Unethical Behavior by Nonprofit, For ... - Vanessa C. Burbano · 1 Unethical Behavior by Nonprofit,...
39
1 Unethical Behavior by Nonprofit, For-Profit, and Public Organizations: Everybody Cheats, but with Different Objectives and Outcomes Vanessa Burbano and James Ostler* Working Paper February 2017 ABSTRACT We examine how the objectives of different types of firms (for-profit, nonprofit, and public) influence strategic, unethical behavior. We argue that all types face incentives to behave unethically when doing so enables the achievement of distinct objectives and concepts of value. We provide empirical support by comparing unethical, strategic misrepresentation of information by for-profit, nonprofit, and public firms in the liver transplant market, leveraging a policy change to identify unethical behavior. Nonprofits misrepresented information at similar, sometimes higher, rates as for-profits. Nonprofit and public centers did so more egregiously than for-profits for certain beneficiaries, in line with their concepts of value. We contribute to an understanding of how definitions of value influence the conditions under which organizations behave strategically and unethically. * Vanessa Burbano, Assistant Professor of Management, Columbia Business School, [email protected]; James Ostler, Assistant Professor of Strategy, Ross School of Business, University of Michigan, [email protected]
Transcript of Unethical Behavior by Nonprofit, For ... - Vanessa C. Burbano · 1 Unethical Behavior by Nonprofit,...

1
Unethical Behavior by Nonprofit, For-Profit, and Public Organizations:
Everybody Cheats, but with Different Objectives and Outcomes
Vanessa Burbano and James Ostler*
Working Paper
February 2017
ABSTRACT
We examine how the objectives of different types of firms (for-profit, nonprofit, and public)
influence strategic, unethical behavior. We argue that all types face incentives to behave
unethically when doing so enables the achievement of distinct objectives and concepts of value.
We provide empirical support by comparing unethical, strategic misrepresentation of information
by for-profit, nonprofit, and public firms in the liver transplant market, leveraging a policy
change to identify unethical behavior. Nonprofits misrepresented information at similar,
sometimes higher, rates as for-profits. Nonprofit and public centers did so more egregiously than
for-profits for certain beneficiaries, in line with their concepts of value. We contribute to an
understanding of how definitions of value influence the conditions under which organizations
behave strategically and unethically.
* Vanessa Burbano, Assistant Professor of Management, Columbia Business School,
[email protected]; James Ostler, Assistant Professor of Strategy, Ross School
of Business, University of Michigan, [email protected]

2
Introduction
For-profit, nonprofit and public organizations have distinct objectives. Whereas the primary
objective of a for-profit organization is to maximize profit, the primary objective of a nonprofit
or public organization is to maximize a single or combination of non-monetary objectives.1
Organizations with such distinct objectives will define value differently, and make strategic
decisions to maximize value creation and capture in accordance with distinct definitions of value.
One strategic, yet unethical, behavior that represents an opportunity to capture value is strategic
misrepresentation of information (Bennett et al., 2013; Crawford, 2003; Feldman and March,
1981; Ostler, 2014; Snyder, 2010). Strategic misrepresentation of information by for-profit
organizations has been shown to influence consumer behavior (Dellarocas, 2006) and market
demand (Mirman, Samuelson, and Schlee, 1994). We argue that this unethical behavior, driven
by the goal of capturing value, is not limited to for-profit organizations; that nonprofit, public,
and for-profit firms alike will strategically manipulate information when doing so enables them
to capture value per their (distinct) concepts of value. A commonly-held belief persists that for-
profit organizations are more likely to “game the system” than nonprofit and public
organizations, which have non-monetary, pro-social objectives and, by extension, should behave
more “ethically.” We, however, argue that nonprofit and public organizations will be just as
likely, and in some circumstances, more likely, to strategically misrepresent information, when
doing so conforms with their concept of value.2
1 Though nonprofit and public organizations are certainly subject to monetary (i.e., financing and fundraising) constraints, we focus on their primary objectives and goals. We recognize that there are also double and triple bottom line organizations that do not fit clearly into the distinction we are making here, since these organizations have both monetary and non-monetary objectives as primary objectives. However, for simplicity of exposition, and because of the nature of the organizations in the empirical setting we examine, we focus in this paper on three types of organization: private, nonprofit, and public. 2 The National Nonprofits Ethics Survey reports that nonprofits generally have a stronger ethics culture compared to businesses (available at: https://www.soe.vt.edu/highered/files/Perspectives_PolicyNews/04-08/NationalNonprofitEthicsSurvey.pdf). Americans report having more confidence in charitable organizations

3
There has been little examination of how nonprofit, public and for-profit firms compare in
the degree to which or circumstances under which they engage in unethical behavior. This line of
inquiry is challenging because 1) nonprofit, for-profit, and public organizations rarely do the
same thing, making it hard to compare across organization types without confounding
differences in organization type with differences in activities being performed, and 2) unethical
behavior is difficult to observe, since organizations hide this behavior rather than make it public.
This paper leverages a unique setting that enables us to address these empirical challenges: the
liver transplant market. First, in this setting, for-profit, nonprofit, and public liver transplant
centers all do the same thing: they provide liver transplants. The setting thus holds constant any
differences in unethical behavior by organization type that are driven by differences in basic
activities.3 Second, by examining centers’ responses to a policy shock in how livers were
allocated to individuals who need liver transplants, we are able to identify strategic manipulation
of intensive care unit (ICU) enrollment in the liver transplant market (Ostler, 2016; Snyder,
2010).4 By comparing nonprofit, private, and public transplant centers’ strategic manipulation of
ICU enrollment, we provide insight into the conditions under which the three organizational
types misrepresented information, and posit that differences in how the organizational types
define, and thus act to capture, value helps explain this behavior.
compared to for-profit or public organizations (Bowman, 2012). Nonprofit board members are perceived to behave more ethically than corporate for-profit board members (Brower and Shrader, 2000; Machan and Uyl, 1987). Health sector-focused studies also claim that nonprofit organizations are less likely to make misleading claims than for-profit organizations, for example (Schlesinger et al., 2005). 3 For example, though in the same general industry, we would not want to compare a for-profit bank to a non-profit organization working to help low income families save; these organizations’ basic activities are too different to facilitate comparison. 4 Before March 1, 2002, whether or not a patient was in the ICU was a critical determinant of whether a patient would be allocated a liver; patients in the ICU went to the top of the liver transplant priority list, irrespective of whether they were sicker than others on the transplant list. Transplant centers could strategically report that a patient was in the ICU to increase the chance of their patients receiving a liver. After March 1, 2002, however, allocation of livers changed to a system based only on clinical indicators of sickness, not ICU status. A discontinuous decrease in the number of transplant patients in the ICU or a discontinuous increase in the average sickness of transplant patients after the policy change indicates that centers were strategically manipulating the ICU list to increase the chances that their patients would receive a liver transplant.

4
We thus address the following questions in this paper: Can differences in how value is
defined by nonprofit or public organizations lead them to engage in strategic unethical behavior
more than for-profit firms? If so, what are the implications for governing and contracting with
these organizations in settings where they coexist or work together? Contrary to the
conventionally-held belief that nonprofit and public organizations behave less unethically and
strategically than for-profit organizations, we show that nonprofit liver transplant centers
manipulated ICU enrollment at a similar, and for certain beneficiaries, a higher, rate than for-
profit organizations.5 The manipulation of patient status by nonprofits was not arbitrary across
patients on the health margin of being eligible for transplant, as would be expected if the practice
was in the pursuit of increased profits. Rather, nonprofit liver centers manipulated patient status
for certain types of individuals: locally-residing residents and women, even when relatively
healthy. For-profit liver centers manipulated ICU enrollment for patients on the margin of being
eligible for transplant (that is, clinically unhealthy and nearly indistinguishable from patients on
the waiting list above them), but not for relatively healthy patients. Public liver centers
manipulated ICU enrollment less than the other center types on average, but when they did
manipulate ICU enrollment, they did so more similarly to non-profit than for-profit liver centers.
We posit that this behavior is in line with each organization type’s objectives and, thus, how we
would expect them to define, create, and capture value. Our findings are robust to the use of
three different measures of strategic misrepresentation of information and to different functional
forms of the regression analyses.
This paper provides a comparison of strategic misrepresentation of information by for-profit,
nonprofit, and public organizations to demonstrate that each type of organization faces incentives
5 Some authors have noted that unethical behavior does indeed take place in nonprofit and public organizations, and have called for further inquiry into this phenomenon (e.g., Archambeault et al. 2015; Bowman,
1990; O’Neill, 1992; Fremont-Smith and Kosaras, 2003; Krishnan et al., 2006)

5
to behave unethically when doing so enables the creation and capture of value as defined by that
organization type. Our findings suggest that understanding and distinguishing between distinct
concepts of value by organization type is important for understanding strategic behavior by
nonprofit, public, and for-profit organizations, particularly when these organizations work
together or in parallel. We thus join the work beginning to link differences in strategic choices
with differences in the missions and objectives of organizations (Greenwood et al., 2016). Given
that the liver transplant market is overseen by a single (nonprofit) entity, our findings also have
broader implications for understanding how policies and regulations will influence nonprofit,
public, and for-profit organizations differently, with implications for the governance of these
organizations in settings where they co-exist or work together. It has been noted that public-
private relationships have potentially contradictory agendas and heterogenous interests which
can lead to tensions (Kivleniece and Quelin, 2012; Mahoney et al., 2009; Cabral et al., 2012;
Henisz, 2006; Utting and Zammit, 2009). Our paper demonstrates that the heterogeneous
objectives of different organization types can result in different manifestations of unethical
behavior that at times conflict with, and at times complement, the objectives of the overseeing
entity. Lastly, this paper responds to a call for scholarly inquiry into unethical behavior in
nonprofit and public organizations (e.g., Rhode and Packel, 2009; Archambeault et al., 2015;
Holtfreter, 2008; Krishnan et al., 2006).
Objectives, Value, and Organization Type
Value is defined in monetary terms for for-profit organizations. Given the profit-maximizing
objective of for-profit organizations, a monetary concept of value is both theoretically appealing
and empirically tractable for for-profit firms (Lieberman, Garcia Castro, and Balasubramanian,

6
2016). Per the (for-profit) value creation/appropriation framework, value is defined based on the
vertical chain that extends from suppliers of resources, through the firm, to the buyers of the
firms’ products and services (Brandenburger, 2002; Brandenburger and Stuart, 1996; Porter
1980). The amount of value created is the willingness of the buyer to pay minus the opportunity
cost of the supplier (Brandenburger and Stuart, 1996), while the amount of value captured by the
firm is determined by competition and the resulting prices paid (Chatain, 2011; MacDonald and
Ryall, 2004). When externalities are present, such as in the cases of public and nonprofit
organizations (Ostrom, 1990; Brinkerhoff and Brinkerhoff, 2011; Mahoney et al., 2009; Rangan
et al., 2006), the exchange value, or monetary amount realized in exchange for the firm’s product
or service (Bowman and Ambrosini, 2000; Lepak, Smith, and Taylor, 2007), does not accurately
reflect the amount of value captured by the organization (Klein et al., 2013).
For public and nonprofit organizations, the mission is to maximize non-monetary, often
pro-social, objectives. Though attempts have been made to translate pro-social outcomes into
monetary equivalents (e.g., to quantify the value of saving a life, by Thaler and Rosen, 1976, or
of recycling by Viscusi, Huber, and Bell, 2011), many pro-social outcomes are difficult to assign
monetary values. In fact, some posit that the role of the nonprofit organization is precisely to
provide goods and services whose benefits are difficult to observe or measure (Easley and
O'Hara, 1983). Even if all prosocial outcomes could be translated into agreed-upon monetary
equivalents, it is unlikely that a simple maximization of this monetary equivalent would
adequately capture the complex prosocial objectives of many nonprofit and public organizations.
The strategy literature on value creation and capture has recognized that some values cannot be
measured and monetized (Ramírez, 1999; Kivleniece and Quelin, 2012), paving the way for the

7
notion that organizations simply have different concepts of value, some which are monetary in
nature and some of which are not.
Organizations of different ownership type (i.e., nonprofit, for-profit, and government-
owned) also respond to different sets of stakeholders and differentially weight the importance of
these stakeholders. Indeed, it has been established that how much attention will be paid to which
stakeholders is the result of the organization’s conceptualization of itself and its relationship to
society (Crilly and Sloan, 2012), as well as the power, legitimacy and urgency of the stakeholder
to each organization (Mitchell, Agle, and Wood, 1997). The strategy literature has begun to
incorporate the stakeholder view of strategy into the value creation and appropriation
frameworks (Garcia Castro and Aguilera, 2015). This literature has extended the set of for-
profits’ value-appropriating stakeholders from consumers and suppliers to include government,
capital providers, and society more broadly (Clarkson, 1995; Garcia Castro and Aguilera, 2015;
Hillman and Keim, 2001; Lepak et al., 2007; Porter and Kramer, 2011). This literature has made
the link between a for-profit organization’s stakeholders and the value that it creates and
appropriates. A link has similarly been made between nonprofit organizations’ values and their
relationships with stakeholders (Voss, Cable, and Voss, 2000). Given the difference in the
weight placed on different stakeholders by organization type, we would expect organizations to
have different concepts of value by organization type.
Unethical Behavior, Strategic Misrepresentation of Information, and Organization Type
These distinct concepts of value will influence organizations’ strategic choices, including
whether and under what circumstances they will engage in unethical behavior. One type of
unethical behavior that has been the object of study is strategic misrepresentation of information

8
(Feldman and March, 1981). Numerous antecedents of strategic misrepresentation of information
have been put forth. Some are clearly tied to stakeholders and objectives that exist in for-profit
organizations, but not in non-profit or public organizations. For example, Connor et al. (2006)
showed that CEO stock options can promote fraudulent financial reporting. Strategic
misrepresentation of information has been described as a means to increase customer utility or
willingness to pay (Becker and Milbourn, 2011; Bennett et al., 2013), and thus increase the value
created through a key for-profit stakeholder, the consumer. Indeed, studies have shown that
unethical behavior is influenced by the preferences of and pressure from an organization’s
stakeholders (Stevens et al., 2004; Jansen and VonGlinow, 1985; Iriyama et al., 2016). At the
same time, managerial incentives have been shown to drive strategic misrepresentation of
information such as expense misreporting in nonprofit organizations (Krishnan et al., 2006).
Other antecedents predictive of strategic misrepresentation of information exist in and could thus
drive strategic misrepresentation of information in for-profit, nonprofit, and public organizations
alike. These include the influence of compensation and poor organizational performance (Harris
and Bromiley, 2007), incentives (Tenbrunsel, 1998), situations when preferences of the sender of
information and the receiver of information diverge (Crawford and Sobel, 1983; Cai and Wang,
2006), and competition (Bennett et al., 2013; Snyder, 2010).
Because the objectives, set of primary stakeholders, and resulting concepts of value are
different in for-profit, nonprofit, and public organizations, we would expect strategic
misrepresentation of information to take place under different circumstances. We argue that
nonprofit, for-profit and public organizations will all strategically misrepresent information when
doing so enables them to achieve their objectives and create and capture what they define as
value.

9
Empirical Setting
We test this broad proposition in the US liver transplant market, where approximately 6,500 liver
transplants are performed by over 100 for-profit, nonprofit, and public centers each year. The
distribution of livers for transplant across all organization types is regulated and overseen by the
Organ Procurement and Transportation Network (OPTN), a nonprofit organization that is
overseen by Congress. It is organized geographically such that all hospitals belong to one
regional organ procurement organization (OPO). When a liver becomes available, transplant
centers within that OPO have first rights to obtain the organ.6 Thousands of individuals die each
year while on the waiting list for a new liver, and liver transplants are lucrative for hospitals with
transplant centers.7 As such, the demand for liver transplants is high, and there could be an
incentive for centers to pursue unethical, strategic means of obtaining organs for transplant.
A 2002 policy change in how livers were allocated offers a unique opportunity to identify
strategic misrepresentation of information by liver transplant centers. Prior to March 1, 2002,
individuals in the intensive care unit (ICU) received transplant priority ahead of individuals not
in the ICU. Centers could place relatively healthy individuals on the ICU list to increase their
likelihood of obtaining a liver for transplant. One such case involved the University of Illinois,
which was sued by Medicaid and paid a fine of two million dollars for unethical representation
of patients on their ICU list.8 Other cases were discovered where patients supposedly in the ICU
were at home and out at restaurants when receiving word that they would be getting a transplant
(Murphy 2004). On March 1, 2002, the liver allocation process changed such that livers were
6 If no claim is made on the organ within the OPO, then transplant centers within the organ transplant region (comprised of more than one OPO) have access to the organ. 7 Each transplanted liver represents $739 in billings. http://www.transplantliving.org/before-the-transplant/financing-a-transplant/the-costs/ 8 http://www.justice.gov/usao/iln/pr/chicago/2003/pr111703_01.pdf

10
allocated by individuals’ Model for End-Stage Liver Disease (MELD) score, which is
determined by clinical indicators of a patient’s sickness (and no longer influenced by ICU
status). We compare whether nonprofit, for-profit, and public liver transplant centers are more
likely to misrepresent patient health by estimating how these centers react to the change in
policy. Leveraging this policy change follows the approach used by Snyder (2010) and Ostler
(2016), who use the policy change to empirically identify unethical behavior and examine the
effects of competition (Snyder 2010) and of being a new entrant (Ostler, 2016) on propensity to
engage in unethical behavior. Neither Snyder (2010) nor Ostler (2016) examined differences in
unethical behavior by nonprofit, for-profit, and public organization types, nor did they explore
differential effects on the beneficiaries of the unethical behavior.
Value, Organization Type, and Unethical Behavior in the Liver Transplant Market
The liver transplant market is one that lends itself to different possible manifestations of value.
Since transplants are lucrative, some centers could derive value from increasing their number of
transplants as part of a monetary, profit-maximizing objective. Others could seek to maximize
social welfare or allocate livers to important stakeholder groups like those individuals whom
they seek to serve. We predict that organizations of different types will engage in this unethical
behavior at different rates, and for different patients, in line with their distinct objectives and
concepts of value. In what follows, we develop formal hypotheses for this empirical context. We
predict that for-profit liver centers will strategically manipulate information, driven by their main
objective of maximizing profits. We then predict how nonprofit and public liver centers’
behavior will compare to that of for-profit centers, on average and for groups they seek to serve,
driven by their distinct concepts of value and objectives.

11
For-profit organizations
Strategic misrepresentation of information has been described as a means to increase customer
utility and willingness to pay (Becker and Milbourn, 2011; Bennett et al., 2013), which in turn
increase a for-profit firm’s potential to capture value and increase profits (Brandenburger and
Stuart, 1996; Chatain, 2011; MacDonald and Ryall, 2004). Given the fiduciary duty of a for-
profit organization to its shareholders, the primacy of shareholders as the most important
stakeholder to for-profit firms has been established (Friedman, 2007). Likewise, the for-profit
organization’s objective of maximizing profit for shareholders has been well-established
(Friedman, 2007). Even the stakeholder view of strategy, which highlights the role that (non-
shareholding) stakeholders play in determining for-profit organizations’ success, links the
preferences and behaviors of these (non-shareholding) stakeholders to the profitability of the
firm (e.g., Sundaram and Inkpen, 2017; for a discussion of the distinction between primary and
non-primary stakeholders, see Hillman and Keim, 2001).
A study of hospital services in the US demonstrated that the mix of health services
offered by for-profit hospitals is more profitable than that of other hospital types (Horwitz,
2005). For-profit hospitals have also been shown to adopt technological advancements when
these advancements are revenue-enhancing (Greenwood et al., 2016). This suggests that
profitability is indeed the prime objective of for-profit organizations in this industry, despite the
fact that hospitals all treat patients with a mix of needs and operate under the same health
regulations (Horwitz, 2005). As for-profit organizations seek to maximize profits for
shareholders and liver transplants are lucrative, we would expect for-profit liver centers to face
monetary incentives to strategically misrepresent information to increase the number of liver
transplants administered.

12
H1a: For-profit liver centers will strategically manipulate information to increase the
likelihood of their patients receiving livers.
For-profit organizations are subject to regulatory and nonprofit watchdog scrutiny if they
engage in unethical behavior, which would result in financial penalties, and thus reduced value
capture, if caught (Delmas and Burbano, 2011; Sethi and Sama, 1998). They are thus likely to
strategically misrepresent patient health in a manner that maximizes the financial upside of
increasing the number of patients receiving transplants while simultaneously minimizing the
likelihood of being caught and penalized. Given a set of patients for whom they could
strategically misrepresent ICU status, we would expect them to do so for the patients least likely
to draw adverse attention or scrutiny. We would thus expect for-profit liver transplant centers to
be more likely to misrepresent patient health for sicker patients who are on the margin of being
eligible to receive a transplant, and less likely to misrepresent patient health for healthier
patients.
H1b: For-profit liver transplant centers will strategically manipulate information for
sicker, rather than healthier, patients.
Nonprofit organizations
In contrast to for-profit organizations, nonprofit organizations do not have shareholders and thus
do not face the clear primary objective of creating and capturing monetary value for
shareholders. Though nonprofits face an objective of fundraising to support their activities, this

13
objective is not the primary objective. The existence and function of the nonprofit organization
has been framed in much of the literature in contrast to that of the for-profit organization. For
example, in the traditional economics and related strategy literatures, public goods, contract
failure, transaction costs, and agency theory have been put forth as explanations for the existence
of nonprofit and public organizations (see Gassler (1986) and Rose-Ackerman (1996) for
surveys, also Kaul and Luo (2016)). Nonprofits have also been described as maximizers of
(prosocial) services that help their beneficiaries (Steinberg, 1986), and as sources of
experimentation to solve social problems (DiMaggio and Anheier, 1990). A common thread in
this diverse set of literature on the rationale for the existence of the nonprofit is that nonprofits
provide (prosocial) services to beneficiaries in need of these services.
Nonprofit organizations have been described as mechanisms by which people become
involved in their communities (Boris 1999), and as vehicles for empowering local residents and
improving local quality of life (De Vita and Fleming, 2001, p. 8). Additionally, nonprofits have
been identified as sources of experimentation in local contexts to solve social problems
(DiMaggio and Anheier, 1990). Nonprofit hospitals, in particular, have been shown to have local
community-related constraints and incentives (Greenwood et al., 2016). It has also been
suggested that nonprofit organizations represent diverse values, and their existence has been
explained in part by the civic history of the United States, including the suffrage movement
(Boris and Steuerle, 2006). Indeed, women are common beneficiaries of nonprofit organizations’
focus and services.1 Nonprofits seeking to create prosocial value and maximize social welfare
often target women; numerous microfinance studies have shown that women are more
trustworthy, and more likely to act on behalf of the welfare of children and the family as a whole
than men (Lott, 2008), for example. We would thus expect nonprofits to strategically

14
misrepresent information when this behavior enables them to serve the groups of patients they
seek to serve, such as locally residing individuals and women.
H2a: Nonprofit liver centers will strategically misrepresent information more than for-
profit organizations when doing so benefits the groups of patients they seek to serve.
Given that nonprofits do not face the primary objective of maximizing financial value for
their shareholders, they are less likely than for-profits to be concerned about the implications of
getting caught and financially penalized for engaging in strategic misrepresentation of
information. This makes more egregious misrepresentation of patient health for relatively sick
patients less of a concern for nonprofit than for-profit organizations. Given their concept of value
being centered around the provision of services to their target beneficiaries, we would expect
nonprofit to strategically misrepresent information for even relatively healthy patients who are
part of the beneficiary groups they seek to serve (as opposed to sicker patients who are not part
of the beneficiary groups they seek to serve).
H2b: Nonprofit liver centers will strategically misrepresent information for relatively
healthy patients more on average than for-profit liver centers, when doing so benefits the
groups of patients they seek to serve.
Public organizations
Public organizations respond to a much larger set of primary constituents and stakeholders than
for-profit organizations, and even nonprofit organizations (Boyne, 2002). As a result,

15
organizational goals are more difficult to define with precision in public organizations (Lyden,
1975). It has even been suggested that public organizations are deliberately vague in their goals
so that their activities will be acceptable to all constituents (Christensen et al., 2007). As a result,
public organizations have conflicting, more vaguely defined goals than other organization types
which are not beholden to political constituents to the same degree (Boyne, 2002). As the
importance of who an organization’s stakeholders are, and how urgent their demands are for the
organization, have been highlighted in determining strategic choices in general (Garcia Castro
and Aguilera, 2015; Mitchell, Agle, and Wood, 1997), as well as unethical behavior specifically
(Delmas and Burbano, 2011), we would expect that organizations with less clearly defined
primary stakeholders or beneficiaries and less clearly defined goals would be less likely to
engage in strategic misrepresentation of information.
H3a: Public liver transplant centers will strategically manipulate information less on
average than for-profit and nonprofit liver transplant centers.
Nonprofit and public organizations have been described as complements in the provision
of (similar) public goods (Boris and Steuerle, 2006; Salamon, 1995, 2015). It has been suggested
that public organizations exist in cases when nonprofits would be the preferred provider of a
certain services but are unable to meet perceived societal needs (Salamon, 1995). Others have
explained the existence of nonprofits as due to an undersupply of a public good or service to a
group of citizens whose demand for the good exceeds that of the median voter (Weisbrod, 1988).
The concepts of value amongst nonprofit and public organizations are thus more similar than
those of for-profit organizations. Similar to nonprofit organizations, we would expect that if

16
public organizations do strategically misrepresent information, they would do so to benefit the
constituents they seek to serve. Because public organizations are neither responsible to
shareholders, nor face fundraising pressures, we would expect them to be the least concerned of
the three organization types about financial penalties for being caught engaging in strategic
misrepresentation of information.
H3b: When public liver transplant centers strategically misrepresent information, they do
so to benefit the groups of patients they seek to serve, even if these are relatively healthy
patients.
Data and Empirical Strategy
Our data comes from a comprehensive database of all liver transplants taking place in the United
States from 1990-2009, provided by the United Network for Organ Sharing. The data includes
patient health information, patient demographic characteristics, and the center in which the
transplant was performed. The name of the center was used to determine each center’s nonprofit,
for-profit, or public status, which was obtained from the website www.healthgrades.com and
cross-referenced with information from the centers’ websites to confirm organizational type at
the time of the policy change. Pediatric hospitals were dropped as there were no for-profit
children's hospitals with transplant centers. Additionally, children's hospitals’ transplant centers
often serve larger geographical areas that do not match up with OPOs. Thus, our analysis only
uses transplants performed on adults of legal age. We also drop three centers associated with
military and veterans’ hospitals. In two cases where hospitals shared an experimental shared
services arrangement, the associated centers are coded as a single center. In these cases, the

17
organizational type of the hospitals sharing transplant centers were the same (i.e., for-profits
shared with for-profits, etc.). We restrict the sample to one year before and after the policy
change to isolate the effect of the policy change.
If some organization types strategically misrepresented patient health more than others by
placing or listing more (relatively) healthy patients in the ICU, we would expect to see different
decreases in the percentage of patients receiving liver transplants who were admitted to the ICU
after the policy shift by those organization types. Similarly, we would expect to see a different
increase in average sickness of the patients receiving transplants after the policy change by those
organization types. We use patients’ MELD scores, a clinical objective measure of patient health,
to measure the average sickness of patients receiving transplants.9
To examine how different center types (nonprofit, for-profit, and public) behave
unethically in this context, we compare how center type influences the change in three outcome
variables of interest before and after the policy change: ICU, MELD Score, and MELD<15.
Each is an individual, patient-level variable that is measured at the time of the transplant. ICU is
a binary variable indicating whether the patient was listed as being in the ICU; MELD Score is a
continuous variable capturing the patient’s MELD score; and MELD<15 is a binary variable
indicating whether the patient’s MELD score was less than 15. A MELD score of less than 15 is
used to indicate that they patient is relatively healthy (as opposed to unhealthy), as this is the
cutoff score associated with a lower mortality risk and many centers will not list patients on the
active transplant waiting list until their score is greater than 15.10
9 Patient health and survival metrics have been extensively studied in the health care literature and patients MELD
score found to be the best indicator of patient health and survival (Kamath et al, 2001, 2007). There are a few cases where a patient’s MELD score was not recorded. In these cases, it was computed using the available patient health measures. In a few select cases a component of the MELD score was missing and in these cases that component was interpolated like in Snyder (2010).
10 http://blog.texasliver.com/2012/06/waiting-for-a-liver-transplant-my-meld-score-is-low-now-what/
18
To identify a baseline effect of the policy change on each of the three outcomes of
interest, we use the following specification at the patient and calendar month level (i and t
respectively):
Outcomei,t = β1 MELD erat + β2 Controlsi,t + Calendar montht + Centeri
+ εi,t .
1
A dummy variable, MELD era, identifies whether a transplant occurred before or after
the policy change that determined that livers be allocated solely on a patient’s MELD score
(rather than ICU status). This variable takes the value of 0 before the policy change and 1 after
the policy change. Thus, β1 is an estimate of the change in outcome due to the new policy. To
address the possibility that competitive effects could contaminate the results, we control for
competition by constructing a measure equal to the number of transplant centers in any given
OPO (the same measure for competition used by Snyder (2010)), a measure for the total number
of transplants in the OPO by year, and an indicator variable of whether the firm is a new entrant
(defined as having entered into the market within five years previous to the policy change). To
address concerns about time trends, month fixed effects and a quadratic time control of the
number of months from the policy change are included as controls. We also include controls for
patient demographic characteristics including race, gender, and age. In specifications where the
outcome of interest is whether transplant patients come from the ICU (ICU), we include the
patient’s MELD scores as a control for patient health. Similarly, in specifications where the
outcome of interest is patient health (MELD Score or MELD<15), we include as a control
whether a patient is in the ICU. We also include center fixed effects to control for unobserved

19
center differences. The result of this analysis provides baseline estimates of centers’ unethical
behavior, which we examine by organization-type subsample (that is, separately for nonprofit,
for-profit, and public organizational types).
To estimate the differential effect of ownership type and move beyond separate
subsample baseline estimates, we next use a differences-in-differences estimation approach with
the following specification:
Outcomei,t = β1 MELD erat x Org Typei + β2 Controlsi;t +
β3 MELD erat x Controlsi,t + Montht + Centeri + εi,t 2
OrgType is a categorical variable taking on three values: for-profit, non-profit, and public
ownership type. The differential impact of organization type on the change in the outcome of
interest before and after the policy change is measured by β1. Montht dummy variables for each
individual month in the data are included (24 dummies, instead of 12 as in Equation 1). No main
effect for Org Type or MELD era is included in the estimation equation because these are
absorbed by the center and month fixed effects, respectively. All controls are also interacted
with the variable MELD era.
To estimate how organization type influences differential strategic misrepresentation of
information to benefit specific groups of patients corresponding with the center’s concepts of
value, we use the following differences-in-differences specification:

20
Outcomei,t= β1Zi,t + β2MELD erat x Zi,t + β3 MELD erat x Org Typei x
Zi,t + β4Org Typei x Zi,t + β5MELD erat x Org Typei +
β6Controlsi,t + β7MELD erat x Controlsi,t + Montht +
Centeri + εi,t
3
Z is a binary variable indicating whether the patient is of the beneficiary type of interest
(e.g., locally-residing patients in one specification and female patients in another specification).
β3 is the estimate of interest, measuring differential ICU manipulation by organization type for
the beneficiary type. To proxy whether the patient resides locally, we construct the dependent
variable Same zip, which takes the value of 1 if the transplant patient is from the same zip code
as the center and 0 otherwise.11 Similarly, Female is a binary variable indicating whether the
patient is female.
All reported specifications use ordinary least squares models with standard errors
clustered at the OPO level.12 When the outcome variable is either ICU or MELD<15, the model
is estimated using ordinary least squares, resulting in a linear probability model. A linear
probability model is reported instead of a logistic model to be consistent with previous work in
this context (Snyder 2010), to allow for easy interpretation of the results, and to avoid the
complications arising from using many fixed effects in logistic models (Katz 2001; Wooldridge
2010).
11 In a small number of cases the patient zip code was not available. These cases were dropped. There were no
systematic differences in the patients with missing zip codes. Due to this and the small number of occurrences, the analysis is robust to inclusion of these observations as either local or non-local.
12 Standard errors could also be clustered at the center level, but this would result in cluster sizes with high variation. To avoid this issue as well as obtain a more conservative estimate, we use the more conservative clustering at the OPO level.

21
Results
Patient health misrepresentation, overall and by center type
Table 1 reports summary statistics for key variables before and after the policy change. The
proportion of patients coming from the ICU dropped significantly, by 11.83 from 23.22, while
average patient sickness as measured by the MELD score increased by 1.25 points. If there were
no manipulation of ICU status taking place, we would expect the number of patients coming
from the ICU to increase as average patient sickness increases. The contrary pattern exhibited in
Table 1 is consistent with strategic manipulation of the liver transplant waitlist by listing patients
in the ICU.13
***Insert Table 1 about here***
In the first three columns of Table 2, the summary statistics for the three main outcome
variables of interest (proportion of transplant patients coming from the ICU, MELD scores of
liver transplant patients, and proportion of transplant patients with MELD scores below 15) are
reported by center ownership type. While the proportion of patients coming from the ICU
dropped after the policy change in all organization types, the magnitudes of the drop vary greatly
between center types. The decrease in proportion of patients coming from the ICU was greatest
for for-profit centers, while the associated change in patient health, MELD Score, did not change
significantly for for-profits. Interestingly, the proportion of healthy patients receiving transplants
in for-profit centers increased rather than decreased after the policy change, opposing the general
decreasing trend shown in Table 1. This is consistent with for-profit firms taking advantage of
the opportunity to increase the number of transplants performed by misrepresenting ICU status 13 See Snyder (2010) for a similar argument.

22
before the policy change, but only doing so with patients who were relatively sick and on the
margin of eligibility. These summary statistics are thus consistent with H1a and H1b. By
contrast, in both public and nonprofit centers, the average patient sickness level increased after
the policy change and the fraction of healthy patients receiving transplants decreased. These
summary statistics are consistent with nonprofit and public centers manipulating ICU status for
patients further from the margin of eligibility and more egregiously than for-profit centers, as
predicted by H2b and H3b.
The last two columns of Table 2 report average MELD scores and the proportion of
patients with MELD scores under 15 by center type, conditional on patients coming from the
ICU. If manipulation of the ICU were indeed resulting in healthier patients receiving transplants,
we would expect the average health of patients coming from the ICU to decrease after the policy
change. Table 2 shows that the increase in patient sickness and the decrease in the proportion of
relatively healthy patients receiving transplants is indeed greater when restricted to the subgroup
of patients coming from the ICU.
***Insert Table 2 about here***
While these results are suggestive of centers strategically misrepresenting information in
different ways and for different outcomes, there are likely persistent differences across centers
that could conflate simple cross-sectional comparisons. To begin to control for these differences,
we ran regressions per the specification in Equation 1 for each the outcome variable and
organization type (as well as for all organization types combined). Table 3 reports in each cell
the main coefficient of interest, β1, which estimates the change in behavior due to the policy

23
shock, along with its corresponding standard errors and p-values, for each permutation of the
regression. Controlling for patient characteristics, time trends, and center-level differences, the
changes in behavior due to the policy shock as reported in Table 3 are consistent with the
summary statistics presented in Table 2, as well as with H1a, H1b, and H3a.
***Insert Table 3 about here***
Differences in patient health misrepresentation between for-profit, nonprofit and public
centers
To further assess whether patient misrepresentation was statistically different between
organization types, Table 4 displays results for the specification described in Equation 2. The
baseline organization type for these regressions is non-profit.
***Insert Table 4 about here ***
Model 1 shows that public centers’ drop in the proportion of liver transplant patients
coming from the ICU was 8.3 percentage points less than that of nonprofit centers, controlling
for patient characteristics, center fixed effects, time trends, and OPO characteristics. Replicating
the regression presented in Model 1, but with for-profit as the baseline organization type results
in a Public x MELD era coefficient of β1=0.081 (p=0.109).14 Taken together, these results
provide support for the hypothesis that public centers are less likely to manipulate ICU status on
average than other organization types (H3a).
14 All p-values reported in the text are for directional one-tailed tests; p-values of the more conservative two-tailed
tests are reported in the corresponding tables.

24
Model 2 indicates that nonprofits saw a larger decline in average health of liver transplant
patients in response to the policy change (with lower MELD scores indicating healthier patients)
than for-profit centers (p=0.024). This suggests that nonprofits’ liver transplant patients were
healthier on average than for-profit centers’ liver transplant patients before the policy change.
The change in average health of liver transplant patients in response to the policy change was
statistically equivalent for public and non-profit (β1=-0.59, p=0.119), as well as public and for-
profit (β1=1.103, p=0.186)15 centers. The results of Model 2 are consistent with H1b and H2b,
suggesting that for-profit firms minimized noticeable, more egregious, manipulation of ICU
status, while nonprofit centers were willing to misrepresent information for relatively healthy
patients.
Model 3 allows us to compare across organization types the response to the policy shock
in proportion of liver transplant patients that are relatively clinically healthy. Here, the difference
between nonprofits and for-profits is even more stark than that shown in Model 2: a difference of
12.7 percentage points (p=0.000). The difference between public and for-profits organizations is
nearly the same with β1 =12.6 (p=0.001).16
Targeted patient health misrepresentation for groups of value
Table 5 displays results for the regression specification described in Equation 3. Columns 1
through 3 reflect Equation 3 where Z, the beneficiary group of interest, is Same Zip. Columns 4
through 6 reflect Equation 3 where the beneficiary group of interest is Female.
15 Calculated using the same regression as Model 2, but with for-profit as the baseline organization type (rather than
non-profit). The coefficient reported is that corresponding to the interaction Public x Meld era. The coefficients can be calculated from the data in the table by subtracting the Public x Meld era and For-Profit x Meld era coefficients. The standard errors and p-values can also be calculated from the respective standard errors in the table as well.
16 Computed with the same regression as presented in Model 3 except with for-profit, rather than nonprofit, as the baseline for organization type.

25
***Insert Table 5 about here***
Columns 1 and 4 demonstrate support for H2b, showing that nonprofits were more likely
to manipulate patient ICU status for certain beneficiaries than for-profits, in line with nonprofits’
objectives and definitions of value. The differential increase in proportion of transplant patients
coming from the ICU after the policy change was 15.9 and 12.6 percentage points for Same Zip
and Female, respectively (p=0.016 and p=0.029).
Columns 2 and 5 replicate the regressions of Columns 1 and 4 with a different outcome
variable: patient MELD score. Using this more stringent outcome variable, support for H2b is
mixed. The estimated coefficients are directionally supportive of H2b, with nonprofits estimated
to have increases in MELD scores that are 1.298 and 3.399 points higher than for-profits in
response to the policy change for Same Zip and Female, respectively. Only Female is statistically
significant, however (p=0.213 and p=0.004 for Same Zip and Female). Columns 3 and 6 show a
similar pattern with respect to the outcome MELD<15, with differential percentage point drops
in the proportion of healthy patients receiving transplants in response to the policy change by
nonprofits compared to for-profits of 0.157 and 0.222, with only the coefficient for the
interaction with Female being significant (p=0.152 and p=0.008 for Same Zip and Female).
To further test H3b, we replicated the regressions presented in Table 5 except with for-
profit, rather than nonprofit, as the baseline for Org Type. Compared to for-profit firms, public
centers have estimated coefficients of 2.326 and 3.287 points higher before the policy change on
the interactions with Same Zip and Female, respectively, with the coefficient for female again
larger and more significant (p=0.086 and p=0.014 for Same Zip and Female). Coefficients for the

26
regression predicting MELD<15 were similar, with slightly smaller coefficients for public
centers, 0.157 and 0.222 for Same Zip and Female respectively (p=0.152 and p=0.008). These
results support H3b.
To further explore targeted patient health misrepresentation for beneficiaries of value,
Table 6 reports the effects on subsamples conditional on being in the Same Zip and Female. The
results for female transplant patients residing in the same zip code as the transplant center are
shown in Columns 1, 5, and 9. The coefficients in these columns are much larger than the
coefficients from Table 5, and more significant, with p-values less than 0.001. The results of
Table 6 show that local females benefitted the most from strategic misrepresentation of patient
health, with both nonprofit and public centers strategically misrepresenting patient health on
behalf of this group. For example, when restricting the analysis to only female transplant patients
from the same zip code as the transplant center, MELD scores for nonprofits are estimated to be
12.94 points lower than that of for-profits (p=0.002). This effect does not persist when only
looking at male transplant patients either within or outside of the same zip. The only other
subgroup to show a benefit in this analysis is non-local females. However, while the coefficients
in columns 7 and 11 are indeed statistically significant (p-values of 0.015 and 0.000,
respectively), the coefficients are much smaller (with differences between nonprofit and for-
profit centers of 12.936 vs. 2.178 for the increase in MELD scores and 0.631 vs 0.22 for the
MELD<15 measure).
An interesting takeaway from Table 6 is that public centers behave very similarly to
nonprofit centers with respect to MELD Score and MELD<15 outcomes, except for the case of
non-local females. Here their behavior was directionally similar, but with smaller coefficients
and a less statistically significant difference compared to for-profit firms. This supports H3b.

27
***Insert Table 6 about here***
Economic Significance of the Results
To put the results into perspective, patients with MELD scores between 20 and 29 have an
estimated 90-day mortality rate of 19.6 percent. The estimated 90-day mortality rate jumps to
52.6 percent for patients with scores between 30 and 39. For patients with alcoholic hepatitis,
moving from a MELD score of 20 (the average score for the data used) to a score of 23 increases
the estimated 90-day mortality rate from 25 percent to 35 percent. Thus, in this context, the
coefficients representing differences in MELD scores represent a sizable difference in the health
and mortality projections of transplant recipients.
Limitations and Implications for Future Work
We cannot infer a causal relationship between organization type and strategic misrepresentation
of information to benefit different types of individuals from our findings. In this setting, as in
most foreseeable settings, it is not possible to randomly assign nonprofit, for-profit, and public
status across organizations, so we cannot observe a causal relationship. The correlational
findings we observe are, however, consistent with the notion that organizations of all types face
incentives to behave unethically, and that differences in concepts of value can help explain
differences in their unethical and strategic behavior. Furthermore, the fact that this paper’s
setting enables us to leverage a policy shock to identify strategic misrepresentation of
information, a practice that is usually difficult to observe, and is one in which all three
organization types coexist and conduct the same basic activities, nevertheless makes it an

28
advantageous setting for studying the relationship between organization type and strategic
misrepresentation of information.
Given our interest in comparing behavior across organization types, we treat centers’
concepts of value as homogenous by organization type, though we do allow for centers to vary in
other ways through the inclusion of center-level fixed effects. More nuanced exploration of
differences in concepts of value within organization types can be explored in future work.
Conclusions and Managerial Implications
Our findings support the hypotheses presented and the broad prediction that different
organization types will all exhibit strategic unethical behavior when doing so enables the
creation and capture of that organization type’s concept of value. Our results underscore the
importance of considering how distinct objectives and corresponding concepts of value in
organizations of different types affect strategic behavior, including unethical behavior.
This paper contributes to the literature linking differences in strategic choices across
organization type to differences in the missions and incentives of organizations (Greenwood et
al., 2016). Our findings are also contrary to the popular notion that for-profit organizations are
more likely to “game the system” than the more prosocial-oriented, and by extension ethical,
nonprofit organizations. It thus supports the literature that has called for increased scholarly
inquiry into the unethical behavior in nonprofit and public organizations (Holtfreter, 2008;
Krishnan et al., 2006; Greenlee et al., 2007; O’Neill, 1992).
The liver transplant industry is one in which all three organization types co-exist and are
overseen and regulated by a single entity (the OPTN, a nonprofit organization which in turn is
overseen by Congress). As such, our findings are relevant to the literature considering the

29
interactions between and oversight of entities of different organization types (Mahoney et al.,
2009; Utting and Zammit, 2009; Kivleniece and Quelin, 2012; Cabral et al., 2010; Henisz,
2006). This literature has noted that public-private relationships have potentially contradictory
agendas and heterogeneous interests which can lead to tensions (Mahoney et al., 2009; Utting
and Zammit, 2009; Kivleniece and Quelin, 2012; Cabral et al., 2010). Our paper furthers this
conversation by demonstrating that the heterogeneous objectives of different organization types
can result in different manifestations of unethical behavior that at times conflict with, and at
times complement, the objectives of the overseeing entity.
In a setting where the regulatory agency’s objective is the allocation of livers to the
sickest patients,17 it is notable that unethical manipulation of the ICU waiting list by some
organization types resulted in allocations that conflicted with the overseeing agency’s objectives
more than others.18 For-profit liver centers, driven by the primary objective of maximizing
profitability for shareholders, were incentivized to manipulate ICU status to increase the volume
of transplants occurring in their centers, while simultaneously minimizing negative attention
from regulators. As such, sicker patients still received liver transplants as result of for-profits’
strategic misrepresentation of patient health. The regulatory agency’s goals with respect to liver
transplant allocations were thus not significantly thwarted by the unethical behavior of for-profit
liver centers. Nonprofit (and to a lesser degree, public) centers, on the other hand, that derive
value from providing services to certain groups of individuals (women and local patients), face
an incentive to prioritize patients with the characteristics they seek to help over sicker patients
without characteristics they seek to help. For example, in deciding whether it is better to allocate
17 https://bioethicsarchive.georgetown.edu/pcbe/background/davispaper.html 18 Similarly, Snyder (2010) found that even though competition did drive liver transplant centers to misrepresent
patient health (likely for financial reasons), centers did so in a way to still allocated the available livers to the sickest patients.

30
a liver to a relatively healthy, single mother or a sicker male without dependents, a nonprofit
center seeking to provide services to beneficiaries it seeks to serve and considering social welfare
might be willing to take actions to ensure the allocation to the relatively healthy single mother.19
Nonprofit, and to a lesser degree, public liver centers, by manipulating ICU status in a way that
resulted in healthier patients receiving transplants, thus went against the goals of the overseeing
organization.
The overseeing organization in this context is itself a non-profit organization (the OPTN).
It is interesting that nonprofit, and to a lesser extent, public, liver centers’ strategic behavior was
less aligned with the goals of the overseeing organization of the same type than that of for-profit
liver centers. As public-private relationships create tensions (Kivleniece and Quelin, 2012), it is
interesting that in this instance the private centers’ behavior, rather than the public centers’
behavior, was more aligned with the objectives of the public overseer. The distinct objectives
and concepts of value of each of the players in each setting (the overseeing organization, as well
as the organizations being overseen) are important for predicting how organizations will act and
whether the resulting strategic actions will be in alignment or misalignment with the governing
entity’s objectives. This applies to settings where a regulatory organization oversees
organizations of different types, such as in our setting, as well more broadly to settings where
organizations of different types interact in different ways. This includes situations where public,
nonprofit and for-profit firms contract with one another, compete with one another, have formed
alliances, or work in parallel with one another.
19 Nearly one third of children in the United States are raised by single parent families, and of these over 80 percent
are headed by women (US Census, available at: https://bioethicsarchive.georgetown.edu/pcbe/background/davispaper.html). It is plausible that an organization concerned with maximizing social welfare, in addition to simply seeking to serve women, could view the provision of a liver transplant to a relatively healthy single mother over a sicker male without a dependent as value maximizing.

31
REFERENCES Archambeault DS, Webber S, Greenlee J. 2015. Fraud and Corruption in U.S. Nonprofit Entities. Nonprofit and Voluntary Sector Quarterly 44(6):1194-224. Becker B, Milbourn T. 2011. How did increased competition affect credit ratings? Journal of Financial Economics 101: 493–514. Bennett VM, Pierce L, Snyder JA, Toffel MW. 2013. Customer-driven misconduct: How competition corrupts business practices. Management Science 59: 1725–1742. Boris ET. 1999. The nonprofit sector in the 1990s. In Philanthropy and the Nonprofit Sector in a Changing America, Clotfelter CT, Ehrlich T (eds). Indiana University Press: Bloomington, IN; 1-30. Boris ET, Steuerle CE (eds). 2006. Nonprofits & government: Collaboration & Conflict. The Urban Institute: Washington, D.C. Bowman JS. 1990. Ethics in Government: A National Survey of Public Administrators. Public Administration Review 45-353. Bowman C, Ambrosini V. 2000. Value creation versus value capture: Towards a coherent definition of value in strategy. British Journal of Management 11: 1–15. Bowman C. 2012. Nonprofit Accountability and Ethics: Rotting from the Head Down. Nonprofit Quarterly. Boyne GA. 2002. Public and private management: What’s the difference? Journal of Management Studies 39: 97–122. Brandenburger AM. 2002. Porter's added value: High indeed! The Academy of Management Executive 16(2): 58–60. Brandenburger AM, Stuart HW. 1996. Value-based business strategy. Journal of Economics & Management Strategy 5: 5–24. Brinkerhoff DW, Brinkerhoff JM. 2011. Public–Private Partnerships: Perspectives on Purposes, Publicness, and Good Governance. Public Administration and Development 31(1): 2-14. Brower HH, Shrader CB. 2000. Moral reasoning and ethical climate: Not-for-profit vs. for-profit boards of directors. Journal of Business Ethics 26(2): 147-167. Cabral S, Lazzarini SG, Furquim de Azevedo P. 2010. Private operation with public supervision: evidence of hybrid modes of governance in prisons. Public Choice 145(1/2): 281-293. Chatain O. 2011. Value creation, competition, and performance in buyer-supplier relationships. Strategic Management Journal 32: 76–102. Clarkson ME. 1995. A stakeholder framework for analyzing and evaluating corporate social performance. Academy of Management Review 20: 92–117.

32
Crawford VP. 2003. Lying for strategic advantage: Rational and boundedly rational misrepresentation of intentions. American Economic Review 93: 133–149. Crilly D, Sloan P. 2012. Enterprise logic: explaining corporate attention to stakeholders from the ‘inside-out’. Strategic Management Journal 33: 1174–1193. De Vita CJ, Fleming C (eds). 2001. Building Capacity in Nonprofit Organizations. The Urban Institute: Washington, D.C. Dellarocas C. 2006. Strategic manipulation of internet opinion forums: Implications for consumers and firms. Management Science 52: 1577–1593. Delmas MA, Burbano VC. 2011. The drivers of greenwashing. California Management Review, 54(1): 64-87. DiMaggio P, Anheier H. 1990. The sociology of nonprofit organizations and sectors. Annual Review of Sociology 16: 137-159 Eagly AH, Crowley M. 1986. Gender and helping behavior: A meta-analytic review of the social psychological literature. Psychological Bulletin 100: 283–308. Easley D, O'Hara M. 1983. The economic role of the nonprofit firm. The Bell Journal of Economics 14: 531. Ethics Resource Center. National Nonprofit Ethics Survey: An Inside View of Nonprofit Sector Ethics. 2008. Ethics Resource Center: Arlington. Feldman MS, March JG. 1981. Information in organizations as signal and symbol. Administrative Science Quarterly 26: 171. Fremont-Smith MR, Kosaras A. 2003. Wrongdoing by Officers and Directors of Charities: A Survey of Press Reports 1995-2002. Exempt Organization Tax Review 42(1): 25-59 Frey BS, Stutzer A (eds). 2007. Economics and Psychology: A Promising New Cross-Disciplinary Field. MIT press: Cambridge, MA; 51–88. Friedman M. 2007. The social responsibility of business is to increase its profits. In Corporate Ethics and Corporate Governance, Zimmerli WC, Holzinger M, Richter K (eds). Springer: Berlin Heidelberg, Germany; 173-78. Garcia CR, Aguilera RV. 2015. Incremental value creation and appropriation in a world with multiple stakeholders. Strategic Management Journal 36: 137–147. Gassler RS. 1986. The Economics of Nonprofit Enterprise: A Study in Applied Economic Theory. University Press of America: Lanham, MD. Gassler RS. 1998. Altruisim and the economics of non-profit organisations. Financial Accountability & Management 14: 173–182. Greenlee J, Fischer M, Gordon T, Keating E. 2007. An Investigation of Fraud in Nonprofit Organizations: Occurrences and Deterrents. Nonprofit and Voluntary Sector Quarterly 36: 676-694.

33
Greenwood BN, Agarwal R, Agarwal R, Gopal A. 2016. The When and Why of Abandonment: The Role of Organizational Differences In Medical Technology Life Cycles. Management Science, articles in advance, p. 1-19. Hansmann HB. 1980. The role of nonprofit enterprise. The Yale Law Journal 89: 835. Harris J, Bromiley P. 2007. Incentives to cheat: The influence of executive compensation and firm performance on financial misrepresentation. Organization Science 18:350–367. Henisz WV. 2006. Governance issues in public private partnerships. International Journal of Project Management 24(7): 537-538. Hillman AJ, Keim GD. 2001. Shareholder value, stakeholder management, and social issues: what's the bottom line? Strategic Management Journal 22(2):125–139. Holtfreter K. 2008. Determinants of Fraud Losses in Nonprofit Organizations. Nonprofit Management & Leadership 19: 45-63 Horwitz JR. 2005. Making profits and providing care: Comparing nonprofit, for-Profit, and government hospitals. Health Affairs 24: 790–801. Iriyama A, Kishore R, Talukdar D. 2016. Playing Dirty or Building Capability? Corruption and HR Training as Competitive Actions to Threats from Informal and Foreign Firm Rivals. Strategic Management Journal 37(10): 2152-2173. Jansen E, Von Glinow MA. 1985. Ethical Ambivalence and Organizational Reward Systems. Academy of Management Review 10(4): 814-822. Kamath PS, Kim W. 2007. The Model for End-Stage Liver Disease (MELD). Hepatology 45(3): 797-805. Kamath PS, Wiesner RH, Malinchoc M, Kremers W, Therneau TM, Kosberg CL, D'Amico G, Dickson ER, Kim W. 2001. A Model to Predict Survival in Patients with End-Stage Liver Disease. Hepatology 33(2): 464-470.
Katz E. 2001. Bias in conditional and unconditional fixed effects logit estimation. Political Analysis 9(4):379–384. Kaul A, Luo J. 2016. An economic case for CSR: The comparative efficiency of for-profit firms in meeting consumer demand for social goods. Strategic Management Journal, Forthcoming. Klein PG, Mahoney JT, McGahan AM, Pitelis CN. 2013. Capabilities and Strategic Entrepreneurship in Public Organizations. Strategic Entrepreneurship Journal 7(1): 70-91. Krishnan K, Yetman MH, Yetman RJ. 2006. Expense Misreporting in Nonprofit Organizations. The Accounting Review 81:399-420. Kivleniece I, Quelin BV. 2012. Creating and Capturing Value in Public-Private Ties: A Private Actor's Perspective. Academy of Management Review 37(2): 272-299. Lepak DP, Smith KG, Taylor MS. 2007. Value creation and value capture: A multilevel perspective.
34
Academy of Management Review. 32: 180–194. Lieberman MB, Garcia CR, Balasubramanian N. 2016. Measuring value creation and appropriation in firms: The VCA model. Strategic Management Journal. Lott CE. 2008. Why women matter: the story of microcredit. Journal of Law and Commerce 27(2): 219-230. Lyden FJ. 1975. Using Parsons' functional analysis in the study of public organizations. Administrative Science Quarterly 20(1): 59. MacDonald G, Ryall MD. 2004. How do value creation and competition determine whether a firm appropriates value? Management Science 50: 1319–1333. Machan TR, Tibor R, Uyl DJ. 1987. Recent Work in Business Ethics: A Survey and Critique, American Philosophical Quarterly 24(2): 107-124. Mahoney JT, McGahan AM, Pitelis CN. 2009. The interdependence of private and public interests. Organization Science 20(6): 1034-1052. Meier S. 2007. A survey of economic theories and field evidence on pro-social behavior. SSRN Electronic Journal. Mirman LJ, Samuelson L, Schlee EE. 1994. Strategic information manipulation in duopolies. Journal of Economic Theory 62: 363–384. Mitchell RK, Agle BR, Wood DJ. 1997. Toward a theory of stakeholder identification and salience: Defining the principle of who and shat really counts. Academy of Management Review 22: 853–886. Murphy TF. 2004. Gaming the transplant system. The American Journal of Bioethics 4(1):20-28. O'Connor JP, Priem RL, Coombs JE, Gilley KM. 2006. Do CEO Stock options prevent or promote fraudulent financial reporting? Academy of Management Journal 49: 483–500. O’Neill M. Ethical Dimensions of Nonprofit Administration. 1992. Nonprofit Management & Leadership 3(2): 199–213 Ostler J. 2014. Corrupt business practices as a market entry strategy. Academy of Management Proceedings 1:17321–17321. Ostrom E. 1990. Governing the Commons: The Evolution of Institutions for Collective Action. Cambridge University Press: New York, NY. Porter ME, Kramer MR. 2016. Creating shared value. Harvard Business Review 89: 62–77. Ramírez R. 1999. Value co-production: intellectual origins and implications for practice and research. Strategic Management Journal 20: 49–65. Rangan S, Samii R, Van Wassenhove LN. 2006. Constructive partnerships: When alliances between private firms and public actors can enable creative strategies. Academy of Management Review 31(3): 738-751.

35
Rhode DL, Packel AK, 2009. Ethics and Nonprofits. Stanford Social Innovation Review Rose-Ackerman S. 1996. Altruism, nonprofits, and economic theory. Journal of Economic Literature 34: 701-728. Salamon LM. 1995. Partners in Public Service: Government-Nonprofit Relations in the Modern Welfare State. Johns Hopkins University Press: Baltimore, MD. Salamon LM. 2015. The Resilient Sector Revisited: The New Challenge to Nonprofit America. Brookings Institution Press; Washington, D.C. Sethi SP, Sama LM. Ethical behavior as strategic choice by large corporations: the interactive effect of marketplace competition, industry structure and firm resources. Business Ethics Quarterly 8(1): 85-104. Schlesinger M, Quon N, Wynia M, Cummins D, Gray B. 2005. Profit-seeking, corporate control, and the trustworthiness of health care organizations: Assessments of health plan performance by their affiliated physicians. Health Services Research 40: 605–646. Snyder J. 2010. Gaming the liver transplant market. Journal of Law, Economics, and Organization 26: 546–568. Steinberg R. 1986. The revealed objective functions of nonprofit firms. The RAND Journal of Economics 17: 508. Stevens JM, Steensma KH, Harrison DA. Cochran PL. 2005. Symbolic or Substantive Document? The Influence of Ethics Codes on Financial Executives' Decisions. Strategic Management Journal 26(2):181-195. Sundaram AK, Inkpen AC. 2004. The corporate objective revisited. Organization Science 15(3): 350-363 Tenbrunsel AE. 1998. Misrepresentation and expectations of misrepresentation in an ethical dilemma: The role of incentives and temptation. Academy of Management Journal 41: 330–339. Thaler R, Rosen S. 1976. The value of saving a life: Evidence from the labor market. In Household Production and Consumption, Terleckyj N (eds). National Bureau of Economic Research: New York; 265–302. Utting P, Zammit A. 2009. United Nations-business Partnerships: Good Intentions and Contradictory Agendas. Journal of Business Ethics 90(1): 39. Viscusi WK, Huber J, Bell J. 2011. Promoting recycling: Private values, social norms, and economic incentives. American Economic Review 101: 65–70. Voss GB, Cable DM, Voss ZG. 2000. Linking organizational values to relationships with external constituents: A study of nonprofit professional theatres. Organization Science 2000; 11: 330–347. Weisbrod, B. 1988. The Nonprofit Economy. Harvard University Press: Cambridge, MA. Wooldridge, JM. 2010. Econometric Analysis of Cross Section and Panel Data. MIT press: Cambridge, MA.

Appendix A
Table 1: Summary statistics of transplant patients at time of transplantPre-MELD policy Post-MELD policy
Percent coming from ICU 23.22 11.39Average computed Meld Score 18.83 20.08Percent with Meld<15 42.38 39.77Percent female 35.22 32.26Average age 51.32 51.59
Table 2: Summary statistics of transplant patients at the time of transplant by organization type
ICU Meld Score Meld<15 Meld Score Meld<15(from ICU) (from ICU)
Public Pre 17.25 18.83 44.03 28.84 9.17Post 12.71 20.27 39.21 34.22 3.00
For-Profit Pre 29.78 21.36 25.97 28.26 8.70Post 11.76 21.48 35.29 31.25 8.33
Nonprofit Pre 25.95 18.76 42.04 24.62 20.42Post 10.71 19.93 40.20 31.89 7.16
36

Table 3: Patient health misrepresentation
ICU MELD Score Meld<15
All Centers Combined -0.139 2.579 -0.070(0.017) (0.283) (0.015)[0.000] [0.000] [0.000]
Public -0.075 2.207 -0.080(0.023) (0.467) (0.027)[0.003] [0.000] [0.007]
For-Profit -0.198 1.613 0.024(0.049) 0.621 (0.049)[0.028] [0.081] [0.661]
Nonprofit -0.172 2.709 -0.066(0.019) (0.310) (0.017)[0.000] [0.000] [0.000]
Observations 8867 8867 8867
Each cell contains the coefficient β1 from Equation 1 for the respectiveorganization type and outcome variable.All specifications include individual and OPO level controls along withcenter and month fixed effects.Standard errors in parentheses. P-values in brackets.SEs clustered at the OPO level.
Table 4: Impact of center type on patient health misrepresentation
(1) (2) (3)ICU MELD Score Meld<15
Public × MELD era 0.083 -0.59 0.002(0.024) (0.493) (0.030)[0.001] [0.238] [0.957]
For-Profit × MELD era 0.003 -1.693 0.127(0.062) (0.876) (0.022)[0.965] [0.059] [0.000]
Individual Level Controls Yes Yes YesCenter/OPO Controls Yes Yes YesMonth Fixed Efects Yes Yes YesCenter Fixed Effects Yes Yes YesObservations 8867 8867 8867
All controls and fixed effects are interacted with MELD era.Standard errors in parentheses. P-values in brackets.SEs clustered at the OPO level.
37
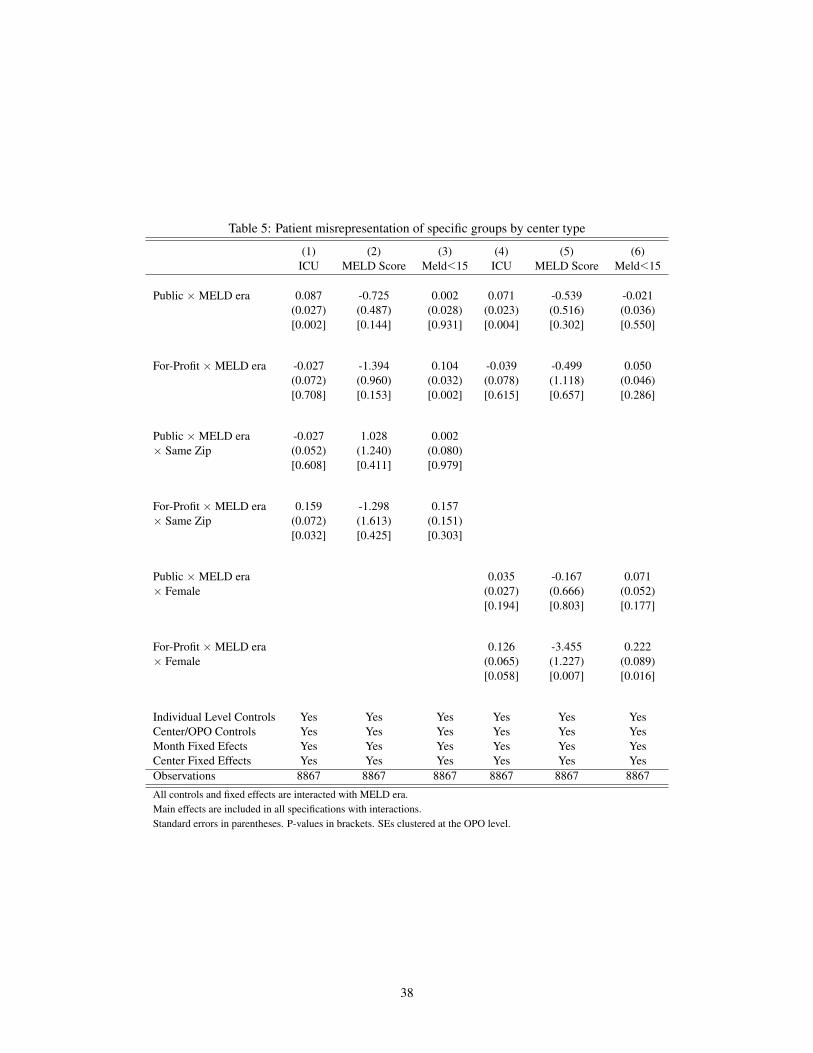
Table 5: Patient misrepresentation of specific groups by center type
(1) (2) (3) (4) (5) (6)ICU MELD Score Meld<15 ICU MELD Score Meld<15
Public × MELD era 0.087 -0.725 0.002 0.071 -0.539 -0.021(0.027) (0.487) (0.028) (0.023) (0.516) (0.036)[0.002] [0.144] [0.931] [0.004] [0.302] [0.550]
For-Profit × MELD era -0.027 -1.394 0.104 -0.039 -0.499 0.050(0.072) (0.960) (0.032) (0.078) (1.118) (0.046)[0.708] [0.153] [0.002] [0.615] [0.657] [0.286]
Public × MELD era -0.027 1.028 0.002× Same Zip (0.052) (1.240) (0.080)
[0.608] [0.411] [0.979]
For-Profit × MELD era 0.159 -1.298 0.157× Same Zip (0.072) (1.613) (0.151)
[0.032] [0.425] [0.303]
Public × MELD era 0.035 -0.167 0.071× Female (0.027) (0.666) (0.052)
[0.194] [0.803] [0.177]
For-Profit × MELD era 0.126 -3.455 0.222× Female (0.065) (1.227) (0.089)
[0.058] [0.007] [0.016]
Individual Level Controls Yes Yes Yes Yes Yes YesCenter/OPO Controls Yes Yes Yes Yes Yes YesMonth Fixed Efects Yes Yes Yes Yes Yes YesCenter Fixed Effects Yes Yes Yes Yes Yes YesObservations 8867 8867 8867 8867 8867 8867
All controls and fixed effects are interacted with MELD era.Main effects are included in all specifications with interactions.Standard errors in parentheses. P-values in brackets. SEs clustered at the OPO level.
38

Table 6: Patient misrepresentation of specific groups by center type
ICU MELD Score Meld<15
(1) (2) (3) (4) (5) (6) (7) (8) (9) (10) (11) (12)
Public × 0.000 0.093 0.113 0.074 0.818 0.695 -1.130 -0.608 0.024 -0.119 0.069 -0.020meldera (0.058) (0.046) (0.037) (0.026) (2.002) (1.819) (0.751) (0.515) (0.126) (0.118) (0.046) (0.033)
[0.994] [0.050] [0.004] [0.006] [0.686] [0.705] [0.139] [0.244] [0.848] [0.321] [0.141] [0.543]
For-Profit × 0.465 -0.056 -0.018 -0.030 -12.936 2.715 -2.178 -0.600 0.631 0.156 0.220 0.035meldera (0.163) (0.152) (0.056) (0.082) (4.162) (4.117) (0.971) (1.322) (0.157) (0.276) (0.054) (0.034)
[0.007] [0.715] [0.741] [0.716] [0.004] [0.514] [0.030] [0.652] [0.000] [0.577] [0.000] [0.312]
Month FE Yes Yes Yes Yes Yes Yes Yes Yes Yes Yes Yes YesCenter FE Yes Yes Yes Yes Yes Yes Yes Yes Yes Yes Yes YesGender Female Male Female Male Female Male Female Male Female Male Female MalePatient Zip Same Same Outside Outside Same Same Outside Outside Same Same Outside OutsideObservations 390 730 2589 5158 390 730 2589 5158 390 730 2589 5158
All controls and fixed effects are interacted with MELD era. Main effects are included in all specifications with interactions.Standard errors in parentheses. P-values in brackets. SEs clustered at the OPO level.
39