Unemployment and Happiness - jil.go.jp · Unemployment and Happiness 61 Winkelmann (1998) analyze...
16
59 Unemployment and Happiness Fumio Ohtake Osaka University Are unemployed people unhappier than employed people? To answer this question, this paper presents an extensive review of previous overseas studies and conducts an empirical analysis of the determinants of happiness in Japan. The main result in this study is consistent with that of previous studies; even when the income level and other individual characteristics are held constant, unemployment reduces people’s happiness. This conclusion, if it is true, sug- gests that under budget constraints, to create jobs rather than to redistribute wealth to the unemployed may be more effective to raise people’s levels of subjective well-being (happiness). I. Introduction Are unemployed people really unhappy? It might be common knowledge that unem- ployment makes people unhappy. However, according to neoclassical economic point of view that emphasizes the market equilibrium, unemployment is voluntary. Suppose that the wage flexibly adjust to equilibrate the labor market, people choose to be jobless, rather than engage in work at a low wage, to find better jobs through ongoing job search activities. If people choose to leave employment, the voluntarily unemployed people, everything else being equal, should be happier than the employed as long as they do not work or there should be no difference in the degree of happiness. If, on the contrary, the employed are happier than the unemployed, when the income level and other conditions are held constant, the assumption of neoclassic economics that people become voluntarily unemployed needs to be modified. Even when unemployment is assumed to arise under conditions of downward wage rigidity, the unemployed should be at a higher utility level than the employed. In other words, in case that people with high in- come are unemployed and people with the same level of income are employed, the utility level of the unemployed should be higher, as long as labor involves disutility. However, if being employed provides not only pecuniary benefit but also a sense of happiness to people, economic policies should be revised accordingly based on such recognition. It implies that compensation in money would not increase the levels of subjective well-being of the unem- ployed, although their income levels reach those of the employed. Under the budget con- straints, creating more jobs than compensating the unemployed will be more effective to improve the level of well-being. In this regard, for the policy-making as well as economic analysis, studying how un- employment affects people’s happiness is very critical. Then, how can we measure people’s feeling of subjective well-being, “happiness”? Happiness is usually measured by using data from attitude surveys, which typically ask, “Taken all together, to what extent are you cur-
Transcript of Unemployment and Happiness - jil.go.jp · Unemployment and Happiness 61 Winkelmann (1998) analyze...
59
Unemployment and Happiness Fumio Ohtake Osaka University
Are unemployed people unhappier than employed people? To answer this question, this paper presents an extensive review of previous overseas studies and conducts an empirical analysis of the determinants of happiness in Japan. The main result in this study is consistent with that of previous studies; even when the income level and other individual characteristics are held constant, unemployment reduces people’s happiness. This conclusion, if it is true, sug-gests that under budget constraints, to create jobs rather than to redistribute wealth to the unemployed may be more effective to raise people’s levels of subjective well-being (happiness).
I. Introduction
Are unemployed people really unhappy? It might be common knowledge that unem-
ployment makes people unhappy. However, according to neoclassical economic point of
view that emphasizes the market equilibrium, unemployment is voluntary. Suppose that the
wage flexibly adjust to equilibrate the labor market, people choose to be jobless, rather than
engage in work at a low wage, to find better jobs through ongoing job search activities. If
people choose to leave employment, the voluntarily unemployed people, everything else
being equal, should be happier than the employed as long as they do not work or there
should be no difference in the degree of happiness.
If, on the contrary, the employed are happier than the unemployed, when the income
level and other conditions are held constant, the assumption of neoclassic economics that
people become voluntarily unemployed needs to be modified. Even when unemployment is
assumed to arise under conditions of downward wage rigidity, the unemployed should be at
a higher utility level than the employed. In other words, in case that people with high in-
come are unemployed and people with the same level of income are employed, the utility
level of the unemployed should be higher, as long as labor involves disutility. However, if
being employed provides not only pecuniary benefit but also a sense of happiness to people,
economic policies should be revised accordingly based on such recognition. It implies that
compensation in money would not increase the levels of subjective well-being of the unem-
ployed, although their income levels reach those of the employed. Under the budget con-
straints, creating more jobs than compensating the unemployed will be more effective to
improve the level of well-being.
In this regard, for the policy-making as well as economic analysis, studying how un-
employment affects people’s happiness is very critical. Then, how can we measure people’s
feeling of subjective well-being, “happiness”? Happiness is usually measured by using data
from attitude surveys, which typically ask, “Taken all together, to what extent are you cur-
Japan Labor Review, vol. 9, no. 2, Spring 2012
60
rently feeling happy?” People’s answers to this question are coded on a 10-point scale
ranging from 0 for “very unhappy” and 5 for “neither happy nor unhappy” to 10 for “very
happy.”
Happiness, an individual’s subjective feeling of well-being, has not been much stu-
died theoretically and examined empirically by economists because of its subjectivity and
difficulty in making comparison between individuals. However, the recent empirical studies
on “happiness” and “satisfaction” have revealed that the effects of personal characteristics
and economic variables on the level of happiness are quite robust and the significant rela-
tions are widely recognized in the international academic filed. For example, Frey and
Stutzer (2002) state that the recent empirical studies on happiness have well proved that
unemployment has a significant negative effect on happiness even when other factors are
controlled for.1
The effects of unemployment on happiness can be analyzed from two different as-
pects. One is a personal-level effect that concerns how individuals’ employment state or any
experiences of unemployment affect one’s happiness. The other is a macro-level effect that
focuses on how the macro-level unemployment rate affects the level of happiness. Increase
in the macro-level unemployment rate could affect happiness in two ways: (i) as the number
of unemployed people increases, the number of happy people in the entire society decreas-
es; (ii) even for the employed, a rise in the macro-level unemployment rate increases a fear
of unemployment, which eventually leads to lowering the level of happiness.
Di Tella, MacCulloch, and Oswald (2001) analyze how the unemployment, the un-
employment rate, and the inflation rate affect the level of happiness based on micro data on
happiness for 12 European countries. They argue that everything else same, the unemployed
are less happy than the employed. Clark and Oswald (1994) also conduct an empirical anal-
ysis using the UK micro data, and clarify that unemployment significantly reduces people’s
happiness. Wolfers (2003) and Blanchflower and Oswald (2004) find using the US and UK
data that unemployment has a negative effect on happiness.
Earlier studies on the relation between unemployment and happiness may have some
limitations if they are based on cross-sectional data. The negative correlation between un-
employment and happiness does not necessarily indicate that unemployment has a
cause-and-effect relationship with happiness. For example, unhappy people may be more
likely to become unemployed and in this case, the causality runs in the opposite direction.
One possible approach to overcome this problem is to analyze fluctuations in the level of
happiness of the same individual, or to treat the time invariant happiness level as the fixed
effect. With this method, the adverse relation that people who feel less happy by nature are
more likely to jobless can be explained as the fixed effect. Then, the actual effect of unem-
ployment on happiness can be analyzed. Using the German panel data, Winkelmann and
1 Hamermesh (2004) made a critical review of the economic analysis that use subjective indica-
tors.
Unemployment and Happiness
61
Winkelmann (1998) analyze unemployment and its effect on happiness by eliminating the
fixed effects. Their results indicate that even when the fixed effect of individuals is taken
into consideration, unemployment still has a large, negative effect on happiness. In other
words, the negative correlation between unemployment and happiness is not attributed to
the reverse causality that those who are unhappier than average tend to be easily unem-
ployed; rather, the negative correlation is resulted from the fact that becoming unemployed
has a negative effect on people’s happiness.
Does the effect of unemployment on happiness differ by the circumstances of the
unemployed? For example, if people become unemployed in the situation where the unem-
ployment rate is high, and unemployment is a common occurrence or an unusual event, the
effects of unemployment may differ. Many studies in the United Kingdom show that unem-
ployment has a smaller effect on happiness in high unemployment areas than in low em-
ployment areas. Clark and Oswald (1994) find that the negative effect size of unemploy-
ment on happiness is small among young and elderly people who experience a high unem-
ployment rate, compared with the 30-49 age group who has a low unemployment rate.
However, Winkelmann and Winkelmann (1998) conduct the empirical analysis using Ger-
man panel data and present a quite different result that young people suffer most from the
unemployment and they report the lowest happiness. This remarkable difference may be an
indication of the possibility that for some countries, being unemployed at a young age acts
as a permanent shock to the person but not for other countries.2
Di Tella, MacCulloch, and Oswald (2001) and Wolfers (2003) analyze the effect of
the macro-level unemployment rate on happiness, in addition to the effect of individuals’
unemployment on subjective well-being. They report that a rise in the macro-level unem-
ployment rate reduces individuals’ happiness. The magnitude of the negative effect caused
by increasing unemployment rate at macro level is bigger than that caused by increasing
inflation rate. Wolfer (2003) further discovers that fluctuations in the unemployment rate
also have a negative effect on the level of happiness.3
Comparatively, there have been only few studies on the effect of economic variables
on people’s level of happiness in Japan.4 This paper, in this regard, aims to fill this gab by
examining how unemployment affects individual happiness, using Japanese data. Two sets
of data are used for this study. One is the data collected from the Questionnaire Survey on
Lifestyle and Society (2002), conducted independently by the author. This survey investi-
gates the level of happiness of individuals and their employment status. The other is the data
from the National Survey on Lifestyle Preference (1978-1999), conducted by the Economic
Planning Agency. This survey asks the level of happiness throughout all survey years and
also includes a question on the perceived level of fear of unemployment. The main esti-
mated results based on these two data are: (i) with level of income held constant, the unem-
2 Korpi (1997) conducted an empirical analysis using data of young people in Sweden. 3 For macroeconomics and happiness, see Darity and Goldsmith (1996), Oswald (1997). 4 For the study on happiness and inequality, see Ohtake and Tomioka (2002, 2003).
Japan Labor Review, vol. 9, no. 2, Spring 2012
62
ployed are less happy than those with jobs; (ii) the fear of unemployment reduces people’s
happiness.
Section II explains two data sets used for this study, and Section III reports the results
of the empirical analysis on the effect of unemployment on happiness. Section IV presents
conclusions and discusses future issues.
II. Data
1. Questionnaire Survey on Lifestyle and Society The first data used for the analysis of the relation between happiness and unemploy-
ment are collected from the Questionnaire Survey on Lifestyle and Society (hereafter,
QSLS) (2002), conducted independently by the author during the period 13-26 February
2002. A sample of 6,000 people aged between 20 and 65 was drawn by two-phase stratified
random sampling. The questionnaires were sent to respondents by mail. The total number of
responses collected was 1,943, among whom 1,928 were valid responses (valid respondent
rate: 32.1%). The questions can be roughly divided into the following categories: (i) Japa-
nese economy (determining factors of income level and normative evaluation thereof, past
and future changes in income distribution, opinions on income redistribution policy); (ii)
respondent’s financial situation (current income, assets, expected income, expected inflation
rate, experience of unemployment, level of happiness, class consciousness); (iii) respon-
dent’s utility function (time preference, risk aversion rate); (iv) other individual characteris-
tics (e.g., gender, age, individual and parental educational attainment).
Studies on the effect of unemployment on happiness using cross-sectional data have
limitations to completely control for personal characteristics, which makes it difficult to
eliminate the adverse cause-and-effect relationship between unemployment and happiness.
The analysis using the QSLS may pose the same problem, but the main difference from
previous studies is that this study adds an indicator for the degree of risk aversion to better
control for individual characteristics.
The degree of risk aversion is constructed by subtracting from 100% the individuals’
responses to the question “When you go out, how high a probability of rainfall makes you
carry an umbrella (0~100%)?”: high values implies a tendency to avoid taking risks. This
indicator is advantageous because it uses the day-to-day situation which is easily unders-
tandable for the Japanese respondents and the continuous variable is simply generated from
answers for the probability of rainfall. The risk aversion measured from the “reservation
price of a hypothetical lottery ticket” may be affected by the respondent’s income level or
asset level. If that happens, the degree of aversion with the same risk level may not be ac-
curately measured. Another limitation is that there may be some respondents who have dif-
ficulties in making self-assessment of risk attitudes regarding the hypothetical lottery ques-
tion. The potential problem posed by the rainfall indicator, on the other hand, is that the
magnitude of disutility from being caught in a rain may itself vary depending on the res-
Unemployment and Happiness
63
pondent’s age, gender, income and other individual characteristics. However, in multiple
regression analysis, we can estimate the net effect by controlling for any other factors.
2. National Survey on Lifestyle Preference Another data used in this paper are collected from the National Survey on Lifestyle
Preference (hereafter NSLP). This survey has been carried out by the Economic Planning
Agency (currently the Cabinet Office) every year, and the survey includes a time-series
component every three years for a chronological comparison. The successive waves of the
NSLP survey with the interval of three years have asked the same question on happiness.
This paper uses individual data from time-series survey collected at 8 points in time be-
tween 1978 and 1999. The NSLP has a nationwide sample of both sexes from the age of 15
to 75 drawn by two-phase stratified random sampling and the drop-off survey method is
used. The total sample size is 30,007 across the eight successive surveys. In contrast to the
cross-section data from the QSLS, the data from the NSLP make it possible to analyze the
effect of changes in the macro-level unemployment rate on happiness. However, it was not
possible to examine the effect of individual unemployment on happiness because the NSLP
does not include questions about a respondent’s job search activities. Instead, this survey
asks, “To what extent are you currently satisfied with the following aspect of your job: work
without fear of unemployment.” Using this question, how “fear of unemployment” affects
individual happiness can be analyzed. Responses to this question are given in the form of a
5-point rating scale running from “hardly sufficiently satisfied” to “sufficiently satisfied.”
Reported results are converted to a binary variable: those who answered either “not very
satisfied” or “hardly satisfied” are defined as persons who have “fear of unemployment
(=1).”
3. Descriptive Statistics Trends in Time-Series
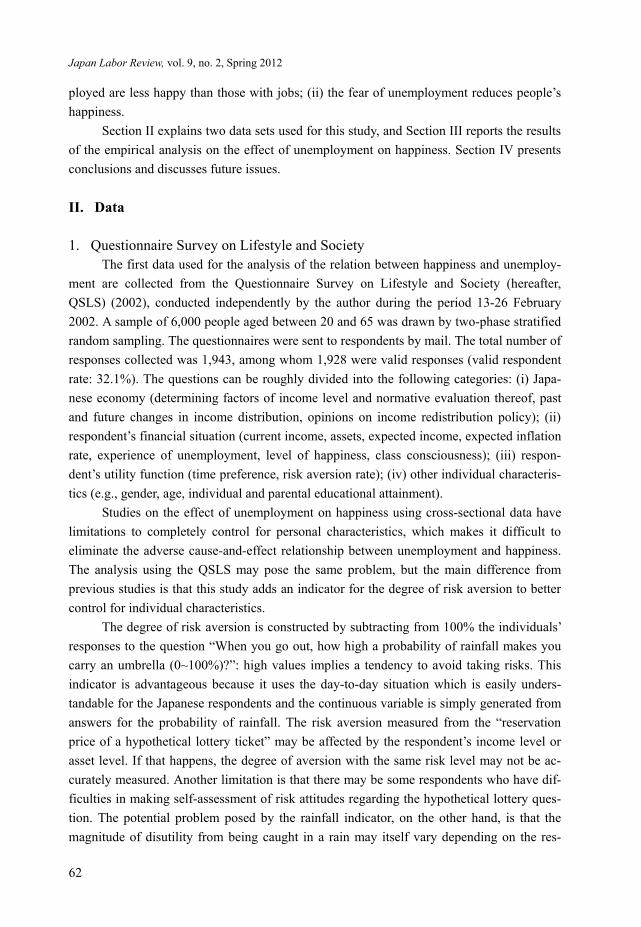
Figure 1 shows the trend in the mean level of happiness calculated from the NSLP.
The average happiness level declined until 1987, remained nearly flat between 1987 and
1996, and then further declined thereafter. The change in unemployment rate shown in Fig-
ure 1 corresponds to a slow increase of the percentage of people who have fear of unem-
ployment. The decline in happiness over time and the increase in unemployment rate (fear
of unemployment) suggests that there is a negative correlation between happiness and the
rest of two.
Distribution of the Level of Happiness The QSLS and the NSLP were conducted by the method of mailing survey and
household drop-off survey respectively and obtained different response rates. Due to these
differences in survey method and responses rate, two surveys may provide different
Japan Labor Review, vol. 9, no. 2, Spring 2012
64
Sources: Level of happiness and fear of unemployment are calculated by the author from the
NSLP and unemployment rate is from the Labor Force Survey.
Figure 1. Level of Happiness, Unemployment Rate, and Fear of Unemployment
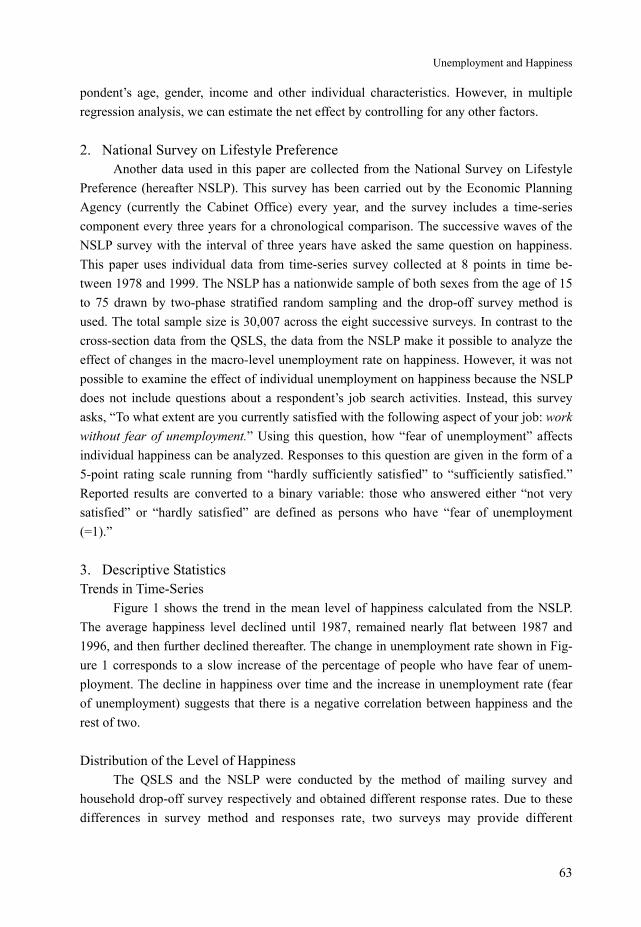
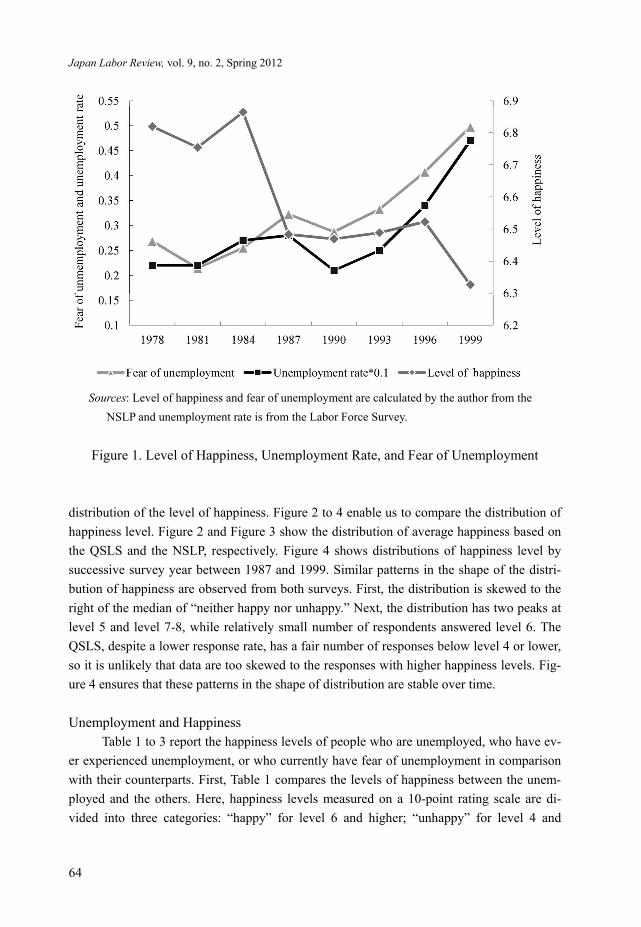
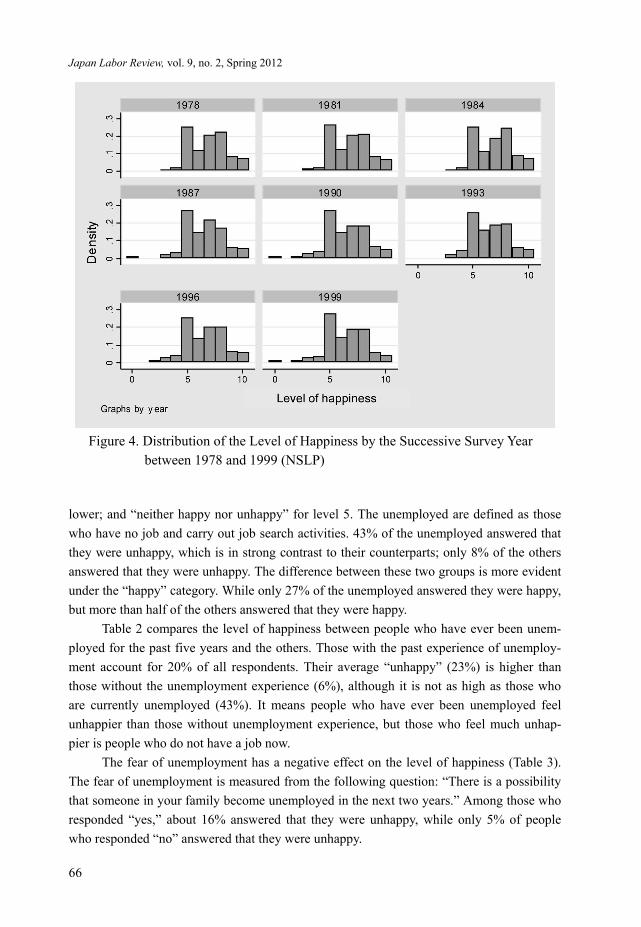
distribution of the level of happiness. Figure 2 to 4 enable us to compare the distribution of
happiness level. Figure 2 and Figure 3 show the distribution of average happiness based on
the QSLS and the NSLP, respectively. Figure 4 shows distributions of happiness level by
successive survey year between 1987 and 1999. Similar patterns in the shape of the distri-
bution of happiness are observed from both surveys. First, the distribution is skewed to the
right of the median of “neither happy nor unhappy.” Next, the distribution has two peaks at
level 5 and level 7-8, while relatively small number of respondents answered level 6. The
QSLS, despite a lower response rate, has a fair number of responses below level 4 or lower,
so it is unlikely that data are too skewed to the responses with higher happiness levels. Fig-
ure 4 ensures that these patterns in the shape of distribution are stable over time.
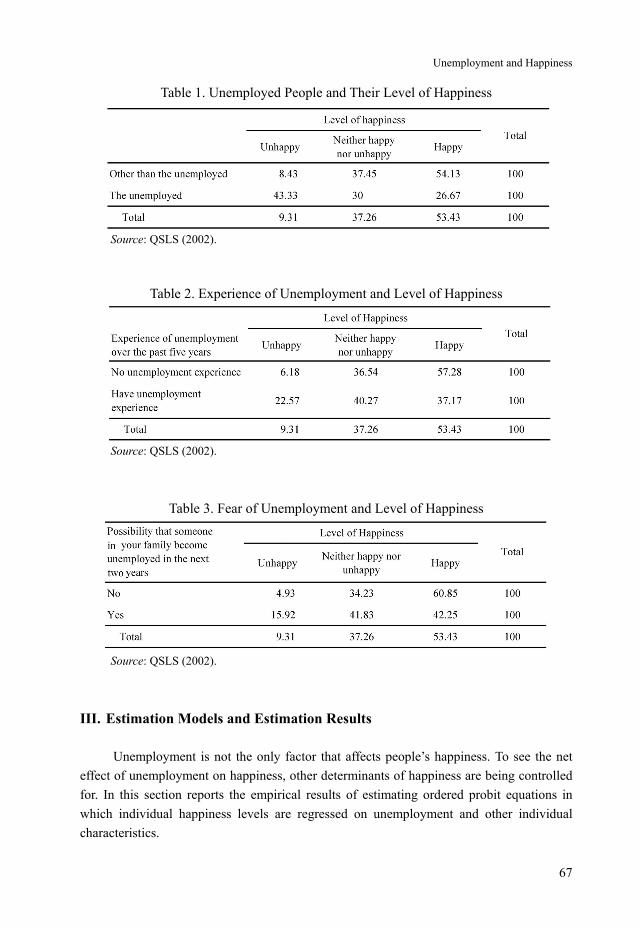
Unemployment and Happiness Table 1 to 3 report the happiness levels of people who are unemployed, who have ev-
er experienced unemployment, or who currently have fear of unemployment in comparison
with their counterparts. First, Table 1 compares the levels of happiness between the unem-
ployed and the others. Here, happiness levels measured on a 10-point rating scale are di-
vided into three categories: “happy” for level 6 and higher; “unhappy” for level 4 and
Unemployment and Happiness
65
Figure 2. Distribution of the Level of Happiness (QSLS)
Figure 3. Distribution of the Level of Happiness (NSLP; 1978-1999)
Japan Labor Review, vol. 9, no. 2, Spring 2012
66
Figure 4. Distribution of the Level of Happiness by the Successive Survey Year between 1978 and 1999 (NSLP)
lower; and “neither happy nor unhappy” for level 5. The unemployed are defined as those
who have no job and carry out job search activities. 43% of the unemployed answered that
they were unhappy, which is in strong contrast to their counterparts; only 8% of the others
answered that they were unhappy. The difference between these two groups is more evident
under the “happy” category. While only 27% of the unemployed answered they were happy,
but more than half of the others answered that they were happy.
Table 2 compares the level of happiness between people who have ever been unem-
ployed for the past five years and the others. Those with the past experience of unemploy-
ment account for 20% of all respondents. Their average “unhappy” (23%) is higher than
those without the unemployment experience (6%), although it is not as high as those who
are currently unemployed (43%). It means people who have ever been unemployed feel
unhappier than those without unemployment experience, but those who feel much unhap-
pier is people who do not have a job now.
The fear of unemployment has a negative effect on the level of happiness (Table 3).
The fear of unemployment is measured from the following question: “There is a possibility
that someone in your family become unemployed in the next two years.” Among those who
responded “yes,” about 16% answered that they were unhappy, while only 5% of people
who responded “no” answered that they were unhappy.
Unemployment and Happiness
67
Table 1. Unemployed People and Their Level of Happiness
Source: QSLS (2002).
Table 2. Experience of Unemployment and Level of Happiness
Source: QSLS (2002).
Table 3. Fear of Unemployment and Level of Happiness
Source: QSLS (2002).
III. Estimation Models and Estimation Results
Unemployment is not the only factor that affects people’s happiness. To see the net
effect of unemployment on happiness, other determinants of happiness are being controlled
for. In this section reports the empirical results of estimating ordered probit equations in
which individual happiness levels are regressed on unemployment and other individual
characteristics.
Japan Labor Review, vol. 9, no. 2, Spring 2012
68
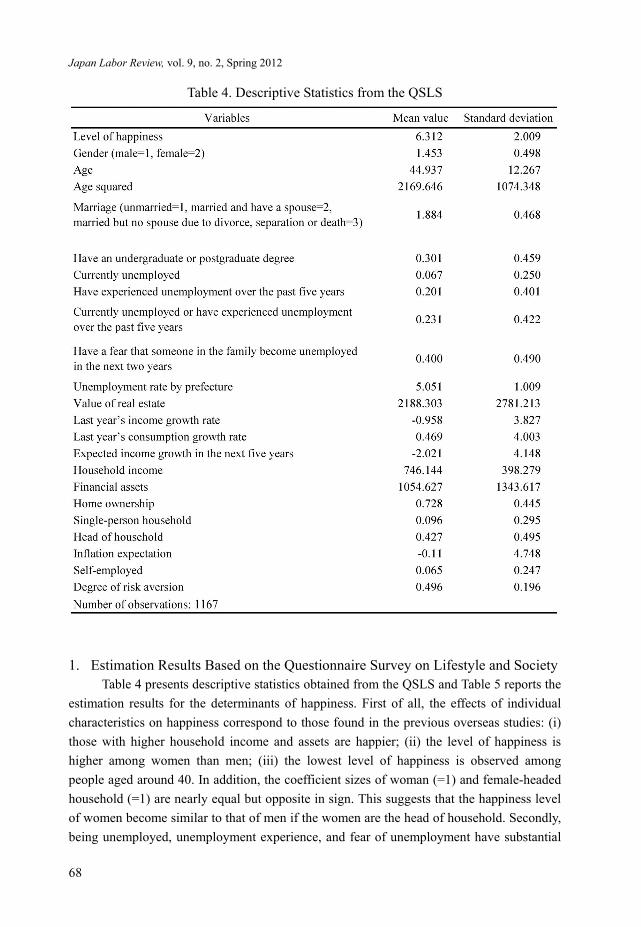
Table 4. Descriptive Statistics from the QSLS
1. Estimation Results Based on the Questionnaire Survey on Lifestyle and Society Table 4 presents descriptive statistics obtained from the QSLS and Table 5 reports the
estimation results for the determinants of happiness. First of all, the effects of individual
characteristics on happiness correspond to those found in the previous overseas studies: (i)
those with higher household income and assets are happier; (ii) the level of happiness is
higher among women than men; (iii) the lowest level of happiness is observed among
people aged around 40. In addition, the coefficient sizes of woman (=1) and female-headed
household (=1) are nearly equal but opposite in sign. This suggests that the happiness level
of women become similar to that of men if the women are the head of household. Secondly,
being unemployed, unemployment experience, and fear of unemployment have substantial
Unemployment and Happiness
69
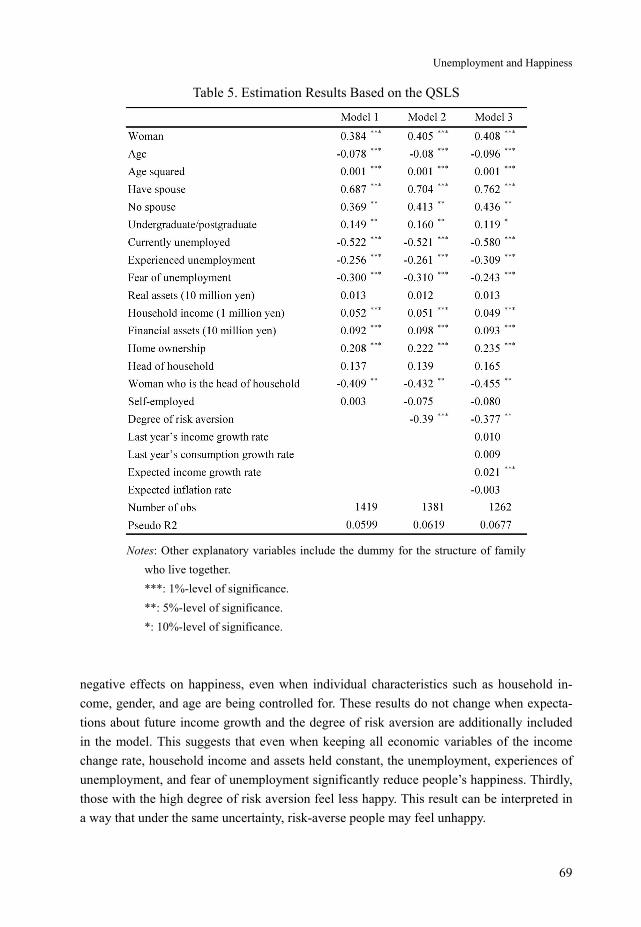
Table 5. Estimation Results Based on the QSLS
Notes: Other explanatory variables include the dummy for the structure of family
who live together.
***: 1%-level of significance.
**: 5%-level of significance.
*: 10%-level of significance.
negative effects on happiness, even when individual characteristics such as household in-
come, gender, and age are being controlled for. These results do not change when expecta-
tions about future income growth and the degree of risk aversion are additionally included
in the model. This suggests that even when keeping all economic variables of the income
change rate, household income and assets held constant, the unemployment, experiences of
unemployment, and fear of unemployment significantly reduce people’s happiness. Thirdly,
those with the high degree of risk aversion feel less happy. This result can be interpreted in
a way that under the same uncertainty, risk-averse people may feel unhappy.
Japan Labor Review, vol. 9, no. 2, Spring 2012
70
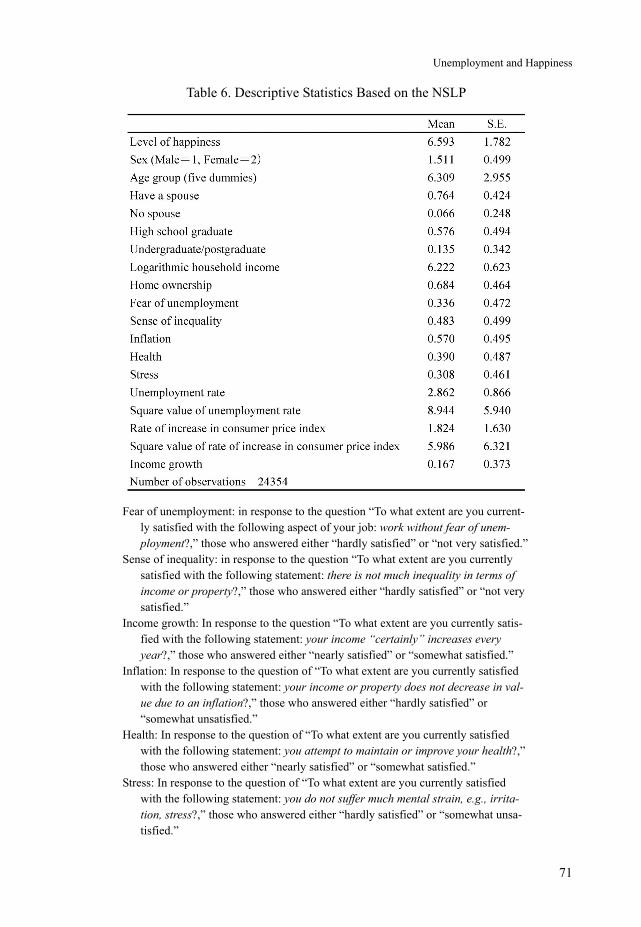
2. Estimated Results Based on the National Survey on Lifestyle Preference Table 6 and Table 7 report descriptive statistics of the NSLP data and estimation re-
sults, respectively. As explained in the section 2-2, the NSLP data do not include a question
as to whether the subjects are currently unemployed or not. Thus, with the NSLP data, this
study analyzes the effect of the “fear” of unemployment, instead of “being” currently em-
ployed, on happiness.
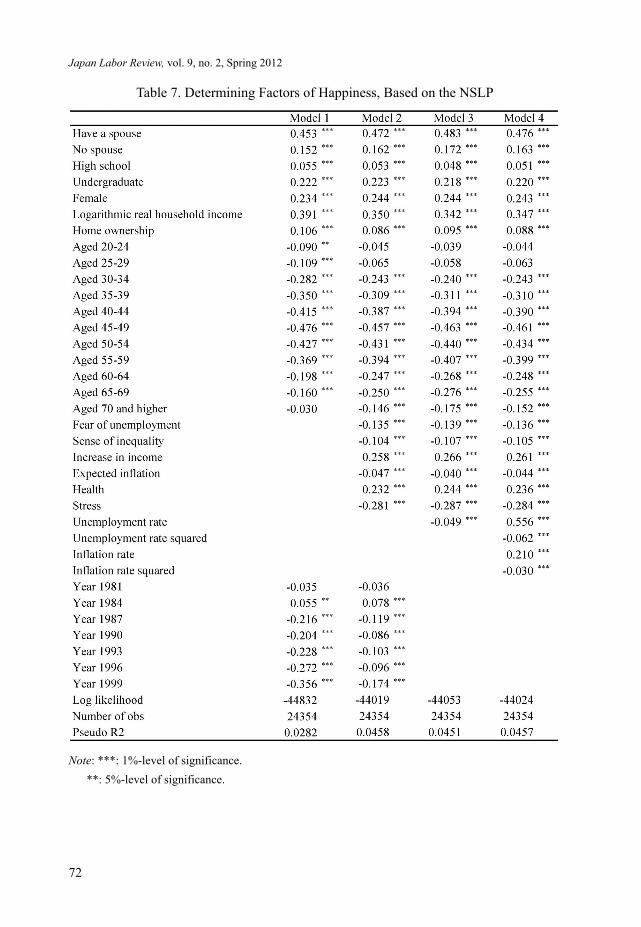
Main estimation results are as follows (Table 7). First, in Model 1, the effects of in-
come, age, and gender on happiness are qualitatively the same as those found with the
QSLS data. High-income earners, women, the highly-educated report higher level of hap-
piness, while those aged around 40 report the lowest level of happiness. In addition, the
recent decline in the level of happiness, with income and age held constant, is observed
from the movements of year dummy variables in Model 1.
Model 2 indicates that people’s levels of happiness significantly declines if they have
fear of unemployment or they think that equality of income and property has not been
achieved. In particular, the negative effect of the fear of unemployment on happiness re-
mains significant even when household income level or the expectation for income growth
is being controlled for. In other words, even when people have high income or expect the
continuous income growth, their happiness declines if they are aware that there is fear of
unemployment in society. If people think that inflation will rise, it also has a negative effect
on happiness. In contrast, those who are healthy and have less stress in life feel happier.
When these self-consciousness variables included into the model, the decline in the coeffi-
cient sizes for year dummies are reduced by about 0.1 point. This suggests that the cause of
the recent decline in the level of happiness can be partly accounted for by the increase in the
fear of unemployment or sense of inequality.5 After self-consciousness variables are being
controlled for, however, the declines in coefficient sizes of the recent year dummies are still
observed. This might indicate that other important variables are also important in explaining
declines in happiness of the Japanese.
In Model 3, the unemployment rate replaces year dummies as an additional explana-
tory variable. Even though the results should be interpreted with caution because the data
were collected only at eight points in time, it is found that the rise in the unemployment rate
has a negative effect on the level of happiness. Model 4 includes quadratic time trends in the
inflation rate and unemployment rate. The quadratic terms of unemployment rate and infla-
tion rate are both negative. The peak of happiness occurs at 4.5% of the unemployment rate
and 3.3% of the inflation rate. This suggests that the level of happiness will decline if the
unemployment rate rises from the 2003 level, whereas the rise in the inflation rate up to
3.3% will raise the level of happiness. This interpretation still requires caution because the
empirical results are based on limited time-series data.
5 When both independent (happiness level) and dependent variables (the sense of inequality or fear of unemployment) are self-consciousness variables, there may be a potential cause-effect specification problem .
Unemployment and Happiness
71
Table 6. Descriptive Statistics Based on the NSLP
Fear of unemployment: in response to the question “To what extent are you current-ly satisfied with the following aspect of your job: work without fear of unem-ployment?,” those who answered either “hardly satisfied” or “not very satisfied.”
Sense of inequality: in response to the question “To what extent are you currently satisfied with the following statement: there is not much inequality in terms of income or property?,” those who answered either “hardly satisfied” or “not very satisfied.”
Income growth: In response to the question “To what extent are you currently satis-fied with the following statement: your income “certainly” increases every year?,” those who answered either “nearly satisfied” or “somewhat satisfied.”
Inflation: In response to the question of “To what extent are you currently satisfied with the following statement: your income or property does not decrease in val-ue due to an inflation?,” those who answered either “hardly satisfied” or “somewhat unsatisfied.”
Health: In response to the question of “To what extent are you currently satisfied with the following statement: you attempt to maintain or improve your health?,” those who answered either “nearly satisfied” or “somewhat satisfied.”
Stress: In response to the question of “To what extent are you currently satisfied with the following statement: you do not suffer much mental strain, e.g., irrita-tion, stress?,” those who answered either “hardly satisfied” or “somewhat unsa-tisfied.”
Japan Labor Review, vol. 9, no. 2, Spring 2012
72
Table 7. Determining Factors of Happiness, Based on the NSLP
Note: ***: 1%-level of significance.
**: 5%-level of significance.
Unemployment and Happiness
73
IV. Conclusion
This paper empirically analyzes what determines the level of happiness with particu-
lar focus on the effect of unemployment, using the individual data obtained from the QSLS
and the NSLP. The main finding from the empirical analysis is that being unemployed, ex-
periences of unemployment and fear of unemployment reduce people’s happiness. This
might appear to be common knowledge, but it should be noted that the same results are ob-
tained when the income level is being controlled for in the analysis. In other words, even
with the same income, those who are currently looking for jobs are less happy than those
who are engaged in their jobs. The analysis also reveals that people who have a high degree
of risk aversion and who recognize income inequality feel less happy. The level of happi-
ness of the Japanese substantially declined in late 1980s, which can be partly accounted for
by the growing fear of unemployment and increasing degree of inequality.
Based on the results of the empirical analysis, this study concludes that in order to
raise people’s level of subjective well-being (happiness), it is more effective to spend budg-
et in creating jobs than to redistribute the budget to the unemployed.
References
Blanchflower, David G., and Andrew J. Oswald. 2004. Well-being over time in Britain and
the USA. Journal of Public Economics 88, no. 7:1359–86.
Clark, Andrew E., and Andrew J. Oswald. 1994. Unhappiness and unemployment. The
Economic Journal 104, no. 424:648–59.
Darity, William Jr., and Arthur H. Goldsmith. 1996. Social psychology, unemployment and
macroeconomics. The Journal of Economic Perspectives, 10, no. 1:121–40.
Di Tella, Rafael, Robert J. MacCulloch, and Andrew J. Oswald. 2001. Preferences over in-
flation and unemployment: Evidence from surveys of happiness. American Economic
Review 91, no. 1:335–41.
Frey, Bruno S., and Alois Stutzer. 2002. What can economists learn from happiness re-
search? Journal of Economic Literature 40, no. 2:402–35.
Hamermesh, Daniel S. 2004. Subjective outcomes in economics. Working Paper no. 10361,
National Bureau of Economic Research, Cambridge, MA.
Korpi, Tomas. 1997. Is utility related to employment status? Employment, unemployment,
labor market policies and subjective well-being among Swedish youth. Labour Eco-
nomics 4, no. 2:125–47.
Ohtake, Fumio, and Jun Tomioka. 2002. Kofukudo to shotoku kakusa [Level of happiness
and income disparity]. A report submitted to the Spring Meeting of the Japanese Eco-
nomic Association in 2002.
———. 2003. Shotoku kakusa to keizai kosei [Income disparity and welfare economics.
Unpublished manuscript.
Japan Labor Review, vol. 9, no. 2, Spring 2012
74
Oswald, Andrew J. 1997. Happiness and economic performance. The Economic Journal
107, no. 445:1815–31.
Winkelmann, Liliana, and Rainer Winkelmann. 1998. Why are the unemployed so unhap-
py? Evidence from panel data. Economica 65, no. 257:1–15.
Wolfers, Justin. 2003. Is business cycle volatility costly? Evidence from surveys of subjec-
tive well-being. Working Paper no. 9619, National Bureau of Economic Research,
Cambridge, MA.