Unearthing Patterns in Venetian History · Unearthing Patterns in Venetian History: Developing an...
95
I Unearthing Patterns in Venetian History: Developing an Online Tool for Discovering Patterns in Subterranean Archaeological Sites An Interdisciplinary Qualifying Project Submitted to the faculty of Worcester Polytechnic Institute in partial fulfillment of the requirements for the Degree of Bachelor of Science Submitted by: William Godsey Natalia Kononenko Xiaozhu Liu Lucy Stuehrmann Sponsoring Agency: Studio Zandinella Submitted To: Professor Aaron N. Deskins Professor Fabio Carrera Submitted Date: https://sites.google.com/site/ve16archeo/ [email protected] This report represents the work of WPI undergraduate students submitted to the faculty as evidence of completion of a degree requirement. WPI routinely publishes these reports on its website without editorial or peer review. For more information about the projects program at WPI, please see http://www.wpi.edu/academics/ugradstudies/project-learning.html
Transcript of Unearthing Patterns in Venetian History · Unearthing Patterns in Venetian History: Developing an...

I
Unearthing Patterns in Venetian History: Developing an Online Tool for Discovering Patterns in Subterranean
Archaeological Sites
An Interdisciplinary Qualifying Project Submitted to the faculty of
Worcester Polytechnic Institute in partial fulfillment of the requirements for the
Degree of Bachelor of Science
Submitted by: William Godsey Natalia Kononenko Xiaozhu Liu Lucy Stuehrmann
Sponsoring Agency: Studio Zandinella
Submitted To: Professor Aaron N. Deskins Professor Fabio Carrera
Submitted Date: https://sites.google.com/site/ve16archeo/
[email protected] This report represents the work of WPI undergraduate students submitted to the faculty as evidence of completion of a degree requirement. WPI routinely publishes these reports on its website without editorial or peer review. For more information about the projects program at WPI, please see http://www.wpi.edu/academics/ugradstudies/project-learning.html

II
Abstract
Archaeologists in Venice would benefit from digital tools to improve their efficiency in
data collection, visualization, and correlation. To aid in archaeological research, we developed a
three-part prototype system, consisting of a web app, online database, and a map-based website,
for the archaeological firm Studio Zandinella. The first aspect of the project was an online database
that allows archaeologists to store and visualize archaeological data. The second part of the system
was a data collecting system that records information on the database. The third part of the system
was a map-based website that visualizes the contents of the database. These tools will allow
Venetian archaeologists to better conduct research and find patterns of data across archaeological
sites in Venice.
III
Executive Summary
The city of Venice and its lagoon have played a major role in the history of both Europe
and the world as both a political force and the cross road between the east and the west over the
last two millennia, drawing the attention of countless visitors and scholars. Amongst these scholars
are archaeologists, scientists who study the material remains of past cultures, and their work is of
the utmost importance to the proper documentation of Venice’s rich culture and history.
Unfortunately archaeological work and research is very time and labor intensive. The goal of this
project was to assist Venetian archaeologists with collecting, visualizing and cross-referencing
archaeological data from subterranean and submerged archaeological sites in Venice and the
surrounding lagoon.
The objectives of the project were as follows:
1. To design and create a data recording systemto collect archeological data.
2. To design and create a web-based system to visualize archaeological data.
3. To experiment with analytical cross-referencing techniques based on the collected data.
The first aspect of our project was the creation of a data recording system that would assist
Venetian archaeologists with recording archaeological data from the field. The first step taken was
to meet with Studio Zandinella and discuss app design. From these discussion we were able to
determine that Venetian archaeologists use a complex set of paper records that are required by the
Soprintendenza, the local government authority for archaeologists. The studio emphasized the
need to reduce the current workload of archaeologists working in the field. From here the
application was designed with both usability and efficiency in mind, and as such any information
that is recorded on the system will be automatically uploaded to the previously mentioned online
database. In the below figure you can see several screenshots of the mobile version of the
IV
application, displaying its data collection functionality, and how it has been designed for clarity
and ease of use while still being able to effectively and accurately record data from the field.
Screenshots of the data recording system’s user interface
As can be seen in the above figure to further ensure the effectiveness of the system the
team designed the data entry forms on the application to correspond with the previously mentioned
government forms which can be found in Appendix C, and to partially autofill said forms on the
database with the relevant information to further increase the ease and efficiency of archaeological
data recording. In order to improve the effectiveness of the data recording system the team
integrated some of the unique technological features of the mobile device platform as was
suggested by our advisors in our team meetings. These features included using the phone’s camera
to easily and automatically upload photographs to the online database to further improve the
visualization abilities of the system. The second of these features is the use of a device’s onboard
GPS functionality to allow archaeologists to easily and accurately record the exact geographic
location of the site on which they are working. The data collected by the web application is stored
in an online database that makes it easily accessible. With the integration of the additional features
in addition to the form-based data recording abilities of the data recording application, the team
has been able to create a system that will allow Venetian archaeologists to easily record, manage,
and visualize their data.

V
The second of the team’s objectives focused primarily on the creation of a map-based
website that would allow archaeologists to easily visualize said data. The first of step towards
accomplishing this goal was for the team to meet with our sponsor, Studio Zandinella, to discuss
the current methods that archaeologists use for data management and visualization. For populating
the database and map-based website the team used the data collected by amateur archaeologist
Ernesto Canal, who spent several decades visiting and documenting archaeological sites in Venice
in his book, “Archeologia della Laguna di Venezia”, to demonstrate the usability of our system for
both storing and visualizing archaeological data. The below figure is the map of Venice and its
lagoon created by Ernesto Canal displaying all of the archaeological information that he collected
during his career.
Ernesto Canal’s Map
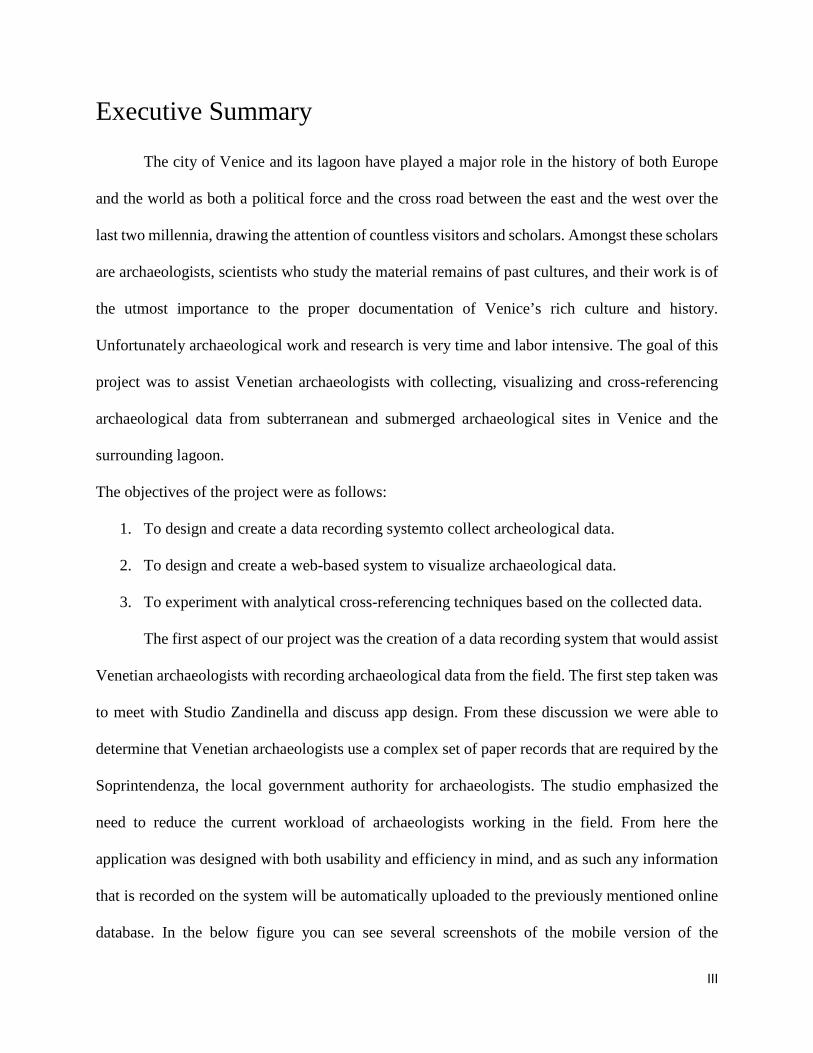
The below figure is a screenshot of the map generated digitally by the team displaying some of
Ernesto Canal’s information, highlighting the capability of the system to accurately and clearly
visualize archaeological information.
VI
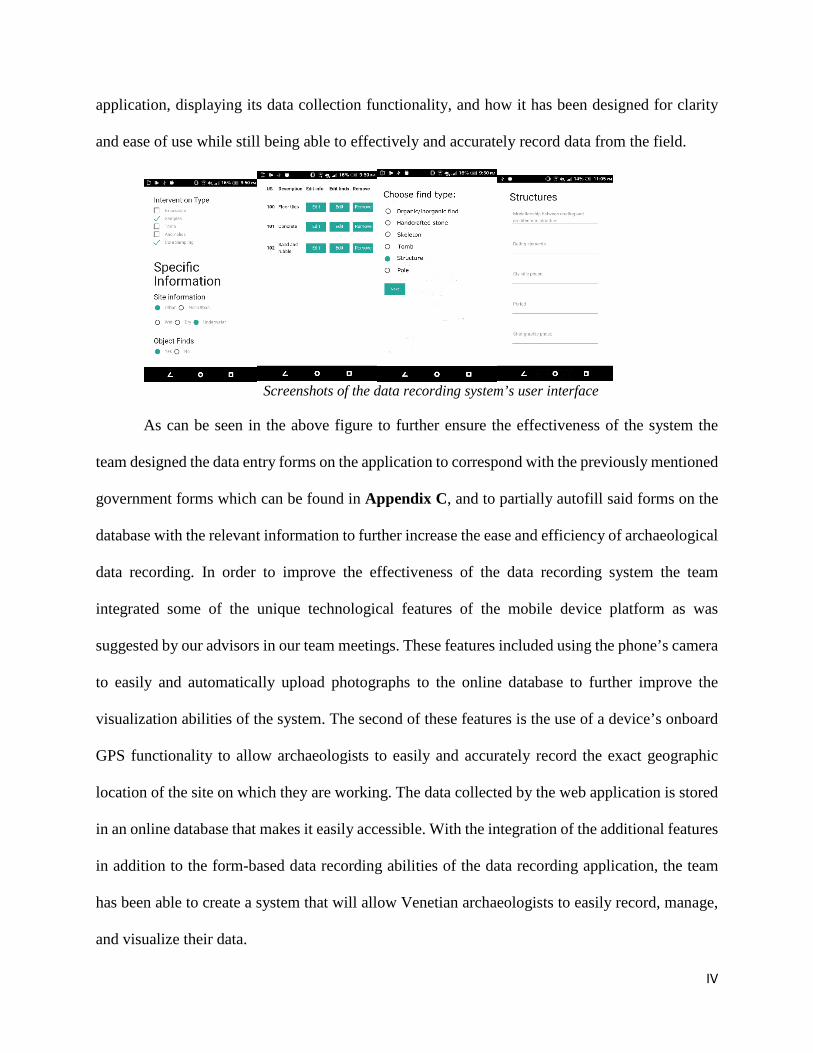
Screenshot of the map-based website
The below figure is a screenshot of the map-based website displaying the system’s ability to zoom
in on any particular area of the map to further visualize the available data, while also displaying
the pop-up feature of the system allowing for easy accessibility to more information on any given
site displayed on the map.
Screenshot of the map-based website’s data visualization abilities
Currently the system is able to accurately store and manage all forms of archaeological information
and will provide archaeologists with a powerful tool for visualizing their collected data. In
particular the use of Ernesto Canal’s collected information has allowed the team to highlight the

VII
efficiency and power of the system as a research tool, as anyone using the system could properly
visualize and make the connections that took Ernesto several decades, in just a fraction of that
time.
Screenshot of the system’s data filtering capabilities using medieval sites
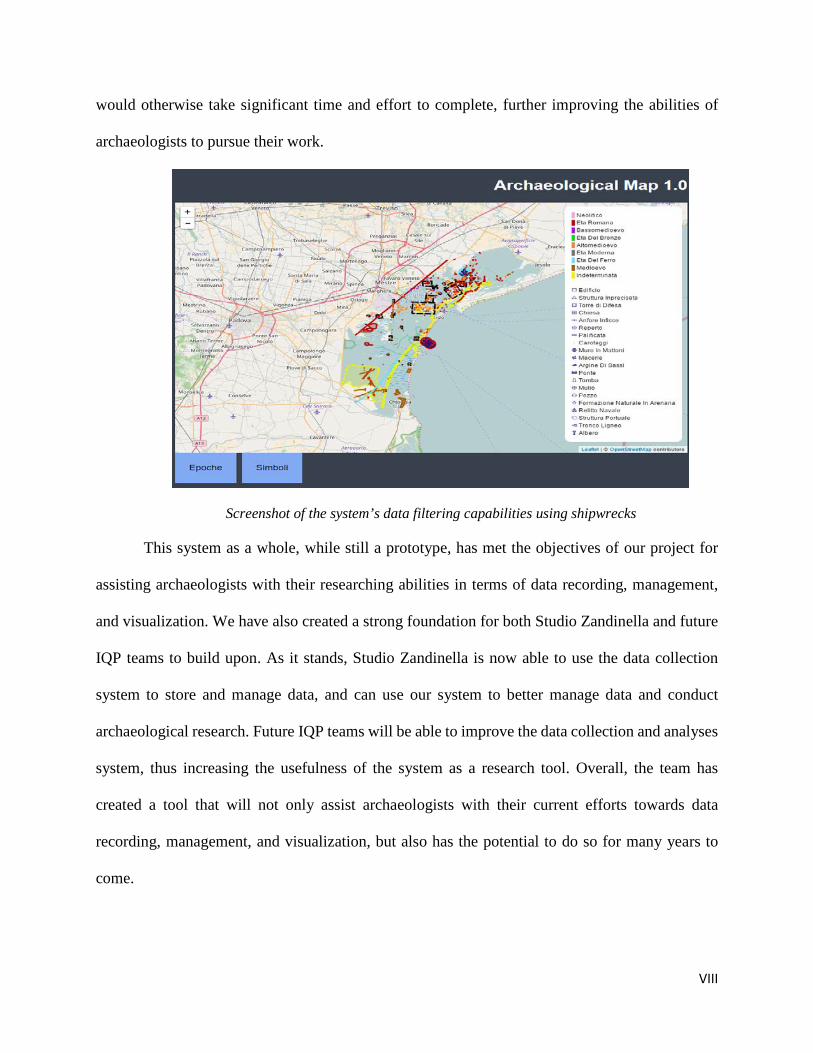
The third goal of this project was to experiment with data cross-referencing techniques
using the collected data, which in this case was data from Ernesto Canal’s book. Experimentation
primarily took the form of using the map-based website for filtering by site type and age to help
with visualizing connections and patterns amongst archaeological data. The uppermost of the two
figures below is a screenshot showing only medieval sites. This screenshot was generated using
the filtering tool. The lower figure shows filtering by type of site. Here only shipwrecks are shown
on the map.
This functionality allows Venetian archaeologists to spend significantly less time and
energy analyzing data and making predictions as to the locations of potential sites than was
previously possible. It also allows archaeologists to easily research and visualize information that
VIII
would otherwise take significant time and effort to complete, further improving the abilities of
archaeologists to pursue their work.
Screenshot of the system’s data filtering capabilities using shipwrecks
This system as a whole, while still a prototype, has met the objectives of our project for
assisting archaeologists with their researching abilities in terms of data recording, management,
and visualization. We have also created a strong foundation for both Studio Zandinella and future
IQP teams to build upon. As it stands, Studio Zandinella is now able to use the data collection
system to store and manage data, and can use our system to better manage data and conduct
archaeological research. Future IQP teams will be able to improve the data collection and analyses
system, thus increasing the usefulness of the system as a research tool. Overall, the team has
created a tool that will not only assist archaeologists with their current efforts towards data
recording, management, and visualization, but also has the potential to do so for many years to
come.

IX
Authorship
Section Primary Author(s) Primary Editor(s)
Abstract Lucy Stuehrmann Lucy Stuehrmann, Will Godsey
Executive Summary Will Godsey Natasha Kononenko, Xiaozhu Liu
Introduction Will Godsey, Natasha Kononenko, Xiaozhu Liu, Lucy Stuehrmann
Will Godsey, Natasha Kononenko, Xiaozhu Liu, Lucy Stuehrmann
2.1 Archaeology Overview Lucy Stuehrmann Will Godsey
2.2 Archaeological Considerations of Venice
Will Godsey, Natasha Kononenko
Will Godsey, Natasha Kononenko
2.3 Digital Archaeology Xiaozhu Liu Will Godsey, Xiaozhu Liu
3.1 Collecting Archaeological Data
Lucy Stuehrmann Natasha Kononenko
3.2 Visualizing Archaeological Data
Natasha Kononenko, Lucy Stuehrmann
Lucy Stuehrmann, Natasha Kononenko
3.3 Experimenting with Cross-Referencing Archaeological Data
Xiaozhu Liu, Lucy Stuehrmann Natasha Kononenko
4.1 Designing and Creating the Data Collection System
Will Godsey, Natasha Kononenko
Xiaozhu Liu
4.2 Visualization System Will Godsey, Xiaozhu Liu Natasha Kononenko
4.3 Using Tools for Archaeological Analysis
Lucy Stuehrmann, Xiaozhu Liu Natasha Kononenko
5.1 Field Application Lucy Stuehrmann Natasha Kononenko, Lucy Stuehrmann
5.2 Visualization System Lucy Stuehrmann Natasha Kononenko
5.3 Analysis Lucy Stuehrmann Will Godsey This work was completed equally by all members of this team and represents extensive work done by all members of this team.

X
Table of Contents Abstract ........................................................................................................................................... II
Executive Summary ...................................................................................................................... III
Authorship..................................................................................................................................... IX
Table of Contents ........................................................................................................................... X
1. Introduction ................................................................................................................................. 1
2. Background ................................................................................................................................. 4
2.1.1. Definitions ..................................................................................................................... 4
2.1.2. Analyzing and Correlating Archaeological Data ........................................................... 5
2.1.3. Types of Venetian Archeological Sites ......................................................................... 6
2.2. Archaeological Issues in Venice .......................................................................................... 9
2.2.1. Historical Wealth of Venice .......................................................................................... 9
2.2.2. Venice-Specific Difficulties .......................................................................................... 9
2.3 Studio Zandinella ................................................................................................................ 12
2.4 Digital Archaeology ............................................................................................................ 13
2.4.1 Geographic Information System ................................................................................... 14
2.4.3 Difficulties in Data Digitization ................................................................................... 16
3. Methodology ............................................................................................................................. 18
3.1. Creating a Tool for Collecting Archaeological Data ......................................................... 19
3.1.1. Establish Data Collection Parameters .......................................................................... 20
3.1.2. Develop Web Interface ................................................................................................ 20
3.1.3. Design Database for Sites and Finds ........................................................................... 21
3.1.4. Populate Database with Venetian Archaeological Sites .............................................. 23
3.2 Visualizing Archaeological Data ........................................................................................ 23
3.2.1. Create a Map-Based Visualization System ................................................................. 24
3.2.2 Receive Feedback and Refine Visualization ................................................................ 24
3.3. Experimenting With Cross-Referencing Archaeological Data .......................................... 25
3.3.1. Filtering Features ......................................................................................................... 25
3.3.2. Assisting with Pattern Recognition ............................................................................. 26
4. Results and Analysis ................................................................................................................. 28
4.1 Designing and Creating the Data Collection System .......................................................... 29

XI
4.1.1 Current Archaeological Recording Systems ................................................................. 29
4.1.2. Final Data Collection System ...................................................................................... 32
4.1.3. Structuring the Database .............................................................................................. 34
4.1.4. Populating the Database .............................................................................................. 37
4.2 Visualization System ........................................................................................................... 38
4.2.1 Completed Visualization System .................................................................................. 39
4.2.2 Feedback ....................................................................................................................... 40
4.3 Using Tools for Archaeological Analysis ........................................................................... 41
4.3.1 Filtering and Pattern Recognition ................................................................................. 41
5. Conclusions & Recommendations ............................................................................................ 48
5.1 Field Application ................................................................................................................. 48
5.2 Visualization System ........................................................................................................... 50
5.3 Analysis ............................................................................................................................... 51
References ..................................................................................................................................... 54
Appendix A: Archaeological System Summaries......................................................................... 59
OxCal ........................................................................................................................................ 59
Integrated Archaeological Database .......................................................................................... 60
Site Recorder 4 .......................................................................................................................... 62
Comparative Archaeology Database ......................................................................................... 63
tDAR ......................................................................................................................................... 64
QGIS.......................................................................................................................................... 64
Kobo Tool ................................................................................................................................. 65
ExeGesIs/HBSMR .................................................................................................................... 66
SHARD ..................................................................................................................................... 67
ARK- The Archaeological Recording Kit ................................................................................. 68
Intrasis ....................................................................................................................................... 68
Nabonidus.................................................................................................................................. 69
SingulArch-Pocket .................................................................................................................... 70
BASP Posthole .......................................................................................................................... 71
Bcal............................................................................................................................................ 71
Appendix B: Data Recording Forms ............................................................................................. 73
Appendix C: Archaeological Forms ............................................................................................. 78

XII
List of Figures
Figure No.
Title Page
1 Archaeological Site Filling with Water 11
2 Photo of an Archaeological Find 13
3 Screenshot of Map with Customized Marker Made in qGIS 15
4 Workflow showing how the web system works 19
5 Catalog Number System in the site form 22
6 Highlighted area that includes several site 26
7 Data recording procedures 29
8 Archaeological field journal 30
9 Sample of US index(left) and US form(right) that are used by Venetian archaeologists
31
10 List of Forms used by archaeologists in Venice 32
11 Sample of app version of site form interface (left) and US matrix (right) 33
12 App interface for find types (left) and forms of the selected type (right) 34
13 Google firebase hierarchy tree 34
14 Saved data for a site in firebase database 35
15 Eight types of data saved in the app 36
16 List of site keys saved in Firebase 36
17 Map displayed in Ernesto canal’s book 37
18 Example of qGIS mapping of the sites mentioned in Ernesto Canal’s book 39
19 Website map with filtering option 40

XIII
20 Map Legend showing site eras and symbols 42
21 Map only shows sites from Medioevo after filtering - cluster in northern lagoon shows likelihood that the area was land during the medieval era
43
22 Map only shows shipwrecks after filtering 43
23 Roman settlement of the northern coast of Santa Cristina 44
24 Island of La Cura showing medieval sites 45
25 Palificata holding a road out of the water 46
26 Location recommended for archaeological excavation 47

1
1. Introduction
Archaeology is the study of past cultures through the material remains left behind by these
cultures (AIA, 2016). Archaeology allows humanity to gain a better understanding of its past,
which assists in understanding why cultures are structured the way they are today. Each new
archaeological find gives archaeologists fresh insight into the past, serving as a piece of a greater
puzzle. Like any other puzzle, the full picture is often only visible when all or many of the pieces
have been assembled. When researchers attempt to bring information together, difficulty can arise
in understanding of past cultural and societal changes, as many current data recording methods do
not allow for easy data analysis and visualization. These problems associated with data analysis
and visualization are caused by archiving methods that put emphasis on the analysis of individual
pieces rather than emphasizing analysis of the connections between sites and finds. Today, most
archaeological data is manually recorded, then organized by parameters including age, site type,
place of origin for artifacts, and location, and are then filed for future reference in paper-based
archives. Such practices are well-established and commonplace, and the resultant analog databases
kept by archaeologists continue to grow with each new discovery (Perrin K., 2014). The larger an
analog database is, the harder it becomes to analyze and organize the contained information to
clearly understand connections between archaeological findings, as such efforts are highly reliant
on the abilities of researchers to find, analyze, and visualize all of the relevant information (Cai
L., 2015). This means that for sites of high archaeological significance, which can contain
thousands of separate data points, traditional methods for data analysis can become a Sisyphean
2
task, as it becomes incredibly difficult for archaeologists to manage and work with so much
information.
Venetian archaeologists face previously mentioned difficulties as well as additional
challenges caused by human activity, urbanization, tidal changes revealing new sites or flooding
current sites, and excavation site difficulties. Human activities in particular contribute to the
destruction of archaeological sites, as cruise ships dump waste directly into the lagoon, which
damages submerged relics, causing difficulties in recording and preserving these sites. (Hastings,
D., 2014). This heightens the importance of swift and efficient archaeological excavation and data
gathering. Venice also faces the unique challenge of being a massive archaeological site with a
large and active civilian population. Archaeologists must work around citizens and often need to
re-bury sites after the initial excavation is finished. This means that inaccessible subterranean sites
are frequent, and often only one excavation is possible. Since the government requires specific
paper forms to be submitted, archaeologists document their results in paper-based, difficult-to-
navigate files (Afezolli, 2010). Due to these factors, researchers in Venice face distinct challenges
in conducting research and gathering archaeological data.
Our sponsor, Studio Zandinella, which is a Venetian archaeological firm, as well as most
Venetian archaeologists, meticulously document and catalogue their findings using paper-based
recording systems. After the recording process, data is archived, and only re-examined when
deemed necessary. This system has created colossal collections of data that require an equally
considerable investment of energy for the members of the Venetian archaeological community to
transcribe into another archiving system. Extensive efforts must be made to not only ensure the
accuracy, but also the completeness of such a switch due to the sheer volume of information
involved. These practices for cataloguing and documentation also create upkeep and managerial
3
challenges due to the necessity of manually tracking and organizing multitudinous paper records.
As data gathering and management represent important aspects of archaeological work and
research, it is necessary to modernize these data collection systems and provide a tool to visualize
this data, including geographical analysis of different archeological finds.
Studio Zandinella has identified specific improvements that could be made to their current
data management methods. They currently use an archaeological information system that utilizes
extensive paper records, which are difficult to search through. An additional difficulty involves
cross-referencing, which refers to the act of comparing data about multiple sites or finds to
understand possible patterns or connections. Cross-referencing is difficult to complete as a result
of the physically large nature of these paper archives. Studio Zandinella has no digital system to
assist with archaeological research, however, other Venetian archaeological firms are actively
working to digitally catalogue the various Venetian sites using a map based web-system, but due
to the specialized needs and preferences of each archaeological studio, none of the currently
created systems adequately meet Studio Zandinella’s needs.
The primary focus of our project will be the creation of a prototype digital system to ease
the documentation, visualization, and analysis of archaeological data. The team will also design a
database and data-entry system to assist in decreasing user error in cataloguing, as the web app
will enable archaeologists to ensure that all necessary information is gathered and recorded on-
site. Data can then be visualized in a map-based form, giving archaeologists further insight into
archaeological sites in Venice.
4
2. Background
In order to assist Venetian archaeologists with the development of an archaeological data
management and research tool, a thorough understanding of general archaeological practices and
research has to be developed. Once archaeological processes and practices are understood, Venice-
specific challenges with archaeological research are discussed as well as current recording and
research practices in the global archaeological community. The section also discusses digital
archaeological practices and techniques which will assist in the creation of an online data
management and research system.
2.1. Archaeology Overview
Archaeologists collect, analyze, and record data using established technical methods that
follow guidelines set by archaeological organizations, universities, and governments. This section
establishes important archaeological definitions, explains data collection and analysis procedures,
and briefly covers differences between traditional and Venice-specific archaeological sites and
techniques.
2.1.1. Definitions Archaeologists attempt to understand and explain the practices and behaviors of past
cultures and societies by analyzing the remains of those societies. These finds are typically
discovered by archaeologists through the excavation of archaeological sites (Dean M., 1995;
Drewett, 1999). An archaeological site is defined as “Any place where human material remains
are found; an area of human activity represented by material culture.” (AIA, 2016) In this
definition, material culture refers to any material remains, such as bricks and pottery shards, left
by past societies (AIA, 2016). Sites take many different forms, but we are primarily concerned

5
with underwater, urban, and subterranean sites, as those are most common to Venice.
Archaeologists face different challenges for investigating each of these site types, which are further
investigated in Section 2.1.3. At these sites, archaeologists uncover relics and remains of past
civilizations, that can be classified broadly as artifacts, ecofacts, and human remains. Artifacts are
defined as “Portable object[s] manufactured, modified, or used by humans.” (AIA, 2016) These
differ from ecofacts, which are defined as “archaeological finds that are of cultural significance,
but were not manufactured by humans. These include bones and vegetal remains that can tell
[archaeologists] about past diet or environments.” (AIA, 2016) Ecofacts, in turn, differ from human
remains, which are defined as human bones, tissue, or body parts (AIA, 2016). The differences
between these relic types is important to understand, as they necessitate different recording,
analyses, and legal processes (AIA, 2016). For example, in Venice, human remains are reported
using a separate, more extensive, set of forms than an artifact or ecofact, as seen in Appendix C,
while ecofacts undergo radiocarbon and chemical analysis. Remains are uncovered at sites, and
are then typically meticulously catalogued, recorded, then moved off-site where they are analyzed
and interpreted (Drewett 1999).
2.1.2. Analyzing and Correlating Archaeological Data Once archaeologists have collected artifacts from an archaeological site, they begin analyzing
these relics to uncover relationships between sites and finds. Archaeologists use several different
methods and techniques when analyzing archeological sites, the most significant of which is dating
(Perrin, K., 2013; Drewett 1999). Dating remains is one of the most widely-used and important
methods used to analyze finds (AIA 2016, Zeuner, F.E, 1951). This process involves establishing
a time period where the remains originated and is crucial to archaeological analysis because it
allows archaeologists to establish chronological records for sites. (Drewett 1999; Perrin, K., 2013;
6
AIA, 2016; Avila, C., 2010). To date finds, archaeologists use many different techniques, which
can be generalized into two categories: relative and absolute dating (AIA 2016; Afezolli, D., 2009).
Relative dating is the process by which finds are analyzed in relation to each other to organize
them from least- to most- recent, whereas absolute dating involves the use of scientific processes,
such as radiocarbon dating to establish specific dates for finds. (AIA 2016; Rowe, J., 1959; Zeuner,
F.E., 1951). Both absolute and relative dating are highly important to archaeological analysis, as
absolute dating allows archaeologists to firmly establish when specific societies resided in the site
area while relative dating allows archaeologists to determine change in societal practices, cultural
considerations, and technological advancement throughout time.
Once remains have been dated and analyzed, archaeologists can then compare their finds to
other sites’ finds to establish trends and correlations between locations. Archaeologists typically
compare information from various locations to determine how manufacturing techniques, cultural
practices, and economic practices spread over time throughout a geographical region (Grunow,
1961; Smith, 1987; South, 1978). In order to do this, they track metrics such as pottery form,
ceramic structure, art motifs, and architectural similarities between sites (Drewett, 1999). By
tracking these and other such metrics, archaeologists determine how civilizations spread and
changed throughout history, which is crucial to understanding how human societies have evolved
and adapted in the past. This process of correlation is therefore extremely important to
archaeologists, and comprises a large portion of archaeological research, which therefore heightens
its importance to this project.
2.1.3. Types of Venetian Archeological Sites Beyond a basic understanding of archaeological methods and analysis, it is important to note
several archaeological challenges regarding underwater, subterranean, and urban archaeological

7
sites, as the majority of Venetian archaeological sites are either located in the lagoon, buried
beneath the city, or located in urban areas (Venice and its Lagoon, 2016). Challenges faced when
excavating and analyzing sites in underwater, subterranean, and urban location typically revolve
around increased difficulty in accessibility to sites and data recording, which can both be addressed
through the creation of online, efficient data recording and management systems for Venetian
archaeologists. Archaeological techniques used when investigating these locations also differ from
techniques used when investigating traditional archaeological sites, and must be understood, as
these difficulties also heighten the need for online data collection tools.
Conditions unique to underwater sites can increase uncertainty when analyzing
archeological finds. Fluctuating sea levels can affect dating and location analysis and materials
tend to degrade differently underwater, which can greatly complicate analysis and evaluation of
these remains (Dean M., 1995; Bailey G., 2008). Furthermore, it is highly difficult for
archaeologists to return to underwater sites, as underwater archaeology is more expensive than
traditional archaeology due to the increased cost of excavation tools, which causes difficulties
when collecting new data from old sites (Barstad, J., 2002). As many Venetian sites are
underwater, these considerations heighten the need for efficient data collection systems for
Venetian archaeologists.
Venice also contains several subterranean archaeological sites, which introduce challenges
that are similar to those faced in underwater excavation but involve distinctly different solutions.
Subterranean, or below-ground archaeological sites, typically are sites that have been buried by
human or geographic activity (Hesselberth, C., 1948; AIA 2016). They can range from
underground catacombs to caves to burial locations (Hesselberth, C., 1948; Schiffer M., 1994). As
these sites have been buried, they are difficult and costly to excavate using traditional, excavation-
8
based methods (Levy T., 1996). Furthermore, subterranean locations can be dangerous to explore
in-person due to ground instability (Hesselberth, C., 1948; Drewett 1999). Therefore,
archaeologists must conduct analysis in subterranean locations quickly, efficiently, and with an
emphasis on archaeologist safety. As these sites are difficult to re-examine later, archaeologists
also require visualizations of subterranean sites to assist with later research and analysis.
Challenges involving urban archaeology are also crucial to understand for the successful
development of this project. Urban sites, or sites located within areas of high human population,
face accessibility challenges as well as legal and analytical difficulties (AIA 2016; Dalgish, C.,
2005). Sites can be inaccessible due to normal human activity in these areas, or can be impossible
to excavate due to their location in proximity to city infrastructure such as subways, water mains,
and roads.There are also more stringent legal procedures for urban excavation that can hinder
archaeological efforts, as there are risks that excavation could damage buried water mains, power
lines, or other city infrastructure if improperly conducted (Dalgish, C., 2005). Furthermore, urban
excavation must be conducted swiftly so as to not interfere with the day-to-day life of citizens,
which heightens the risk of artifact damage and data loss (Staski, E., 2008). These factors mean
that archaeologists conducting urban excavations usually only have one chance to excavate a site
and typically cannot return later to urban sites to conduct further excavations. Urban archaeologists
must therefore gather all relevant data during a single, brief excavation. In Venice, urban
excavations typically are only a few days in duration, which means data recording must be swift,
efficient, and highly organized, which can be accomplished using electronic data collection and
management systems (Studio Zandinella). All of these factors complicate archaeological
excavation and analysis in Venice, and increase the need for highly efficient and robust data
collection, management, and analysis systems.

9
2.2. Archaeological Issues in Venice There are several factors that archaeologist must take into consideration while working
within Venice to avoid possible issues on the worksite and with the collected data. The city has
served as a center for many cultures over hundreds of years, and is home to many sites of
significance, such as San Marco and the Doge’s palace (Ortalli & Scarabello, 1999). The city’s
rich history piques the interest of professional archaeologists, as well as visitors from around the
world. The influx of tourists, as well as geographic considerations relating to urbanization and sea
level fluctuation, cause challenges for Venetian archaeologists. These difficulties directly affect
the work of archaeologists, and hopefully will be addressed by the creation of streamlined data
management and research tools.
2.2.1. Historical Wealth of Venice Archaeologists typically reference historical documents to conduct research into practices
and past cultures. In Venice, there is a wealth of such documents, as traders, artists, and historians
created extensive document records that were kept throughout the history of the republic, giving
today’s archaeologists insight into the business, legislature, philosophy, politics, and events of the
past (Ortalli & Scarabello, 1999). Without referencing these period documents, archaeologists
would face difficulty in discerning the significance of any Venetian archaeological find, as they
would lack some of the historical context for their finds. These records, when used in conjunction
with archaeological sites, are of the utmost importance to Venice and the archaeologists working
there, as they represent a large portion of the city’s cultural and historical heritage (Venice and its
Lagoon, 2016). Historical records also need to be more accessible to Venetian archaeologists,
which will be addressed through the creation of a digital data management system.
2.2.2. Venice-Specific Difficulties
10
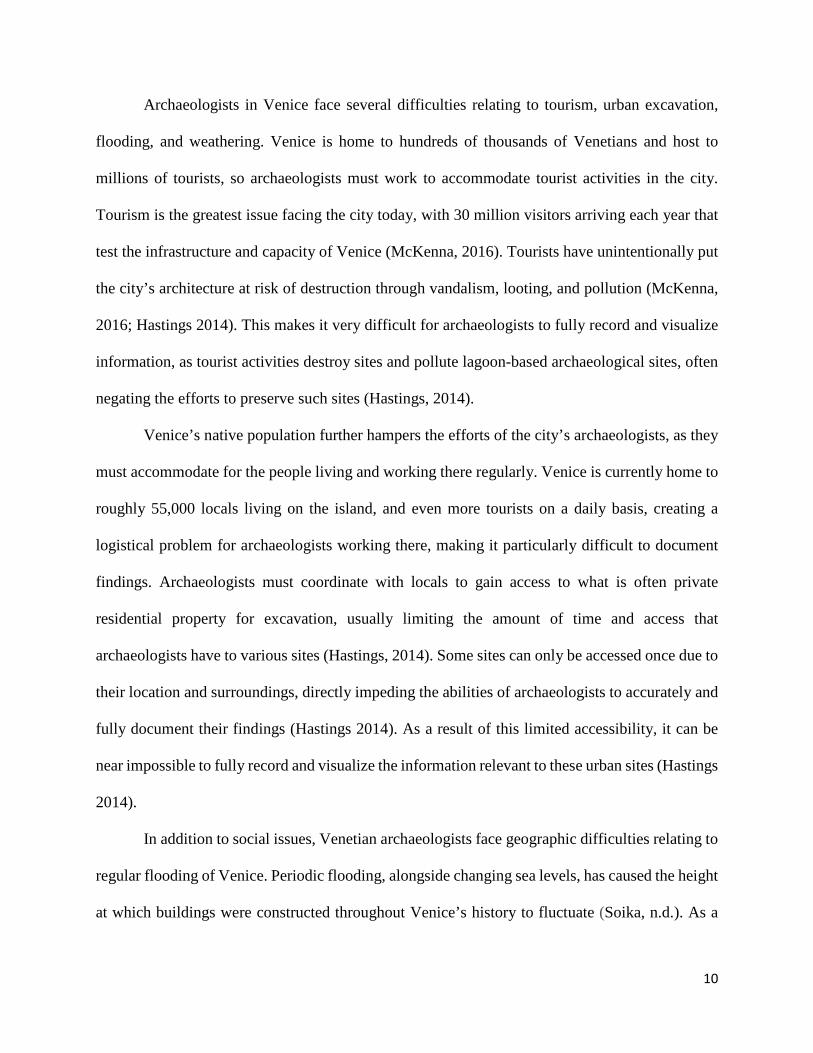
Archaeologists in Venice face several difficulties relating to tourism, urban excavation,
flooding, and weathering. Venice is home to hundreds of thousands of Venetians and host to
millions of tourists, so archaeologists must work to accommodate tourist activities in the city.
Tourism is the greatest issue facing the city today, with 30 million visitors arriving each year that
test the infrastructure and capacity of Venice (McKenna, 2016). Tourists have unintentionally put
the city’s architecture at risk of destruction through vandalism, looting, and pollution (McKenna,
2016; Hastings 2014). This makes it very difficult for archaeologists to fully record and visualize
information, as tourist activities destroy sites and pollute lagoon-based archaeological sites, often
negating the efforts to preserve such sites (Hastings, 2014).
Venice’s native population further hampers the efforts of the city’s archaeologists, as they
must accommodate for the people living and working there regularly. Venice is currently home to
roughly 55,000 locals living on the island, and even more tourists on a daily basis, creating a
logistical problem for archaeologists working there, making it particularly difficult to document
findings. Archaeologists must coordinate with locals to gain access to what is often private
residential property for excavation, usually limiting the amount of time and access that
archaeologists have to various sites (Hastings, 2014). Some sites can only be accessed once due to
their location and surroundings, directly impeding the abilities of archaeologists to accurately and
fully document their findings (Hastings 2014). As a result of this limited accessibility, it can be
near impossible to fully record and visualize the information relevant to these urban sites (Hastings
2014).
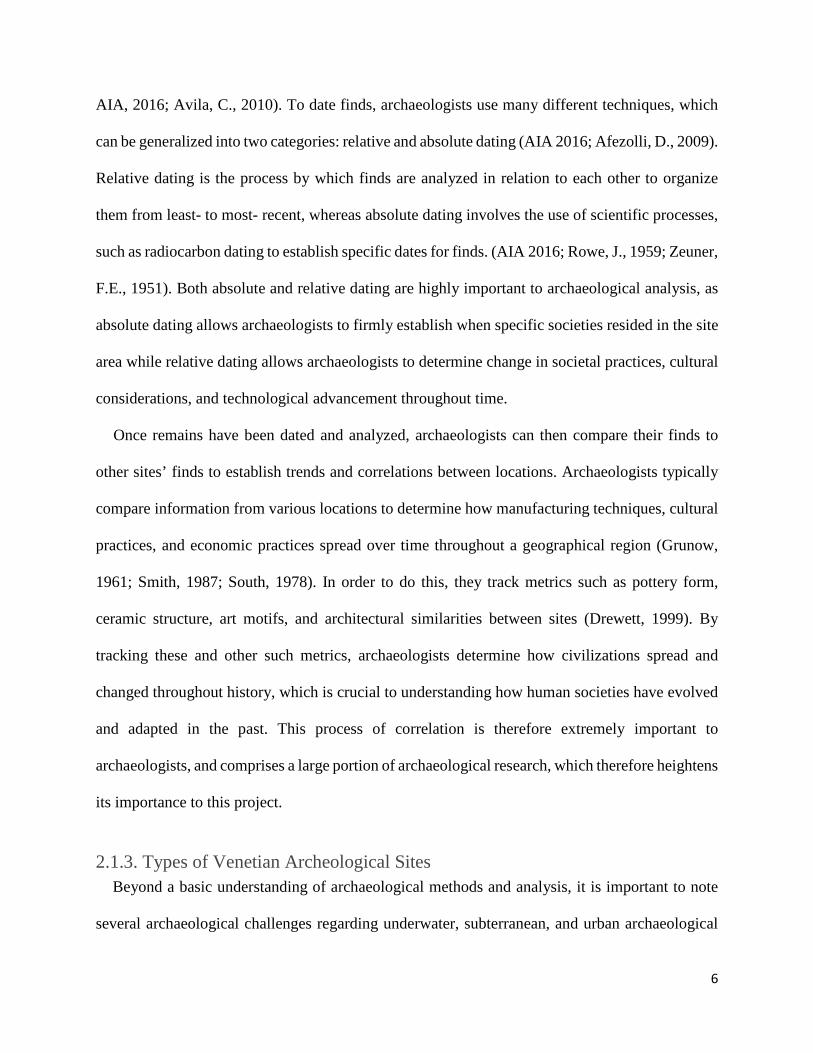
In addition to social issues, Venetian archaeologists face geographic difficulties relating to
regular flooding of Venice. Periodic flooding, alongside changing sea levels, has caused the height
at which buildings were constructed throughout Venice’s history to fluctuate (Soika, n.d.). As a

11
result, the standard methods of relative dating, the process by which finds are compared to other
finds found at similar depths below the surface to make an estimate regarding the age of the find,
do not apply to Venice. Archaeologists must instead compensate for inaccurate depth-based dating
by accessing various records on water levels throughout Venice’s history and adjusting relative
dating to account for sea level fluctuations (Avila, C., 2010). This complicates the process of
archaeological documentation, as it adds extra, complex steps to analysis. Venetian archaeologists
working in the field often also face the issues of a very limited time frame in which they can work
as a result of the changing tides (Avila, C. 2010). For example, Studio
Figure 1: Archaeological Site Filling with Water during an Excavation
Zandinella, our sponsor, was conducting an archaeological excavation when flooding due to high
tides caused their excavation to be temporarily halted, leading to a delay in data gathering and
analysis. The site is shown, in the process of flooding, in Figure 1. Therefore, tools must be
developed to assist in alternative processes of archaeological correlation in Venice.
Venice’s unique maritime location also exacerbates the issue of weathering, the processes
by which the city is damaged by everyday-wear-and-tear, far beyond the average rate. Early
12
Venetian construction involved building platforms upon wooden foundations, unifying many of
the lagoon’s islands into a single landmass (“The Conservation of Venetian Building Materials:
Wood,” 2008). Not many of these initial constructions have survived, succumbing to weathering
and rot (“The Conservation of Venetian Building Materials: Wood,” 2008). Many of these early
sites are located underneath current buildings, and are extremely difficult to access and document
(“The Conservation of Venetian Building Materials: Wood,” 2008). Venetian archaeological sites
are therefore important to document properly and efficiently, as limited accessibility and near
constant damage from natural factors limits the ability of archaeologists to conduct several
excavations on a single site.
2.3 Studio Zandinella
As part of our work in Venice, we collaborated with an archaeological studio, a group of
archaeologists working under one head archaeologists, called Studio Zandinella. The studio
specializes on archaeological excavations, archaeological advisory, rescue excavations, forensic
anthropology, historical research, and anthropometric analysis (Archeoveneta, n.d.). Studio
Zandinella is comprised of four archaeologists: Dr. Alberto Zandinella, Dr. Secilia Campagnol,
Dr. Andrea Cipolato, and Dr. Erika Mattio (Archeoveneta, n.d.). We worked primarily with Dr.
Alberto Zandinella, who studies medieval and post-medieval archaeology, as well as wetland
archaeology. We also worked with Dr. Erika Mattio, who studies anthropology (Archeoveneta,
n.d.). In the past, Studio Zandinella has undertaken subterranean excavations in locations
throughout Venice, including numerous septic tank installations and small scale excavations that
were later refilled. Their small-scale excavations typically occurred over the course of three or
four days, which means that their data collection and recording systems need to be highly
organized and efficient. Therefore, the archaeologists of the studio desired efficient and searchable
13
data management systems to aid in swift and accurate data recording. They also needed advanced
data entry systems for on-site real-time recording, which our project aimed to provide through the
creation of a web app (Archeoveneta, n.d.). Furthermore, as archaeologists, Studio Zandinella has
a vested interest in preserving historical discoveries and data from destruction, which our project
also assists with through the collation of large quantities of archaeological data.
2.4 Digital Archaeology Although there are many Venice-specific challenges with recording and analyzing
archaeological data, the process of archaeological collection and data management is similar
throughout the global archaeological community. Due to the huge amount of effort involved with
traditional methods for archaeological data recording, and the abilities of computers for statistical
analysis, organizations such as IDAMP, the Institute on Digital Archaeology Method and Practice,
use digital tools for data management and encourage use of digital tools (Carter, 2016). This has
lead to increased pressure in the archaeological community to transition to digital tools for
recording and management of data, however, most archaeologists use either proprietary or paper-
based data management systems (Liritzis, 2015).
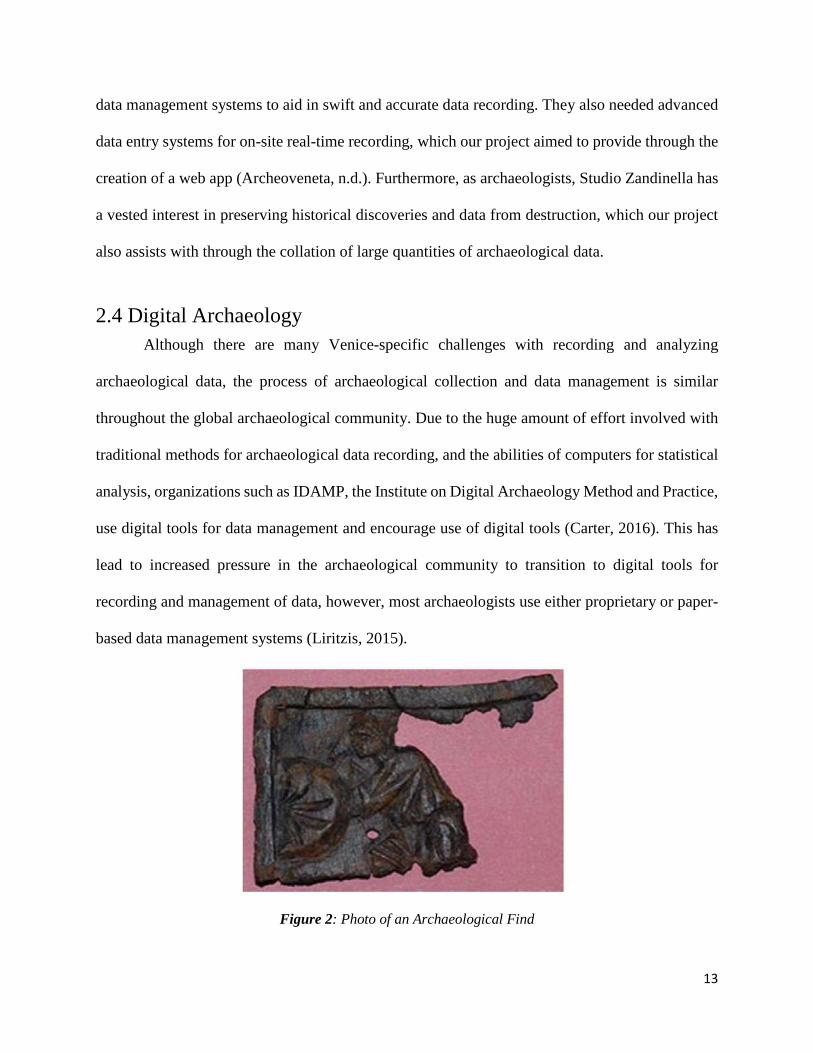
Figure 2: Photo of an Archaeological Find
14
Digital archaeology is archaeological study by using digital tools for data collection,
interpretation and dissemination, also allows archaeologists to better visualize and analyze data
(Richter, 2014). Digital analysis techniques usually involve statistical analysis to develop models
and maps to assist archaeologists with finding data trends and connecting information between
sites (Richter 2014). Since the results of digital analyses can be visualized directly, the
comprehensibility is improved for audiences without a background in archaeology (Richter, 2014).
With the use of such models and images like Figure 2, findings and their present status can be
more easily displayed, which improves the ability of archaeologists to convey the significance of
their work and correlate data between separate sites. Digital archaeology can not only assist in the
visualization of archaeological findings, but also can help to document and analyze collected data.
Due to the great amounts of time and effort associated with traditional methods for location-based
data analysis, Geographic Information Systems have now become one of the most commonly used
tools in archaeological studies, to help alleviate the effort involved with these processes.
2.4.1 Geographic Information System
Geographic information systems (GIS) are computer-based systems that can easily store,
analyze, visualize, and process geographic data (Maliene, 2011). Since the 1990’s GIS has become
more commonly used amongst archaeologists as the relevant information for the system, the
longitude and latitude, are necessary components of the archaeological recording process, making
the integration of GIS relatively easy (GIS Spatial Data Types, 2016). There are several main
applications for GIS in the field of archaeology, including the creation of maps, calculation the
density of population and analyzing of data regarding geographic coordinates, all of which provide
useful analysis and visualization of archaeological data (Straumann, 2015).
15
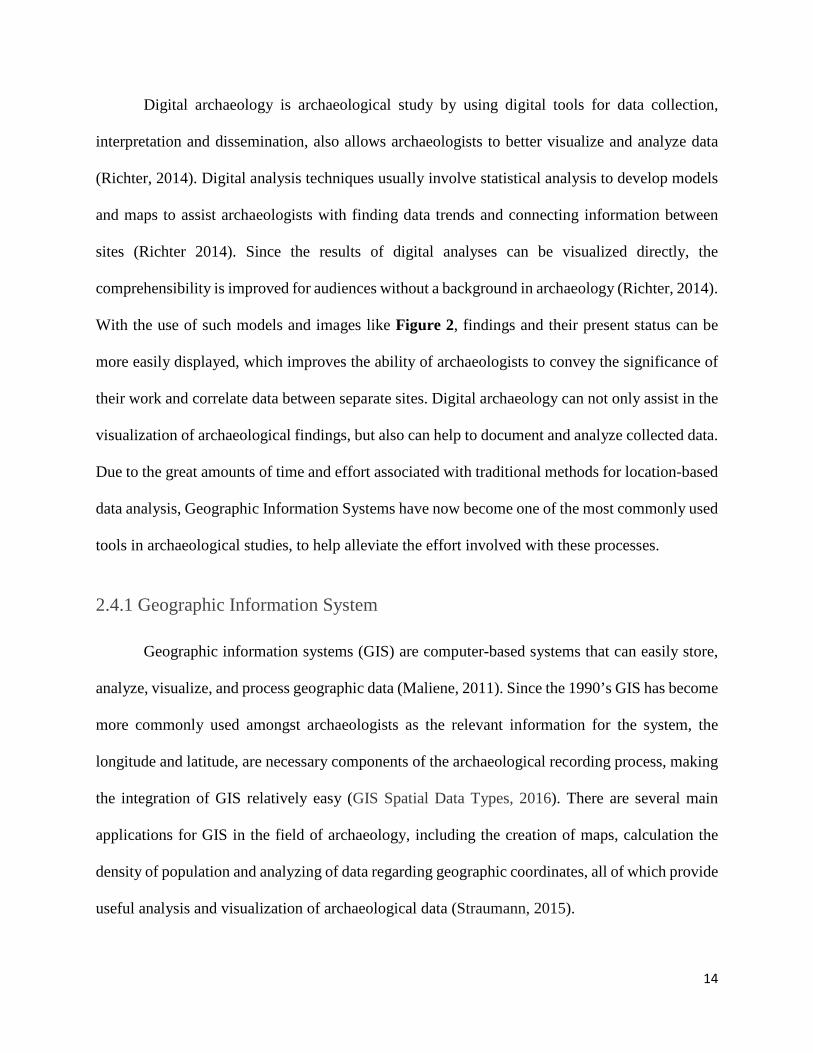
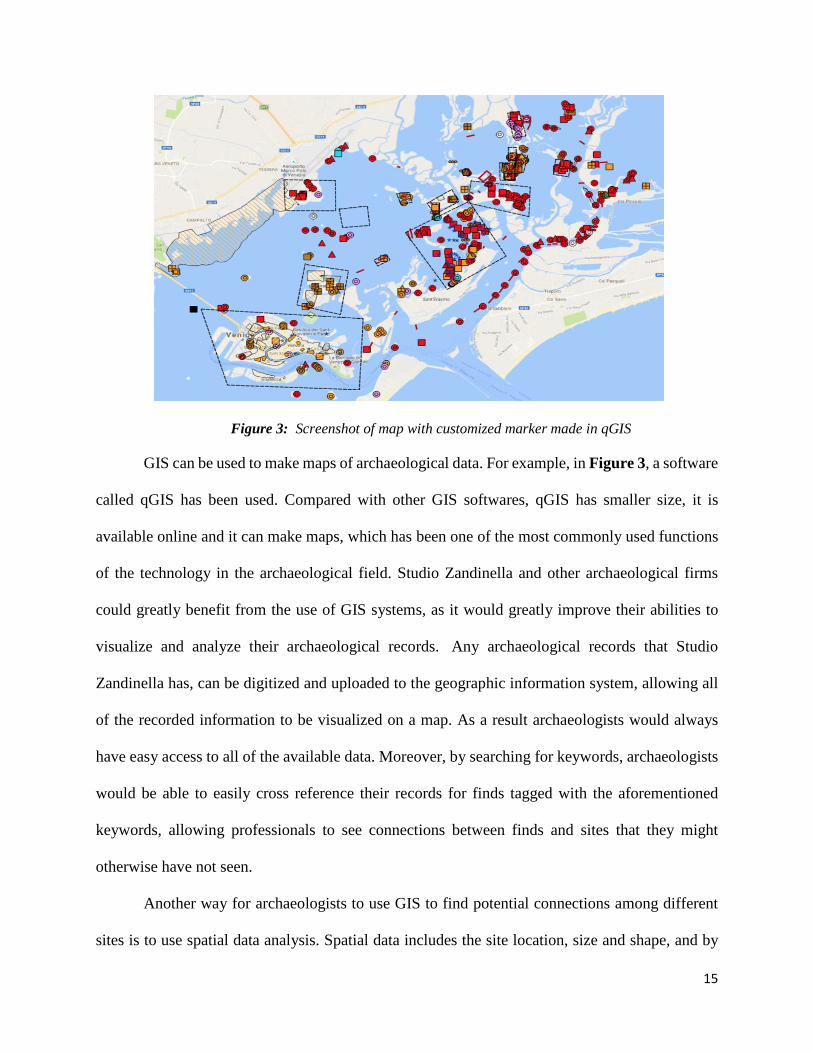
Figure 3: Screenshot of map with customized marker made in qGIS
GIS can be used to make maps of archaeological data. For example, in Figure 3, a software
called qGIS has been used. Compared with other GIS softwares, qGIS has smaller size, it is
available online and it can make maps, which has been one of the most commonly used functions
of the technology in the archaeological field. Studio Zandinella and other archaeological firms
could greatly benefit from the use of GIS systems, as it would greatly improve their abilities to
visualize and analyze their archaeological records. Any archaeological records that Studio
Zandinella has, can be digitized and uploaded to the geographic information system, allowing all
of the recorded information to be visualized on a map. As a result archaeologists would always
have easy access to all of the available data. Moreover, by searching for keywords, archaeologists
would be able to easily cross reference their records for finds tagged with the aforementioned
keywords, allowing professionals to see connections between finds and sites that they might
otherwise have not seen.
Another way for archaeologists to use GIS to find potential connections among different
sites is to use spatial data analysis. Spatial data includes the site location, size and shape, and by

16
studying how the landscape has changed, archaeologists can gain newfound insight into how the
sites were constructed by people in the past, making it all the easier to see visualize the information
gathered as these sites (Anschuetz, Wilshusen, Scheick, 2001). With the information about the
location, finds and collected samples, archaeologists can create a digital model using qGIS to show
how the sites are distributed (Beauvais,2006). The visualization will help archaeologists find the
patterns and trends in order to help locate potential sites (Basic use of GIS, 2012).
2.4.3 Difficulties in Data Digitization
Although there has been increased use of digital data management and analysis systems in
recent years, most archaeologists still do not use digital systems to assist with archaeological
research and data gathering. Most major archaeological organizations, including the European
Archaeological Consilium, which helps set standards for archaeological best practices in Europe,
recommend paper recording of data as a primary means of data storage and management (EAC,
2014; AIA 2016; Drewett 1999). This contributes to slow adaptation of digital systems in the
community, and increases paperwork and inefficient data organization in European archaeological
systems. Further difficulties arise with digital data management and analysis due to the fact that
archaeologists who do use digital data recording and analysis systems typically do not share their
data unless publishing (Hodgkinson, 2012). This means that potentially useful and important
databases are proprietary and are not accessible by other researchers, which increases difficulty
when conducting analyses and research (Drewett 1999; EAC 2014). Digital data management is
therefore typically an underleveraged field in archaeological recording and analysis. Italian
archaeological organizations also tend not to use digital data management systems, as the
organizations in charge of regulating archaeological finds typically require archaeologists to fill
out and file paper forms, which does not provide archaeologists with a strong impetus to switch to

17
digital data recording (Perrin 2014; European Preventive Archaeology 2007). This emphasis on
paper reporting therefore leads to further under-leveraging of digital data management in Italian
archaeology.
18
3. Methodology This project assisted Venetian archaeologists with collecting, visualizing and analyzing
archaeological data from subterranean and submerged archaeological sites in Venice and the
surrounding lagoon.
The objectives of the project were as follows:
1. To design and create a data recording system to collect archaeological data.
2. To design and create a web-based system to visualize archaeological data.
3. To experiment with analytical cross-referencing techniques based on the collected data.
Creation of a web-based system for data visualization allows archaeologists to see location-
based connections between archaeological sites and site data. It allows archaeologists to easily find
information relating to specific sites and finds, as well as search for patterns in archaeological data.
Instead of splitting data entry and visualization into two distinct websites, we have designed a
single web-app that serves both purposes. The data collection section is designed to serve as a tool
for archaeological data collection during excavations, to assist archaeologists in data organization
and off-site recording, and to streamline the data recording process. It saves data to a web-based
database with recorded information, and then populates the visualization section of the web-app
with the stored data, as seen in Figure 4. The web-based visualization tool was designed to assist
archaeologists with data analysis by showing connections and patterns between sites throughout
the lagoon. The two sections of the web application, which were connected by the database, led to
the creation of a synthesized, streamlined system for data entry and analysis.

19
Figure 4: Workflow showing how the web system works
Since urban archaeology sites are difficult to access, and excavations must be finished
quickly, as discussed in Section 2.2.3, efficiency was an important factor in the design process.
This system was an attempt to aid Studio Zandinella by increasing the efficiency of their recording
and research processes.
3.1. Creating a Tool for Collecting Archaeological Data
In order to assist Venetian archaeologists with data collection, the team needed to design
and create a tool that would replace the current, paper-based, system for recording field
information. The first step in the process was gathering data from Studio Zandinella and examining
previous archaeological records in order to establish the datasets that need to be collected using
the application. Later, we designed the interface of the data entry section of our web application
to follow the format of currently used paper records and forms. The data recorded consists of site
information, site locations, and details about layers and finds located at these sites. We then created
a web-based database that contains all the data that is recorded by the application. The team also
worked with Studio Zandinella to ensure that the system met our sponsor’s requirements and met
their needs satisfactorily. We obtained feedback from them throughout the term, which we used to
modify our system.
20
3.1.1. Establish Data Collection Parameters
The team’s initial plan was to accompany the studio’s archaeologists to an archaeological
excavation in order to gather as much observational data as possible. Due to complications related
to timing and legality of allowing non-archaeologists to visit active sites, there was not an
opportunity to visit any archaeological excavations. As a result, in order to properly determine
what data we needed to record using the data recording system, the team examined Studio
Zandinella’s paper records and obtained feedback on what data is crucial for recording through
meetings with the studio’s archaeologists. Each one of the paper records, or forms, used by
archaeologists in Venice has a corresponding data entry page on the app, containing all the datasets
in the paper forms.
In addition to sites and finds, archaeologists also keep track of the different ground layers,
which consist of the underlying stratified layers of stone, earth, and other material beneath the
surface of Venice, encountered during the excavation process. They also keep track of any finds
or anthropological data gathered in the field, which we needed to record in our web app. In addition
to gathering information about current recording processes, we met with our sponsor to discuss
tools they would like to see integrated in the data collection system. These possible features
included the use of the mobile phone’s GPS system and camera to record location data and photos.
3.1.2. Develop Web Interface
When we finished establishing what data the system needed to collect, the team designed
the user interface for the web app using an iterative development process. As we developed the
web application, we focused on efficiency when entering data, user-friendliness, and relevance to
archaeological data collecting. In order to begin designing the data entry system to be user-friendly

21
and efficient, we used Google Forms, Google’s survey application, to prototype the data entry
interface that was later used by the web app. These forms contained the exact fields that were
established for the app. These prototype data entry forms can be seen in Appendix B. Once we
decided on a system that would allow archaeologists to enter data rapidly and easily both on- and
off-site, we translated the forms into HTML webpages. The HTML forms can also be seen in
Appendix B. As an unreadable and difficult to use app would cause data entry to be less efficient,
the design of the user interface was extremely important to ensuring that the app was as useful as
possible. In order to ensure that the app had high usability, we discussed the webpage layout with
the sponsor throughout the design process, and modified the forms using their feedback. When we
finalized the design, we began designing a database to hold all of the information collected through
the app.
3.1.3. Design Database for Sites and Finds
At this stage of the process, the necessary data that needed to be stored for each type of site
and find had been established. The next step, as a result, was to create a database that contained
all of this information in order to make the web application capable of storing information online.
The database we designed for this objective holds information specifically relating to sites, layers,
and several types of archaeological finds including skeletons, artifacts, and structures. The
database was created using Firebase, Google’s database and information management system.
Firebase, which can be found at https://firebase.google.com, is the database application used by
the Venice Project Center for most projects. Due to the fact that the technical experts at the project
center were well-versed in Firebase, and the system was easy to use, we decided it was the best
choice available to us for database creation. The database was also designed to allow for efficient

22
exporting of data to the visualization website, which can be found at
archeo.veniceprojectcenter.org. The database also grouped
Figure 5: Catalog Number System in the site form
and organized data using a catalog number system. This system provided a unique identifying
number for a site based on the system used by archaeologists for data recording. Each site included
a unique catalog number in the format shown in Figure 5. These catalog numbers directly
corresponded with the catalog numbers used by Studio Zandinella when recording site
information. After the site information is saved to the database, layer information can be saved,
and each layer is given a unique 3-digit identifying number, which is called the US number. Each
layer is linked to the site it belongs to, and is grouped with that site. Each find, similarly, is linked
to a layer and given a unique numeric identifying number, and is grouped with the appropriate site.
We decided to use this tagging system as it would allow the visualization website to easily
recognize differences between sites and finds, and display information properly. Furthermore, this
cataloging system was similar to what archaeologists use for paper records, so it increased usability
by providing a similar cataloging system. It also allowed for easy searching of records, and allowed
us to hierarchically organize data for a site, which assisted in data organization and system
usability.

23
3.1.4. Populate Database with Venetian Archaeological Sites
Once we designed the database, we populated it with information gathered by Studio
Zandinella and other Venetian archaeologists. We decided to populate the database with more than
500 site records gathered by the studio. This is not an indication of the maximum capacity of the
database, but merely a demonstration of its abilities for data storage and management. In order to
use this data, we first gathered paper records from a book on Venetian archaeology entitled
“Archeologia della laguna di Venezia”, which was published by Ernesto Canal, a retired Venetian
archaeologist who greatly contributed to Venetian archaeological efforts (Canal Ernesto Tito,
2015). This book gave us a large amount of information to populate the map and database with,
which gave us a starting point for quick data entry. The book also represents several decades of
archaeological data gathering, which means it provided us with a large amount of highly varied
information to use. Although Ernesto Canal’s book was extremely useful for initial data entry, it
only contained site information, not thorough documentation of finds and records. Although this
lack of information is not ideal, as we prefer to fully populate the database with both site and find
information, it did not affect the operation of the database.
3.2 Visualizing Archaeological Data
In order to accomplish the second objective for this project, we created a map-based section
of the web application that allowed Venetian archaeologists to visualize previously recorded
archaeological data. This section shows a map with locations of archaeological sites based on
information saved in the database. We used various mapping programs to create a map-based
website for Venice that showed the locations of archaeological sites. The team also worked with
Studio Zandinella to ensure that the system met our sponsor’s requirements and met their needs
24
satisfactorily. We obtained feedback from them throughout the term, which we used to modify our
system.
3.2.1. Create a Map-Based Visualization System
After creating, organizing, and populating the Firebase database, we developed and tested
a map-based visualization system, which can be found at archeo.veniceprojectcenter.org. Data
visualization, especially location-based visualization, is useful for archaeological analysis and
research, as explained in Section 2.4. In order to create this system, we used online maps for
reference and built an interactive map of the city and the surrounding lagoon using qGIS. QGIS is
a tool used widely to create vector-based maps for navigation, surveying and archaeology. More
information on qGIS can be found in Appendix A. Once we created the initial map layer with
qGIS, we converted it to GeoJSON and embedded it in our website. GeoJSON is a file format
widely used for geographical information storage and web-based visualization, and is compatible
with Firebase, so we used it for storing and displaying the geographical information for our
website. We also used Leaflet, a set of JavaScript tools for displaying GeoJSON information on
the Internet, to display geographical information. When designing our map-based visualization,
we wanted to prioritize usability and user-friendliness. We decided to make the system work
similarly to Google Maps by creating clickable markers for sites that displayed more information
when selected, as such systems are widely-used and well-understood by the general populace.
3.2.2 Receive Feedback and Refine Visualization
Throughout the design process, we presented iterations of our design to Studio Zandinella
for feedback and revisions. We met with archaeologists to ensure that our site was easy to use and
that the information we mapped was accurate and comprehensive. Furthermore, we showed each
25
iteration of the visualization design to our sponsor to ensure that each change improved the
usability of our system. We also collected feedback from the studio in the form of informal
discussion and used the feedback to modify the visualization system to better fit the sponsor’s
needs.
3.3. Experimenting With Cross-Referencing Archaeological Data
In order to finish our last objective and build connections between different excavated sites, we
developed additional features for data visualization and analysis for our website. We focused
primarily on development of a filtering feature to isolate specific sites based on stored information,
as we believed this would be helpful for recognizing patterns in data and finding connections
between different sites throughout the entirety of Venice. In addition to developing a filtering
feature, we also experimented with techniques for grouping sites and showing information in a
way that facilitates pattern recognition.
3.3.1. Filtering Features
Filtering refers to the process of removing sites from the display to better show trends and
patterns in archaeological data. We decided that this was a necessary feature for our website, as it
would help show connections between different sites and would assist archaeologists in grouping
sites and recognizing historical trends in archaeological data. We decided to design two separate
filtering buttons, one for site era and one for site type. The site era filter was designed to help
archaeologists see how humans have settled and spread throughout Venice and the lagoon
throughout history. The site type filter aimed to assist archaeologists in finding clusters of similar
site types, for example, finding clustered groups of building ruins or shipwrecks. Therefore, these
26
two filtering buttons would assist archaeologists in both recognition of historical data trends and
in grouping and connecting various archaeological sites around the lagoon, and thus would assist
with our goal of helping with data analysis and cross-referencing.
3.3.2. Assisting with Pattern Recognition
In addition to creating filtering features to help with data cross-referencing and correlation,
we also decided to design our system to help with pattern recognition, as that would facilitate data
correlation. Designing our display to allow archaeologists to see patterns and connections between
different sites and datasets would allow them to better conduct research and understand how sites
relate to each other. In order to assist with pattern recognition, we color-coded our sites and added
symbols to each site to show site types. We decided to color-code by site era, as that would allow
archaeologists to understand what epoch each site originated from, and we decided to show site
types using symbols to help archaeologists group similar sites. In order to ensure that
archaeologists could understand what the symbols and color-coding meant, we decided to include
a key on our map. This system would help archaeologists recognize patterns and see connections
between different sites.
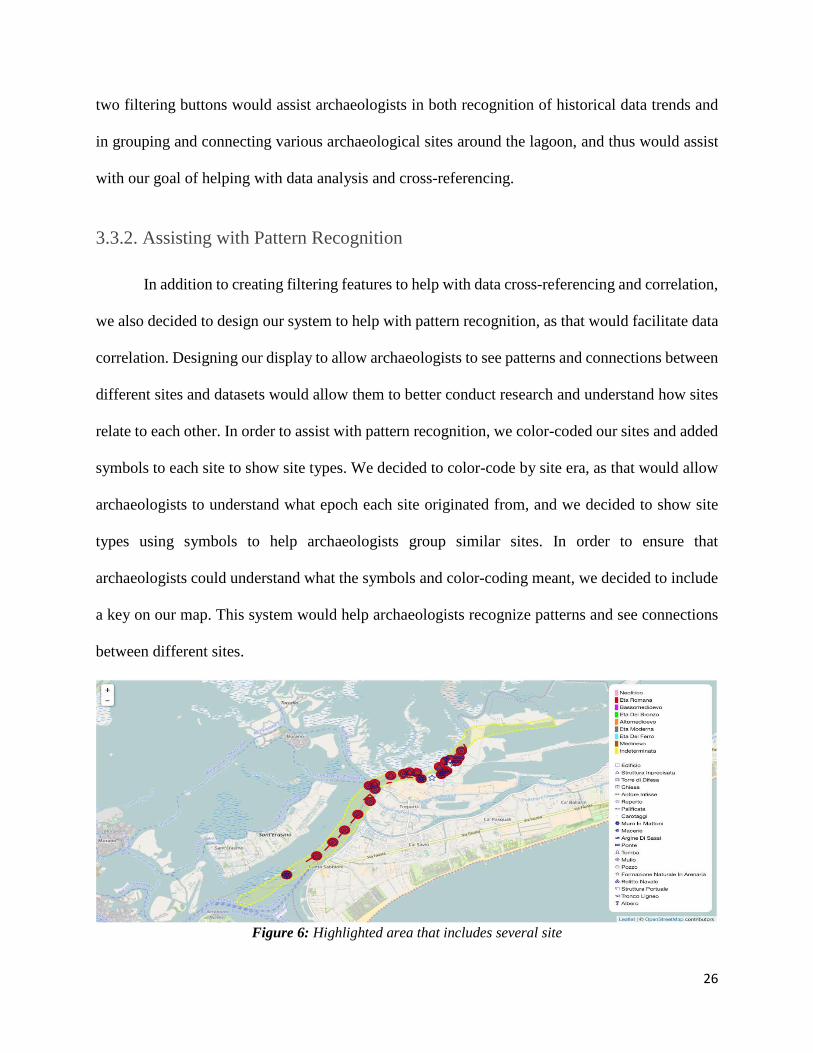
Figure 6: Highlighted area that includes several site

27
After implementing the color-coding system and the symbol system, we decided to include
the various features Ernesto Canal identified through his research on our map. Ernesto Canal
showed connections between data by surrounding similar sites with highlights, as seen in Figure
6. This was a useful way to show connections between different sites, so we translated these
features to our visualization website to help archaeologists group sites. This system would assist
greatly with data analysis.
28
4. Results and Analysis
We implemented the methodology and processes discussed in Section 3 to complete the
design of our system. We developed a prototype system for data collection using an iterative design
process, then compared it to the paper forms it replaced to evaluate its usefulness to archaeologists.
We prototyped our visualization system as well, which was completed using qGIS and Leaflet to
create a map that was then embedded in our web application. Once that prototype was complete,
we evaluated the accuracy of the system through meetings with our sponsor and tested its efficacy
at displaying data and assisting in archaeological visualization. We tested this by navigating
through the visualization system and evaluating its usability and user-friendliness. When this was
completed, we developed several tools to assist with analysis, including two sets of filtering
functions to show connections between data sets. Finally, after developing filtering tools to assist
with archaeological analysis, we tested the website’s ability to assist with analysis in order to
estimate the usefulness of our system to archaeological research. We tested this by using our
system to find possible ancient settlements and geographical features. The system performed well
when used, and accurately and correctly filtered out separate sets of data. When we had determined
that the system would be useful for identifying patterns in archaeological data and for location of
ancient settlements and geographical features, we tested its usefulness for making predictions
related to likely locations of archaeological sites by using the system to formulate hypotheses
regarding locations with a high probability of containing numerous finds. We found that our
system assists with this predictive process as well, and could prove highly useful for archaeological
data analysis.
29
4.1 Designing and Creating the Data Collection System
The first step that we took towards the creation of a system to assist Venetian archaeologists
with their work was to create a prototype of an online system to help them effectively collect and
store data. We did this by first evaluating current archaeological recording systems and
determining which forms and records were necessary for data recording. We found seven different
forms that were crucial to archaeological data recording, which we converted to HTML forms.
Once we finished these forms, we created a database to hold the data that would be collected by a
finished recording system.
4.1.1 Current Archaeological Recording Systems
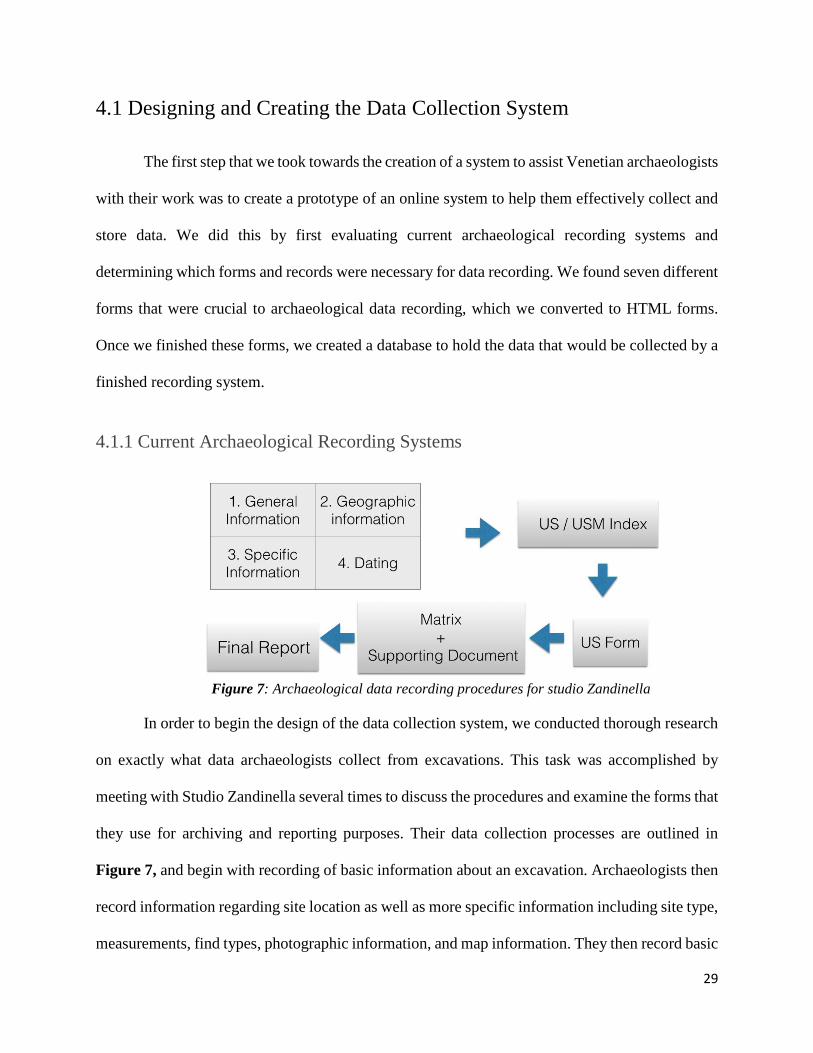
Figure 7: Archaeological data recording procedures for studio Zandinella
In order to begin the design of the data collection system, we conducted thorough research
on exactly what data archaeologists collect from excavations. This task was accomplished by
meeting with Studio Zandinella several times to discuss the procedures and examine the forms that
they use for archiving and reporting purposes. Their data collection processes are outlined in
Figure 7, and begin with recording of basic information about an excavation. Archaeologists then
record information regarding site location as well as more specific information including site type,
measurements, find types, photographic information, and map information. They then record basic
30
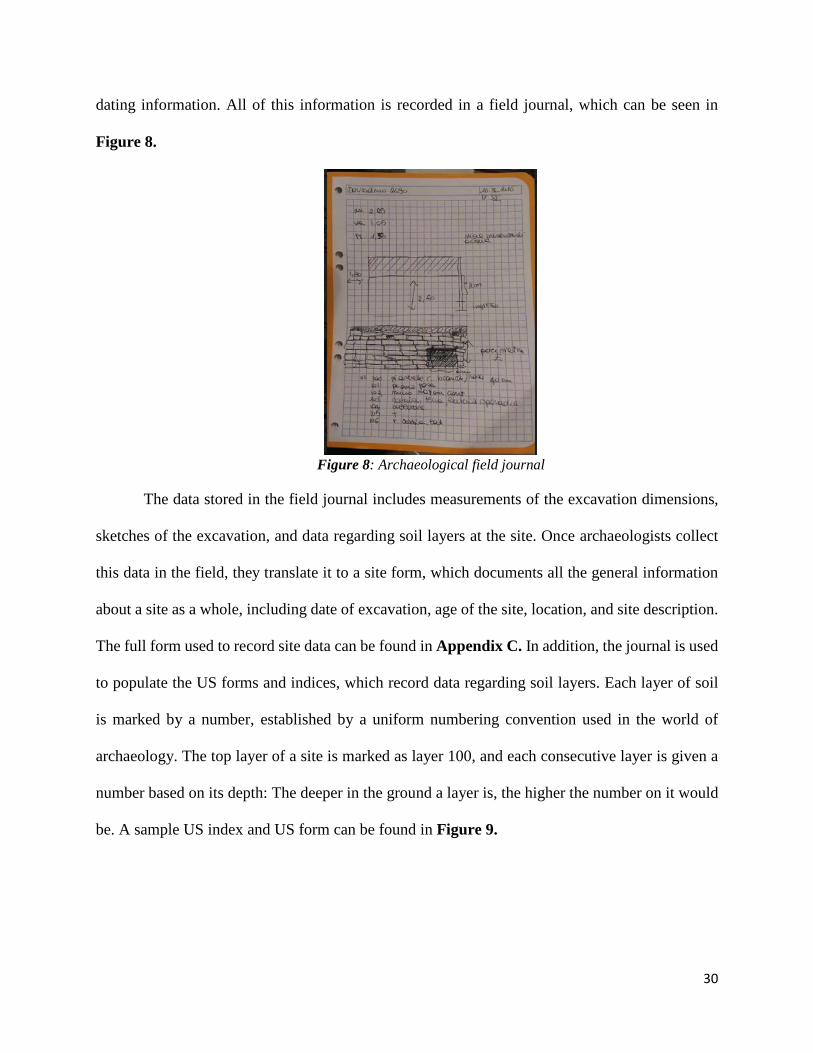
dating information. All of this information is recorded in a field journal, which can be seen in
Figure 8.
Figure 8: Archaeological field journal
The data stored in the field journal includes measurements of the excavation dimensions,
sketches of the excavation, and data regarding soil layers at the site. Once archaeologists collect
this data in the field, they translate it to a site form, which documents all the general information
about a site as a whole, including date of excavation, age of the site, location, and site description.
The full form used to record site data can be found in Appendix C. In addition, the journal is used
to populate the US forms and indices, which record data regarding soil layers. Each layer of soil
is marked by a number, established by a uniform numbering convention used in the world of
archaeology. The top layer of a site is marked as layer 100, and each consecutive layer is given a
number based on its depth: The deeper in the ground a layer is, the higher the number on it would
be. A sample US index and US form can be found in Figure 9.
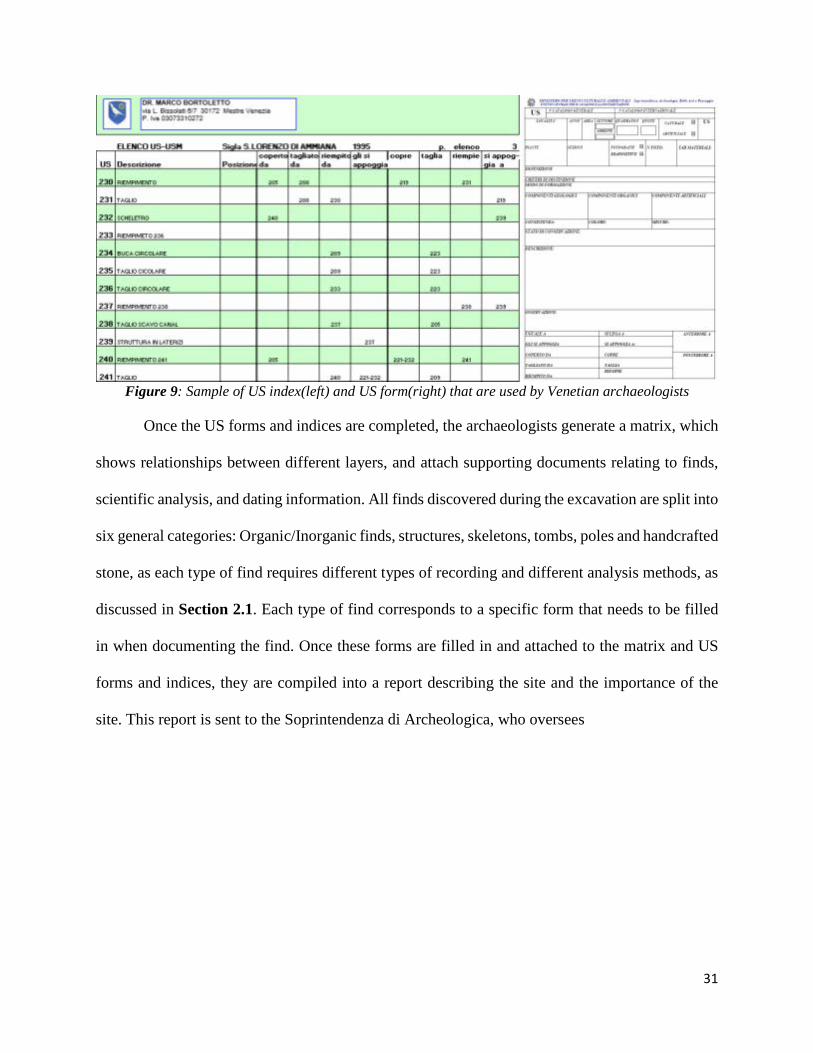
31
Figure 9: Sample of US index(left) and US form(right) that are used by Venetian archaeologists
Once the US forms and indices are completed, the archaeologists generate a matrix, which
shows relationships between different layers, and attach supporting documents relating to finds,
scientific analysis, and dating information. All finds discovered during the excavation are split into
six general categories: Organic/Inorganic finds, structures, skeletons, tombs, poles and handcrafted
stone, as each type of find requires different types of recording and different analysis methods, as
discussed in Section 2.1. Each type of find corresponds to a specific form that needs to be filled
in when documenting the find. Once these forms are filled in and attached to the matrix and US
forms and indices, they are compiled into a report describing the site and the importance of the
site. This report is sent to the Soprintendenza di Archeologica, who oversees

32
Figure 10: List of forms used by archaeologists in Venice
archaeological efforts in Venice. All of the forms filed are listed in Figure 10, and are copied in
Appendix C.
4.1.2. Final Data Collection System
After fully understanding the process used currently by archaeologists to record data, we
developed our data entry portion of the web application. The completed product records eight
different types of data: sites, layers, structures, anthropological data, tomb data, organic/inorganic
finds data, handcrafted stone data, and pole data. Each type of data follows a separate format,
which directly follows from the forms currently used by the studio. Each form was designed with
user-friendliness and usability as a priority. In addition to the data recorded by the studio’s paper
form, the design also includes newly introduced features that utilize the capabilities of modern
mobile phones. The app contains a GPS plugin that generates the user’s position in terms of
longitude and latitude, and an option to upload a picture taken on a mobile phone. These features
are located in the forms, and eliminate the need to manually record location data and carry
additional devices to the excavation. All HTML forms used can be seen in Appendix B. In these
forms, archaeologists can document various information about the site using text fields, radio

33
buttons and checkboxes that are provided in the site form, which can been seen in Figure 16. After
filling in the site form, users can click the “Next” button to view all the layer information of the
site. The page contains the mobile version of the layer matrix, where layers can be added, edited
or removed by clicking right button. On the “edit info” page, the user can record any information
about the layer itself, such as the type of ground it contains, depth and consistency. When choosing
“edit layer”, the user can edit the finds that are located within the layer. If a new find needs to be
added to a layer, the user is given the ability to click an “add” button and choose the type of find
they would like to record. The web application then generates the correct form depending on the
type of find, which the user will be prompted to fill in. The addition of new finds to a layer can be
seen in Figure 12.
Figure 11: Sample of app version of site form interface (left) and US matrix (right)

34
Figure 12: App interface for find type (left) and forms of the selected type (right)
4.1.3. Structuring the Database
The prototype data collection system is designed to allow future developers to link directly
to our database, which was designed using Firebase, Google’s database creation tool. The database
needed to be structured in a specific manner, which would allow the finalized version of the app
to easily store data and would allow other systems including the visualization system to interface
with the database.
Figure 13: Google firebase hierarchy tree
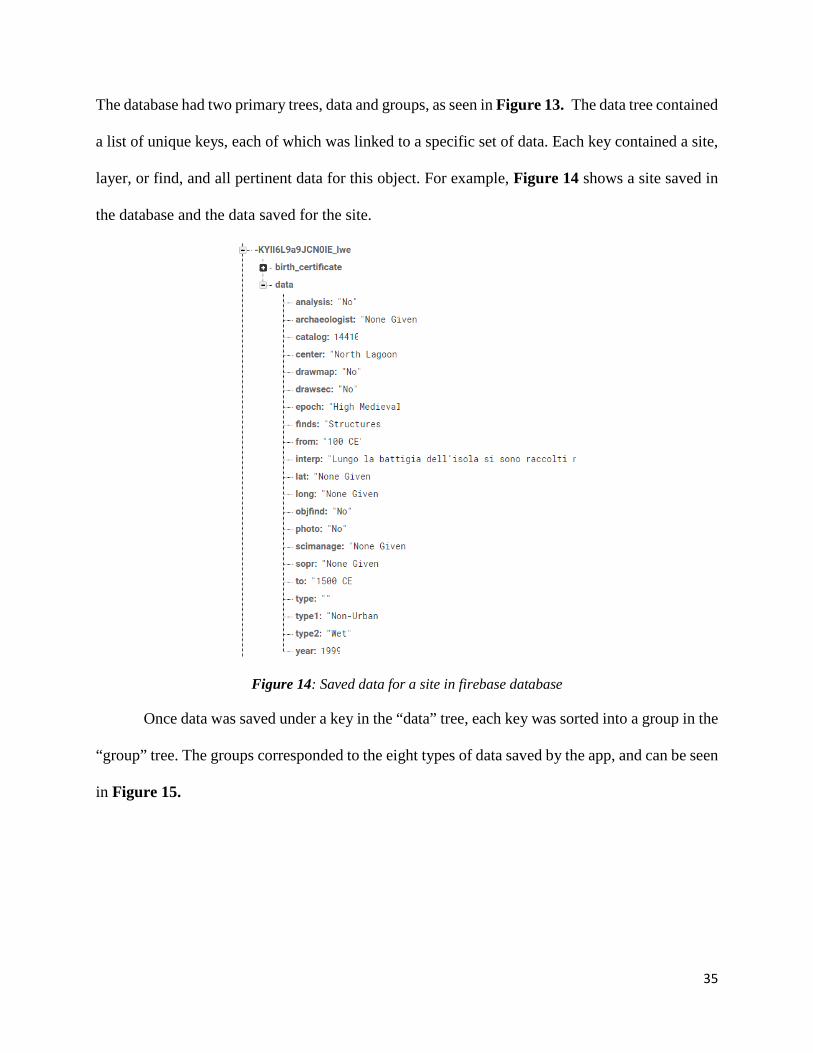
35
The database had two primary trees, data and groups, as seen in Figure 13. The data tree contained
a list of unique keys, each of which was linked to a specific set of data. Each key contained a site,
layer, or find, and all pertinent data for this object. For example, Figure 14 shows a site saved in
the database and the data saved for the site.
Figure 14: Saved data for a site in firebase database
Once data was saved under a key in the “data” tree, each key was sorted into a group in the
“group” tree. The groups corresponded to the eight types of data saved by the app, and can be seen
in Figure 15.
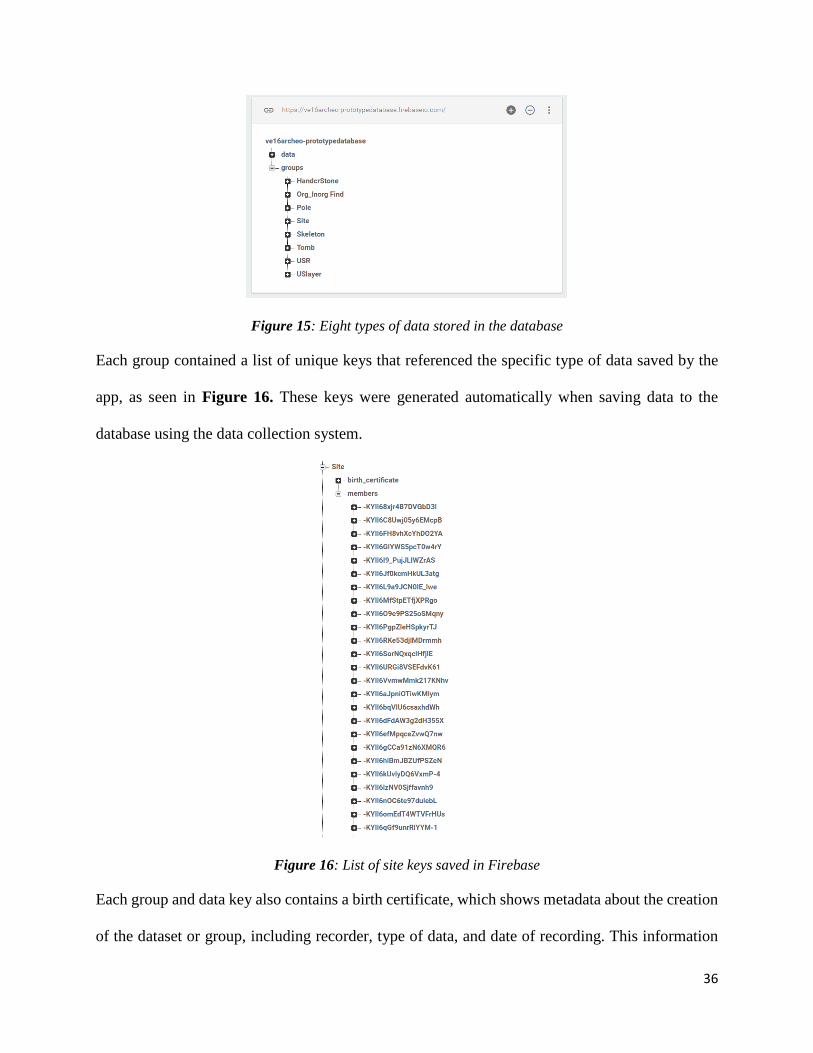
36
Figure 15: Eight types of data stored in the database
Each group contained a list of unique keys that referenced the specific type of data saved by the
app, as seen in Figure 16. These keys were generated automatically when saving data to the
database using the data collection system.
Figure 16: List of site keys saved in Firebase
Each group and data key also contains a birth certificate, which shows metadata about the creation
of the dataset or group, including recorder, type of data, and date of recording. This information

37
helps with data organization and helps to preserve an organized data structure. It also assists with
reading data saved to the database, and assists with recognition of specific datasets. The overall
layout of this database is ordered specifically to ensure efficiency when saving data to the database
and when exporting the data to the visualization system.
4.1.4. Populating the Database
Figure 17: Map displayed in Ernesto canal’s book
To demonstrate the usability and effectiveness of the database, the system was populated
with records provided to the team by Studio Zandinella and the book “Archeologica della laguna
di Venezia”, which is shown in Figure 17. As discussed earlier within the methodology this
number of records currently stored is not indicative of maximum capacity, as the system is fully
capable of handling far more information, but the amount of site data can serve as an adequate
records reference when archaeologists use them on field. Instead of entering each record by hand,
as entering 1000 records would take a large amount of time, we created a spreadsheet using Google
Sheets and imported the data directly to the database. In order to do this, we used JavaScript to

38
complete a basic function that would automatically generate unique keys and save the data to the
database. This information stored in the database will be used in future versions of the application
to populate the visualization system.
4.2 Visualization System
The final stage of creating the web-based system was the implementation of a prototype
map-based website that can be found at archeo.veniceprojectcenter.org. The creation of the map
was accomplished through the use of qGIS using the methods discussed in Section 3.2.1 of the
methodology. More information regarding qGIS can be found in Appendix A. After the map was
created, filters and legends were added to the map, which is shown in Figure 18. In addition to
being able to filter out irrelevant sites while using the map-based website, users are able to click
any specific site to generate a pop-up window previewing some of the important information from
that site. That information includes the site name, the site number, the year of excavation, and a
brief description of the site. Future versions of the website will also feature a password system,
where only individuals with adequate clearance would be able to view certain information or edit
the site records.
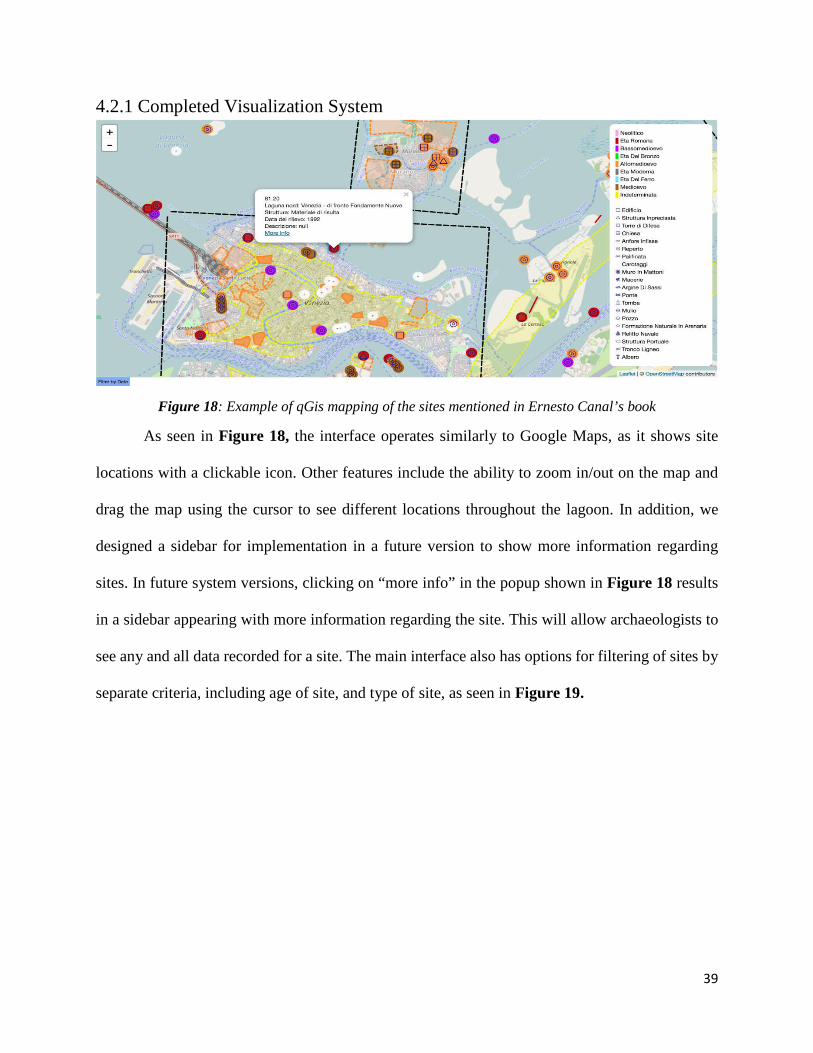
39
4.2.1 Completed Visualization System
Figure 18: Example of qGis mapping of the sites mentioned in Ernesto Canal’s book
As seen in Figure 18, the interface operates similarly to Google Maps, as it shows site
locations with a clickable icon. Other features include the ability to zoom in/out on the map and
drag the map using the cursor to see different locations throughout the lagoon. In addition, we
designed a sidebar for implementation in a future version to show more information regarding
sites. In future system versions, clicking on “more info” in the popup shown in Figure 18 results
in a sidebar appearing with more information regarding the site. This will allow archaeologists to
see any and all data recorded for a site. The main interface also has options for filtering of sites by
separate criteria, including age of site, and type of site, as seen in Figure 19.
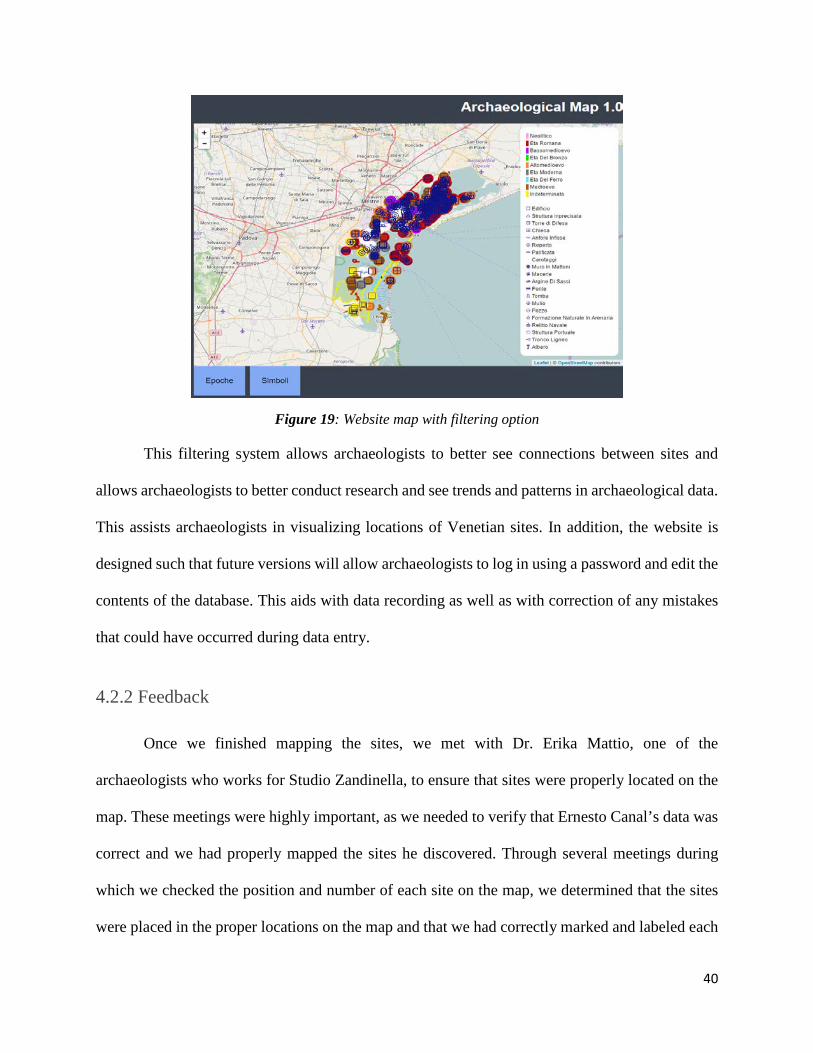
40
Figure 19: Website map with filtering option
This filtering system allows archaeologists to better see connections between sites and
allows archaeologists to better conduct research and see trends and patterns in archaeological data.
This assists archaeologists in visualizing locations of Venetian sites. In addition, the website is
designed such that future versions will allow archaeologists to log in using a password and edit the
contents of the database. This aids with data recording as well as with correction of any mistakes
that could have occurred during data entry.
4.2.2 Feedback
Once we finished mapping the sites, we met with Dr. Erika Mattio, one of the
archaeologists who works for Studio Zandinella, to ensure that sites were properly located on the
map. These meetings were highly important, as we needed to verify that Ernesto Canal’s data was
correct and we had properly mapped the sites he discovered. Through several meetings during
which we checked the position and number of each site on the map, we determined that the sites
were placed in the proper locations on the map and that we had correctly marked and labeled each
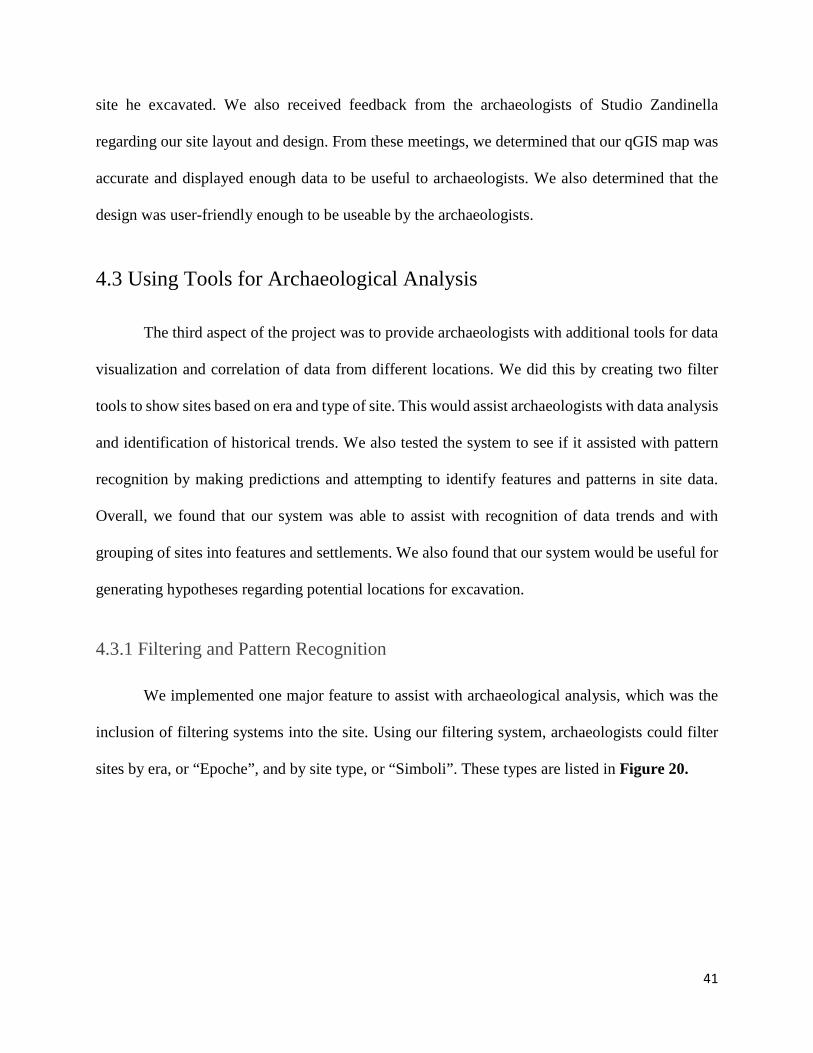
41
site he excavated. We also received feedback from the archaeologists of Studio Zandinella
regarding our site layout and design. From these meetings, we determined that our qGIS map was
accurate and displayed enough data to be useful to archaeologists. We also determined that the
design was user-friendly enough to be useable by the archaeologists.
4.3 Using Tools for Archaeological Analysis
The third aspect of the project was to provide archaeologists with additional tools for data
visualization and correlation of data from different locations. We did this by creating two filter
tools to show sites based on era and type of site. This would assist archaeologists with data analysis
and identification of historical trends. We also tested the system to see if it assisted with pattern
recognition by making predictions and attempting to identify features and patterns in site data.
Overall, we found that our system was able to assist with recognition of data trends and with
grouping of sites into features and settlements. We also found that our system would be useful for
generating hypotheses regarding potential locations for excavation.
4.3.1 Filtering and Pattern Recognition
We implemented one major feature to assist with archaeological analysis, which was the
inclusion of filtering systems into the site. Using our filtering system, archaeologists could filter
sites by era, or “Epoche”, and by site type, or “Simboli”. These types are listed in Figure 20.

42
Figure 20: Map Legend showing site eras and symbols
Each filter button, when clicked, showed a dropdown with several filter types, which were also
displayed on the map legend, as seen in Figure 20. Clicking on a filter option changed the sites
shown, which would assist with pattern recognition. Examples of this can be seen in Figures 21
and 22, which show how our filtering system can show specific types of site and specific site eras.
Once we implemented the filtering system, we tested it to ensure that it displayed each filter
correctly, then attempted to assess how useful this feature could be to archaeologists. By moving
through eras using the filtering feature, we were able to ascertain that the north of the lagoon was
land during the medieval era, due to the high prevalence of medieval-era buildings in the northern
lagoon, and we were able to identify areas that could have been settlements at one point in history
due to high concentrations of buildings. This feature could, based on our testing, be highly useful
for archaeological research.
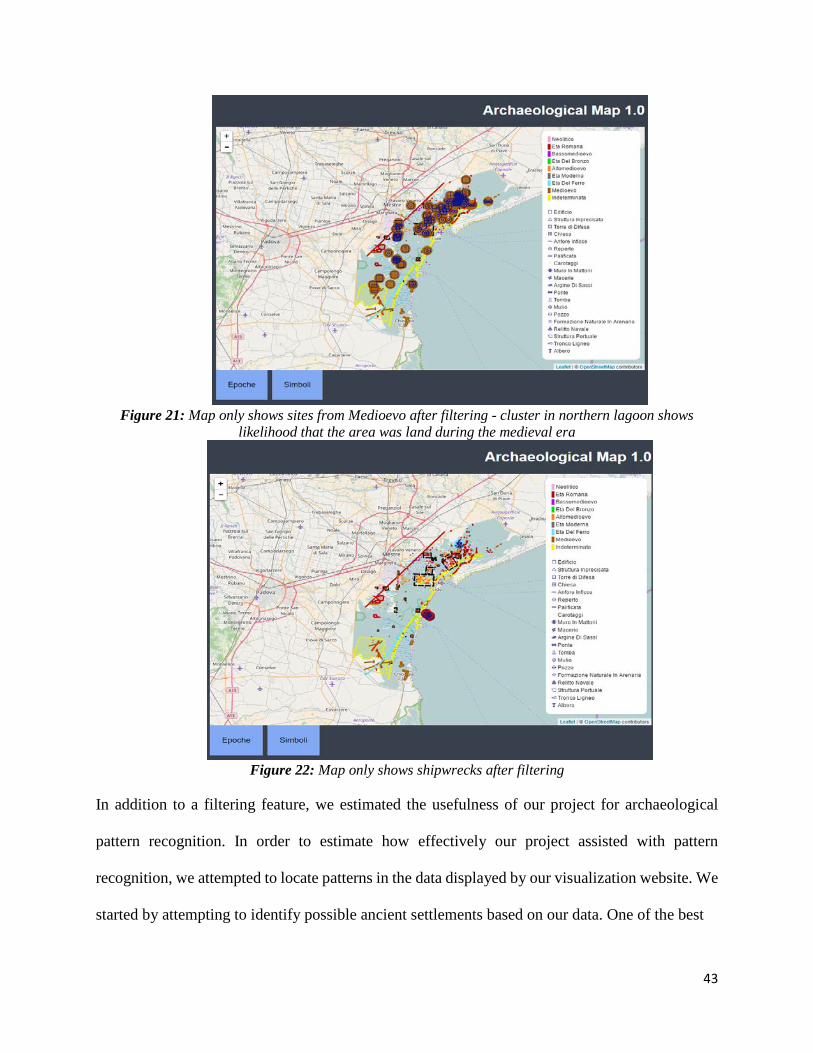
43
Figure 21: Map only shows sites from Medioevo after filtering - cluster in northern lagoon shows
likelihood that the area was land during the medieval era
Figure 22: Map only shows shipwrecks after filtering
In addition to a filtering feature, we estimated the usefulness of our project for archaeological
pattern recognition. In order to estimate how effectively our project assisted with pattern
recognition, we attempted to locate patterns in the data displayed by our visualization website. We
started by attempting to identify possible ancient settlements based on our data. One of the best

44
Figure 23: Roman settlement of the northern coast of Santa Cristina
examples of this can be seen in Figure 23, which shows a set of Roman artifacts found off the
coast of Santa Cristina, a small island in the northern lagoon. The artifacts included two wells,
rubble, evidence of roads and buildings, and Roman-era artifacts. Based on the clustering of the
sites, we determined that this likely showed a Roman settlement. It took us less than 5 minutes of
searching through the map to locate and recognize this pattern, which shows that the system is
useful for identifying patterns and clusters in archaeological data.
After we used our system to locate and group one settlement, we decided to conduct further
testing to determine if our system would be useful for predictive analysis. Predictive analysis refers
to the process through which archaeologists evaluate locations to determine their archaeological
potential (McEwan, 2012). Archaeological potential refers to the likelihood of a site to yield
archaeological finds. The process of predictive analysis is useful to archaeologists, as it allows
them to determine which locations are most likely to contain a wealth of archaeological data. In

45
order to evaluate our system’s usefulness to this process, we examined other locations around the
lagoon, including the island of La Cura, which is shown in Figure 24.
Figure 24: Island of La Cura showing medieval sites
When viewing the island from our map, as seen above, it becomes evident that there was a
medieval settlement on the island. Most of the sites are from the high medieval and medieval
period, which can be determined using the key, and there are several buildings, churches, and
palificata on the island. Palificata were wooden poles used to prevent houses from flooding by
holding them above the water (Eporedia, n.d.). Palificata can be seen in Figure 25.

46
Figure 25: Palificata holding a road out of the water
Based on this information, we deduced that an archaeologist excavating at the location shown in
red in Figure 26 would likely find medieval artifacts and evidence of medieval buildings. We also
deduced that archaeologists excavating in the area would likely find religious artifacts and
medieval building structures, due to the presence of both two medieval churches nearby and the
presence of other medieval buildings in the area. Furthermore, we predicted that aquatic
excavations in the nearby lagoon would also yield a high number of palificata and medieval
artifacts, as well as several building remains.

47
Figure 26: Location recommended for archaeological excavation
We were able to determine this information in less than 15 minutes of searching our map, which
shows that our map is easy to use for archaeological prediction. In addition, we were using the
system with little to no archaeological experience, and were still able to draw connections and
formulate reasonable hypotheses using the system. This demonstrates that our visualization system
could be highly useful for archaeological predictive analysis in addition to being useful for pattern
recognition, site grouping, and data analysis.
48
5. Conclusions & Recommendations
The primary goal of this project was to aid Venetian archaeologists in their documentation
and research work through the creation of online research and data management tools. The primary
issue facing these professionals today was that their current practices for documenting and
managing archaeological data did not adequately meet the need for streamlined research tools. Our
project provided them with a prototype of a streamlined online system for data management,
visualization, and analysis. We created a 3-part system that consisted of a data collection
application, an online database to assist with data storage and management, and a map-based
visualization system for use with data analysis and archaeological research. The collection
application, based on our testing and design, was extremely useful for data recording and
management, and followed an intuitive user-friendly format that was easy to learn. The database
this system linked to was organized in a logical way that allowed for the modification,
organization, and storage of numerous types of data. Our website both visualized data in a way
that was easy to understand and use, and assisted greatly with pattern recognition, spatial
organization of data, analysis of historical data trends, and recognition of historical settlements
and features in archaeological data. Although our system worked well as a prototype, it still
requires work by other IQP teams to advance it to a more sophisticated level both in terms of web
design and usefulness.
5.1 Field Application
Overall, our prototype field application proved useful as a basis for future data collection
applications. We were able to design forms to enter site, layer, find, tomb, skeleton, structure, pole,

49
and handcrafted stone data in an intuitive and useful manner. The layout for our application closely
matched the archaeological forms required for archaeological reporting, and recorded all data
fields written on these forms. This ensured that our system would both follow a format familiar to
archaeologists and that it would provide a starting point for future IQP teams to assist with
archaeological research and data collection. Our app was also designed to allow future IQP teams
to easily link it to our database. We found that saving the data online would ensure that, in the
event of a system failure, archaeological data would be preserved for future use.
Although our prototype data collection app was successful in providing a base design and
framework for future versions, there were several features and areas that require improvement.
The most pressing issue was linking the app to the database so it could store information in a
meaningful and useful manner. Both the database and the app were set up to allow future IQP
teams to easily link the two systems together, so we recommend that the next IQP team focus on
integrating these systems. The next most important issue revolved around the fact that internet
access was necessary to add information via the app. Many archaeological sites do not have access
to internet, so it would be difficult for archaeologists to update data in the field using our app. We
recommend that future IQP groups design an offline mode for our data collection app that saves
data until it connects to the internet and can be uploaded to the database. In addition to the issue
of possible lack of internet access, we also identified a need for a feature to auto-generate PDF
versions of the archaeological forms required for reporting based on the data we collected and
stored in the database. Such a feature would be extremely useful to archaeologists and would
decrease the amount of paperwork necessary for archaeological reporting. We recommend that
future teams create a function to auto-generate PDF forms to assist archaeologists with completion
of paperwork. We also recommend that future teams implement photograph uploads through our
50
data collection app, as this would assist archaeologists in saving large photo libraries for sites. The
final problem we identified with our system was the fact that archaeological forms sometimes
change in format and data required for reporting changes occasionally. We attempted to address
this problem by ensuring that the app would be easy to customize and change, but future IQP teams
will need to modify the app to match the format of future forms. Finally, we recommend that future
IQP teams test our application in-field exhaustively and market it to archaeologists for general use
in Venice. As more archaeologists use our application to record data, our system will be able to
manage and display more data and be more useful to archaeologists for research.
5.2 Visualization System
Our prototype visualization system was highly successful in displaying archaeological data
for use in archaeological research. We logged over 1000 sites with basic data relating to site type,
era, and location. The site was able to display this large amount of data in a satisfactory manner,
and was able to show additional data about each site in popups. The visualization was intuitive and
easy to use, based on our experimentation with it, and the legend was easily readable and provided
useful information for archaeologists. We also found that we had properly located each site on the
map and properly recorded data about each site. Our sponsor indicated that this system would be
useful to them for research as well.
For a prototype, our system worked well for visualizing archaeological data. However,
there were several features and website options that could be implemented to improve on the
system. Firstly, the website needs to be linked to the database as well. This would be the top
priority for future IQP teams. Secondly, the website needed a more clean and sophisticated website
layout. We recommend that future projects create a more sophisticated HTML layout for the

51
website to increase the usability and improve the aesthetic of the website. Furthermore, our website
only currently displays Ernesto Canal’s data, as we used his data for our map. We recommend that
future IQP teams encourage archaeologists to use our system and add data to the database through
our data collection app, as that will then show more data on the map and be more useful to
archaeologists in the future. We also recommend that future IQP teams experiment with other
forms of data visualization, including 3-dimensional modeling of layers recorded using US forms,
and visualization of site density.
5.3 Analysis
Our visualization system provided several useful options for data analysis. The first of
these options was the filtering feature, which allowed archaeologists to filter data by era and type.
This assisted archaeologists with easily identifying trends and patterns in historical data and
assisted with locating clusters of similar finds to assist with research and identification of spatial
features. In addition to the filtering system, our visualization system assisted in recognition of data
patterns due to the fact that it showed data that was organized geographically on a map. The use
of highlights to show possible geographical features or clusters of sites also assisted with data
analysis, as it allowed archaeologists to more easily see relationships between different sites and
connections between different finds. As the system allowed us to find possible settlements and
features in an extremely brief period of time, it proved highly useful for basic pattern recognition
and data analysis.
Although our system helped greatly with basic data analysis, future IQP teams could add
several features that would allow for more sophisticated data analysis and prediction. The first of
these features involves the use of a slider to show changes in sea level throughout the history of
52
Venice. A slider that showed sea level changes would allow archaeologists to track how the
topography of the region has changed over time, and would assist them in predicting where ancient
settlements could be located throughout the lagoon. Such a slider would also help archaeologists
develop hypotheses revolving around how humans spread throughout the lagoon and how the
region’s geography influenced the development of societies and cultures throughout the region.
Another feature we recommend adding to the visualization website to assist with archaeological
research involves predictive algorithms. Predictive modelling allows archaeologists to identify
areas that would likely yield high amounts of significant archaeological finds if excavated, and is
extremely useful to archaeologists for research. We were unable to create predictive models for
our site, as they involve extremely advanced and complex computer algorithms, but future IQP
teams could build on our prototype and implement these predictive models. We also recommend
that future groups include more sophisticated filtering systems that allow for filtration by more
than just site era and type, as more filtration options would assist greatly with the progress of
archaeological research. Our final recommendation for this section of our project is that future IQP
groups should include a “search” function on the website that would allow archaeologists to search
for specific archaeological sites and only display the searched sites on the map.
There is evidence that our prototype system would be highly useful to archaeologists for
data collection, visualization, and analysis. It allows archaeologists to easily record, store, and
manage data, and assists archaeologists in finding connections and relationships between
archaeological sites throughout the lagoon. As a prototype system, it provides a base level of
functionality that is still useful to archaeologists, and provides a base on which future Venice IQP
groups can improve to further assist with archaeological research. We believe that our system, as

53
it is refined and expanded upon by future groups, will become more and more useful to
archaeologists throughout the city of Venice.

54
References
Afezolli, D., Allen, B., Hepworth, J., & Kazanovicz, A. J. (2009, December 18). Unearthing the Roots of Venice: From Relics to DNA. Retrieved September 18, 2016, from https://web.wpi.edu/Pubs/E-project/Available/E-project-010510-121008/unrestricted/Origins_Report_Final.pdf
America, A. I. of. (2016). AIA news. Retrieved September 23, 2016, from https://www.archaeological.org/education/glossary#l
Ammerman, A. J. (1996). Probing the depths of venice. Archaeology, 49(4), 38-43. Anschuetz, K. F., Wilshusen, R. H., & Scheick, C. L. (2001). An Archaeology of Landscapes:
Perspectives and Directions. Journal of archaeological research, 9, 157-211. http://users.clas.ufl.edu/davidson/Proseminar/Week%2013%20Space%20and%20Place/2001%2
0Anschuetz%20et%20al,%20arch%20of%20landscapes.pdf Archaeology 101. (2016). Retrieved September 16, 2016, from
https://www.archaeological.org/pdfs/education/Arch101.2.pdf Archeolex. (2015, August 1). Retrieved September 18, 2016, from
http://www.archeosub.it/leggi.htm Archeoveneta: Dove trovarci. (n.d.). Retrieved September 2, 2016, from http://www.archeoveneta.com/dove.html
Avila, C., De Zulueta, E., Mukhanov, S., & Sokk, M. (2010, December 18). Exploring the History of Venice: Relics, Records, and Relations. Retrieved September 18, 2016, from https://web.wpi.edu/Pubs/E-project/Available/E-project-122710-031051/unrestricted/Final_Report_B10_Origins.pdf
Bailey, G. N., & Flemming, N. C. (2016). Archaeology of the continental shelf: Marine resources, submerged landscapes and underwater archaeology. Quaternary Science Reviews, 27(s 23–24), 2153–2165. doi:10.1016/j.quascirev.2008.08.012
Barstad, J, & Ruppé, C. (2002). International handbook of underwater archaeology. New York: Kluwer Academic/Plenum.
Basic Use of GIS. (2012, August 6). Retrieved November 27, 2016, from https://www.gislounge.com/basic-uses-of-gis/
Beauvais, G. P., Keinath, D. A., & Hernandez, P. (2006). Element distribution modeling: a primer-or-Musings upon depicting the geographic arrangement of biota, with ample reference to the harsh lessons of the dark master experience. Wyoming Natural Diversity Database. Wyoming.
Beltrame, C. (n.d.). The Underwater Archaeological Heritage of the Venice Lagoon. Retrieved September 16, 2016, from http://www.venicethefuture.com/schede/uk/340?aliusid=340
Brainerd, G. W. (1951). The place of chronological ordering in archaeological analysis. American Antiquity, 16(4), 301-313. doi:10.2307/276979
Boshoff, J. (2003). The South African Archaeological Bulletin,58(177), 38-39. doi:1. Retrieved from http://www.jstor.org/stable/3889156
Cai, L., & Zhu, Y. (2015). The Challenges of Data Quality and Data Quality Assessment in the Big Data Era. Data Science Journal, 14, 2. DOI: http://doi.org/10.5334/dsj-2015-002
Calderon, M. (1989). Underwater archaeology in the Philippines. Philippine Quarterly of Culture and Society, 17(4), 322-325. Retrieved from http://www.jstor.org/stable/29791991

55
Canal Ernesto Tito. (2015). Retrieved October 14, 2016, from https://venipedia.it/it/persone/veneziano-dellanno/canal-ernesto-tito
Canning, S. (2005). 'Belief' in the Past: Dempster-Shafer Theory, GIS and Archaeological Predictive Modelling. Australian Archaeology, (60), 6-15. Retrieved from http://www.jstor.org/stable/40287774
Carter, B. (2016, September 6). Wanna collect data digitally? Retrieved September 23, 2016, from Institute on Digital Archaeology Method & Practice, http://digitalarchaeology.msu.edu/news/
Cook, S. F., & Heizer, R. F. (1953). Archaeological dating by chemical analysis of bone. Southwestern Journal of Anthropology, 9(2), 231-238.
Dalgish, C. (2005). Urban myths: Rethinking the archaeology of the modern scottish city. Scottish Archaeological Journal, 27(2), 147-183.
Dean, M. (1995). Archaeology underwater: The NAS guide to principles and practice. Portsmouth: Nautical Archaeology Society.
Drewett, P. L. (1999). Field Archaeology: An Introduction. Retrieved from http://www.archaeology.ru/Download/Drewett/Drewett_1999_Field_Archaeology.pdf
Eporedia. N.d. Citta Romana d’Importanza Strategica. Retrieved December 10, 2016 from http://www.eporedia.eu/pg026.html European Preventive Archaeology. (2007). National Office of Cultural Heritage. Retrieved
September 23, 2016, from https://www.coe.int/t/dg4/cultureheritage/heritage/Archeologie/EPreventiveArchwebversion.pdf
Firth, A. (1996). Theorizing the Management of Archaeology Underwater. Historical Archaeology, 30(2), 85-92. Retrieved from http://www.jstor.org/stable/25616458
Foote, K. E. (2015). Geographic Information Systems as an Integrating Technology: Context, Concepts, and Definitions. Retrieved October 14, 2016, from http://www.colorado.edu/geography/gcraft/notes/intro/intro.html
Gianolio, S., Mermati, F., & Genovese, G. (2014). Image-based 3D modeling for the knowledge and the representation of archaeological dig and pottery: Sant'omobono and sarno project's strategies. The International Archives of Photogrammetry, Remote Sensing and Spatial Information Sciences, 40(5), 243.
GIS Spatial Data Types: Vector vs Raster. (2016, July 30). Retrieved November 27, 2016, from http://gisgeography.com/spatial-data-types-vector-raster/
Grunow, O. (1961). The 34th international congress of americanists. Current Anthropology, 2(3), 265-268.
Hastings, D. (2014). Combating Visitor Pressure: Impact of Tourism on the Conservation of World Heritage Sites. Retrieved September 5, 2016, from https://dlib.lib.washington.edu/researchworks/bitstream/handle/1773/27123/Hastings_washington_0250O_13213.pdf?sequence=1&isAllowed=y
Hesselberth, C. (1948). Subterranean archaeology.Journal of the Illinois State Archaeological Society, 6(2), 38-38. Retrieved from
http://www.jstor.org/stable/43762950 High water in Venice: frequently asked questions (FAQ). Retrieved September 22, 2016, from
The City of Venice, http://archive.comune.venezia.it/flex/cm/pages/ServeBLOB.php/L/EN/IDPagina/22795
Hodgkinson, A. (2012, March 30). The archaeological applications of GIS Spatial Technology
56
and Archaeology. Archaeology in the Digital Era, 2, 59-88. Holdaway, S. (1995). Archaeological analysis and the role of statistics: A reply to veth.
Archaeology in Oceania, 30(3), 137-138. Ingbar, E. (1994). Plains Anthropologist, 39(148), 235-237. Retrieved from
http://www.jstor.org/stable/25669271 J. W. (2015, November 3). Understanding what makes a visualization memorable. Retrieved
September 29, 2016, from http://www.storybench.org/understanding-what-makes-a-visualization-memorable/
Johnston, G. (2016, May 18). Dating Techniques In Archaeology. Retrieved September 16, 2016,
from http://www.archaeologyexpert.co.uk/archaeologicaldating.html Kvamme, K. (1990). One-Sample Tests in Regional Archaeological Analysis: New Possibilities
through Computer Technology. American Antiquity, 55(2), 367-381. doi:1. Retrieved from http://www.jstor.org/stable/281655
Kyle A. Knabb, Jurgen P. Schulze, Falko Kuester, Thomas A. DeFanti, & Thomas E. Levy. (2014). Scientific Visualization, 3D Immersive Virtual Reality Environments, and Archaeology in Jordan and the Near East. Near Eastern Archaeology, 77(3), 228-232. doi:1. Retrieved from http://www.jstor.org/stable/10.5615/neareastarch.77.3.0228
Levy, T., Witten, A., & Alon, D. (1996). Denizens of the Desert.Archaeology, 49(2), 36-40. Retrieved from http://www.jstor.org/stable/41770590
Liritzis, I., Al-Otaibi, F. M., Volonakis, P., & Drivaliari, A. (2015). Digital Technologies And Trends In Cultural Heritage. Mediterranean Archaeology & Archaeometry, 15(3), 313-332.
Maliene, V., Grigonis, V., Palevicius, V., & Griffiths, S. (2011, January 17). Geographic information system: Old principles with new capabilities. Retrieved October 14, 2016, from http://link.springer.com/article/10.1057/udi.2010.25
Marwick, B. J. Archaeological Method Theory (2016). Retrieved September 10, 2016, from http://link.springer.com/article/10.1007/s10816-015-9272-9
McEwan, D. (2012). Qualitative Landscape Theories and Archaeological Predictive Modelling—A Journey Through No Man's Land? Journal of Archaeological Method and Theory, 19(4), 526-547. Retrieved from http://www.jstor.org/stable/23365977
McKenna, J. (2016, July 15). UN threatens to place Venice on endangered list unless Italy bans cruise ships. Retrieved September 05, 2016, from http://www.telegraph.co.uk/news/2016/07/15/un-threatens-to-place-venice-on-endangered-list-unless-italy-ban/
Merali, Z. (2002, August 19). Saving Venice. Retrieved September 19, 2016, from Scientific American, http://www.scientificamerican.com/article/saving-venice/
Mukhanov, Sofia; DeZulueta, Elizabeth Marie; Avila, Corrie Elizabeth; Sokk, Maarja-Liisa; Carrera, Fabio; Cocola, James. (2011). Exploring the history of venice -- relics, records, and relations. Worcester, MA: Worcester Polytechnic Institute.
Nguyen, M.-L., & Archaeological Institute of America. (2009, December 7). Site preservation news. Retrieved September 23, 2016, from https://www.archaeological.org/news/advocacy/76
Ortalli, G., & Scarabello, G. (1999). A Short History of Venice. Pacini Editore S.P.A. Orton, C. (2007). Digging Your Own Grave: Generic Skills from an Archaeological Simulation.
57
Archaeology to Delight and Instruct: Active Learning in the University Classroom, 49, 143.
Palomero, F., & Palomero, I. (2013). San sebastian de silos: The church dedicated or consecrated around 1088 through the documentation and archaeological remains. Imago Temporis.Medium Aevum, 7, 139-174.
Perrin, K., Brown, D. H., Lange, G., Bibby, D., Carlsson, A., Degraeve, A., … Von Bieberstein, A. R. (2014). A Standard and Guide to Best Practice for Archaeological Archiving in Europe (EAC Guidelines 1 ed.). rue des Brigades d’Irlande 1 5100 Namur, Belgium: Europae Archaeologia Consilium (EAC). http://european-archaeological-council.org/files/arches_v1_gb.compressed.pdf
Phuong, D. Q., Faylona, Marie Grace Pamela G, & Parry, D. (2009). A conservation perspective on the ba dinh archaeological site. Bulletin of the Indo-Pacific Prehistory Association, 29, 61-67.
Quartermaine, J., Olson, B., & Killebrew, A. (2014). Image-Based Modeling Approaches to 2D and 3D Digital Drafting in Archaeology at Tel Akko and Qasrin: Two Case Studies. Journal of Eastern Mediterranean Archaeology & Heritage Studies, 2(2), 110-127. doi:1. Retrieved from http://www.jstor.org/stable/10.5325/jeasmedarcherstu.2.2.0110
Richards, J. (1998). Recent Trends in Computer Applications in Archaeology. Journal of Archaeological Research, 6(4), 331-382. Retrieved from http://www.jstor.org/stable/41053162
Richter, A. (2014, July 18). So What is Digital Archaeology? Retrieved September 23, 2016 http://popular-archaeology.com/blog/adventures-in-digital-archaeology/so-what-is-digital-archaeology
Roosevelt, C. H., Cobb, P., Moss, E., Olson, B. R., & Unlusoy, S. (2015, May 29). Excavation is Digitization: Advances in Archaeological Practice. Retrieved September 19, 2016, from http://www.tandfonline.com/doi/full/10.1179/2042458215Y.0000000004
Rowe, J. H. (1959). Archaeological dating and cultural process. Southwestern Journal of Anthropology, 15(4), 317-324.
Sconcerto. Archivio storico: Dati di livello di marea a Venezia. Retrieved September 21, 2016, from http://www.comune.venezia.it/archivio/25419
Shrestha, B. (2016). Nuclear isotopes and uses. Retrieved October 14, 2016, from http://chem-guide.blogspot.com/2010/04/nuclear-isotopes-and-uses.html
Smith, M. E. (1987). The expansion of the aztec empire: A case study in the correlation of diachronic archaeological and ethnohistorical data. American Antiquity, 52(1), 37-54. doi:10.2307/281059
Smith, M. D., Longley, P., & Goodchild, M. (2012). Geospatial Analysis - spatial and GIS analysis techniques and GIS software. Retrieved October 14, 2016, from http://www.spatialanalysisonline.com/output/
Soika, G. (n.d.). A. Supplemento al vol. XXVII del bollettino del Museo di Storia Naturale di Venezia
South, S. (1978). Pattern recognition in historical archaeology. American Antiquity, 43(2), 223-230. doi:10.2307/279246
Staski, E. (2008). Living in Cities Today. Historical Archaeology, 42(1), 5-10. Retrieved from http://www.jstor.org/stable/25617479
Straumann, S. [Recording Archaeology]. (2015, October 7). Interpreting the Archaeological Record by the aid of GIS – The Insula 30 of Augusta Raurica (CH). [VideoFile]. Retrived from
http://popular-archaeology.com/blog/adventures-in-digital-archaeology/so-what-is-digital-archaeology

58
https://www.youtube.com/watch?time_continue=472&v=5k3x2x8PlhM The 50th Anniversary of GIS. (2012, Fall). Retrieved October 14, 2016, from
http://www.esri.com/news/arcnews/fall12articles/the-fiftieth-anniversary-of-gis.html The Conservation of Venetian Building Materials: Wood. (2008, December 11). Retrieved
September 19, 2016, from Venice: An Online Exhibit Produced in ARTH 470z at the University of Mary Washington, http://venice.umwblogs.org/exhibit/the-conservation-of-venetian-building-materials/wood/
Tugby, D. (1965). Archaeological Objectives and Statistical Methods: A Frontier in Archaeology. American Antiquity, 31(1), 1-16. doi:1. Retrieved from http://www.jstor.org/stable/2694017
Venice and its Lagoon. (2016). Retrieved September 18, 2016, from http://whc.unesco.org/en/list/394
Verhagen, P., & Whitley, T. (2012). Integrating Archaeological Theory and Predictive Modeling:
A Live Report from the Scene. Journal of Archaeological Method and Theory, 19(1), 49-100. Retrieved from http://www.jstor.org/stable/41408809
Zeuner, F. E. (1951). Archeological dating by radioactive carbon. Science Progress (1933- ), 39(154), 225-238.

59
Appendix A: Archaeological System Summaries This appendix, and the tables and summaries contained within, represent our analysis of fifteen different computational systems for archaeological research and data management. The below table summarizes features of these systems, and more information relating to each system is located in their summaries.
OxCal OxCal is a program designed by Oxford University’s C. Bronk Ramsey for use in radiocarbon dating and analysis. The program provides radiocarbon calibration and allows archaeologists to summarize and analyze absolute radiocarbon dating data. It is both available as a download and as a browser-based application and allows the user to enter analysis data either as command files or through the user interface. This program is only available to the University of Oxford, so the team could not use the program. However, screenshots provided on the website show that the program uses graphs to display radiocarbon data for ease of analysis. This program is most applicable to the analysis and research stages of the archaeological process.

60
OxCal can be found at the following link: https://c14.arch.ox.ac.uk/oxcal.html
Integrated Archaeological Database The Integrated Archaeological Database System or IADB is a web-based databasing system that provides support to archaeologists for data management throughout the course of an archaeological project. This database software provides support through excavation recording, analysis of finds, research, publication, and data archiving. It was created by a group of Scottish archaeologists to address a lack of online archaeological databasing tools. The system is web-based and designed to work with Firefox. It focuses on data recording and establishing links between records. The system itself is proprietary and requires purchase to use, but the website provides a number of screenshots and a free, limited-access demo that allows users to browse a completed archaeological site record. Below are several screenshots provided by the website of forms and pages.

61

62
IADB can be found at the following link: http://www.iadb.org.uk/
Site Recorder 4 Site Recorder 4 is a system designed to integrate GIS and information management for use specifically in underwater archaeology. It has support for real-time data collection, publication, migration of data from other systems, and data archiving. This system is designed for collecting and displaying data as well as on-site data collection. This system has features for recording artifacts as well as site features such as trenches, areas, and sectors. It also allows for tracking of divers and boats in the area, and allows archaeologists to upload photos, drawings, and site documents. It allows for some data linking based on location. The system also allows archaeologists to complete site drawings in-application and publish data using the system. However, this system is designed only for use with underwater archaeology and requires a computer running older versions of Windows (Vista and older) to use. It also requires payment to use. Below is a screenshot of the system showing a map of site artifacts for a wreck, including cannons and an anchor.

63
More information on Site Recorder 4 can be found at the following link: http://www.3hconsulting.com/ProductsRecorderMain.htm
Comparative Archaeology Database The Comparative Archaeology Database, created by the University of Pittsburgh, supports archaeological efforts to preserve and publish archaeological data. This system provides numerous datasets specifically revolving around Latin American archaeology. The system aims to provide a more efficient and more user-friendly method for preserving large amounts of archaeological data. Below is an example of the system’s map-based interface:
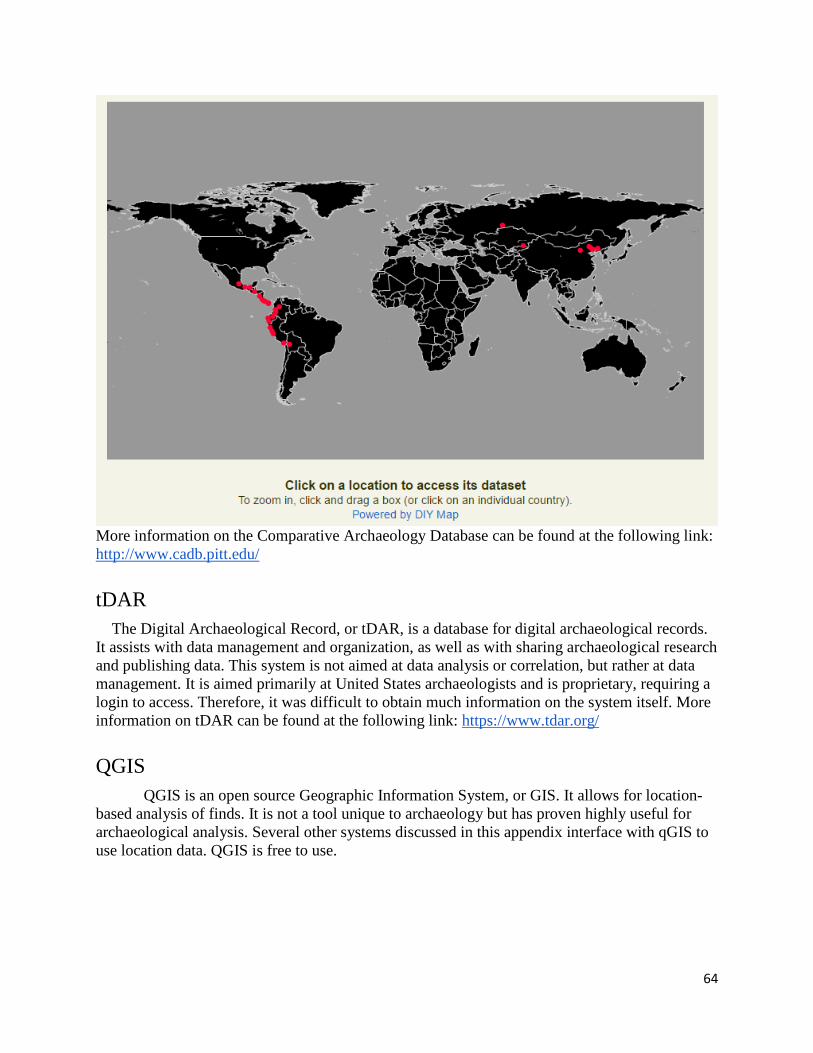
64
More information on the Comparative Archaeology Database can be found at the following link: http://www.cadb.pitt.edu/
tDAR The Digital Archaeological Record, or tDAR, is a database for digital archaeological records. It assists with data management and organization, as well as with sharing archaeological research and publishing data. This system is not aimed at data analysis or correlation, but rather at data management. It is aimed primarily at United States archaeologists and is proprietary, requiring a login to access. Therefore, it was difficult to obtain much information on the system itself. More information on tDAR can be found at the following link: https://www.tdar.org/
QGIS QGIS is an open source Geographic Information System, or GIS. It allows for location-
based analysis of finds. It is not a tool unique to archaeology but has proven highly useful for archaeological analysis. Several other systems discussed in this appendix interface with qGIS to use location data. QGIS is free to use.

65
More information on QGIS can be found at the following link: http://www.qgis.org/en/site/
Kobo Tool KoBoToolbox is comprised of a set of tools for use in data collection. It allows researchers to collect data through use of mobile forms. It also allows researchers to modify and create new forms, as well as to analyze data gathered through the mobile system using Excel or other data analysis systems. This is useful to archaeologists when collecting data from archaeological sites, as it allows for real-time data collection. Although it is free for use by humanitarian organizations, it has data restrictions for non-humanitarian users, and limits submissions to less than 10,000 and data uploads to less than 5 GB per month. Therefore, this system is too limited for use in our current project.

66
More information on Kobo Tool can be found at the following link: http://www.kobotoolbox.org/
ExeGesIs/HBSMR HBSMR is a GIS platform for data management, analysis, and publication. It was created
for use by English archaeologists in data management. It allows users to record monuments, finds, landscapes, casework, events, sources, designations, and data synthesis. It integrates GIS into its data management system for the display of locations and finds on map interfaces. It also provides support for admins and is customizable. This system is not free to use, and requires registration.
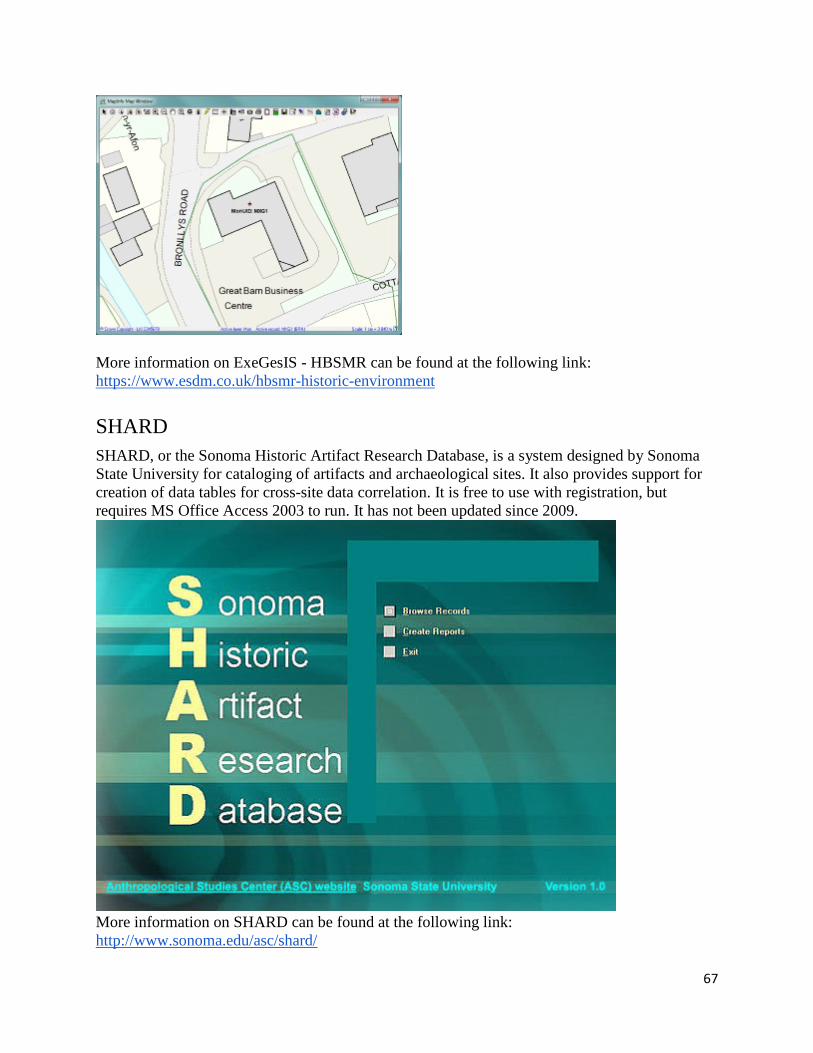
67
More information on ExeGesIS - HBSMR can be found at the following link: https://www.esdm.co.uk/hbsmr-historic-environment
SHARD SHARD, or the Sonoma Historic Artifact Research Database, is a system designed by Sonoma State University for cataloging of artifacts and archaeological sites. It also provides support for creation of data tables for cross-site data correlation. It is free to use with registration, but requires MS Office Access 2003 to run. It has not been updated since 2009.
More information on SHARD can be found at the following link: http://www.sonoma.edu/asc/shard/

68
ARK- The Archaeological Recording Kit ARK is a system for archaeological data management. It allows archaeologists to collect data and edit, view and share the collected data. It allows archaeologists to customize data entry for their sites and finds, and is fully open-source. ARK is web-based and requires no additional software to run. It is also free to install and use.
More information on Ark can be found at the following link: http://ark.lparchaeology.com/
Intrasis Intrasis is a GIS aimed specifically at archaeological data management. It allows archaeologists to combine all data related to a single site in order to better analyze and record site data. It was developed by a Swedish archaeological department, and is widely used in Swedish archaeology. The system itself is aimed at archaeological documentation on-site and is comprised of two separate products, Intrasis Explorer and Intrasis Analysis. Explorer allows for data importation and administration. Analysis uses GIS analysis to help organize and make sense of data. The system is object oriented. It is not free or open source and requires a key to activate.
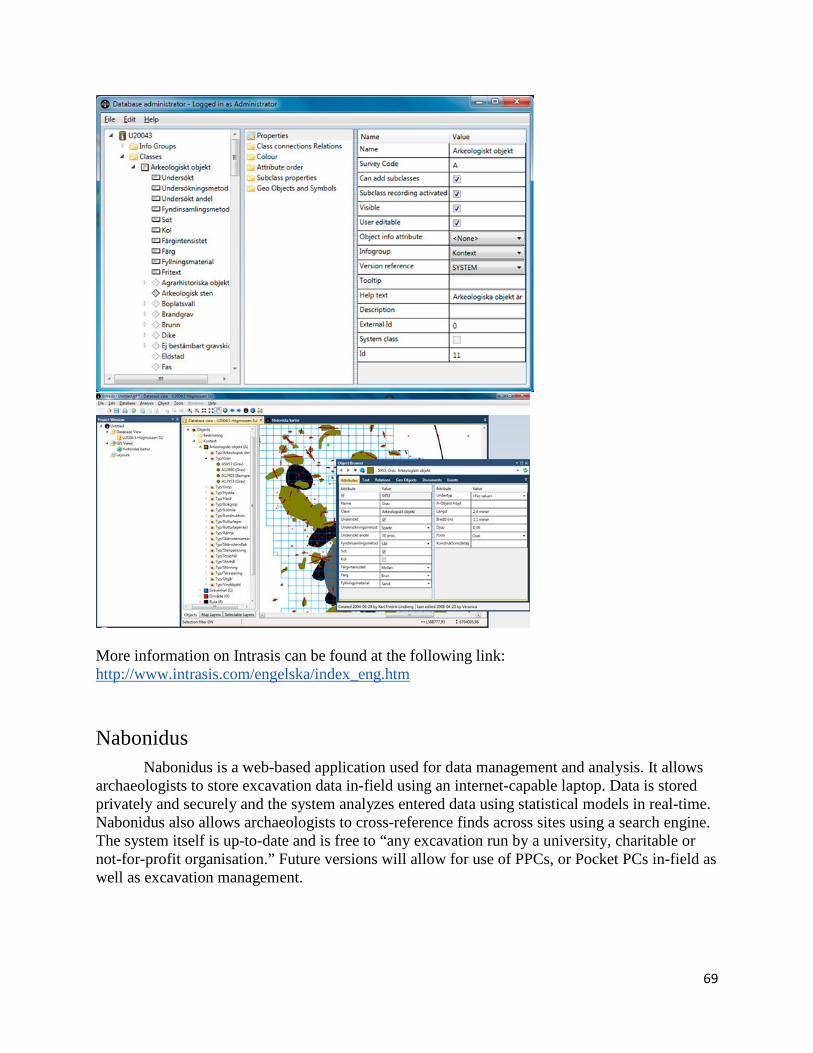
69
More information on Intrasis can be found at the following link: http://www.intrasis.com/engelska/index_eng.htm
Nabonidus Nabonidus is a web-based application used for data management and analysis. It allows
archaeologists to store excavation data in-field using an internet-capable laptop. Data is stored privately and securely and the system analyzes entered data using statistical models in real-time. Nabonidus also allows archaeologists to cross-reference finds across sites using a search engine. The system itself is up-to-date and is free to “any excavation run by a university, charitable or not-for-profit organisation.” Future versions will allow for use of PPCs, or Pocket PCs in-field as well as excavation management.

70
More information on Nabonidus can be found at the following link: http://www.nabonidus.org/
SingulArch-Pocket SingulArch-Pocket is an application for PPCs, or Pocket PCs. It allows archaolgists to
collect a wide variety of data during archaeological excavations. It also has applications for geological and biological investigation. SingulArch also allows users to store coordinates and interpret GPS data. There are two versions, the full and the light version, which offer differing levels of functionality. The light version only allows use of CAD tools, coordinates, and GPS. The full version allows use of all of the features of the light version plus databasing capabilities. The full version also includes tools to synch PPCs with desktops. However, this tool has not been updated since 2007 and is likely defunct.
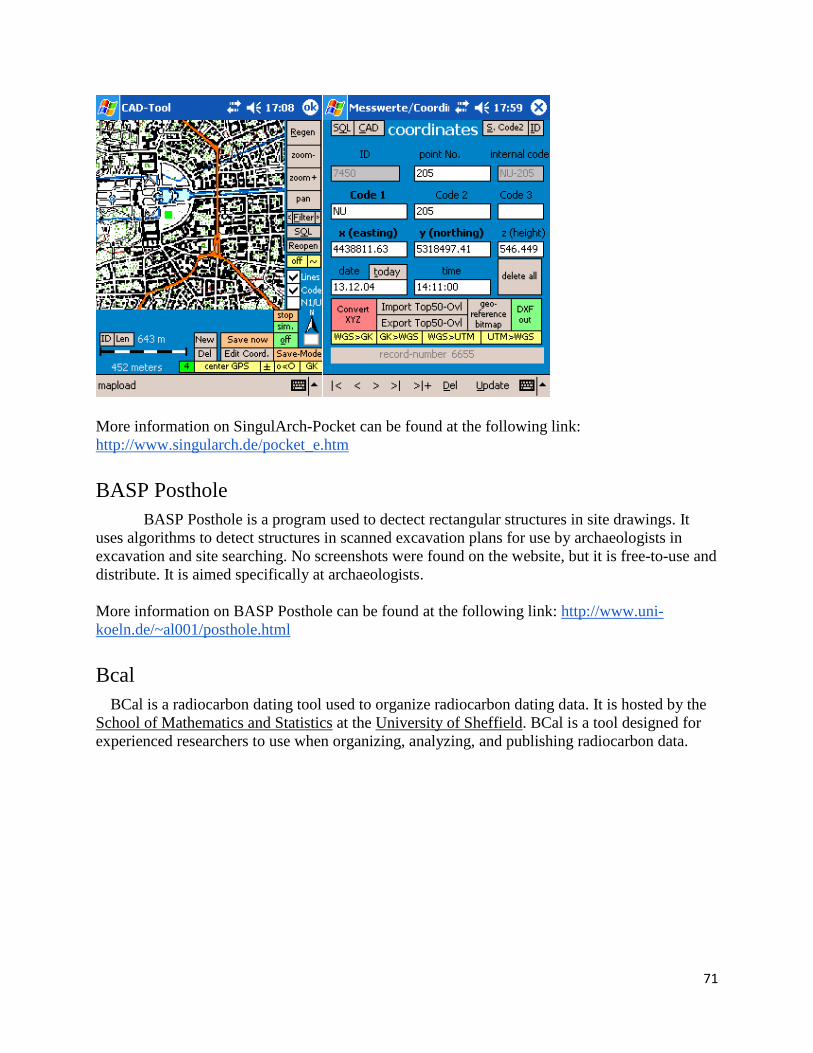
71
More information on SingulArch-Pocket can be found at the following link: http://www.singularch.de/pocket_e.htm
BASP Posthole BASP Posthole is a program used to dectect rectangular structures in site drawings. It
uses algorithms to detect structures in scanned excavation plans for use by archaeologists in excavation and site searching. No screenshots were found on the website, but it is free-to-use and distribute. It is aimed specifically at archaeologists. More information on BASP Posthole can be found at the following link: http://www.uni-koeln.de/~al001/posthole.html
Bcal BCal is a radiocarbon dating tool used to organize radiocarbon dating data. It is hosted by the School of Mathematics and Statistics at the University of Sheffield. BCal is a tool designed for experienced researchers to use when organizing, analyzing, and publishing radiocarbon data.

72
More information on BCal Posthole can be found at the following link: http://bcal.shef.ac.uk/
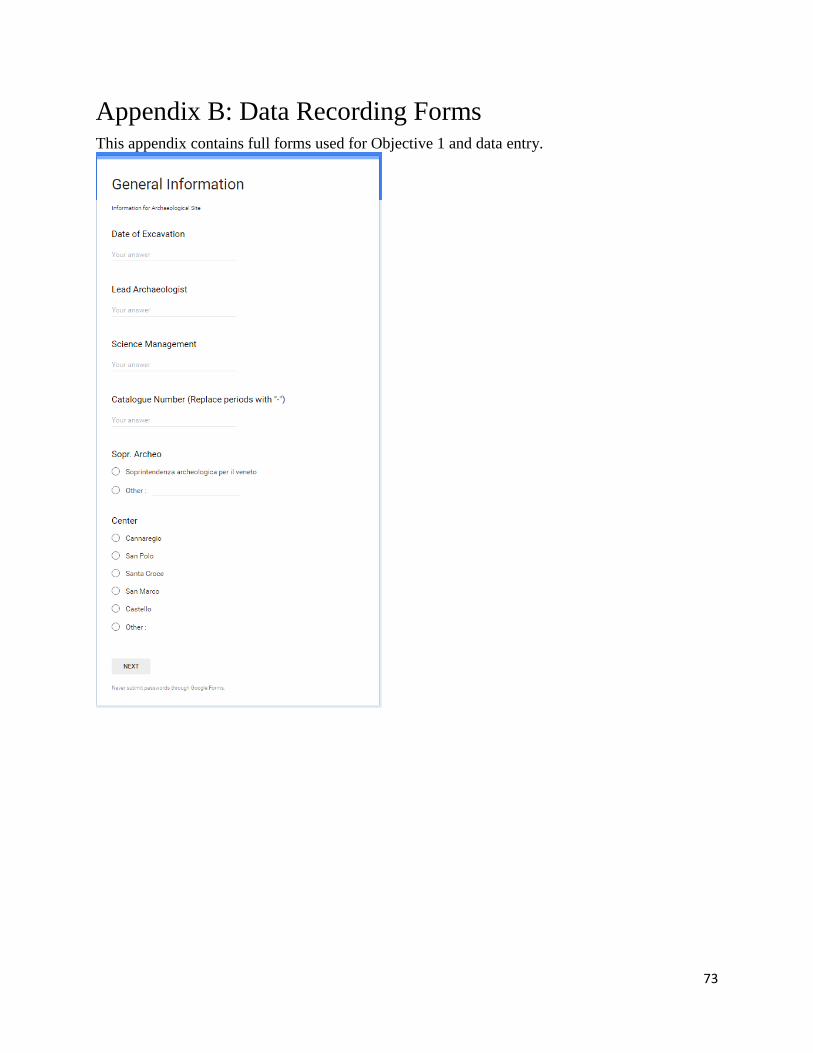
73
Appendix B: Data Recording Forms This appendix contains full forms used for Objective 1 and data entry.
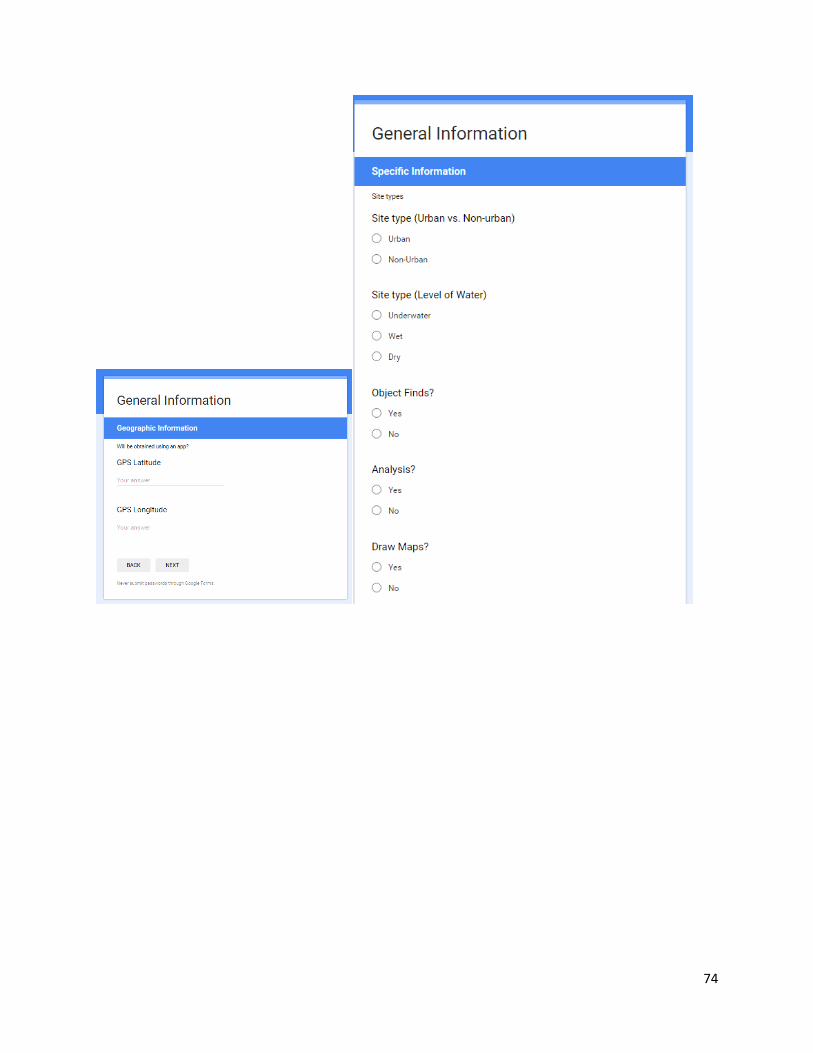
74

75
Form Screenshots from App

76

77

78
Appendix C: Archaeological Forms
Site form provided by Studio Zandinella
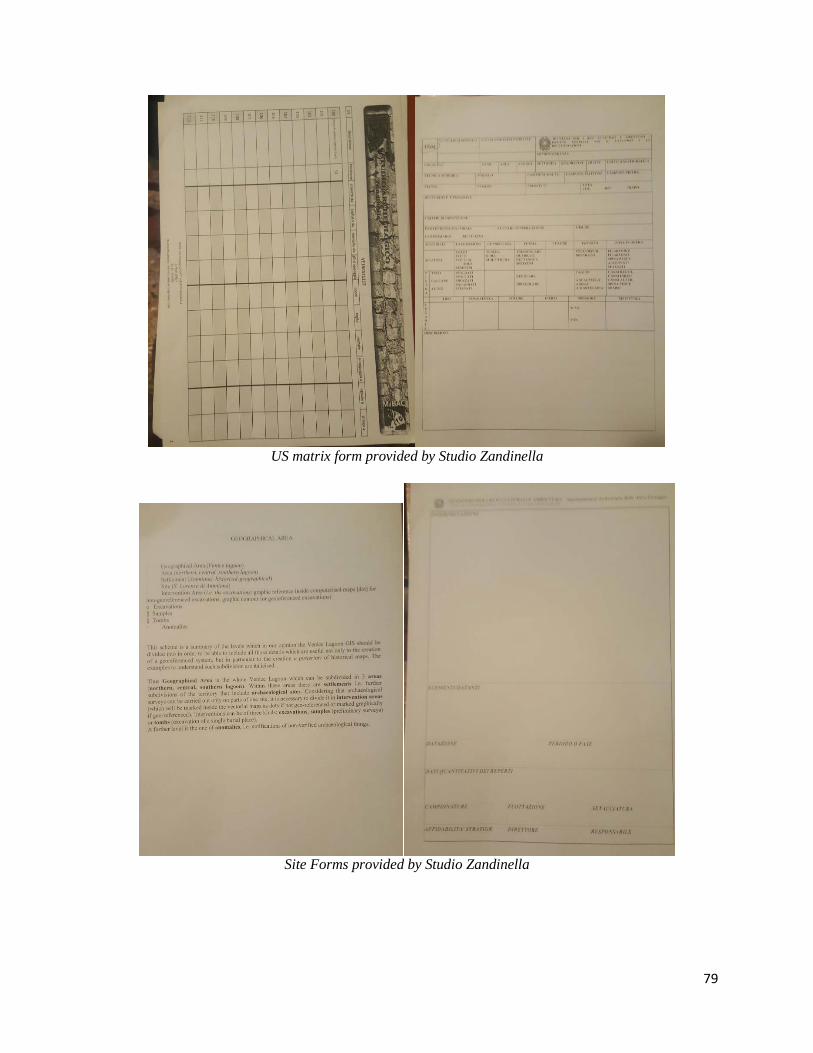
79
US matrix form provided by Studio Zandinella
Site Forms provided by Studio Zandinella

80
Front and back pictures of the USM form provided by Studio Zandinella

81
US Site Layers Index provided by Studio Zandinella
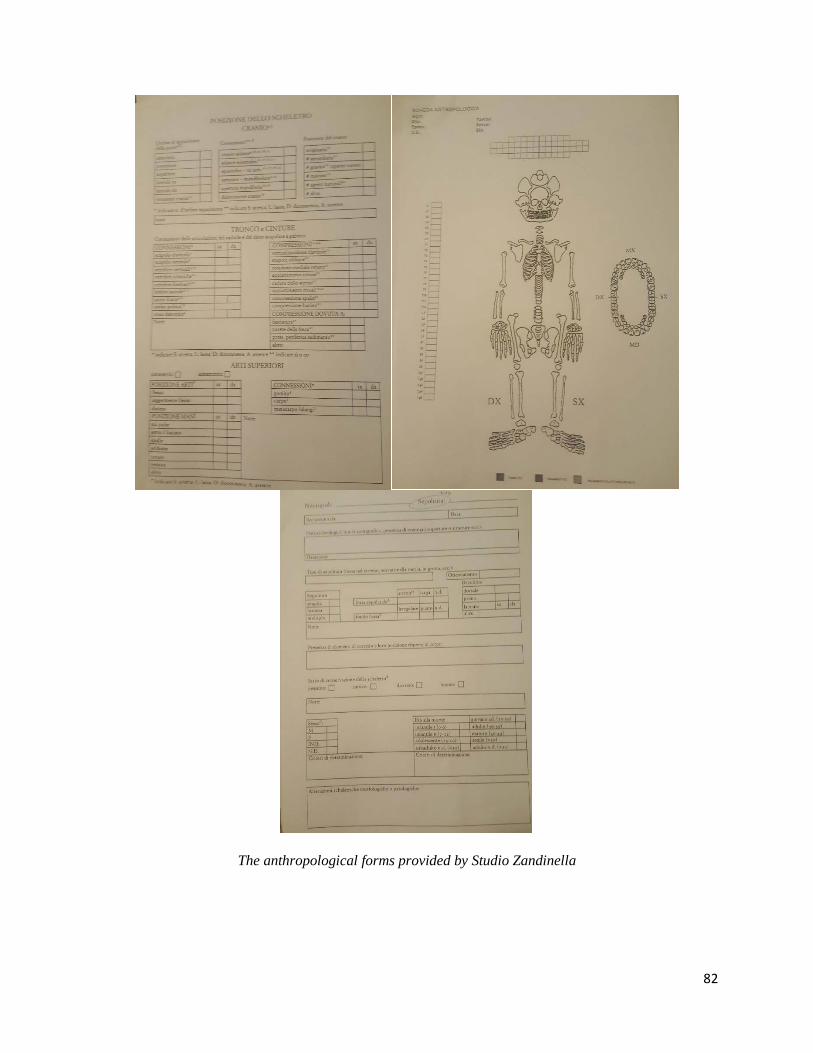
82
The anthropological forms provided by Studio Zandinella