UNDP Climate Profiles Malawi - University of Oxford
27
UNDP Climate Change Country Profiles Malawi C. McSweeney 1 , M. New 1,2 and G. Lizcano 1 1. School of Geography and Environment, University of Oxford. 2. Tyndall Centre for Climate Change Research http://country-profiles.geog.ox.ac.uk General Climate Malawi is located in eastern southern Africa, stretching across latitudes 9‐15˚S. The country’s topography is highly varied; the Great Rift Valley runs North to South through the country, containing Lake Malawi, and the landscape around the valley consists of large at an elevation of around 800‐1200m, but with peaks as high as 3000m. The country’s climate is tropical, but the influence of its high elevation means that temperatures are relatively cool. In winter (JJA) temperatures drop to around 18‐19˚C, and in the warmest months (September to January) temperatures range from 22‐27˚C. Wet season rainfalls depend on the position of the Inter‐tropical Convergence Zone (ITCZ) which can vary in its timing and intensity from year to year. In the south of Malawi the wet season normally lasts from November to February bringing around 150‐300m per month, but rain continues into March and April in the north of the country as the ITCZ migrates northwards. Topographical influences also cause local variations to the rainfall with the highest altitude regions receiving the highest rainfalls. Inter‐annual variability in the wet‐season rainfall in Malawi is also strongly influenced by Indian Ocean Sea Surface Temperatures, which can vary from one year to another due to variations in patterns of atmospheric and oceanic circulation. The most well documented cause of this variability is the El Nino Southern Oscillation (ENSO). The influences of ENSO on the climate of Malawi can be difficult to predict as it sits between two regions of opposing climatic response to El Niño. Eastern equatorial Africa tends to receive above average rainfall in El Niño conditions, whilst south‐eastern Africa often experiences below average rainfall. The opposite response pattern occurs in La Niña episodes. The response of climate in each of these two regions, and the extent of the area affected, varies with each El Niño or La Niña event causing mixed responses in Malawi. 1
Transcript of UNDP Climate Profiles Malawi - University of Oxford
UNDP Climate Change Country Profiles
Malawi C. McSweeney1, M. New1,2 and G. Lizcano1
1. School of Geography and Environment, University of Oxford. 2. Tyndall Centre for Climate Change Research
http://country-profiles.geog.ox.ac.uk
General Climate
Malawi is located in eastern southern Africa, stretching across latitudes 9‐15˚S. The country’s topography is highly varied; the Great Rift Valley runs North to South through the country, containing Lake Malawi, and the landscape around the valley consists of large at an elevation of around 800‐1200m, but with peaks as high as 3000m. The country’s climate is tropical, but the influence of its high elevation means that temperatures are relatively cool.
In winter (JJA) temperatures drop to around 18‐19˚C, and in the warmest months (September to January) temperatures range from 22‐27˚C. Wet season rainfalls depend on the position of the Inter‐tropical Convergence Zone (ITCZ) which can vary in its timing and intensity from year to year. In the south of Malawi the wet season normally lasts from November to February bringing around 150‐300m per month, but rain continues into March and April in the north of the country as the ITCZ migrates northwards. Topographical influences also cause local variations to the rainfall with the highest altitude regions receiving the highest rainfalls.
Inter‐annual variability in the wet‐season rainfall in Malawi is also strongly influenced by Indian Ocean Sea Surface Temperatures, which can vary from one year to another due to variations in patterns of atmospheric and oceanic circulation. The most well documented cause of this variability is the El Nino Southern Oscillation (ENSO). The influences of ENSO on the climate of Malawi can be difficult to predict as it sits between two regions of opposing climatic response to El Niño. Eastern equatorial Africa tends to receive above average rainfall in El Niño conditions, whilst south‐eastern Africa often experiences below average rainfall. The opposite response pattern occurs in La Niña episodes. The response of climate in each of these two regions, and the extent of the area affected, varies with each El Niño or La Niña event causing mixed responses in Malawi.
1
Malawi
Recent Climate Trends Temperature
• Mean annual temperature has increased by 0.9˚C between 1960 and 2006, an average rate of 0.21˚C per decade. This increase in temperature has been most rapid in summer (DJF) and slowest in SON.
• Daily temperature observations show significantly increasing trends in the frequency hot days1 and nights in all seasons.
o The average number of ‘hot’ days per year in Malawi has increased by 30.5 (an additional 8.3% of days2) between 1960 and 2003. The rate of increase is seen most strongly in DJF when the average number of hot DJF days has increased by 3.9 days per month (an additional 12.7% of DJF days) over this period.
o The average number of ‘hot’ nights per year increased by 41 (an additional 11.1% of nights) between 1960 and 2003. The rate of increase is seen most strongly in DJF when the average number of hot DJF nights has increased by 5.5 days per month (an additional 17.6% of DJF nights) over this period.
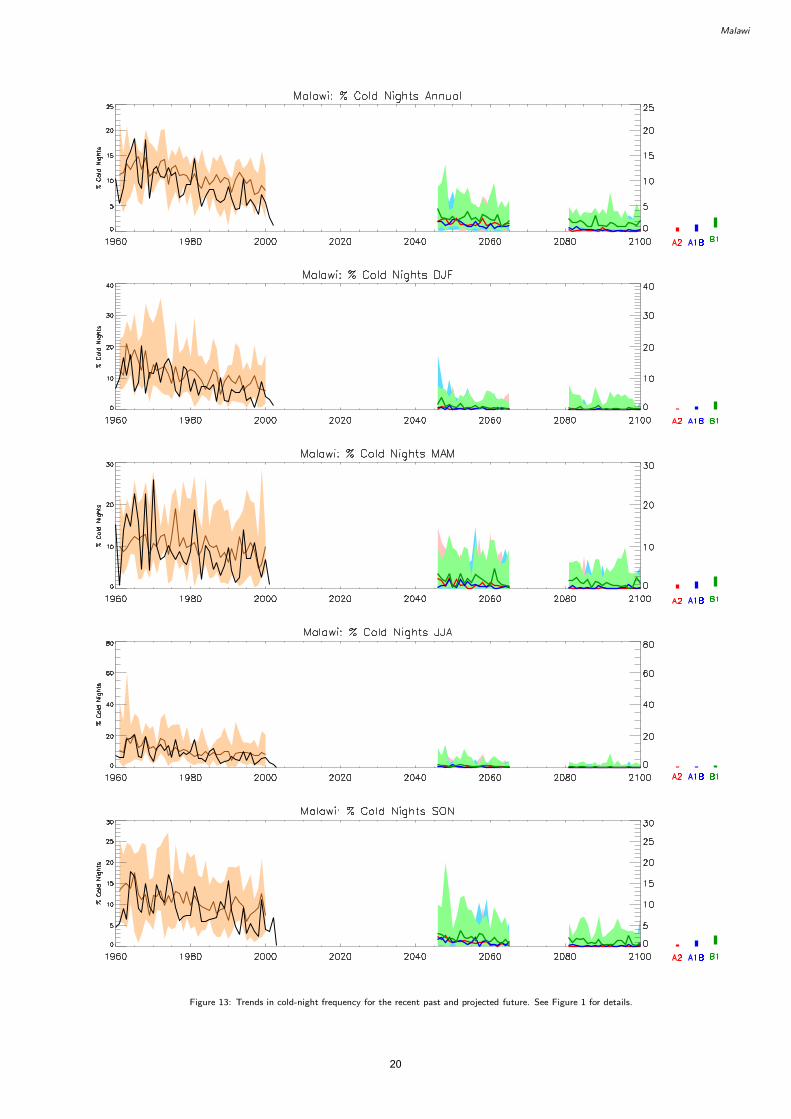
• The frequency of cold days3 and nights have decreased significantly since 1960 in all seasons except SON.
o The average number of ‘cold ‘days per year has decreased by 16 (4.3% of days) between 1960 and 2003. This rate of decrease is most rapid in MAM when the average number of cold MAM days has decreased by 2.4 days per month (7.2% of MAM days) over this period.
o The average number of ‘cold’ nights per year has decreased by 33 (8.9% of days). This rate of decrease is most rapid in MAM when the average number of cold MAM nights has decreased by 3.2 nights per month (10.4% of MAM nights) over this period.
Precipitation
• Year‐to‐year variability in rainfall is very string in Malawi and this can make it difficult to identify long term trends. Observations of rainfall over Malawi do not show statistically significant trends. Wet‐season (DJF) rainfall over Malawi in 2006 was particularly low, causing an apparent decreasing trend in DJF rainfall but there is no evidence of consistent decreases.
• There are no statistically significant trends in the extremes indices calculated using daily precipitation observations.
1 ‘Hot’ day or ‘hot’ night is defined by the temperature exceeded on 10% of days or nights in current climate of that region and season. 2 The increase in frequency over the 43‐year period between 1960 and 2003 is estimated based on the decadal trend quoted in the summary table. 3 ‘Cold’ days or ‘cold’ nights are defined as the temperature below which 10% of days or nights are recorded in current climate of that region or season.
2
Malawi
GCM Projections of Future Climate Temperature
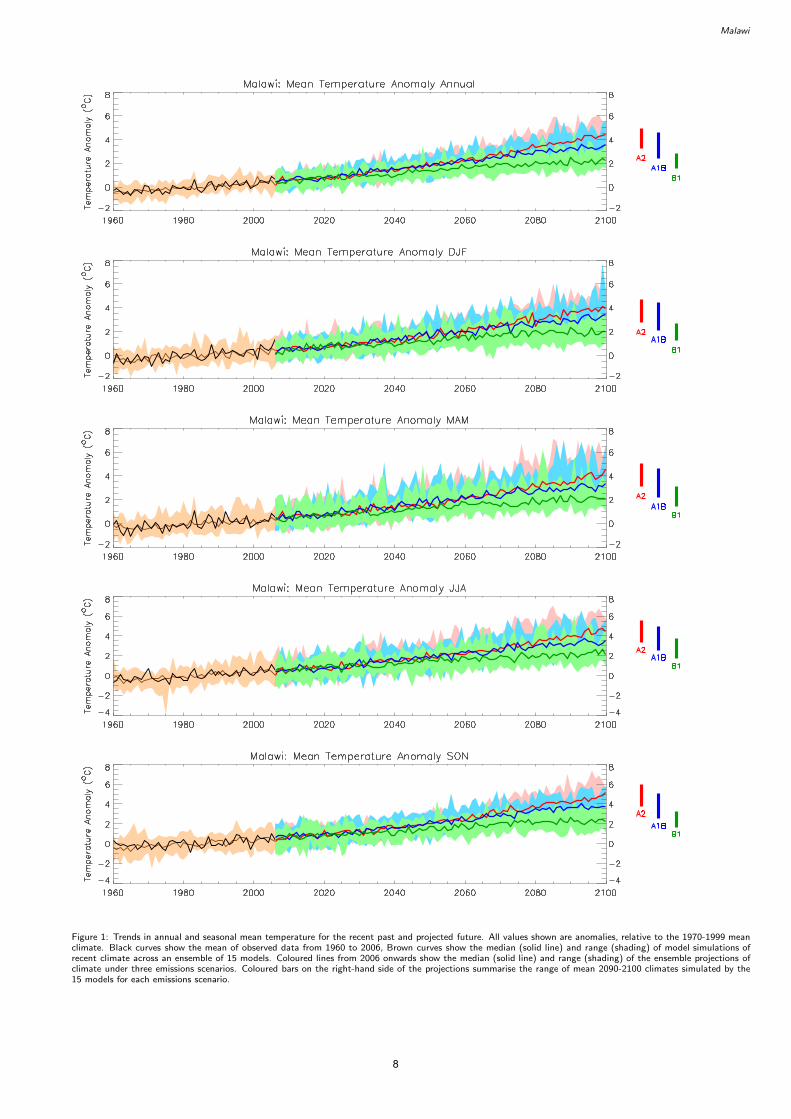
• The mean annual temperature is projected to increase by 1.1 to 3.0˚C by the 2060s, and 1.5 to 5.0˚C by the 2090s. Under a single emissions scenario, the projected changes from different models span a range of up to 2.1˚C.
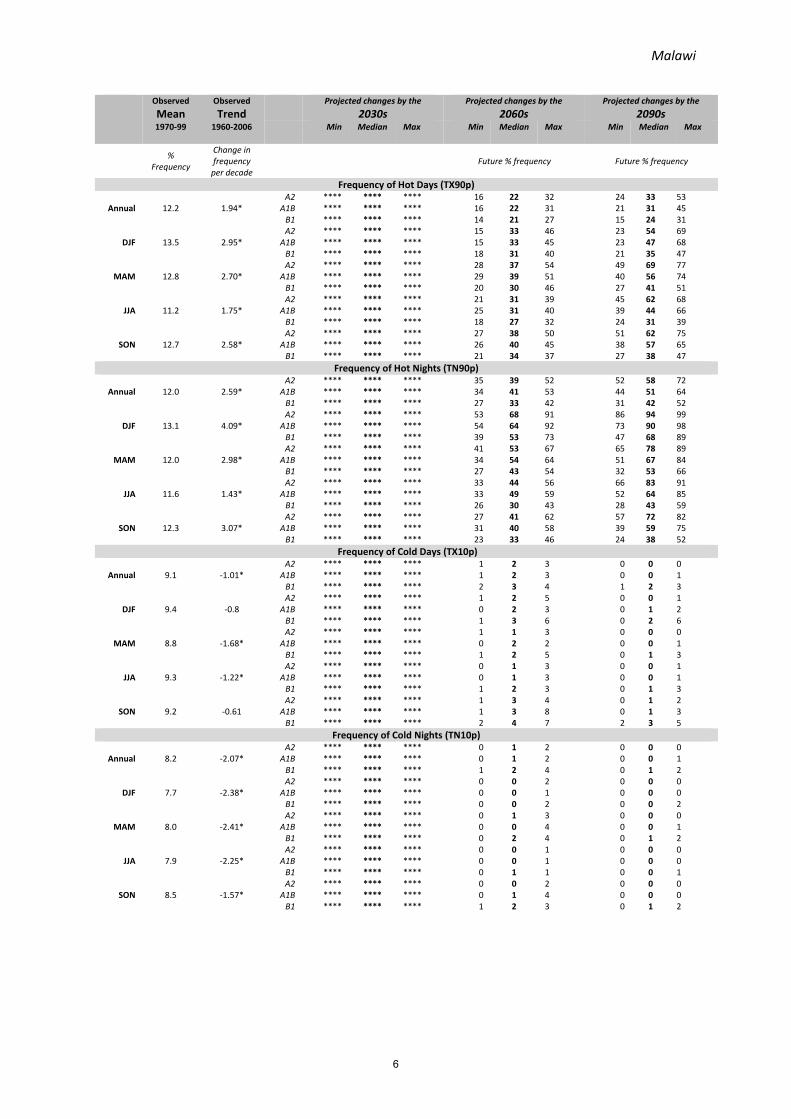
• All projections indicate substantial increases in the frequency of days and nights that are considered ‘hot’ in current climate.
o Annually, projections indicate that ‘hot’ days will occur on 14‐32% of days by the 2060s, and 15‐53% of days by the 2090s.
o Nights that are considered ‘hot’ for the annual climate of 1970‐99 are projected to increase more quickly that hot days, occurring on 27‐53% of nights by the 2060s and 31‐72% of nights by the 2090s. Nights that are considered hot for each season by 1970‐99 standards are projected to increase particularly rapidly in DJF, occurring on 47‐99% of nights in every season by the 2090s.
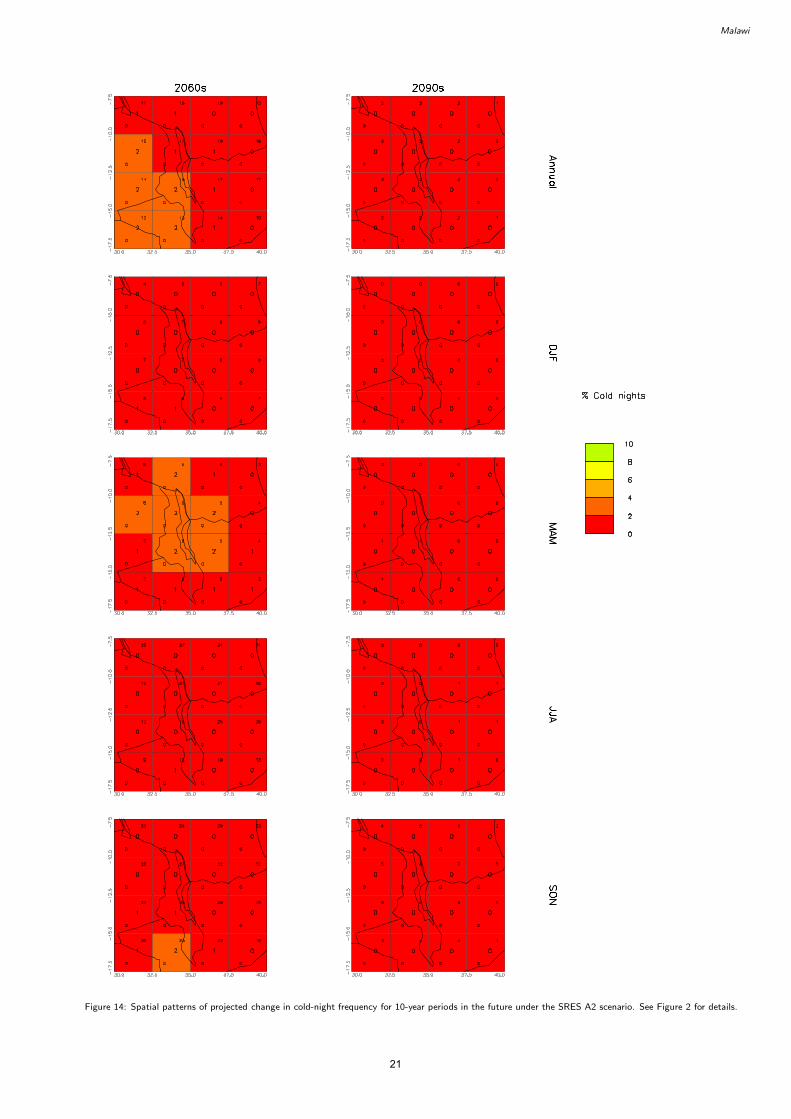
• All projections indicate decreases in the frequency of days and nights that are considered ‘cold’ in current climate. These events are expected to become exceedingly rare, and do not occur at all under the highest emissions scenario (A2) by the 2090s.
Precipitation
• Projections of mean rainfall do not indicate substantial changes in annual rainfall. The range of projections from different models is large and straddles both negative and positive changes (‐13% to +32%). Seasonally, the projections tend towards decreases in dry season rainfall (JJA and SON), and increases in wet season rainfall (DJF and MAM).
o Projected changes in JJA rainfall range from ‐77 to +48% with ensemble median changes of ‐5 to ‐18% and in SON, ‐63 to +40% with ensemble median values ‐7 to ‐20%.
o Projected changes in DJF rainfall range from ‐8 to +25% with ensemble median changes of 4 to +11% and in MAM, ‐17 to +99% with ensemble median values of +1 to +7%)
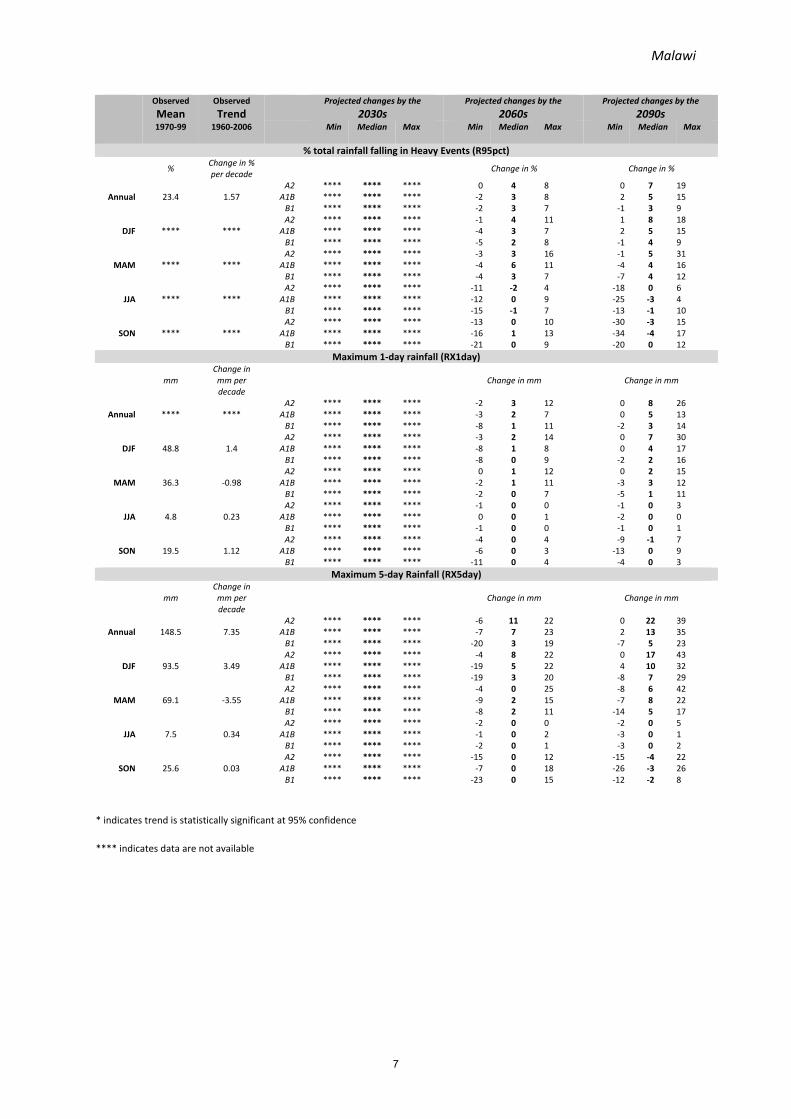
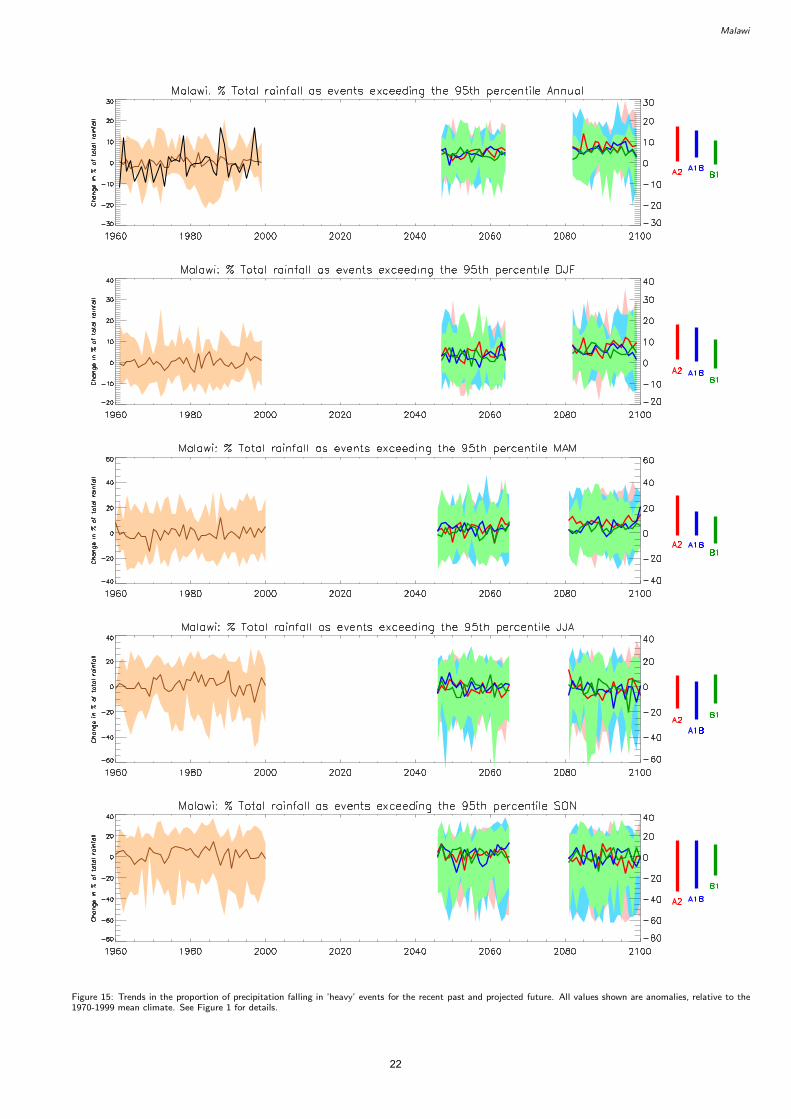
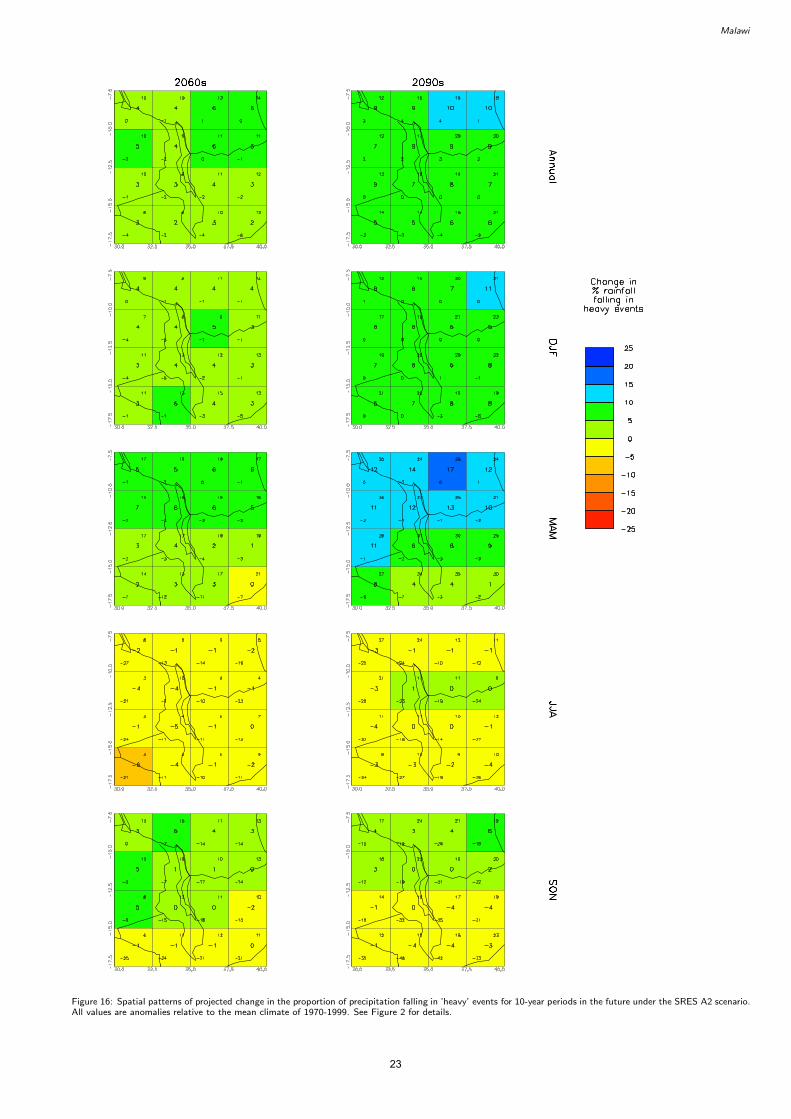
• Overall, the models consistently project increases in the proportion of rainfall that falls in heavy events in the annual average under the higher emissions scenarios (A2 and A1B), of up to 19% by the 2090s. These increases mainly arise from increases in heavy events in the wet‐seasons, DJF and MAM, and are partially offset by decreases in JJA and SON.
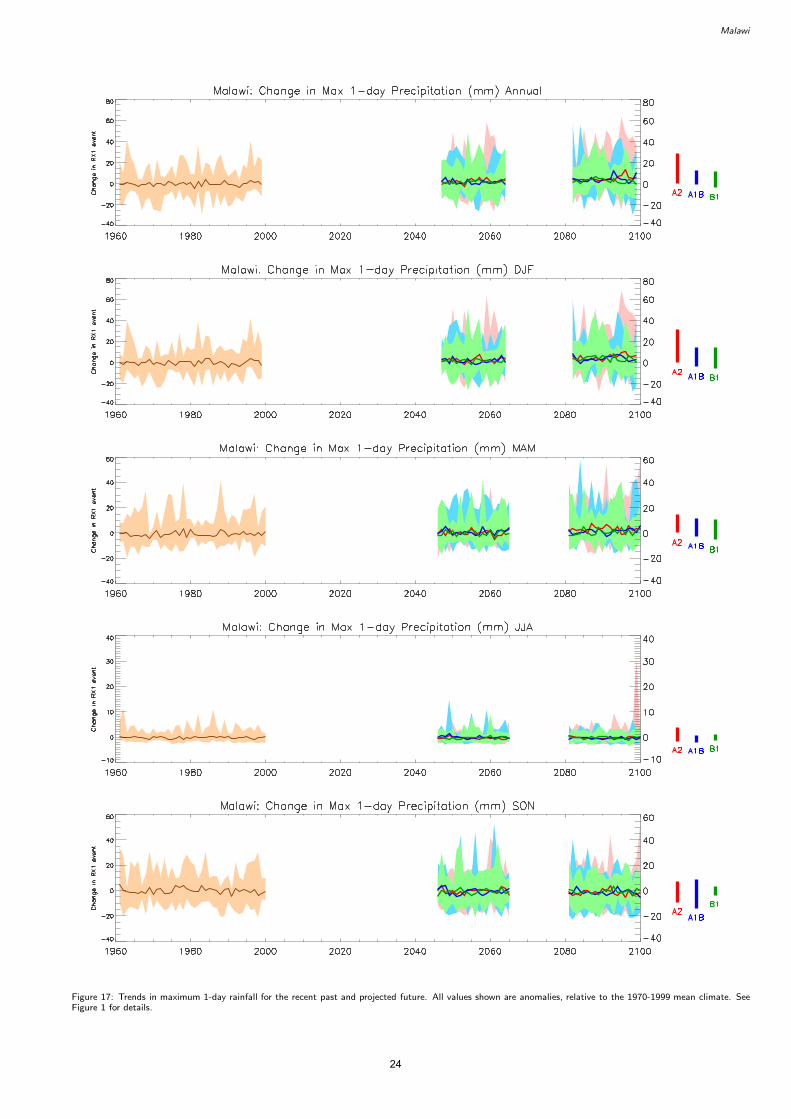
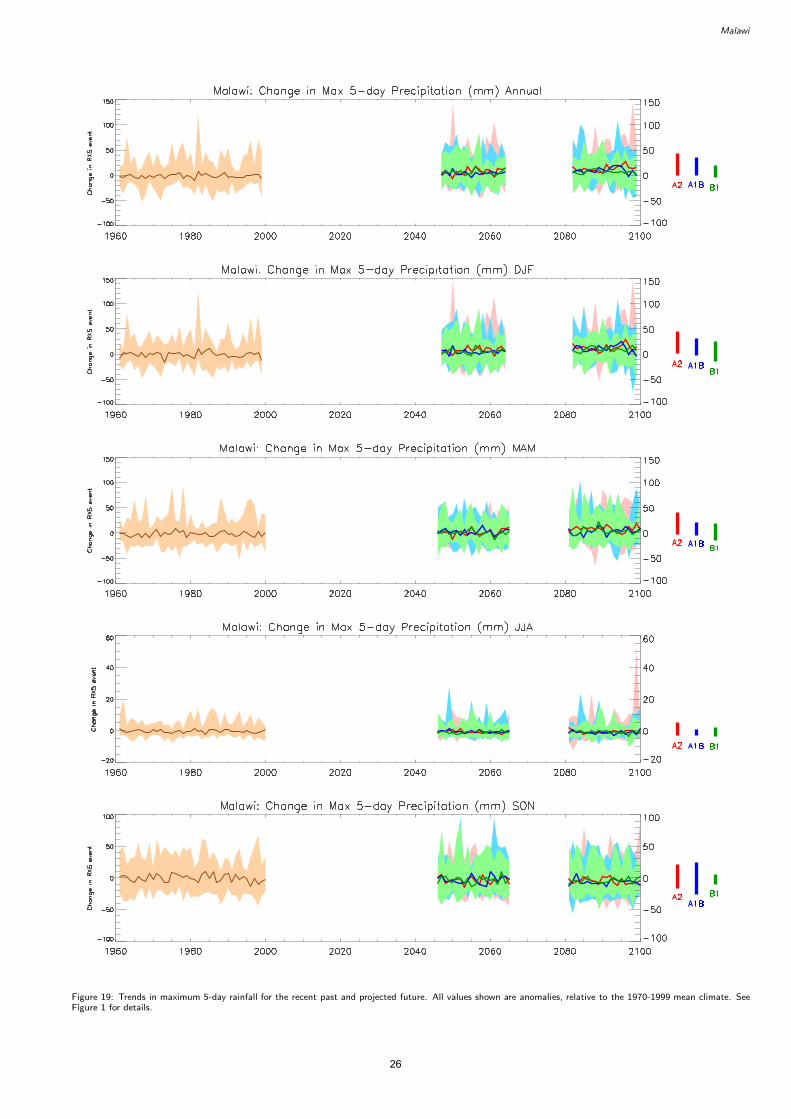
• The models consistently project increases in 1‐ and 5‐day rainfall maxima by the 2090s under the higher emissions scenarios, of up to 26mm in 1‐day events, and 39mm in 5‐day events. These also generally increase in DJF and MAM, but decrease in JJA and SON.
3

Malawi
Other Regional Climate Change Information
• Model simulations show wide disagreements in projected changes in the amplitude of future El Niño events. Malawi’s climate can be strongly influenced by ENSO, thus contributing to uncertainty in climate projections for this region.
• For further information on climate projections for Africa, see Christensen et al. (2007) IPCC Working Group I Report: ‘The Physical Science Basis’, Chapter 11 (Regional Climate projections): Section 11.2 (Africa).
4
Malawi
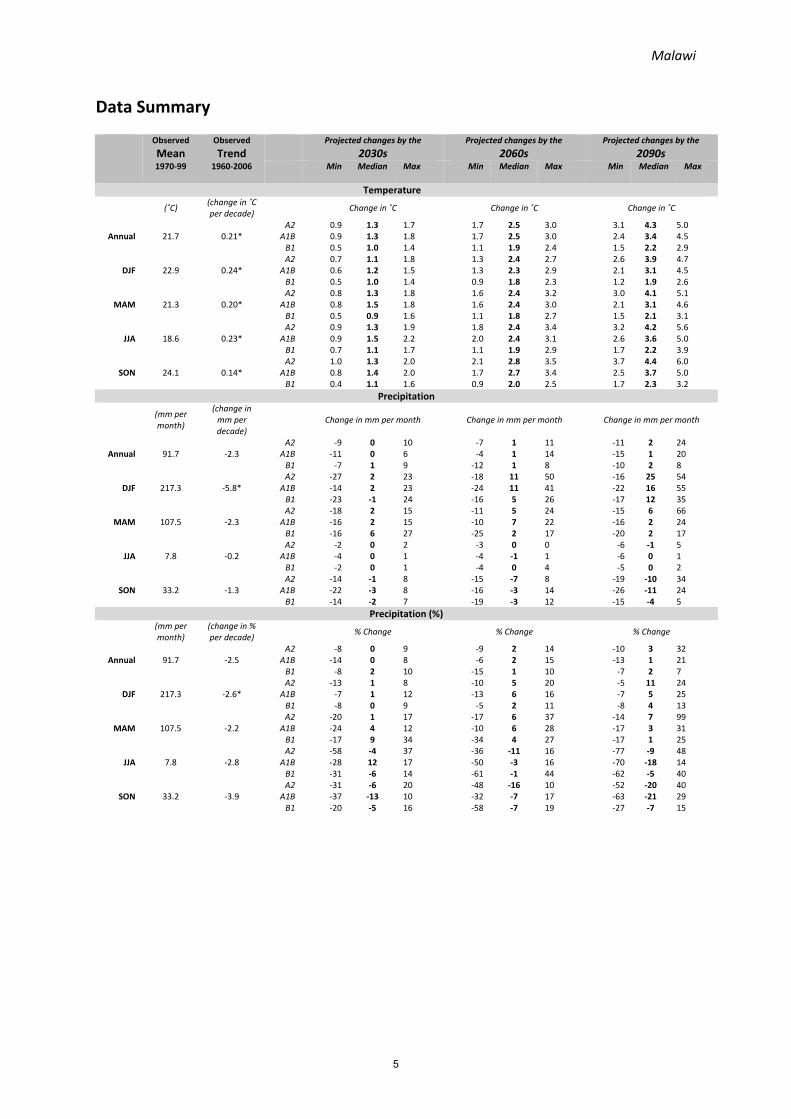
Data Summary
Observed
Mean 1970‐99
Observed
Trend 1960‐2006
Projected changes by the
2030s Projected changes by the
2060s Projected changes by the
2090s Min Median Max Min Median Max Min Median Max
Temperature
(˚C)
(change in ˚C per decade)
Change in ˚C Change in ˚C Change in ˚C
A2 0.9 1.3 1.7 1.7 2.5 3.0 3.1 4.3 5.0 Annual 21.7 0.21* A1B 0.9 1.3 1.8 1.7 2.5 3.0 2.4 3.4 4.5
B1 0.5 1.0 1.4 1.1 1.9 2.4 1.5 2.2 2.9 A2 0.7 1.1 1.8 1.3 2.4 2.7 2.6 3.9 4.7
DJF 22.9 0.24* A1B 0.6 1.2 1.5 1.3 2.3 2.9 2.1 3.1 4.5 B1 0.5 1.0 1.4 0.9 1.8 2.3 1.2 1.9 2.6 A2 0.8 1.3 1.8 1.6 2.4 3.2 3.0 4.1 5.1
MAM 21.3 0.20* A1B 0.8 1.5 1.8 1.6 2.4 3.0 2.1 3.1 4.6 B1 0.5 0.9 1.6 1.1 1.8 2.7 1.5 2.1 3.1 A2 0.9 1.3 1.9 1.8 2.4 3.4 3.2 4.2 5.6
JJA 18.6 0.23* A1B 0.9 1.5 2.2 2.0 2.4 3.1 2.6 3.6 5.0 B1 0.7 1.1 1.7 1.1 1.9 2.9 1.7 2.2 3.9 A2 1.0 1.3 2.0 2.1 2.8 3.5 3.7 4.4 6.0
SON 24.1 0.14* A1B 0.8 1.4 2.0 1.7 2.7 3.4 2.5 3.7 5.0 B1 0.4 1.1 1.6 0.9 2.0 2.5 1.7 2.3 3.2
Precipitation
(mm per month)
(change in mm per decade)
Change in mm per month Change in mm per month Change in mm per month
A2 ‐9 0 10 ‐7 1 11 ‐11 2 24 Annual 91.7 ‐2.3 A1B ‐11 0 6 ‐4 1 14 ‐15 1 20
B1 ‐7 1 9 ‐12 1 8 ‐10 2 8 A2 ‐27 2 23 ‐18 11 50 ‐16 25 54
DJF 217.3 ‐5.8* A1B ‐14 2 23 ‐24 11 41 ‐22 16 55 B1 ‐23 ‐1 24 ‐16 5 26 ‐17 12 35 A2 ‐18 2 15 ‐11 5 24 ‐15 6 66
MAM 107.5 ‐2.3 A1B ‐16 2 15 ‐10 7 22 ‐16 2 24 B1 ‐16 6 27 ‐25 2 17 ‐20 2 17 A2 ‐2 0 2 ‐3 0 0 ‐6 ‐1 5
JJA 7.8 ‐0.2 A1B ‐4 0 1 ‐4 ‐1 1 ‐6 0 1 B1 ‐2 0 1 ‐4 0 4 ‐5 0 2 A2 ‐14 ‐1 8 ‐15 ‐7 8 ‐19 ‐10 34
SON 33.2 ‐1.3 A1B ‐22 ‐3 8 ‐16 ‐3 14 ‐26 ‐11 24 B1 ‐14 ‐2 7 ‐19 ‐3 12 ‐15 ‐4 5
Precipitation (%)
(mm per month)
(change in % per decade)
% Change % Change % Change
A2 ‐8 0 9 ‐9 2 14 ‐10 3 32 Annual 91.7 ‐2.5 A1B ‐14 0 8 ‐6 2 15 ‐13 1 21
B1 ‐8 2 10 ‐15 1 10 ‐7 2 7 A2 ‐13 1 8 ‐10 5 20 ‐5 11 24
DJF 217.3 ‐2.6* A1B ‐7 1 12 ‐13 6 16 ‐7 5 25 B1 ‐8 0 9 ‐5 2 11 ‐8 4 13 A2 ‐20 1 17 ‐17 6 37 ‐14 7 99
MAM 107.5 ‐2.2 A1B ‐24 4 12 ‐10 6 28 ‐17 3 31 B1 ‐17 9 34 ‐34 4 27 ‐17 1 25 A2 ‐58 ‐4 37 ‐36 ‐11 16 ‐77 ‐9 48
JJA 7.8 ‐2.8 A1B ‐28 12 17 ‐50 ‐3 16 ‐70 ‐18 14 B1 ‐31 ‐6 14 ‐61 ‐1 44 ‐62 ‐5 40 A2 ‐31 ‐6 20 ‐48 ‐16 10 ‐52 ‐20 40
SON 33.2 ‐3.9 A1B ‐37 ‐13 10 ‐32 ‐7 17 ‐63 ‐21 29 B1 ‐20 ‐5 16 ‐58 ‐7 19 ‐27 ‐7 15
5
Malawi
Observed
Mean 1970‐99
Observed
Trend 1960‐2006
Projected changes by the
2030s Projected changes by the
2060s Projected changes by the
2090s Min Median Max Min Median Max Min Median Max
%
Frequency
Change in frequency per decade
Future % frequency Future % frequency
Frequency of Hot Days (TX90p)A2 **** **** **** 16 22 32 24 33 53
Annual 12.2 1.94* A1B **** **** **** 16 22 31 21 31 45 B1 **** **** **** 14 21 27 15 24 31 A2 **** **** **** 15 33 46 23 54 69
DJF 13.5 2.95* A1B **** **** **** 15 33 45 23 47 68 B1 **** **** **** 18 31 40 21 35 47 A2 **** **** **** 28 37 54 49 69 77
MAM 12.8 2.70* A1B **** **** **** 29 39 51 40 56 74 B1 **** **** **** 20 30 46 27 41 51 A2 **** **** **** 21 31 39 45 62 68
JJA 11.2 1.75* A1B **** **** **** 25 31 40 39 44 66 B1 **** **** **** 18 27 32 24 31 39 A2 **** **** **** 27 38 50 51 62 75
SON 12.7 2.58* A1B **** **** **** 26 40 45 38 57 65 B1 **** **** **** 21 34 37 27 38 47
Frequency of Hot Nights (TN90p)A2 **** **** **** 35 39 52 52 58 72
Annual 12.0 2.59* A1B **** **** **** 34 41 53 44 51 64 B1 **** **** **** 27 33 42 31 42 52 A2 **** **** **** 53 68 91 86 94 99
DJF 13.1 4.09* A1B **** **** **** 54 64 92 73 90 98 B1 **** **** **** 39 53 73 47 68 89 A2 **** **** **** 41 53 67 65 78 89
MAM 12.0 2.98* A1B **** **** **** 34 54 64 51 67 84 B1 **** **** **** 27 43 54 32 53 66 A2 **** **** **** 33 44 56 66 83 91
JJA 11.6 1.43* A1B **** **** **** 33 49 59 52 64 85 B1 **** **** **** 26 30 43 28 43 59 A2 **** **** **** 27 41 62 57 72 82
SON 12.3 3.07* A1B **** **** **** 31 40 58 39 59 75 B1 **** **** **** 23 33 46 24 38 52
Frequency of Cold Days (TX10p)A2 **** **** **** 1 2 3 0 0 0
Annual 9.1 ‐1.01* A1B **** **** **** 1 2 3 0 0 1 B1 **** **** **** 2 3 4 1 2 3 A2 **** **** **** 1 2 5 0 0 1
DJF 9.4 ‐0.8 A1B **** **** **** 0 2 3 0 1 2 B1 **** **** **** 1 3 6 0 2 6 A2 **** **** **** 1 1 3 0 0 0
MAM 8.8 ‐1.68* A1B **** **** **** 0 2 2 0 0 1 B1 **** **** **** 1 2 5 0 1 3 A2 **** **** **** 0 1 3 0 0 1
JJA 9.3 ‐1.22* A1B **** **** **** 0 1 3 0 0 1 B1 **** **** **** 1 2 3 0 1 3 A2 **** **** **** 1 3 4 0 1 2
SON 9.2 ‐0.61 A1B **** **** **** 1 3 8 0 1 3 B1 **** **** **** 2 4 7 2 3 5
Frequency of Cold Nights (TN10p)A2 **** **** **** 0 1 2 0 0 0
Annual 8.2 ‐2.07* A1B **** **** **** 0 1 2 0 0 1 B1 **** **** **** 1 2 4 0 1 2 A2 **** **** **** 0 0 2 0 0 0
DJF 7.7 ‐2.38* A1B **** **** **** 0 0 1 0 0 0 B1 **** **** **** 0 0 2 0 0 2 A2 **** **** **** 0 1 3 0 0 0
MAM 8.0 ‐2.41* A1B **** **** **** 0 0 4 0 0 1 B1 **** **** **** 0 2 4 0 1 2 A2 **** **** **** 0 0 1 0 0 0
JJA 7.9 ‐2.25* A1B **** **** **** 0 0 1 0 0 0 B1 **** **** **** 0 1 1 0 0 1 A2 **** **** **** 0 0 2 0 0 0
SON 8.5 ‐1.57* A1B **** **** **** 0 1 4 0 0 0 B1 **** **** **** 1 2 3 0 1 2
6
Malawi
Observed
Mean 1970‐99
Observed
Trend 1960‐2006
Projected changes by the
2030s Projected changes by the
2060s Projected changes by the
2090s Min Median Max Min Median Max Min Median Max
% total rainfall falling in Heavy Events (R95pct)
%
Change in % per decade
Change in % Change in %
A2 **** **** **** 0 4 8 0 7 19 Annual 23.4 1.57 A1B **** **** **** ‐2 3 8 2 5 15
B1 **** **** **** ‐2 3 7 ‐1 3 9 A2 **** **** **** ‐1 4 11 1 8 18
DJF **** **** A1B **** **** **** ‐4 3 7 2 5 15 B1 **** **** **** ‐5 2 8 ‐1 4 9 A2 **** **** **** ‐3 3 16 ‐1 5 31
MAM **** **** A1B **** **** **** ‐4 6 11 ‐4 4 16 B1 **** **** **** ‐4 3 7 ‐7 4 12 A2 **** **** **** ‐11 ‐2 4 ‐18 0 6
JJA **** **** A1B **** **** **** ‐12 0 9 ‐25 ‐3 4 B1 **** **** **** ‐15 ‐1 7 ‐13 ‐1 10 A2 **** **** **** ‐13 0 10 ‐30 ‐3 15
SON **** **** A1B **** **** **** ‐16 1 13 ‐34 ‐4 17 B1 **** **** **** ‐21 0 9 ‐20 0 12
Maximum 1‐day rainfall (RX1day)
mm
Change in mm per decade
Change in mm Change in mm
A2 **** **** **** ‐2 3 12 0 8 26 Annual **** **** A1B **** **** **** ‐3 2 7 0 5 13
B1 **** **** **** ‐8 1 11 ‐2 3 14 A2 **** **** **** ‐3 2 14 0 7 30
DJF 48.8 1.4 A1B **** **** **** ‐8 1 8 0 4 17 B1 **** **** **** ‐8 0 9 ‐2 2 16 A2 **** **** **** 0 1 12 0 2 15
MAM 36.3 ‐0.98 A1B **** **** **** ‐2 1 11 ‐3 3 12 B1 **** **** **** ‐2 0 7 ‐5 1 11 A2 **** **** **** ‐1 0 0 ‐1 0 3
JJA 4.8 0.23 A1B **** **** **** 0 0 1 ‐2 0 0 B1 **** **** **** ‐1 0 0 ‐1 0 1 A2 **** **** **** ‐4 0 4 ‐9 ‐1 7
SON 19.5 1.12 A1B **** **** **** ‐6 0 3 ‐13 0 9 B1 **** **** **** ‐11 0 4 ‐4 0 3
Maximum 5‐day Rainfall (RX5day)
mm
Change in mm per decade
Change in mm Change in mm
A2 **** **** **** ‐6 11 22 0 22 39 Annual 148.5 7.35 A1B **** **** **** ‐7 7 23 2 13 35
B1 **** **** **** ‐20 3 19 ‐7 5 23 A2 **** **** **** ‐4 8 22 0 17 43
DJF 93.5 3.49 A1B **** **** **** ‐19 5 22 4 10 32 B1 **** **** **** ‐19 3 20 ‐8 7 29 A2 **** **** **** ‐4 0 25 ‐8 6 42
MAM 69.1 ‐3.55 A1B **** **** **** ‐9 2 15 ‐7 8 22 B1 **** **** **** ‐8 2 11 ‐14 5 17 A2 **** **** **** ‐2 0 0 ‐2 0 5
JJA 7.5 0.34 A1B **** **** **** ‐1 0 2 ‐3 0 1 B1 **** **** **** ‐2 0 1 ‐3 0 2 A2 **** **** **** ‐15 0 12 ‐15 ‐4 22
SON 25.6 0.03 A1B **** **** **** ‐7 0 18 ‐26 ‐3 26 B1 **** **** **** ‐23 0 15 ‐12 ‐2 8
* indicates trend is statistically significant at 95% confidence
**** indicates data are not available
7
Malawi
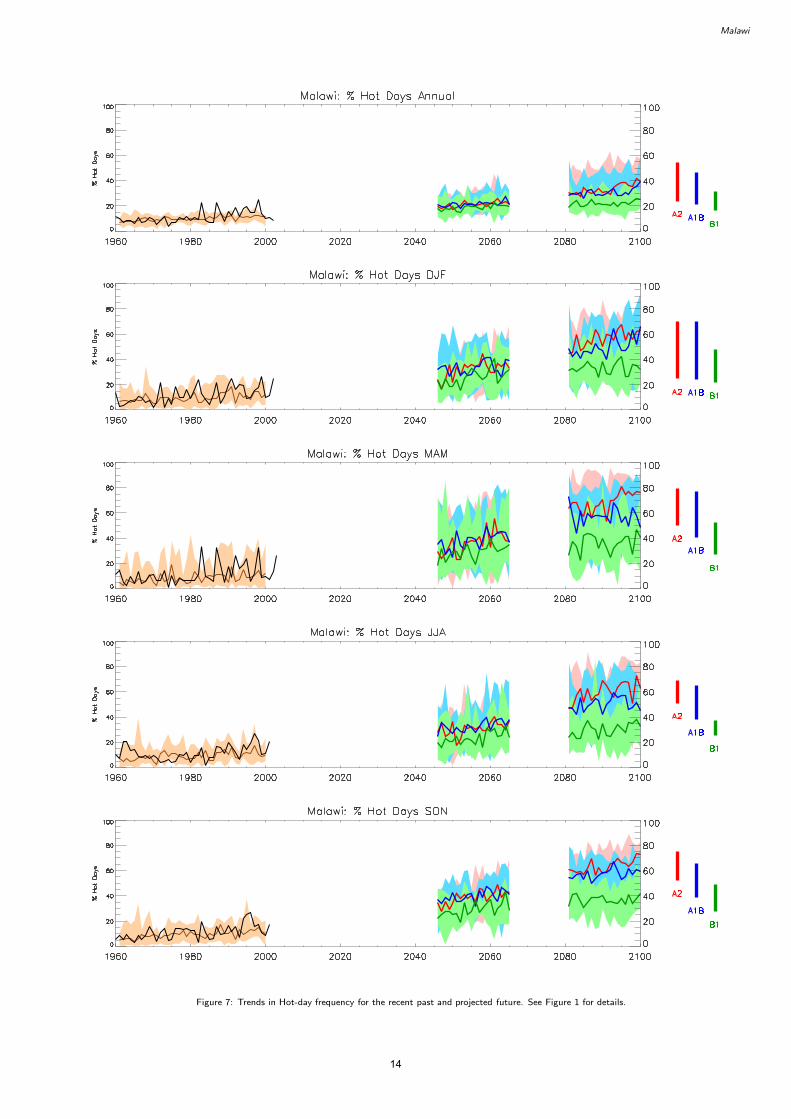
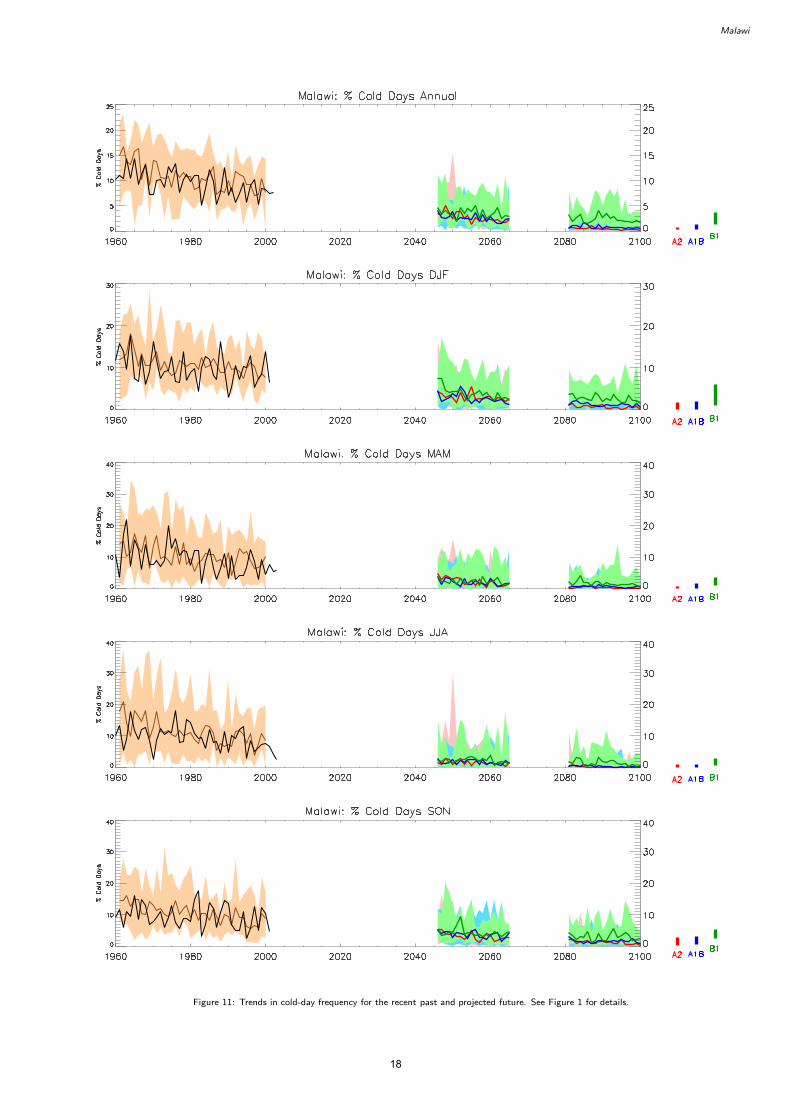
Figure 1: Trends in annual and seasonal mean temperature for the recent past and projected future. All values shown are anomalies, relative to the 1970-1999 meanclimate. Black curves show the mean of observed data from 1960 to 2006, Brown curves show the median (solid line) and range (shading) of model simulations ofrecent climate across an ensemble of 15 models. Coloured lines from 2006 onwards show the median (solid line) and range (shading) of the ensemble projections ofclimate under three emissions scenarios. Coloured bars on the right-hand side of the projections summarise the range of mean 2090-2100 climates simulated by the15 models for each emissions scenario.
8
Malawi
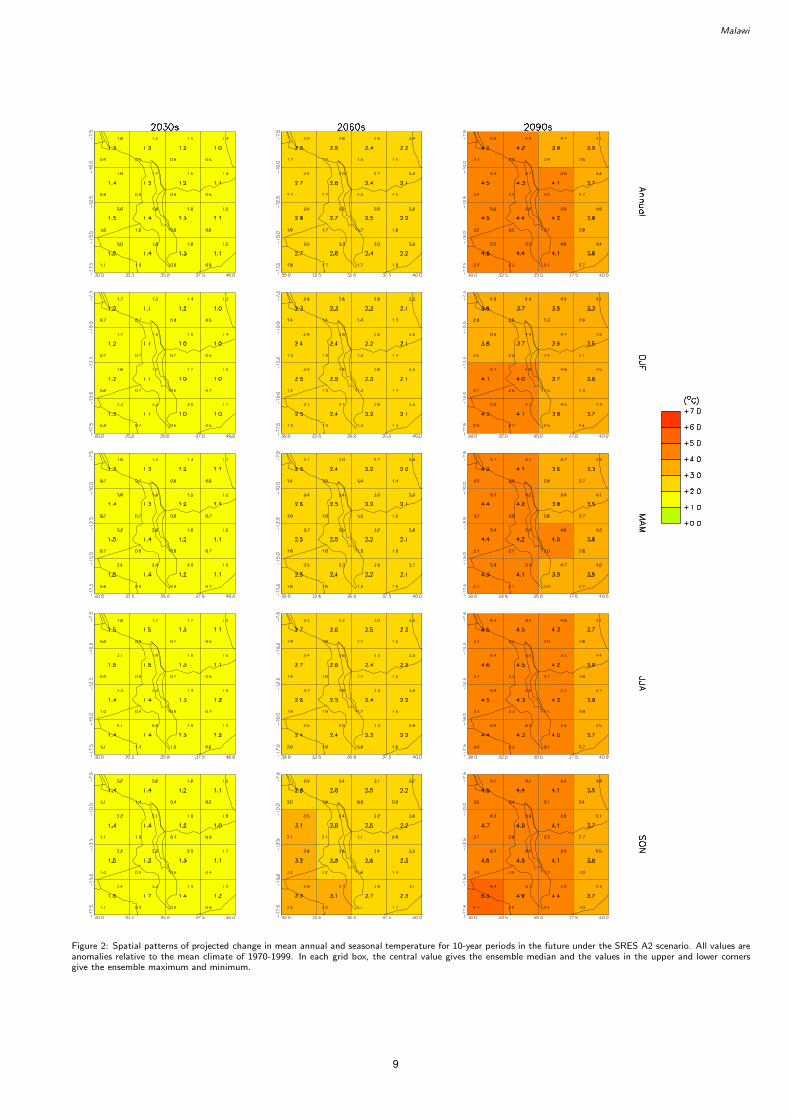
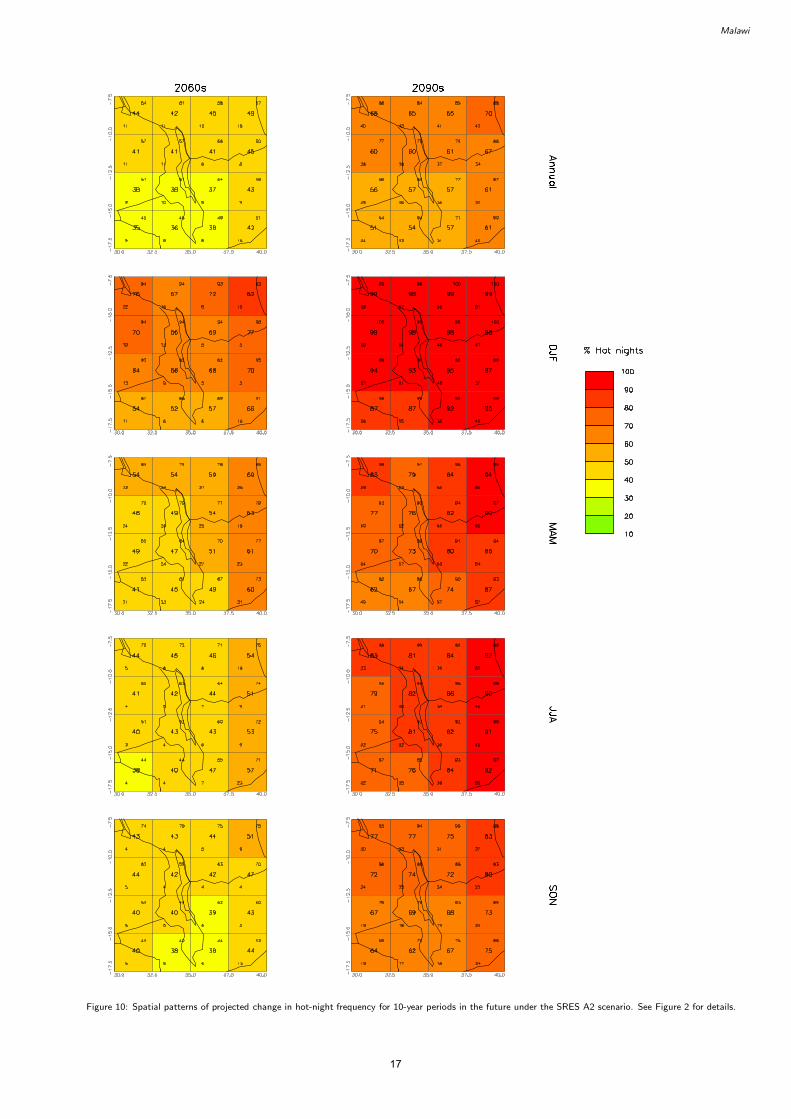
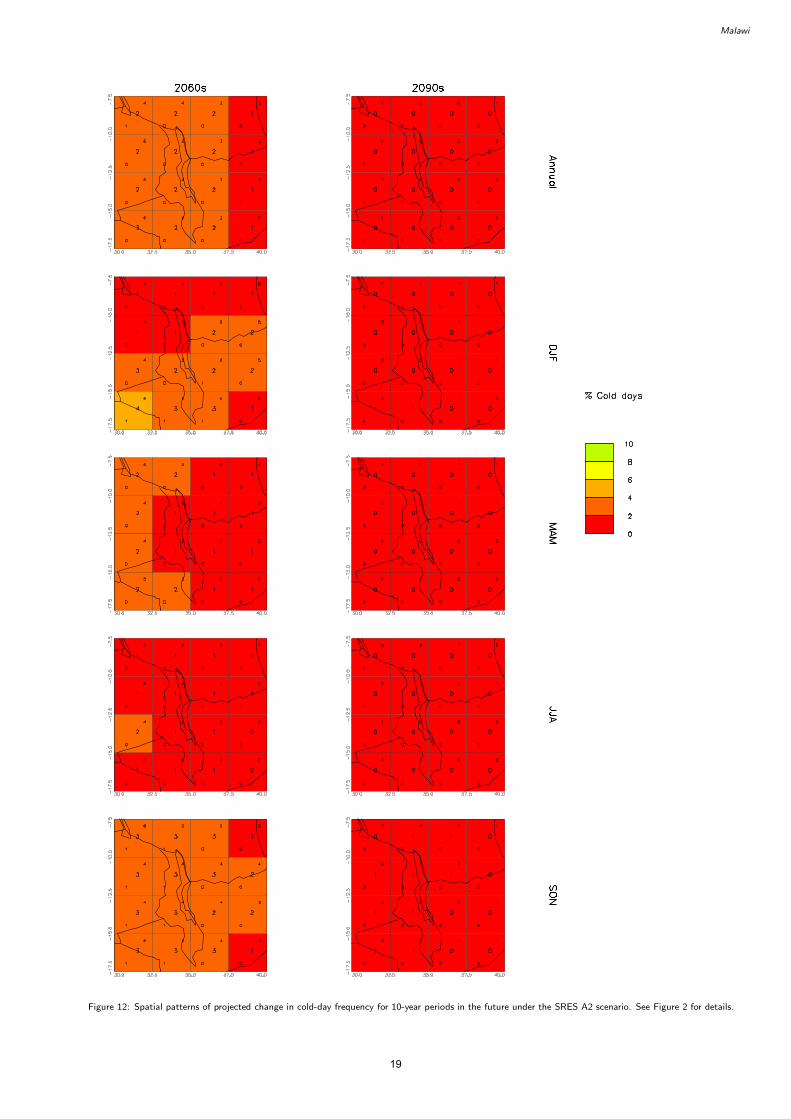
Figure 2: Spatial patterns of projected change in mean annual and seasonal temperature for 10-year periods in the future under the SRES A2 scenario. All values areanomalies relative to the mean climate of 1970-1999. In each grid box, the central value gives the ensemble median and the values in the upper and lower cornersgive the ensemble maximum and minimum.
9
Malawi
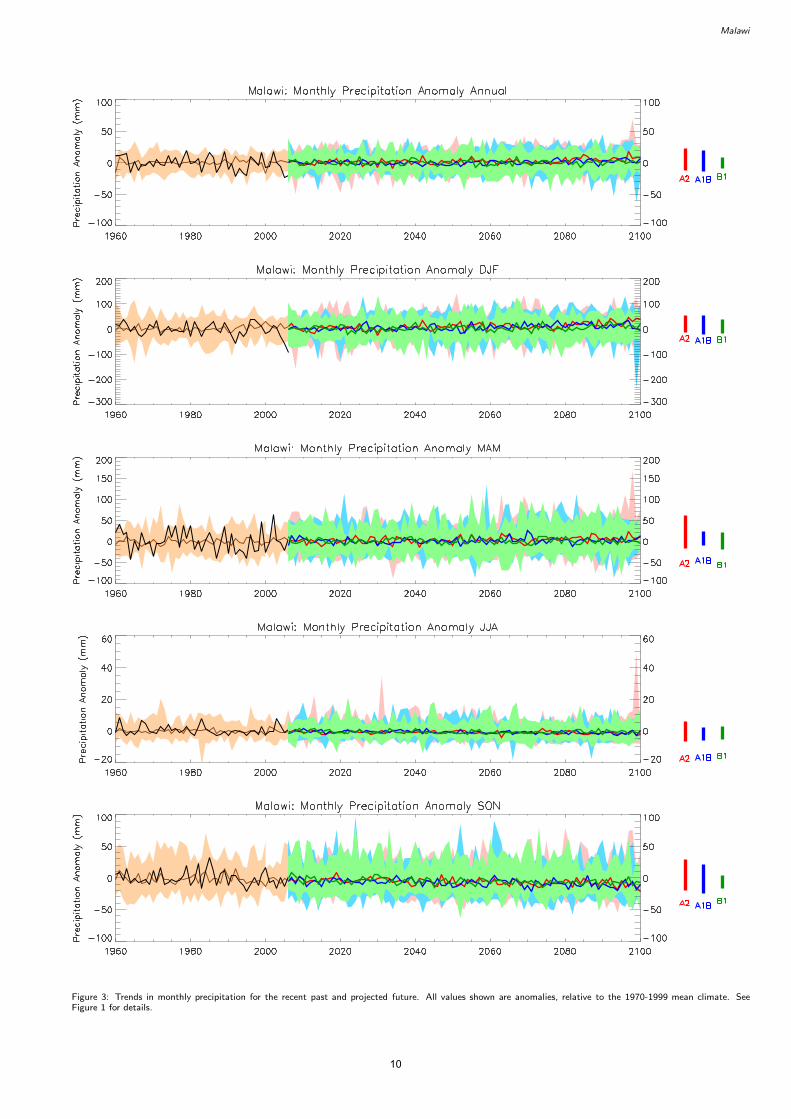
Figure 3: Trends in monthly precipitation for the recent past and projected future. All values shown are anomalies, relative to the 1970-1999 mean climate. SeeFigure 1 for details.
10
Malawi
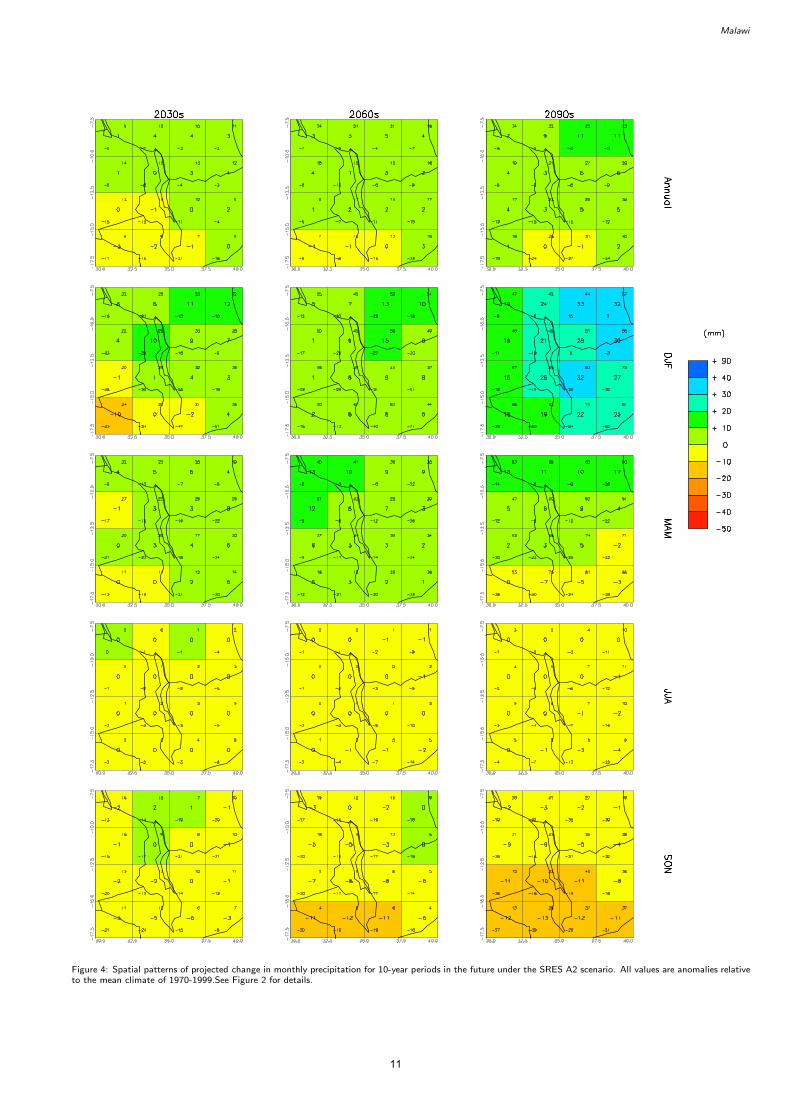
Figure 4: Spatial patterns of projected change in monthly precipitation for 10-year periods in the future under the SRES A2 scenario. All values are anomalies relativeto the mean climate of 1970-1999.See Figure 2 for details.
11
Malawi
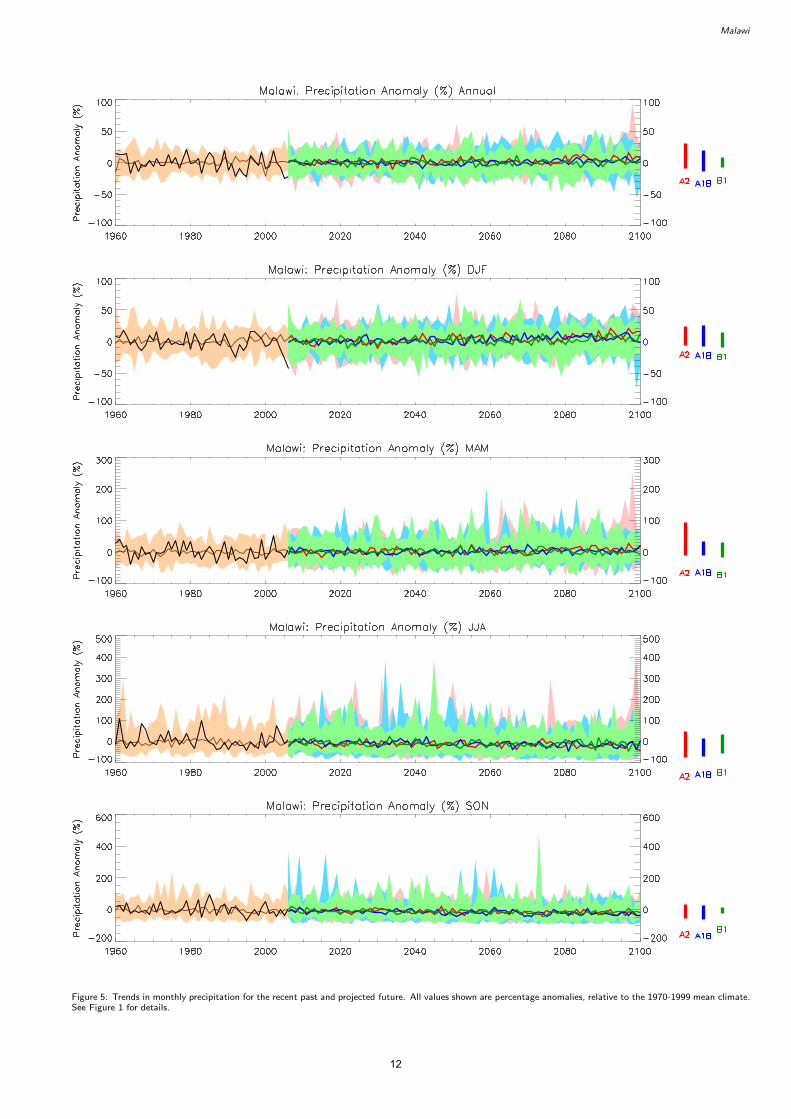
Figure 5: Trends in monthly precipitation for the recent past and projected future. All values shown are percentage anomalies, relative to the 1970-1999 mean climate.See Figure 1 for details.
12
Malawi
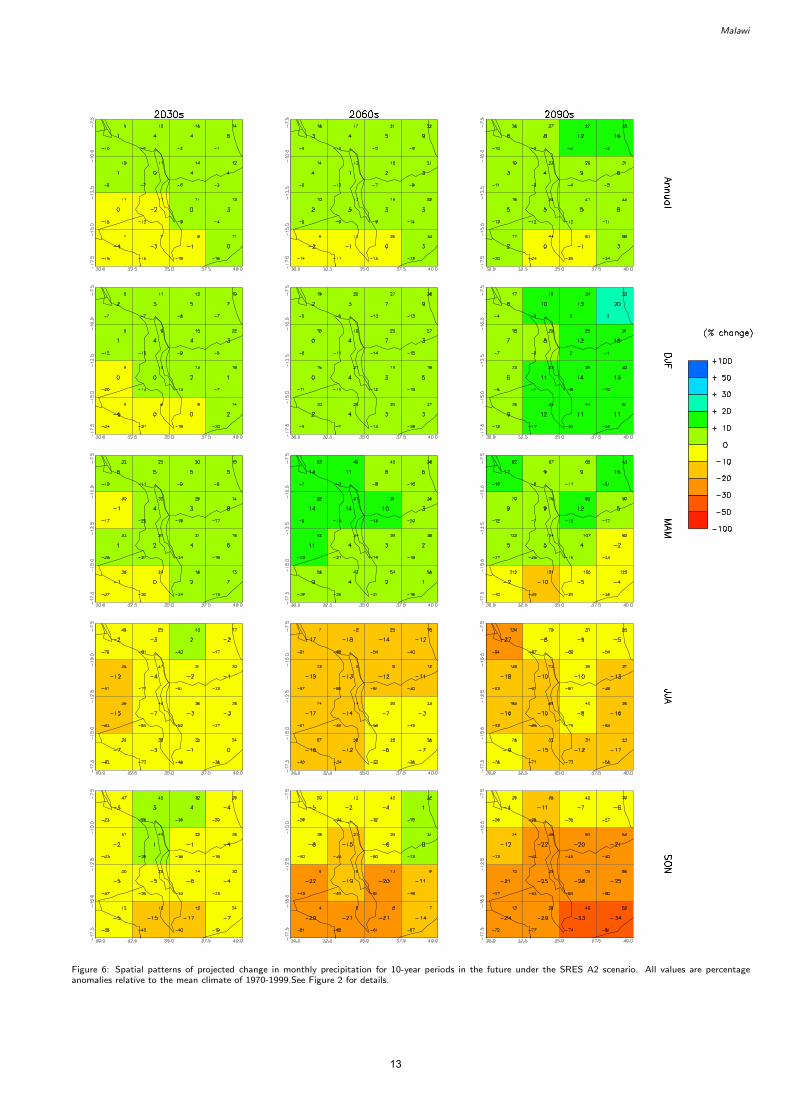
Figure 6: Spatial patterns of projected change in monthly precipitation for 10-year periods in the future under the SRES A2 scenario. All values are percentageanomalies relative to the mean climate of 1970-1999.See Figure 2 for details.
13
Malawi
Figure 7: Trends in Hot-day frequency for the recent past and projected future. See Figure 1 for details.
14

Malawi
Figure 8: Spatial patterns of projected change in Hot-day frequency for 10-year periods in the future under the SRES A2 scenario. See Figure 2 for details.
15

Malawi
Figure 9: Trends in hot-night frequency for the recent past and projected future. See Figure 1 for details.
16
Malawi
Figure 10: Spatial patterns of projected change in hot-night frequency for 10-year periods in the future under the SRES A2 scenario. See Figure 2 for details.
17
Malawi
Figure 11: Trends in cold-day frequency for the recent past and projected future. See Figure 1 for details.
18
Malawi
Figure 12: Spatial patterns of projected change in cold-day frequency for 10-year periods in the future under the SRES A2 scenario. See Figure 2 for details.
19
Malawi
Figure 13: Trends in cold-night frequency for the recent past and projected future. See Figure 1 for details.
20
Malawi
Figure 14: Spatial patterns of projected change in cold-night frequency for 10-year periods in the future under the SRES A2 scenario. See Figure 2 for details.
21
Malawi
Figure 15: Trends in the proportion of precipitation falling in ’heavy’ events for the recent past and projected future. All values shown are anomalies, relative to the1970-1999 mean climate. See Figure 1 for details.
22
Malawi
Figure 16: Spatial patterns of projected change in the proportion of precipitation falling in ’heavy’ events for 10-year periods in the future under the SRES A2 scenario.All values are anomalies relative to the mean climate of 1970-1999. See Figure 2 for details.
23
Malawi
Figure 17: Trends in maximum 1-day rainfall for the recent past and projected future. All values shown are anomalies, relative to the 1970-1999 mean climate. SeeFigure 1 for details.
24
Malawi
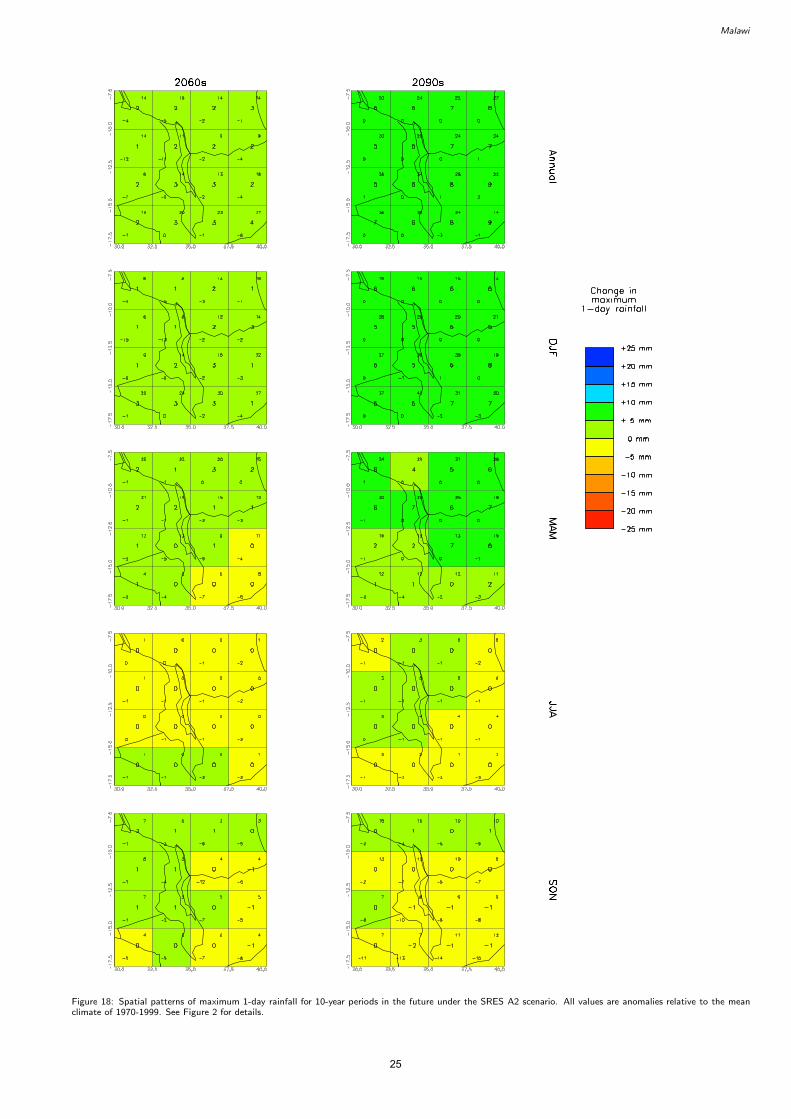
Figure 18: Spatial patterns of maximum 1-day rainfall for 10-year periods in the future under the SRES A2 scenario. All values are anomalies relative to the meanclimate of 1970-1999. See Figure 2 for details.
25
Malawi
Figure 19: Trends in maximum 5-day rainfall for the recent past and projected future. All values shown are anomalies, relative to the 1970-1999 mean climate. SeeFigure 1 for details.
26
Malawi
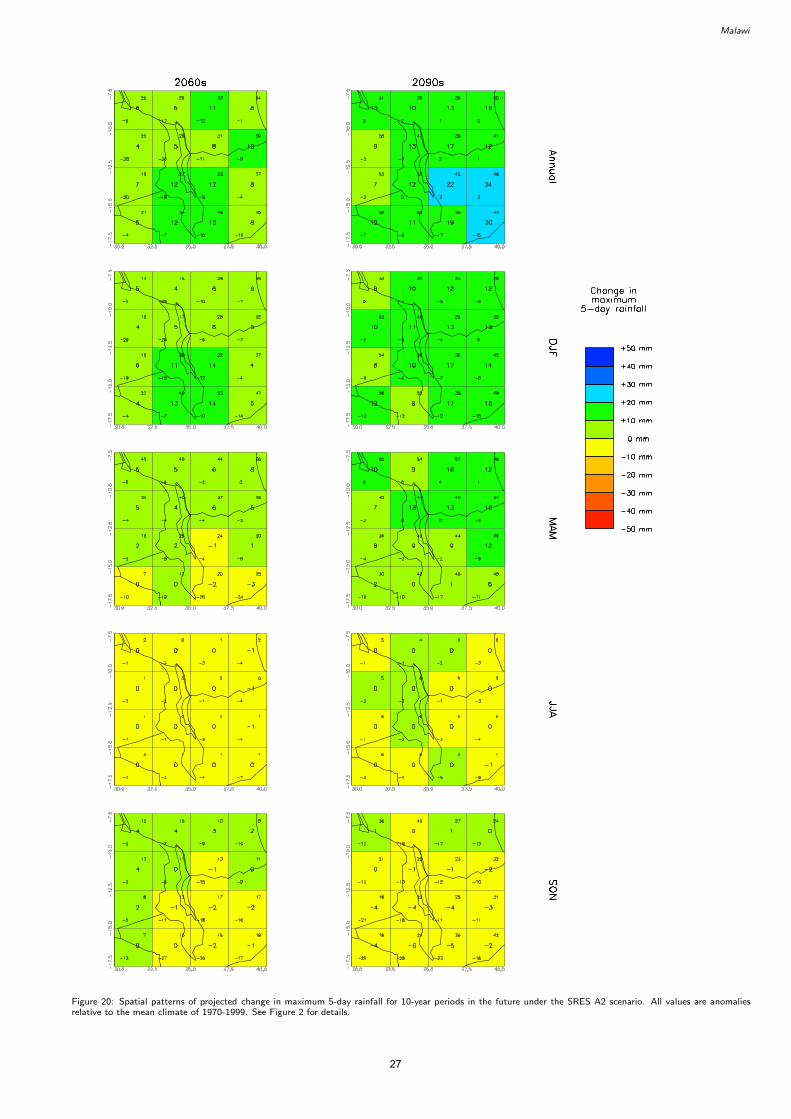
Figure 20: Spatial patterns of projected change in maximum 5-day rainfall for 10-year periods in the future under the SRES A2 scenario. All values are anomaliesrelative to the mean climate of 1970-1999. See Figure 2 for details.
27