Underwater noise modelling at the Creyke Beck … SEL ss 198 dB re 1 µPa2s TTS / fleeing response...
137
COMMERCIAL IN CONFIDENCE COMMERCIAL IN CONFIDENCE Submitted to: Submitted by: Helen Craven Tim Mason HaskoningDHV UK Ltd. Subacoustech Environmental Ltd Rightwell House Chase Mill Bretton Winchester Road Peterborough Bishop’s Waltham PE3 8DW Hampshire SO32 1AH Tel: +44 (0)1733 336 124 Tel: +44 (0)1489 892 881 E-mail: [email protected] E-mail: [email protected] Website: www.royalhaskoningdhv.com Website: www.subacoustech.com Underwater noise modelling at the Creyke Beck offshore wind farms, Dogger Bank R Barham, T Mason 13 April 2018 Subacoustech Environmental Report No. P223R0101 Document No. Date Written Approved Distribution P223R0101 13/04/2018 R Barham T Mason Helen Craven (HaskoningDHV) This report is a controlled document. The report documentation page lists the version number, record of changes, referencing information, abstract and other documentation details.
Transcript of Underwater noise modelling at the Creyke Beck … SEL ss 198 dB re 1 µPa2s TTS / fleeing response...

COMMERCIAL IN CONFIDENCE
COMMERCIAL IN CONFIDENCE
Submitted to: Submitted by:
Helen Craven Tim Mason
HaskoningDHV UK Ltd. Subacoustech Environmental Ltd
Rightwell House Chase Mill
Bretton Winchester Road
Peterborough Bishop’s Waltham
PE3 8DW Hampshire
SO32 1AH
Tel: +44 (0)1733 336 124 Tel: +44 (0)1489 892 881
E-mail: [email protected] E-mail: [email protected]
Website: www.royalhaskoningdhv.com Website: www.subacoustech.com
Underwater noise modelling at the
Creyke Beck offshore wind farms,
Dogger Bank
R Barham, T Mason
13 April 2018
Subacoustech Environmental Report No.
P223R0101
Document No. Date Written Approved Distribution
P223R0101 13/04/2018 R Barham T Mason Helen Craven (HaskoningDHV)
This report is a controlled document. The report documentation page lists the version number, record of changes, referencing information, abstract and other documentation details.
COMMERCIAL IN CONFIDENCE
Underwater noise modelling at the Creyke Beck offshore wind farms, Dogger Bank
Subacoustech Environmental Ltd. I
Document Ref: P223R0101
COMMERCIAL IN CONFIDENCE
List of contents
List of contents ........................................................................................................................................ 1
1 Introduction ...................................................................................................................................... 1
2 Assessment criteria ......................................................................................................................... 3
2.1 Background ............................................................................................................................. 3
2.2 Criteria from the NPL Report ................................................................................................... 3
2.3 Impacts on marine mammals (NMFS, 2016) .......................................................................... 4
2.3.1 Available literature ........................................................................................................... 4
2.3.2 Weighted source levels ................................................................................................... 5
2.4 Impacts on fish (Popper et al. 2014) ....................................................................................... 6
3 Modelling methodology ................................................................................................................... 8
3.1 NPL modelling ......................................................................................................................... 8
3.2 Subacoustech Environmental modelling ................................................................................. 8
3.2.1 Modelling location............................................................................................................ 9
3.2.2 Modelling input parameters ............................................................................................. 9
3.3 Results of original and revised modelling comparison .......................................................... 11
3.3.1 Model comparison ......................................................................................................... 11
3.3.2 Modelling confidence .................................................................................................... 14
4 Modelling results ........................................................................................................................... 16
4.1 Previously considered criteria ............................................................................................... 16
4.2 NMFS (2016) impact ranges ................................................................................................. 19
4.2.1 Discussion ..................................................................................................................... 23
4.3 Popper et al. (2014) impact ranges ....................................................................................... 25
5 Summary and conclusions ............................................................................................................ 27
References ............................................................................................................................................ 28
Appendix A Complete modelling results ........................................................................................... 30
A.1 Creyke Beck A, location ID6 ................................................................................................. 34
A.2 Creyke Beck A, location ID11 ............................................................................................... 43
A.3 Creyke Beck B, location ID6 ................................................................................................. 52
A.4 Creyke Beck B, location ID13 ............................................................................................... 61
Appendix B Modelling figures ........................................................................................................... 70
B.1 Creyke Beck A, location ID6 ................................................................................................. 79
B.2 Creyke Beck A, location ID11 ............................................................................................... 93
B.3 Creyke Beck B, location ID6 ............................................................................................... 107
B.4 Creyke Beck B, location ID13 ............................................................................................. 121
Report documentation page ................................................................................................................ 135

COMMERCIAL IN CONFIDENCE
Underwater noise modelling at the Creyke Beck offshore wind farms, Dogger Bank
Subacoustech Environmental Ltd. 1
Document Ref: P223R0101
COMMERCIAL IN CONFIDENCE
1 Introduction
Underwater noise propagation modelling was carried out by the National Physical Laboratory (NPL)
(Theobald et al. 2012, hereafter the “NPL Report”) to assess the effects of noise from the construction
of the Creyke Beck offshore wind farms, part of the Dogger Bank development area.
Since the NPL modelling was completed, new noise thresholds and criteria have been developed by
the US National Marine Fisheries Service (NMFS, 2016) for impacts on marine mammals and Popper
et al. (2014) for impact on fish. To obtain impact ranges using these criteria at Creyke Beck, additional
modelling has been carried out by Subacoustech Environmental.
The modelling undertaken by Subacoustech Environmental has sought to replicate the results of
modelling by NPL as closely as possible, for equivalent inputs and scenarios. Initially Subacoustech’s
modelling was run to verify that results closely matched the NPL predicted ranges under the original
scenarios. The results were then re-analysed to produce new ranges based on the up-to-date criteria.
In addition to these new criteria, additional modelling was carried out by Subacoustech Environmental
to estimate noise levels produced by larger hammers using greater blow energies than those previously
modelled.
A map of the Creyke Beck sites including the modelling locations, is shown in Figure 1-1.
This report assumes familiarity with basic underwater acoustical concepts and metrics.

COMMERCIAL IN CONFIDENCE
Underwater noise modelling at the Creyke Beck offshore wind farms, Dogger Bank
Subacoustech Environmental Ltd. 2
Document Ref: P223R0101
COMMERCIAL IN CONFIDENCE
Figure 1-1 Overview map showing the windfarm boundaries and the approximate locations used for
the modelling
COMMERCIAL IN CONFIDENCE
Underwater noise modelling at the Creyke Beck offshore wind farms, Dogger Bank
Subacoustech Environmental Ltd. 3
Document Ref: P223R0101
COMMERCIAL IN CONFIDENCE
2 Assessment criteria
2.1 Background
Over the past 20 years it has become increasingly evident that noise from human activities in and
around underwater environments have the potential to cause adverse impacts on marine species in the
area. The extent to which intense underwater sound might cause an adverse impact to a species is
dependent upon the incident sound level, sound frequency, duration of exposure and/or repetition rate
of an impulsive sound (Hastings and Popper, 2005), as well as the sensitivity of the species. As a result,
scientific interest in the hearing abilities of aquatic animal species has increased. Studies are primarily
based on evidence from high intensity sources of underwater noise such as blasting or impact piling,
as these sources are likely to have the greatest environmental impact and the clearest observable
effects, although there has been more interest in chronic noise exposure over the last ten years.
For this study, various criteria have been used, covering the values used in the NPL Report and the
more up to date studies from NMFS (2016) for marine mammals and Popper et al. (2014) for fish.
2.2 Criteria from the NPL Report
The following criteria were used in the NPL Report and have been used to give a direct comparison
between the NPL modelling and the INSPIRE modelling carried out for this study.
• Southall et al. (2007) for species of cetaceans and pinnipeds;
• Lucke et al. (2009) for harbour porpoises;
• Popper et al. (2006) and Carlson et al. (2007) using peak SPLs for injury in fish;
• Halvorsen et al. (2011) for SELcum for injury in fish; and
• McCauley et al. (2000) and Pearson et al. (1992) for behavioural response in fish.
These criteria are summarised in Table 2-1 to Table 2-5 as they appear in the NPL Report. It should be
noted that the Southall and Lucke criteria presented in the NPL Report, and here as a comparison, for
marine mammals are only for single strike SEL.
Effect Criteria
Instantaneous injury / PTS SPLpeak 200 dB re 1 µPa
SELss 179 dB re 1 µPa2s
TTS / fleeing response SPLpeak 194 dB re 1 µPa
SELss 164 dB re 1 µPa2s
Possible avoidance from area SPLpeak 168 dB re 1 µPa
SELss 145 dB re 1 µPa2s
Table 2-1 Criteria for assessing harbour porpoise impacts as presented in the NPL report. These have been derived from Lucke et al. (2009)
Effect Criteria
Instantaneous injury / PTS SPLpeak 230 dB re 1 µPa
Mmf weighted SELss 198 dB re 1 µPa2s
TTS / fleeing response SPLpeak 224 dB re 1 µPa
Mmf weighted SELss 183 dB re 1 µPa2s
Likely avoidance from area SELss 170 dB re 1 µPa2s
Possible avoidance from area SELss 160 dB re 1 µPa2s
Table 2-2 Criteria for assessing mid-frequency (MF) cetaceans impacts as presented in the NPL report. These have been derived from Southall et al. (2007)

COMMERCIAL IN CONFIDENCE
Underwater noise modelling at the Creyke Beck offshore wind farms, Dogger Bank
Subacoustech Environmental Ltd. 4
Document Ref: P223R0101
COMMERCIAL IN CONFIDENCE
Effect Criteria
Instantaneous injury / PTS SPLpeak 230 dB re 1 µPa
Mlf weighted SELss 198 dB re 1 µPa2s
TTS / fleeing response SPLpeak 224 dB re 1 µPa
Mlf weighted SELss 183 dB re 1 µPa2s
Likely avoidance from area SELss 152 dB re 1 µPa2s
Possible avoidance from area SELss 142 dB re 1 µPa2s
Table 2-3 Criteria for assessing low-frequency (LF) cetaceans impacts as presented in the NPL report. These have been derived from Southall et al. (2007)
Effect Criteria
Instantaneous injury / PTS SPLpeak 218 dB re 1 µPa
Mpw weighted SELss 186 dB re 1 µPa2s
TTS / fleeing response SPLpeak 212 dB re 1 µPa
Mpw weighted SELss 171 dB re 1 µPa2s
Table 2-4 Criteria for assessing pinnipeds (in water) impacts as presented in the NPL report. These are from Southall et al. (2007)
Effect Criteria
Instantaneous injury / PTS SPLpeak 206 dB re 1 µPa
SELcum 211 dB re 1 µPa2s
Possible moderate to strong avoidance SPLpeak 168 – 173 dB re 1 µPa
Startle response or C-turn reaction SPLpeak 200 dB re 1 µPa
Table 2-5 Criteria for assessing fish impacts as presented in the NPL report. These are from Popper et al. (2006), Carlson et al. (2007), Halvorsen et al. (2011), McCauley et al. (2000) and Pearson et al.
(1992)
2.3 Impacts on marine mammals (NMFS, 2016)
2.3.1 Available literature
Since it was published, Southall et al. (2007) has been the source of the most widely used criteria to
assess the effects of underwater noise on marine mammals and was the main criteria, along with Lucke
et al. (2009), used in the NPL Report for marine mammals. NMFS (2016) was co-authored by many of
the same authors from the Southall et al. (2007) paper and effectively updates its criteria for assessing
the risk of auditory injury.
Similarly to the Southall et al. (2007) criteria, the NMFS (2016) guidance groups marine mammals into
hearing groups and applies weighting filters to the noise to approximate the hearing sensitivity of the
receptor. It should be noted that the filters used in Southall et al. (2007) differ from those used in NMFS
(2016).
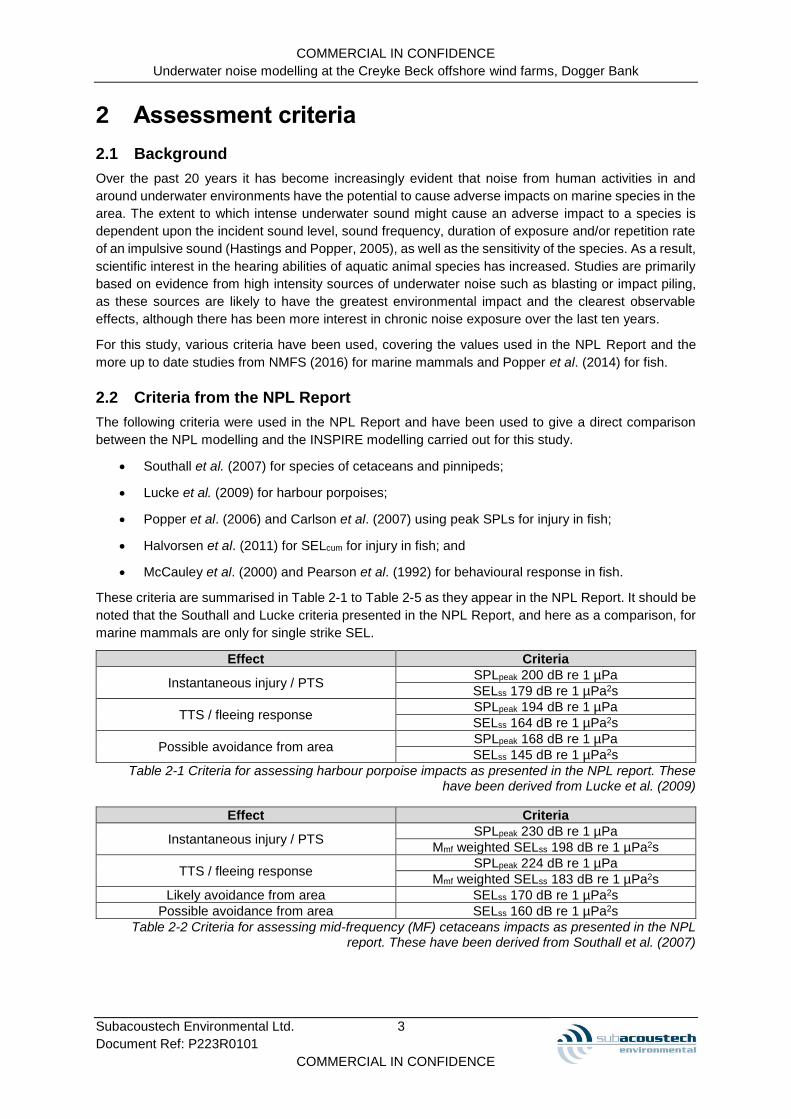
The hearing groups given in the NMFS (2016) guidance are summarised in Table 2-6 and Figure 2-1.
A further hearing groups for Otariid Pinnipeds is also given for sea lions and fur seals, however this has
not been used in this study as those species are not commonly found in the areas surrounding Dogger
Bank.
Hearing group Example species Generalised
hearing range
Low Frequency (LF) cetaceans
Baleen whales 7 Hz to 35 kHz
Mid Frequency (MF) cetaceans
Dolphins, Toothed Whales, Beaked Whales, Bottlenose Whales (including Bottlenose Dolphin)
150 Hz to 160 kHz
High Frequency (HF) cetaceans
True Porpoises (including Harbour Porpoise) 275 Hz to 160 kHz
Phocid Pinnipeds (PW) (underwater)
True Seals (including Harbour Seal) 50 Hz to 86 kHz
Table 2-6 Marine mammal hearing groups (from NMFS, 2016)
COMMERCIAL IN CONFIDENCE
Underwater noise modelling at the Creyke Beck offshore wind farms, Dogger Bank
Subacoustech Environmental Ltd. 5
Document Ref: P223R0101
COMMERCIAL IN CONFIDENCE
Figure 2-1 Auditory weighting functions for low frequency (LF) cetaceans, mid frequency (MF)
cetaceans, high frequency (HF) cetaceans, and phocid pinnipeds (PW) (underwater) (from NMFS, 2016)
NFMS (2016) presents single strike, unweighted peak criteria (SPLpeak) and cumulative (i.e. more than
a single impulsive sound), weighted sound exposure criteria (SELcum) for both permanent threshold shift
(PTS) where unrecoverable hearing damage may occur and temporary threshold shift (TTS) where a
temporary reduction in hearing sensitivity may occur in individual receptors. It should be noted that
these cannot be compared like-for-like with criteria in the original ES as cumulative SELs were not
considered for marine mammals.
Table 2-7 presents the NMFS (2016) criteria used in this study for each of the key marine mammal
hearing groups.
Impulsive noise PTS criteria TTS criteria
Functional Group
SELcum (weighted)
dB re 1 µPa2s
SPLpeak
(unweighted) dB re 1 µPa
SELcum (weighted)
dB re 1 µPa2s
SPLpeak
(unweighted) dB re 1 µPa
LF Cetaceans 183 219 168 213
MF Cetaceans 185 230 170 224
HF Cetaceans 155 202 140 196
PW Pinnipeds 185 218 170 212
Table 2-7 Assessment criteria for marine mammals from NMFS (2016) for impulsive noise
2.3.2 Weighted source levels
To undertake the modelling for the NMFS (2016) criteria with regards to the weighted SELcum criteria,
the source levels were first adjusted using the auditory weighting functions shown in Figure 2-1. This
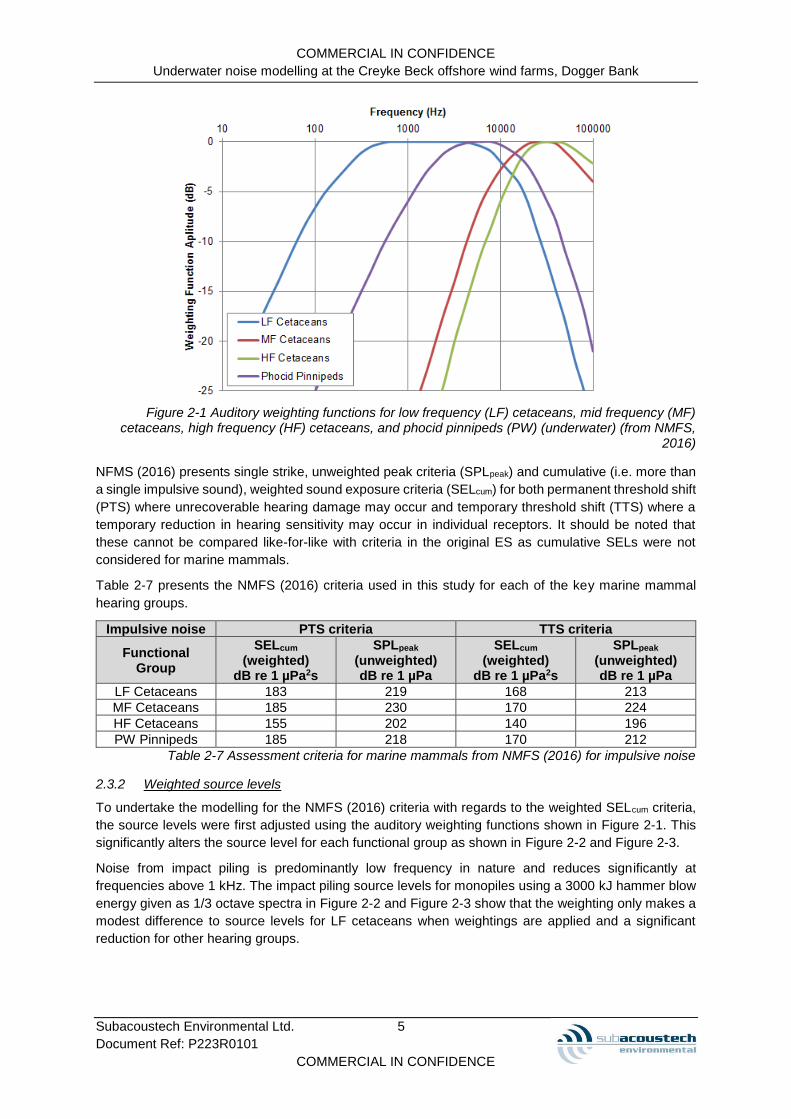
significantly alters the source level for each functional group as shown in Figure 2-2 and Figure 2-3.
Noise from impact piling is predominantly low frequency in nature and reduces significantly at
frequencies above 1 kHz. The impact piling source levels for monopiles using a 3000 kJ hammer blow
energy given as 1/3 octave spectra in Figure 2-2 and Figure 2-3 show that the weighting only makes a
modest difference to source levels for LF cetaceans when weightings are applied and a significant
reduction for other hearing groups.
COMMERCIAL IN CONFIDENCE
Underwater noise modelling at the Creyke Beck offshore wind farms, Dogger Bank
Subacoustech Environmental Ltd. 6
Document Ref: P223R0101
COMMERCIAL IN CONFIDENCE
Figure 2-2 Unweighted and NMFS (2016) weighted SEL monopile impact piling source level third
octave values for LF and MF cetaceans for a 3000 kJ hammer
Figure 2-3 Unweighted and NMFS (2016) weighted SEL monopile impact piling source level third
octave values for HF cetaceans and phocid pinnipeds for a 3000 kJ hammer
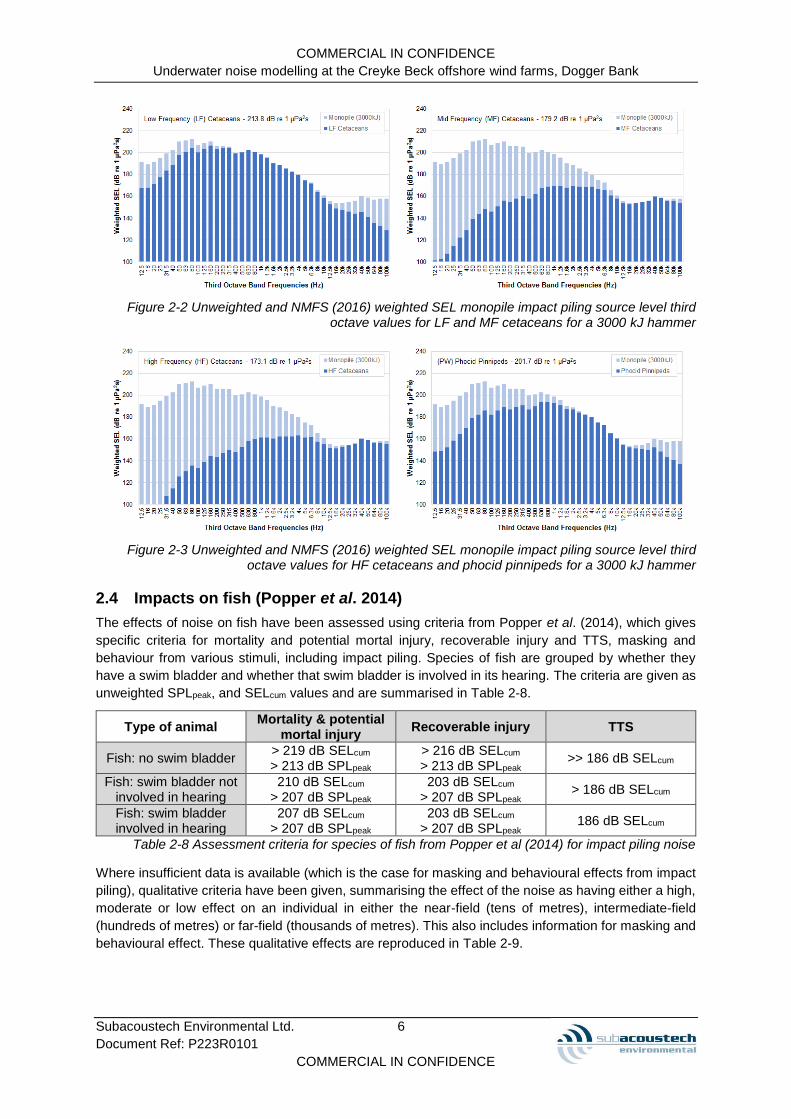
2.4 Impacts on fish (Popper et al. 2014)
The effects of noise on fish have been assessed using criteria from Popper et al. (2014), which gives
specific criteria for mortality and potential mortal injury, recoverable injury and TTS, masking and
behaviour from various stimuli, including impact piling. Species of fish are grouped by whether they
have a swim bladder and whether that swim bladder is involved in its hearing. The criteria are given as
unweighted SPLpeak, and SELcum values and are summarised in Table 2-8.
Type of animal Mortality & potential
mortal injury Recoverable injury TTS
Fish: no swim bladder > 219 dB SELcum
> 213 dB SPLpeak > 216 dB SELcum
> 213 dB SPLpeak >> 186 dB SELcum
Fish: swim bladder not involved in hearing
210 dB SELcum
> 207 dB SPLpeak 203 dB SELcum
> 207 dB SPLpeak > 186 dB SELcum
Fish: swim bladder involved in hearing
207 dB SELcum
> 207 dB SPLpeak 203 dB SELcum
> 207 dB SPLpeak 186 dB SELcum
Table 2-8 Assessment criteria for species of fish from Popper et al (2014) for impact piling noise
Where insufficient data is available (which is the case for masking and behavioural effects from impact
piling), qualitative criteria have been given, summarising the effect of the noise as having either a high,
moderate or low effect on an individual in either the near-field (tens of metres), intermediate-field
(hundreds of metres) or far-field (thousands of metres). This also includes information for masking and
behavioural effect. These qualitative effects are reproduced in Table 2-9.

COMMERCIAL IN CONFIDENCE
Underwater noise modelling at the Creyke Beck offshore wind farms, Dogger Bank
Subacoustech Environmental Ltd. 7
Document Ref: P223R0101
COMMERCIAL IN CONFIDENCE
Type of animal Masking Behaviour
Fish: no swim bladder (N) Moderate
(I) Low (F) Low
(N) High (I) Moderate
(F) Low
Fish: swim bladder not involved in hearing
(N) Moderate (I) Low (F) Low
(N) High (I) Moderate
(F) Low
Fish: swim bladder involved in hearing
(N) High (I) High
(F) Moderate
(N) High (I) High
(F) Moderate
Table 2-9 Summary of the qualitative effects on fish from impact piling noise from Popper et al. (2014) (N=Near field, I=Intermediate field, F=Far field)
COMMERCIAL IN CONFIDENCE
Underwater noise modelling at the Creyke Beck offshore wind farms, Dogger Bank
Subacoustech Environmental Ltd. 8
Document Ref: P223R0101
COMMERCIAL IN CONFIDENCE
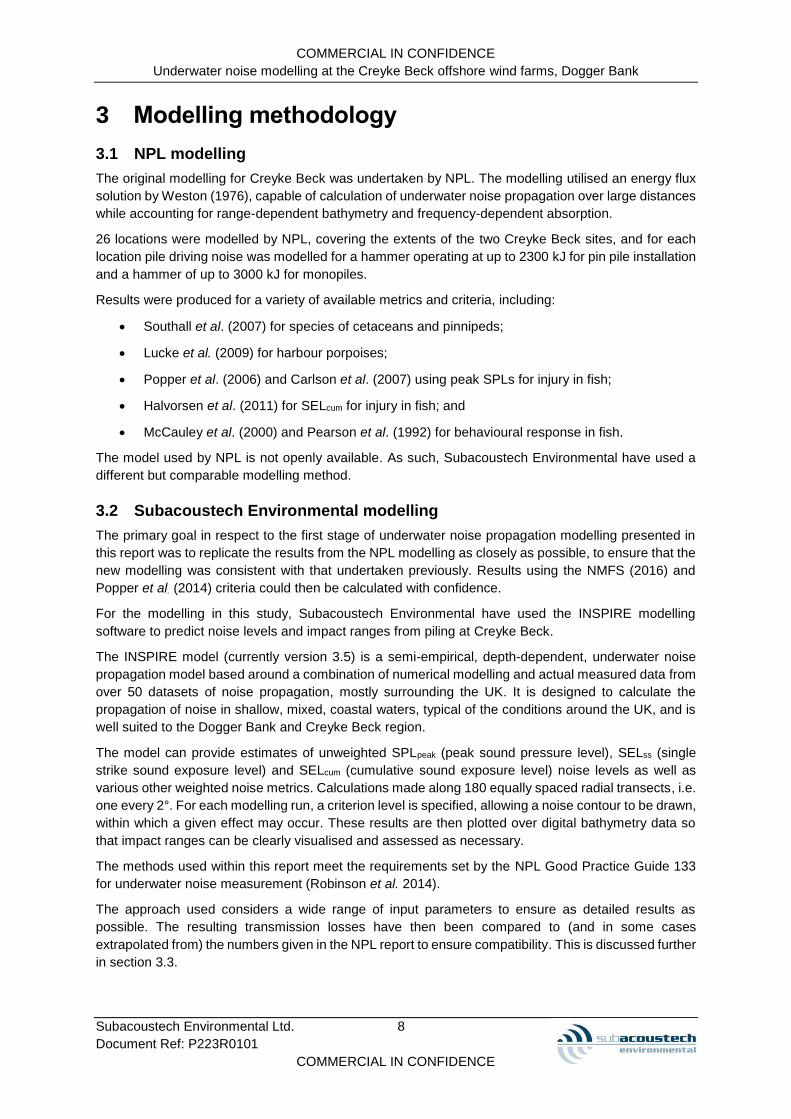
3 Modelling methodology
3.1 NPL modelling
The original modelling for Creyke Beck was undertaken by NPL. The modelling utilised an energy flux
solution by Weston (1976), capable of calculation of underwater noise propagation over large distances
while accounting for range-dependent bathymetry and frequency-dependent absorption.
26 locations were modelled by NPL, covering the extents of the two Creyke Beck sites, and for each
location pile driving noise was modelled for a hammer operating at up to 2300 kJ for pin pile installation
and a hammer of up to 3000 kJ for monopiles.
Results were produced for a variety of available metrics and criteria, including:
• Southall et al. (2007) for species of cetaceans and pinnipeds;
• Lucke et al. (2009) for harbour porpoises;
• Popper et al. (2006) and Carlson et al. (2007) using peak SPLs for injury in fish;
• Halvorsen et al. (2011) for SELcum for injury in fish; and
• McCauley et al. (2000) and Pearson et al. (1992) for behavioural response in fish.
The model used by NPL is not openly available. As such, Subacoustech Environmental have used a
different but comparable modelling method.
3.2 Subacoustech Environmental modelling
The primary goal in respect to the first stage of underwater noise propagation modelling presented in
this report was to replicate the results from the NPL modelling as closely as possible, to ensure that the
new modelling was consistent with that undertaken previously. Results using the NMFS (2016) and
Popper et al. (2014) criteria could then be calculated with confidence.
For the modelling in this study, Subacoustech Environmental have used the INSPIRE modelling
software to predict noise levels and impact ranges from piling at Creyke Beck.
The INSPIRE model (currently version 3.5) is a semi-empirical, depth-dependent, underwater noise
propagation model based around a combination of numerical modelling and actual measured data from
over 50 datasets of noise propagation, mostly surrounding the UK. It is designed to calculate the
propagation of noise in shallow, mixed, coastal waters, typical of the conditions around the UK, and is
well suited to the Dogger Bank and Creyke Beck region.
The model can provide estimates of unweighted SPLpeak (peak sound pressure level), SELss (single
strike sound exposure level) and SELcum (cumulative sound exposure level) noise levels as well as
various other weighted noise metrics. Calculations made along 180 equally spaced radial transects, i.e.
one every 2°. For each modelling run, a criterion level is specified, allowing a noise contour to be drawn,
within which a given effect may occur. These results are then plotted over digital bathymetry data so
that impact ranges can be clearly visualised and assessed as necessary.
The methods used within this report meet the requirements set by the NPL Good Practice Guide 133
for underwater noise measurement (Robinson et al. 2014).
The approach used considers a wide range of input parameters to ensure as detailed results as
possible. The resulting transmission losses have then been compared to (and in some cases
extrapolated from) the numbers given in the NPL report to ensure compatibility. This is discussed further
in section 3.3.

COMMERCIAL IN CONFIDENCE
Underwater noise modelling at the Creyke Beck offshore wind farms, Dogger Bank
Subacoustech Environmental Ltd. 9
Document Ref: P223R0101
COMMERCIAL IN CONFIDENCE
3.2.1 Modelling location
Modelling has been undertaken at four locations over the two Creyke Beck sites identified in the NPL
Report (locations ID6 and ID11 in Creyke Beck A, and locations ID6 and ID13 in Creyke Beck B – Table
4.1 and Table 4.2). These locations have been chosen as they are used for detailed analysis within the
NPL Report. The locations cover a wide area of the Creyke Beck sites including both deep and shallow
water areas.
The approximate location is given in Figure 1-1 and the coordinates are summarised in Table 3-1.
Creyke Beck A
ID6 Creyke Beck A
ID11 Creyke Beck B
ID6 Creyke Beck B
ID13
Latitude 54.7417°N 54.8003°N 55.07332°N 54.8902°N
Longitude 1.8283°E 1.8796°E 1.5056°E 1.8157°E
Depth (m) 23 32 30 22
Table 3-1 Summary of the modelling locations used for this study
3.2.2 Modelling input parameters
The following environmental and noise source parameters have been assumed in the modelling.
Impact piling
The original modelling by NPL considered two primary scenarios: monopile foundations installed using
a hammer with a maximum blow energy of 3000 kJ and pin pile foundations installed using a maximum
blow energy of 2300 kJ. In addition to these, several lower blow energies were also modelled to show
the ‘soft start’ and ramp up of the impact piling from the start to the maximum (300 kJ and 1900 kJ).
The above initial (comparative) scenarios have been modelled using the Subacoustech Environmental
approach described above. In addition, two higher maximum blow energies for monopiles, 3600 kJ and
4000 kJ, could potentially be used for installation and the effects of these have been modelled.
Source levels
Underwater noise modelling requires knowledge of the source level, which is the noise level at 1 m from
the noise source. The source levels used by NPL for their modelling were not presented in their report.
For this study, the source level has been derived by taking the modelled transmission loss of the noise
over distance and fitting it to the impact ranges presented previously in the NPL Report. The resulting
source levels have been used for calculating the impact ranges for the NMFS (2016) and Popper et al.
(2014) criteria. A description for the process of fitting of the data and comparisons to NPL modelling are
presented in section 3.3.
The unweighted source levels used for the modelling are provided in Table 3-2 for the maximum blow
energies, which are in line with those seen at other, similar scale projects.
SPLpeak source level SELss source level
Pin Pile 2300 kJ (maximum) 243.5 dB re 1 µPa @ 1 m 216.5 dB re 1 µPa2s @ 1 m
Monopile 3000 kJ (maximum) 245.2 dB re 1 µPa @ 1 m 219.2 dB re 1 µPa2s @ 1 m
Monopile 3600 kJ (maximum) 246.7 dB re 1 µPa @ 1 m 219.9 dB re 1 µPa2s @ 1 m
Monopile 4000 kJ (maximum) 247.5 dB re 1 µPa @ 1 m 220.4 dB re 1 µPa2s @ 1 m
Table 3-2 Summary of the unweighted, single strike, source levels used for modelling in this study
It is important to note that the source level value is theoretical and does not necessarily, nor is intended
to, represent the actual noise level at 1 m from the piling operation, which is highly complex close to a
large distributed source. Its purpose is for the accurate calculation of noise levels at greater distances
from the source, to correspond with relevant thresholds, and crucially in this case, to agree with the
original NPL modelling.

COMMERCIAL IN CONFIDENCE
Underwater noise modelling at the Creyke Beck offshore wind farms, Dogger Bank
Subacoustech Environmental Ltd. 10
Document Ref: P223R0101
COMMERCIAL IN CONFIDENCE
Frequency content
The size of the pile being installed has been applied to the modelling to estimate the frequency content
of the noise. Frequency data was not given in the NPL report. As such, frequency data has been derived
using Subacoustech Environmental’s noise measurement database. Representative third-octave noise
levels dependent on the size of the monopiles and pin piles have been used for this modelling. The SEL
third-octave frequency spectrum levels used for modelling are illustrated in Figure 3-1. The shape of
each spectrum is the same for all blow energies at source, with the overall source levels adjusted to
account for the changing blow energy.
Figure 3-1 SELss third-octave source level frequency spectra used for modelling
The noise from monopiles contains more low frequency content and the pin piles contain more high
frequency content, due to the dimensions and acoustics of the pile.
Soft start, strike rate, and piling duration
For cumulative SEL, which takes into account the total exposure of a receptor to the noise of the
complete piling period, the soft start, strike rate and duration of the piling events have also been
considered. Table 4.4 in the NPL Report gives a summary of the parameters used for cumulative strike
modelling; all three of these sequences have been considered for this modelling. The parameters used
for this modelling, based on those given in the NPL report, are summarised in Table 3-3 below.
Sequence 1 assumes 2000 strikes over 65 minutes, sequence 2 assumes 5000 strikes over 140
minutes, and sequence 3 assumes 12600 strikes over 330 minutes.
The soft start, or the use of lower hammer energy for an initial period, takes place over the first half-
hour of piling, with a blow energy of 10% of maximum, then for the remaining number of strikes the blow
energy is 100%. This is a worst-case scenario, as it is likely that the blow energy will ramp up gradually
from 10% to 100% after the soft start and for engineering reasons piling would not be at 100% for this
extended period. However information on a ramp-up was unavailable in the NPL report, and thus these
worst-case assumptions have been made.

COMMERCIAL IN CONFIDENCE
Underwater noise modelling at the Creyke Beck offshore wind farms, Dogger Bank
Subacoustech Environmental Ltd. 11
Document Ref: P223R0101
COMMERCIAL IN CONFIDENCE
Maximum hammer blow energy
Percent of maximum blow energy
10% (soft start) 100%
2300 kJ (pin pile) 230 kJ 2300 kJ
3000 kJ (monopile) 300 kJ 3000 kJ
3600 kJ (monopile) 360 kJ 3600 kJ
4000 kJ (monopile) 400 kJ 4000 kJ
Strike rate 1 strike every 3 seconds 1 strike every 1.5 seconds
Duration 30 minutes 35 minutes (sequence 1)
110 minutes (sequence 2) 300 minutes (sequence 3)
Number of strikes 600 strikes 1,400 strikes (sequence 1) 4,400 strikes (sequence 2) 12,000 strikes (sequence 3)
Table 3-3 Summary of the multiple pulse scenarios used for cumulative SEL modelling
Fleeing receptors
Where the SELcum results are required, a fleeing animal model has been used. This assumes that the
animal exposed to the noise levels will swim away from the source as it occurs. For this, a constant
speed of 3.25 ms-1 has been assumed for the low frequency (LF) cetaceans group (Blix and Folkow,
1995) based on data for Minke whale. All other receptors are assumed to swim at a constant speed of
1.5 ms-1 (Otani et al. 2000; Hirata, 1999). These are considered worst-case (i.e. relatively slow, leading
to greater calculated exposures) as marine mammals are expected to swim much faster under stress
conditions.
Environmental conditions
By inclusion of measured data from similar offshore impact piling events, the INSPIRE model
intrinsically accounts for various environmental conditions. Data from the British Geological Survey
(BGS) presented as part of the Marine Environmental Mapping Programme (MAREMAP) show that the
areas around Creyke Beck and the Dogger Bank region generally are made up of sand or gravelly sand.
Bathymetry from the European Marine Observation and Data Network (EMODnet) was used for this
modelling. Mean tidal depth was used throughout for the bathymetry to match conditions used in the
NPL report.
3.3 Results of original and revised modelling comparison
3.3.1 Model comparison
In order to obtain modelling results representative of those produced for the NPL Report, modelling was
carried out using the INSPIRE model using the parameters detailed in the previous section to get a
general transmission loss over multiple transects. These transmission losses were then compared
against the results given in the NPL Report. Location ID6 at Creyke Beck B was chosen as a
representative modelling location due to its location in the deeper water to the north and west of the
site.
There was good correlation between the two resultant data sets. Figure 3-2 and Figure 3-3 compare
the unweighted noise level plots from the NPL Report and the new Subacoustech modelling at the same
scale. It should be noted that although the noise levels do not line up perfectly, the figures do show
many of the same features, such as a largely uniform distribution in all directions for the highest noise
levels, with larger ranges into the deeper water to the north and northwest and some effects of shallower
areas and sandbanks to the south, which reduce noise transmission.

COMMERCIAL IN CONFIDENCE
Underwater noise modelling at the Creyke Beck offshore wind farms, Dogger Bank
Subacoustech Environmental Ltd. 12
Document Ref: P223R0101
COMMERCIAL IN CONFIDENCE
Figure 3-2 SELss impact piling noise propagation map for Creyke Beck B location ID6 for a 3000 kJ
hammer from the NPL Report, Figure 4.4
Figure 3-3 SELss impact piling noise propagation map for Creyke Beck B location ID6 for a 3000 kJ
hammer showing the transmission losses predicted for the INSPIRE modelling

COMMERCIAL IN CONFIDENCE
Underwater noise modelling at the Creyke Beck offshore wind farms, Dogger Bank
Subacoustech Environmental Ltd. 13
Document Ref: P223R0101
COMMERCIAL IN CONFIDENCE
The source level was ascertained by fitting the modelled transmission loss to the impact ranges given
in the NPL Report. Figure 3-4 and Figure 3-5 show how the worst-case transect lines up with the higher
SPLpeak and SELss impact ranges given in the NPL Report, resulting in the source levels to be used for
modelling in this study, summarised in Table 3-2. A conservative fit to the data has been used so that
levels predicted along the worst-case transect intersect with the highest levels reported by NPL; this
data is summarised in Table 3-4 and Table 3-5.
Figure 3-4 Level versus range plots showing a comparison between the reported NPL impact ranges
and the new modelling fitted to the data (unweighted SPLpeak)
SPLpeak Criteria NPL modelling INSPIRE worst case
2300 kJ
206 dB re 1 µPa < 180 m 230 m
200 dB re 1 µPa < 500 m 500 m
173 dB re 1 µPa 7.5 to 9.5 km 11.5 km
168 dB re 1 µPa 16.0 to 20.0 km 17.7 km
3000kJ
206 dB re 1 µPa < 200 m 280 m
200 dB re 1 µPa < 600 m 490 m
173 dB re 1 µPa 8.5 to 10.5 km 13.4 km
168 dB re 1 µPa 18.0 to 21.5 km 20.5 km
Table 3-4 Summary of the maximum modelled SPLpeak values compared in Figure 3-4
Figure 3-5 Level versus range plots showing a comparison between the reported NPL impact ranges
and the new modelling parameters fitted to the data (unweighted SELss)
COMMERCIAL IN CONFIDENCE
Underwater noise modelling at the Creyke Beck offshore wind farms, Dogger Bank
Subacoustech Environmental Ltd. 14
Document Ref: P223R0101
COMMERCIAL IN CONFIDENCE
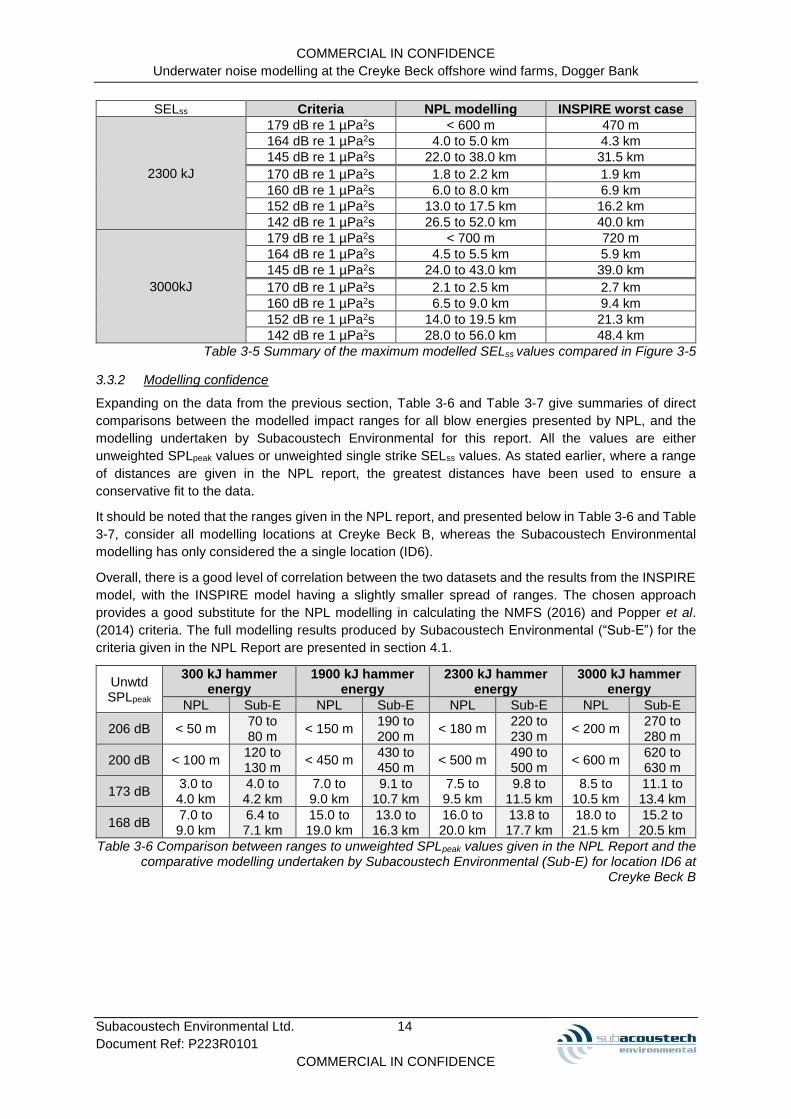
SELss Criteria NPL modelling INSPIRE worst case
2300 kJ
179 dB re 1 µPa2s < 600 m 470 m
164 dB re 1 µPa2s 4.0 to 5.0 km 4.3 km
145 dB re 1 µPa2s 22.0 to 38.0 km 31.5 km
170 dB re 1 µPa2s 1.8 to 2.2 km 1.9 km
160 dB re 1 µPa2s 6.0 to 8.0 km 6.9 km
152 dB re 1 µPa2s 13.0 to 17.5 km 16.2 km
142 dB re 1 µPa2s 26.5 to 52.0 km 40.0 km
3000kJ
179 dB re 1 µPa2s < 700 m 720 m
164 dB re 1 µPa2s 4.5 to 5.5 km 5.9 km
145 dB re 1 µPa2s 24.0 to 43.0 km 39.0 km
170 dB re 1 µPa2s 2.1 to 2.5 km 2.7 km
160 dB re 1 µPa2s 6.5 to 9.0 km 9.4 km
152 dB re 1 µPa2s 14.0 to 19.5 km 21.3 km
142 dB re 1 µPa2s 28.0 to 56.0 km 48.4 km
Table 3-5 Summary of the maximum modelled SELss values compared in Figure 3-5
3.3.2 Modelling confidence
Expanding on the data from the previous section, Table 3-6 and Table 3-7 give summaries of direct
comparisons between the modelled impact ranges for all blow energies presented by NPL, and the
modelling undertaken by Subacoustech Environmental for this report. All the values are either
unweighted SPLpeak values or unweighted single strike SELss values. As stated earlier, where a range
of distances are given in the NPL report, the greatest distances have been used to ensure a
conservative fit to the data.
It should be noted that the ranges given in the NPL report, and presented below in Table 3-6 and Table
3-7, consider all modelling locations at Creyke Beck B, whereas the Subacoustech Environmental
modelling has only considered the a single location (ID6).
Overall, there is a good level of correlation between the two datasets and the results from the INSPIRE
model, with the INSPIRE model having a slightly smaller spread of ranges. The chosen approach
provides a good substitute for the NPL modelling in calculating the NMFS (2016) and Popper et al.
(2014) criteria. The full modelling results produced by Subacoustech Environmental (“Sub-E”) for the
criteria given in the NPL Report are presented in section 4.1.
Unwtd SPLpeak
300 kJ hammer energy
1900 kJ hammer energy
2300 kJ hammer energy
3000 kJ hammer energy
NPL Sub-E NPL Sub-E NPL Sub-E NPL Sub-E
206 dB < 50 m 70 to 80 m
< 150 m 190 to 200 m
< 180 m 220 to 230 m
< 200 m 270 to 280 m
200 dB < 100 m 120 to 130 m
< 450 m 430 to 450 m
< 500 m 490 to 500 m
< 600 m 620 to 630 m
173 dB 3.0 to 4.0 km
4.0 to 4.2 km
7.0 to 9.0 km
9.1 to 10.7 km
7.5 to 9.5 km
9.8 to 11.5 km
8.5 to 10.5 km
11.1 to 13.4 km
168 dB 7.0 to 9.0 km
6.4 to 7.1 km
15.0 to 19.0 km
13.0 to 16.3 km
16.0 to 20.0 km
13.8 to 17.7 km
18.0 to 21.5 km
15.2 to 20.5 km
Table 3-6 Comparison between ranges to unweighted SPLpeak values given in the NPL Report and the comparative modelling undertaken by Subacoustech Environmental (Sub-E) for location ID6 at
Creyke Beck B

COMMERCIAL IN CONFIDENCE
Underwater noise modelling at the Creyke Beck offshore wind farms, Dogger Bank
Subacoustech Environmental Ltd. 15
Document Ref: P223R0101
COMMERCIAL IN CONFIDENCE
Unwtd SELss
300 kJ hammer energy
1900 kJ hammer energy
2300 kJ hammer energy
3000 kJ hammer energy
NPL Sub-E NPL Sub-E NPL Sub-E NPL Sub-E
179 dB < 100 m 140 to 150 m
< 550 m 420 to 430 m
< 600 m 460 to 470 m
< 700 m 700 to 720 m
164 dB 1.2 to 1.5 km
1.4 km 3.2 to 4.4 km
3.7 to 3.9 km
4.0 to 5.0 km
4.0 to 4.3 km
4.5 to 5.5 km
5.5 to 5.9 km
145 dB 10.5 to 14.5 km
12.4 to 15.1 km
20.5 to 34.5 km
19.7 to 30.1 km
22.0 to 38.0 km
20.3 to 31.5 km
24.0 to 43.0 km
23.2 to 39.1 km
170 dB < 600 m 570 to 580 m
1.6 to 2.0 km
1.7 km 1.8 to 2.2 km
1.8 to 1.9 km
2.1 to 2.5 km
2.7 km
160 dB 2.1 to 2.5 km
2.5 to 2.6 km
5.5 to 7.5 km
6.0 to 6.5 km
6.0 to 8.0 km
6.3 to 6.9 km
6.5 to 9.0 km
8.3 to 9.4 km
152 dB 5.5 to 7.5 km
6.5 to 7.2 km
11.5 to 16.0 km
12.6 to 15.3 km
13.0 to 17.5 km
13.1 to 16.2 km
14.0 to 19.5 km
15.8 to 21.3 km
142 dB 14.0 to 19.5 km
15.4 to 20.4 km
25.5 to 49.0 km
22.9 to 38.3 km
26.5 to 52.0 km
23.5 to 40.0 km
28.0 to 56.0 km
26.4 to 48.4 km
Table 3-7 Comparison between ranges to unweighted SELss values given in the NPL Report and the comparable modelling undertaken by Subacoustech Environmental (Sub-E) for location ID6 at Creyke
Beck B

COMMERCIAL IN CONFIDENCE
Underwater noise modelling at the Creyke Beck offshore wind farms, Dogger Bank
Subacoustech Environmental Ltd. 16
Document Ref: P223R0101
COMMERCIAL IN CONFIDENCE
4 Modelling results
The following sections present the modelling impact ranges for the criteria discussed in section 2 at the
Creyke Beck sites and a comparison with the results presented in the NPL Report. Only the results from
location ID6 at Creyke Beck B are presented in this section. The complete modelling results for all
modelled locations are presented in Appendix A.
4.1 Previously considered criteria
Table 4-1 to Table 4-5 present the impact ranges from the INSPIRE modelling considering the single
pulse noise criteria used in the NPL Report, covering the metrics and criteria described in section 2.
Also included are the results for the 3600 and 4000 kJ hammer energies.
Predicted ranges smaller than 50 m, and area less than 0.1 km2 for single strike criteria, and smaller
than 100 m for cumulative criteria, have not been presented as the modelling processes are unable to
specify that level of accuracy with confidence due to acoustic effects near the source and other noise
processes at close ranges.
The results that are large enough to be shown clearly are also presented in Appendix B as contour
plots.
Harbour porpoise - impact criterion
300 kJ hammer energy
1900 kJ hammer energy
2300 kJ hammer energy
3000 kJ hammer energy
3600 kJ hammer energy
4000 kJ hammer energy
Instantaneous injury/PTS (SPLpeak 200 dB re 1 µPa)
Max 130 m 450 m 500 m 630 m 770 m 860 m
Min 120 m 430 m 490 m 620 m 760 m 840 m
Mean 130 m 440 m 500 m 630 m 770 m 850 m
Area 0.1 km2 0.6 km2 0.8 km2 1.2 km2 1.8 km2 2.3 km2
Instantaneous injury/PTS (SELss
179 dB re 1 µPa2s)
Max 150 m 430 m 470 m 720 m 800 m 860 m
Min 140 m 420 m 460 m 700 m 780 m 850 m
Mean 150 m 430 m 470 m 710 m 790 m 860 m
Area 0.1 km2 0.6 km2 0.7 km2 1.6 km2 2.0 km2 2.3 km2
TTS/fleeing response (SPLpeak 194 dB re
1 µPa)
Max 280 m 990 m 1.1 km 1.4 km 1.7 km 1.9 km
Min 270 m 970 m 1.1 km 1.4 km 1.7 km 1.8 km
Mean 280 m 980 m 1.1 km 1.4 km 1.7 km 1.9 km
Area 0.2 km2 3.0 km2 3.8 km2 6.0 km2 8.8 km2 11 km2
TTS/fleeing response (SELss 164 dB re
1 µPa2s)
Max 1.4 km 4.0 km 4.3 km 5.9 km 6.5 km 6.9 km
Min 1.4 km 3.8 km 4.0 km 5.5 km 6.0 km 6.3 km
Mean 1.4 km 3.9 km 4.2 km 5.8 km 6.3 km 6.7 km
Area 6.4 km2 47 km2 54 km2 110 km2 130 km2 140 km2
Possible avoidance of area (SPLpeak 168 re
1 µPa2s)
Max 7.1 km 16.3 km 17.7 km 20.5 km 23.2 km 24.6 km
Min 6.4 km 13.0 km 13.8 km 15.2 km 16.4 km 17.0 km
Mean 6.9 km 15.0 km 16.0 km 18.1 km 20.0 km 21.1 km
Area 150 km2 710 km2 810 km2 1000 km2 1300 km2 1400 km2
Possible avoidance of area (SELss 145 re
1 µPa2s)
Max 15.1 km 30.1 km 31.5 km 39.1 km 41.1 km 42.6 km
Min 12.4 km 19.7 km 20.3 km 23.2 km 23.9 km 24.4 km
Mean 14.1 km 25.1 km 26.1 km 31.4 km 32.8 km 33.9 km
Area 620 km2 2000 km2 2200 km2 3100 km2 3500 km2 3700 km2
Table 4-1 Predicted harbour porpoise impact ranges using criteria derived from Lucke et al. (2009) at Creyke Beck B, location ID6

COMMERCIAL IN CONFIDENCE
Underwater noise modelling at the Creyke Beck offshore wind farms, Dogger Bank
Subacoustech Environmental Ltd. 17
Document Ref: P223R0101
COMMERCIAL IN CONFIDENCE
Mid-frequency cetaceans - impact criterion
300 kJ hammer energy
1900 kJ hammer energy
2300 kJ hammer energy
3000 kJ hammer energy
3600 kJ hammer energy
4000 kJ hammer energy
Instantaneous injury/PTS (SPLpeak 230 dB re 1 µPa)
Max < 50 m < 50 m < 50 m < 50 m < 50 m < 50 m
Min < 50 m < 50 m < 50 m < 50 m < 50 m < 50 m
Mean < 50 m < 50 m < 50 m < 50 m < 50 m < 50 m
Area < 0.1 km2 < 0.1 km2 < 0.1 km2 < 0.1 km2 < 0.1 km2 < 0.1 km2
Instantaneous injury/PTS (Mmf SELss
198 dB re 1 µPa2s)
Max < 50 m < 50 m < 50 m < 50 m < 50 m < 50 m
Min < 50 m < 50 m < 50 m < 50 m < 50 m < 50 m
Mean < 50 m < 50 m < 50 m < 50 m < 50 m < 50 m
Area < 0.1 km2 < 0.1 km2 < 0.1 km2 < 0.1 km2 < 0.1 km2 < 0.1 km2
TTS/fleeing response (SPLpeak 224 dB re
1 µPa)
Max < 50 m < 50 m < 50 m < 50 m < 50 m < 50 m
Min < 50 m < 50 m < 50 m < 50 m < 50 m < 50 m
Mean < 50 m < 50 m < 50 m < 50 m < 50 m < 50 m
Area < 0.1 km2 < 0.1 km2 < 0.1 km2 < 0.1 km2 < 0.1 km2 < 0.1 km2
TTS/fleeing response (Mmf SELss 183 dB re
1 µPa2s)
Max < 50 m 90 m 120 m 140 m 150 m 170 m
Min < 50 m 80 m 110 m 130 m 140 m 160 m
Mean < 50 m 90 m 120 m 140 m 150 m 170 m
Area < 0.1 km2 < 0.1 km2 < 0.1 km2 0.1 km2 0.1 km2 0.1 km2
Likely avoidance of area (SELss 170 re 1 µPa2s)
Max 580 m 1.7 km 1.9 km 2.7 km 3.0 km 3.2 km
Min 570 m 1.7 km 1.8 km 2.7 km 2.9 km 3.1 km
Mean 580 m 1.7 km 1.8 km 2.7 km 3.0 km 3.2 km
Area 1.0 km2 8.9 km2 10 km2 23 km2 27 km2 31 km2
Possible avoidance of area (SELss 160 re
1 µPa2s)
Max 2.6 km 6.5 km 6.9 km 9.4 km 10.2 km 10.7 km
Min 2.5 km 6.0 km 6.3 km 8.3 km 8.9 km 9.3 km
Mean 2.5 km 6.4 km 6.8 km 9.1 km 9.7 km 10.2 km
Area 20 km2 130 km2 140 km2 260 km2 300 km2 330 km2
Table 4-2 Predicted mid-frequency cetacean impact ranges using criteria derived from Southall et al. (2007) at Creyke Beck B, location ID6

COMMERCIAL IN CONFIDENCE
Underwater noise modelling at the Creyke Beck offshore wind farms, Dogger Bank
Subacoustech Environmental Ltd. 18
Document Ref: P223R0101
COMMERCIAL IN CONFIDENCE
Low-frequency cetaceans - impact criterion
300 kJ hammer energy
1900 kJ hammer energy
2300 kJ hammer energy
3000 kJ hammer energy
3600 kJ hammer energy
4000 kJ hammer energy
Instantaneous injury/PTS (SPLpeak 230
dB re 1 µPa)
Max < 50 m < 50 m < 50 m < 50 m < 50 m < 50 m
Min < 50 m < 50 m < 50 m < 50 m < 50 m < 50 m
Mean < 50 m < 50 m < 50 m < 50 m < 50 m < 50 m
Area < 0.1 km2 < 0.1 km2 < 0.1 km2 < 0.1 km2 < 0.1 km2 < 0.1 km2
Instantaneous injury/PTS (Mlf SELss 198 dB re 1 µPa2s)
Max < 50 m < 50 m < 50 m 50 m 50 m 50 m
Min < 50 m < 50 m < 50 m < 50 m < 50 m < 50 m
Mean < 50 m < 50 m < 50 m < 50 m < 50 m < 50 m
Area < 0.1 km2 < 0.1 km2 < 0.1 km2 < 0.1 km2 < 0.1 km2 < 0.1 km2
TTS/fleeing response (SPLpeak 224 dB re
1 µPa)
Max < 50 m < 50 m < 50 m < 50 m < 50 m < 50 m
Min < 50 m < 50 m < 50 m < 50 m < 50 m < 50 m
Mean < 50 m < 50 m < 50 m < 50 m < 50 m < 50 m
Area < 0.1 km2 < 0.1 km2 < 0.1 km2 < 0.1 km2 < 0.1 km2 < 0.1 km2
TTS/fleeing response (Mlf SELss 183 dB re
1 µPa2s)
Max 80 m 240 m 260 m 390 m 430 m 470 m
Min 70 m 230 m 250 m 380 m 420 m 450 m
Mean 80 m 240 m 260 m 390 m 430 m 460 m
Area < 0.1 km2 0.2 km2 0.2 km2 0.5 km2 0.6 km2 0.7 km2
Likely avoidance of area (SELss 152 re 1 µPa2s)
Max 7.2 km 15.3 km 16.2 km 21.3 km 22.8 km 23.9 km
Min 6.5 km 12.6 km 13.1 km 15.8 km 16.5 km 17.0 km
Mean 7.0 km 14.3 km 15.0 km 18.8 km 19.9 km 20.7 km
Area 150 km2 640 km2 700 km2 1100 km2 1200 km2 1300 km2
Possible avoidance of area (SELss 142 re
1 µPa2s)
Max 20.4 km 38.3 km 40.0 km 48.4 km 50.8 km 52.5 km
Min 15.4 km 22.9 km 23.5 km 26.4 km 27.2 km 27.8 km
Mean 18.2 km 30.9 km 32.0 km 37.9 km 39.5 km 40.7 km
Area 1000 km2 3000 km2 3300 km2 4600 km2 5100 km2 5400 km2
Table 4-3 Predicted low-frequency cetacean impact ranges using criteria derived from Southall et al. (2007) at Creyke Beck B, location ID6
Pinnipeds (in water) - impact criterion
300 kJ hammer energy
1900 kJ hammer energy
2300 kJ hammer energy
3000 kJ hammer energy
3600 kJ hammer energy
4000 kJ hammer energy
Instantaneous injury/PTS (SPLpeak 218 dB re 1 µPa)
Max 50 m 50 m 60 m 70 m 80 m 80 m
Min < 50 m < 50 m 50 m 60 m 70 m 70 m
Mean < 50 m < 50 m 60 m 70 m 80 m 80 m
Area < 0.1 km2 < 0.1 km2 < 0.1 km2 < 0.1 km2 < 0.1 km2 < 0.1 km2
Instantaneous injury/PTS (Mpw SELss
186 dB re 1 µPa2s)
Max < 50 m 90 m 120 m 150 m 160 m 170 m
Min < 50 m 80 m 110 m 140 m 150 m 160 m
Mean < 50 m 90 m 120 m 150 m 160 m 170 m
Area < 0.1 km2 < 0.1 km2 < 0.1 km2 0.1 km2 0.1 km2 0.1 km2
TTS/fleeing response (SPLpeak 212 dB re
1 µPa)
Max 70 m 90 m 110 m 130 m 160 m 170 m
Min 60 m 80 m 100 m 120 m 150 m 160 m
Mean 70 m 90 m 110 m 130 m 160 m 170 m
Area < 0.1 km2 < 0.1 km2 < 0.1 km2 0.1 km2 0.1 km2 0.1 km2
TTS/fleeing response (Mpw SELss 171 dB re
1 µPa2s)
Max 290 m 870 m 1.2 km 1.4 km 1.6 km 1.7 km
Min 280 m 850 m 1.2 km 1.4 km 1.6 km 1.7 km
Mean 290 m 860 m 1.2 km 1.4 km 1.6 km 1.7 km
Area 0.3 km2 2.3 km2 4.2 km2 6.2 km2 7.6 km2 8.8 km2
Table 4-4 Predicted pinniped (in water) impact ranges using criteria from Southall et al. (2007) at Creyke Beck B, location ID6

COMMERCIAL IN CONFIDENCE
Underwater noise modelling at the Creyke Beck offshore wind farms, Dogger Bank
Subacoustech Environmental Ltd. 19
Document Ref: P223R0101
COMMERCIAL IN CONFIDENCE
Fish - impact criterion 300 kJ
hammer energy
1900 kJ hammer energy
2300 kJ hammer energy
3000 kJ hammer energy
3600 kJ hammer energy
4000 kJ hammer energy
Instantaneous injury/PTS (SPLpeak 206 dB re 1 µPa)
Max 80 m 200 m 230 m 280 m 350 m 380 m
Min 70 m 190 m 220 m 270 m 340 m 370 m
Mean 80 m 200 m 230 m 280 m 350 m 380 m
Area < 0.1 km2 0.1 km2 0.2 km2 0.2 km2 0.4 km2 0.4 km2
PTS (SELcum 211 dB re 1 µPa2s) – Sequence 1
Max - - < 50 m < 50 m < 50 m < 50 m
Min - - < 50 m < 50 m < 50 m < 50 m
Mean - - < 50 m < 50 m < 50 m < 50 m
Area - - < 0.1 km2 < 0.1 km2 < 0.1 km2 < 0.1 km2
PTS (SELcum 211 dB re 1 µPa2s) – Sequence 2
Max - - < 50 m < 50 m < 50 m < 50 m
Min - - < 50 m < 50 m < 50 m < 50 m
Mean - - < 50 m < 50 m < 50 m < 50 m
Area - - < 0.1 km2 < 0.1 km2 < 0.1 km2 < 0.1 km2
PTS (SELcum 211 dB re 1 µPa2s) – Sequence 3
Max - - < 50 m < 50 m < 50 m < 50 m
Min - - < 50 m < 50 m < 50 m < 50 m
Mean - - < 50 m < 50 m < 50 m < 50 m
Area - - < 0.1 km2 < 0.1 km2 < 0.1 km2 < 0.1 km2
Possible moderate to strong avoidance
(upper bound SPLpeak 173 dB re 1 µPa)
Max 4.2 km 10.7 km 11.5 km 13.4 km 15.1 km 16.2 km
Min 4.0 km 9.1 km 9.8 km 11.1 km 12.3 km 12.9 km
Mean 4.1 km 10.2 km 11.0 km 12.6 km 14.1 km 14.9 km
Area 53 km2 320 km2 380 km2 490 km2 620 km2 700 km2
Possible moderate to strong avoidance
(lower bound SPLpeak 168 dB re 1 µPa)
Max 7.1 km 16.3 km 17.7 km 20.5 km 23.2 km 24.6 km
Min 6.4 km 13.0 km 13.8 km 15.2 km 16.4 km 17.0 km
Mean 6.9 km 15.0 km 16.0 km 18.1 km 20.0 km 21.1 km
Area 150 km2 710 km2 810 km2 1000 km2 1300 km2 1400 km2
Startle response or C-turn reaction (SPLpeak
200 dB re 1 µPa)
Max 130 m 450 m 500 m 630 m 770 m 860 m
Min 120 m 430 m 490 m 620 m 760 m 840 m
Mean 130 m 440 m 500 m 630 m 770 m 850 m
Area 0.1 km2 0.6 km2 0.8 km2 1.2 km2 1.8 km2 2.3 km2
Table 4-5 Predicted fish impact ranges using criteria from Popper et al. (2006), Carlson et al. (2007), Halvorsen et al (2011), McCauley et al. (2000) and Pearson et al. (1992) at Creyke Beck B, location
ID6
Cells marked with a hyphen (300 kJ and 1900 kJ) are only used for single strike hammer energies within
the soft start period. As such cumulative SELs are not intended to be calculated for them.
4.2 NMFS (2016) impact ranges
Table 4-6 to Table 4-13 present the impact ranges for the NMFS (2016) criteria for marine mammals.
As before, ranges smaller than 50 m or 100 m have not been presented for single strike criteria for
cumulative criteria respectively.
The results show that, using the NMFS (2016) SPLpeak criteria, ranges are largely within a few hundred
metres, with only the TTS ranges for high-frequency cetaceans extending over 1 km. For the SELcum
criteria, larger ranges are predicted, with PTS for LF cetaceans exceeding 8.1 km and TTS for LF
cetaceans exceeding 50 km for the largest hammer blow energies and worst-case ramp-up sequence
3.
The ranges for all species groups are greater with the increase in maximum monopile blow energy.
Comparing the PTS and TTS criteria used previously (Lucke et al. 2009; Southall et al. 2007) to the
SPLpeak NMFS (2016) criteria, reductions in impact ranges are shown for every hearing group.
As with the previous section, relevant contour plots are presented in Appendix B.

COMMERCIAL IN CONFIDENCE
Underwater noise modelling at the Creyke Beck offshore wind farms, Dogger Bank
Subacoustech Environmental Ltd. 20
Document Ref: P223R0101
COMMERCIAL IN CONFIDENCE
Low-frequency cetaceans - impact criterion 2300 kJ hammer energy
3000 kJ hammer energy
3600 kJ hammer energy
4000 kJ hammer energy
PTS unweighted SPLpeak
(219 re 1 µPa)
Maximum 50 m 60 m 70 m 70 m
Minimum < 50 m 50 m 60 m 60 m
Mean < 50 m 60 m 70 m 70 m
Area < 0.1 km2 < 0.1 km2 < 0.1 km2 < 0.1 km2
TTS unweighted SPLpeak
(213 re 1 µPa)
Maximum 90 m 120 m 140 m 150 m
Minimum 80 m 110 m 130 m 140 m
Mean 90 m 120 m 140 m 150 m
Area < 0.1 km2 < 0.1 km2 0.1 km2 0.1 km2
Table 4-6 Predicted unweighted SPLpeak impact ranges for low-frequency cetaceans using criteria from NMFS (2016) at Creyke Beck B, location ID6
Low-frequency cetaceans - impact criterion 2300 kJ hammer energy
3000 kJ hammer energy
3600 kJ hammer energy
4000 kJ hammer energy
Sequence 1 – PTS weighted SELcum (183 dB re 1 µPa2s)
Maximum 1.4 km 2.7 km 3.5 km 4.1 km
Minimum 690 m 1.6 km 2.1 km 2.5 km
Mean 1.1 km 2.4 km 3.0 km 3.5 km
Area 4.2 km2 17 km2 29 km2 39 km2
Sequence 1 – TTS weighted SELcum (168 dB re 1 µPa2s)
Maximum 30.3 km 34.7 km 36.9 km 38.5 km
Minimum 14.7 km 16.3 km 17.1 km 17.6 km
Mean 22.7 km 25.8 km 27.4 km 28.5 km
Area 1700 km2 2200 km2 2500 km2 2700 km2
Sequence 2 – PTS weighted SELcum (183 dB re 1 µPa2s)
Maximum 3.0 km 5.0 km 6.1 km 6.9 km
Minimum 1.1 km 2.2 km 2.8 km 3.3 km
Mean 2.2 km 3.8 km 4.7 km 5.3 km
Area 16 km2 47 km2 70 km2 91 km2
Sequence 2 – TTS weighted SELcum (168 dB re 1 µPa2s)
Maximum 40.2 km 45.3 km 47.9 km 49.8 km
Minimum 16.0 km 17.7 km 18.6 km 19.2 km
Mean 28.4 km 32.0 km 33.8 km 35.1 km
Area 2700 km2 3500 km2 3900 km2 4200 km2
Sequence 3 – PTS weighted SELcum (183 dB re 1 µPa2s)
Maximum 3.6 km 5.9 km 7.2 km 8.1 km
Minimum 1.1 km 2.3 km 2.9 km 3.3 km
Mean 2.5 km 4.2 km 5.1 km 5.8 km
Area 21 km2 58 km2 86 km2 110 km2
Sequence 3 – TTS weighted SELcum (168 dB re 1 µPa2s)
Maximum 45.0 km 50.8 km 53.8 km 55.9 km
Minimum 16.1 km 17.9 km 18.7 km 19.3 km
Mean 30.8 km 34.6 km 36.6 km 38.0 km
Area 3300 km2 4100 km2 4600 km2 5000 km2
Table 4-7 Predicted low-frequency cetacean weighted SELcum impact ranges using criteria from NMFS (2016) assuming a fleeing speed of 3.25 ms-1 for the three piling sequences at Creyke Beck B,
location ID6

COMMERCIAL IN CONFIDENCE
Underwater noise modelling at the Creyke Beck offshore wind farms, Dogger Bank
Subacoustech Environmental Ltd. 21
Document Ref: P223R0101
COMMERCIAL IN CONFIDENCE
Mid-frequency cetaceans - impact criterion 2300 kJ hammer energy
3000 kJ hammer energy
3600 kJ hammer energy
4000 kJ hammer energy
PTS unweighted SPLpeak
(230 re 1 µPa)
Maximum < 50 m < 50 m < 50 m < 50 m
Minimum < 50 m < 50 m < 50 m < 50 m
Mean < 50 m < 50 m < 50 m < 50 m
Area < 0.1 km2 < 0.1 km2 < 0.1 km2 < 0.1 km2
TTS unweighted SPLpeak
(224 re 1 µPa)
Maximum < 50 m < 50 m < 50 m < 50 m
Minimum < 50 m < 50 m < 50 m < 50 m
Mean < 50 m < 50 m < 50 m < 50 m
Area < 0.1 km2 < 0.1 km2 < 0.1 km2 < 0.1 km2
Table 4-8 Predicted unweighted SPLpeak impact ranges for mid-frequency cetaceans using criteria from NMFS (2016) at Creyke Beck B, location ID6
Mid-frequency cetaceans - impact criterion 2300 kJ hammer energy
3000 kJ hammer energy
3600 kJ hammer energy
4000 kJ hammer energy
Sequence 1 – PTS weighted SELcum (185 dB re 1 µPa2s)
Maximum < 100 m < 100 m < 100 m < 100 m
Minimum < 100 m < 100 m < 100 m < 100 m
Mean < 100 m < 100 m < 100 m < 100 m
Area < 0.1 km2 < 0.1 km2 < 0.1 km2 < 0.1 km2
Sequence 1 – TTS weighted SELcum (170 dB re 1 µPa2s)
Maximum < 100 m < 100 m < 100 m < 100 m
Minimum < 100 m < 100 m < 100 m < 100 m
Mean < 100 m < 100 m < 100 m < 100 m
Area < 0.1 km2 < 0.1 km2 < 0.1 km2 < 0.1 km2
Sequence 2 – PTS weighted SELcum (185 dB re 1 µPa2s)
Maximum < 100 m < 100 m < 100 m < 100 m
Minimum < 100 m < 100 m < 100 m < 100 m
Mean < 100 m < 100 m < 100 m < 100 m
Area < 0.1 km2 < 0.1 km2 < 0.1 km2 < 0.1 km2
Sequence 2 – TTS weighted SELcum (170 dB re 1 µPa2s)
Maximum < 100 m < 100 m < 100 m < 100 m
Minimum < 100 m < 100 m < 100 m < 100 m
Mean < 100 m < 100 m < 100 m < 100 m
Area < 0.1 km2 < 0.1 km2 < 0.1 km2 < 0.1 km2
Sequence 3 – PTS weighted SELcum (185 dB re 1 µPa2s)
Maximum < 100 m < 100 m < 100 m < 100 m
Minimum < 100 m < 100 m < 100 m < 100 m
Mean < 100 m < 100 m < 100 m < 100 m
Area < 0.1 km2 < 0.1 km2 < 0.1 km2 < 0.1 km2
Sequence 3 – TTS weighted SELcum (170 dB re 1 µPa2s)
Maximum < 100 m < 100 m < 100 m < 100 m
Minimum < 100 m < 100 m < 100 m < 100 m
Mean < 100 m < 100 m < 100 m < 100 m
Area < 0.1 km2 < 0.1 km2 < 0.1 km2 < 0.1 km2
Table 4-9 Predicted mid-frequency cetacean weighted SELcum impact ranges using criteria from NMFS (2016) assuming a fleeing speed of 1.5 ms-1 for the three piling sequences at Creyke Beck B,
location ID6

COMMERCIAL IN CONFIDENCE
Underwater noise modelling at the Creyke Beck offshore wind farms, Dogger Bank
Subacoustech Environmental Ltd. 22
Document Ref: P223R0101
COMMERCIAL IN CONFIDENCE
High-frequency cetaceans - impact criterion 2300 kJ hammer energy
3000 kJ hammer energy
3600 kJ hammer energy
4000 kJ hammer energy
PTS unweighted SPLpeak
(202 re 1 µPa)
Maximum 390 m 490 m 590 m 660 m
Minimum 370 m 470 m 580 m 640 m
Mean 380 m 480 m 590 m 650 m
Area 0.5 km2 0.7 km2 1.1 km2 1.3 km2
TTS unweighted SPLpeak
(196 re 1 µPa)
Maximum 860 m 1.1 km 1.3 km 1.5 km
Minimum 840 m 1.1 km 1.3 km 1.4 km
Mean 850 m 1.1 km 1.3 km 1.4 km
Area 2.3 km2 3.6 km2 5.3 km2 6.4 km2
Table 4-10 Predicted unweighted SPLpeak impact ranges for high-frequency cetaceans using criteria from NMFS (2016) at Creyke Beck B, location ID6
High-frequency cetaceans - impact criterion 2300 kJ hammer energy
3000 kJ hammer energy
3600 kJ hammer energy
4000 kJ hammer energy
Sequence 1 – PTS weighted SELcum (155 dB re 1 µPa2s)
Maximum 1.9 km < 100 m < 100 m < 100 m
Minimum 1.5 km < 100 m < 100 m < 100 m
Mean 1.7 km < 100 m < 100 m < 100 m
Area 9.2 km2 < 0.1 km2 < 0.1 km2 < 0.1 km2
Sequence 1 – TTS weighted SELcum (140 dB re 1 µPa2s)
Maximum 23.1 km 9.7 km 10.7 km 11.5 km
Minimum 14.4 km 7.6 km 8.3 km 8.7 km
Mean 19.0 km 9.0 km 9.8 km 10.4 km
Area 1100 km2 250 km2 300 km2 340 km2
Sequence 2 – PTS weighted SELcum (155 dB re 1 µPa2s)
Maximum 3.5 km < 100 m < 100 m < 100 m
Minimum 2.6 km < 100 m < 100 m < 100 m
Mean 3.3 km < 100 m < 100 m < 100 m
Area 33 km2 < 0.1 km2 < 0.1 km2 < 0.1 km2
Sequence 2 – TTS weighted SELcum (140 dB re 1 µPa2s)
Maximum 33.4 km 15.6 km 17.1 km 18.3 km
Minimum 17.1 km 9.9 km 10.6 km 11.1 km
Mean 25.5 km 13.0 km 14.1 km 14.9 km
Area 2100 km2 530 km2 630 km2 700 km2
Sequence 3 – PTS weighted SELcum (155 dB re 1 µPa2s)
Maximum 4.7 km < 100 m < 100 m < 100 m
Minimum 2.9 km < 100 m < 100 m < 100 m
Mean 4.0 km < 100 m < 100 m < 100 m
Area 50 km2 < 0.1 km2 < 0.1 km2 < 0.1 km2
Sequence 3 – TTS weighted SELcum (140 dB re 1 µPa2s)
Maximum 40.8 km 20.0 km 21.8 km 23.2 km
Minimum 17.9 km 10.4 km 11.2 km 11.7 km
Mean 29.6 km 15.3 km 16.6 km 17.5 km
Area 2900 km2 750 km2 890 km2 990 km2
Table 4-11 Predicted high-frequency cetacean weighted SELcum impact ranges using criteria from NMFS (2016) assuming a fleeing speed of 1.5 ms-1 for the three piling sequences at Creyke Beck B,
location ID6
Many weighted SEL result ranges for high-frequency cetaceans are greater for the 2300 kJ pin pile
installation than the higher energy 3000 to 4000 kJ monopile installation. This is discussed in section
4.2.1.

COMMERCIAL IN CONFIDENCE
Underwater noise modelling at the Creyke Beck offshore wind farms, Dogger Bank
Subacoustech Environmental Ltd. 23
Document Ref: P223R0101
COMMERCIAL IN CONFIDENCE
Phocid pinnipeds - impact criterion 2300 kJ hammer energy
3000 kJ hammer energy
3600 kJ hammer energy
4000 kJ hammer energy
PTS unweighted SPLpeak
(218 re 1 µPa)
Maximum 60 m 70 m 80 m 80 m
Minimum 50 m 60 m 70 m 70 m
Mean 60 m 70 m 80 m 80 m
Area < 0.1 km2 < 0.1 km2 < 0.1 km2 < 0.1 km2
TTS unweighted SPLpeak
(212 re 1 µPa)
Maximum 110 m 130 m 160 m 170 m
Minimum 100 m 120 m 150 m 160 m
Mean 110 m 130 m 160 m 170 m
Area < 0.1 km2 0.1 km2 0.1 km2 0.1 km2
Table 4-12 Predicted unweighted SPLpeak impact ranges for phocid pinnipeds using criteria from NMFS (2016) at Creyke Beck B, location ID6
Phocid pinnipeds - impact criterion 2300 kJ hammer energy
3000 kJ hammer energy
3600 kJ hammer energy
4000 kJ hammer energy
Sequence 1 – PTS weighted SELcum (185 dB re 1 µPa2s)
Maximum < 100 m < 100 m < 100 m < 100 m
Minimum < 100 m < 100 m < 100 m < 100 m
Mean < 100 m < 100 m < 100 m < 100 m
Area < 0.1 km2 < 0.1 km2 < 0.1 km2 < 0.1 km2
Sequence 1 – TTS weighted SELcum (170 dB re 1 µPa2s)
Maximum 5.3 km 7.9 km 8.8 km 9.5 km
Minimum 4.3 km 6.3 km 6.9 km 7.4 km
Mean 5.0 km 7.4 km 8.2 km 8.7 km
Area 79 km2 170 km2 210 km2 240 km2
Sequence 2 – PTS weighted SELcum (185 dB re 1 µPa2s)
Maximum < 100 m < 100 m < 100 m < 100 m
Minimum < 100 m < 100 m < 100 m < 100 m
Mean < 100 m < 100 m < 100 m < 100 m
Area < 0.1 km2 < 0.1 km2 < 0.1 km2 < 0.1 km2
Sequence 2 – TTS weighted SELcum (170 dB re 1 µPa2s)
Maximum 8.7 km 12.7 km 14.1 km 15.2 km
Minimum 6.2 km 8.5 km 9.2 km 9.7 km
Mean 7.7 km 10.9 km 11.9 km 12.7 km
Area 190 km2 370 km2 450 km2 510 km2
Sequence 3 – PTS weighted SELcum (185 dB re 1 µPa2s)
Maximum < 100 m < 100 m < 100 m < 100 m
Minimum < 100 m < 100 m < 100 m < 100 m
Mean < 100 m < 100 m < 100 m < 100 m
Area < 0.1 km2 < 0.1 km2 < 0.1 km2 < 0.1 km2
Sequence 3 – TTS weighted SELcum (170 dB re 1 µPa2s)
Maximum 11.3 km 16.5 km 18.3 km 19.5 km
Minimum 6.6 km 9.0 km 9.7 km 10.2 km
Mean 9.2 km 12.9 km 14.1 km 14.9 km
Area 270 km2 530 km2 640 km2 720 km2
Table 4-13 Predicted phocid pinnipeds weighted SELcum impact ranges using criteria from NMFS (2016) assuming a fleeing speed of 1.5 ms-1 for the three piling sequences at Creyke Beck B, location
ID6
4.2.1 Discussion
Some of the weighted SELcum results in the previous section appear to give paradoxical results, as a
larger hammer hitting a monopile (3000 kJ, 3600 kJ, 4000 kJ) results in lower impact ranges than a
smaller hammer hitting a pin pile (2300 kJ). This is most apparent for HF cetaceans and can be
explained by examining the difference in sensitivity between the marine mammal hearing groups and
the sound frequencies produced by different piles. The effect also exists with mid-frequency cetaceans,
however due to the low impact ranges predicted (Table 4-9), this is not apparent in the results.
To illustrate this, Figure 4-1 and Figure 4-2 show the sound frequency spectra for monopiles and pin
piles, weighted to account for the sensitivities of each of the NMFS (2016) weightings. These can be
compared with the original unweighted frequency spectra in Figure 3-1 (shown faintly in Figure 4-1 and
Figure 4-2). Table 4-14 summarises the equivalent source levels that account for the effect of the
weightings, explaining the differences in results between pin piles and monopiles in the previous
section.

COMMERCIAL IN CONFIDENCE
Underwater noise modelling at the Creyke Beck offshore wind farms, Dogger Bank
Subacoustech Environmental Ltd. 24
Document Ref: P223R0101
COMMERCIAL IN CONFIDENCE
The overall unweighted noise level is higher for the monopile due to the low frequency components of
piling noise (i.e. most of the pile strike energy is in the lower frequencies). The NMFS (2016) filters
remove most of the low frequency components of the noise, especially when considering MF and HF
cetaceans. This leaves the higher frequency noise, which, in the case of the pin piles, is greater than
that for monopiles.
Figure 4-1 Filtered noise inputs for monopiles and pin piles using the LF and MF cetacean weightings
from NMFS (2016). The lighter coloured bars show the unweighted third-octave levels
Figure 4-2 Filtered noise inputs for monopiles and pin piles using the HF cetacean and phocid
pinniped weightings from NMFS (2016). The pale coloured bars show the unweighted third-octave levels
Monopile source level
(3000kJ) Pin pile source level
(2300kJ)
Unweighted SELss 219.2 dB re 1 µPa2s @ 1 m 216.5 dB re 1 µPa2s @ 1 m
LF Cetaceans (NMFS) SELss 213.9 dB re 1 µPa2s @ 1 m 212.5 dB re 1 µPa2s @ 1 m
MF Cetaceans (NMFS) SELss 179.2 dB re 1 µPa2s @ 1 m 183.1 dB re 1 µPa2s @ 1 m
HF Cetaceans (NMFS) SELss 173.1 dB re 1 µPa2s @ 1 m 180.0 dB re 1 µPa2s @ 1 m
Phocid Pinnipeds (NMFS) SELss 201.7 dB re 1 µPa2s @ 1 m 199.3 dB re 1 µPa2s @ 1 m
Table 4-14 Summary of the NMFS (2016) weighted source levels used for modelling pin piles and monopiles

COMMERCIAL IN CONFIDENCE
Underwater noise modelling at the Creyke Beck offshore wind farms, Dogger Bank
Subacoustech Environmental Ltd. 25
Document Ref: P223R0101
COMMERCIAL IN CONFIDENCE
4.3 Popper et al. (2014) impact ranges
Table 4-15 to Table 4-18 present the impact ranges for fish for the Popper et al. (2014) criteria, covering
unweighted SPLpeak and SELcum metrics for all three piling sequences (Table 3-3). All fleeing
calculations have assumed a receptor fleeing at a constant rate of 1.5 ms-1. The results for the 2300 kJ
hammer assume installation of pin piles, whereas the other blow energies assume installation of a
monopile. Ranges smaller than 100 m have not been presented for the SELcum results and relevant
contour plots are presented in Appendix B.
Fish - impact criterion 2300 kJ hammer energy
3000 kJ hammer energy
3600 kJ hammer energy
4000 kJ hammer energy
Injury (fish: no swim bladder) unweighted SPLpeak
(213 re 1 µPa)
Maximum 90 m 120 m 140 m 150 m
Minimum 80 m 110 m 130 m 140 m
Mean 90 m 120 m 140 m 150 m
Area < 0.1 km2 < 0.1 km2 0.1 km2 0.1 km2
Injury (fish: with swim bladder) unweighted SPLpeak
(207 re 1 µPa)
Maximum 200 m 250 m 300 m 340 m
Minimum 190 m 240 m 290 m 330 m
Mean 200 m 250 m 300 m 340 m
Area 0.1 km2 0.2 km2 0.3 km2 0.4 km2
Table 4-15 Predicted unweighted SPLpeak impact ranges for fish using criteria from Popper et al. (2014) at Creyke Beck B, location ID6
Fish - impact criterion (Sequence 1)
2300 kJ hammer energy
3000 kJ hammer energy
3600 kJ hammer energy
4000 kJ hammer energy
Mortality (fish: no swim bladder) SELcum
(> 219 dB re 1 µPa2s)
Maximum < 100 m < 100 m < 100 m < 100 m
Minimum < 100 m < 100 m < 100 m < 100 m
Mean < 100 m < 100 m < 100 m < 100 m
Area < 0.1 km2 < 0.1 km2 < 0.1 km2 < 0.1 km2
Recoverable injury (fish: no swim bladder) SELcum
(> 216 dB re 1 µPa2s)
Maximum < 100 m < 100 m < 100 m < 100 m
Minimum < 100 m < 100 m < 100 m < 100 m
Mean < 100 m < 100 m < 100 m < 100 m
Area < 0.1 km2 < 0.1 km2 < 0.1 km2 < 0.1 km2
Mortality (fish: swim bladder not involved in hearing) SELcum
(210 dB re 1 µPa2s)
Maximum < 100 m < 100 m < 100 m < 100 m
Minimum < 100 m < 100 m < 100 m < 100 m
Mean < 100 m < 100 m < 100 m < 100 m
Area < 0.1 km2 < 0.1 km2 < 0.1 km2 < 0.1 km2
Mortality (fish: swim bladder involved in hearing) SELcum
(207 dB re 1 µPa2s)
Maximum < 100 m < 100 m < 100 m < 100 m
Minimum < 100 m < 100 m < 100 m < 100 m
Mean < 100 m < 100 m < 100 m < 100 m
Area < 0.1 km2 < 0.1 km2 < 0.1 km2 < 0.1 km2
Recoverable injury (fish: with swim bladder) SELcum (203 dB re 1 µPa2s)
Maximum < 100 m < 100 m < 100 m < 100 m
Minimum < 100 m < 100 m < 100 m < 100 m
Mean < 100 m < 100 m < 100 m < 100 m
Area < 0.1 km2 < 0.1 km2 < 0.1 km2 < 0.1 km2
TTS (all fish) SELcum
(186 re 1 µPa2s)
Maximum 6.5 km 9.8 km 10.8 km 11.6 km
Minimum 5.1 km 7.5 km 8.2 km 8.7 km
Mean 6.1 km 9.0 km 9.8 km 10.5 km
Area 110 km2 250 km2 300 km2 340 km2
Table 4-16 Predicted unweighted SELcum impact ranges for fish using criteria from Popper et al. (2014) assuming a fleeing speed of 1.5 ms-1 for piling sequence 1 at Creyke Beck B, location ID6

COMMERCIAL IN CONFIDENCE
Underwater noise modelling at the Creyke Beck offshore wind farms, Dogger Bank
Subacoustech Environmental Ltd. 26
Document Ref: P223R0101
COMMERCIAL IN CONFIDENCE
Fish - impact criterion (Sequence 2)
2300 kJ hammer energy
3000 kJ hammer energy
3600 kJ hammer energy
4000 kJ hammer energy
Mortality (fish: no swim bladder) SELcum
(> 219 dB re 1 µPa2s)
Maximum < 100 m < 100 m < 100 m < 100 m
Minimum < 100 m < 100 m < 100 m < 100 m
Mean < 100 m < 100 m < 100 m < 100 m
Area < 0.1 km2 < 0.1 km2 < 0.1 km2 < 0.1 km2
Recoverable injury (fish: no swim bladder) SELcum
(> 216 dB re 1 µPa2s)
Maximum < 100 m < 100 m < 100 m < 100 m
Minimum < 100 m < 100 m < 100 m < 100 m
Mean < 100 m < 100 m < 100 m < 100 m
Area < 0.1 km2 < 0.1 km2 < 0.1 km2 < 0.1 km2
Mortality (fish: swim bladder not involved in hearing) SELcum
(210 dB re 1 µPa2s)
Maximum < 100 m < 100 m < 100 m < 100 m
Minimum < 100 m < 100 m < 100 m < 100 m
Mean < 100 m < 100 m < 100 m < 100 m
Area < 0.1 km2 < 0.1 km2 < 0.1 km2 < 0.1 km2
Mortality (fish: swim bladder involved in hearing) SELcum
(207 dB re 1 µPa2s)
Maximum < 100 m < 100 m < 100 m < 100 m
Minimum < 100 m < 100 m < 100 m < 100 m
Mean < 100 m < 100 m < 100 m < 100 m
Area < 0.1 km2 < 0.1 km2 < 0.1 km2 < 0.1 km2
Recoverable injury (fish: with swim bladder) SELcum (203 dB re 1 µPa2s)
Maximum < 100 m < 100 m < 100 m < 100 m
Minimum < 100 m < 100 m < 100 m < 100 m
Mean < 100 m < 100 m < 100 m < 100 m
Area < 0.1 km2 < 0.1 km2 < 0.1 km2 < 0.1 km2
TTS (all fish) SELcum
(186 re 1 µPa2s)
Maximum 10.5 km 15.7 km 17.3 km 18.4 km
Minimum 7.2 km 9.9 km 10.6 km 11.1 km
Mean 9.2 km 13.0 km 14.1 km 14.9 km
Area 260 km2 540 km2 630 km2 710 km2
Table 4-17 Predicted unweighted SELcum impact ranges for fish using criteria from Popper et al. (2014) assuming a fleeing speed of 1.5 ms-1 for piling sequence 2 at Creyke Beck B, location ID6
Fish - impact criterion (Sequence 3)
2300 kJ hammer energy
3000 kJ hammer energy
3600 kJ hammer energy
4000 kJ hammer energy
Mortality (fish: no swim bladder) SELcum
(> 219 dB re 1 µPa2s)
Maximum < 100 m < 100 m < 100 m < 100 m
Minimum < 100 m < 100 m < 100 m < 100 m
Mean < 100 m < 100 m < 100 m < 100 m
Area < 0.1 km2 < 0.1 km2 < 0.1 km2 < 0.1 km2
Recoverable injury (fish: no swim bladder) SELcum
(> 216 dB re 1 µPa2s)
Maximum < 100 m < 100 m < 100 m < 100 m
Minimum < 100 m < 100 m < 100 m < 100 m
Mean < 100 m < 100 m < 100 m < 100 m
Area < 0.1 km2 < 0.1 km2 < 0.1 km2 < 0.1 km2
Mortality (fish: swim bladder not involved in hearing) SELcum
(210 dB re 1 µPa2s)
Maximum < 100 m < 100 m < 100 m < 100 m
Minimum < 100 m < 100 m < 100 m < 100 m
Mean < 100 m < 100 m < 100 m < 100 m
Area < 0.1 km2 < 0.1 km2 < 0.1 km2 < 0.1 km2
Mortality (fish: swim bladder involved in hearing) SELcum
(207 dB re 1 µPa2s)
Maximum < 100 m < 100 m < 100 m < 100 m
Minimum < 100 m < 100 m < 100 m < 100 m
Mean < 100 m < 100 m < 100 m < 100 m
Area < 0.1 km2 < 0.1 km2 < 0.1 km2 < 0.1 km2
Recoverable injury (fish: with swim bladder) SELcum (203 dB re 1 µPa2s)
Maximum < 100 m < 100 m < 100 m < 100 m
Minimum < 100 m < 100 m < 100 m < 100 m
Mean < 100 m < 100 m < 100 m < 100 m
Area < 0.1 km2 < 0.1 km2 < 0.1 km2 < 0.1 km2
TTS (all fish) SELcum
(186 re 1 µPa2s)
Maximum 13.7 km 20.2 km 22.0 km 23.4 km
Minimum 7.7 km 10.4 km 11.1 km 11.7 km
Mean 10.9 km 15.4 km 16.6 km 17.6 km
Area 380 km2 760 km2 900 km2 1000 km2
Table 4-18 Predicted unweighted SELcum impact ranges for fish using criteria from Popper et al. (2014) assuming a fleeing speed of 1.5 ms-1 for piling sequence 3 at Creyke Beck B, location ID6

COMMERCIAL IN CONFIDENCE
Underwater noise modelling at the Creyke Beck offshore wind farms, Dogger Bank
Subacoustech Environmental Ltd. 27
Document Ref: P223R0101
COMMERCIAL IN CONFIDENCE
5 Summary and conclusions
Underwater noise modelling was carried out by NPL in 2012 to assess the effects of impact piling noise
on fish and marine mammals from the construction of the Creyke Beck offshore wind farms, in the
Dogger Bank development area. In the time since the original modelling was completed, new noise
thresholds and criteria have been developed by NMFS (2016) for marine mammals and Popper et al.
(2014) for fish. To obtain impact ranges for these new criteria, additional modelling has been carried
out by Subacoustech Environmental.
The modelling undertaken by NPL utilised an energy flux solution, and the model used is not openly
available. Subacoustech have used a different but comparable method using the semi-empirical
INSPIRE model. This additional modelling has sought to be compatible with and provide equivalent
results to the original modelling. A conservative fit to the data was used so that levels predicted along
the worst-case transect match with the highest levels reported originally, especially at the greatest
distances. Overall, there was a good level of correlation between the two modelling result datasets.
In addition to modelling to the new criteria, the effects of two piling hammer blow energies greater than
that considered originally have been assessed (3600 kJ and 4000 kJ).
The modelling results using the new metrics showed that, using the NMFS (2016) SPLpeak criteria,
ranges are largely within a few hundred metres, with only the TTS ranges for high-frequency cetaceans
extending over 1 km. When considering the SELcum values for fleeing animals, the PTS and TTS ranges
are much larger with TTS ranges for low-frequency cetaceans of 38.5 to 55.9 km depending on the
piling sequence. Also, predicted impact ranges for ramp-up sequence 3 (with 12,600 pile strikes)
resulted in larger ranges than those predicted for ramp-up sequence 1 (with 2,000 pile strikes).
When considering the Popper et al. (2014) criteria, the ranges calculated are no greater than 340 m,
with many, especially the SELcum criteria, being less than 100 m. The exceptions were ranges modelled
for TTS, where the largest values predicted were when considering the largest blow energy, with impact
ranges of between 11.6 and 23.4 km depending on the piling ramp up scenario.
All modelled scenarios using the increased maximum blow energies for monopiles result in larger
impact ranges than with the largest monopile blow energy used in the original report.

COMMERCIAL IN CONFIDENCE
Underwater noise modelling at the Creyke Beck offshore wind farms, Dogger Bank
Subacoustech Environmental Ltd. 28
Document Ref: P223R0101
COMMERCIAL IN CONFIDENCE
References
1. Blix A S and Folkow L P (1995). Daily energy expenditure in free living minke whales. Acta
Physiol. Scand., 153:61-66.
2. Carlson T, Hastings M, Popper A N (2007). Memorandum – Update on recommendations for
revised interim sound exposure criteria for fish during pile driving activities. Sent to California
Dept. of Trans. And Washingron Dept. of Trans.
3. Halvorsen M B, Casper B M, Woodley C M, Carlson T J, Popper A N (2011). Predicting and
mitigating hydroacoustic impacts on fish from pile installations. NCHRP Research Results
Digest 363, Project 25-28, National cooperative Highway Research Program, Transportation
Research Board, National Academy of Sciences, Washington D.C.
4. Hastings M C, Popper A N (2005). Effects of sound on fish. Report to the California Department
of Transport, under Contract No. 43A01392005, January 2005.
5. Hirata K (1999). Swimming speeds of some common fish. National Maritime Research Institute
(Japan). Data sourced from Iwai T, Hisada M (1998). Fishes – Illustrated Book of Gakken (in
Japanese). Accessed on 8th March 2017 at http://www.nmri.go.jp/eng/khirata/fish/general/
speed/speede/htm
6. Lucke K, Lepper P A, Blanchet M (2009). Temporary shift in masked hearing thresholds in a
harbour porpoise (Phocoena phocoena) after exposure to seismic airgun stimuli. J. Acoust.
Soc. Am. 125(6), 4060-4070.
7. McCauley R D, Fewtrell K, Duncan A J, Jenner C, Jenner M-N, Penrose J D, Prince R I T,
Adhitya A, Murdoch J, McCabe K (2000). Marine seismic surveys – A study of environmental
implications. Appea Journal, pp 692-708.
8. National Marine Fisheries Service (NMFS) (2016). Technical guidance for assessing the effects
of anthropogenic sound on marine mammal hearing: Underwater acoustic thresholds for onset
of permanent and temporary threshold shifts. U.S. Dept. of Commer., NOAA. NOAA Technical
Memorandum NMFS-OPR-55, 178 p.
9. Otani S, Naito T, Kato A, Kawamura A (2000). Diving behaviour and swimming speed of a free-
ranging harbour porpoise (Phocoena phocoena). Marine mammal science, Volume 16, Issue
4, pp 811-814, October 2000.
10. Pearson W H, Skalski J R, Malme C I (1992). Effects of sounds from a geophysical survey
device on behaviour of captive rockfish (Sebastes spp.). Can. J. Fish. Aquat. Sci., 49, pp. 1343-
1355.
11. Popper A N, Carlson T J, Hawkins A D, Southall B D, Gentry R L (2006). Interim criteria for
injury in fish exposed to a pile driving operation. A white paper, available from
http://www.wsdot.wa.gov/NR/rdonlyres/84A6313A-9297-42C9-BFA6-750A691E1DB3/0/BA_
PileDrivingInterimCriteria.pdf 2005.
12. Popper A N, Hawkins A D, Fay R R, Mann D A, Bartol S, Carlson T J, Coombs S, Ellison W T,
Gentry R L, Halvorsen M B, Løkkeborg S, Rogers P H, Southall B L, Zeddies D G, Tavolga W
N (2014). Sound Exposure Guidelines for Fishes and Sea Turtles. Springer Briefs in
Oceanography, DOI 10. 1007/978-3-319-06659-2.
13. Robinson S P, Lepper P A, Hazelwood R A (2014). Good practice guide for underwater noise
measurement. National Measurement Office, Marine Scotland, The Crown Estate. NPL Good
Practice Guide No. 133, ISSN: 1368-6550.

COMMERCIAL IN CONFIDENCE
Underwater noise modelling at the Creyke Beck offshore wind farms, Dogger Bank
Subacoustech Environmental Ltd. 29
Document Ref: P223R0101
COMMERCIAL IN CONFIDENCE
14. Southall B L, Bowles A E, Ellison W T, Finneran J J, Gentry R L, Green Jr. C R, Kastak D,
Ketten D R, Miller J H, Nachtigall P E, Richardson W J, Thomas J A, Tyack P L (2007). Marine
mammal noise exposure criteria: Initial scientific recommendations. Aquatic Mammals, 33 (4),
pp. 411-509.
15. Theobald P, Pangerc T, Wang L, Lepper P (2012). Underwater noise modelling to support the
Dogger Bank Wind Farm Environmental Impact Assessment for Creyke Beck A and Creyke
Beck B. NPL Report AIR (RES) 059, 18th October 2012. In ‘Dogger Bank Creyke Beck
Environmental Statement Chapter 5 Appendix A: Underwater Noise Technical Report’
Appendix Reference 6.5.1, August 2013.
16. Weston D (1976). Propagation in water with uniform sound velocity by variable-depth lossy
bottom. Journal of Sound and Vibration, 49, pp. 473-483.
COMMERCIAL IN CONFIDENCE
Underwater noise modelling at the Creyke Beck offshore wind farms, Dogger Bank
Subacoustech Environmental Ltd. 30
Document Ref: P223R0101
COMMERCIAL IN CONFIDENCE
Appendix A Complete modelling results
This appendix presents all the results from modelling at the four locations at Creyke Beck A and B.
Predicted ranges smaller than 50 m, and area less than 0.1 km2 for single strike criteria and 100 m for
cumulative criteria, have not been presented as the modelling processes are unable to specify that level
of accuracy with confidence due to acoustic effects near the source and other noise processes at close
ranges. The results that are large enough to be shown clearly are also presented in Appendix B as
contour plots.
Table A 1 Predicted harbour porpoise impact ranges using criteria derived from Lucke et al. (2009) at Creyke Beck A, location ID6 .................................................................................................... 34
Table A 2 Predicted mid-frequeny cetacean impact ranges using criteria derived from Southall et al. (2007) at Creyke Beck A, location ID6 ..................................................................................... 35
Table A 3 Predicted low-frequency cetacean impact ranges using criteria derived from Southall et al. (2007) at Creyke Beck A, location ID6 ..................................................................................... 35
Table A 4 Predicted pinniped (in water) impact ranges using criteria from Southall et al. (2007) at Creyke Beck A, location ID6 ................................................................................................................. 36
Table A 5 Predicted fish impact ranges using criteria from Popper et al. (2006), Carlson et al. (2007), Halvorsen et al (2011), McCauley et al. (2000) and Pearson et al. (1992) at Creyke Beck A, location ID6 .............................................................................................................................. 36
Table A 6 Predicted unweighted SPLpeak impact ranges for low-frequency cetaceans using criteria from NMFS (2016) at Creyke Beck A, location ID6.......................................................................... 37
Table A 7 Predicted low-frequency cetacean weighted SELcum impact ranges using criteria from NMFS (2016) assuming a fleeing speed of 3.25 ms-1 for the three piling sequences at Creyke Beck A, location ID6 .............................................................................................................................. 37
Table A 8 Predicted unweighted SPLpeak impact ranges for mid-frequency cetaceans using criteria from NMFS (2016) at Creyke Beck A, location ID6.......................................................................... 37
Table A 9 Predicted mid-frequency cetacean weighted SELcum impact ranges using criteria from NMFS (2016) assuming a fleeing speed of 1.5 ms-1 for the three piling sequences at Creyke Beck A, location ID6 .............................................................................................................................. 38
Table A 10 Predicted unweighted SPLpeak impact ranges for high-frequency cetaceans using criteria from NMFS (2016) at Creyke Beck A, location ID6 ................................................................. 38
Table A 11 Predicted high-frequency cetacean weighted SELcum impact ranges using criteria from NMFS (2016) assuming a fleeing speed of 1.5 ms-1 for the three piling sequences at Creyke Beck A, location ID6 ................................................................................................................. 39
Table A 12 Predicted unweighted SPLpeak impact ranges for phocid pinnipeds using criteria from NMFS (2016) at Creyke Beck A, location ID6 ..................................................................................... 39
Table A 13 Predicted phocid pinnipeds weighted SELcum impact ranges using criteria from NMFS (2016) assuming a fleeing speed of 1.5 ms-1 for the three piling sequences at Creyke Beck A, location ID6 ............................................................................................................................................ 40

COMMERCIAL IN CONFIDENCE
Underwater noise modelling at the Creyke Beck offshore wind farms, Dogger Bank
Subacoustech Environmental Ltd. 31
Document Ref: P223R0101
COMMERCIAL IN CONFIDENCE
Table A 14 Predicted unweighted SPLpeak impact ranges for fish using criteria from Popper et al. (2014) at Creyke Beck A, location ID6 ................................................................................................ 40
Table A 15 Predicted unweighted SELcum impact ranges for fish using criteria from Popper et al. (2014) assuming a fleeing speed of 1.5 ms-1 for piling sequence 1 at Creyke Beck A, location ID6 .. 41
Table A 16 Predicted unweighted SELcum impact ranges for fish using criteria from Popper et al. (2014) assuming a fleeing speed of 1.5 ms-1 for piling sequence 2 at Creyke Beck A, location ID6 .. 41
Table A 17 Predicted unweighted SELcum impact ranges for fish using criteria from Popper et al. (2014) assuming a fleeing speed of 1.5 ms-1 for piling sequence 3 at Creyke Beck A, location ID6 .. 42
Table A 18 Predicted harbour porpoise impact ranges using criteria derived from Lucke et al. (2009) at Creyke Beck A, location ID11 .................................................................................................. 43
Table A 19 Predicted mid-frequency cetacean impact ranges using criteria derived from Southall et al. (2007) at Creyke Beck A, location ID11 ................................................................................... 44
Table A 20 Predicted low-frequency cetacean impact ranges using criteria derived from Southall et al. (2007) at Creyke Beck A, location ID11 ................................................................................... 44
Table A 21 Predicted pinniped (in water) impact ranges using criteria from Southall et al. (2007) at Creyke Beck A, location ID11 .................................................................................................. 45
Table A 22 Predicted fish impact ranges using criteria from Popper et al. (2006), Carlson et al. (2007), Halvorsen et al (2011), McCauley et al. (2000) and Pearson et al. (1992) at Creyke Beck A, location ID11 ............................................................................................................................ 45
Table A 23 Predicted unweighted SPLpeak impact ranges for low-frequency cetaceans using criteria from NMFS (2016) at Creyke Beck A, location ID11 ....................................................................... 46
Table A 24 Predicted low-frequency cetacean weighted SELcum impact ranges using criteria from NMFS (2016) assuming a fleeing speed of 3.25 ms-1 for the three piling sequences at Creyke Beck A, location ID11 ............................................................................................................................ 46
Table A 25 Predicted unweighted SPLpeak impact ranges for mid-frequency cetaceans using criteria from NMFS (2016) at Creyke Beck A, location ID11 ............................................................... 46
Table A 26 Predicted mid-frequency cetacean weighted SELcum impact ranges using criteria from NMFS (2016) assuming a fleeing speed of 1.5 ms-1 for the three piling sequences at Creyke Beck A, location ID11 ............................................................................................................................ 47
Table A 27 Predicted unweighted SPLpeak impact ranges for high-frequency cetaceans using criteria from NMFS (2016) at Creyke Beck A, location ID11 ............................................................... 47
Table A 28 Predicted high-frequency cetacean weighted SELcum impact ranges using criteria from NMFS (2016) assuming a fleeing speed of 1.5 ms-1 for the three piling sequences at Creyke Beck A, location ID11 ............................................................................................................... 48
Table A 29 Predicted unweighted SPLpeak impact ranges for phocid pinnipeds using criteria from NMFS (2016) at Creyke Beck A, location ID11 ................................................................................... 48
Table A 30 Predicted phocid pinnipeds weighted SELcum impact ranges using criteria from NMFS (2016) assuming a fleeing speed of 1.5 ms-1 for the three piling sequences at Creyke Beck A, location ID11 .......................................................................................................................................... 49
COMMERCIAL IN CONFIDENCE
Underwater noise modelling at the Creyke Beck offshore wind farms, Dogger Bank
Subacoustech Environmental Ltd. 32
Document Ref: P223R0101
COMMERCIAL IN CONFIDENCE
Table A 31 Predicted unweighted SPLpeak impact ranges for fish using criteria from Popper et al. (2014) at Creyke Beck A, location ID11 .............................................................................................. 49
Table A 32 Predicted unweighted SELcum impact ranges for fish using criteria from Popper et al. (2014) assuming a fleeing speed of 1.5 ms-1 for piling sequence 1 at Creyke Beck A, location ID11 50
Table A 33 Predicted unweighted SELcum impact ranges for fish using criteria from Popper et al. (2014) assuming a fleeing speed of 1.5 ms-1 for piling sequence 2 at Creyke Beck A, location ID11 50
Table A 34 Predicted unweighted SELcum impact ranges for fish using criteria from Popper et al. (2014) assuming a fleeing speed of 1.5 ms-1 for piling sequence 3 at Creyke Beck A, location ID11 51
Table A 35 Predicted harbour porpoise impact ranges using criteria derived from Lucke et al. (2009) at Creyke Beck B, location ID6 .................................................................................................... 52
Table A 36 Predicted mid-frequency cetacean impact ranges using criteria derived from Southall et al. (2007) at Creyke Beck B, location ID6 ..................................................................................... 53
Table A 37 Predicted low-frequency cetacean impact ranges using criteria derived from Southall et al. (2007) at Creyke Beck B, location ID6 ..................................................................................... 53
Table A 38 Predicted pinniped (in water) impact ranges using criteria from Southall et al. (2007) at Creyke Beck B, location ID6 .................................................................................................... 54
Table A 39 Predicted fish impact ranges using criteria from Popper et al. (2006), Carlson et al. (2007), Halvorsen et al (2011), McCauley et al. (2000) and Pearson et al. (1992) at Creyke Beck B, location ID6 .............................................................................................................................. 54
Table A 40 Predicted unweighted SPLpeak impact ranges for low-frequency cetaceans using criteria from NMFS (2016) at Creyke Beck B, location ID6.......................................................................... 55
Table A 41 Predicted low-frequency cetacean weighted SELcum impact ranges using criteria from NMFS (2016) assuming a fleeing speed of 3.25 ms-1 for the three piling sequences at Creyke Beck B, location ID6 .............................................................................................................................. 55
Table A 42 Predicted unweighted SPLpeak impact ranges for mid-frequency cetaceans using criteria from NMFS (2016) at Creyke Beck B, location ID6 ................................................................. 55
Table A 43 Predicted mid-frequency cetacean weighted SELcum impact ranges using criteria from NMFS (2016) assuming a fleeing speed of 1.5 ms-1 for the three piling sequences at Creyke Beck B, location ID6 .............................................................................................................................. 56
Table A 44 Predicted unweighted SPLpeak impact ranges for high-frequency cetaceans using criteria from NMFS (2016) at Creyke Beck B, location ID6 ................................................................. 56
Table A 45 Predicted high-frequency cetacean weighted SELcum impact ranges using criteria from NMFS (2016) assuming a fleeing speed of 1.5 ms-1 for the three piling sequences at Creyke Beck B, location ID6 ................................................................................................................. 57
Table A 46 Predicted unweighted SPLpeak impact ranges for phocid pinnipeds using criteria from NMFS (2016) at Creyke Beck B, location ID6 ..................................................................................... 57
Table A 47 Predicted phocid pinnipeds weighted SELcum impact ranges using criteria from NMFS (2016) assuming a fleeing speed of 1.5 ms-1 for the three piling sequences at Creyke Beck B, location ID6 ............................................................................................................................................ 58

COMMERCIAL IN CONFIDENCE
Underwater noise modelling at the Creyke Beck offshore wind farms, Dogger Bank
Subacoustech Environmental Ltd. 33
Document Ref: P223R0101
COMMERCIAL IN CONFIDENCE
Table A 48 Predicted unweighted SPLpeak impact ranges for fish using criteria from Popper et al. (2014) at Creyke Beck B, location ID6 ................................................................................................ 58
Table A 49 Predicted unweighted SELcum impact ranges for fish using criteria from Popper et al. (2014) assuming a fleeing speed of 1.5 ms-1 for piling sequence 1 at Creyke Beck B, location ID6 .. 59
Table A 50 Predicted unweighted SELcum impact ranges for fish using criteria from Popper et al. (2014) assuming a fleeing speed of 1.5 ms-1 for piling sequence 2 at Creyke Beck B, location ID6 .. 59
Table A 51 Predicted unweighted SELcum impact ranges for fish using criteria from Popper et al. (2014) assuming a fleeing speed of 1.5 ms-1 for piling sequence 3 at Creyke Beck B, location ID6 .. 60
Table A 52 Predicted harbour porpoise impact ranges using criteria derived from Lucke et al. (2009) at Creyke Beck B, location ID13 .................................................................................................. 61
Table A 53 Predicted mid-frequency cetacean impact ranges using criteria derived from Southall et al. (2007) at Creyke Beck B, location ID13 ................................................................................... 62
Table A 54 Predicted low-frequency cetacean impact ranges using criteria derived from Southall et al. (2007) at Creyke Beck B, location ID13 ................................................................................... 62
Table A 55 Predicted pinniped (in water) impact ranges using criteria from Southall et al. (2007) at Creyke Beck B, location ID13 .................................................................................................. 63
Table A 56 Predicted fish impact ranges using criteria from Popper et al. (2006), Carlson et al. (2007), Halvorsen et al. (2011), McCauley et al. (2000) and Pearson et al. (1992) at Creyke Beck B, location ID13 ............................................................................................................................ 63
Table A 57 Predicted unweighted SPLpeak impact ranges for low-frequency cetaceans using criteria from NMFS (2016) at Creyke Beck B, location ID13 ....................................................................... 64
Table A 58 Predicted low-frequency cetacean weighted SELcum impact ranges using criteria from NMFS (2016) assuming a fleeing speed of 3.25 ms-1 for the three piling sequences at Creyke Beck B, location ID13 ............................................................................................................................ 64
Table A 59 Predicted unweighted SPLpeak impact ranges for mid-frequency cetaceans using criteria from NMFS (2016) at Creyke Beck B, location ID13 ............................................................... 64
Table A 60 Predicted mid-frequency cetacean weighted SELcum impact ranges using criteria from NMFS (2016) assuming a fleeing speed of 1.5 ms-1 for the three piling sequences at Creyke Beck B, location ID13 ............................................................................................................................ 65
Table A 61 Predicted unweighted SPLpeak impact ranges for high-frequency cetaceans using criteria from NMFS (2016) at Creyke Beck B, location ID13 ............................................................... 65
Table A 62 Predicted high-frequency cetacean weighted SELcum impact ranges using criteria from NMFS (2016) assuming a fleeing speed of 1.5 ms-1 for the three piling sequences at Creyke Beck B, location ID13 ............................................................................................................... 66
Table A 63 Predicted unweighted SPLpeak impact ranges for phocid pinnipeds using criteria from NMFS (2016) at Creyke Beck B, location ID13 ................................................................................... 66
Table A 64 Predicted phocid pinnipeds weighted SELcum impact ranges using criteria from NMFS (2016) assuming a fleeing speed of 1.5 ms-1 for the three piling sequences at Creyke Beck B, location ID13 .......................................................................................................................................... 67
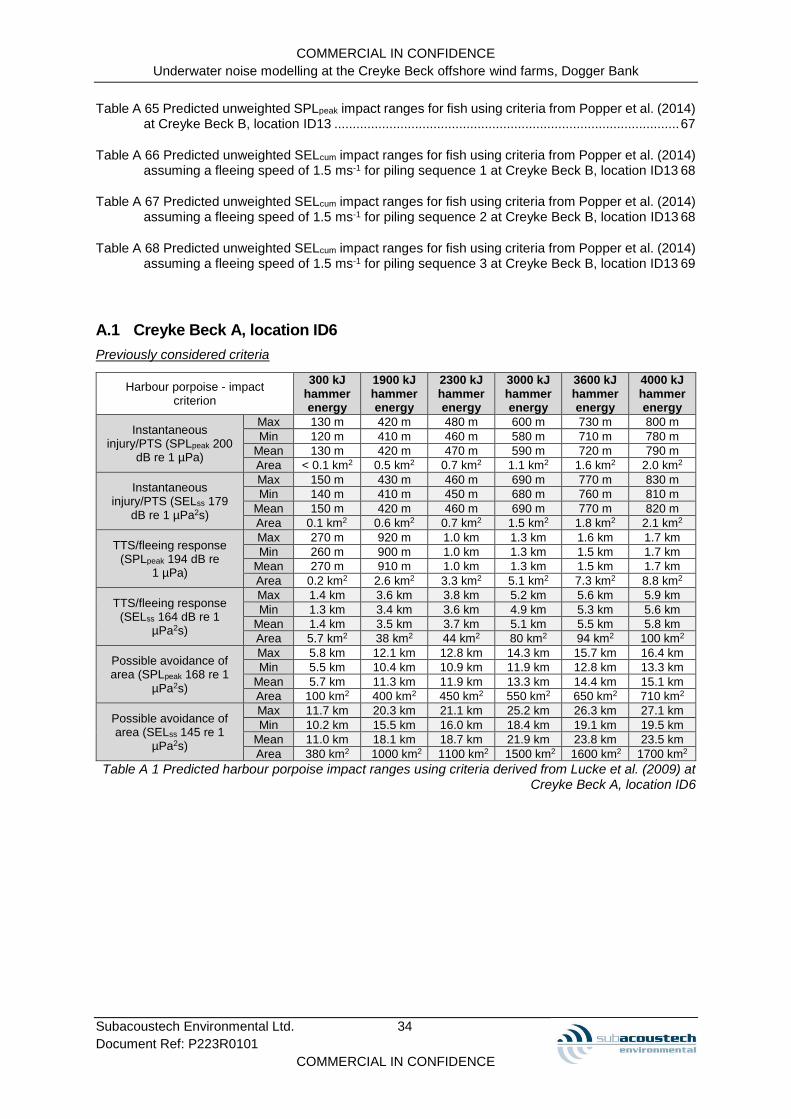
COMMERCIAL IN CONFIDENCE
Underwater noise modelling at the Creyke Beck offshore wind farms, Dogger Bank
Subacoustech Environmental Ltd. 34
Document Ref: P223R0101
COMMERCIAL IN CONFIDENCE
Table A 65 Predicted unweighted SPLpeak impact ranges for fish using criteria from Popper et al. (2014) at Creyke Beck B, location ID13 .............................................................................................. 67
Table A 66 Predicted unweighted SELcum impact ranges for fish using criteria from Popper et al. (2014) assuming a fleeing speed of 1.5 ms-1 for piling sequence 1 at Creyke Beck B, location ID13 68
Table A 67 Predicted unweighted SELcum impact ranges for fish using criteria from Popper et al. (2014) assuming a fleeing speed of 1.5 ms-1 for piling sequence 2 at Creyke Beck B, location ID13 68
Table A 68 Predicted unweighted SELcum impact ranges for fish using criteria from Popper et al. (2014) assuming a fleeing speed of 1.5 ms-1 for piling sequence 3 at Creyke Beck B, location ID13 69
A.1 Creyke Beck A, location ID6
Previously considered criteria
Harbour porpoise - impact criterion
300 kJ hammer energy
1900 kJ hammer energy
2300 kJ hammer energy
3000 kJ hammer energy
3600 kJ hammer energy
4000 kJ hammer energy
Instantaneous injury/PTS (SPLpeak 200
dB re 1 µPa)
Max 130 m 420 m 480 m 600 m 730 m 800 m
Min 120 m 410 m 460 m 580 m 710 m 780 m
Mean 130 m 420 m 470 m 590 m 720 m 790 m
Area < 0.1 km2 0.5 km2 0.7 km2 1.1 km2 1.6 km2 2.0 km2
Instantaneous injury/PTS (SELss 179
dB re 1 µPa2s)
Max 150 m 430 m 460 m 690 m 770 m 830 m
Min 140 m 410 m 450 m 680 m 760 m 810 m
Mean 150 m 420 m 460 m 690 m 770 m 820 m
Area 0.1 km2 0.6 km2 0.7 km2 1.5 km2 1.8 km2 2.1 km2
TTS/fleeing response (SPLpeak 194 dB re
1 µPa)
Max 270 m 920 m 1.0 km 1.3 km 1.6 km 1.7 km
Min 260 m 900 m 1.0 km 1.3 km 1.5 km 1.7 km
Mean 270 m 910 m 1.0 km 1.3 km 1.5 km 1.7 km
Area 0.2 km2 2.6 km2 3.3 km2 5.1 km2 7.3 km2 8.8 km2
TTS/fleeing response (SELss 164 dB re 1
µPa2s)
Max 1.4 km 3.6 km 3.8 km 5.2 km 5.6 km 5.9 km
Min 1.3 km 3.4 km 3.6 km 4.9 km 5.3 km 5.6 km
Mean 1.4 km 3.5 km 3.7 km 5.1 km 5.5 km 5.8 km
Area 5.7 km2 38 km2 44 km2 80 km2 94 km2 100 km2
Possible avoidance of area (SPLpeak 168 re 1
µPa2s)
Max 5.8 km 12.1 km 12.8 km 14.3 km 15.7 km 16.4 km
Min 5.5 km 10.4 km 10.9 km 11.9 km 12.8 km 13.3 km
Mean 5.7 km 11.3 km 11.9 km 13.3 km 14.4 km 15.1 km
Area 100 km2 400 km2 450 km2 550 km2 650 km2 710 km2
Possible avoidance of area (SELss 145 re 1
µPa2s)
Max 11.7 km 20.3 km 21.1 km 25.2 km 26.3 km 27.1 km
Min 10.2 km 15.5 km 16.0 km 18.4 km 19.1 km 19.5 km
Mean 11.0 km 18.1 km 18.7 km 21.9 km 23.8 km 23.5 km
Area 380 km2 1000 km2 1100 km2 1500 km2 1600 km2 1700 km2
Table A 1 Predicted harbour porpoise impact ranges using criteria derived from Lucke et al. (2009) at Creyke Beck A, location ID6

COMMERCIAL IN CONFIDENCE
Underwater noise modelling at the Creyke Beck offshore wind farms, Dogger Bank
Subacoustech Environmental Ltd. 35
Document Ref: P223R0101
COMMERCIAL IN CONFIDENCE
Mid-frequency cetaceans - impact criterion
300 kJ hammer energy
1900 kJ hammer energy
2300 kJ hammer energy
3000 kJ hammer energy
3600 kJ hammer energy
4000 kJ hammer energy
Instantaneous injury/PTS (SPLpeak 230
dB re 1 µPa)
Max < 50 m < 50 m < 50 m < 50 m < 50 m < 50 m
Min < 50 m < 50 m < 50 m < 50 m < 50 m < 50 m
Mean < 50 m < 50 m < 50 m < 50 m < 50 m < 50 m
Area < 0.1 km2 < 0.1 km2 < 0.1 km2 < 0.1 km2 < 0.1 km2 < 0.1 km2
Instantaneous injury/PTS (Mmf SELss
198 dB re 1 µPa2s)
Max < 50 m < 50 m < 50 m < 50 m < 50 m < 50 m
Min < 50 m < 50 m < 50 m < 50 m < 50 m < 50 m
Mean < 50 m < 50 m < 50 m < 50 m < 50 m < 50 m
Area < 0.1 km2 < 0.1 km2 < 0.1 km2 < 0.1 km2 < 0.1 km2 < 0.1 km2
TTS/fleeing response (SPLpeak 224 dB re 1
µPa)
Max < 50 m < 50 m < 50 m < 50 m < 50 m < 50 m
Min < 50 m < 50 m < 50 m < 50 m < 50 m < 50 m
Mean < 50 m < 50 m < 50 m < 50 m < 50 m < 50 m
Area < 0.1 km2 < 0.1 km2 < 0.1 km2 < 0.1 km2 < 0.1 km2 < 0.1 km2
TTS/fleeing response (Mmf SELss 183 dB re 1
µPa2s)
Max < 50 m 90 m 110 m 140 m 150 m 160 m
Min < 50 m 80 m 100 m 130 m 140 m 150 m
Mean < 50 m 90 m 110 m 140 m 140 m 160 m
Area < 0.1 km2 < 0.1 km2 < 0.1 km2 0.1 km2 0.1 km2 0.1 km2
Likely avoidance of area (SELss 170 re 1 µPa2s)
Max 560 m 1.6 km 1.8 km 2.5 km 2.8 km 3.0 km
Min 550 m 1.6 km 1.7 km 2.4 km 2.7 km 2.8 km
Mean 560 m 1.6 km 1.7 km 2.5 km 2.7 km 2.9 km
Area 1.0 km2 8.0 km2 9.2 km2 19 km2 23 km2 26 km2
Possible avoidance of area (SELss 160 re 1
µPa2s)
Max 2.4 km 5.6 km 5.9 km 7.8 km 8.3 km 8.7 km
Min 2.3 km 5.3 km 5.6 km 7.3 km 7.8 km 8.1 km
Mean 2.4 km 5.5 km 5.8 km 7.5 km 8.0 km 8.4 km
Area 17 km2 95 km2 110 km2 180 km2 200 km2 220 km2
Table A 2 Predicted mid-frequeny cetacean impact ranges using criteria derived from Southall et al. (2007) at Creyke Beck A, location ID6
Low-frequency cetaceans - impact criterion
300 kJ hammer energy
1900 kJ hammer energy
2300 kJ hammer energy
3000 kJ hammer energy
3600 kJ hammer energy
4000 kJ hammer energy
Instantaneous injury/PTS (SPLpeak 230
dB re 1 µPa)
Max < 50 m < 50 m < 50 m < 50 m < 50 m < 50 m
Min < 50 m < 50 m < 50 m < 50 m < 50 m < 50 m
Mean < 50 m < 50 m < 50 m < 50 m < 50 m < 50 m
Area < 0.1 km2 < 0.1 km2 < 0.1 km2 < 0.1 km2 < 0.1 km2 < 0.1 km2
Instantaneous injury/PTS (Mlf SELss 198 dB re 1 µPa2s)
Max < 50 m < 50 m < 50 m 50 m 50 m 50 m
Min < 50 m < 50 m < 50 m < 50 m < 50 m < 50 m
Mean < 50 m < 50 m < 50 m < 50 m < 50 m < 50 m
Area < 0.1 km2 < 0.1 km2 < 0.1 km2 < 0.1 km2 < 0.1 km2 < 0.1 km2
TTS/fleeing response (SPLpeak 224 dB re 1
µPa)
Max < 50 m < 50 m < 50 m < 50 m < 50 m < 50 m
Min < 50 m < 50 m < 50 m < 50 m < 50 m < 50 m
Mean < 50 m < 50 m < 50 m < 50 m < 50 m < 50 m
Area < 0.1 km2 < 0.1 km2 < 0.1 km2 < 0.1 km2 < 0.1 km2 < 0.1 km2
TTS/fleeing response (Mlf SELss 183 dB re 1
µPa2s)
Max 80 m 230 m 250 m 380 m 420 m 450 m
Min 70 m 220 m 240 m 370 m 410 m 440 m
Mean 80 m 230 m 250 m 380 m 420 m 450 m
Area < 0.1 km2 0.2 km2 0.2 km2 0.4 km2 0.5 km2 0.6 km2
Likely avoidance of area (SELss 152 re 1 µPa2s)
Max 6.1 km 11.9 km 12.4 km 15.3 km 16.1 km 16.6 km
Min 5.8 km 10.3 km 10.7 km 12.6 km 13.1 km 13.5 km
Mean 6.0 km 11.2 km 11.6 km 14.1 km 14.8 km 15.3 km
Area 110 km2 390 km2 420 km2 620 km2 690 km2 730 km2
Possible avoidance of area (SELss 142 re 1
µPa2s)
Max 14.8 km 24.9 km 25.7 km 30.1 km 31.1 km 32.0 km
Min 12.3 km 18.2 km 18.7 km 21.1 km 21.7 km 22.1 km
Mean 13.7 km 21.6 km 22.3 km 25.9 km 26.9 km 27.6 km
Area 590 km2 1500 km2 1600 km2 2100 km2 2300 km2 2400 km2
Table A 3 Predicted low-frequency cetacean impact ranges using criteria derived from Southall et al. (2007) at Creyke Beck A, location ID6

COMMERCIAL IN CONFIDENCE
Underwater noise modelling at the Creyke Beck offshore wind farms, Dogger Bank
Subacoustech Environmental Ltd. 36
Document Ref: P223R0101
COMMERCIAL IN CONFIDENCE
Pinnipeds (in water) - impact criterion
300 kJ hammer energy
1900 kJ hammer energy
2300 kJ hammer energy
3000 kJ hammer energy
3600 kJ hammer energy
4000 kJ hammer energy
Instantaneous injury/PTS (SPLpeak 218
dB re 1 µPa)
Max < 50 m 50 m 60 m 70 m 80 m 80 m
Min < 50 m < 50 m 50 m 60 m 70 m 70 m
Mean < 50 m < 50 m 60 m 70 m 80 m 80 m
Area < 0.1 km2 < 0.1 km2 < 0.1 km2 < 0.1 km2 < 0.1 km2 < 0.1 km2
Instantaneous injury/PTS (Mpw SELss
186 dB re 1 µPa2s)
Max < 50 m 90 m 120 m 140 m 160 m 170 m
Min < 50 m 80 m 110 m 130 m 150 m 160 m
Mean < 50 m 90 m 120 m 140 m 160 m 170 m
Area < 0.1 km2 < 0.1 km2 < 0.1 km2 0.1 km2 0.1 km2 0.1 km2
TTS/fleeing response (SPLpeak 212 dB re
1 µPa)
Max 70 m 90 m 100 m 130 m 150 m 170 m
Min 60 m 80 m 90 m 120 m 140 m 160 m
Mean 70 m 90 m 100 m 130 m 150 m 170 m
Area < 0.1 km2 < 0.1 km2 < 0.1 km2 < 0.1 km2 0.1 km2 0.1 km2
TTS/fleeing response (Mpw SELss 171 dB re
1 µPa2s)
Max 280 m 840 m 1.1 km 1.4 km 1.5 km 1.6 km
Min 270 m 820 m 1.1 km 1.3 km 1.5 km 1.6 km
Mean 280 m 830 m 1.1 km 1.3 km 1.5 km 1.6 km
Area 0.2 km2 2.2 km2 3.8 km2 5.6 km2 6.8 km2 7.8 km2
Table A 4 Predicted pinniped (in water) impact ranges using criteria from Southall et al. (2007) at Creyke Beck A, location ID6
Fish - impact criterion 300 kJ
hammer energy
1900 kJ hammer energy
2300 kJ hammer energy
3000 kJ hammer energy
3600 kJ hammer energy
4000 kJ hammer energy
Instantaneous injury/PTS (SPLpeak 206 dB re 1 µPa)
Max < 50 m 190 m 220 m 270 m 330 m 370 m
Min < 50 m 180 m 210 m 260 m 320 m 350 m
Mean < 50 m 190 m 220 m 270 m 330 m 360 m
Area < 0.1 km2 0.1 km2 0.1 km2 0.2 km2 0.3 km2 0.4 km2
PTS (SELcum 211 dB re 1 µPa2s) – Sequence 1
Max - - < 100 m < 100 m < 100 m < 100 m
Min - - < 100 m < 100 m < 100 m < 100 m
Mean - - < 100 m < 100 m < 100 m < 100 m
Area - - 0.1 km2 0.1 km2 0.1 km2 0.1 km2
PTS (SELcum 211 dB re 1 µPa2s) – Sequence 2
Max - - < 100 m < 100 m < 100 m < 100 m
Min - - < 100 m < 100 m < 100 m < 100 m
Mean - - < 100 m < 100 m < 100 m < 100 m
Area - - 0.1 km2 0.1 km2 0.1 km2 0.1 km2
PTS (SELcum 211 dB re 1 µPa2s) – Sequence 3
Max - - < 100 m < 100 m < 100 m < 100 m
Min - - < 100 m < 100 m < 100 m < 100 m
Mean - - < 100 m < 100 m < 100 m < 100 m
Area - - 0.1 km2 0.1 km2 0.1 km2 0.1 km2
Possible moderate to strong avoidance
(upper bound SPLpeak 173 dB re 1 µPa)
Max 3.7 km 8.4 km 9.0 km 10.2 km 11.4 km 12.0 km
Min 3.5 km 7.8 km 8.3 km 9.2 km 9.9 km 10.3 km
Mean 3.6 km 8.1 km 8.6 km 9.7 km 10.7 km 11.2 km
Area 39 km2 200 km2 230 km2 290 km2 360 km2 390 km2
Possible moderate to strong avoidance
(lower bound SPLpeak 168 dB re 1 µPa)
Max 5.9 km 12.1 km 12.8 km 14.3 km 15.7 km 16.4 km
Min 5.5 km 10.4 km 10.9 km 11.9 km 12.8 km 13.3 km
Mean 5.7 km 11.3 km 11.9 km 13.3 km 14.4 km 15.1 km
Area 100 km2 400 km2 450 km2 550 km2 650 km2 710 km2
Startle response or C-turn reaction (SPLpeak
200 dB re 1 µPa)
Max 130 m 420 m 480 m 600 m 730 m 800 m
Min 120 m 410 m 460 m 580 m 710 m 780 m
Mean 130 m 420 m 470 m 590 m 720 m 790 m
Area < 0.1 km2 0.5 km2 0.7 km2 1.1 km2 1.6 km2 2.0 km2
Table A 5 Predicted fish impact ranges using criteria from Popper et al. (2006), Carlson et al. (2007), Halvorsen et al (2011), McCauley et al. (2000) and Pearson et al. (1992) at Creyke Beck A, location
ID6
Cells marked with a hyphen are for single strike hammer energies and as such cumulative SELs cannot
be calculated for them.

COMMERCIAL IN CONFIDENCE
Underwater noise modelling at the Creyke Beck offshore wind farms, Dogger Bank
Subacoustech Environmental Ltd. 37
Document Ref: P223R0101
COMMERCIAL IN CONFIDENCE
NMFS (2016) impact ranges
Low-frequency cetaceans - impact criterion 2300 kJ hammer energy
3000 kJ hammer energy
3600 kJ hammer energy
4000 kJ hammer energy
PTS unweighted SPLpeak
(219 re 1 µPa)
Maximum 50 m 60 m 70 m 70 m
Minimum < 50 m 50 m 60 m 60 m
Mean < 50 m 60 m 70 m 70 m
Area < 0.1 km2 < 0.1 km2 < 0.1 km2 < 0.1 km2
TTS unweighted SPLpeak
(213 re 1 µPa)
Maximum 90 m 110 m 130 m 150 m
Minimum 80 m 100 m 120 m 140 m
Mean 90 m 110 m 130 m 150 m
Area < 0.1 km2 < 0.1 km2 0.1 km2 0.1 km2
Table A 6 Predicted unweighted SPLpeak impact ranges for low-frequency cetaceans using criteria from NMFS (2016) at Creyke Beck A, location ID6
Low-frequency cetaceans - impact criterion 2300 kJ hammer energy
3000 kJ hammer energy
3600 kJ hammer energy
4000 kJ hammer energy
Sequence 1 – PTS weighted SELcum (183 dB re 1 µPa2s)
Maximum 600 m 1.1 km 1.6 km 1.9 km
Minimum 400 m 800 m 1.1 km 1.4 km
Mean 500 m 1.0 km 1.3 km 1.6 km
Area 0.7 km2 2.9 km2 5.6 km2 8.4 km2
Sequence 1 – TTS weighted SELcum (168 dB re 1 µPa2s)
Maximum 16.8 km 19.0 km 20.1 km 20.9 km
Minimum 10.2 km 11.4 km 12.0 km 12.5 km
Mean 13.5 km 15.3 km 16.3 km 16.9 km
Area 580 km2 750 km2 840 km2 910 km2
Sequence 2 – PTS weighted SELcum (183 dB re 1 µPa2s)
Maximum 800 m 1.7 km 2.2 km 2.7 km
Minimum 500 m 1.0 km 1.3 km 1.6 km
Mean 600 m 1.3 km 1.8 km 2.2 km
Area 1.4 km2 5.8 km2 10 km2 15 km2
Sequence 2 – TTS weighted SELcum (168 dB re 1 µPa2s)
Maximum 20.1 km 22.8 km 24.3 km 25.4 km
Minimum 10.9 km 12.2 km 12.8 km 13.3 km
Mean 15.7 km 17.7 km 18.8 km 19.6 km
Area 790 km2 1000 km2 1100 km2 1200 km2
Sequence 3 – PTS weighted SELcum (183 dB re 1 µPa2s)
Maximum 900 m 1.8 km 2.4 km 2.8 km
Minimum 500 m 1.0 km 1.3 km 1.6 km
Mean 700 m 1.4 km 1.9 km 2.2 km
Area 1.5 km2 6.2 km2 11 km2 16 km2
Sequence 3 – TTS weighted SELcum (168 dB re 1 µPa2s)
Maximum 21.4 km 24.4 km 26.1 km 27.4 km
Minimum 11.0 km 12.3 km 12.9 km 13.3 km
Mean 16.3 km 18.5 km 19.6 km 20.5 km
Area 850 km2 1100 km2 1200 km2 1400 km2
Table A 7 Predicted low-frequency cetacean weighted SELcum impact ranges using criteria from NMFS (2016) assuming a fleeing speed of 3.25 ms-1 for the three piling sequences at Creyke Beck A,
location ID6
Mid-frequency cetaceans - impact criterion 2300 kJ hammer energy
3000 kJ hammer energy
3600 kJ hammer energy
4000 kJ hammer energy
PTS unweighted SPLpeak
(230 re 1 µPa)
Maximum < 50 m < 50 m < 50 m < 50 m
Minimum < 50 m < 50 m < 50 m < 50 m
Mean < 50 m < 50 m < 50 m < 50 m
Area < 0.1 km2 < 0.1 km2 < 0.1 km2 < 0.1 km2
TTS unweighted SPLpeak
(224 re 1 µPa)
Maximum < 50 m < 50 m < 50 m < 50 m
Minimum < 50 m < 50 m < 50 m < 50 m
Mean < 50 m < 50 m < 50 m < 50 m
Area < 0.1 km2 < 0.1 km2 < 0.1 km2 < 0.1 km2
Table A 8 Predicted unweighted SPLpeak impact ranges for mid-frequency cetaceans using criteria from NMFS (2016) at Creyke Beck A, location ID6

COMMERCIAL IN CONFIDENCE
Underwater noise modelling at the Creyke Beck offshore wind farms, Dogger Bank
Subacoustech Environmental Ltd. 38
Document Ref: P223R0101
COMMERCIAL IN CONFIDENCE
Mid-frequency cetaceans - impact criterion 2300 kJ hammer energy
3000 kJ hammer energy
3600 kJ hammer energy
4000 kJ hammer energy
Sequence 1 – PTS weighted SELcum (185 dB re 1 µPa2s)
Maximum < 100 m < 100 m < 100 m < 100 m
Minimum < 100 m < 100 m < 100 m < 100 m
Mean < 100 m < 100 m < 100 m < 100 m
Area < 0.1 km2 < 0.1 km2 < 0.1 km2 < 0.1 km2
Sequence 1 – TTS weighted SELcum (170 dB re 1 µPa2s)
Maximum < 100 m < 100 m < 100 m < 100 m
Minimum < 100 m < 100 m < 100 m < 100 m
Mean < 100 m < 100 m < 100 m < 100 m
Area < 0.1 km2 < 0.1 km2 < 0.1 km2 < 0.1 km2
Sequence 2 – PTS weighted SELcum (185 dB re 1 µPa2s)
Maximum < 100 m < 100 m < 100 m < 100 m
Minimum < 100 m < 100 m < 100 m < 100 m
Mean < 100 m < 100 m < 100 m < 100 m
Area < 0.1 km2 < 0.1 km2 < 0.1 km2 < 0.1 km2
Sequence 2 – TTS weighted SELcum (170 dB re 1 µPa2s)
Maximum < 100 m < 100 m < 100 m < 100 m
Minimum < 100 m < 100 m < 100 m < 100 m
Mean < 100 m < 100 m < 100 m < 100 m
Area < 0.1 km2 < 0.1 km2 < 0.1 km2 < 0.1 km2
Sequence 3 – PTS weighted SELcum (185 dB re 1 µPa2s)
Maximum < 100 m < 100 m < 100 m < 100 m
Minimum < 100 m < 100 m < 100 m < 100 m
Mean < 100 m < 100 m < 100 m < 100 m
Area < 0.1 km2 < 0.1 km2 < 0.1 km2 < 0.1 km2
Sequence 3 – TTS weighted SELcum (170 dB re 1 µPa2s)
Maximum < 100 m < 100 m < 100 m < 100 m
Minimum < 100 m < 100 m < 100 m < 100 m
Mean < 100 m < 100 m < 100 m < 100 m
Area < 0.1 km2 < 0.1 km2 < 0.1 km2 < 0.1 km2
Table A 9 Predicted mid-frequency cetacean weighted SELcum impact ranges using criteria from NMFS (2016) assuming a fleeing speed of 1.5 ms-1 for the three piling sequences at Creyke Beck A,
location ID6
High-frequency cetaceans - impact criterion 2300 kJ hammer energy
3000 kJ hammer energy
3600 kJ hammer energy
4000 kJ hammer energy
PTS unweighted SPLpeak
(202 re 1 µPa)
Maximum 370 m 460 m 560 m 620 m
Minimum 360 m 450 m 540 m 600 m
Mean 370 m 460 m 560 m 610 m
Area 0.4 km2 0.7 km2 1.0 km2 1.2 km2
TTS unweighted SPLpeak
(196 re 1 µPa)
Maximum 810 m 1.0 km 1.2 km 1.3 km
Minimum 780 m 980 m 1.2 km 1.3 km
Mean 800 m 990 m 1.2 km 1.3 km
Area 2.0 km2 3.1 km2 4.5 km2 5.4 km2
Table A 10 Predicted unweighted SPLpeak impact ranges for high-frequency cetaceans using criteria from NMFS (2016) at Creyke Beck A, location ID6

COMMERCIAL IN CONFIDENCE
Underwater noise modelling at the Creyke Beck offshore wind farms, Dogger Bank
Subacoustech Environmental Ltd. 39
Document Ref: P223R0101
COMMERCIAL IN CONFIDENCE
High-frequency cetaceans - impact criterion 2300 kJ hammer energy
3000 kJ hammer energy
3600 kJ hammer energy
4000 kJ hammer energy
Sequence 1 – PTS weighted SELcum (155 dB re 1 µPa2s)
Maximum 1.2 km < 100 m < 100 m < 100 m
Minimum 900 m < 100 m < 100 m < 100 m
Mean 1.1 km < 100 m < 100 m < 100 m
Area 3.8 km2 < 0.1 km2 < 0.1 km2 < 0.1 km2
Sequence 1 – TTS weighted SELcum (140 dB re 1 µPa2s)
Maximum 14.6 km 6.8 km 7.5 km 8.0 km
Minimum 10.7 km 5.8 km 6.2 km 6.5 km
Mean 12.8 km 6.3 km 6.9 km 7.3 km
Area 510 km2 130 km2 150 km2 170 km2
Sequence 2 – PTS weighted SELcum (155 dB re 1 µPa2s)
Maximum 2.1 km < 100 m < 100 m < 100 m
Minimum 1.7 km < 100 m < 100 m < 100 m
Mean 1.9 km < 100 m < 100 m < 100 m
Area 12 km2 < 0.1 km2 < 0.1 km2 < 0.1 km2
Sequence 2 – TTS weighted SELcum (140 dB re 1 µPa2s)
Maximum 19.2 km 9.3 km 10.2 km 10.8 km
Minimum 12.4 km 6.9 km 7.5 km 7.8 km
Mean 15.9 km 8.3 km 9.0 km 9.5 km
Area 800 km2 220 km2 250 km2 280 km2
Sequence 3 – PTS weighted SELcum (155 dB re 1 µPa2s)
Maximum 2.4 km < 100 m < 100 m < 100 m
Minimum 1.9 km < 100 m < 100 m < 100 m
Mean 2.1 km < 100 m < 100 m < 100 m
Area 14 km2 < 0.1 km2 < 0.1 km2 < 0.1 km2
Sequence 3 – TTS weighted SELcum (140 dB re 1 µPa2s)
Maximum 21.5 km 10.6 km 11.5 km 12.3 km
Minimum 12.9 km2 7.2 km 7.7 km 8.1 km
Mean 17.2 km2 8.9 km 9.7 km 10.2 km
Area 940 km2 250 km2 300 km2 330 km2
Table A 11 Predicted high-frequency cetacean weighted SELcum impact ranges using criteria from NMFS (2016) assuming a fleeing speed of 1.5 ms-1 for the three piling sequences at Creyke Beck A,
location ID6
Phocid pinnipeds - impact criterion 2300 kJ hammer energy
3000 kJ hammer energy
3600 kJ hammer energy
4000 kJ hammer energy
PTS unweighted SPLpeak
(218 re 1 µPa)
Maximum 60 m 70 m 80 m 80 m
Minimum 50 m 60 m 70 m 70 m
Mean 60 m 70 m 80 m 80 m
Area < 0.1 km2 < 0.1 km2 < 0.1 km2 < 0.1 km2
TTS unweighted SPLpeak
(212 re 1 µPa)
Maximum 100 m 130 m 150 m 170 m
Minimum 90 m 120 m 140 m 160 m
Mean 100 m 130 m 150 m 170 m
Area < 0.1 km2 0.1 km2 0.1 km2 0.1 km2
Table A 12 Predicted unweighted SPLpeak impact ranges for phocid pinnipeds using criteria from NMFS (2016) at Creyke Beck A, location ID6

COMMERCIAL IN CONFIDENCE
Underwater noise modelling at the Creyke Beck offshore wind farms, Dogger Bank
Subacoustech Environmental Ltd. 40
Document Ref: P223R0101
COMMERCIAL IN CONFIDENCE
Phocid pinnipeds - impact criterion 2300 kJ hammer energy
3000 kJ hammer energy
3600 kJ hammer energy
4000 kJ hammer energy
Sequence 1 – PTS weighted SELcum (185 dB re 1 µPa2s)
Maximum < 100 m < 100 m < 100 m < 100 m
Minimum < 100 m < 100 m < 100 m < 100 m
Mean < 100 m < 100 m < 100 m < 100 m
Area < 0.1 km2 < 0.1 km2 < 0.1 km2 < 0.1 km2
Sequence 1 – TTS weighted SELcum (170 dB re 1 µPa2s)
Maximum 3.7 km 5.6 km 6.2 km 6.7 km
Minimum 3.3 km 4.9 km 5.3 km 5.6 km
Mean 3.6 km 5.2 km 5.8 km 6.2 km
Area 40 km2 86 km2 100 km2 120 km2
Sequence 2 – PTS weighted SELcum (185 dB re 1 µPa2s)
Maximum < 100 m < 100 m < 100 m < 100 m
Minimum < 100 m < 100 m < 100 m < 100 m
Mean < 100 m < 100 m < 100 m < 100 m
Area < 0.1 km2 < 0.1 km2 < 0.1 km2 < 0.1 km2
Sequence 2 – TTS weighted SELcum (170 dB re 1 µPa2s)
Maximum 5.5 km 7.8 km 8.5 km 9.1 km
Minimum 4.4 km 6.0 km 6.5 km 6.8 km
Mean 5.0 km 7.0 km 7.6 km 8.1 km
Area 77 km2 150 km2 180 km2 210 km2
Sequence 3 – PTS weighted SELcum (185 dB re 1 µPa2s)
Maximum < 100 m < 100 m < 100 m < 100 m
Minimum < 100 m < 100 m < 100 m < 100 m
Mean < 100 m < 100 m < 100 m < 100 m
Area < 0.1 km2 < 0.1 km2 < 0.1 km2 < 0.1 km2
Sequence 3 – TTS weighted SELcum (170 dB re 1 µPa2s)
Maximum 6.0 km 8.7 km 9.6 km 10.3 km
Minimum 4.6 km 6.2 km 6.7 km 7.0 km
Mean 5.4 km 7.5 km 8.2 km 8.7 km
Area 91 km2 180 km2 210 km2 240 km2
Table A 13 Predicted phocid pinnipeds weighted SELcum impact ranges using criteria from NMFS (2016) assuming a fleeing speed of 1.5 ms-1 for the three piling sequences at Creyke Beck A, location
ID6
Popper et al (2014) impact ranges
Fish - impact criterion 2300 kJ hammer energy
3000 kJ hammer energy
3600 kJ hammer energy
4000 kJ hammer energy
Injury (fish: no swim bladder) unweighted SPLpeak
(213 re 1 µPa)
Maximum 90 m 110 m 130 m 150 m
Minimum 80 m 100 m 120 m 140 m
Mean 90 m 110 m 130 m 150 m
Area < 0.1 km2 < 0.1 km2 0.1 km2 0.1 km2
Injury (fish: with swim bladder) unweighted SPLpeak
(207 re 1 µPa)
Maximum 190 m 240 m 290 m 320 m
Minimum 180 m 230 m 280 m 310 m
Mean 190 m 240 m 290 m 320 m
Area 0.1 km2 0.2 km2 0.3 km2 0.3 km2
Table A 14 Predicted unweighted SPLpeak impact ranges for fish using criteria from Popper et al. (2014) at Creyke Beck A, location ID6

COMMERCIAL IN CONFIDENCE
Underwater noise modelling at the Creyke Beck offshore wind farms, Dogger Bank
Subacoustech Environmental Ltd. 41
Document Ref: P223R0101
COMMERCIAL IN CONFIDENCE
Fish - impact criterion (Sequence 1)
2300 kJ hammer energy
3000 kJ hammer energy
3600 kJ hammer energy
4000 kJ hammer energy
Mortality (fish: no swim bladder) SELcum
(> 219 dB re 1 µPa2s)
Maximum < 100 m < 100 m < 100 m < 100 m
Minimum < 100 m < 100 m < 100 m < 100 m
Mean < 100 m < 100 m < 100 m < 100 m
Area 0.1 km2 0.1 km2 0.1 km2 0.1 km2
Recoverable injury (fish: no swim bladder) SELcum
(> 216 dB re 1 µPa2s)
Maximum < 100 m < 100 m < 100 m < 100 m
Minimum < 100 m < 100 m < 100 m < 100 m
Mean < 100 m < 100 m < 100 m < 100 m
Area 0.1 km2 0.1 km2 0.1 km2 0.1 km2
Mortality (fish: swim bladder not involved in hearing) SELcum
(210 dB re 1 µPa2s)
Maximum < 100 m < 100 m < 100 m < 100 m
Minimum < 100 m < 100 m < 100 m < 100 m
Mean < 100 m < 100 m < 100 m < 100 m
Area 0.1 km2 0.1 km2 0.1 km2 0.1 km2
Mortality (fish: swim bladder involved in hearing) SELcum
(207 dB re 1 µPa2s)
Maximum < 100 m < 100 m < 100 m < 100 m
Minimum < 100 m < 100 m < 100 m < 100 m
Mean < 100 m < 100 m < 100 m < 100 m
Area 0.1 km2 0.1 km2 0.1 km2 0.1 km2
Recoverable injury (fish: with swim bladder) SELcum (203 dB re 1 µPa2s)
Maximum < 100 m < 100 m < 100 m < 100 m
Minimum < 100 m < 100 m < 100 m < 100 m
Mean < 100 m < 100 m < 100 m < 100 m
Area 0.1 km2 0.1 km2 0.1 km2 0.1 km2
TTS (all fish) SELcum
(186 re 1 µPa2s)
Maximum 4.6 km 6.9 km 7.6 km 8.1 km
Minimum 4.1 km 5.8 km 6.3 km 6.6 km
Mean 4.4 km 6.4 km 7.0 km 7.4 km
Area 60 km2 130 km2 150 km2 170 km2
Table A 15 Predicted unweighted SELcum impact ranges for fish using criteria from Popper et al. (2014) assuming a fleeing speed of 1.5 ms-1 for piling sequence 1 at Creyke Beck A, location ID6
Fish - impact criterion (Sequence 2)
2300 kJ hammer energy
3000 kJ hammer energy
3600 kJ hammer energy
4000 kJ hammer energy
Mortality (fish: no swim bladder) SELcum
(> 219 dB re 1 µPa2s)
Maximum < 100 m < 100 m < 100 m < 100 m
Minimum < 100 m < 100 m < 100 m < 100 m
Mean < 100 m < 100 m < 100 m < 100 m
Area 0.1 km2 0.1 km2 0.1 km2 0.1 km2
Recoverable injury (fish: no swim bladder) SELcum
(> 216 dB re 1 µPa2s)
Maximum < 100 m < 100 m < 100 m < 100 m
Minimum < 100 m < 100 m < 100 m < 100 m
Mean < 100 m < 100 m < 100 m < 100 m
Area 0.1 km2 0.1 km2 0.1 km2 0.1 km2
Mortality (fish: swim bladder not involved in hearing) SELcum (210
dB re 1 µPa2s)
Maximum < 100 m < 100 m < 100 m < 100 m
Minimum < 100 m < 100 m < 100 m < 100 m
Mean < 100 m < 100 m < 100 m < 100 m
Area 0.1 km2 0.1 km2 0.1 km2 0.1 km2
Mortality (fish: swim bladder involved in hearing) SELcum
(207 dB re 1 µPa2s)
Maximum < 100 m < 100 m < 100 m < 100 m
Minimum < 100 m < 100 m < 100 m < 100 m
Mean < 100 m < 100 m < 100 m < 100 m
Area 0.1 km2 0.1 km2 0.1 km2 0.1 km2
Recoverable injury (fish: with swim bladder) SELcum (203 dB re 1 µPa2s)
Maximum < 100 m < 100 m < 100 m < 100 m
Minimum < 100 m < 100 m < 100 m < 100 m
Mean < 100 m < 100 m < 100 m < 100 m
Area 0.1 km2 0.1 km2 0.1 km2 0.1 km2
TTS (all fish) SELcum
(186 re 1 µPa2s)
Maximum 6.6 km 9.4 km 10.3 km 11.0 km
Minimum 5.2 km 7.0 km 7.5 km 7.9 km
Mean 5.9 km 8.4 km 9.1 km 9.6 km
Area 110 km2 220 km2 260 km2 290 km2
Table A 16 Predicted unweighted SELcum impact ranges for fish using criteria from Popper et al. (2014) assuming a fleeing speed of 1.5 ms-1 for piling sequence 2 at Creyke Beck A, location ID6

COMMERCIAL IN CONFIDENCE
Underwater noise modelling at the Creyke Beck offshore wind farms, Dogger Bank
Subacoustech Environmental Ltd. 42
Document Ref: P223R0101
COMMERCIAL IN CONFIDENCE
Fish - impact criterion (Sequence 3)
2300 kJ hammer energy
3000 kJ hammer energy
3600 kJ hammer energy
4000 kJ hammer energy
Mortality (fish: no swim bladder) SELcum
(> 219 dB re 1 µPa2s)
Maximum < 100 m < 100 m < 100 m < 100 m
Minimum < 100 m < 100 m < 100 m < 100 m
Mean < 100 m < 100 m < 100 m < 100 m
Area 0.1 km2 0.1 km2 0.1 km2 0.1 km2
Recoverable injury (fish: no swim bladder) SELcum
(> 216 dB re 1 µPa2s)
Maximum < 100 m < 100 m < 100 m < 100 m
Minimum < 100 m < 100 m < 100 m < 100 m
Mean < 100 m < 100 m < 100 m < 100 m
Area 0.1 km2 0.1 km2 0.1 km2 0.1 km2
Mortality (fish: swim bladder not involved in hearing) SELcum (210
dB re 1 µPa2s)
Maximum < 100 m < 100 m < 100 m < 100 m
Minimum < 100 m < 100 m < 100 m < 100 m
Mean < 100 m < 100 m < 100 m < 100 m
Area 0.1 km2 0.1 km2 0.1 km2 0.1 km2
Mortality (fish: swim bladder involved in hearing) SELcum
(207 dB re 1 µPa2s)
Maximum < 100 m < 100 m < 100 m < 100 m
Minimum < 100 m < 100 m < 100 m < 100 m
Mean < 100 m < 100 m < 100 m < 100 m
Area 0.1 km2 0.1 km2 0.1 km2 0.1 km2
Recoverable injury (fish: with swim bladder) SELcum (203 dB re 1 µPa2s)
Maximum < 100 m < 100 m < 100 m < 100 m
Minimum < 100 m < 100 m < 100 m < 100 m
Mean < 100 m < 100 m < 100 m < 100 m
Area 0.1 km2 0.1 km2 0.1 km2 0.1 km2
TTS (all fish) SELcum
(186 re 1 µPa2s)
Maximum 7.3 km 10.7 km 11.7 km 12.4 km
Minimum 5.3 km 7.2 km 7.8 km 8.1 km
Mean 6.4 km 9.0 km 9.8 km 10.3 km
Area 130 km2 260 km2 300 km2 340 km2
Table A 17 Predicted unweighted SELcum impact ranges for fish using criteria from Popper et al. (2014) assuming a fleeing speed of 1.5 ms-1 for piling sequence 3 at Creyke Beck A, location ID6
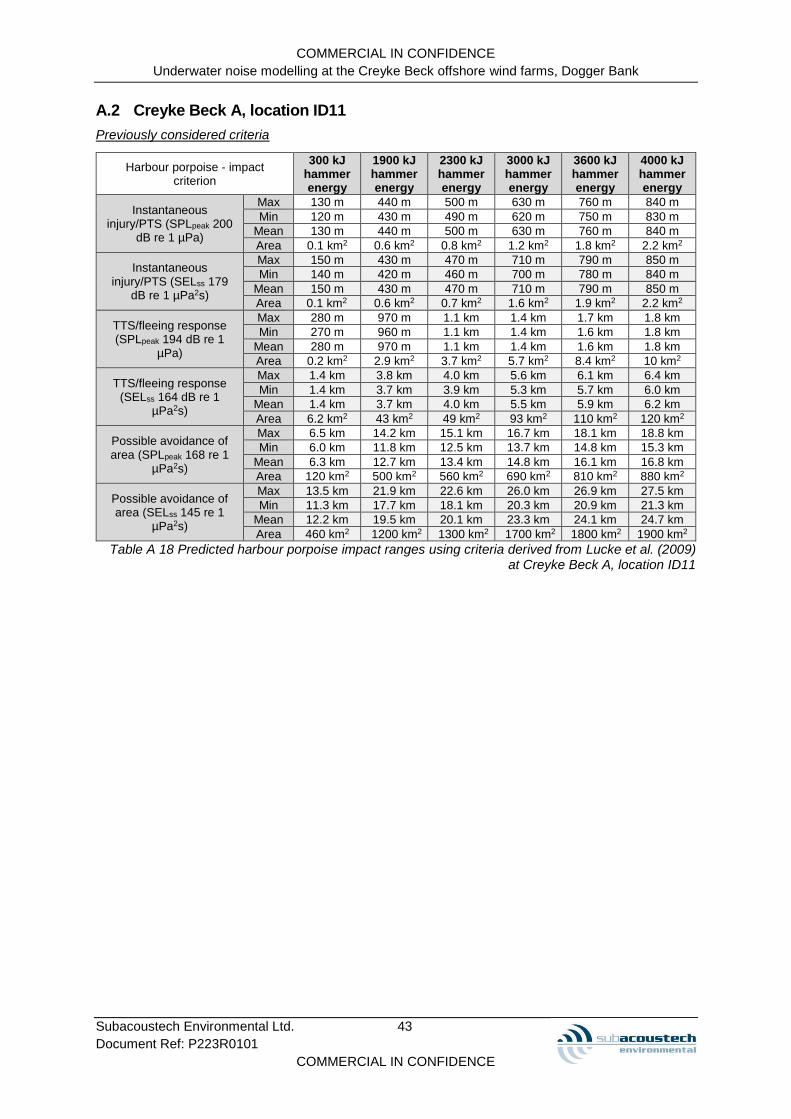
COMMERCIAL IN CONFIDENCE
Underwater noise modelling at the Creyke Beck offshore wind farms, Dogger Bank
Subacoustech Environmental Ltd. 43
Document Ref: P223R0101
COMMERCIAL IN CONFIDENCE
A.2 Creyke Beck A, location ID11
Previously considered criteria
Harbour porpoise - impact criterion
300 kJ hammer energy
1900 kJ hammer energy
2300 kJ hammer energy
3000 kJ hammer energy
3600 kJ hammer energy
4000 kJ hammer energy
Instantaneous injury/PTS (SPLpeak 200
dB re 1 µPa)
Max 130 m 440 m 500 m 630 m 760 m 840 m
Min 120 m 430 m 490 m 620 m 750 m 830 m
Mean 130 m 440 m 500 m 630 m 760 m 840 m
Area 0.1 km2 0.6 km2 0.8 km2 1.2 km2 1.8 km2 2.2 km2
Instantaneous injury/PTS (SELss 179
dB re 1 µPa2s)
Max 150 m 430 m 470 m 710 m 790 m 850 m
Min 140 m 420 m 460 m 700 m 780 m 840 m
Mean 150 m 430 m 470 m 710 m 790 m 850 m
Area 0.1 km2 0.6 km2 0.7 km2 1.6 km2 1.9 km2 2.2 km2
TTS/fleeing response (SPLpeak 194 dB re 1
µPa)
Max 280 m 970 m 1.1 km 1.4 km 1.7 km 1.8 km
Min 270 m 960 m 1.1 km 1.4 km 1.6 km 1.8 km
Mean 280 m 970 m 1.1 km 1.4 km 1.6 km 1.8 km
Area 0.2 km2 2.9 km2 3.7 km2 5.7 km2 8.4 km2 10 km2
TTS/fleeing response (SELss 164 dB re 1
µPa2s)
Max 1.4 km 3.8 km 4.0 km 5.6 km 6.1 km 6.4 km
Min 1.4 km 3.7 km 3.9 km 5.3 km 5.7 km 6.0 km
Mean 1.4 km 3.7 km 4.0 km 5.5 km 5.9 km 6.2 km
Area 6.2 km2 43 km2 49 km2 93 km2 110 km2 120 km2
Possible avoidance of area (SPLpeak 168 re 1
µPa2s)
Max 6.5 km 14.2 km 15.1 km 16.7 km 18.1 km 18.8 km
Min 6.0 km 11.8 km 12.5 km 13.7 km 14.8 km 15.3 km
Mean 6.3 km 12.7 km 13.4 km 14.8 km 16.1 km 16.8 km
Area 120 km2 500 km2 560 km2 690 km2 810 km2 880 km2
Possible avoidance of area (SELss 145 re 1
µPa2s)
Max 13.5 km 21.9 km 22.6 km 26.0 km 26.9 km 27.5 km
Min 11.3 km 17.7 km 18.1 km 20.3 km 20.9 km 21.3 km
Mean 12.2 km 19.5 km 20.1 km 23.3 km 24.1 km 24.7 km
Area 460 km2 1200 km2 1300 km2 1700 km2 1800 km2 1900 km2
Table A 18 Predicted harbour porpoise impact ranges using criteria derived from Lucke et al. (2009) at Creyke Beck A, location ID11
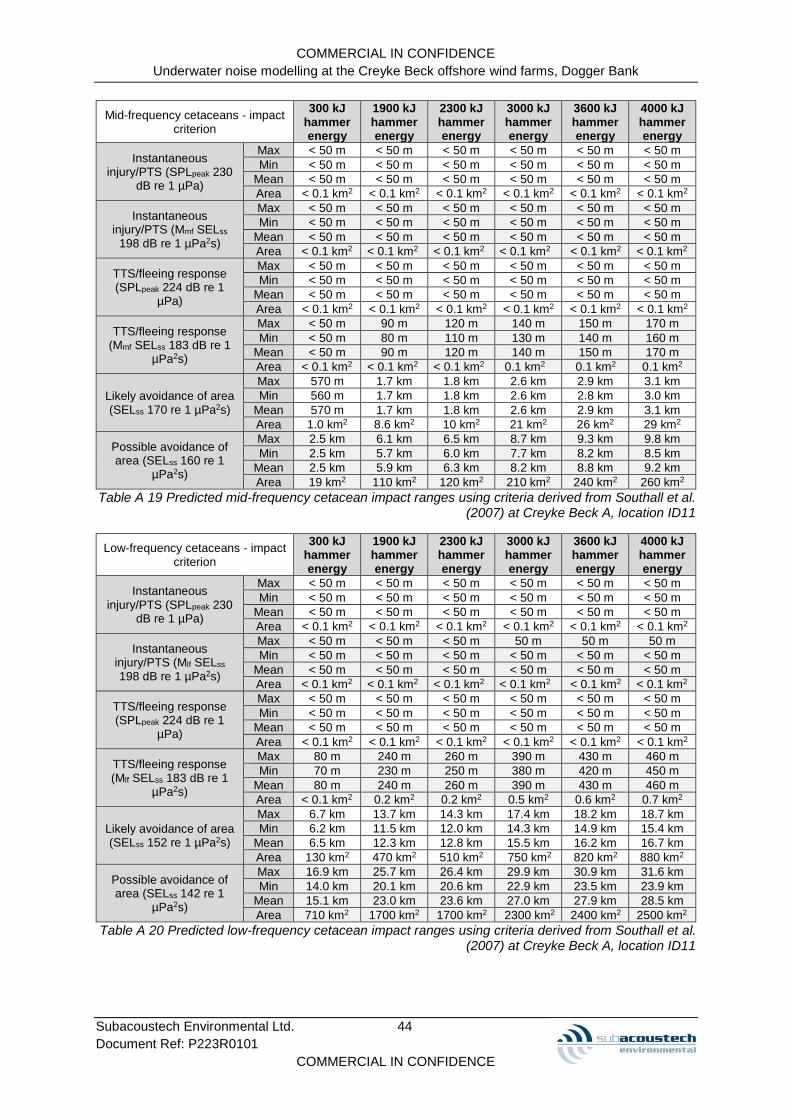
COMMERCIAL IN CONFIDENCE
Underwater noise modelling at the Creyke Beck offshore wind farms, Dogger Bank
Subacoustech Environmental Ltd. 44
Document Ref: P223R0101
COMMERCIAL IN CONFIDENCE
Mid-frequency cetaceans - impact criterion
300 kJ hammer energy
1900 kJ hammer energy
2300 kJ hammer energy
3000 kJ hammer energy
3600 kJ hammer energy
4000 kJ hammer energy
Instantaneous injury/PTS (SPLpeak 230
dB re 1 µPa)
Max < 50 m < 50 m < 50 m < 50 m < 50 m < 50 m
Min < 50 m < 50 m < 50 m < 50 m < 50 m < 50 m
Mean < 50 m < 50 m < 50 m < 50 m < 50 m < 50 m
Area < 0.1 km2 < 0.1 km2 < 0.1 km2 < 0.1 km2 < 0.1 km2 < 0.1 km2
Instantaneous injury/PTS (Mmf SELss
198 dB re 1 µPa2s)
Max < 50 m < 50 m < 50 m < 50 m < 50 m < 50 m
Min < 50 m < 50 m < 50 m < 50 m < 50 m < 50 m
Mean < 50 m < 50 m < 50 m < 50 m < 50 m < 50 m
Area < 0.1 km2 < 0.1 km2 < 0.1 km2 < 0.1 km2 < 0.1 km2 < 0.1 km2
TTS/fleeing response (SPLpeak 224 dB re 1
µPa)
Max < 50 m < 50 m < 50 m < 50 m < 50 m < 50 m
Min < 50 m < 50 m < 50 m < 50 m < 50 m < 50 m
Mean < 50 m < 50 m < 50 m < 50 m < 50 m < 50 m
Area < 0.1 km2 < 0.1 km2 < 0.1 km2 < 0.1 km2 < 0.1 km2 < 0.1 km2
TTS/fleeing response (Mmf SELss 183 dB re 1
µPa2s)
Max < 50 m 90 m 120 m 140 m 150 m 170 m
Min < 50 m 80 m 110 m 130 m 140 m 160 m
Mean < 50 m 90 m 120 m 140 m 150 m 170 m
Area < 0.1 km2 < 0.1 km2 < 0.1 km2 0.1 km2 0.1 km2 0.1 km2
Likely avoidance of area (SELss 170 re 1 µPa2s)
Max 570 m 1.7 km 1.8 km 2.6 km 2.9 km 3.1 km
Min 560 m 1.7 km 1.8 km 2.6 km 2.8 km 3.0 km
Mean 570 m 1.7 km 1.8 km 2.6 km 2.9 km 3.1 km
Area 1.0 km2 8.6 km2 10 km2 21 km2 26 km2 29 km2
Possible avoidance of area (SELss 160 re 1
µPa2s)
Max 2.5 km 6.1 km 6.5 km 8.7 km 9.3 km 9.8 km
Min 2.5 km 5.7 km 6.0 km 7.7 km 8.2 km 8.5 km
Mean 2.5 km 5.9 km 6.3 km 8.2 km 8.8 km 9.2 km
Area 19 km2 110 km2 120 km2 210 km2 240 km2 260 km2
Table A 19 Predicted mid-frequency cetacean impact ranges using criteria derived from Southall et al. (2007) at Creyke Beck A, location ID11
Low-frequency cetaceans - impact criterion
300 kJ hammer energy
1900 kJ hammer energy
2300 kJ hammer energy
3000 kJ hammer energy
3600 kJ hammer energy
4000 kJ hammer energy
Instantaneous injury/PTS (SPLpeak 230
dB re 1 µPa)
Max < 50 m < 50 m < 50 m < 50 m < 50 m < 50 m
Min < 50 m < 50 m < 50 m < 50 m < 50 m < 50 m
Mean < 50 m < 50 m < 50 m < 50 m < 50 m < 50 m
Area < 0.1 km2 < 0.1 km2 < 0.1 km2 < 0.1 km2 < 0.1 km2 < 0.1 km2
Instantaneous injury/PTS (Mlf SELss 198 dB re 1 µPa2s)
Max < 50 m < 50 m < 50 m 50 m 50 m 50 m
Min < 50 m < 50 m < 50 m < 50 m < 50 m < 50 m
Mean < 50 m < 50 m < 50 m < 50 m < 50 m < 50 m
Area < 0.1 km2 < 0.1 km2 < 0.1 km2 < 0.1 km2 < 0.1 km2 < 0.1 km2
TTS/fleeing response (SPLpeak 224 dB re 1
µPa)
Max < 50 m < 50 m < 50 m < 50 m < 50 m < 50 m
Min < 50 m < 50 m < 50 m < 50 m < 50 m < 50 m
Mean < 50 m < 50 m < 50 m < 50 m < 50 m < 50 m
Area < 0.1 km2 < 0.1 km2 < 0.1 km2 < 0.1 km2 < 0.1 km2 < 0.1 km2
TTS/fleeing response (Mlf SELss 183 dB re 1
µPa2s)
Max 80 m 240 m 260 m 390 m 430 m 460 m
Min 70 m 230 m 250 m 380 m 420 m 450 m
Mean 80 m 240 m 260 m 390 m 430 m 460 m
Area < 0.1 km2 0.2 km2 0.2 km2 0.5 km2 0.6 km2 0.7 km2
Likely avoidance of area (SELss 152 re 1 µPa2s)
Max 6.7 km 13.7 km 14.3 km 17.4 km 18.2 km 18.7 km
Min 6.2 km 11.5 km 12.0 km 14.3 km 14.9 km 15.4 km
Mean 6.5 km 12.3 km 12.8 km 15.5 km 16.2 km 16.7 km
Area 130 km2 470 km2 510 km2 750 km2 820 km2 880 km2
Possible avoidance of area (SELss 142 re 1
µPa2s)
Max 16.9 km 25.7 km 26.4 km 29.9 km 30.9 km 31.6 km
Min 14.0 km 20.1 km 20.6 km 22.9 km 23.5 km 23.9 km
Mean 15.1 km 23.0 km 23.6 km 27.0 km 27.9 km 28.5 km
Area 710 km2 1700 km2 1700 km2 2300 km2 2400 km2 2500 km2
Table A 20 Predicted low-frequency cetacean impact ranges using criteria derived from Southall et al. (2007) at Creyke Beck A, location ID11

COMMERCIAL IN CONFIDENCE
Underwater noise modelling at the Creyke Beck offshore wind farms, Dogger Bank
Subacoustech Environmental Ltd. 45
Document Ref: P223R0101
COMMERCIAL IN CONFIDENCE
Pinnipeds (in water) - impact criterion
300 kJ hammer energy
1900 kJ hammer energy
2300 kJ hammer energy
3000 kJ hammer energy
3600 kJ hammer energy
4000 kJ hammer energy
Instantaneous injury/PTS (SPLpeak 218
dB re 1 µPa)
Max 50 m 50 m 60 m 70 m 80 m 80 m
Min < 50 m < 50 m 50 m 60 m 70 m 70 m
Mean < 50 m < 50 m 60 m 70 m 80 m 80 m
Area < 0.1 km2 < 0.1 km2 < 0.1 km2 < 0.1 km2 < 0.1 km2 < 0.1 km2
Instantaneous injury/PTS (Mpw SELss
186 dB re 1 µPa2s)
Max < 50 m 90 m 120 m 140 m 160 m 170 m
Min < 50 m 80 m 110 m 130 m 150 m 160 m
Mean < 50 m 90 m 120 m 140 m 160 m 170 m
Area < 0.1 km2 < 0.1 km2 < 0.1 km2 0.1 km2 0.1 km2 0.1 km2
TTS/fleeing response (SPLpeak 212 dB re 1
µPa)
Max 70 m 90 m 110 m 130 m 160 m 170 m
Min 60 m 80 m 100 m 120 m 150 m 160 m
Mean 70 m 90 m 110 m 130 m 160 m 170 m
Area < 0.1 km2 < 0.1 km2 < 0.1 km2 0.1 km2 0.1 km2 0.1 km2
TTS/fleeing response (Mpw SELss 171 dB re 1
µPa2s)
Max 290 m 860 m 1.2 km 1.4 km 1.5 km 1.7 km
Min 280 m 850 m 1.1 km 1.4 km 1.5 km 1.6 km
Mean 290 m 860 m 1.1 km 1.4 km 1.5 km 1.6 km
Area 0.3 km2 2.3 km2 4.1 km2 6.0 km2 7.4 km2 8.5 km2
Table A 21 Predicted pinniped (in water) impact ranges using criteria from Southall et al. (2007) at Creyke Beck A, location ID11
Fish - impact criterion 300 kJ
hammer energy
1900 kJ hammer energy
2300 kJ hammer energy
3000 kJ hammer energy
3600 kJ hammer energy
4000 kJ hammer energy
Instantaneous injury/PTS (SPLpeak 206
dB re 1 µPa)
Max 100 m 200 m 230 m 280 m 340 m 380 m
Min 90 m 190 m 220 m 270 m 330 m 370 m
Mean 100 m 200 m 230 m 280 m 340 m 380 m
Area < 0.1 km2 0.1 km2 0.2 km2 0.2 km2 0.4 km2 0.4 km2
PTS (SELcum 211 dB re 1 µPa2s) – Sequence 1
Max - - < 100 m < 100 m < 100 m < 100 m
Min - - < 100 m < 100 m < 100 m < 100 m
Mean - - < 100 m < 100 m < 100 m < 100 m
Area - - < 0.1 km2 < 0.1 km2 < 0.1 km2 < 0.1 km2
PTS (SELcum 211 dB re 1 µPa2s) – Sequence 2
Max - - < 100 m < 100 m < 100 m < 100 m
Min - - < 100 m < 100 m < 100 m < 100 m
Mean - - < 100 m < 100 m < 100 m < 100 m
Area - - < 0.1 km2 < 0.1 km2 < 0.1 km2 < 0.1 km2
PTS (SELcum 211 dB re 1 µPa2s) – Sequence 3
Max - - < 100 m < 100 m < 100 m < 100 m
Min - - < 100 m < 100 m < 100 m < 100 m
Mean - - < 100 m < 100 m < 100 m < 100 m
Area - - < 0.1 km2 < 0.1 km2 < 0.1 km2 < 0.1 km2
Possible moderate to strong avoidance
(upper bound SPLpeak 173 dB re 1 µPa)
Max 4.0 km 9.7 km 10.4 km 12.0 km 13.4 km 14.1 km
Min 3.8 km 8.3 km 8.9 km 10.0 km 11.1 km 11.7 km
Mean 3.9 km 9.0 km 9.6 km 10.9 km 12.0 km 12.6 km
Area 47 km2 250 km2 290 km2 370 km2 450 km2 500 km2
Possible moderate to strong avoidance
(lower bound SPLpeak 168 dB re 1 µPa)
Max 6.5 km 14.2 km 15.1 km 16.7 km 18.1 km 18.8 km
Min 6.0 km 11.8 km 12.5 km 13.7 km 14.8 km 15.3 km
Mean 6.3 km 12.7 km 13.4 km 14.8 km 16.1 km 16.8 km
Area 120 km2 500 km2 560 km2 690 km2 810 km2 880 km2
Startle response or C-turn reaction (SPLpeak
200 dB re 1 µPa)
Max 130 m 440 m 500 m 630 m 760 m 840 m
Min 120 m 430 m 490 m 620 m 750 m 830 m
Mean 130 m 440 m 500 m 630 m 760 m 840 m
Area 0.1 km2 0.6 km2 0.8 km2 1.2 km2 1.8 km2 2.2 km2
Table A 22 Predicted fish impact ranges using criteria from Popper et al. (2006), Carlson et al. (2007), Halvorsen et al (2011), McCauley et al. (2000) and Pearson et al. (1992) at Creyke Beck A, location
ID11
Cells marked with a hyphen are for single strike hammer energies and as such cumulative SELs cannot
be calculated for them.

COMMERCIAL IN CONFIDENCE
Underwater noise modelling at the Creyke Beck offshore wind farms, Dogger Bank
Subacoustech Environmental Ltd. 46
Document Ref: P223R0101
COMMERCIAL IN CONFIDENCE
NMFS (2016) impact ranges
Low-frequency cetaceans - impact criterion 2300 kJ hammer energy
3000 kJ hammer energy
3600 kJ hammer energy
4000 kJ hammer energy
PTS unweighted SPLpeak
(219 re 1 µPa)
Maximum 50 m 60 m 70 m 70 m
Minimum < 50 m 50 m 60 m 60 m
Mean < 50 m 60 m 70 m 70 m
Area < 0.1 km2 < 0.1 km2 < 0.1 km2 < 0.1 km2
TTS unweighted SPLpeak
(213 re 1 µPa)
Maximum 90 m 110 m 140 m 150 m
Minimum 80 m 100 m 130 m 140 m
Mean 90 m 110 m 140 m 150 m
Area < 0.1 km2 < 0.1 km2 0.1 km2 0.1 km2
Table A 23 Predicted unweighted SPLpeak impact ranges for low-frequency cetaceans using criteria from NMFS (2016) at Creyke Beck A, location ID11
Low-frequency cetaceans - impact criterion 2300 kJ hammer energy
3000 kJ hammer energy
3600 kJ hammer energy
4000 kJ hammer energy
Sequence 1 – PTS weighted SELcum (183 dB re 1 µPa2s)
Maximum 1.0 km 2.0 km 2.7 km 3.1 km
Minimum 600 m 1.1 km 1.5 km 1.8 km
Mean 740 m 1.5 km 2.0 km 2.3 km
Area 1.7 km2 7.0 km2 12 km2 17 km2
Sequence 1 – TTS weighted SELcum (168 dB re 1 µPa2s)
Maximum 17.6 km 19.4 km 20.3 km 20.9 km
Minimum 12.1 km 13.3 km 13.9 km 14.3 km
Mean 14.9 km 16.5 km 17.4 km 18.0 km
Area 690 km2 860 km2 950 km2 1000 km2
Sequence 2 – PTS weighted SELcum (183 dB re 1 µPa2s)
Maximum 1.7 km 3.0 km 3.7 km 4.3 km
Minimum 800 m 1.5 km 1.9 km 2.3 km
Mean 1.1 km 2.1 km 2.6 km 3.1 km
Area 4.0 km2 14 km2 22 km2 30 km2
Sequence 2 – TTS weighted SELcum (168 dB re 1 µPa2s)
Maximum 19.3 km 21.5 km 22.8 km 23.7 km
Minimum 12.8 km 14. km 14.6 km 15.1 km
Mean 16.6 km 18.4 km 19.3 km 20.0 km
Area 860 km2 1100 km2 1200 km2 1300 km2
Sequence 3 – PTS weighted SELcum (183 dB re 1 µPa2s)
Maximum 1.8 km 3.1 km 3.8 km 4.3 km
Minimum 800 m 1.5 km 2.0 km 2.3 km
Mean 1.1 km 2.1 km 2.7 km 3.1 km
Area 4.2 km2 14 km2 23 km2 31 km2
Sequence 3 – TTS weighted SELcum (168 dB re 1 µPa2s)
Maximum 19.9 km 22.4 km 23.8 km 24.7 km
Minimum 12.9 km 14.1 km 14.8 km 15.2 km
Mean 16.8 km 18.7 km 19.7 km 20.3 km
Area 890 km2 1100 km2 1200 km2 1300 km2
Table A 24 Predicted low-frequency cetacean weighted SELcum impact ranges using criteria from NMFS (2016) assuming a fleeing speed of 3.25 ms-1 for the three piling sequences at Creyke Beck A,
location ID11
Mid-frequency cetaceans - impact criterion 2300 kJ hammer energy
3000 kJ hammer energy
3600 kJ hammer energy
4000 kJ hammer energy
PTS unweighted SPLpeak
(230 re 1 µPa)
Maximum < 50 m < 50 m < 50 m < 50 m
Minimum < 50 m < 50 m < 50 m < 50 m
Mean < 50 m < 50 m < 50 m < 50 m
Area < 0.1 km2 < 0.1 km2 < 0.1 km2 < 0.1 km2
TTS unweighted SPLpeak
(224 re 1 µPa)
Maximum < 50 m < 50 m < 50 m < 50 m
Minimum < 50 m < 50 m < 50 m < 50 m
Mean < 50 m < 50 m < 50 m < 50 m
Area < 0.1 km2 < 0.1 km2 < 0.1 km2 < 0.1 km2
Table A 25 Predicted unweighted SPLpeak impact ranges for mid-frequency cetaceans using criteria from NMFS (2016) at Creyke Beck A, location ID11

COMMERCIAL IN CONFIDENCE
Underwater noise modelling at the Creyke Beck offshore wind farms, Dogger Bank
Subacoustech Environmental Ltd. 47
Document Ref: P223R0101
COMMERCIAL IN CONFIDENCE
Mid-frequency cetaceans - impact criterion 2300 kJ hammer energy
3000 kJ hammer energy
3600 kJ hammer energy
4000 kJ hammer energy
Sequence 1 – PTS weighted SELcum (185 dB re 1 µPa2s)
Maximum < 100 m < 100 m < 100 m < 100 m
Minimum < 100 m < 100 m < 100 m < 100 m
Mean < 100 m < 100 m < 100 m < 100 m
Area < 0.1 km2 < 0.1 km2 < 0.1 km2 < 0.1 km2
Sequence 1 – TTS weighted SELcum (170 dB re 1 µPa2s)
Maximum < 100 m < 100 m < 100 m < 100 m
Minimum < 100 m < 100 m < 100 m < 100 m
Mean < 100 m < 100 m < 100 m < 100 m
Area < 0.1 km2 < 0.1 km2 < 0.1 km2 < 0.1 km2
Sequence 2 – PTS weighted SELcum (185 dB re 1 µPa2s)
Maximum < 100 m < 100 m < 100 m < 100 m
Minimum < 100 m < 100 m < 100 m < 100 m
Mean < 100 m < 100 m < 100 m < 100 m
Area < 0.1 km2 < 0.1 km2 < 0.1 km2 < 0.1 km2
Sequence 2 – TTS weighted SELcum (170 dB re 1 µPa2s)
Maximum < 100 m < 100 m < 100 m < 100 m
Minimum < 100 m < 100 m < 100 m < 100 m
Mean < 100 m < 100 m < 100 m < 100 m
Area < 0.1 km2 < 0.1 km2 < 0.1 km2 < 0.1 km2
Sequence 3 – PTS weighted SELcum (185 dB re 1 µPa2s)
Maximum < 100 m < 100 m < 100 m < 100 m
Minimum < 100 m < 100 m < 100 m < 100 m
Mean < 100 m < 100 m < 100 m < 100 m
Area < 0.1 km2 < 0.1 km2 < 0.1 km2 < 0.1 km2
Sequence 3 – TTS weighted SELcum (170 dB re 1 µPa2s)
Maximum < 100 m < 100 m < 100 m < 100 m
Minimum < 100 m < 100 m < 100 m < 100 m
Mean < 100 m < 100 m < 100 m < 100 m
Area < 0.1 km2 < 0.1 km2 < 0.1 km2 < 0.1 km2
Table A 26 Predicted mid-frequency cetacean weighted SELcum impact ranges using criteria from NMFS (2016) assuming a fleeing speed of 1.5 ms-1 for the three piling sequences at Creyke Beck A,
location ID11
High-frequency cetaceans - impact criterion 2300 kJ hammer energy
3000 kJ hammer energy
3600 kJ hammer energy
4000 kJ hammer energy
PTS unweighted SPLpeak
(202 re 1 µPa)
Maximum 380 m 480 m 590 m 650 m
Minimum 370 m 470 m 580 m 640 m
Mean 380 m 480 m 590 m 650 m
Area 0.4 km2 0.7 km2 1.1 km2 1.3 km2
TTS unweighted SPLpeak
(196 re 1 µPa)
Maximum 850 m 1.1 km 1.3 km 1.4 km
Minimum 830 m 1.0 km 1.3 km 1.4 km
Mean 840 m 1.1 km 1.3 km 1.4 km
Area 2.2 km2 3.5 km2 5.1 km2 6.2 km2
Table A 27 Predicted unweighted SPLpeak impact ranges for high-frequency cetaceans using criteria from NMFS (2016) at Creyke Beck A, location ID11

COMMERCIAL IN CONFIDENCE
Underwater noise modelling at the Creyke Beck offshore wind farms, Dogger Bank
Subacoustech Environmental Ltd. 48
Document Ref: P223R0101
COMMERCIAL IN CONFIDENCE
High-frequency cetaceans - impact criterion 2300 kJ hammer energy
3000 kJ hammer energy
3600 kJ hammer energy
4000 kJ hammer energy
Sequence 1 – PTS weighted SELcum (155 dB re 1 µPa2s)
Maximum 1.6 km < 100 m < 100 m < 100 m
Minimum 1.3 km < 100 m < 100 m < 100 m
Mean 1.4 km < 100 m < 100 m < 100 m
Area 6.3 km2 < 0.1 km2 < 0.1 km2 < 0.1 km2
Sequence 1 – TTS weighted SELcum (140 dB re 1 µPa2s)
Maximum 16.4 km 8.5 km 9.3 km 9.8 km
Minimum 12.7 km 6.6 km 7.2 km 7.7 km
Mean 14.2 km 7.3 km 8.0 km 8.4 km
Area 630 km2 170 km2 200 km2 220 km2
Sequence 2 – PTS weighted SELcum (155 dB re 1 µPa2s)
Maximum 2.9 km < 100 m < 100 m < 100 m
Minimum 2.2 km < 100 m < 100 m < 100 m
Mean 2.5 km < 100 m < 100 m < 100 m
Area 20 km2 < 0.1 km2 < 0.1 km2 < 0.1 km2
Sequence 2 – TTS weighted SELcum (140 dB re 1 µPa2s)
Maximum 19.9 km 11.4 km 12.3 km 12.8 km
Minimum 14.4 km 8.4 km 9.1 km 9.5 km
Mean 17.2 km 9.6 km 10.3 km 10.8 km
Area 930 km2 290 km2 330 km2 370 km2
Sequence 3 – PTS weighted SELcum (155 dB re 1 µPa2s)
Maximum 3.4 km < 100 m < 100 m < 100 m
Minimum 2.3 km < 100 m < 100 m < 100 m
Mean 2.8 km < 100 m < 100 m < 100 m
Area 24 km2 < 0.1 km2 < 0.1 km2 < 0.1 km2
Sequence 3 – TTS weighted SELcum (140 dB re 1 µPa2s)
Maximum 20.9 km 12.2 km 13.1 km 13.7 km
Minimum 14.7 km 8.7 km 9.4 km 9.8 km
Mean 18.2 km 10.2 km 11.0 km 11.5 km
Area 1000 km2 330 km2 380 km2 420 km2
Table A 28 Predicted high-frequency cetacean weighted SELcum impact ranges using criteria from NMFS (2016) assuming a fleeing speed of 1.5 ms-1 for the three piling sequences at Creyke Beck A,
location ID11
Phocid pinnipeds - impact criterion 2300 kJ hammer energy
3000 kJ hammer energy
3600 kJ hammer energy
4000 kJ hammer energy
PTS unweighted SPLpeak
(218 re 1 µPa)
Maximum 60 m 70 m 80 m 80 m
Minimum 50 m 60 m 70 m 70 m
Mean 60 m 70 m 80 m 80 m
Area < 0.1 km2 < 0.1 km2 < 0.1 km2 < 0.1 km2
TTS unweighted SPLpeak
(212 re 1 µPa)
Maximum 110 m 130 m 160 m 170 m
Minimum 100 m 120 m 150 m 160 m
Mean 110 m 130 m 160 m 170 m
Area < 0.1 km2 0.1 km2 0.1 km2 0.1 km2
Table A 29 Predicted unweighted SPLpeak impact ranges for phocid pinnipeds using criteria from NMFS (2016) at Creyke Beck A, location ID11

COMMERCIAL IN CONFIDENCE
Underwater noise modelling at the Creyke Beck offshore wind farms, Dogger Bank
Subacoustech Environmental Ltd. 49
Document Ref: P223R0101
COMMERCIAL IN CONFIDENCE
Phocid pinnipeds - impact criterion 2300 kJ hammer energy
3000 kJ hammer energy
3600 kJ hammer energy
4000 kJ hammer energy
Sequence 1 – PTS weighted SELcum (185 dB re 1 µPa2s)
Maximum < 100 m < 100 m < 100 m < 100 m
Minimum < 100 m < 100 m < 100 m < 100 m
Mean < 100 m < 100 m < 100 m < 100 m
Area < 0.1 km2 < 0.1 km2 < 0.1 km2 < 0.1 km2
Sequence 1 – TTS weighted SELcum (170 dB re 1 µPa2s)
Maximum 4.7 km 7.0 km 7.7 km 8.3 km
Minimum 3.7 km 5.5 km 6.0 km 6.4 km
Mean 4.2 km 6.1 km 6.7 km 7.2 km
Area 55 km2 120 km2 140 km2 160 km2
Sequence 2 – PTS weighted SELcum (185 dB re 1 µPa2s)
Maximum < 100 m < 100 m < 100 m < 100 m
Minimum < 100 m < 100 m < 100 m < 100 m
Mean < 100 m < 100 m < 100 m < 100 m
Area < 0.1 km2 < 0.1 km2 < 0.1 km2 < 0.1 km2
Sequence 2 – TTS weighted SELcum (170 dB re 1 µPa2s)
Maximum 7.1 km 9.8 km 10.6 km 11.2 km
Minimum 5.2 km 7.2 km 7.8 km 8.3 km
Mean 5.9 km 8.2 km 8.9 km 9.4 km
Area 110 km2 210 km2 250 km2 280 km2
Sequence 3 – PTS weighted SELcum (185 dB re 1 µPa2s)
Maximum < 100 m < 100 m < 100 m < 100 m
Minimum < 100 m < 100 m < 100 m < 100 m
Mean < 100 m < 100 m < 100 m < 100 m
Area < 0.1 km2 < 0.1 km2 < 0.1 km2 < 0.1 km2
Sequence 3 – TTS weighted SELcum (170 dB re 1 µPa2s)
Maximum 7.8 km 10.6 km 11.4 km 12.0 km
Minimum 5.5 km 7.5 km 8.1 km 8.6 km
Mean 6.4 km 8.8 km 9.5 km 10.0 km
Area 130 km2 240 km2 280 km2 320 km2
Table A 30 Predicted phocid pinnipeds weighted SELcum impact ranges using criteria from NMFS (2016) assuming a fleeing speed of 1.5 ms-1 for the three piling sequences at Creyke Beck A, location
ID11
Popper et al (2014) impact ranges
Fish - impact criterion 2300 kJ hammer energy
3000 kJ hammer energy
3600 kJ hammer energy
4000 kJ hammer energy
Injury (fish: no swim bladder) unweighted SPLpeak
(213 re 1 µPa)
Maximum 90 m 110 m 140 m 150 m
Minimum 80 m 100 m 130 m 140 m
Mean 90 m 110 m 140 m 150 m
Area < 0.1 km2 < 0.1 km2 < 0.1 km2 0.1 km2
Injury (fish: with swim bladder) unweighted SPLpeak
(207 re 1 µPa)
Maximum 200 m 250 m 300 m 330 m
Minimum 190 m 240 m 290 m 320 m
Mean 200 m 250 m 300 m 330 m
Area 0.1 km2 0.2 km2 0.3 km2 0.3 km2
Table A 31 Predicted unweighted SPLpeak impact ranges for fish using criteria from Popper et al. (2014) at Creyke Beck A, location ID11

COMMERCIAL IN CONFIDENCE
Underwater noise modelling at the Creyke Beck offshore wind farms, Dogger Bank
Subacoustech Environmental Ltd. 50
Document Ref: P223R0101
COMMERCIAL IN CONFIDENCE
Fish - impact criterion (Sequence 1)
2300 kJ hammer energy
3000 kJ hammer energy
3600 kJ hammer energy
4000 kJ hammer energy
Mortality (fish: no swim bladder) SELcum
(> 219 dB re 1 µPa2s)
Maximum < 100 m < 100 m < 100 m < 100 m
Minimum < 100 m < 100 m < 100 m < 100 m
Mean < 100 m < 100 m < 100 m < 100 m
Area < 0.1 km2 < 0.1 km2 < 0.1 km2 < 0.1 km2
Recoverable injury (fish: no swim bladder) SELcum
(> 216 dB re 1 µPa2s)
Maximum < 100 m < 100 m < 100 m < 100 m
Minimum < 100 m < 100 m < 100 m < 100 m
Mean < 100 m < 100 m < 100 m < 100 m
Area < 0.1 km2 < 0.1 km2 < 0.1 km2 < 0.1 km2
Mortality (fish: swim bladder not involved in hearing) SELcum (210
dB re 1 µPa2s)
Maximum < 100 m < 100 m < 100 m < 100 m
Minimum < 100 m < 100 m < 100 m < 100 m
Mean < 100 m < 100 m < 100 m < 100 m
Area < 0.1 km2 < 0.1 km2 < 0.1 km2 < 0.1 km2
Mortality (fish: swim bladder involved in hearing) SELcum
(207 dB re 1 µPa2s)
Maximum < 100 m < 100 m < 100 m < 100 m
Minimum < 100 m < 100 m < 100 m < 100 m
Mean < 100 m < 100 m < 100 m < 100 m
Area < 0.1 km2 < 0.1 km2 < 0.1 km2 < 0.1 km2
Recoverable injury (fish: with swim bladder) SELcum (203 dB re 1 µPa2s)
Maximum < 100 m < 100 m < 100 m < 100 m
Minimum < 100 m < 100 m < 100 m < 100 m
Mean < 100 m < 100 m < 100 m < 100 m
Area < 0.1 km2 < 0.1 km2 < 0.1 km2 < 0.1 km2
TTS (all fish) SELcum
(186 re 1 µPa2s)
Maximum 5.8 km 8.6 km 9.4 km 9.9 km
Minimum 4.6 km 6.7 km 7.3 km 7.7 km
Mean 5.1 km 7.4 km 8.1 km 8.5 km
Area 82 km2 170 km2 200 km2 230 km2
Table A 32 Predicted unweighted SELcum impact ranges for fish using criteria from Popper et al. (2014) assuming a fleeing speed of 1.5 ms-1 for piling sequence 1 at Creyke Beck A, location ID11
Fish - impact criterion (Sequence 2)
2300 kJ hammer energy
3000 kJ hammer energy
3600 kJ hammer energy
4000 kJ hammer energy
Mortality (fish: no swim bladder) SELcum
(> 219 dB re 1 µPa2s)
Maximum < 100 m < 100 m < 100 m < 100 m
Minimum < 100 m < 100 m < 100 m < 100 m
Mean < 100 m < 100 m < 100 m < 100 m
Area < 0.1 km2 < 0.1 km2 < 0.1 km2 < 0.1 km2
Recoverable injury (fish: no swim bladder) SELcum
(> 216 dB re 1 µPa2s)
Maximum < 100 m < 100 m < 100 m < 100 m
Minimum < 100 m < 100 m < 100 m < 100 m
Mean < 100 m < 100 m < 100 m < 100 m
Area < 0.1 km2 < 0.1 km2 < 0.1 km2 < 0.1 km2
Mortality (fish: swim bladder not involved in hearing) SELcum (210
dB re 1 µPa2s)
Maximum < 100 m < 100 m < 100 m < 100 m
Minimum < 100 m < 100 m < 100 m < 100 m
Mean < 100 m < 100 m < 100 m < 100 m
Area < 0.1 km2 < 0.1 km2 < 0.1 km2 < 0.1 km2
Mortality (fish: swim bladder involved in hearing) SELcum
(207 dB re 1 µPa2s)
Maximum < 100 m < 100 m < 100 m < 100 m
Minimum < 100 m < 100 m < 100 m < 100 m
Mean < 100 m < 100 m < 100 m < 100 m
Area < 0.1 km2 < 0.1 km2 < 0.1 km2 < 0.1 km2
Recoverable injury (fish: with swim bladder) SELcum (203 dB re 1 µPa2s)
Maximum < 100 m < 100 m < 100 m < 100 m
Minimum < 100 m < 100 m < 100 m < 100 m
Mean < 100 m < 100 m < 100 m < 100 m
Area < 0.1 km2 < 0.1 km2 < 0.1 km2 < 0.1 km2
TTS (all fish) SELcum
(186 re 1 µPa2s)
Maximum 8.4 km 11.5 km 12.4 km 13.0 km
Minimum 6.2 km 8.5 km 9.2 km 9.6 km
Mean 7.0 km 9.7 km 10.4 km 10.9 km
Area 160 km2 290 km2 340 km2 370 km2
Table A 33 Predicted unweighted SELcum impact ranges for fish using criteria from Popper et al. (2014) assuming a fleeing speed of 1.5 ms-1 for piling sequence 2 at Creyke Beck A, location ID11

COMMERCIAL IN CONFIDENCE
Underwater noise modelling at the Creyke Beck offshore wind farms, Dogger Bank
Subacoustech Environmental Ltd. 51
Document Ref: P223R0101
COMMERCIAL IN CONFIDENCE
Fish - impact criterion (Sequence 3)
2300 kJ hammer energy
3000 kJ hammer energy
3600 kJ hammer energy
4000 kJ hammer energy
Mortality (fish: no swim bladder) SELcum
(> 219 dB re 1 µPa2s)
Maximum < 100 m < 100 m < 100 m < 100 m
Minimum < 100 m < 100 m < 100 m < 100 m
Mean < 100 m < 100 m < 100 m < 100 m
Area < 0.1 km2 < 0.1 km2 < 0.1 km2 < 0.1 km2
Recoverable injury (fish: no swim bladder) SELcum
(> 216 dB re 1 µPa2s)
Maximum < 100 m < 100 m < 100 m < 100 m
Minimum < 100 m < 100 m < 100 m < 100 m
Mean < 100 m < 100 m < 100 m < 100 m
Area < 0.1 km2 < 0.1 km2 < 0.1 km2 < 0.1 km2
Mortality (fish: swim bladder not involved in hearing) SELcum (210
dB re 1 µPa2s)
Maximum < 100 m < 100 m < 100 m < 100 m
Minimum < 100 m < 100 m < 100 m < 100 m
Mean < 100 m < 100 m < 100 m < 100 m
Area < 0.1 km2 < 0.1 km2 < 0.1 km2 < 0.1 km2
Mortality (fish: swim bladder involved in hearing) SELcum
(207 dB re 1 µPa2s)
Maximum < 100 m < 100 m < 100 m < 100 m
Minimum < 100 m < 100 m < 100 m < 100 m
Mean < 100 m < 100 m < 100 m < 100 m
Area < 0.1 km2 < 0.1 km2 < 0.1 km2 < 0.1 km2
Recoverable injury (fish: with swim bladder) SELcum (203 dB re 1 µPa2s)
Maximum < 100 m < 100 m < 100 m < 100 m
Minimum < 100 m < 100 m < 100 m < 100 m
Mean < 100 m < 100 m < 100 m < 100 m
Area < 0.1 km2 < 0.1 km2 < 0.1 km2 < 0.1 km2
TTS (all fish) SELcum
(186 re 1 µPa2s)
Maximum 9.2 km 12.3 km 13.2 km 13.8 km
Minimum 6.5 km 8.8 km 9.4 km 9.9 km
Mean 7.6 km 10.3 km 11.1 km 11.6 km
Area 180 km2 340 km2 390 km2 420 km2
Table A 34 Predicted unweighted SELcum impact ranges for fish using criteria from Popper et al. (2014) assuming a fleeing speed of 1.5 ms-1 for piling sequence 3 at Creyke Beck A, location ID11

COMMERCIAL IN CONFIDENCE
Underwater noise modelling at the Creyke Beck offshore wind farms, Dogger Bank
Subacoustech Environmental Ltd. 52
Document Ref: P223R0101
COMMERCIAL IN CONFIDENCE
A.3 Creyke Beck B, location ID6
Previously considered criteria
Harbour porpoise - impact criterion
300 kJ hammer energy
1900 kJ hammer energy
2300 kJ hammer energy
3000 kJ hammer energy
3600 kJ hammer energy
4000 kJ hammer energy
Instantaneous injury/PTS (SPLpeak 200
dB re 1 µPa)
Max 130 m 450 m 500 m 630 m 770 m 860 m
Min 120 m 430 m 490 m 620 m 760 m 840 m
Mean 130 m 440 m 500 m 630 m 770 m 850 m
Area 0.1 km2 0.6 km2 0.8 km2 1.2 km2 1.8 km2 2.3 km2
Instantaneous injury/PTS (SELss 179
dB re 1 µPa2s)
Max 150 m 430 m 470 m 720 m 800 m 860 m
Min 140 m 420 m 460 m 700 m 780 m 850 m
Mean 150 m 430 m 470 m 710 m 790 m 860 m
Area 0.1 km2 0.6 km2 0.7 km2 1.6 km2 2.0 km2 2.3 km2
TTS/fleeing response (SPLpeak 194 dB re 1
µPa)
Max 280 m 990 m 1.1 km 1.4 km 1.7 km 1.9 km
Min 270 m 970 m 1.1 km 1.4 km 1.7 km 1.8 km
Mean 280 m 980 m 1.1 km 1.4 km 1.7 km 1.9 km
Area 0.2 km2 3.0 km2 3.8 km2 6.0 km2 8.8 km2 11 km2
TTS/fleeing response (SELss 164 dB re 1
µPa2s)
Max 1.4 km 4.0 km 4.3 km 5.9 km 6.5 km 6.9 km
Min 1.4 km 3.8 km 4.0 km 5.5 km 6.0 km 6.3 km
Mean 1.4 km 3.9 km 4.2 km 5.8 km 6.3 km 6.7 km
Area 6.4 km2 47 km2 54 km2 110 km2 130 km2 140 km2
Possible avoidance of area (SPLpeak 168 re 1
µPa2s)
Max 7.1 km 16.3 km 17.7 km 20.5 km 23.2 km 24.6 km
Min 6.4 km 13.0 km 13.8 km 15.2 km 16.4 km 17.0 km
Mean 6.9 km 15.0 km 16.0 km 18.1 km 20.0 km 21.1 km
Area 150 km2 710 km2 810 km2 1000 km2 1300 km2 1400 km2
Possible avoidance of area (SELss 145 re 1
µPa2s)
Max 15.1 km 30.1 km 31.5 km 39.1 km 41.1 km 42.6 km
Min 12.4 km 19.7 km 20.3 km 23.2 km 23.9 km 24.4 km
Mean 14.1 km 25.1 km 26.1 km 31.4 km 32.8 km 33.9 km
Area 620 km2 2000 km2 2200 km2 3100 km2 3500 km2 3700 km2
Table A 35 Predicted harbour porpoise impact ranges using criteria derived from Lucke et al. (2009) at Creyke Beck B, location ID6

COMMERCIAL IN CONFIDENCE
Underwater noise modelling at the Creyke Beck offshore wind farms, Dogger Bank
Subacoustech Environmental Ltd. 53
Document Ref: P223R0101
COMMERCIAL IN CONFIDENCE
Mid-frequency cetaceans - impact criterion
300 kJ hammer energy
1900 kJ hammer energy
2300 kJ hammer energy
3000 kJ hammer energy
3600 kJ hammer energy
4000 kJ hammer energy
Instantaneous injury/PTS (SPLpeak 230
dB re 1 µPa)
Max < 50 m < 50 m < 50 m < 50 m < 50 m < 50 m
Min < 50 m < 50 m < 50 m < 50 m < 50 m < 50 m
Mean < 50 m < 50 m < 50 m < 50 m < 50 m < 50 m
Area < 0.1 km2 < 0.1 km2 < 0.1 km2 < 0.1 km2 < 0.1 km2 < 0.1 km2
Instantaneous injury/PTS (Mmf SELss
198 dB re 1 µPa2s)
Max < 50 m < 50 m < 50 m < 50 m < 50 m < 50 m
Min < 50 m < 50 m < 50 m < 50 m < 50 m < 50 m
Mean < 50 m < 50 m < 50 m < 50 m < 50 m < 50 m
Area < 0.1 km2 < 0.1 km2 < 0.1 km2 < 0.1 km2 < 0.1 km2 < 0.1 km2
TTS/fleeing response (SPLpeak 224 dB re 1
µPa)
Max < 50 m < 50 m < 50 m < 50 m < 50 m < 50 m
Min < 50 m < 50 m < 50 m < 50 m < 50 m < 50 m
Mean < 50 m < 50 m < 50 m < 50 m < 50 m < 50 m
Area < 0.1 km2 < 0.1 km2 < 0.1 km2 < 0.1 km2 < 0.1 km2 < 0.1 km2
TTS/fleeing response (Mmf SELss 183 dB re 1
µPa2s)
Max < 50 m 90 m 120 m 140 m 150 m 170 m
Min < 50 m 80 m 110 m 130 m 140 m 160 m
Mean < 50 m 90 m 120 m 140 m 150 m 170 m
Area < 0.1 km2 < 0.1 km2 < 0.1 km2 0.1 km2 0.1 km2 0.1 km2
Likely avoidance of area (SELss 170 re 1 µPa2s)
Max 580 m 1.7 km 1.9 km 2.7 km 3.0 km 3.2 km
Min 570 m 1.7 km 1.8 km 2.7 km 2.9 km 3.1 km
Mean 580 m 1.7 km 1.8 km 2.7 km 3.0 km 3.2 km
Area 1.0 km2 8.9 km2 10 km2 23 km2 27 km2 31 km2
Possible avoidance of area (SELss 160 re 1
µPa2s)
Max 2.6 km 6.5 km 6.9 km 9.4 km 10.2 km 10.7 km
Min 2.5 km 6.0 km 6.3 km 8.3 km 8.9 km 9.3 km
Mean 2.5 km 6.4 km 6.8 km 9.1 km 9.7 km 10.2 km
Area 20 km2 130 km2 140 km2 260 km2 300 km2 330 km2
Table A 36 Predicted mid-frequency cetacean impact ranges using criteria derived from Southall et al. (2007) at Creyke Beck B, location ID6
Low-frequency cetaceans - impact criterion
300 kJ hammer energy
1900 kJ hammer energy
2300 kJ hammer energy
3000 kJ hammer energy
3600 kJ hammer energy
4000 kJ hammer energy
Instantaneous injury/PTS (SPLpeak 230
dB re 1 µPa)
Max < 50 m < 50 m < 50 m < 50 m < 50 m < 50 m
Min < 50 m < 50 m < 50 m < 50 m < 50 m < 50 m
Mean < 50 m < 50 m < 50 m < 50 m < 50 m < 50 m
Area < 0.1 km2 < 0.1 km2 < 0.1 km2 < 0.1 km2 < 0.1 km2 < 0.1 km2
Instantaneous injury/PTS (Mlf SELss 198 dB re 1 µPa2s)
Max < 50 m < 50 m < 50 m 50 m 50 m 50 m
Min < 50 m < 50 m < 50 m < 50 m < 50 m < 50 m
Mean < 50 m < 50 m < 50 m < 50 m < 50 m < 50 m
Area < 0.1 km2 < 0.1 km2 < 0.1 km2 < 0.1 km2 < 0.1 km2 < 0.1 km2
TTS/fleeing response (SPLpeak 224 dB re 1
µPa)
Max < 50 m < 50 m < 50 m < 50 m < 50 m < 50 m
Min < 50 m < 50 m < 50 m < 50 m < 50 m < 50 m
Mean < 50 m < 50 m < 50 m < 50 m < 50 m < 50 m
Area < 0.1 km2 < 0.1 km2 < 0.1 km2 < 0.1 km2 < 0.1 km2 < 0.1 km2
TTS/fleeing response (Mlf SELss 183 dB re 1
µPa2s)
Max 80 m 240 m 260 m 390 m 430 m 470 m
Min 70 m 230 m 250 m 380 m 420 m 450 m
Mean 80 m 240 m 260 m 390 m 430 m 460 m
Area < 0.1 km2 0.2 km2 0.2 km2 0.5 km2 0.6 km2 0.7 km2
Likely avoidance of area (SELss 152 re 1 µPa2s)
Max 7.2 km 15.3 km 16.2 km 21.3 km 22.8 km 23.9 km
Min 6.5 km 12.6 km 13.1 km 15.8 km 16.5 km 17.0 km
Mean 7.0 km 14.3 km 15.0 km 18.8 km 19.9 km 20.7 km
Area 150 km2 640 km2 700 km2 1100 km2 1200 km2 1300 km2
Possible avoidance of area (SELss 142 re 1
µPa2s)
Max 20.4 km 38.3 km 40.0 km 48.4 km 50.8 km 52.5 km
Min 15.4 km 22.9 km 23.5 km 26.4 km 27.2 km 27.8 km
Mean 18.2 km 30.9 km 32.0 km 37.9 km 39.5 km 40.7 km
Area 1000 km2 3000 km2 3300 km2 4600 km2 5100 km2 5400 km2
Table A 37 Predicted low-frequency cetacean impact ranges using criteria derived from Southall et al. (2007) at Creyke Beck B, location ID6
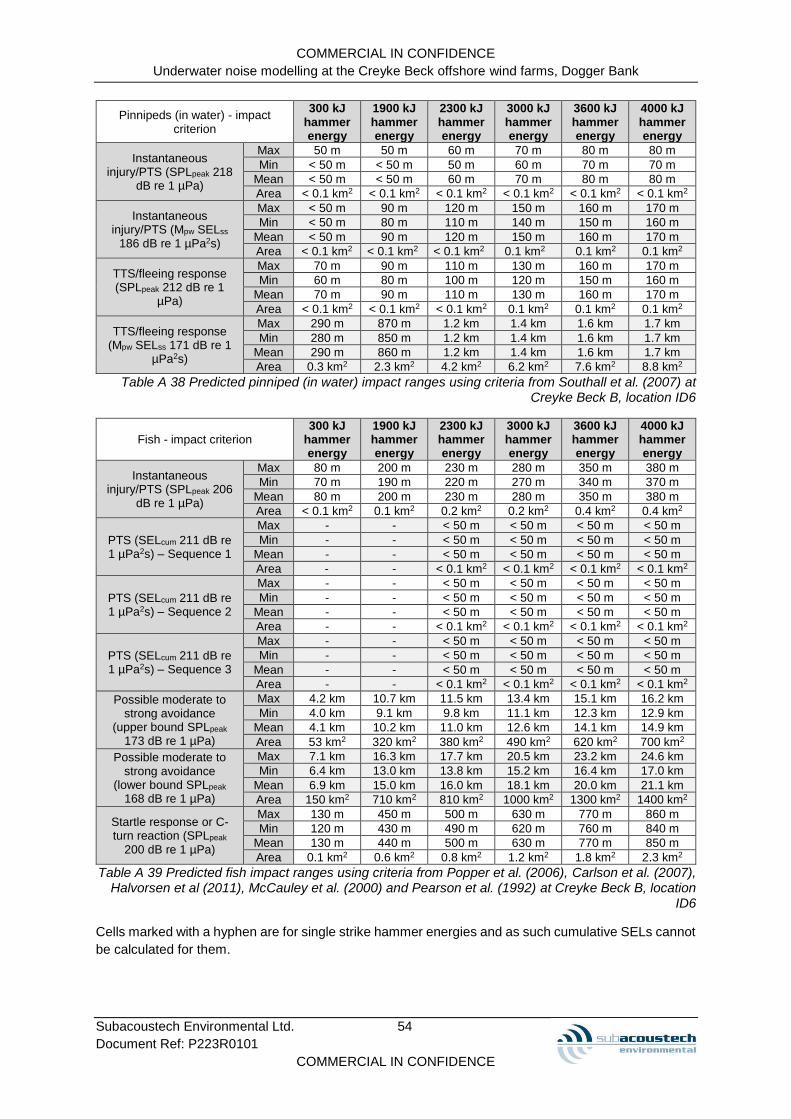
COMMERCIAL IN CONFIDENCE
Underwater noise modelling at the Creyke Beck offshore wind farms, Dogger Bank
Subacoustech Environmental Ltd. 54
Document Ref: P223R0101
COMMERCIAL IN CONFIDENCE
Pinnipeds (in water) - impact criterion
300 kJ hammer energy
1900 kJ hammer energy
2300 kJ hammer energy
3000 kJ hammer energy
3600 kJ hammer energy
4000 kJ hammer energy
Instantaneous injury/PTS (SPLpeak 218
dB re 1 µPa)
Max 50 m 50 m 60 m 70 m 80 m 80 m
Min < 50 m < 50 m 50 m 60 m 70 m 70 m
Mean < 50 m < 50 m 60 m 70 m 80 m 80 m
Area < 0.1 km2 < 0.1 km2 < 0.1 km2 < 0.1 km2 < 0.1 km2 < 0.1 km2
Instantaneous injury/PTS (Mpw SELss
186 dB re 1 µPa2s)
Max < 50 m 90 m 120 m 150 m 160 m 170 m
Min < 50 m 80 m 110 m 140 m 150 m 160 m
Mean < 50 m 90 m 120 m 150 m 160 m 170 m
Area < 0.1 km2 < 0.1 km2 < 0.1 km2 0.1 km2 0.1 km2 0.1 km2
TTS/fleeing response (SPLpeak 212 dB re 1
µPa)
Max 70 m 90 m 110 m 130 m 160 m 170 m
Min 60 m 80 m 100 m 120 m 150 m 160 m
Mean 70 m 90 m 110 m 130 m 160 m 170 m
Area < 0.1 km2 < 0.1 km2 < 0.1 km2 0.1 km2 0.1 km2 0.1 km2
TTS/fleeing response (Mpw SELss 171 dB re 1
µPa2s)
Max 290 m 870 m 1.2 km 1.4 km 1.6 km 1.7 km
Min 280 m 850 m 1.2 km 1.4 km 1.6 km 1.7 km
Mean 290 m 860 m 1.2 km 1.4 km 1.6 km 1.7 km
Area 0.3 km2 2.3 km2 4.2 km2 6.2 km2 7.6 km2 8.8 km2
Table A 38 Predicted pinniped (in water) impact ranges using criteria from Southall et al. (2007) at Creyke Beck B, location ID6
Fish - impact criterion 300 kJ
hammer energy
1900 kJ hammer energy
2300 kJ hammer energy
3000 kJ hammer energy
3600 kJ hammer energy
4000 kJ hammer energy
Instantaneous injury/PTS (SPLpeak 206
dB re 1 µPa)
Max 80 m 200 m 230 m 280 m 350 m 380 m
Min 70 m 190 m 220 m 270 m 340 m 370 m
Mean 80 m 200 m 230 m 280 m 350 m 380 m
Area < 0.1 km2 0.1 km2 0.2 km2 0.2 km2 0.4 km2 0.4 km2
PTS (SELcum 211 dB re 1 µPa2s) – Sequence 1
Max - - < 50 m < 50 m < 50 m < 50 m
Min - - < 50 m < 50 m < 50 m < 50 m
Mean - - < 50 m < 50 m < 50 m < 50 m
Area - - < 0.1 km2 < 0.1 km2 < 0.1 km2 < 0.1 km2
PTS (SELcum 211 dB re 1 µPa2s) – Sequence 2
Max - - < 50 m < 50 m < 50 m < 50 m
Min - - < 50 m < 50 m < 50 m < 50 m
Mean - - < 50 m < 50 m < 50 m < 50 m
Area - - < 0.1 km2 < 0.1 km2 < 0.1 km2 < 0.1 km2
PTS (SELcum 211 dB re 1 µPa2s) – Sequence 3
Max - - < 50 m < 50 m < 50 m < 50 m
Min - - < 50 m < 50 m < 50 m < 50 m
Mean - - < 50 m < 50 m < 50 m < 50 m
Area - - < 0.1 km2 < 0.1 km2 < 0.1 km2 < 0.1 km2
Possible moderate to strong avoidance
(upper bound SPLpeak 173 dB re 1 µPa)
Max 4.2 km 10.7 km 11.5 km 13.4 km 15.1 km 16.2 km
Min 4.0 km 9.1 km 9.8 km 11.1 km 12.3 km 12.9 km
Mean 4.1 km 10.2 km 11.0 km 12.6 km 14.1 km 14.9 km
Area 53 km2 320 km2 380 km2 490 km2 620 km2 700 km2
Possible moderate to strong avoidance
(lower bound SPLpeak 168 dB re 1 µPa)
Max 7.1 km 16.3 km 17.7 km 20.5 km 23.2 km 24.6 km
Min 6.4 km 13.0 km 13.8 km 15.2 km 16.4 km 17.0 km
Mean 6.9 km 15.0 km 16.0 km 18.1 km 20.0 km 21.1 km
Area 150 km2 710 km2 810 km2 1000 km2 1300 km2 1400 km2
Startle response or C-turn reaction (SPLpeak
200 dB re 1 µPa)
Max 130 m 450 m 500 m 630 m 770 m 860 m
Min 120 m 430 m 490 m 620 m 760 m 840 m
Mean 130 m 440 m 500 m 630 m 770 m 850 m
Area 0.1 km2 0.6 km2 0.8 km2 1.2 km2 1.8 km2 2.3 km2
Table A 39 Predicted fish impact ranges using criteria from Popper et al. (2006), Carlson et al. (2007), Halvorsen et al (2011), McCauley et al. (2000) and Pearson et al. (1992) at Creyke Beck B, location
ID6
Cells marked with a hyphen are for single strike hammer energies and as such cumulative SELs cannot
be calculated for them.

COMMERCIAL IN CONFIDENCE
Underwater noise modelling at the Creyke Beck offshore wind farms, Dogger Bank
Subacoustech Environmental Ltd. 55
Document Ref: P223R0101
COMMERCIAL IN CONFIDENCE
NMFS (2016) impact ranges
Low-frequency cetaceans - impact criterion 2300 kJ hammer energy
3000 kJ hammer energy
3600 kJ hammer energy
4000 kJ hammer energy
PTS unweighted SPLpeak
(219 re 1 µPa)
Maximum 50 m 60 m 70 m 70 m
Minimum < 50 m 50 m 60 m 60 m
Mean < 50 m 60 m 70 m 70 m
Area < 0.1 km2 < 0.1 km2 < 0.1 km2 < 0.1 km2
TTS unweighted SPLpeak
(213 re 1 µPa)
Maximum 90 m 120 m 140 m 150 m
Minimum 80 m 110 m 130 m 140 m
Mean 90 m 120 m 140 m 150 m
Area < 0.1 km2 < 0.1 km2 0.1 km2 0.1 km2
Table A 40 Predicted unweighted SPLpeak impact ranges for low-frequency cetaceans using criteria from NMFS (2016) at Creyke Beck B, location ID6
Low-frequency cetaceans - impact criterion 2300 kJ hammer energy
3000 kJ hammer energy
3600 kJ hammer energy
4000 kJ hammer energy
Sequence 1 – PTS weighted SELcum (183 dB re 1 µPa2s)
Maximum 1.4 km 2.7 km 3.5 km 4.1 km
Minimum 690 m 1.6 km 2.1 km 2.5 km
Mean 1.1 km 2.4 km 3.0 km 3.5 km
Area 4.2 km2 17 km2 29 km2 39 km2
Sequence 1 – TTS weighted SELcum (168 dB re 1 µPa2s)
Maximum 30.3 km 34.7 km 36.9 km 38.5 km
Minimum 14.7 km 16.3 km 17.1 km 17.6 km
Mean 22.7 km 25.8 km 27.4 km 28.5 km
Area 1700 km2 2200 km2 2500 km2 2700 km2
Sequence 2 – PTS weighted SELcum (183 dB re 1 µPa2s)
Maximum 3.0 km 5.0 km 6.1 km 6.9 km
Minimum 1.1 km 2.2 km 2.8 km 3.3 km
Mean 2.2 km 3.8 km 4.7 km 5.3 km
Area 16 km2 47 km2 70 km2 91 km2
Sequence 2 – TTS weighted SELcum (168 dB re 1 µPa2s)
Maximum 40.2 km 45.3 km 47.9 km 49.8 km
Minimum 16.0 km 17.7 km 18.6 km 19.2 km
Mean 28.4 km 32.0 km 33.8 km 35.1 km
Area 2700 km2 3500 km2 3900 km2 4200 km2
Sequence 3 – PTS weighted SELcum (183 dB re 1 µPa2s)
Maximum 3.6 km 5.9 km 7.2 km 8.1 km
Minimum 1.1 km 2.3 km 2.9 km 3.3 km
Mean 2.5 km 4.2 km 5.1 km 5.8 km
Area 21 km2 58 km2 86 km2 110 km2
Sequence 3 – TTS weighted SELcum (168 dB re 1 µPa2s)
Maximum 45.0 km 50.8 km 53.8 km 55.9 km
Minimum 16.1 km 17.9 km 18.7 km 19.3 km
Mean 30.8 km 34.6 km 36.6 km 38.0 km
Area 3300 km2 4100 km2 4600 km2 5000 km2
Table A 41 Predicted low-frequency cetacean weighted SELcum impact ranges using criteria from NMFS (2016) assuming a fleeing speed of 3.25 ms-1 for the three piling sequences at Creyke Beck B,
location ID6
Mid-frequency cetaceans - impact criterion 2300 kJ hammer energy
3000 kJ hammer energy
3600 kJ hammer energy
4000 kJ hammer energy
PTS unweighted SPLpeak
(230 re 1 µPa)
Maximum < 50 m < 50 m < 50 m < 50 m
Minimum < 50 m < 50 m < 50 m < 50 m
Mean < 50 m < 50 m < 50 m < 50 m
Area < 0.1 km2 < 0.1 km2 < 0.1 km2 < 0.1 km2
TTS unweighted SPLpeak
(224 re 1 µPa)
Maximum < 50 m < 50 m < 50 m < 50 m
Minimum < 50 m < 50 m < 50 m < 50 m
Mean < 50 m < 50 m < 50 m < 50 m
Area < 0.1 km2 < 0.1 km2 < 0.1 km2 < 0.1 km2
Table A 42 Predicted unweighted SPLpeak impact ranges for mid-frequency cetaceans using criteria from NMFS (2016) at Creyke Beck B, location ID6
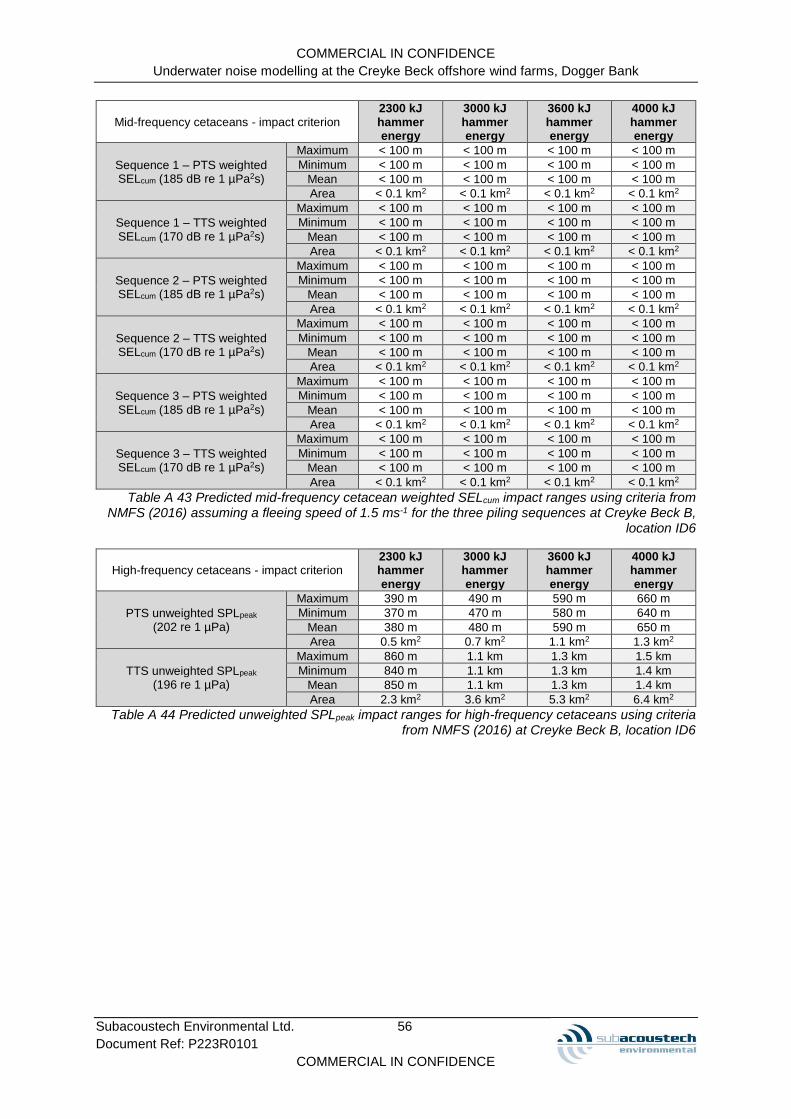
COMMERCIAL IN CONFIDENCE
Underwater noise modelling at the Creyke Beck offshore wind farms, Dogger Bank
Subacoustech Environmental Ltd. 56
Document Ref: P223R0101
COMMERCIAL IN CONFIDENCE
Mid-frequency cetaceans - impact criterion 2300 kJ hammer energy
3000 kJ hammer energy
3600 kJ hammer energy
4000 kJ hammer energy
Sequence 1 – PTS weighted SELcum (185 dB re 1 µPa2s)
Maximum < 100 m < 100 m < 100 m < 100 m
Minimum < 100 m < 100 m < 100 m < 100 m
Mean < 100 m < 100 m < 100 m < 100 m
Area < 0.1 km2 < 0.1 km2 < 0.1 km2 < 0.1 km2
Sequence 1 – TTS weighted SELcum (170 dB re 1 µPa2s)
Maximum < 100 m < 100 m < 100 m < 100 m
Minimum < 100 m < 100 m < 100 m < 100 m
Mean < 100 m < 100 m < 100 m < 100 m
Area < 0.1 km2 < 0.1 km2 < 0.1 km2 < 0.1 km2
Sequence 2 – PTS weighted SELcum (185 dB re 1 µPa2s)
Maximum < 100 m < 100 m < 100 m < 100 m
Minimum < 100 m < 100 m < 100 m < 100 m
Mean < 100 m < 100 m < 100 m < 100 m
Area < 0.1 km2 < 0.1 km2 < 0.1 km2 < 0.1 km2
Sequence 2 – TTS weighted SELcum (170 dB re 1 µPa2s)
Maximum < 100 m < 100 m < 100 m < 100 m
Minimum < 100 m < 100 m < 100 m < 100 m
Mean < 100 m < 100 m < 100 m < 100 m
Area < 0.1 km2 < 0.1 km2 < 0.1 km2 < 0.1 km2
Sequence 3 – PTS weighted SELcum (185 dB re 1 µPa2s)
Maximum < 100 m < 100 m < 100 m < 100 m
Minimum < 100 m < 100 m < 100 m < 100 m
Mean < 100 m < 100 m < 100 m < 100 m
Area < 0.1 km2 < 0.1 km2 < 0.1 km2 < 0.1 km2
Sequence 3 – TTS weighted SELcum (170 dB re 1 µPa2s)
Maximum < 100 m < 100 m < 100 m < 100 m
Minimum < 100 m < 100 m < 100 m < 100 m
Mean < 100 m < 100 m < 100 m < 100 m
Area < 0.1 km2 < 0.1 km2 < 0.1 km2 < 0.1 km2
Table A 43 Predicted mid-frequency cetacean weighted SELcum impact ranges using criteria from NMFS (2016) assuming a fleeing speed of 1.5 ms-1 for the three piling sequences at Creyke Beck B,
location ID6
High-frequency cetaceans - impact criterion 2300 kJ hammer energy
3000 kJ hammer energy
3600 kJ hammer energy
4000 kJ hammer energy
PTS unweighted SPLpeak
(202 re 1 µPa)
Maximum 390 m 490 m 590 m 660 m
Minimum 370 m 470 m 580 m 640 m
Mean 380 m 480 m 590 m 650 m
Area 0.5 km2 0.7 km2 1.1 km2 1.3 km2
TTS unweighted SPLpeak
(196 re 1 µPa)
Maximum 860 m 1.1 km 1.3 km 1.5 km
Minimum 840 m 1.1 km 1.3 km 1.4 km
Mean 850 m 1.1 km 1.3 km 1.4 km
Area 2.3 km2 3.6 km2 5.3 km2 6.4 km2
Table A 44 Predicted unweighted SPLpeak impact ranges for high-frequency cetaceans using criteria from NMFS (2016) at Creyke Beck B, location ID6
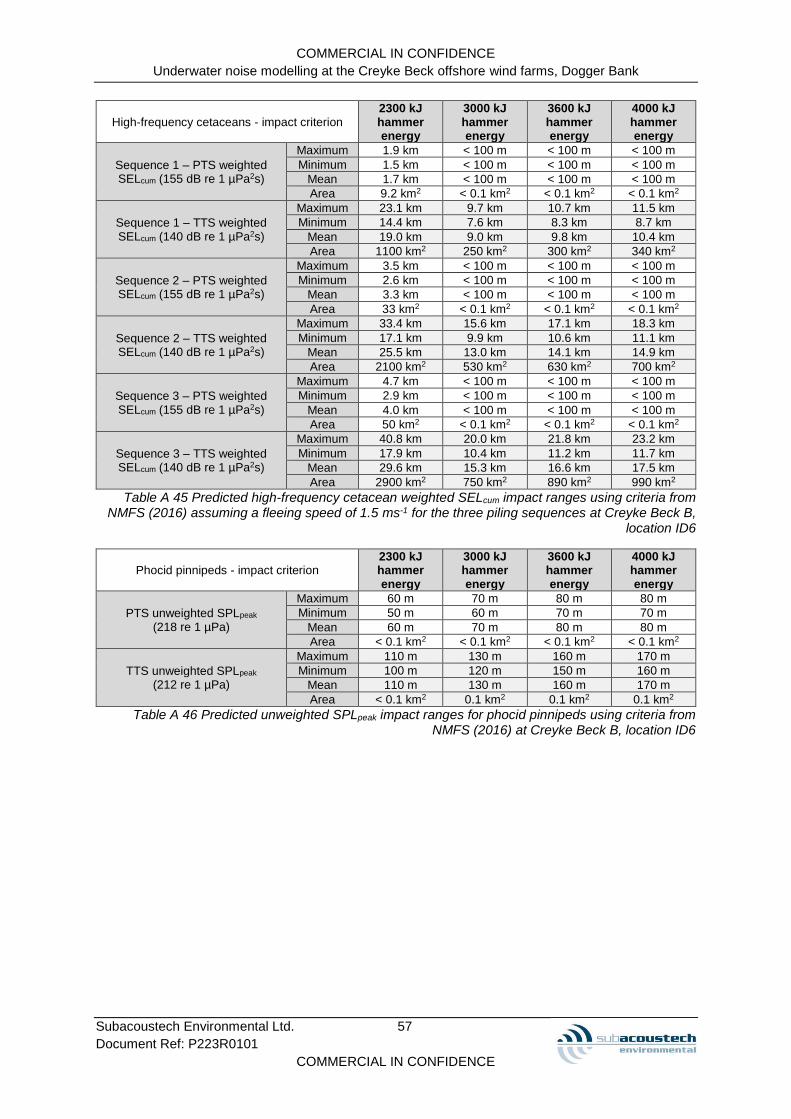
COMMERCIAL IN CONFIDENCE
Underwater noise modelling at the Creyke Beck offshore wind farms, Dogger Bank
Subacoustech Environmental Ltd. 57
Document Ref: P223R0101
COMMERCIAL IN CONFIDENCE
High-frequency cetaceans - impact criterion 2300 kJ hammer energy
3000 kJ hammer energy
3600 kJ hammer energy
4000 kJ hammer energy
Sequence 1 – PTS weighted SELcum (155 dB re 1 µPa2s)
Maximum 1.9 km < 100 m < 100 m < 100 m
Minimum 1.5 km < 100 m < 100 m < 100 m
Mean 1.7 km < 100 m < 100 m < 100 m
Area 9.2 km2 < 0.1 km2 < 0.1 km2 < 0.1 km2
Sequence 1 – TTS weighted SELcum (140 dB re 1 µPa2s)
Maximum 23.1 km 9.7 km 10.7 km 11.5 km
Minimum 14.4 km 7.6 km 8.3 km 8.7 km
Mean 19.0 km 9.0 km 9.8 km 10.4 km
Area 1100 km2 250 km2 300 km2 340 km2
Sequence 2 – PTS weighted SELcum (155 dB re 1 µPa2s)
Maximum 3.5 km < 100 m < 100 m < 100 m
Minimum 2.6 km < 100 m < 100 m < 100 m
Mean 3.3 km < 100 m < 100 m < 100 m
Area 33 km2 < 0.1 km2 < 0.1 km2 < 0.1 km2
Sequence 2 – TTS weighted SELcum (140 dB re 1 µPa2s)
Maximum 33.4 km 15.6 km 17.1 km 18.3 km
Minimum 17.1 km 9.9 km 10.6 km 11.1 km
Mean 25.5 km 13.0 km 14.1 km 14.9 km
Area 2100 km2 530 km2 630 km2 700 km2
Sequence 3 – PTS weighted SELcum (155 dB re 1 µPa2s)
Maximum 4.7 km < 100 m < 100 m < 100 m
Minimum 2.9 km < 100 m < 100 m < 100 m
Mean 4.0 km < 100 m < 100 m < 100 m
Area 50 km2 < 0.1 km2 < 0.1 km2 < 0.1 km2
Sequence 3 – TTS weighted SELcum (140 dB re 1 µPa2s)
Maximum 40.8 km 20.0 km 21.8 km 23.2 km
Minimum 17.9 km 10.4 km 11.2 km 11.7 km
Mean 29.6 km 15.3 km 16.6 km 17.5 km
Area 2900 km2 750 km2 890 km2 990 km2
Table A 45 Predicted high-frequency cetacean weighted SELcum impact ranges using criteria from NMFS (2016) assuming a fleeing speed of 1.5 ms-1 for the three piling sequences at Creyke Beck B,
location ID6
Phocid pinnipeds - impact criterion 2300 kJ hammer energy
3000 kJ hammer energy
3600 kJ hammer energy
4000 kJ hammer energy
PTS unweighted SPLpeak
(218 re 1 µPa)
Maximum 60 m 70 m 80 m 80 m
Minimum 50 m 60 m 70 m 70 m
Mean 60 m 70 m 80 m 80 m
Area < 0.1 km2 < 0.1 km2 < 0.1 km2 < 0.1 km2
TTS unweighted SPLpeak
(212 re 1 µPa)
Maximum 110 m 130 m 160 m 170 m
Minimum 100 m 120 m 150 m 160 m
Mean 110 m 130 m 160 m 170 m
Area < 0.1 km2 0.1 km2 0.1 km2 0.1 km2
Table A 46 Predicted unweighted SPLpeak impact ranges for phocid pinnipeds using criteria from NMFS (2016) at Creyke Beck B, location ID6

COMMERCIAL IN CONFIDENCE
Underwater noise modelling at the Creyke Beck offshore wind farms, Dogger Bank
Subacoustech Environmental Ltd. 58
Document Ref: P223R0101
COMMERCIAL IN CONFIDENCE
Phocid pinnipeds - impact criterion 2300 kJ hammer energy
3000 kJ hammer energy
3600 kJ hammer energy
4000 kJ hammer energy
Sequence 1 – PTS weighted SELcum (185 dB re 1 µPa2s)
Maximum < 100 m < 100 m < 100 m < 100 m
Minimum < 100 m < 100 m < 100 m < 100 m
Mean < 100 m < 100 m < 100 m < 100 m
Area < 0.1 km2 < 0.1 km2 < 0.1 km2 < 0.1 km2
Sequence 1 – TTS weighted SELcum (170 dB re 1 µPa2s)
Maximum 5.3 km 7.9 km 8.8 km 9.5 km
Minimum 4.3 km 6.3 km 6.9 km 7.4 km
Mean 5.0 km 7.4 km 8.2 km 8.7 km
Area 79 km2 170 km2 210 km2 240 km2
Sequence 2 – PTS weighted SELcum (185 dB re 1 µPa2s)
Maximum < 100 m < 100 m < 100 m < 100 m
Minimum < 100 m < 100 m < 100 m < 100 m
Mean < 100 m < 100 m < 100 m < 100 m
Area < 0.1 km2 < 0.1 km2 < 0.1 km2 < 0.1 km2
Sequence 2 – TTS weighted SELcum (170 dB re 1 µPa2s)
Maximum 8.7 km 12.7 km 14.1 km 15.2 km
Minimum 6.2 km 8.5 km 9.2 km 9.7 km
Mean 7.7 km 10.9 km 11.9 km 12.7 km
Area 190 km2 370 km2 450 km2 510 km2
Sequence 3 – PTS weighted SELcum (185 dB re 1 µPa2s)
Maximum < 100 m < 100 m < 100 m < 100 m
Minimum < 100 m < 100 m < 100 m < 100 m
Mean < 100 m < 100 m < 100 m < 100 m
Area < 0.1 km2 < 0.1 km2 < 0.1 km2 < 0.1 km2
Sequence 3 – TTS weighted SELcum (170 dB re 1 µPa2s)
Maximum 11.3 km 16.5 km 18.3 km 19.5 km
Minimum 6.6 km 9.0 km 9.7 km 10.2 km
Mean 9.2 km 12.9 km 14.1 km 14.9 km
Area 270 km2 530 km2 640 km2 720 km2
Table A 47 Predicted phocid pinnipeds weighted SELcum impact ranges using criteria from NMFS (2016) assuming a fleeing speed of 1.5 ms-1 for the three piling sequences at Creyke Beck B, location
ID6
Popper et al (2014) impact ranges
Fish - impact criterion 2300 kJ hammer energy
3000 kJ hammer energy
3600 kJ hammer energy
4000 kJ hammer energy
Injury (fish: no swim bladder) unweighted SPLpeak
(213 re 1 µPa)
Maximum 90 m 120 m 140 m 150 m
Minimum 80 m 110 m 130 m 140 m
Mean 90 m 120 m 140 m 150 m
Area < 0.1 km2 < 0.1 km2 0.1 km2 0.1 km2
Injury (fish: with swim bladder) unweighted SPLpeak
(207 re 1 µPa)
Maximum 200 m 250 m 300 m 340 m
Minimum 190 m 240 m 290 m 330 m
Mean 200 m 250 m 300 m 340 m
Area 0.1 km2 0.2 km2 0.3 km2 0.4 km2
Table A 48 Predicted unweighted SPLpeak impact ranges for fish using criteria from Popper et al. (2014) at Creyke Beck B, location ID6
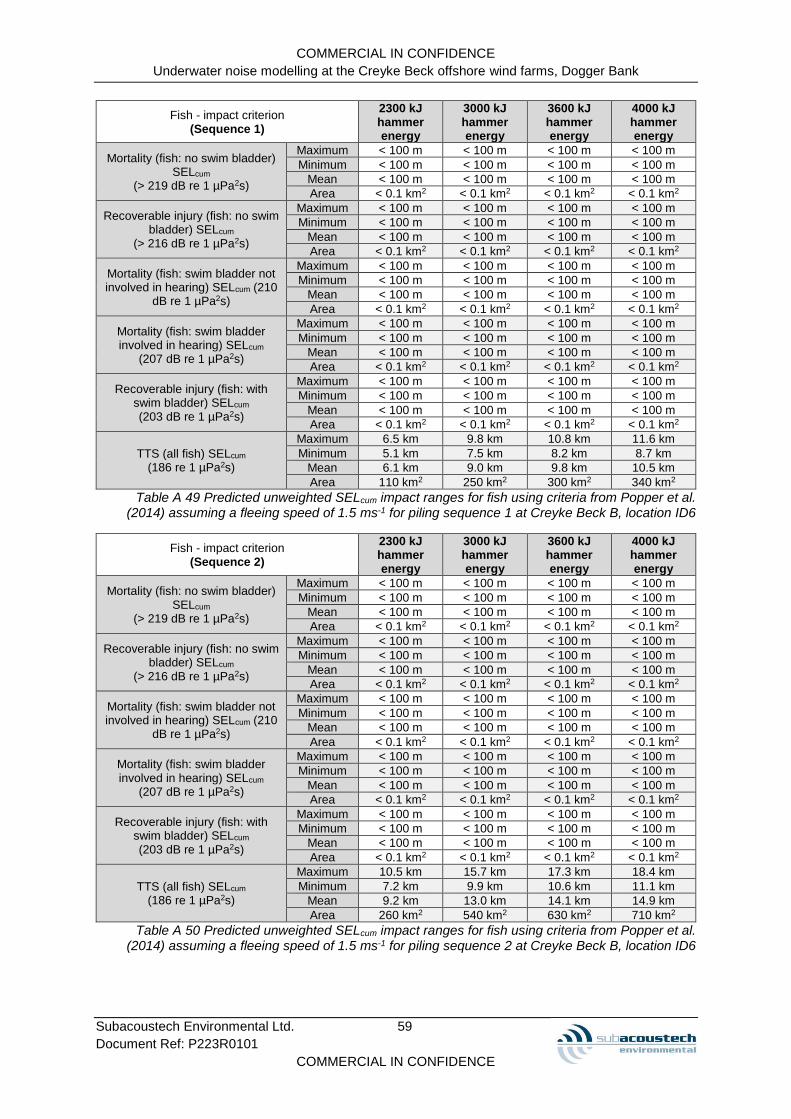
COMMERCIAL IN CONFIDENCE
Underwater noise modelling at the Creyke Beck offshore wind farms, Dogger Bank
Subacoustech Environmental Ltd. 59
Document Ref: P223R0101
COMMERCIAL IN CONFIDENCE
Fish - impact criterion (Sequence 1)
2300 kJ hammer energy
3000 kJ hammer energy
3600 kJ hammer energy
4000 kJ hammer energy
Mortality (fish: no swim bladder) SELcum
(> 219 dB re 1 µPa2s)
Maximum < 100 m < 100 m < 100 m < 100 m
Minimum < 100 m < 100 m < 100 m < 100 m
Mean < 100 m < 100 m < 100 m < 100 m
Area < 0.1 km2 < 0.1 km2 < 0.1 km2 < 0.1 km2
Recoverable injury (fish: no swim bladder) SELcum
(> 216 dB re 1 µPa2s)
Maximum < 100 m < 100 m < 100 m < 100 m
Minimum < 100 m < 100 m < 100 m < 100 m
Mean < 100 m < 100 m < 100 m < 100 m
Area < 0.1 km2 < 0.1 km2 < 0.1 km2 < 0.1 km2
Mortality (fish: swim bladder not involved in hearing) SELcum (210
dB re 1 µPa2s)
Maximum < 100 m < 100 m < 100 m < 100 m
Minimum < 100 m < 100 m < 100 m < 100 m
Mean < 100 m < 100 m < 100 m < 100 m
Area < 0.1 km2 < 0.1 km2 < 0.1 km2 < 0.1 km2
Mortality (fish: swim bladder involved in hearing) SELcum
(207 dB re 1 µPa2s)
Maximum < 100 m < 100 m < 100 m < 100 m
Minimum < 100 m < 100 m < 100 m < 100 m
Mean < 100 m < 100 m < 100 m < 100 m
Area < 0.1 km2 < 0.1 km2 < 0.1 km2 < 0.1 km2
Recoverable injury (fish: with swim bladder) SELcum (203 dB re 1 µPa2s)
Maximum < 100 m < 100 m < 100 m < 100 m
Minimum < 100 m < 100 m < 100 m < 100 m
Mean < 100 m < 100 m < 100 m < 100 m
Area < 0.1 km2 < 0.1 km2 < 0.1 km2 < 0.1 km2
TTS (all fish) SELcum
(186 re 1 µPa2s)
Maximum 6.5 km 9.8 km 10.8 km 11.6 km
Minimum 5.1 km 7.5 km 8.2 km 8.7 km
Mean 6.1 km 9.0 km 9.8 km 10.5 km
Area 110 km2 250 km2 300 km2 340 km2
Table A 49 Predicted unweighted SELcum impact ranges for fish using criteria from Popper et al. (2014) assuming a fleeing speed of 1.5 ms-1 for piling sequence 1 at Creyke Beck B, location ID6
Fish - impact criterion (Sequence 2)
2300 kJ hammer energy
3000 kJ hammer energy
3600 kJ hammer energy
4000 kJ hammer energy
Mortality (fish: no swim bladder) SELcum
(> 219 dB re 1 µPa2s)
Maximum < 100 m < 100 m < 100 m < 100 m
Minimum < 100 m < 100 m < 100 m < 100 m
Mean < 100 m < 100 m < 100 m < 100 m
Area < 0.1 km2 < 0.1 km2 < 0.1 km2 < 0.1 km2
Recoverable injury (fish: no swim bladder) SELcum
(> 216 dB re 1 µPa2s)
Maximum < 100 m < 100 m < 100 m < 100 m
Minimum < 100 m < 100 m < 100 m < 100 m
Mean < 100 m < 100 m < 100 m < 100 m
Area < 0.1 km2 < 0.1 km2 < 0.1 km2 < 0.1 km2
Mortality (fish: swim bladder not involved in hearing) SELcum (210
dB re 1 µPa2s)
Maximum < 100 m < 100 m < 100 m < 100 m
Minimum < 100 m < 100 m < 100 m < 100 m
Mean < 100 m < 100 m < 100 m < 100 m
Area < 0.1 km2 < 0.1 km2 < 0.1 km2 < 0.1 km2
Mortality (fish: swim bladder involved in hearing) SELcum
(207 dB re 1 µPa2s)
Maximum < 100 m < 100 m < 100 m < 100 m
Minimum < 100 m < 100 m < 100 m < 100 m
Mean < 100 m < 100 m < 100 m < 100 m
Area < 0.1 km2 < 0.1 km2 < 0.1 km2 < 0.1 km2
Recoverable injury (fish: with swim bladder) SELcum (203 dB re 1 µPa2s)
Maximum < 100 m < 100 m < 100 m < 100 m
Minimum < 100 m < 100 m < 100 m < 100 m
Mean < 100 m < 100 m < 100 m < 100 m
Area < 0.1 km2 < 0.1 km2 < 0.1 km2 < 0.1 km2
TTS (all fish) SELcum
(186 re 1 µPa2s)
Maximum 10.5 km 15.7 km 17.3 km 18.4 km
Minimum 7.2 km 9.9 km 10.6 km 11.1 km
Mean 9.2 km 13.0 km 14.1 km 14.9 km
Area 260 km2 540 km2 630 km2 710 km2
Table A 50 Predicted unweighted SELcum impact ranges for fish using criteria from Popper et al. (2014) assuming a fleeing speed of 1.5 ms-1 for piling sequence 2 at Creyke Beck B, location ID6

COMMERCIAL IN CONFIDENCE
Underwater noise modelling at the Creyke Beck offshore wind farms, Dogger Bank
Subacoustech Environmental Ltd. 60
Document Ref: P223R0101
COMMERCIAL IN CONFIDENCE
Fish - impact criterion (Sequence 3)
2300 kJ hammer energy
3000 kJ hammer energy
3600 kJ hammer energy
4000 kJ hammer energy
Mortality (fish: no swim bladder) SELcum
(> 219 dB re 1 µPa2s)
Maximum < 100 m < 100 m < 100 m < 100 m
Minimum < 100 m < 100 m < 100 m < 100 m
Mean < 100 m < 100 m < 100 m < 100 m
Area < 0.1 km2 < 0.1 km2 < 0.1 km2 < 0.1 km2
Recoverable injury (fish: no swim bladder) SELcum
(> 216 dB re 1 µPa2s)
Maximum < 100 m < 100 m < 100 m < 100 m
Minimum < 100 m < 100 m < 100 m < 100 m
Mean < 100 m < 100 m < 100 m < 100 m
Area < 0.1 km2 < 0.1 km2 < 0.1 km2 < 0.1 km2
Mortality (fish: swim bladder not involved in hearing) SELcum (210
dB re 1 µPa2s)
Maximum < 100 m < 100 m < 100 m < 100 m
Minimum < 100 m < 100 m < 100 m < 100 m
Mean < 100 m < 100 m < 100 m < 100 m
Area < 0.1 km2 < 0.1 km2 < 0.1 km2 < 0.1 km2
Mortality (fish: swim bladder involved in hearing) SELcum
(207 dB re 1 µPa2s)
Maximum < 100 m < 100 m < 100 m < 100 m
Minimum < 100 m < 100 m < 100 m < 100 m
Mean < 100 m < 100 m < 100 m < 100 m
Area < 0.1 km2 < 0.1 km2 < 0.1 km2 < 0.1 km2
Recoverable injury (fish: with swim bladder) SELcum (203 dB re 1 µPa2s)
Maximum < 100 m < 100 m < 100 m < 100 m
Minimum < 100 m < 100 m < 100 m < 100 m
Mean < 100 m < 100 m < 100 m < 100 m
Area < 0.1 km2 < 0.1 km2 < 0.1 km2 < 0.1 km2
TTS (all fish) SELcum
(186 re 1 µPa2s)
Maximum 13.7 km 20.2 km 22.0 km 23.4 km
Minimum 7.7 km 10.4 km 11.1 km 11.7 km
Mean 10.9 km 15.4 km 16.6 km 17.6 km
Area 380 km2 760 km2 900 km2 1000 km2
Table A 51 Predicted unweighted SELcum impact ranges for fish using criteria from Popper et al. (2014) assuming a fleeing speed of 1.5 ms-1 for piling sequence 3 at Creyke Beck B, location ID6

COMMERCIAL IN CONFIDENCE
Underwater noise modelling at the Creyke Beck offshore wind farms, Dogger Bank
Subacoustech Environmental Ltd. 61
Document Ref: P223R0101
COMMERCIAL IN CONFIDENCE
A.4 Creyke Beck B, location ID13
Previously considered criteria
Harbour porpoise - impact criterion
300 kJ hammer energy
1900 kJ hammer energy
2300 kJ hammer energy
3000 kJ hammer energy
3600 kJ hammer energy
4000 kJ hammer energy
Instantaneous injury/PTS (SPLpeak 200
dB re 1 µPa)
Max 130 m 440 m 500 m 630 m 770 m 850 m
Min 120 m 430 m 490 m 620 m 750 m 840 m
Mean 130 m 440 m 500 m 630 m 760 m 840 m
Area 0.1 km2 0.6 km2 0.8 km2 1.2 km2 1.8 km2 2.2 km2
Instantaneous injury/PTS (SELss 179
dB re 1 µPa2s)
Max 150 m 430 m 470 m 710 m 790 m 850 m
Min 140 m 420 m 460 m 700 m 780 m 840 m
Mean 150 m 430 m 470 m 710 m 790 m 850 m
Area 0.1 km2 0.6 km2 0.7 km2 1.6 km2 1.9 km2 2.2 km2
TTS/fleeing response (SPLpeak 194 dB re 1
µPa)
Max 280 m 980 m 1.1 km 1.4 km 1.7 km 18.2 km
Min 270 m 960 m 1.1 km 1.4 km 1.6 km 11.9 km
Mean 280 m 970 m 1.1 km 1.4 km 1.6 km 12.7 km
Area 0.2 km2 2.9 km2 3.7 km2 5.8 km2 8.4 km2 500 km2
TTS/fleeing response (SELss 164 dB re 1
µPa2s)
Max 1.4 km 3.8 km 4.0 km 5.6 km 6.1 km 6.4 km
Min 1.4 km 3.7 km 3.9 km 5.2 km 5.7 km 5.9 km
Mean 1.4 km 3.7 km 4.0 km 5.4 km 5.8 km 6.1 km
Area 6.2 km2 43 km2 49 km2 91 km2 110 km2 120 km2
Possible avoidance of area (SPLpeak 168 re 1
µPa2s)
Max 6.5 km 13.9 km 14.8 km 16.6 km 18.2 km 19.0 km
Min 6.0 km 11.9 km 12.6 km 13.8 km 14.8 km 15.4 km
Mean 6.2 km 12.7 km 13.5 km 15.0 km 16.3 km 17.0 km
Area 120 km2 510 km2 570 km2 700 km2 830 km2 910 km2
Possible avoidance of area (SELss 145 re 1
µPa2s)
Max 13.2 km 22.5 km 23.4 km 27.9 km 29.2 km 30.1 km
Min 11.5 km 18.1 km 18.6 km 21.4 km 22.2 km 22.8 km
Mean 12.2 km 20.0 km 20.7 km 24.2 km 25.1 km 25.8 km
Area 460 km2 1300 km2 1300 km2 1800 km2 2000 km2 2100 km2
Table A 52 Predicted harbour porpoise impact ranges using criteria derived from Lucke et al. (2009) at Creyke Beck B, location ID13

COMMERCIAL IN CONFIDENCE
Underwater noise modelling at the Creyke Beck offshore wind farms, Dogger Bank
Subacoustech Environmental Ltd. 62
Document Ref: P223R0101
COMMERCIAL IN CONFIDENCE
Mid-frequency cetaceans - impact criterion
300 kJ hammer energy
1900 kJ hammer energy
2300 kJ hammer energy
3000 kJ hammer energy
3600 kJ hammer energy
4000 kJ hammer energy
Instantaneous injury/PTS (SPLpeak 230
dB re 1 µPa)
Max < 50 m < 50 m < 50 m < 50 m < 50 m < 50 m
Min < 50 m < 50 m < 50 m < 50 m < 50 m < 50 m
Mean < 50 m < 50 m < 50 m < 50 m < 50 m < 50 m
Area < 0.1 km2 < 0.1 km2 < 0.1 km2 < 0.1 km2 < 0.1 km2 < 0.1 km2
Instantaneous injury/PTS (Mmf SELss
198 dB re 1 µPa2s)
Max < 50 m < 50 m < 50 m < 50 m < 50 m < 50 m
Min < 50 m < 50 m < 50 m < 50 m < 50 m < 50 m
Mean < 50 m < 50 m < 50 m < 50 m < 50 m < 50 m
Area < 0.1 km2 < 0.1 km2 < 0.1 km2 < 0.1 km2 < 0.1 km2 < 0.1 km2
TTS/fleeing response (SPLpeak 224 dB re 1
µPa)
Max < 50 m < 50 m < 50 m < 50 m < 50 m < 50 m
Min < 50 m < 50 m < 50 m < 50 m < 50 m < 50 m
Mean < 50 m < 50 m < 50 m < 50 m < 50 m < 50 m
Area < 0.1 km2 < 0.1 km2 < 0.1 km2 < 0.1 km2 < 0.1 km2 < 0.1 km2
TTS/fleeing response (Mmf SELss 183 dB re 1
µPa2s)
Max < 50 m 90 m 120 m 140 m 150 m 170 m
Min < 50 m 80 m 110 m 130 m 140 m 160 m
Mean < 50 m 90 m 120 m 140 m 150 m 170 m
Area < 0.1 km2 < 0.1 km2 < 0.1 km2 0.1 km2 0.1 km2 0.1 km2
Likely avoidance of area (SELss 170 re 1 µPa2s)
Max 570 m 1.7 km 1.8 km 2.6 km 2.9 km 3.1 km
Min 560 m 1.7 km 1.8 km 2.6 km 2.8 km 3.0 km
Mean 570 m 1.7 km 1.8 km 2.6 km 2.9 km 3.0 km
Area 1.0 km2 8.6 km2 10 km2 21 km2 25 km2 29 km2
Possible avoidance of area (SELss 160 re 1
µPa2s)
Max 2.5 km 6.1 km 6.4 km 8.6 km 9.2 km 9.7 km
Min 2.5 km 5.7 km 6.0 km 7.8 km 8.3 km 8.7 km
Mean 2.5 km 5.9 km 6.2 km 8.1 km 8.7 km 9.1 km
Area 19 km2 110 km2 120 km2 210 km2 240 km2 260 km2
Table A 53 Predicted mid-frequency cetacean impact ranges using criteria derived from Southall et al. (2007) at Creyke Beck B, location ID13
Low-frequency cetaceans - impact criterion
300 kJ hammer energy
1900 kJ hammer energy
2300 kJ hammer energy
3000 kJ hammer energy
3600 kJ hammer energy
4000 kJ hammer energy
Instantaneous injury/PTS (SPLpeak 230
dB re 1 µPa)
Max < 50 m < 50 m < 50 m < 50 m < 50 m < 50 m
Min < 50 m < 50 m < 50 m < 50 m < 50 m < 50 m
Mean < 50 m < 50 m < 50 m < 50 m < 50 m < 50 m
Area < 0.1 km2 < 0.1 km2 < 0.1 km2 < 0.1 km2 < 0.1 km2 < 0.1 km2
Instantaneous injury/PTS (Mlf SELss 198 dB re 1 µPa2s)
Max < 50 m < 50 m < 50 m 50 m 50 m 50 m
Min < 50 m < 50 m < 50 m < 50 m < 50 m < 50 m
Mean < 50 m < 50 m < 50 m < 50 m < 50 m < 50 m
Area < 0.1 km2 < 0.1 km2 < 0.1 km2 < 0.1 km2 < 0.1 km2 < 0.1 km2
TTS/fleeing response (SPLpeak 224 dB re 1
µPa)
Max < 50 m < 50 m < 50 m < 50 m < 50 m < 50 m
Min < 50 m < 50 m < 50 m < 50 m < 50 m < 50 m
Mean < 50 m < 50 m < 50 m < 50 m < 50 m < 50 m
Area < 0.1 km2 < 0.1 km2 < 0.1 km2 < 0.1 km2 < 0.1 km2 < 0.1 km2
TTS/fleeing response (Mlf SELss 183 dB re 1
µPa2s)
Max 80 m 240 m 260 m 390 m 430 m 460 m
Min 70 m 230 m 250 m 380 m 420 m 450 m
Mean 80 m 240 m 260 m 390 m 430 m 460 m
Area < 0.1 km2 0.2 km2 0.2 km2 0.5 km2 0.6 km2 0.7 km2
Likely avoidance of area (SELss 152 re 1 µPa2s)
Max 6.7 km 13.3 km 14.0 km 17.3 km 18.2 km 18.9 km
Min 6.2 km 11.6 km 12.1 km 14.4 km 15.0 km 15.5 km
Mean 6.4 km 12.3 km 12.8 km 15.6 km 16.4 km 17.0 km
Area 130 km2 470 km2 520 km2 770 km2 840 km2 900 km2
Possible avoidance of area (SELss 142 re 1
µPa2s)
Max 16.8 km 27.5 km 28.4 km 33.8 km 35.3 km 36.3 km
Min 14.0 km 21.2 km 21.8 km 24.5 km 25.0 km 25.5 km
Mean 15.2 km 23.9 km 24.6 km 28.3 km 29.4 km 30.1 km
Area 720 km2 1800 km2 1900 km2 2500 km2 2700 km2 2800 km2
Table A 54 Predicted low-frequency cetacean impact ranges using criteria derived from Southall et al. (2007) at Creyke Beck B, location ID13

COMMERCIAL IN CONFIDENCE
Underwater noise modelling at the Creyke Beck offshore wind farms, Dogger Bank
Subacoustech Environmental Ltd. 63
Document Ref: P223R0101
COMMERCIAL IN CONFIDENCE
Pinnipeds (in water) - impact criterion
300 kJ hammer energy
1900 kJ hammer energy
2300 kJ hammer energy
3000 kJ hammer energy
3600 kJ hammer energy
4000 kJ hammer energy
Instantaneous injury/PTS (SPLpeak 218
dB re 1 µPa)
Max 50 m 50 m 60 m 70 m 80 m 80 m
Min < 50 m < 50 m 50 m 60 m 70 m 70 m
Mean < 50 m < 50 m 60 m 70 m 80 m 80 m
Area < 0.1 km2 < 0.1 km2 < 0.1 km2 < 0.1 km2 < 0.1 km2 < 0.1 km2
Instantaneous injury/PTS (Mpw SELss
186 dB re 1 µPa2s)
Max < 50 m 90 m 120 m 140 m 160 m 170 m
Min < 50 m 80 m 110 m 130 m 150 m 160 m
Mean < 50 m 90 m 120 m 140 m 160 m 170 m
Area < 0.1 km2 < 0.1 km2 < 0.1 km2 0.1 km2 0.1 km2 0.1 km2
TTS/fleeing response (SPLpeak 212 dB re 1
µPa)
Max 70 m 90 m 110 m 130 m 160 m 170 m
Min 60 m 80 m 100 m 120 m 150 m 160 m
Mean 70 m 90 m 110 m 130 m 160 m 170 m
Area < 0.1 km2 < 0.1 km2 < 0.1 km2 0.1 km2 0.1 km2 0.1 km2
TTS/fleeing response (Mpw SELss 171 dB re 1
µPa2s)
Max 290 m 860 m 1.2 km 1.4 km 1.6 km 1.7 km
Min 280 m 850 m 1.1 km 1.4 km 1.5 km 1.6 km
Mean 290 m 860 m 1.1 km 1.4 km 1.5 km 1.7 km
Area 0.3 km2 2.3 km2 4.1 km2 6.0 km2 7.4 km2 8.5 km2
Table A 55 Predicted pinniped (in water) impact ranges using criteria from Southall et al. (2007) at Creyke Beck B, location ID13
Fish - impact criterion 300 kJ
hammer energy
1900 kJ hammer energy
2300 kJ hammer energy
3000 kJ hammer energy
3600 kJ hammer energy
4000 kJ hammer energy
Instantaneous injury/PTS (SPLpeak 206
dB re 1 µPa)
Max 80 m 200 m 230 m 280 m 350 m 380 m
Min 70 m 190 m 220 m 270 m 330 m 370 m
Mean 80 m 200 m 230 m 280 m 340 m 380 m
Area < 0.1 km2 0.1 km2 0.2 km2 0.2 km2 0.4 km2 0.4 km2
PTS (SELcum 211 dB re 1 µPa2s) – Sequence 1
Max - - < 100 m < 100 m < 100 m < 100 m
Min - - < 100 m < 100 m < 100 m < 100 m
Mean - - < 100 m < 100 m < 100 m < 100 m
Area - - < 0.1 km2 < 0.1 km2 < 0.1 km2 < 0.1 km2
PTS (SELcum 211 dB re 1 µPa2s) – Sequence 2
Max - - < 100 m < 100 m < 100 m < 100 m
Min - - < 100 m < 100 m < 100 m < 100 m
Mean - - < 100 m < 100 m < 100 m < 100 m
Area - - < 0.1 km2 < 0.1 km2 < 0.1 km2 < 0.1 km2
PTS (SELcum 211 dB re 1 µPa2s) – Sequence 3
Max - - < 100 m < 100 m < 100 m < 100 m
Min - - < 100 m < 100 m < 100 m < 100 m
Mean - - < 100 m < 100 m < 100 m < 100 m
Area - - < 0.1 km2 < 0.1 km2 < 0.1 km2 < 0.1 km2
Possible moderate to strong avoidance
(upper bound SPLpeak 173 dB re 1 µPa)
Max 4.0 km 9.5 km 10.3 km 11.7 km 13.1 km 13.8 km
Min 3.8 km 8.5 km 9.1 km 10.3 km 11.3 km 11.9 km
Mean 3.9 km 8.9 km 9.6 km 10.8 km 12.0 km 12.7 km
Area 47 km2 250 km2 290 km2 370 km2 450 km2 500 km2
Possible moderate to strong avoidance
(lower bound SPLpeak 168 dB re 1 µPa)
Max 6.5 km 13.9 km 14.8 km 16.6 km 18.2 km 19.0 km
Min 6.0 km 11.9 km 12.6 km 13.8 km 14.8 km 15.4 km
Mean 6.2 km 12.7 km 13.5 km 15.0 km 16.3 km 17.0 km
Area 120 km2 510 km2 570 km2 700 km2 830 km2 910 km2
Startle response or C-turn reaction (SPLpeak
200 dB re 1 µPa)
Max 130 m 440 m 500 m 630 m 770 m 850 m
Min 120 m 430 m 490 m 620 m 750 m 840 m
Mean 130 m 440 m 500 m 630 m 760 m 840 m
Area 0.1 km2 0.6 km2 0.8 km2 1.2 km2 1.8 km2 2.2 km2
Table A 56 Predicted fish impact ranges using criteria from Popper et al. (2006), Carlson et al. (2007), Halvorsen et al. (2011), McCauley et al. (2000) and Pearson et al. (1992) at Creyke Beck B, location
ID13
Cells marked with a hyphen are for single strike hammer energies and as such cumulative SELs cannot
be calculated for them.

COMMERCIAL IN CONFIDENCE
Underwater noise modelling at the Creyke Beck offshore wind farms, Dogger Bank
Subacoustech Environmental Ltd. 64
Document Ref: P223R0101
COMMERCIAL IN CONFIDENCE
NMFS (2016) impact ranges
Low-frequency cetaceans - impact criterion 2300 kJ hammer energy
3000 kJ hammer energy
3600 kJ hammer energy
4000 kJ hammer energy
PTS unweighted SPLpeak
(219 re 1 µPa)
Maximum 50 m 60 m 70 m 70 m
Minimum < 50 m 50 m 60 m 60 m
Mean < 50 m 60 m 70 m 70 m
Area < 0.1 km2 < 0.1 km2 < 0.1 km2 < 0.1 km2
TTS unweighted SPLpeak
(213 re 1 µPa)
Maximum 90 m 120 m 140 m 150 m
Minimum 80 m 100 m 130 m 140 m
Mean 90 m 110 m 140 m 150 m
Area < 0.1 km2 < 0.1 km2 0.1 km2 0.1 km2
Table A 57 Predicted unweighted SPLpeak impact ranges for low-frequency cetaceans using criteria from NMFS (2016) at Creyke Beck B, location ID13
Low-frequency cetaceans - impact criterion 2300 kJ hammer energy
3000 kJ hammer energy
3600 kJ hammer energy
4000 kJ hammer energy
Sequence 1 – PTS weighted SELcum (183 dB re 1 µPa2s)
Maximum 900 m 1.8 km 2.4 km 2.9 km
Minimum 600 m 1.2 km 1.6 km 2.0 km
Mean 700 m 1.4 km 1.9 km 2.3 km
Area 1.6 km2 6.6 km2 12 km2 17 km2
Sequence 1 – TTS weighted SELcum (168 dB re 1 µPa2s)
Maximum 19.4 km 21.9 km 23.3 km 24.3 km
Minimum 13.1 km 14.6 km 15.2 km 15.7 km
Mean 15.7 km 17.6 km 23.3 km 19.3 km
Area 780 km2 980 km2 1100 km2 1200 km2
Sequence 2 – PTS weighted SELcum (183 dB re 1 µPa2s)
Maximum 1.6 km 2.8 km 3.6 km 4.1 km
Minimum 800 m 1.6 km 2.1 km 2.5 km
Mean 1.1 km 2.1 km 2.7 km 3.1 km
Area 3.9 km2 14 km2 23 km2 31 km2
Sequence 2 – TTS weighted SELcum (168 dB re 1 µPa2s)
Maximum 23.6 km 26.6 km 28.2 km 29.3 km
Minimum 14.0 km 15.3 km 16.0 km 16.5 km
Mean 18.0 km 20.0 km 21.1 km 21.9 km
Area 1000 km2 1300 km2 1400 km2 1500 km2
Sequence 3 – PTS weighted SELcum (183 dB re 1 µPa2s)
Maximum 1.7 km 3.0 km 3.8 km 4.3 km
Minimum 800 m 1.6 km 2.1 km 2.5 km
Mean 1.1 km 2.2 km 2.8 km 3.2 km
Area 4.3 km2 15 km2 24 km2 33 km2
Sequence 3 – TTS weighted SELcum (168 dB re 1 µPa2s)
Maximum 25.2 km 28.5 km 30.2 km 31.4 km
Minimum 14.1 km 15.4 km 16.1 km 16.6 km
Mean 18.5 km 20.7 km 21.8 km 22.6 km
Area 1.1 km2 1400 km2 1500 km2 1600 km2
Table A 58 Predicted low-frequency cetacean weighted SELcum impact ranges using criteria from NMFS (2016) assuming a fleeing speed of 3.25 ms-1 for the three piling sequences at Creyke Beck B,
location ID13
Mid-frequency cetaceans - impact criterion 2300 kJ hammer energy
3000 kJ hammer energy
3600 kJ hammer energy
4000 kJ hammer energy
PTS unweighted SPLpeak
(230 re 1 µPa)
Maximum < 50 m < 50 m < 50 m < 50 m
Minimum < 50 m < 50 m < 50 m < 50 m
Mean < 50 m < 50 m < 50 m < 50 m
Area < 0.1 km2 < 0.1 km2 < 0.1 km2 < 0.1 km2
TTS unweighted SPLpeak
(224 re 1 µPa)
Maximum < 50 m < 50 m < 50 m < 50 m
Minimum < 50 m < 50 m < 50 m < 50 m
Mean < 50 m < 50 m < 50 m < 50 m
Area < 0.1 km2 < 0.1 km2 < 0.1 km2 < 0.1 km2
Table A 59 Predicted unweighted SPLpeak impact ranges for mid-frequency cetaceans using criteria from NMFS (2016) at Creyke Beck B, location ID13

COMMERCIAL IN CONFIDENCE
Underwater noise modelling at the Creyke Beck offshore wind farms, Dogger Bank
Subacoustech Environmental Ltd. 65
Document Ref: P223R0101
COMMERCIAL IN CONFIDENCE
Mid-frequency cetaceans - impact criterion 2300 kJ hammer energy
3000 kJ hammer energy
3600 kJ hammer energy
4000 kJ hammer energy
Sequence 1 – PTS weighted SELcum (185 dB re 1 µPa2s)
Maximum < 100 m < 100 m < 100 m < 100 m
Minimum < 100 m < 100 m < 100 m < 100 m
Mean < 100 m < 100 m < 100 m < 100 m
Area < 0.1 km2 < 0.1 km2 < 0.1 km2 < 0.1 km2
Sequence 1 – TTS weighted SELcum (170 dB re 1 µPa2s)
Maximum < 100 m < 100 m < 100 m < 100 m
Minimum < 100 m < 100 m < 100 m < 100 m
Mean < 100 m < 100 m < 100 m < 100 m
Area < 0.1 km2 < 0.1 km2 < 0.1 km2 < 0.1 km2
Sequence 2 – PTS weighted SELcum (185 dB re 1 µPa2s)
Maximum < 100 m < 100 m < 100 m < 100 m
Minimum < 100 m < 100 m < 100 m < 100 m
Mean < 100 m < 100 m < 100 m < 100 m
Area < 0.1 km2 < 0.1 km2 < 0.1 km2 < 0.1 km2
Sequence 2 – TTS weighted SELcum (170 dB re 1 µPa2s)
Maximum < 100 m < 100 m < 100 m < 100 m
Minimum < 100 m < 100 m < 100 m < 100 m
Mean < 100 m < 100 m < 100 m < 100 m
Area < 0.1 km2 < 0.1 km2 < 0.1 km2 < 0.1 km2
Sequence 3 – PTS weighted SELcum (185 dB re 1 µPa2s)
Maximum < 100 m < 100 m < 100 m < 100 m
Minimum < 100 m < 100 m < 100 m < 100 m
Mean < 100 m < 100 m < 100 m < 100 m
Area < 0.1 km2 < 0.1 km2 < 0.1 km2 < 0.1 km2
Sequence 3 – TTS weighted SELcum (170 dB re 1 µPa2s)
Maximum < 100 m < 100 m < 100 m < 100 m
Minimum < 100 m < 100 m < 100 m < 100 m
Mean < 100 m < 100 m < 100 m < 100 m
Area < 0.1 km2 < 0.1 km2 < 0.1 km2 < 0.1 km2
Table A 60 Predicted mid-frequency cetacean weighted SELcum impact ranges using criteria from NMFS (2016) assuming a fleeing speed of 1.5 ms-1 for the three piling sequences at Creyke Beck B,
location ID13
High-frequency cetaceans - impact criterion 2300 kJ hammer energy
3000 kJ hammer energy
3600 kJ hammer energy
4000 kJ hammer energy
PTS unweighted SPLpeak
(202 re 1 µPa)
Maximum 380 m 480 m 590 m 650 m
Minimum 370 m 470 m 580 m 640 m
Mean 380 m 480 m 590 m 650 m
Area 0.4 km2 0.7 km2 1.1 km2 1.3 km2
TTS unweighted SPLpeak
(196 re 1 µPa)
Maximum 850 m 1.1 km 1.3 km 1.4 km
Minimum 840 m 1.1 km 1.3 km 1.4 km
Mean 850 m 1.1 km 1.3 km 1.4 km
Area 2.2 km2 3.5 km2 5.1 km2 6.2 km2
Table A 61 Predicted unweighted SPLpeak impact ranges for high-frequency cetaceans using criteria from NMFS (2016) at Creyke Beck B, location ID13

COMMERCIAL IN CONFIDENCE
Underwater noise modelling at the Creyke Beck offshore wind farms, Dogger Bank
Subacoustech Environmental Ltd. 66
Document Ref: P223R0101
COMMERCIAL IN CONFIDENCE
High-frequency cetaceans - impact criterion 2300 kJ hammer energy
3000 kJ hammer energy
3600 kJ hammer energy
4000 kJ hammer energy
Sequence 1 – PTS weighted SELcum (155 dB re 1 µPa2s)
Maximum 1.5 km < 100 m < 100 m < 100 m
Minimum 1.3 km < 100 m < 100 m < 100 m
Mean 1.4 km < 100 m < 100 m < 100 m
Area 5.9 km2 < 0.1 km2 < 0.1 km2 < 0.1 km2
Sequence 1 – TTS weighted SELcum (140 dB re 1 µPa2s)
Maximum 16.7 km 8.1 km 8.9 km 9.4 km
Minimum 13.0 km 6.8 km 7.4 km 7.8 km
Mean 14.6 km 7.3 km 8.0 km 8.5 km
Area 670 km2 170 km2 200 km2 220 km2
Sequence 2 – PTS weighted SELcum (155 dB re 1 µPa2s)
Maximum 2.8 km < 100 m < 100 m < 100 m
Minimum 2.2 km < 100 m < 100 m < 100 m
Mean 2.4 km < 100 m < 100 m < 100 m
Area 19 km2 < 0.1 km2 < 0.1 km2 < 0.1 km2
Sequence 2 – TTS weighted SELcum (140 dB re 1 µPa2s)
Maximum 21.9 km 11.3 km 12.2 km 12.9 km
Minimum 15.5 km 8.6 km 9.3 km 9.7 km
Mean 18.1 km 9.8 km 10.5 km 11.1 km
Area 1000 km2 300 km2 350 km2 390 km2
Sequence 3 – PTS weighted SELcum (155 dB re 1 µPa2s)
Maximum 3.3 km < 100 m < 100 m < 100 m
Minimum 2.4 km < 100 m < 100 m < 100 m
Mean 2.8 km < 100 m < 100 m < 100 m
Area 24 km2 < 0.1 km2 < 0.1 km2 < 0.1 km2
14.6Sequence 3 – TTS weighted SELcum (140 dB re 1 µPa2s)
Maximum 24.8 km 12.8 km 13.9 km 14.6 km
Minimum 15.9 km 9.1 km 9.7 km 10.2 km
Mean 19.5 km 10.6 km 11.4 km 12.0 km
Area 1200 km2 350 km2 410 km2 450 km2
Table A 62 Predicted high-frequency cetacean weighted SELcum impact ranges using criteria from NMFS (2016) assuming a fleeing speed of 1.5 ms-1 for the three piling sequences at Creyke Beck B,
location ID13
Phocid pinnipeds - impact criterion 2300 kJ hammer energy
3000 kJ hammer energy
3600 kJ hammer energy
4000 kJ hammer energy
PTS unweighted SPLpeak
(218 re 1 µPa)
Maximum 60 m 70 m 80 m 80 m
Minimum 50 m 60 m 70 m 70 m
Mean 60 m 70 m 80 m 80 m
Area < 0.1 km2 < 0.1 km2 < 0.1 km2 < 0.1 km2
TTS unweighted SPLpeak
(212 re 1 µPa)
Maximum 110 m 130 m 160 m 170 m
Minimum 100 m 120 m 150 m 160 m
Mean 110 m 130 m 160 m 170 m
Area < 0.1 km2 0.1 km2 0.1 km2 0.1 km2
Table A 63 Predicted unweighted SPLpeak impact ranges for phocid pinnipeds using criteria from NMFS (2016) at Creyke Beck B, location ID13
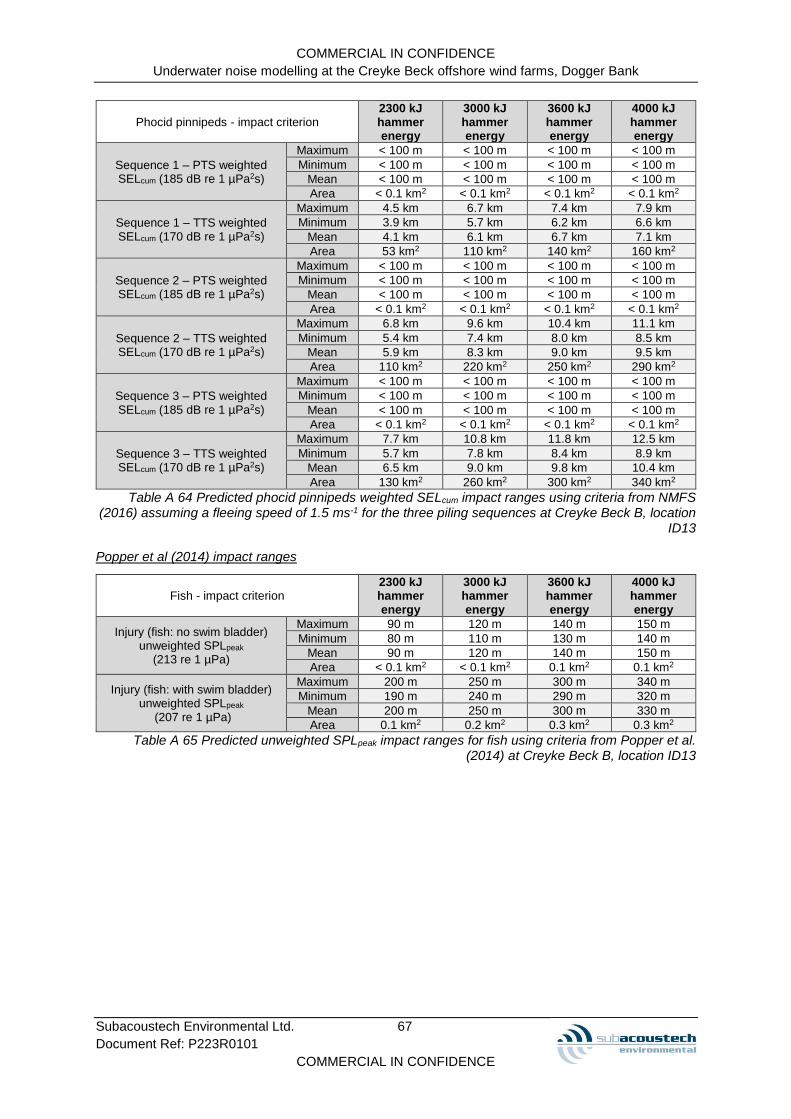
COMMERCIAL IN CONFIDENCE
Underwater noise modelling at the Creyke Beck offshore wind farms, Dogger Bank
Subacoustech Environmental Ltd. 67
Document Ref: P223R0101
COMMERCIAL IN CONFIDENCE
Phocid pinnipeds - impact criterion 2300 kJ hammer energy
3000 kJ hammer energy
3600 kJ hammer energy
4000 kJ hammer energy
Sequence 1 – PTS weighted SELcum (185 dB re 1 µPa2s)
Maximum < 100 m < 100 m < 100 m < 100 m
Minimum < 100 m < 100 m < 100 m < 100 m
Mean < 100 m < 100 m < 100 m < 100 m
Area < 0.1 km2 < 0.1 km2 < 0.1 km2 < 0.1 km2
Sequence 1 – TTS weighted SELcum (170 dB re 1 µPa2s)
Maximum 4.5 km 6.7 km 7.4 km 7.9 km
Minimum 3.9 km 5.7 km 6.2 km 6.6 km
Mean 4.1 km 6.1 km 6.7 km 7.1 km
Area 53 km2 110 km2 140 km2 160 km2
Sequence 2 – PTS weighted SELcum (185 dB re 1 µPa2s)
Maximum < 100 m < 100 m < 100 m < 100 m
Minimum < 100 m < 100 m < 100 m < 100 m
Mean < 100 m < 100 m < 100 m < 100 m
Area < 0.1 km2 < 0.1 km2 < 0.1 km2 < 0.1 km2
Sequence 2 – TTS weighted SELcum (170 dB re 1 µPa2s)
Maximum 6.8 km 9.6 km 10.4 km 11.1 km
Minimum 5.4 km 7.4 km 8.0 km 8.5 km
Mean 5.9 km 8.3 km 9.0 km 9.5 km
Area 110 km2 220 km2 250 km2 290 km2
Sequence 3 – PTS weighted SELcum (185 dB re 1 µPa2s)
Maximum < 100 m < 100 m < 100 m < 100 m
Minimum < 100 m < 100 m < 100 m < 100 m
Mean < 100 m < 100 m < 100 m < 100 m
Area < 0.1 km2 < 0.1 km2 < 0.1 km2 < 0.1 km2
Sequence 3 – TTS weighted SELcum (170 dB re 1 µPa2s)
Maximum 7.7 km 10.8 km 11.8 km 12.5 km
Minimum 5.7 km 7.8 km 8.4 km 8.9 km
Mean 6.5 km 9.0 km 9.8 km 10.4 km
Area 130 km2 260 km2 300 km2 340 km2
Table A 64 Predicted phocid pinnipeds weighted SELcum impact ranges using criteria from NMFS (2016) assuming a fleeing speed of 1.5 ms-1 for the three piling sequences at Creyke Beck B, location
ID13
Popper et al (2014) impact ranges
Fish - impact criterion 2300 kJ hammer energy
3000 kJ hammer energy
3600 kJ hammer energy
4000 kJ hammer energy
Injury (fish: no swim bladder) unweighted SPLpeak
(213 re 1 µPa)
Maximum 90 m 120 m 140 m 150 m
Minimum 80 m 110 m 130 m 140 m
Mean 90 m 120 m 140 m 150 m
Area < 0.1 km2 < 0.1 km2 0.1 km2 0.1 km2
Injury (fish: with swim bladder) unweighted SPLpeak
(207 re 1 µPa)
Maximum 200 m 250 m 300 m 340 m
Minimum 190 m 240 m 290 m 320 m
Mean 200 m 250 m 300 m 330 m
Area 0.1 km2 0.2 km2 0.3 km2 0.3 km2
Table A 65 Predicted unweighted SPLpeak impact ranges for fish using criteria from Popper et al. (2014) at Creyke Beck B, location ID13

COMMERCIAL IN CONFIDENCE
Underwater noise modelling at the Creyke Beck offshore wind farms, Dogger Bank
Subacoustech Environmental Ltd. 68
Document Ref: P223R0101
COMMERCIAL IN CONFIDENCE
Fish - impact criterion (Sequence 1)
2300 kJ hammer energy
3000 kJ hammer energy
3600 kJ hammer energy
4000 kJ hammer energy
Mortality (fish: no swim bladder) SELcum
(> 219 dB re 1 µPa2s)
Maximum < 100 m < 100 m < 100 m < 100 m
Minimum < 100 m < 100 m < 100 m < 100 m
Mean < 100 m < 100 m < 100 m < 100 m
Area < 0.1 km2 < 0.1 km2 < 0.1 km2 < 0.1 km2
Recoverable injury (fish: no swim bladder) SELcum
(> 216 dB re 1 µPa2s)
Maximum < 100 m < 100 m < 100 m < 100 m
Minimum < 100 m < 100 m < 100 m < 100 m
Mean < 100 m < 100 m < 100 m < 100 m
Area < 0.1 km2 < 0.1 km2 < 0.1 km2 < 0.1 km2
Mortality (fish: swim bladder not involved in hearing) SELcum (210
dB re 1 µPa2s)
Maximum < 100 m < 100 m < 100 m < 100 m
Minimum < 100 m < 100 m < 100 m < 100 m
Mean < 100 m < 100 m < 100 m < 100 m
Area < 0.1 km2 < 0.1 km2 < 0.1 km2 < 0.1 km2
Mortality (fish: swim bladder involved in hearing) SELcum
(207 dB re 1 µPa2s)
Maximum < 100 m < 100 m < 100 m < 100 m
Minimum < 100 m < 100 m < 100 m < 100 m
Mean < 100 m < 100 m < 100 m < 100 m
Area < 0.1 km2 < 0.1 km2 < 0.1 km2 < 0.1 km2
Recoverable injury (fish: with swim bladder) SELcum (203 dB re 1 µPa2s)
Maximum < 100 m < 100 m < 100 m < 100 m
Minimum < 100 m < 100 m < 100 m < 100 m
Mean < 100 m < 100 m < 100 m < 100 m
Area < 0.1 km2 < 0.1 km2 < 0.1 km2 < 0.1 km2
TTS (all fish) SELcum
(186 re 1 µPa2s)
Maximum 5.5 km 8.2 km 9.0 km 9.6 km
Minimum 4.7 km 6.9 km 7.5 km 7.9 km
Mean 5.1 km 7.4 km 8.1 km 8.6 km
Area 80 km2 170 km2 200 km2 230 km2
Table A 66 Predicted unweighted SELcum impact ranges for fish using criteria from Popper et al. (2014) assuming a fleeing speed of 1.5 ms-1 for piling sequence 1 at Creyke Beck B, location ID13
Fish - impact criterion (Sequence 2)
2300 kJ hammer energy
3000 kJ hammer energy
3600 kJ hammer energy
4000 kJ hammer energy
Mortality (fish: no swim bladder) SELcum
(> 219 dB re 1 µPa2s)
Maximum < 100 m < 100 m < 100 m < 100 m
Minimum < 100 m < 100 m < 100 m < 100 m
Mean < 100 m < 100 m < 100 m < 100 m
Area < 0.1 km2 < 0.1 km2 < 0.1 km2 < 0.1 km2
Recoverable injury (fish: no swim bladder) SELcum
(> 216 dB re 1 µPa2s)
Maximum < 100 m < 100 m < 100 m < 100 m
Minimum < 100 m < 100 m < 100 m < 100 m
Mean < 100 m < 100 m < 100 m < 100 m
Area < 0.1 km2 < 0.1 km2 < 0.1 km2 < 0.1 km2
Mortality (fish: swim bladder not involved in hearing) SELcum (210
dB re 1 µPa2s)
Maximum < 100 m < 100 m < 100 m < 100 m
Minimum < 100 m < 100 m < 100 m < 100 m
Mean < 100 m < 100 m < 100 m < 100 m
Area < 0.1 km2 < 0.1 km2 < 0.1 km2 < 0.1 km2
Mortality (fish: swim bladder involved in hearing) SELcum
(207 dB re 1 µPa2s)
Maximum < 100 m < 100 m < 100 m < 100 m
Minimum < 100 m < 100 m < 100 m < 100 m
Mean < 100 m < 100 m < 100 m < 100 m
Area < 0.1 km2 < 0.1 km2 < 0.1 km2 < 0.1 km2
Recoverable injury (fish: with swim bladder) SELcum (203 dB re 1 µPa2s)
Maximum < 100 m < 100 m < 100 m < 100 m
Minimum < 100 m < 100 m < 100 m < 100 m
Mean < 100 m < 100 m < 100 m < 100 m
Area < 0.1 km2 < 0.1 km2 < 0.1 km2 < 0.1 km2
TTS (all fish) SELcum
(186 re 1 µPa2s)
Maximum 8.1 km 11.4 km 12.4 km 13.0 km
Minimum 6.4 km 8.7 km 9.4 km 9.8 km
Mean 7.1 km 9.9 km 10.6 km 11.1 km
Area 160 km2 310 km2 360 km2 390 km2
Table A 67 Predicted unweighted SELcum impact ranges for fish using criteria from Popper et al. (2014) assuming a fleeing speed of 1.5 ms-1 for piling sequence 2 at Creyke Beck B, location ID13

COMMERCIAL IN CONFIDENCE
Underwater noise modelling at the Creyke Beck offshore wind farms, Dogger Bank
Subacoustech Environmental Ltd. 69
Document Ref: P223R0101
COMMERCIAL IN CONFIDENCE
Fish - impact criterion (Sequence 3)
2300 kJ hammer energy
3000 kJ hammer energy
3600 kJ hammer energy
4000 kJ hammer energy
Mortality (fish: no swim bladder) SELcum
(> 219 dB re 1 µPa2s)
Maximum < 100 m < 100 m < 100 m < 100 m
Minimum < 100 m < 100 m < 100 m < 100 m
Mean < 100 m < 100 m < 100 m < 100 m
Area < 0.1 km2 < 0.1 km2 < 0.1 km2 < 0.1 km2
Recoverable injury (fish: no swim bladder) SELcum
(> 216 dB re 1 µPa2s)
Maximum < 100 m < 100 m < 100 m < 100 m
Minimum < 100 m < 100 m < 100 m < 100 m
Mean < 100 m < 100 m < 100 m < 100 m
Area < 0.1 km2 < 0.1 km2 < 0.1 km2 < 0.1 km2
Mortality (fish: swim bladder not involved in hearing) SELcum (210
dB re 1 µPa2s)
Maximum < 100 m < 100 m < 100 m < 100 m
Minimum < 100 m < 100 m < 100 m < 100 m
Mean < 100 m < 100 m < 100 m < 100 m
Area < 0.1 km2 < 0.1 km2 < 0.1 km2 < 0.1 km2
Mortality (fish: swim bladder involved in hearing) SELcum
(207 dB re 1 µPa2s)
Maximum < 100 m < 100 m < 100 m < 100 m
Minimum < 100 m < 100 m < 100 m < 100 m
Mean < 100 m < 100 m < 100 m < 100 m
Area < 0.1 km2 < 0.1 km2 < 0.1 km2 < 0.1 km2
Recoverable injury (fish: with swim bladder) SELcum (203 dB re 1 µPa2s)
Maximum < 100 m < 100 m < 100 m < 100 m
Minimum < 100 m < 100 m < 100 m < 100 m
Mean < 100 m < 100 m < 100 m < 100 m
Area < 0.1 km2 < 0.1 km2 < 0.1 km2 < 0.1 km2
TTS (all fish) SELcum
(186 re 1 µPa2s)
Maximum 9.2 km 13.0 km 14.0 km 14.8 km
Minimum 6.7 km 9.2 km 9.8 km 10.3 km
Mean 7.7 km 10.7 km 11.5 km 12.1 km
Area 190 km2 360 km2 420 km2 460 km2
Table A 68 Predicted unweighted SELcum impact ranges for fish using criteria from Popper et al. (2014) assuming a fleeing speed of 1.5 ms-1 for piling sequence 3 at Creyke Beck B, location ID13

COMMERCIAL IN CONFIDENCE
Underwater noise modelling at the Creyke Beck offshore wind farms, Dogger Bank
Subacoustech Environmental Ltd. 70
Document Ref: P223R0101
COMMERCIAL IN CONFIDENCE
Appendix B Modelling figures
This appendix presents the modelled impact ranges from section 4 and
Appendix A as contour plots. Only the impact ranges large enough to be
shown clearly for the map scale have been included here.
Figure B 1 Contour plot showing the unweighted SPLpeak and SELss impact ranges for TTS/fleeing response and avoidance in harbour porpoise from Lucke et al. (2009) at Creyke Beck A, location ID6 for installing a pin pile using a maximum blow energy of 2300 kJ ................... 79
Figure B 2 Contour plot showing the unweighted SPLpeak and SELss impact ranges for TTS/fleeing response and avoidance in harbour porpoise from Lucke et al. (2009) at Creyke Beck A, location ID6 for installing a monopile using a maximum blow energy of 3000 kJ ................ 79
Figure B 3 Contour plot showing the unweighted SPLpeak and SELss impact ranges for TTS/fleeing response and avoidance in harbour porpoise from Lucke et al. (2009) at Creyke Beck A, location ID6 for installing a monopile using a maximum blow energy of 3600 kJ ................ 80
Figure B 4 Contour plot showing the unweighted SPLpeak and SELss impact ranges for TTS/fleeing response and avoidance in harbour porpoise from Lucke et al. (2009) at Creyke Beck A, location ID6 for installing a monopile using a maximum blow energy of 4000 kJ ................ 80
Figure B 5 Contour plot showing the unweighted SELss impact ranges for avoidance in LF and MF cetaceans from Southall et al. (2007) at Creyke Beck A, location ID6 for installing a pin pile using a maximum blow energy of 2300 kJ ............................................... 81
Figure B 6 Contour plot showing the unweighted SELss impact ranges for avoidance in LF and MF cetaceans from Southall et al. (2007) at
Creyke Beck A, location ID6 for installing a monopile using a maximum blow energy of 3000 kJ ................................................ 81
Figure B 7 Contour plot showing the unweighted SELss impact ranges for avoidance in LF and MF cetaceans from Southall et al. (2007) at Creyke Beck A, location ID6 for installing a monopile using a maximum blow energy of 3600 kJ ................................................ 82
Figure B 8 Contour plot showing the unweighted SELss impact ranges for avoidance in LF and MF cetaceans from Southall et al. (2007) at Creyke Beck A, location ID6 for installing a monopile using a maximum blow energy of 4000 kJ ................................................ 82
Figure B 9 Contour plot showing the unweighted SPLpeak impact ranges for avoidance in species of fish at Creyke Beck A, location ID6 for installing a pin pile using a maximum blow energy of 2300 kJ .... 83
Figure B 10 Contour plot showing the unweighted SPLpeak impact ranges for avoidance in species of fish at Creyke Beck A, location ID6 for installing a monopile using a maximum blow energy of 3000 kJ . 83
Figure B 11 Contour plot showing the unweighted SPLpeak impact ranges for avoidance in species of fish at Creyke Beck A, location ID6 for installing a monopile using a maximum blow energy of 3600 kJ . 84
Figure B 12 Contour plot showing the unweighted SPLpeak impact ranges for avoidance in species of fish at Creyke Beck A, location ID6 for installing a monopile using a maximum blow energy of 4000 kJ . 84
Figure B 13 Contour plot showing the weighted SELcum impact ranges for TTS in LF cetaceans from NMFS (2016) at Creyke Beck A, location ID6 for installing a pin pile using a maximum blow energy of 2300 kJ for the three ramp-up scenarios (scenario 1 = green, scenario 2 = yellow, scenario 3 = red) .............................................................. 85
COMMERCIAL IN CONFIDENCE
Underwater noise modelling at the Creyke Beck offshore wind farms, Dogger Bank
Subacoustech Environmental Ltd. 71
Document Ref: P223R0101
COMMERCIAL IN CONFIDENCE
Figure B 14 Contour plot showing the weighted SELcum impact ranges for TTS in LF cetaceans from NMFS (2016) at Creyke Beck A, location ID6 for installing a monopile using a maximum blow energy of 3000 kJ for the three ramp-up scenarios (scenario 1 = green, scenario 2 = yellow, scenario 3 = red) ......................................... 85
Figure B 15 Contour plot showing the weighted SELcum impact ranges for TTS in LF cetaceans from NMFS (2016) at Creyke Beck A, location ID6 for installing a monopile using a maximum blow energy of 3600 kJ for the three ramp-up scenarios (scenario 1 = green, scenario 2 = yellow, scenario 3 = red) ......................................... 86
Figure B 16 Contour plot showing the weighted SELcum impact ranges for TTS in LF cetaceans from NMFS (2016) at Creyke Beck A, location ID6 for installing a monopile using a maximum blow energy of 4000 kJ for the three ramp-up scenarios (scenario 1 = green, scenario 2 = yellow, scenario 3 = red) ......................................... 86
Figure B 17 Contour plot showing the weighted SELcum impact ranges for TTS in HF cetaceans from NMFS (2016) at Creyke Beck A, location ID6 for installing a pin pile using a maximum blow energy of 2300 kJ for the three ramp-up scenarios (scenario 1 = green, scenario 2 = yellow, scenario 3 = red) .............................................................. 87
Figure B 18 Contour plot showing the weighted SELcum impact ranges for TTS in HF cetaceans from NMFS (2016) at Creyke Beck A, location ID6 for installing a monopile using a maximum blow energy of 3000 kJ for the three ramp-up scenarios (scenario 1 = green, scenario 2 = yellow, scenario 3 = red) ......................................... 87
Figure B 19 Contour plot showing the weighted SELcum impact ranges for TTS in HF cetaceans from NMFS (2016) at Creyke Beck A, location ID6 for installing a monopile using a maximum blow energy of 3600 kJ for the three ramp-up scenarios (scenario 1 = green, scenario 2 = yellow, scenario 3 = red) ......................................... 88
Figure B 20 Contour plot showing the weighted SELcum impact ranges for TTS in HF cetaceans from NMFS (2016) at Creyke Beck A, location ID6 for installing a monopile using a maximum blow energy of 4000 kJ for the three ramp-up scenarios (scenario 1 = green, scenario 2 = yellow, scenario 3 = red) ......................................... 88
Figure B 21 Contour plot showing the weighted SELcum impact ranges for TTS in phocid pinnipeds from NMFS (2016) at Creyke Beck A, location ID6 for installing a pin pile using a maximum blow energy of 2300 kJ for the three ramp-up scenarios (scenario 1 = green, scenario 2 = yellow, scenario 3 = red) ......................................... 89
Figure B 22 Contour plot showing the weighted SELcum impact ranges for TTS in phocid pinnipeds from NMFS (2016) at Creyke Beck A, location ID6 for installing a monopile using a maximum blow energy of 3000 kJ for the three ramp-up scenarios (scenario 1 = green, scenario 2 = yellow, scenario 3 = red) ......................................... 89
Figure B 23 Contour plot showing the weighted SELcum impact ranges for TTS in phocid pinnipeds from NMFS (2016) at Creyke Beck A, location ID6 for installing a monopile using a maximum blow energy of 3600 kJ for the three ramp-up scenarios (scenario 1 = green, scenario 2 = yellow, scenario 3 = red) ......................................... 90
Figure B 24 Contour plot showing the weighted SELcum impact ranges for TTS in phocid pinnipeds from NMFS (2016) at Creyke Beck A, location ID6 for installing a monopile using a maximum blow energy of 4000 kJ for the three ramp-up scenarios (scenario 1 = green, scenario 2 = yellow, scenario 3 = red) ......................................... 90
Figure B 25 Contour plot showing the unweighted SELcum impact ranges for TTS in species of fish from Popper et al. (2014) at Creyke Beck A, location ID6 for installing a pin pile using a maximum blow energy of 2300 kJ for the three ramp-up scenarios (scenario 1 = green, scenario 2 = yellow, scenario 3 = red) ......................................... 91

COMMERCIAL IN CONFIDENCE
Underwater noise modelling at the Creyke Beck offshore wind farms, Dogger Bank
Subacoustech Environmental Ltd. 72
Document Ref: P223R0101
COMMERCIAL IN CONFIDENCE
Figure B 26 Contour plot showing the unweighted SELcum impact ranges for TTS in species of fish from Popper et al. (2014) at Creyke Beck A, location ID6 for installing a monopile using a maximum blow energy of 3000 kJ for the three ramp-up scenarios (scenario 1 = green, scenario 2 = yellow, scenario 3 = red) ......................................... 91
Figure B 27 Contour plot showing the unweighted SELcum impact ranges for TTS in species of fish from Popper et al. (2014) at Creyke Beck A, location ID6 for installing a monopile using a maximum blow energy of 3600 kJ for the three ramp-up scenarios (scenario 1 = green, scenario 2 = yellow, scenario 3 = red) ......................................... 92
Figure B 28 Contour plot showing the unweighted SELcum impact ranges for TTS in species of fish from Popper et al. (2014) at Creyke Beck A, location ID6 for installing a monopile using a maximum blow energy of 4000 kJ for the three ramp-up scenarios (scenario 1 = green, scenario 2 = yellow, scenario 3 = red) ......................................... 92
Figure B 29 Contour plot showing the unweighted SPLpeak and SELss impact ranges for TTS/fleeing response and avoidance in harbour porpoise from Lucke et al. (2009) at Creyke Beck A, location ID11 for installing a pin pile using a maximum blow energy of 2300 kJ .... 93
Figure B 30 Contour plot showing the unweighted SPLpeak and SELss impact ranges for TTS/fleeing response and avoidance in harbour porpoise from Lucke et al. (2009) at Creyke Beck A, location ID11 for installing a monopile using a maximum blow energy of 3000 kJ . 93
Figure B 31 Contour plot showing the unweighted SPLpeak and SELss impact ranges for TTS/fleeing response and avoidance in harbour porpoise from Lucke et al. (2009) at Creyke Beck A, location ID11 for installing a monopile using a maximum blow energy of 3600 kJ . 94
Figure B 32 Contour plot showing the unweighted SPLpeak and SELss impact ranges for TTS/fleeing response and avoidance in harbour porpoise
from Lucke et al. (2009) at Creyke Beck A, location ID11 for installing a monopile using a maximum blow energy of 4000 kJ . 94
Figure B 33 Contour plot showing the unweighted SELss impact ranges for avoidance in LF and MF cetaceans from Southall et al. (2007) at Creyke Beck A, location ID11 for installing a pin pile using a maximum blow energy of 2300 kJ ................................................ 95
Figure B 34 Contour plot showing the unweighted SELss impact ranges for avoidance in LF and MF cetaceans from Southall et al. (2007) at Creyke Beck A, location ID11 for installing a monopile using a maximum blow energy of 3000 kJ ................................................ 95
Figure B 35 Contour plot showing the unweighted SELss impact ranges for avoidance in LF and MF cetaceans from Southall et al. (2007) at Creyke Beck A, location ID11 for installing a monopile using a maximum blow energy of 3600 kJ ................................................ 96
Figure B 36 Contour plot showing the unweighted SELss impact ranges for avoidance in LF and MF cetaceans from Southall et al. (2007) at Creyke Beck A, location ID11 for installing a monopile using a maximum blow energy of 4000 kJ ................................................ 96
Figure B 37 Contour plot showing the unweighted SPLpeak impact ranges for avoidance in species of fish at Creyke Beck A, location ID11 for installing a pin pile using a maximum blow energy of 2300 kJ .... 97
Figure B 38 Contour plot showing the unweighted SPLpeak impact ranges for avoidance in species of fish at Creyke Beck A, location ID11 for installing a monopile using a maximum blow energy of 3000 kJ . 97
Figure B 39 Contour plot showing the unweighted SPLpeak impact ranges for avoidance in species of fish at Creyke Beck A, location ID11 for installing a monopile using a maximum blow energy of 3600 kJ . 98

COMMERCIAL IN CONFIDENCE
Underwater noise modelling at the Creyke Beck offshore wind farms, Dogger Bank
Subacoustech Environmental Ltd. 73
Document Ref: P223R0101
COMMERCIAL IN CONFIDENCE
Figure B 40 Contour plot showing the unweighted SPLpeak impact ranges for avoidance in species of fish at Creyke Beck A, location ID11 for installing a monopile using a maximum blow energy of 4000 kJ . 98
Figure B 41 Contour plot showing the weighted SELcum impact ranges for TTS in LF cetaceans from NMFS (2016) at Creyke Beck A, location ID11 for installing a pin pile using a maximum blow energy of 2300 kJ for the three ramp-up scenarios (scenario 1 = green, scenario 2 = yellow, scenario 3 = red) ......................................... 99
Figure B 42 Contour plot showing the weighted SELcum impact ranges for TTS in LF cetaceans from NMFS (2016) at Creyke Beck A, location ID11 for installing a monopile using a maximum blow energy of 3000 kJ for the three ramp-up scenarios (scenario 1 = green, scenario 2 = yellow, scenario 3 = red) ......................................... 99
Figure B 43 Contour plot showing the weighted SELcum impact ranges for TTS in LF cetaceans from NMFS (2016) at Creyke Beck A, location ID11 for installing a monopile using a maximum blow energy of 3600 kJ for the three ramp-up scenarios (scenario 1 = green, scenario 2 = yellow, scenario 3 = red) ....................................... 100
Figure B 44 Contour plot showing the weighted SELcum impact ranges for TTS in LF cetaceans from NMFS (2016) at Creyke Beck A, location ID11 for installing a monopile using a maximum blow energy of 4000 kJ for the three ramp-up scenarios (scenario 1 = green, scenario 2 = yellow, scenario 3 = red) ....................................... 100
Figure B 45 Contour plot showing the weighted SELcum impact ranges for TTS in HF cetaceans from NMFS (2016) at Creyke Beck A, location ID11 for installing a pin pile using a maximum blow energy of 2300 kJ for the three ramp-up scenarios (scenario 1 = green, scenario 2 = yellow, scenario 3 = red) ....................................... 101
Figure B 46 Contour plot showing the weighted SELcum impact ranges for TTS in HF cetaceans from NMFS (2016) at Creyke Beck A, location
ID11 for installing a monopile using a maximum blow energy of 3000 kJ for the three ramp-up scenarios (scenario 1 = green, scenario 2 = yellow, scenario 3 = red) ....................................... 101
Figure B 47 Contour plot showing the weighted SELcum impact ranges for TTS in HF cetaceans from NMFS (2016) at Creyke Beck A, location ID11 for installing a monopile using a maximum blow energy of 3600 kJ for the three ramp-up scenarios (scenario 1 = green, scenario 2 = yellow, scenario 3 = red) ....................................... 102
Figure B 48 Contour plot showing the weighted SELcum impact ranges for TTS in HF cetaceans from NMFS (2016) at Creyke Beck A, location ID11 for installing a monopile using a maximum blow energy of 4000 kJ for the three ramp-up scenarios (scenario 1 = green, scenario 2 = yellow, scenario 3 = red) ....................................... 102
Figure B 49 Contour plot showing the weighted SELcum impact ranges for TTS in phocid pinnipeds from NMFS (2016) at Creyke Beck A, location ID11 for installing a pin pile using a maximum blow energy of 2300 kJ for the three ramp-up scenarios (scenario 1 = green, scenario 2 = yellow, scenario 3 = red) ....................................... 103
Figure B 50 Contour plot showing the weighted SELcum impact ranges for TTS in phocid pinnipeds from NMFS (2016) at Creyke Beck A, location ID11 for installing a monopile using a maximum blow energy of 3000 kJ for the three ramp-up scenarios (scenario 1 = green, scenario 2 = yellow, scenario 3 = red) ............................ 103
Figure B 51 Contour plot showing the weighted SELcum impact ranges for TTS in phocid pinnipeds from NMFS (2016) at Creyke Beck A, location ID11 for installing a monopile using a maximum blow energy of 3600 kJ for the three ramp-up scenarios (scenario 1 = green, scenario 2 = yellow, scenario 3 = red) ............................ 104
Figure B 52 Contour plot showing the weighted SELcum impact ranges for TTS in phocid pinnipeds from NMFS (2016) at Creyke Beck A,

COMMERCIAL IN CONFIDENCE
Underwater noise modelling at the Creyke Beck offshore wind farms, Dogger Bank
Subacoustech Environmental Ltd. 74
Document Ref: P223R0101
COMMERCIAL IN CONFIDENCE
location ID11 for installing a monopile using a maximum blow energy of 4000 kJ for the three ramp-up scenarios (scenario 1 = green, scenario 2 = yellow, scenario 3 = red) ............................ 104
Figure B 53 Contour plot showing the unweighted SELcum impact ranges for TTS in species of fish from Popper et al. (2014) at Creyke Beck A, location ID11 for installing a pin pile using a maximum blow energy of 2300 kJ for the three ramp-up scenarios (scenario 1 = green, scenario 2 = yellow, scenario 3 = red) ....................................... 105
Figure B 54 Contour plot showing the unweighted SELcum impact ranges for TTS in species of fish from Popper et al. (2014) at Creyke Beck A, location ID11 for installing a monopile using a maximum blow energy of 3000 kJ for the three ramp-up scenarios (scenario 1 = green, scenario 2 = yellow, scenario 3 = red) ............................ 105
Figure B 55 Contour plot showing the unweighted SELcum impact ranges for TTS in species of fish from Popper et al. (2014) at Creyke Beck A, location ID11 for installing a monopile using a maximum blow energy of 3600 kJ for the three ramp-up scenarios (scenario 1 = green, scenario 2 = yellow, scenario 3 = red) ............................ 106
Figure B 56 Contour plot showing the unweighted SELcum impact ranges for TTS in species of fish from Popper et al. (2014) at Creyke Beck A, location ID11 for installing a monopile using a maximum blow energy of 4000 kJ for the three ramp-up scenarios (scenario 1 = green, scenario 2 = yellow, scenario 3 = red) ............................ 106
Figure B 57 Contour plot showing the unweighted SPLpeak and SELss impact ranges for TTS/fleeing response and avoidance in harbour porpoise from Lucke et al. (2009) at Creyke Beck B, location ID6 for installing a pin pile using a maximum blow energy of 2300 kJ ................. 107
Figure B 58 Contour plot showing the unweighted SPLpeak and SELss impact ranges for TTS/fleeing response and avoidance in harbour porpoise
from Lucke et al. (2009) at Creyke Beck B, location ID6 for installing a monopile using a maximum blow energy of 3000 kJ .............. 107
Figure B 59 Contour plot showing the unweighted SPLpeak and SELss impact ranges for TTS/fleeing response and avoidance in harbour porpoise from Lucke et al. (2009) at Creyke Beck B, location ID6 for installing a monopile using a maximum blow energy of 3600 kJ .............. 108
Figure B 60 Contour plot showing the unweighted SPLpeak and SELss impact ranges for TTS/fleeing response and avoidance in harbour porpoise from Lucke et al. (2009) at Creyke Beck B, location ID6 for installing a monopile using a maximum blow energy of 4000 kJ .............. 108
Figure B 61 Contour plot showing the unweighted SELss impact ranges for avoidance in LF and MF cetaceans from Southall et al. (2007) at Creyke Beck B, location ID6 for installing a pin pile using a maximum blow energy of 2300 kJ .............................................. 109
Figure B 62 Contour plot showing the unweighted SELss impact ranges for avoidance in LF and MF cetaceans from Southall et al. (2007) at Creyke Beck B, location ID6 for installing a monopile using a maximum blow energy of 3000 kJ .............................................. 109
Figure B 63 Contour plot showing the unweighted SELss impact ranges for avoidance in LF and MF cetaceans from Southall et al. (2007) at Creyke Beck B, location ID6 for installing a monopile using a maximum blow energy of 3600 kJ .............................................. 110
Figure B 64 Contour plot showing the unweighted SELss impact ranges for avoidance in LF and MF cetaceans from Southall et al. (2007) at Creyke Beck B, location ID6 for installing a monopile using a maximum blow energy of 4000 kJ .............................................. 110
Figure B 65 Contour plot showing the unweighted SPLpeak impact ranges for avoidance in species of fish at Creyke Beck B, location ID6 for installing a pin pile using a maximum blow energy of 2300 kJ .. 111

COMMERCIAL IN CONFIDENCE
Underwater noise modelling at the Creyke Beck offshore wind farms, Dogger Bank
Subacoustech Environmental Ltd. 75
Document Ref: P223R0101
COMMERCIAL IN CONFIDENCE
Figure B 66 Contour plot showing the unweighted SPLpeak impact ranges for avoidance in species of fish at Creyke Beck B, location ID6 for installing a monopile using a maximum blow energy of 3000 kJ 111
Figure B 67 Contour plot showing the unweighted SPLpeak impact ranges for avoidance in species of fish at Creyke Beck B, location ID6 for installing a monopile using a maximum blow energy of 3600 kJ 112
Figure B 68 Contour plot showing the unweighted SPLpeak impact ranges for avoidance in species of fish at Creyke Beck B, location ID6 for installing a monopile using a maximum blow energy of 4000 kJ 112
Figure B 69 Contour plot showing the weighted SELcum impact ranges for TTS in LF cetaceans from NMFS (2016) at Creyke Beck B, location ID6 for installing a pin pile using a maximum blow energy of 2300 kJ for the three ramp-up scenarios (scenario 1 = green, scenario 2 = yellow, scenario 3 = red) ............................................................ 113
Figure B 70 Contour plot showing the weighted SELcum impact ranges for TTS in LF cetaceans from NMFS (2016) at Creyke Beck B, location ID6 for installing a monopile using a maximum blow energy of 3000 kJ for the three ramp-up scenarios (scenario 1 = green, scenario 2 = yellow, scenario 3 = red) ....................................... 113
Figure B 71 Contour plot showing the weighted SELcum impact ranges for TTS in LF cetaceans from NMFS (2016) at Creyke Beck B, location ID6 for installing a monopile using a maximum blow energy of 3600 kJ for the three ramp-up scenarios (scenario 1 = green, scenario 2 = yellow, scenario 3 = red) ....................................... 114
Figure B 72 Contour plot showing the weighted SELcum impact ranges for TTS in LF cetaceans from NMFS (2016) at Creyke Beck B, location ID6 for installing a monopile using a maximum blow energy of 4000 kJ for the three ramp-up scenarios (scenario 1 = green, scenario 2 = yellow, scenario 3 = red) ....................................... 114
Figure B 73 Contour plot showing the weighted SELcum impact ranges for TTS in HF cetaceans from NMFS (2016) at Creyke Beck B, location ID6 for installing a pin pile using a maximum blow energy of 2300 kJ for the three ramp-up scenarios (scenario 1 = green, scenario 2 = yellow, scenario 3 = red) ............................................................ 115
Figure B 74 Contour plot showing the weighted SELcum impact ranges for TTS in HF cetaceans from NMFS (2016) at Creyke Beck B, location ID6 for installing a monopile using a maximum blow energy of 3000 kJ for the three ramp-up scenarios (scenario 1 = green, scenario 2 = yellow, scenario 3 = red) ....................................... 115
Figure B 75 Contour plot showing the weighted SELcum impact ranges for TTS in HF cetaceans from NMFS (2016) at Creyke Beck B, location ID6 for installing a monopile using a maximum blow energy of 3600 kJ for the three ramp-up scenarios (scenario 1 = green, scenario 2 = yellow, scenario 3 = red) ....................................... 116
Figure B 76 Contour plot showing the weighted SELcum impact ranges for TTS in HF cetaceans from NMFS (2016) at Creyke Beck B, location ID6 for installing a monopile using a maximum blow energy of 4000 kJ for the three ramp-up scenarios (scenario 1 = green, scenario 2 = yellow, scenario 3 = red) ....................................... 116
Figure B 77 Contour plot showing the weighted SELcum impact ranges for TTS in phocid pinnipeds from NMFS (2016) at Creyke Beck B, location ID6 for installing a pin pile using a maximum blow energy of 2300 kJ for the three ramp-up scenarios (scenario 1 = green, scenario 2 = yellow, scenario 3 = red) ....................................... 117
Figure B 78 Contour plot showing the weighted SELcum impact ranges for TTS in phocid pinnipeds from NMFS (2016) at Creyke Beck B, location ID6 for installing a monopile using a maximum blow energy of 3000 kJ for the three ramp-up scenarios (scenario 1 = green, scenario 2 = yellow, scenario 3 = red) ....................................... 117

COMMERCIAL IN CONFIDENCE
Underwater noise modelling at the Creyke Beck offshore wind farms, Dogger Bank
Subacoustech Environmental Ltd. 76
Document Ref: P223R0101
COMMERCIAL IN CONFIDENCE
Figure B 79 Contour plot showing the weighted SELcum impact ranges for TTS in phocid pinnipeds from NMFS (2016) at Creyke Beck B, location ID6 for installing a monopile using a maximum blow energy of 3600 kJ for the three ramp-up scenarios (scenario 1 = green, scenario 2 = yellow, scenario 3 = red) ....................................... 118
Figure B 80 Contour plot showing the weighted SELcum impact ranges for TTS in phocid pinnipeds from NMFS (2016) at Creyke Beck B, location ID6 for installing a monopile using a maximum blow energy of 4000 kJ for the three ramp-up scenarios (scenario 1 = green, scenario 2 = yellow, scenario 3 = red) ....................................... 118
Figure B 81 Contour plot showing the unweighted SELcum impact ranges for TTS in species of fish from Popper et al. (2014) at Creyke Beck B, location ID6 for installing a pin pile using a maximum blow energy of 2300 kJ for the three ramp-up scenarios (scenario 1 = green, scenario 2 = yellow, scenario 3 = red) ....................................... 119
Figure B 82 Contour plot showing the unweighted SELcum impact ranges for TTS in species of fish from Popper et al. (2014) at Creyke Beck B, location ID6 for installing a monopile using a maximum blow energy of 3000 kJ for the three ramp-up scenarios (scenario 1 = green, scenario 2 = yellow, scenario 3 = red) ....................................... 119
Figure B 83 Contour plot showing the unweighted SELcum impact ranges for TTS in species of fish from Popper et al. (2014) at Creyke Beck B, location ID6 for installing a monopile using a maximum blow energy of 3600 kJ for the three ramp-up scenarios (scenario 1 = green, scenario 2 = yellow, scenario 3 = red) ....................................... 120
Figure B 84 Contour plot showing the unweighted SELcum impact ranges for TTS in species of fish from Popper et al. (2014) at Creyke Beck B, location ID6 for installing a monopile using a maximum blow energy of 4000 kJ for the three ramp-up scenarios (scenario 1 = green, scenario 2 = yellow, scenario 3 = red) ....................................... 120
Figure B 85 Contour plot showing the unweighted SPLpeak and SELss impact ranges for TTS/fleeing response and avoidance in harbour porpoise from Lucke et al. (2009) at Creyke Beck B, location ID13 for installing a pin pile using a maximum blow energy of 2300 kJ .. 121
Figure B 86 Contour plot showing the unweighted SPLpeak and SELss impact ranges for TTS/fleeing response and avoidance in harbour porpoise from Lucke et al. (2009) at Creyke Beck B, location ID13 for installing a monopile using a maximum blow energy of 3000 kJ 121
Figure B 87 Contour plot showing the unweighted SPLpeak and SELss impact ranges for TTS/fleeing response and avoidance in harbour porpoise from Lucke et al. (2009) at Creyke Beck B, location ID13 for installing a monopile using a maximum blow energy of 3600 kJ 122
Figure B 88 Contour plot showing the unweighted SPLpeak and SELss impact ranges for TTS/fleeing response and avoidance in harbour porpoise from Lucke et al. (2009) at Creyke Beck B, location ID13 for installing a monopile using a maximum blow energy of 4000 kJ 122
Figure B 89 Contour plot showing the unweighted SELss impact ranges for avoidance in LF and MF cetaceans from Southall et al. (2007) at Creyke Beck B, location ID13 for installing a pin pile using a maximum blow energy of 2300 kJ .............................................. 123
Figure B 90 Contour plot showing the unweighted SELss impact ranges for avoidance in LF and MF cetaceans from Southall et al. (2007) at Creyke Beck B, location ID13 for installing a monopile using a maximum blow energy of 3000 kJ .............................................. 123
Figure B 91 Contour plot showing the unweighted SELss impact ranges for avoidance in LF and MF cetaceans from Southall et al. (2007) at Creyke Beck B, location ID13 for installing a monopile using a maximum blow energy of 3600 kJ .............................................. 124

COMMERCIAL IN CONFIDENCE
Underwater noise modelling at the Creyke Beck offshore wind farms, Dogger Bank
Subacoustech Environmental Ltd. 77
Document Ref: P223R0101
COMMERCIAL IN CONFIDENCE
Figure B 92 Contour plot showing the unweighted SELss impact ranges for avoidance in LF and MF cetaceans from Southall et al. (2007) at Creyke Beck B, location ID13 for installing a monopile using a maximum blow energy of 4000 kJ ............................................. 124
Figure B 93 Contour plot showing the unweighted SPLpeak impact ranges for avoidance in species of fish at Creyke Beck B, location ID13 for installing a pin pile using a maximum blow energy of 2300 kJ .. 125
Figure B 94 Contour plot showing the unweighted SPLpeak impact ranges for avoidance in species of fish at Creyke Beck B, location ID13 for installing a monopile using a maximum blow energy of 3000 kJ 125
Figure B 95 Contour plot showing the unweighted SPLpeak impact ranges for avoidance in species of fish at Creyke Beck B, location ID13 for installing a monopile using a maximum blow energy of 3600 kJ 126
Figure B 96 Contour plot showing the unweighted SPLpeak impact ranges for avoidance in species of fish at Creyke Beck B, location ID13 for installing a monopile using a maximum blow energy of 4000 kJ 126
Figure B 97 Contour plot showing the weighted SELcum impact ranges for TTS in LF cetaceans from NMFS (2016) at Creyke Beck B, location ID13 for installing a pin pile using a maximum blow energy of 2300 kJ for the three ramp-up scenarios (scenario 1 = green, scenario 2 = yellow, scenario 3 = red) ....................................... 127
Figure B 98 Contour plot showing the weighted SELcum impact ranges for TTS in LF cetaceans from NMFS (2016) at Creyke Beck B, location ID13 for installing a monopile using a maximum blow energy of 3000 kJ for the three ramp-up scenarios (scenario 1 = green, scenario 2 = yellow, scenario 3 = red) ....................................... 127
Figure B 99 Contour plot showing the weighted SELcum impact ranges for TTS in LF cetaceans from NMFS (2016) at Creyke Beck B, location ID13 for installing a monopile using a maximum blow energy of
3600 kJ for the three ramp-up scenarios (scenario 1 = green, scenario 2 = yellow, scenario 3 = red) ....................................... 128
Figure B 100 Contour plot showing the weighted SELcum impact ranges for TTS in LF cetaceans from NMFS (2016) at Creyke Beck B, location ID13 for installing a monopile using a maximum blow energy of 4000 kJ for the three ramp-up scenarios (scenario 1 = green, scenario 2 = yellow, scenario 3 = red) ....................................... 128
Figure B 101 Contour plot showing the weighted SELcum impact ranges for TTS in HF cetaceans from NMFS (2016) at Creyke Beck B, location ID13 for installing a pin pile using a maximum blow energy of 2300 kJ for the three ramp-up scenarios (scenario 1 = green, scenario 2 = yellow, scenario 3 = red) ....................................... 129
Figure B 102 Contour plot showing the weighted SELcum impact ranges for TTS in HF cetaceans from NMFS (2016) at Creyke Beck B, location ID13 for installing a monopile using a maximum blow energy of 3000 kJ for the three ramp-up scenarios (scenario 1 = green, scenario 2 = yellow, scenario 3 = red) ....................................... 129
Figure B 103 Contour plot showing the weighted SELcum impact ranges for TTS in HF cetaceans from NMFS (2016) at Creyke Beck B, location ID13 for installing a monopile using a maximum blow energy of 3600 kJ for the three ramp-up scenarios (scenario 1 = green, scenario 2 = yellow, scenario 3 = red) ....................................... 130
Figure B 104 Contour plot showing the weighted SELcum impact ranges for TTS in HF cetaceans from NMFS (2016) at Creyke Beck B, location ID13 for installing a monopile using a maximum blow energy of 4000 kJ for the three ramp-up scenarios (scenario 1 = green, scenario 2 = yellow, scenario 3 = red) ....................................... 130
Figure B 105 Contour plot showing the weighted SELcum impact ranges for TTS in phocid pinnipeds from NMFS (2016) at Creyke Beck B, location ID13 for installing a pin pile using a maximum blow energy

COMMERCIAL IN CONFIDENCE
Underwater noise modelling at the Creyke Beck offshore wind farms, Dogger Bank
Subacoustech Environmental Ltd. 78
Document Ref: P223R0101
COMMERCIAL IN CONFIDENCE
of 2300 kJ for the three ramp-up scenarios (scenario 1 = green, scenario 2 = yellow, scenario 3 = red) ....................................... 131
Figure B 106 Contour plot showing the weighted SELcum impact ranges for TTS in phocid pinnipeds from NMFS (2016) at Creyke Beck B, location ID13 for installing a monopile using a maximum blow energy of 3000 kJ for the three ramp-up scenarios (scenario 1 = green, scenario 2 = yellow, scenario 3 = red) ............................ 131
Figure B 107 Contour plot showing the weighted SELcum impact ranges for TTS in phocid pinnipeds from NMFS (2016) at Creyke Beck B, location ID13 for installing a monopile using a maximum blow energy of 3600 kJ for the three ramp-up scenarios (scenario 1 = green, scenario 2 = yellow, scenario 3 = red) ............................ 132
Figure B 108 Contour plot showing the weighted SELcum impact ranges for TTS in phocid pinnipeds from NMFS (2016) at Creyke Beck B, location ID13 for installing a monopile using a maximum blow energy of 4000 kJ for the three ramp-up scenarios (scenario 1 = green, scenario 2 = yellow, scenario 3 = red) ............................ 132
Figure B 109 Contour plot showing the unweighted SELcum impact ranges for TTS in species of fish from Popper et al. (2014) at Creyke Beck B, location ID13 for installing a pin pile using a maximum blow energy of 2300 kJ for the three ramp-up scenarios (scenario 1 = green, scenario 2 = yellow, scenario 3 = red) ............................ 133
Figure B 110 Contour plot showing the unweighted SELcum impact ranges for TTS in species of fish from Popper et al. (2014) at Creyke Beck B, location ID13 for installing a monopile using a maximum blow energy of 3000 kJ for the three ramp-up scenarios (scenario 1 = green, scenario 2 = yellow, scenario 3 = red) ............................ 133
Figure B 111 Contour plot showing the unweighted SELcum impact ranges for TTS in species of fish from Popper et al. (2014) at Creyke Beck B, location ID13 for installing a monopile using a maximum blow
energy of 3600 kJ for the three ramp-up scenarios (scenario 1 = green, scenario 2 = yellow, scenario 3 = red) ............................ 134
Figure B 112 Contour plot showing the unweighted SELcum impact ranges for TTS in species of fish from Popper et al. (2014) at Creyke Beck B, location ID13 for installing a monopile using a maximum blow energy of 4000 kJ for the three ramp-up scenarios (scenario 1 = green, scenario 2 = yellow, scenario 3 = red) ............................ 134

COMMERCIAL IN CONFIDENCE
Underwater noise modelling at the Creyke Beck offshore wind farms, Dogger Bank
Subacoustech Environmental Ltd. 79
Document Ref: P223R0101
COMMERCIAL IN CONFIDENCE
B.1 Creyke Beck A, location ID6
Previously considered criteria contour plots
Figure B 1 Contour plot showing the unweighted SPLpeak and SELss impact
ranges for TTS/fleeing response and avoidance in harbour porpoise from Lucke et al. (2009) at Creyke Beck A, location ID6 for installing a pin pile
using a maximum blow energy of 2300 kJ
Figure B 2 Contour plot showing the unweighted SPLpeak and SELss impact
ranges for TTS/fleeing response and avoidance in harbour porpoise from Lucke et al. (2009) at Creyke Beck A, location ID6 for installing a monopile
using a maximum blow energy of 3000 kJ

COMMERCIAL IN CONFIDENCE
Underwater noise modelling at the Creyke Beck offshore wind farms, Dogger Bank
Subacoustech Environmental Ltd. 80
Document Ref: P223R0101
COMMERCIAL IN CONFIDENCE
Figure B 3 Contour plot showing the unweighted SPLpeak and SELss impact
ranges for TTS/fleeing response and avoidance in harbour porpoise from Lucke et al. (2009) at Creyke Beck A, location ID6 for installing a monopile
using a maximum blow energy of 3600 kJ
Figure B 4 Contour plot showing the unweighted SPLpeak and SELss impact
ranges for TTS/fleeing response and avoidance in harbour porpoise from Lucke et al. (2009) at Creyke Beck A, location ID6 for installing a monopile
using a maximum blow energy of 4000 kJ

COMMERCIAL IN CONFIDENCE
Underwater noise modelling at the Creyke Beck offshore wind farms, Dogger Bank
Subacoustech Environmental Ltd. 81
Document Ref: P223R0101
COMMERCIAL IN CONFIDENCE
Figure B 5 Contour plot showing the unweighted SELss impact ranges for avoidance in LF and MF cetaceans from Southall et al. (2007) at Creyke
Beck A, location ID6 for installing a pin pile using a maximum blow energy of 2300 kJ
Figure B 6 Contour plot showing the unweighted SELss impact ranges for avoidance in LF and MF cetaceans from Southall et al. (2007) at Creyke
Beck A, location ID6 for installing a monopile using a maximum blow energy of 3000 kJ

COMMERCIAL IN CONFIDENCE
Underwater noise modelling at the Creyke Beck offshore wind farms, Dogger Bank
Subacoustech Environmental Ltd. 82
Document Ref: P223R0101
COMMERCIAL IN CONFIDENCE
Figure B 7 Contour plot showing the unweighted SELss impact ranges for avoidance in LF and MF cetaceans from Southall et al. (2007) at Creyke
Beck A, location ID6 for installing a monopile using a maximum blow energy of 3600 kJ
Figure B 8 Contour plot showing the unweighted SELss impact ranges for avoidance in LF and MF cetaceans from Southall et al. (2007) at Creyke
Beck A, location ID6 for installing a monopile using a maximum blow energy of 4000 kJ

COMMERCIAL IN CONFIDENCE
Underwater noise modelling at the Creyke Beck offshore wind farms, Dogger Bank
Subacoustech Environmental Ltd. 83
Document Ref: P223R0101
COMMERCIAL IN CONFIDENCE
Figure B 9 Contour plot showing the unweighted SPLpeak impact ranges for avoidance in species of fish at Creyke Beck A, location ID6 for installing a
pin pile using a maximum blow energy of 2300 kJ
Figure B 10 Contour plot showing the unweighted SPLpeak impact ranges
for avoidance in species of fish at Creyke Beck A, location ID6 for installing a monopile using a maximum blow energy of 3000 kJ

COMMERCIAL IN CONFIDENCE
Underwater noise modelling at the Creyke Beck offshore wind farms, Dogger Bank
Subacoustech Environmental Ltd. 84
Document Ref: P223R0101
COMMERCIAL IN CONFIDENCE
Figure B 11 Contour plot showing the unweighted SPLpeak impact ranges
for avoidance in species of fish at Creyke Beck A, location ID6 for installing a monopile using a maximum blow energy of 3600 kJ
Figure B 12 Contour plot showing the unweighted SPLpeak impact ranges
for avoidance in species of fish at Creyke Beck A, location ID6 for installing a monopile using a maximum blow energy of 4000 kJ

COMMERCIAL IN CONFIDENCE
Underwater noise modelling at the Creyke Beck offshore wind farms, Dogger Bank
Subacoustech Environmental Ltd. 85
Document Ref: P223R0101
COMMERCIAL IN CONFIDENCE
NMFS (2016) contour plots
Figure B 13 Contour plot showing the weighted SELcum impact ranges for
TTS in LF cetaceans from NMFS (2016) at Creyke Beck A, location ID6 for installing a pin pile using a maximum blow energy of 2300 kJ for the three ramp-up scenarios (scenario 1 = green, scenario 2 = yellow, scenario 3 =
red)
Figure B 14 Contour plot showing the weighted SELcum impact ranges for
TTS in LF cetaceans from NMFS (2016) at Creyke Beck A, location ID6 for installing a monopile using a maximum blow energy of 3000 kJ for the
three ramp-up scenarios (scenario 1 = green, scenario 2 = yellow, scenario 3 = red)

COMMERCIAL IN CONFIDENCE
Underwater noise modelling at the Creyke Beck offshore wind farms, Dogger Bank
Subacoustech Environmental Ltd. 86
Document Ref: P223R0101
COMMERCIAL IN CONFIDENCE
Figure B 15 Contour plot showing the weighted SELcum impact ranges for
TTS in LF cetaceans from NMFS (2016) at Creyke Beck A, location ID6 for installing a monopile using a maximum blow energy of 3600 kJ for the
three ramp-up scenarios (scenario 1 = green, scenario 2 = yellow, scenario 3 = red)
Figure B 16 Contour plot showing the weighted SELcum impact ranges for
TTS in LF cetaceans from NMFS (2016) at Creyke Beck A, location ID6 for installing a monopile using a maximum blow energy of 4000 kJ for the
three ramp-up scenarios (scenario 1 = green, scenario 2 = yellow, scenario 3 = red)
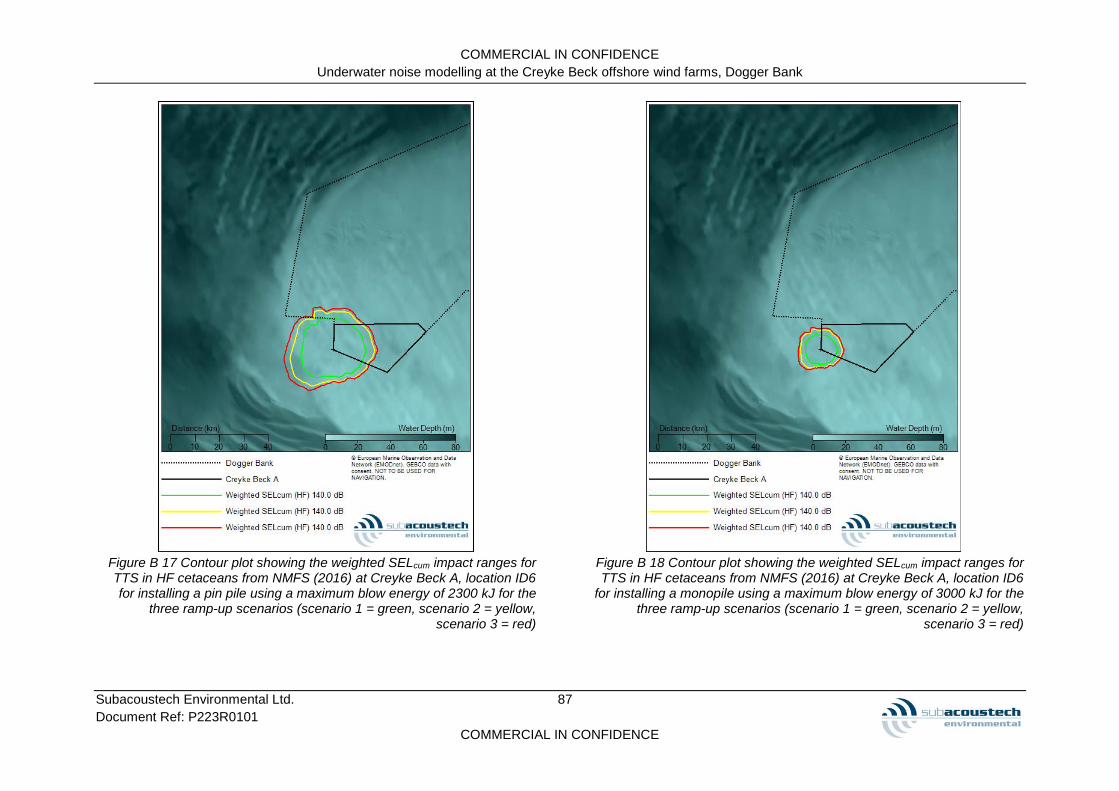
COMMERCIAL IN CONFIDENCE
Underwater noise modelling at the Creyke Beck offshore wind farms, Dogger Bank
Subacoustech Environmental Ltd. 87
Document Ref: P223R0101
COMMERCIAL IN CONFIDENCE
Figure B 17 Contour plot showing the weighted SELcum impact ranges for TTS in HF cetaceans from NMFS (2016) at Creyke Beck A, location ID6 for installing a pin pile using a maximum blow energy of 2300 kJ for the
three ramp-up scenarios (scenario 1 = green, scenario 2 = yellow, scenario 3 = red)
Figure B 18 Contour plot showing the weighted SELcum impact ranges for TTS in HF cetaceans from NMFS (2016) at Creyke Beck A, location ID6
for installing a monopile using a maximum blow energy of 3000 kJ for the three ramp-up scenarios (scenario 1 = green, scenario 2 = yellow,
scenario 3 = red)
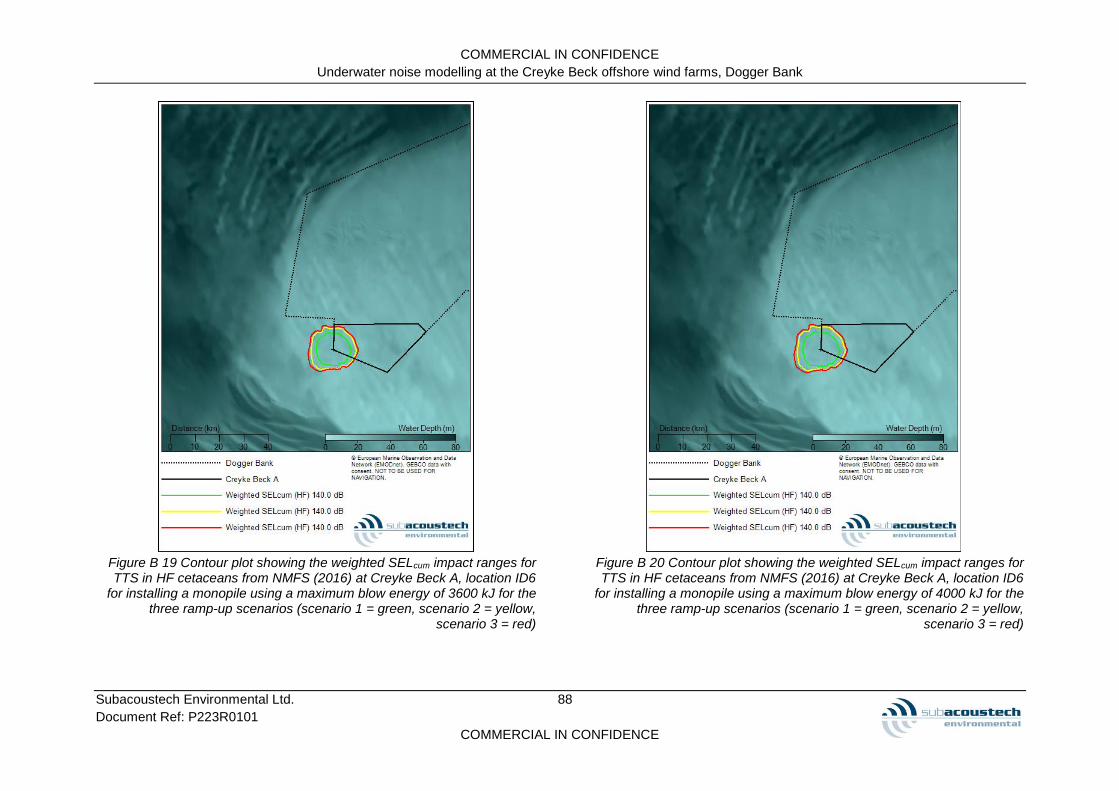
COMMERCIAL IN CONFIDENCE
Underwater noise modelling at the Creyke Beck offshore wind farms, Dogger Bank
Subacoustech Environmental Ltd. 88
Document Ref: P223R0101
COMMERCIAL IN CONFIDENCE
Figure B 19 Contour plot showing the weighted SELcum impact ranges for TTS in HF cetaceans from NMFS (2016) at Creyke Beck A, location ID6
for installing a monopile using a maximum blow energy of 3600 kJ for the three ramp-up scenarios (scenario 1 = green, scenario 2 = yellow,
scenario 3 = red)
Figure B 20 Contour plot showing the weighted SELcum impact ranges for TTS in HF cetaceans from NMFS (2016) at Creyke Beck A, location ID6
for installing a monopile using a maximum blow energy of 4000 kJ for the three ramp-up scenarios (scenario 1 = green, scenario 2 = yellow,
scenario 3 = red)
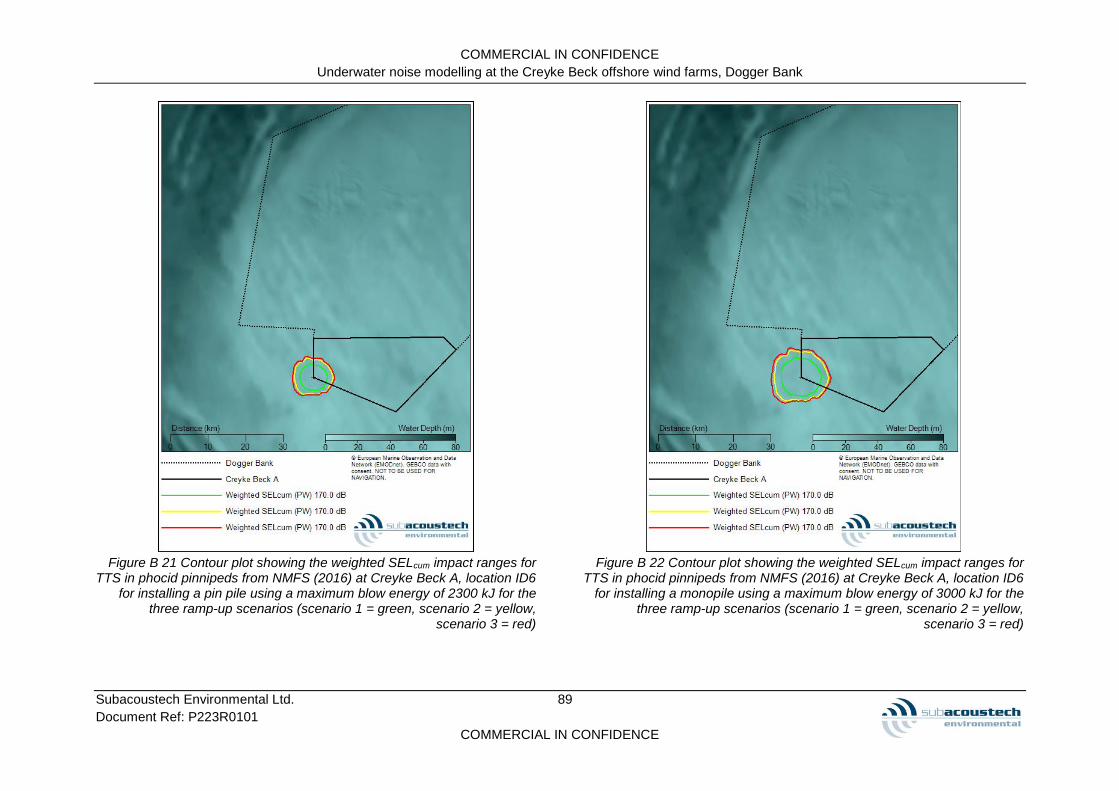
COMMERCIAL IN CONFIDENCE
Underwater noise modelling at the Creyke Beck offshore wind farms, Dogger Bank
Subacoustech Environmental Ltd. 89
Document Ref: P223R0101
COMMERCIAL IN CONFIDENCE
Figure B 21 Contour plot showing the weighted SELcum impact ranges for
TTS in phocid pinnipeds from NMFS (2016) at Creyke Beck A, location ID6 for installing a pin pile using a maximum blow energy of 2300 kJ for the
three ramp-up scenarios (scenario 1 = green, scenario 2 = yellow, scenario 3 = red)
Figure B 22 Contour plot showing the weighted SELcum impact ranges for
TTS in phocid pinnipeds from NMFS (2016) at Creyke Beck A, location ID6 for installing a monopile using a maximum blow energy of 3000 kJ for the
three ramp-up scenarios (scenario 1 = green, scenario 2 = yellow, scenario 3 = red)

COMMERCIAL IN CONFIDENCE
Underwater noise modelling at the Creyke Beck offshore wind farms, Dogger Bank
Subacoustech Environmental Ltd. 90
Document Ref: P223R0101
COMMERCIAL IN CONFIDENCE
Figure B 23 Contour plot showing the weighted SELcum impact ranges for
TTS in phocid pinnipeds from NMFS (2016) at Creyke Beck A, location ID6 for installing a monopile using a maximum blow energy of 3600 kJ for the
three ramp-up scenarios (scenario 1 = green, scenario 2 = yellow, scenario 3 = red)
Figure B 24 Contour plot showing the weighted SELcum impact ranges for
TTS in phocid pinnipeds from NMFS (2016) at Creyke Beck A, location ID6 for installing a monopile using a maximum blow energy of 4000 kJ for the
three ramp-up scenarios (scenario 1 = green, scenario 2 = yellow, scenario 3 = red)

COMMERCIAL IN CONFIDENCE
Underwater noise modelling at the Creyke Beck offshore wind farms, Dogger Bank
Subacoustech Environmental Ltd. 91
Document Ref: P223R0101
COMMERCIAL IN CONFIDENCE
Popper et al. (2014) contour plots
Figure B 25 Contour plot showing the unweighted SELcum impact ranges
for TTS in species of fish from Popper et al. (2014) at Creyke Beck A, location ID6 for installing a pin pile using a maximum blow energy of
2300 kJ for the three ramp-up scenarios (scenario 1 = green, scenario 2 = yellow, scenario 3 = red)
Figure B 26 Contour plot showing the unweighted SELcum impact ranges
for TTS in species of fish from Popper et al. (2014) at Creyke Beck A, location ID6 for installing a monopile using a maximum blow energy of
3000 kJ for the three ramp-up scenarios (scenario 1 = green, scenario 2 = yellow, scenario 3 = red)

COMMERCIAL IN CONFIDENCE
Underwater noise modelling at the Creyke Beck offshore wind farms, Dogger Bank
Subacoustech Environmental Ltd. 92
Document Ref: P223R0101
COMMERCIAL IN CONFIDENCE
Figure B 27 Contour plot showing the unweighted SELcum impact ranges
for TTS in species of fish from Popper et al. (2014) at Creyke Beck A, location ID6 for installing a monopile using a maximum blow energy of
3600 kJ for the three ramp-up scenarios (scenario 1 = green, scenario 2 = yellow, scenario 3 = red)
Figure B 28 Contour plot showing the unweighted SELcum impact ranges
for TTS in species of fish from Popper et al. (2014) at Creyke Beck A, location ID6 for installing a monopile using a maximum blow energy of
4000 kJ for the three ramp-up scenarios (scenario 1 = green, scenario 2 = yellow, scenario 3 = red)
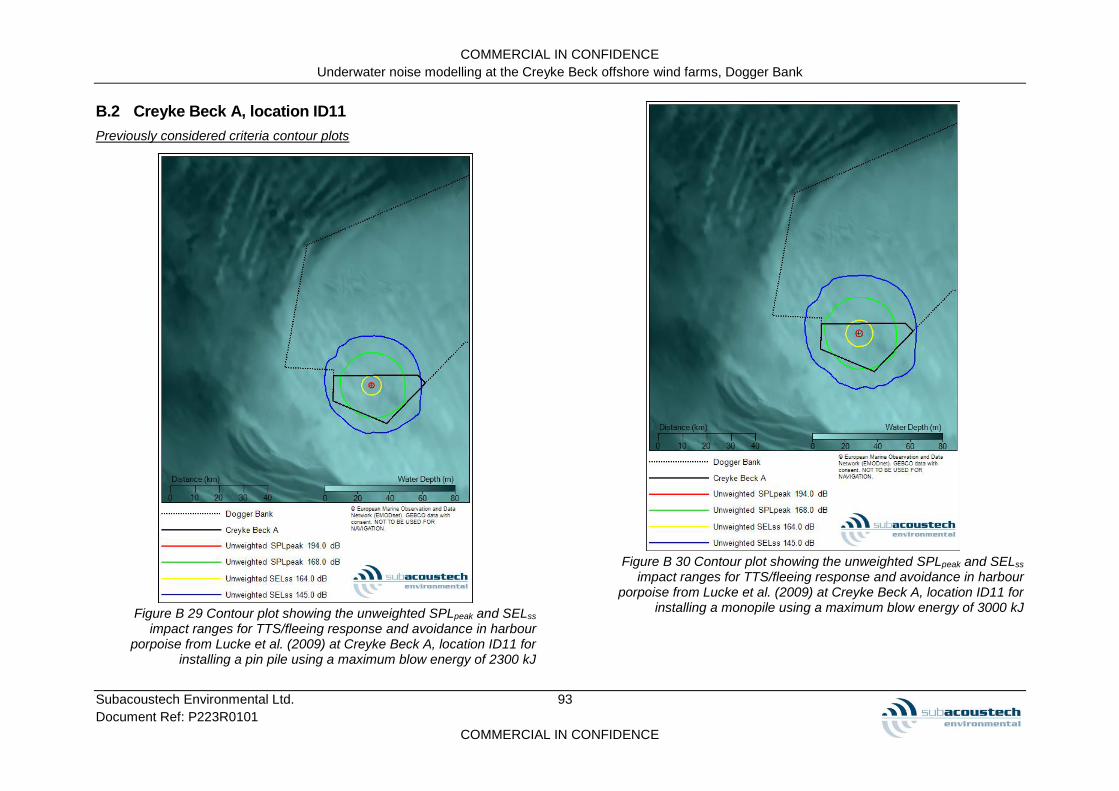
COMMERCIAL IN CONFIDENCE
Underwater noise modelling at the Creyke Beck offshore wind farms, Dogger Bank
Subacoustech Environmental Ltd. 93
Document Ref: P223R0101
COMMERCIAL IN CONFIDENCE
B.2 Creyke Beck A, location ID11
Previously considered criteria contour plots
Figure B 29 Contour plot showing the unweighted SPLpeak and SELss
impact ranges for TTS/fleeing response and avoidance in harbour porpoise from Lucke et al. (2009) at Creyke Beck A, location ID11 for
installing a pin pile using a maximum blow energy of 2300 kJ
Figure B 30 Contour plot showing the unweighted SPLpeak and SELss
impact ranges for TTS/fleeing response and avoidance in harbour porpoise from Lucke et al. (2009) at Creyke Beck A, location ID11 for
installing a monopile using a maximum blow energy of 3000 kJ

COMMERCIAL IN CONFIDENCE
Underwater noise modelling at the Creyke Beck offshore wind farms, Dogger Bank
Subacoustech Environmental Ltd. 94
Document Ref: P223R0101
COMMERCIAL IN CONFIDENCE
Figure B 31 Contour plot showing the unweighted SPLpeak and SELss
impact ranges for TTS/fleeing response and avoidance in harbour porpoise from Lucke et al. (2009) at Creyke Beck A, location ID11 for
installing a monopile using a maximum blow energy of 3600 kJ
Figure B 32 Contour plot showing the unweighted SPLpeak and SELss
impact ranges for TTS/fleeing response and avoidance in harbour porpoise from Lucke et al. (2009) at Creyke Beck A, location ID11 for
installing a monopile using a maximum blow energy of 4000 kJ

COMMERCIAL IN CONFIDENCE
Underwater noise modelling at the Creyke Beck offshore wind farms, Dogger Bank
Subacoustech Environmental Ltd. 95
Document Ref: P223R0101
COMMERCIAL IN CONFIDENCE
Figure B 33 Contour plot showing the unweighted SELss impact ranges for
avoidance in LF and MF cetaceans from Southall et al. (2007) at Creyke Beck A, location ID11 for installing a pin pile using a maximum blow
energy of 2300 kJ
Figure B 34 Contour plot showing the unweighted SELss impact ranges for
avoidance in LF and MF cetaceans from Southall et al. (2007) at Creyke Beck A, location ID11 for installing a monopile using a maximum blow
energy of 3000 kJ

COMMERCIAL IN CONFIDENCE
Underwater noise modelling at the Creyke Beck offshore wind farms, Dogger Bank
Subacoustech Environmental Ltd. 96
Document Ref: P223R0101
COMMERCIAL IN CONFIDENCE
Figure B 35 Contour plot showing the unweighted SELss impact ranges for
avoidance in LF and MF cetaceans from Southall et al. (2007) at Creyke Beck A, location ID11 for installing a monopile using a maximum blow
energy of 3600 kJ
Figure B 36 Contour plot showing the unweighted SELss impact ranges for
avoidance in LF and MF cetaceans from Southall et al. (2007) at Creyke Beck A, location ID11 for installing a monopile using a maximum blow
energy of 4000 kJ

COMMERCIAL IN CONFIDENCE
Underwater noise modelling at the Creyke Beck offshore wind farms, Dogger Bank
Subacoustech Environmental Ltd. 97
Document Ref: P223R0101
COMMERCIAL IN CONFIDENCE
Figure B 37 Contour plot showing the unweighted SPLpeak impact ranges
for avoidance in species of fish at Creyke Beck A, location ID11 for installing a pin pile using a maximum blow energy of 2300 kJ
Figure B 38 Contour plot showing the unweighted SPLpeak impact ranges
for avoidance in species of fish at Creyke Beck A, location ID11 for installing a monopile using a maximum blow energy of 3000 kJ

COMMERCIAL IN CONFIDENCE
Underwater noise modelling at the Creyke Beck offshore wind farms, Dogger Bank
Subacoustech Environmental Ltd. 98
Document Ref: P223R0101
COMMERCIAL IN CONFIDENCE
Figure B 39 Contour plot showing the unweighted SPLpeak impact ranges
for avoidance in species of fish at Creyke Beck A, location ID11 for installing a monopile using a maximum blow energy of 3600 kJ
Figure B 40 Contour plot showing the unweighted SPLpeak impact ranges
for avoidance in species of fish at Creyke Beck A, location ID11 for installing a monopile using a maximum blow energy of 4000 kJ

COMMERCIAL IN CONFIDENCE
Underwater noise modelling at the Creyke Beck offshore wind farms, Dogger Bank
Subacoustech Environmental Ltd. 99
Document Ref: P223R0101
COMMERCIAL IN CONFIDENCE
NMFS (2016) contour plots
Figure B 41 Contour plot showing the weighted SELcum impact ranges for TTS in LF cetaceans from NMFS (2016) at Creyke Beck A, location ID11
for installing a pin pile using a maximum blow energy of 2300 kJ for the three ramp-up scenarios (scenario 1 = green, scenario 2 = yellow,
scenario 3 = red)
Figure B 42 Contour plot showing the weighted SELcum impact ranges for TTS in LF cetaceans from NMFS (2016) at Creyke Beck A, location ID11 for installing a monopile using a maximum blow energy of 3000 kJ for the
three ramp-up scenarios (scenario 1 = green, scenario 2 = yellow, scenario 3 = red)
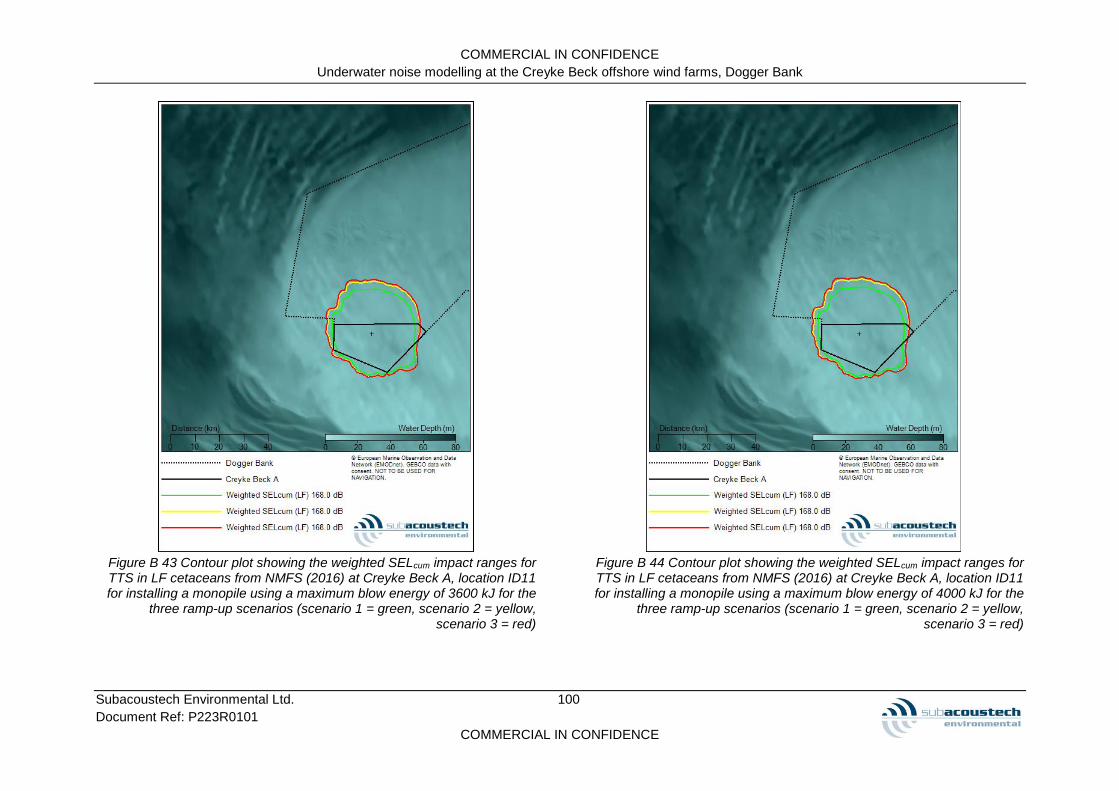
COMMERCIAL IN CONFIDENCE
Underwater noise modelling at the Creyke Beck offshore wind farms, Dogger Bank
Subacoustech Environmental Ltd. 100
Document Ref: P223R0101
COMMERCIAL IN CONFIDENCE
Figure B 43 Contour plot showing the weighted SELcum impact ranges for TTS in LF cetaceans from NMFS (2016) at Creyke Beck A, location ID11 for installing a monopile using a maximum blow energy of 3600 kJ for the
three ramp-up scenarios (scenario 1 = green, scenario 2 = yellow, scenario 3 = red)
Figure B 44 Contour plot showing the weighted SELcum impact ranges for TTS in LF cetaceans from NMFS (2016) at Creyke Beck A, location ID11 for installing a monopile using a maximum blow energy of 4000 kJ for the
three ramp-up scenarios (scenario 1 = green, scenario 2 = yellow, scenario 3 = red)

COMMERCIAL IN CONFIDENCE
Underwater noise modelling at the Creyke Beck offshore wind farms, Dogger Bank
Subacoustech Environmental Ltd. 101
Document Ref: P223R0101
COMMERCIAL IN CONFIDENCE
Figure B 45 Contour plot showing the weighted SELcum impact ranges for TTS in HF cetaceans from NMFS (2016) at Creyke Beck A, location ID11
for installing a pin pile using a maximum blow energy of 2300 kJ for the three ramp-up scenarios (scenario 1 = green, scenario 2 = yellow,
scenario 3 = red)
Figure B 46 Contour plot showing the weighted SELcum impact ranges for TTS in HF cetaceans from NMFS (2016) at Creyke Beck A, location ID11 for installing a monopile using a maximum blow energy of 3000 kJ for the
three ramp-up scenarios (scenario 1 = green, scenario 2 = yellow, scenario 3 = red)

COMMERCIAL IN CONFIDENCE
Underwater noise modelling at the Creyke Beck offshore wind farms, Dogger Bank
Subacoustech Environmental Ltd. 102
Document Ref: P223R0101
COMMERCIAL IN CONFIDENCE
Figure B 47 Contour plot showing the weighted SELcum impact ranges for TTS in HF cetaceans from NMFS (2016) at Creyke Beck A, location ID11 for installing a monopile using a maximum blow energy of 3600 kJ for the
three ramp-up scenarios (scenario 1 = green, scenario 2 = yellow, scenario 3 = red)
Figure B 48 Contour plot showing the weighted SELcum impact ranges for TTS in HF cetaceans from NMFS (2016) at Creyke Beck A, location ID11 for installing a monopile using a maximum blow energy of 4000 kJ for the
three ramp-up scenarios (scenario 1 = green, scenario 2 = yellow, scenario 3 = red)

COMMERCIAL IN CONFIDENCE
Underwater noise modelling at the Creyke Beck offshore wind farms, Dogger Bank
Subacoustech Environmental Ltd. 103
Document Ref: P223R0101
COMMERCIAL IN CONFIDENCE
Figure B 49 Contour plot showing the weighted SELcum impact ranges for
TTS in phocid pinnipeds from NMFS (2016) at Creyke Beck A, location ID11 for installing a pin pile using a maximum blow energy of 2300 kJ for
the three ramp-up scenarios (scenario 1 = green, scenario 2 = yellow, scenario 3 = red)
Figure B 50 Contour plot showing the weighted SELcum impact ranges for
TTS in phocid pinnipeds from NMFS (2016) at Creyke Beck A, location ID11 for installing a monopile using a maximum blow energy of 3000 kJ for
the three ramp-up scenarios (scenario 1 = green, scenario 2 = yellow, scenario 3 = red)

COMMERCIAL IN CONFIDENCE
Underwater noise modelling at the Creyke Beck offshore wind farms, Dogger Bank
Subacoustech Environmental Ltd. 104
Document Ref: P223R0101
COMMERCIAL IN CONFIDENCE
Figure B 51 Contour plot showing the weighted SELcum impact ranges for
TTS in phocid pinnipeds from NMFS (2016) at Creyke Beck A, location ID11 for installing a monopile using a maximum blow energy of 3600 kJ for
the three ramp-up scenarios (scenario 1 = green, scenario 2 = yellow, scenario 3 = red)
Figure B 52 Contour plot showing the weighted SELcum impact ranges for
TTS in phocid pinnipeds from NMFS (2016) at Creyke Beck A, location ID11 for installing a monopile using a maximum blow energy of 4000 kJ for
the three ramp-up scenarios (scenario 1 = green, scenario 2 = yellow, scenario 3 = red)
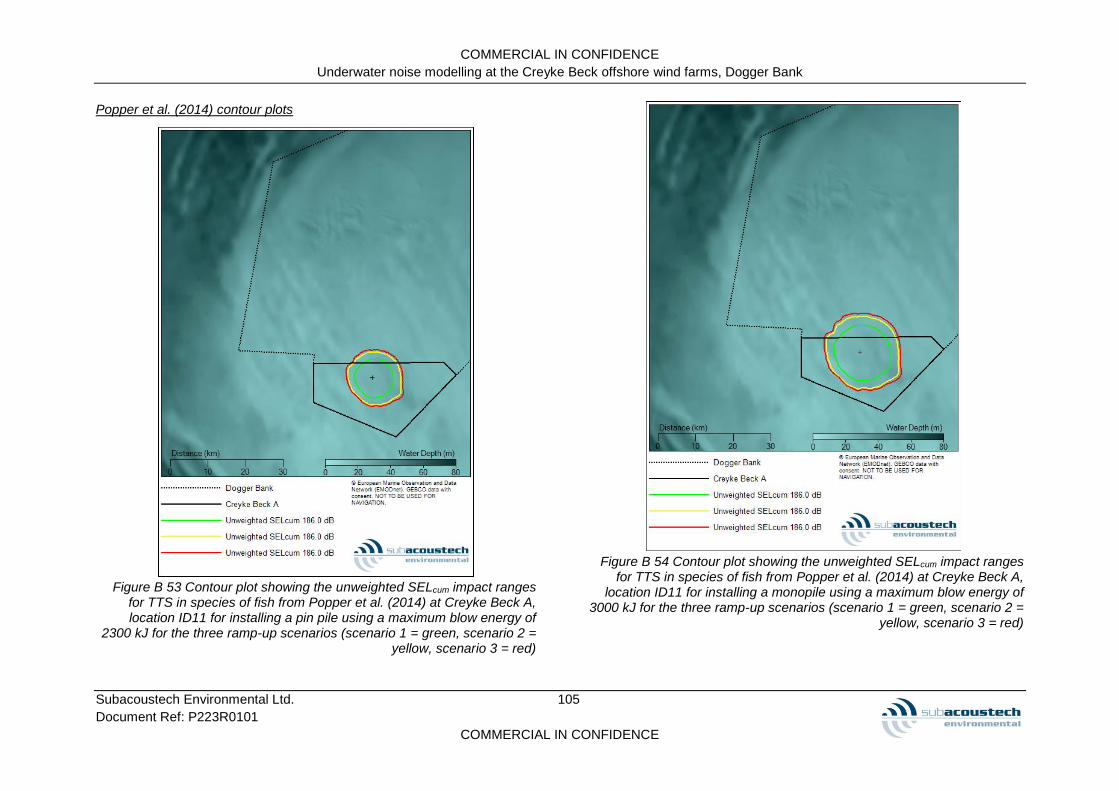
COMMERCIAL IN CONFIDENCE
Underwater noise modelling at the Creyke Beck offshore wind farms, Dogger Bank
Subacoustech Environmental Ltd. 105
Document Ref: P223R0101
COMMERCIAL IN CONFIDENCE
Popper et al. (2014) contour plots
Figure B 53 Contour plot showing the unweighted SELcum impact ranges
for TTS in species of fish from Popper et al. (2014) at Creyke Beck A, location ID11 for installing a pin pile using a maximum blow energy of
2300 kJ for the three ramp-up scenarios (scenario 1 = green, scenario 2 = yellow, scenario 3 = red)
Figure B 54 Contour plot showing the unweighted SELcum impact ranges
for TTS in species of fish from Popper et al. (2014) at Creyke Beck A, location ID11 for installing a monopile using a maximum blow energy of
3000 kJ for the three ramp-up scenarios (scenario 1 = green, scenario 2 = yellow, scenario 3 = red)

COMMERCIAL IN CONFIDENCE
Underwater noise modelling at the Creyke Beck offshore wind farms, Dogger Bank
Subacoustech Environmental Ltd. 106
Document Ref: P223R0101
COMMERCIAL IN CONFIDENCE
Figure B 55 Contour plot showing the unweighted SELcum impact ranges
for TTS in species of fish from Popper et al. (2014) at Creyke Beck A, location ID11 for installing a monopile using a maximum blow energy of
3600 kJ for the three ramp-up scenarios (scenario 1 = green, scenario 2 = yellow, scenario 3 = red)
Figure B 56 Contour plot showing the unweighted SELcum impact ranges
for TTS in species of fish from Popper et al. (2014) at Creyke Beck A, location ID11 for installing a monopile using a maximum blow energy of
4000 kJ for the three ramp-up scenarios (scenario 1 = green, scenario 2 = yellow, scenario 3 = red)

COMMERCIAL IN CONFIDENCE
Underwater noise modelling at the Creyke Beck offshore wind farms, Dogger Bank
Subacoustech Environmental Ltd. 107
Document Ref: P223R0101
COMMERCIAL IN CONFIDENCE
B.3 Creyke Beck B, location ID6
Previously considered criteria contour plots
Figure B 57 Contour plot showing the unweighted SPLpeak and SELss
impact ranges for TTS/fleeing response and avoidance in harbour porpoise from Lucke et al. (2009) at Creyke Beck B, location ID6 for
installing a pin pile using a maximum blow energy of 2300 kJ
Figure B 58 Contour plot showing the unweighted SPLpeak and SELss
impact ranges for TTS/fleeing response and avoidance in harbour porpoise from Lucke et al. (2009) at Creyke Beck B, location ID6 for
installing a monopile using a maximum blow energy of 3000 kJ

COMMERCIAL IN CONFIDENCE
Underwater noise modelling at the Creyke Beck offshore wind farms, Dogger Bank
Subacoustech Environmental Ltd. 108
Document Ref: P223R0101
COMMERCIAL IN CONFIDENCE
Figure B 59 Contour plot showing the unweighted SPLpeak and SELss
impact ranges for TTS/fleeing response and avoidance in harbour porpoise from Lucke et al. (2009) at Creyke Beck B, location ID6 for
installing a monopile using a maximum blow energy of 3600 kJ
Figure B 60 Contour plot showing the unweighted SPLpeak and SELss
impact ranges for TTS/fleeing response and avoidance in harbour porpoise from Lucke et al. (2009) at Creyke Beck B, location ID6 for
installing a monopile using a maximum blow energy of 4000 kJ
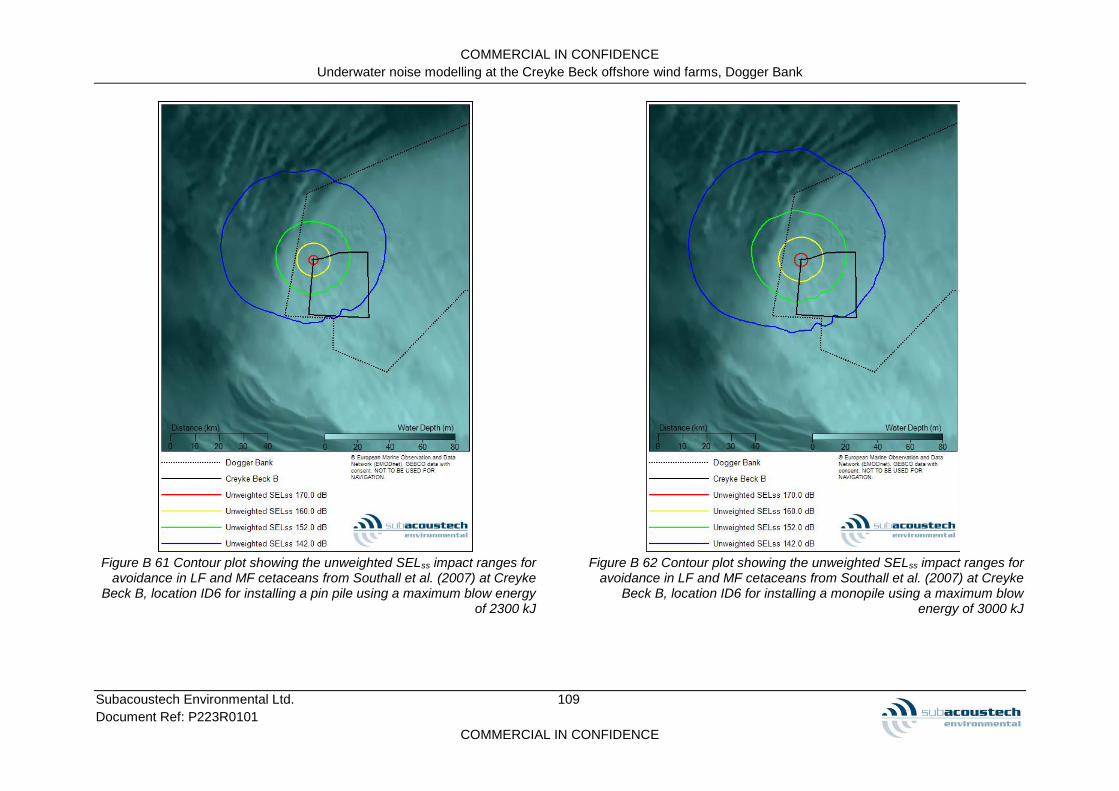
COMMERCIAL IN CONFIDENCE
Underwater noise modelling at the Creyke Beck offshore wind farms, Dogger Bank
Subacoustech Environmental Ltd. 109
Document Ref: P223R0101
COMMERCIAL IN CONFIDENCE
Figure B 61 Contour plot showing the unweighted SELss impact ranges for
avoidance in LF and MF cetaceans from Southall et al. (2007) at Creyke Beck B, location ID6 for installing a pin pile using a maximum blow energy
of 2300 kJ
Figure B 62 Contour plot showing the unweighted SELss impact ranges for
avoidance in LF and MF cetaceans from Southall et al. (2007) at Creyke Beck B, location ID6 for installing a monopile using a maximum blow
energy of 3000 kJ

COMMERCIAL IN CONFIDENCE
Underwater noise modelling at the Creyke Beck offshore wind farms, Dogger Bank
Subacoustech Environmental Ltd. 110
Document Ref: P223R0101
COMMERCIAL IN CONFIDENCE
Figure B 63 Contour plot showing the unweighted SELss impact ranges for
avoidance in LF and MF cetaceans from Southall et al. (2007) at Creyke Beck B, location ID6 for installing a monopile using a maximum blow
energy of 3600 kJ
Figure B 64 Contour plot showing the unweighted SELss impact ranges for
avoidance in LF and MF cetaceans from Southall et al. (2007) at Creyke Beck B, location ID6 for installing a monopile using a maximum blow
energy of 4000 kJ

COMMERCIAL IN CONFIDENCE
Underwater noise modelling at the Creyke Beck offshore wind farms, Dogger Bank
Subacoustech Environmental Ltd. 111
Document Ref: P223R0101
COMMERCIAL IN CONFIDENCE
Figure B 65 Contour plot showing the unweighted SPLpeak impact ranges
for avoidance in species of fish at Creyke Beck B, location ID6 for installing a pin pile using a maximum blow energy of 2300 kJ
Figure B 66 Contour plot showing the unweighted SPLpeak impact ranges
for avoidance in species of fish at Creyke Beck B, location ID6 for installing a monopile using a maximum blow energy of 3000 kJ

COMMERCIAL IN CONFIDENCE
Underwater noise modelling at the Creyke Beck offshore wind farms, Dogger Bank
Subacoustech Environmental Ltd. 112
Document Ref: P223R0101
COMMERCIAL IN CONFIDENCE
Figure B 67 Contour plot showing the unweighted SPLpeak impact ranges
for avoidance in species of fish at Creyke Beck B, location ID6 for installing a monopile using a maximum blow energy of 3600 kJ
Figure B 68 Contour plot showing the unweighted SPLpeak impact ranges
for avoidance in species of fish at Creyke Beck B, location ID6 for installing a monopile using a maximum blow energy of 4000 kJ

COMMERCIAL IN CONFIDENCE
Underwater noise modelling at the Creyke Beck offshore wind farms, Dogger Bank
Subacoustech Environmental Ltd. 113
Document Ref: P223R0101
COMMERCIAL IN CONFIDENCE
NMFS (2016) contour plots
Figure B 69 Contour plot showing the weighted SELcum impact ranges for
TTS in LF cetaceans from NMFS (2016) at Creyke Beck B, location ID6 for installing a pin pile using a maximum blow energy of 2300 kJ for the three ramp-up scenarios (scenario 1 = green, scenario 2 = yellow, scenario 3 =
red)
Figure B 70 Contour plot showing the weighted SELcum impact ranges for
TTS in LF cetaceans from NMFS (2016) at Creyke Beck B, location ID6 for installing a monopile using a maximum blow energy of 3000 kJ for the
three ramp-up scenarios (scenario 1 = green, scenario 2 = yellow, scenario 3 = red)

COMMERCIAL IN CONFIDENCE
Underwater noise modelling at the Creyke Beck offshore wind farms, Dogger Bank
Subacoustech Environmental Ltd. 114
Document Ref: P223R0101
COMMERCIAL IN CONFIDENCE
Figure B 71 Contour plot showing the weighted SELcum impact ranges for
TTS in LF cetaceans from NMFS (2016) at Creyke Beck B, location ID6 for installing a monopile using a maximum blow energy of 3600 kJ for the
three ramp-up scenarios (scenario 1 = green, scenario 2 = yellow, scenario 3 = red)
Figure B 72 Contour plot showing the weighted SELcum impact ranges for
TTS in LF cetaceans from NMFS (2016) at Creyke Beck B, location ID6 for installing a monopile using a maximum blow energy of 4000 kJ for the
three ramp-up scenarios (scenario 1 = green, scenario 2 = yellow, scenario 3 = red)

COMMERCIAL IN CONFIDENCE
Underwater noise modelling at the Creyke Beck offshore wind farms, Dogger Bank
Subacoustech Environmental Ltd. 115
Document Ref: P223R0101
COMMERCIAL IN CONFIDENCE
Figure B 73 Contour plot showing the weighted SELcum impact ranges for TTS in HF cetaceans from NMFS (2016) at Creyke Beck B, location ID6 for installing a pin pile using a maximum blow energy of 2300 kJ for the
three ramp-up scenarios (scenario 1 = green, scenario 2 = yellow, scenario 3 = red)
Figure B 74 Contour plot showing the weighted SELcum impact ranges for TTS in HF cetaceans from NMFS (2016) at Creyke Beck B, location ID6
for installing a monopile using a maximum blow energy of 3000 kJ for the three ramp-up scenarios (scenario 1 = green, scenario 2 = yellow,
scenario 3 = red)

COMMERCIAL IN CONFIDENCE
Underwater noise modelling at the Creyke Beck offshore wind farms, Dogger Bank
Subacoustech Environmental Ltd. 116
Document Ref: P223R0101
COMMERCIAL IN CONFIDENCE
Figure B 75 Contour plot showing the weighted SELcum impact ranges for TTS in HF cetaceans from NMFS (2016) at Creyke Beck B, location ID6
for installing a monopile using a maximum blow energy of 3600 kJ for the three ramp-up scenarios (scenario 1 = green, scenario 2 = yellow,
scenario 3 = red)
Figure B 76 Contour plot showing the weighted SELcum impact ranges for TTS in HF cetaceans from NMFS (2016) at Creyke Beck B, location ID6
for installing a monopile using a maximum blow energy of 4000 kJ for the three ramp-up scenarios (scenario 1 = green, scenario 2 = yellow,
scenario 3 = red)

COMMERCIAL IN CONFIDENCE
Underwater noise modelling at the Creyke Beck offshore wind farms, Dogger Bank
Subacoustech Environmental Ltd. 117
Document Ref: P223R0101
COMMERCIAL IN CONFIDENCE
Figure B 77 Contour plot showing the weighted SELcum impact ranges for
TTS in phocid pinnipeds from NMFS (2016) at Creyke Beck B, location ID6 for installing a pin pile using a maximum blow energy of 2300 kJ for the
three ramp-up scenarios (scenario 1 = green, scenario 2 = yellow, scenario 3 = red)
Figure B 78 Contour plot showing the weighted SELcum impact ranges for
TTS in phocid pinnipeds from NMFS (2016) at Creyke Beck B, location ID6 for installing a monopile using a maximum blow energy of 3000 kJ for the
three ramp-up scenarios (scenario 1 = green, scenario 2 = yellow, scenario 3 = red)

COMMERCIAL IN CONFIDENCE
Underwater noise modelling at the Creyke Beck offshore wind farms, Dogger Bank
Subacoustech Environmental Ltd. 118
Document Ref: P223R0101
COMMERCIAL IN CONFIDENCE
Figure B 79 Contour plot showing the weighted SELcum impact ranges for
TTS in phocid pinnipeds from NMFS (2016) at Creyke Beck B, location ID6 for installing a monopile using a maximum blow energy of 3600 kJ for the
three ramp-up scenarios (scenario 1 = green, scenario 2 = yellow, scenario 3 = red)
Figure B 80 Contour plot showing the weighted SELcum impact ranges for
TTS in phocid pinnipeds from NMFS (2016) at Creyke Beck B, location ID6 for installing a monopile using a maximum blow energy of 4000 kJ for the
three ramp-up scenarios (scenario 1 = green, scenario 2 = yellow, scenario 3 = red)

COMMERCIAL IN CONFIDENCE
Underwater noise modelling at the Creyke Beck offshore wind farms, Dogger Bank
Subacoustech Environmental Ltd. 119
Document Ref: P223R0101
COMMERCIAL IN CONFIDENCE
Popper et al. (2014) contour plots
Figure B 81 Contour plot showing the unweighted SELcum impact ranges
for TTS in species of fish from Popper et al. (2014) at Creyke Beck B, location ID6 for installing a pin pile using a maximum blow energy of
2300 kJ for the three ramp-up scenarios (scenario 1 = green, scenario 2 = yellow, scenario 3 = red)
Figure B 82 Contour plot showing the unweighted SELcum impact ranges
for TTS in species of fish from Popper et al. (2014) at Creyke Beck B, location ID6 for installing a monopile using a maximum blow energy of
3000 kJ for the three ramp-up scenarios (scenario 1 = green, scenario 2 = yellow, scenario 3 = red)

COMMERCIAL IN CONFIDENCE
Underwater noise modelling at the Creyke Beck offshore wind farms, Dogger Bank
Subacoustech Environmental Ltd. 120
Document Ref: P223R0101
COMMERCIAL IN CONFIDENCE
Figure B 83 Contour plot showing the unweighted SELcum impact ranges
for TTS in species of fish from Popper et al. (2014) at Creyke Beck B, location ID6 for installing a monopile using a maximum blow energy of
3600 kJ for the three ramp-up scenarios (scenario 1 = green, scenario 2 = yellow, scenario 3 = red)
Figure B 84 Contour plot showing the unweighted SELcum impact ranges
for TTS in species of fish from Popper et al. (2014) at Creyke Beck B, location ID6 for installing a monopile using a maximum blow energy of
4000 kJ for the three ramp-up scenarios (scenario 1 = green, scenario 2 = yellow, scenario 3 = red)

COMMERCIAL IN CONFIDENCE
Underwater noise modelling at the Creyke Beck offshore wind farms, Dogger Bank
Subacoustech Environmental Ltd. 121
Document Ref: P223R0101
COMMERCIAL IN CONFIDENCE
B.4 Creyke Beck B, location ID13
Previously considered criteria contour plots
Figure B 85 Contour plot showing the unweighted SPLpeak and SELss
impact ranges for TTS/fleeing response and avoidance in harbour porpoise from Lucke et al. (2009) at Creyke Beck B, location ID13 for
installing a pin pile using a maximum blow energy of 2300 kJ
Figure B 86 Contour plot showing the unweighted SPLpeak and SELss
impact ranges for TTS/fleeing response and avoidance in harbour porpoise from Lucke et al. (2009) at Creyke Beck B, location ID13 for
installing a monopile using a maximum blow energy of 3000 kJ

COMMERCIAL IN CONFIDENCE
Underwater noise modelling at the Creyke Beck offshore wind farms, Dogger Bank
Subacoustech Environmental Ltd. 122
Document Ref: P223R0101
COMMERCIAL IN CONFIDENCE
Figure B 87 Contour plot showing the unweighted SPLpeak and SELss
impact ranges for TTS/fleeing response and avoidance in harbour porpoise from Lucke et al. (2009) at Creyke Beck B, location ID13 for
installing a monopile using a maximum blow energy of 3600 kJ
Figure B 88 Contour plot showing the unweighted SPLpeak and SELss
impact ranges for TTS/fleeing response and avoidance in harbour porpoise from Lucke et al. (2009) at Creyke Beck B, location ID13 for
installing a monopile using a maximum blow energy of 4000 kJ

COMMERCIAL IN CONFIDENCE
Underwater noise modelling at the Creyke Beck offshore wind farms, Dogger Bank
Subacoustech Environmental Ltd. 123
Document Ref: P223R0101
COMMERCIAL IN CONFIDENCE
Figure B 89 Contour plot showing the unweighted SELss impact ranges for
avoidance in LF and MF cetaceans from Southall et al. (2007) at Creyke Beck B, location ID13 for installing a pin pile using a maximum blow
energy of 2300 kJ
Figure B 90 Contour plot showing the unweighted SELss impact ranges for
avoidance in LF and MF cetaceans from Southall et al. (2007) at Creyke Beck B, location ID13 for installing a monopile using a maximum blow
energy of 3000 kJ

COMMERCIAL IN CONFIDENCE
Underwater noise modelling at the Creyke Beck offshore wind farms, Dogger Bank
Subacoustech Environmental Ltd. 124
Document Ref: P223R0101
COMMERCIAL IN CONFIDENCE
Figure B 91 Contour plot showing the unweighted SELss impact ranges for
avoidance in LF and MF cetaceans from Southall et al. (2007) at Creyke Beck B, location ID13 for installing a monopile using a maximum blow
energy of 3600 kJ
Figure B 92 Contour plot showing the unweighted SELss impact ranges for
avoidance in LF and MF cetaceans from Southall et al. (2007) at Creyke Beck B, location ID13 for installing a monopile using a maximum blow
energy of 4000 kJ

COMMERCIAL IN CONFIDENCE
Underwater noise modelling at the Creyke Beck offshore wind farms, Dogger Bank
Subacoustech Environmental Ltd. 125
Document Ref: P223R0101
COMMERCIAL IN CONFIDENCE
Figure B 93 Contour plot showing the unweighted SPLpeak impact ranges
for avoidance in species of fish at Creyke Beck B, location ID13 for installing a pin pile using a maximum blow energy of 2300 kJ
Figure B 94 Contour plot showing the unweighted SPLpeak impact ranges
for avoidance in species of fish at Creyke Beck B, location ID13 for installing a monopile using a maximum blow energy of 3000 kJ

COMMERCIAL IN CONFIDENCE
Underwater noise modelling at the Creyke Beck offshore wind farms, Dogger Bank
Subacoustech Environmental Ltd. 126
Document Ref: P223R0101
COMMERCIAL IN CONFIDENCE
Figure B 95 Contour plot showing the unweighted SPLpeak impact ranges
for avoidance in species of fish at Creyke Beck B, location ID13 for installing a monopile using a maximum blow energy of 3600 kJ
Figure B 96 Contour plot showing the unweighted SPLpeak impact ranges
for avoidance in species of fish at Creyke Beck B, location ID13 for installing a monopile using a maximum blow energy of 4000 kJ

COMMERCIAL IN CONFIDENCE
Underwater noise modelling at the Creyke Beck offshore wind farms, Dogger Bank
Subacoustech Environmental Ltd. 127
Document Ref: P223R0101
COMMERCIAL IN CONFIDENCE
NMFS (2016) contour plots
Figure B 97 Contour plot showing the weighted SELcum impact ranges for TTS in LF cetaceans from NMFS (2016) at Creyke Beck B, location ID13
for installing a pin pile using a maximum blow energy of 2300 kJ for the three ramp-up scenarios (scenario 1 = green, scenario 2 = yellow,
scenario 3 = red)
Figure B 98 Contour plot showing the weighted SELcum impact ranges for TTS in LF cetaceans from NMFS (2016) at Creyke Beck B, location ID13 for installing a monopile using a maximum blow energy of 3000 kJ for the
three ramp-up scenarios (scenario 1 = green, scenario 2 = yellow, scenario 3 = red)

COMMERCIAL IN CONFIDENCE
Underwater noise modelling at the Creyke Beck offshore wind farms, Dogger Bank
Subacoustech Environmental Ltd. 128
Document Ref: P223R0101
COMMERCIAL IN CONFIDENCE
Figure B 99 Contour plot showing the weighted SELcum impact ranges for TTS in LF cetaceans from NMFS (2016) at Creyke Beck B, location ID13 for installing a monopile using a maximum blow energy of 3600 kJ for the
three ramp-up scenarios (scenario 1 = green, scenario 2 = yellow, scenario 3 = red)
Figure B 100 Contour plot showing the weighted SELcum impact ranges for
TTS in LF cetaceans from NMFS (2016) at Creyke Beck B, location ID13 for installing a monopile using a maximum blow energy of 4000 kJ for the
three ramp-up scenarios (scenario 1 = green, scenario 2 = yellow, scenario 3 = red)
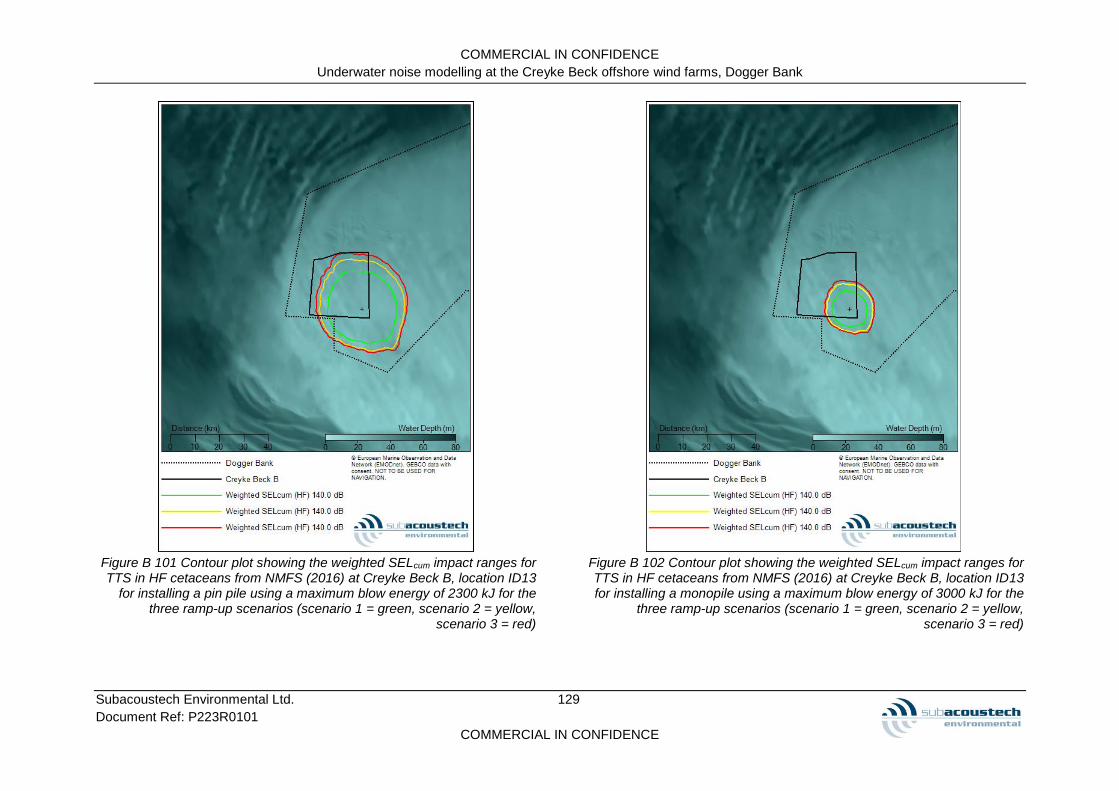
COMMERCIAL IN CONFIDENCE
Underwater noise modelling at the Creyke Beck offshore wind farms, Dogger Bank
Subacoustech Environmental Ltd. 129
Document Ref: P223R0101
COMMERCIAL IN CONFIDENCE
Figure B 101 Contour plot showing the weighted SELcum impact ranges for TTS in HF cetaceans from NMFS (2016) at Creyke Beck B, location ID13
for installing a pin pile using a maximum blow energy of 2300 kJ for the three ramp-up scenarios (scenario 1 = green, scenario 2 = yellow,
scenario 3 = red)
Figure B 102 Contour plot showing the weighted SELcum impact ranges for TTS in HF cetaceans from NMFS (2016) at Creyke Beck B, location ID13 for installing a monopile using a maximum blow energy of 3000 kJ for the
three ramp-up scenarios (scenario 1 = green, scenario 2 = yellow, scenario 3 = red)

COMMERCIAL IN CONFIDENCE
Underwater noise modelling at the Creyke Beck offshore wind farms, Dogger Bank
Subacoustech Environmental Ltd. 130
Document Ref: P223R0101
COMMERCIAL IN CONFIDENCE
Figure B 103 Contour plot showing the weighted SELcum impact ranges for TTS in HF cetaceans from NMFS (2016) at Creyke Beck B, location ID13 for installing a monopile using a maximum blow energy of 3600 kJ for the
three ramp-up scenarios (scenario 1 = green, scenario 2 = yellow, scenario 3 = red)
Figure B 104 Contour plot showing the weighted SELcum impact ranges for TTS in HF cetaceans from NMFS (2016) at Creyke Beck B, location ID13 for installing a monopile using a maximum blow energy of 4000 kJ for the
three ramp-up scenarios (scenario 1 = green, scenario 2 = yellow, scenario 3 = red)

COMMERCIAL IN CONFIDENCE
Underwater noise modelling at the Creyke Beck offshore wind farms, Dogger Bank
Subacoustech Environmental Ltd. 131
Document Ref: P223R0101
COMMERCIAL IN CONFIDENCE
Figure B 105 Contour plot showing the weighted SELcum impact ranges for
TTS in phocid pinnipeds from NMFS (2016) at Creyke Beck B, location ID13 for installing a pin pile using a maximum blow energy of 2300 kJ for
the three ramp-up scenarios (scenario 1 = green, scenario 2 = yellow, scenario 3 = red)
Figure B 106 Contour plot showing the weighted SELcum impact ranges for
TTS in phocid pinnipeds from NMFS (2016) at Creyke Beck B, location ID13 for installing a monopile using a maximum blow energy of 3000 kJ for
the three ramp-up scenarios (scenario 1 = green, scenario 2 = yellow, scenario 3 = red)
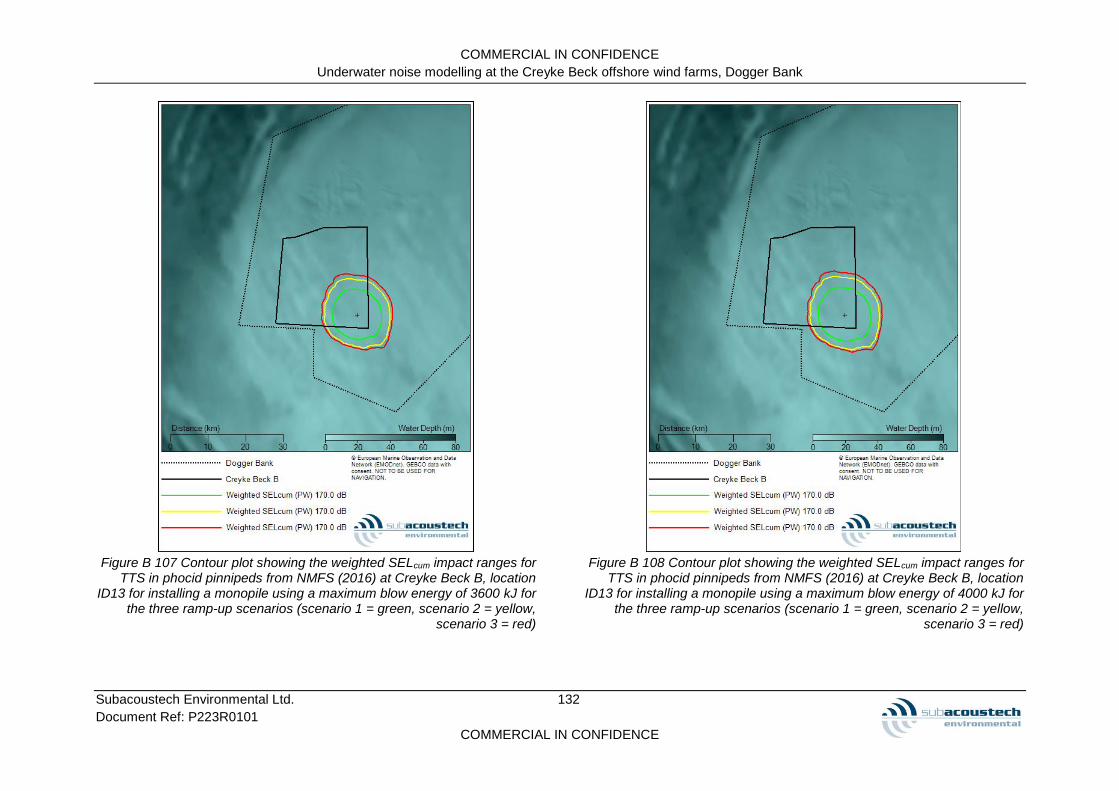
COMMERCIAL IN CONFIDENCE
Underwater noise modelling at the Creyke Beck offshore wind farms, Dogger Bank
Subacoustech Environmental Ltd. 132
Document Ref: P223R0101
COMMERCIAL IN CONFIDENCE
Figure B 107 Contour plot showing the weighted SELcum impact ranges for
TTS in phocid pinnipeds from NMFS (2016) at Creyke Beck B, location ID13 for installing a monopile using a maximum blow energy of 3600 kJ for
the three ramp-up scenarios (scenario 1 = green, scenario 2 = yellow, scenario 3 = red)
Figure B 108 Contour plot showing the weighted SELcum impact ranges for
TTS in phocid pinnipeds from NMFS (2016) at Creyke Beck B, location ID13 for installing a monopile using a maximum blow energy of 4000 kJ for
the three ramp-up scenarios (scenario 1 = green, scenario 2 = yellow, scenario 3 = red)

COMMERCIAL IN CONFIDENCE
Underwater noise modelling at the Creyke Beck offshore wind farms, Dogger Bank
Subacoustech Environmental Ltd. 133
Document Ref: P223R0101
COMMERCIAL IN CONFIDENCE
Popper et al. (2014) contour plots
Figure B 109 Contour plot showing the unweighted SELcum impact ranges
for TTS in species of fish from Popper et al. (2014) at Creyke Beck B, location ID13 for installing a pin pile using a maximum blow energy of
2300 kJ for the three ramp-up scenarios (scenario 1 = green, scenario 2 = yellow, scenario 3 = red)
Figure B 110 Contour plot showing the unweighted SELcum impact ranges for TTS in species of fish from Popper et al. (2014) at Creyke Beck B,
location ID13 for installing a monopile using a maximum blow energy of 3000 kJ for the three ramp-up scenarios (scenario 1 = green, scenario 2 =
yellow, scenario 3 = red)

COMMERCIAL IN CONFIDENCE
Underwater noise modelling at the Creyke Beck offshore wind farms, Dogger Bank
Subacoustech Environmental Ltd. 134
Document Ref: P223R0101
COMMERCIAL IN CONFIDENCE
Figure B 111 Contour plot showing the unweighted SELcum impact ranges
for TTS in species of fish from Popper et al. (2014) at Creyke Beck B, location ID13 for installing a monopile using a maximum blow energy of
3600 kJ for the three ramp-up scenarios (scenario 1 = green, scenario 2 = yellow, scenario 3 = red)
Figure B 112 Contour plot showing the unweighted SELcum impact ranges
for TTS in species of fish from Popper et al. (2014) at Creyke Beck B, location ID13 for installing a monopile using a maximum blow energy of
4000 kJ for the three ramp-up scenarios (scenario 1 = green, scenario 2 = yellow, scenario 3 = red)
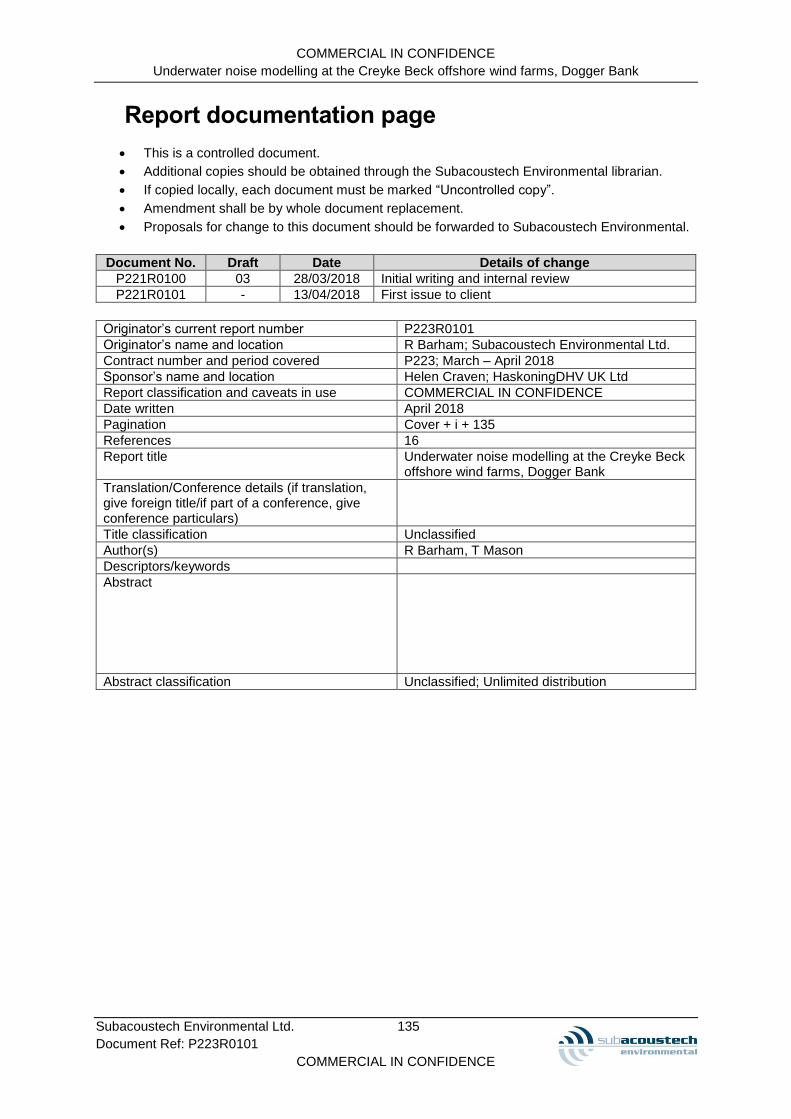
COMMERCIAL IN CONFIDENCE
Underwater noise modelling at the Creyke Beck offshore wind farms, Dogger Bank
Subacoustech Environmental Ltd. 135
Document Ref: P223R0101
COMMERCIAL IN CONFIDENCE
Report documentation page
• This is a controlled document.
• Additional copies should be obtained through the Subacoustech Environmental librarian.
• If copied locally, each document must be marked “Uncontrolled copy”.
• Amendment shall be by whole document replacement.
• Proposals for change to this document should be forwarded to Subacoustech Environmental.
Document No. Draft Date Details of change
P221R0100 03 28/03/2018 Initial writing and internal review
P221R0101 - 13/04/2018 First issue to client
Originator’s current report number P223R0101
Originator’s name and location R Barham; Subacoustech Environmental Ltd.
Contract number and period covered P223; March – April 2018
Sponsor’s name and location Helen Craven; HaskoningDHV UK Ltd
Report classification and caveats in use COMMERCIAL IN CONFIDENCE
Date written April 2018
Pagination Cover + i + 135
References 16
Report title Underwater noise modelling at the Creyke Beck offshore wind farms, Dogger Bank
Translation/Conference details (if translation, give foreign title/if part of a conference, give conference particulars)
Title classification Unclassified
Author(s) R Barham, T Mason
Descriptors/keywords
Abstract
Abstract classification Unclassified; Unlimited distribution