Underwater Acoustics including96)r.pdf · Energy, Energy Density,Power and Intensity (plane wave)...
96
Underwater Acoustics including Signal and Array Processing William A. Kuperman Scripps Institution of Oceanography of the University of California, San Diego [email protected] OUTLINE 0'! !#+ !,201'!0 0'! !#+ !,201'!0 /,-%1',+ &#,/4 +" ,"#)'+% ,'0# +1#/$#/#+!# #+0'1'3'14 #/+#) '%+)//4 -/,!#00'+% '*# #3#/0) !,201'!0 ,'0# /,'+% '%+)
Transcript of Underwater Acoustics including96)r.pdf · Energy, Energy Density,Power and Intensity (plane wave)...

Underwater Acoustics including Signal and Array Processing
William A. Kuperman
Scripps Institution of Oceanography of the University of California, San Diego
OUTLINE
�� ��0'!��!#�+��!,201'!0����� ��0'!��!#�+��!,201'!0������ �/,-�%�1',+��&#,/4��+"��,"#)'+%�� �,'0#�����+1#/$#/#+!#�� �#+0'1'3'14��#/+#)������������������������������������������������� �'%+�)��//�4�-/,!#00'+%��� �'*#��#3#/0�)��!,201'!0��� �,'0#������/, '+%��'%+�)��

Underwater Acoustics including Signal and Array Processing
�� ��0'!��!#�+��!,201'!0���• ��!(%/,2+"��2+'10��• �!#�+��+3'/,+*#+1�• �,2+"�'+�1&#��!#�+�• �--)'!�1',+0����������,*,%/�-&4���,**2+'!�1',+05�
�� ��0'!��!#�+��!,201'!0������ �/,-�%�1',+��&#,/4��+"��,"#)'+%�� �,'0#�����+1#/$#/#+!#�� �#+0'1'3'14��#/+#)��� �'%+�)��//�4�-/,!#00'+%��� �'*#��#3#/0�)��!,201'!0� � �,'0#������/, '+%��'%+�)��

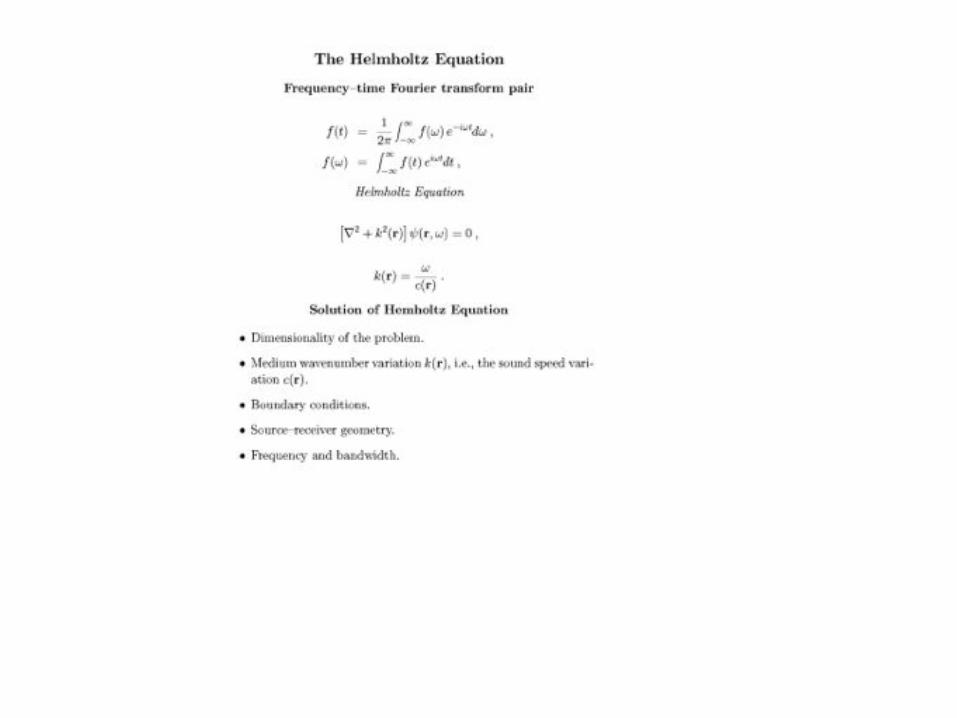
Helmholtz Equation
Let p(r,t) = p(r)e− iω t
Rectangular Coordinate: Plane Waves
Spherical Symmetry: Spherical Waves
p(x, y, z) ~ e± ik ⋅r
p(r) ~ e± ikr
r
With
And note that
is the equation of a plane and therefore a �surface of constant phase�
k

Energy, Energy Density,Power and Intensity (plane wave) Instantaneous Energy Density: E(t)=P.E. +K.E (Average) Energy Density: E Intensity, I, is average rate of flow of energy through a unit area normal to the direction of propagation Power is energy rate (e.g., watt) I ~ c X E X Area
= ρ0v2 =
p2
ρ0c2 =
pvc
= ρ0vrms2 =
prms2
ρ0c2 =
prmsvrmsc
= ρ0cvrms2 =
prms2
ρ0c= prmsvrms

GEOMETRIC SPREADING

UNITS DECIBEL (dB re_ ): 10 LOG (Intensity/Intensityref) = 20 LOG (Pressure/Pressureref)
Air: Pressureref = 20 µ Pa ( 1 Atmosphere = 194 dB = 105 Pa)
Water: Pressureref = µ Pa 20 LOG 20 = 26 dB ⇒ Same dB in air is higher pressure !!!!

Units cont�d Where do the intensity numbers come from? Intensity is flow of energy through a unit area = energy/
(time x area) Energy/time = power (e.g. watts) ⇒ Intensity units =>
Watts/m2
INTENSITY (plane wave) = P2
rms/(ρc)

Units cont�d ρcwater= 1.5 x 10⁶ kg/m2s and ρcair = ρcwater/3500
0 dB re µPa in water:
Intensity of µPa plane wave in water is = .67 x 10-18
watts/m2 Int of 20 µPa in air = 10-12 / .67 x 10-18 = 1.5 x 10⁶
Intensity of µPa in water
In dB: 61.7 dB which is (about) the same as 26 +10 Log 3500


Sound Speeds dB re 20µPaSPL�s in air:
More Numbers

ACOUSTICS IN THE OCEAN

GENERIC SOUND SPEED STRUCTURE

SOUND SPEED, SNELL�S LAW AND ATTENUATION

GLOBAL SOUND SPEED STRUCTURE

ATTENUATION OF SOUND IN SEAWATER (URICK)
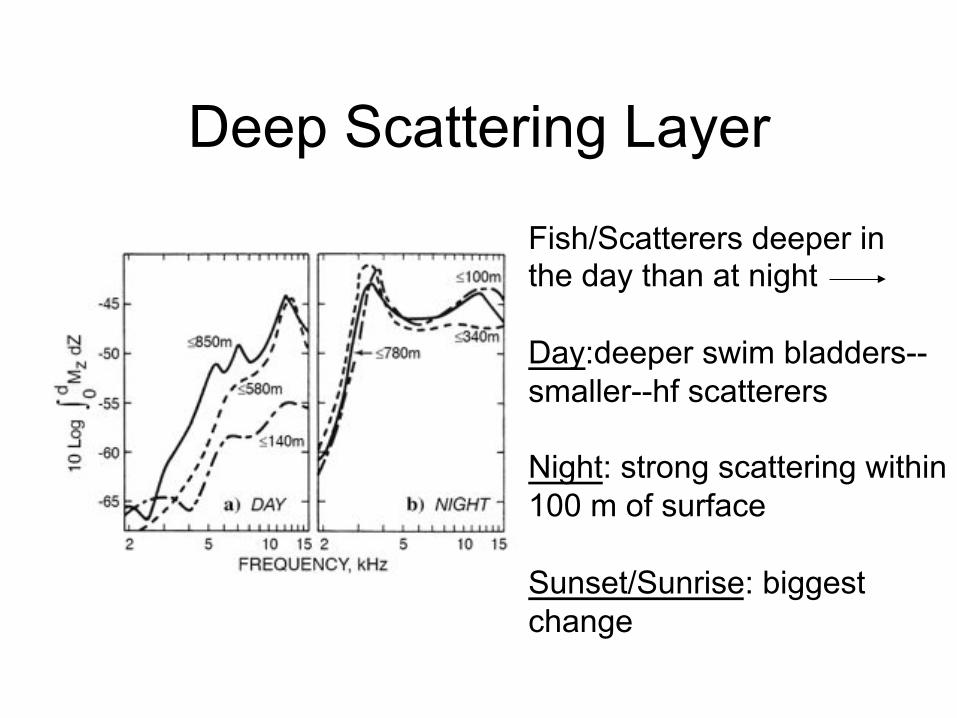
Deep Scattering Layer
Fish/Scatterers deeper in the day than at night Day:deeper swim bladders-- smaller--hf scatterers Night: strong scattering within 100 m of surface Sunset/Sunrise: biggest change

b.a.
BUBBLES
• Pop and make noise
• Have Resonances
• Bubbly media attenuate an incoming field by • Absorbtion • Scattering
• Bubbly media have lower sound speeds
Km = µKb + (1− µ)Kw →1Bm
= µ1Bb
+ (1− µ) 1Bw
Void fraction
Example: µ = .0001 and .001→ c = 930m / s and 370m / s

SNELL�S LAW:
SOUND LIKES LOW
SPEEDS

GLOBAL SOUND SPEED STRUCTURE

SCHEMATIC OF SOUND PROPAGATION PATHS

DEEP SOUND -CHANNEL PROPAGATION (NORWEGIAN SEA)

Range ~1000 miles
polar latitudes Mid latitudes
array
Typical mid-latitude sound speed profile
Typical northern sound speed profile
Radiated noise
Sea mountain or continental
shelf
Ray trapped in the Deep Sound Channel
(DSC)
Depth ~10000 ft
Layers of constant sound speed
C (m/s)!
Box 1!
Historical Underwater Acoustics

LLOYD MIRROR EFFECT

CONVERGENCE ZONE PROPAGATION (NORTH ATLANTIC)

SURFACE-DUCT PROPAGATION (NORWEGIAN SEA)

ARCTIC PROPAGATION

Sound propagation over a seamount

PROPAGATION OVER A SEAMOUNT
(NORTH PACIFIC) data: Chapman and Ebbeson

PROPAGATION IN A RANGE DEPENDENT ENVIRONMENT

! Sound Speed Profile!
! Pulse Shape !
! Propagation Model!� Normal Mode Methods " ORCA : Evan Westwood (1996) !
Propagation Modeling

TL 60
70
80
90 dB
Pressure (R = 60km, SD = 100m)

TL 70
80
90
100 dB
Pressure (R = 300km, SD = 100m)

SHALLOW WATER SOUND SPEED PROFILES

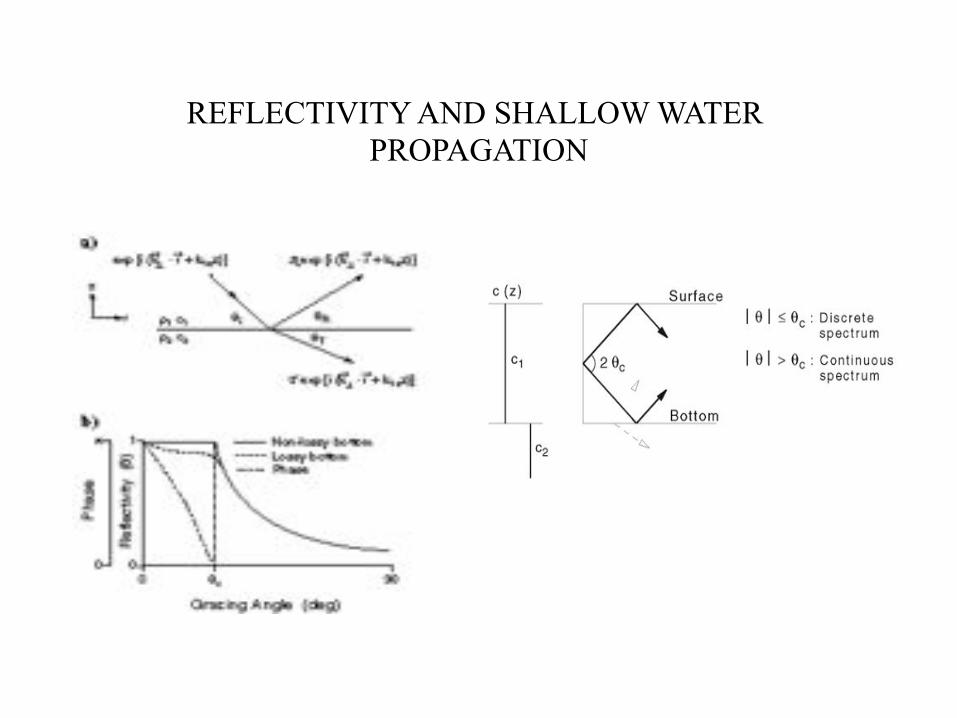
REFLECTIVITY AND SHALLOW WATER PROPAGATION

CONSTRUCTIVE INTERFERENCE: MODAL PROPAGATION
SHALLOW WATER PROPAGATION

θ1 θ2
θn
θc
a)
Box 2!
r
z
ρb,cb
cω% kr1 kr2 …
krn
b)

Mode Cutoff

SHALLOW-WATER PROPAGATION
(SUMMER, MEDITERRANEAN)

OPTIMUM FREQUENCY CURVES
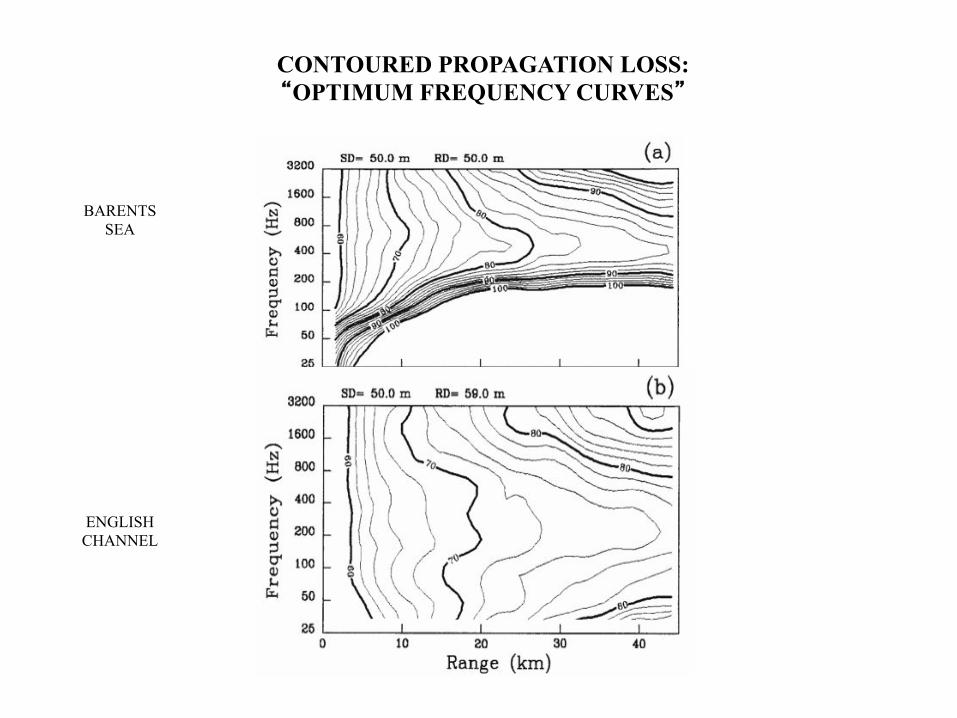
CONTOURED PROPAGATION LOSS: �OPTIMUM FREQUENCY CURVES�
BARENTS SEA
ENGLISH CHANNEL
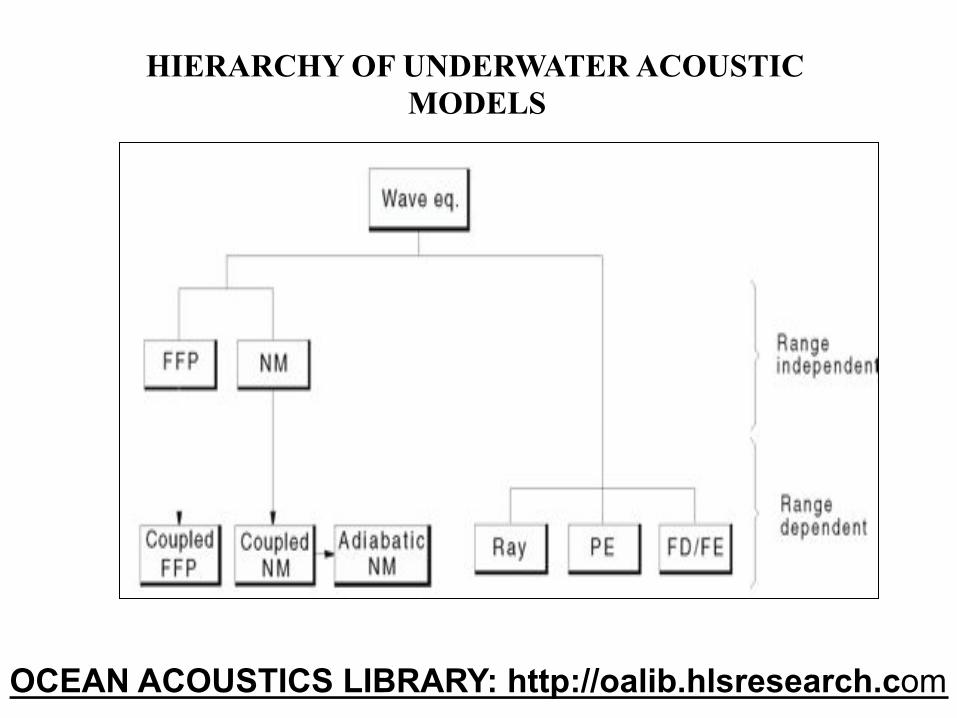
HIERARCHY OF UNDERWATER ACOUSTIC MODELS
OCEAN ACOUSTICS LIBRARY: http://oalib.hlsresearch.com

AMBIENT NOISE SPECTRA (WENZ)

Some Applications

SONAR

Underwater acoustic bottom mapping

Fish Finding
Display Includes Bottom

Problems Associated with Undersea Acoustic Communication
5.72 5.73 5.74 5.75 5.76 5.77 5.78 5.79 5.8 5.81 5.82-1
0
1
2.71 2.72 2.73 2.74 2.75 2.76 2.77 2.78 2.79 2.8 2.81-1
0
1
0.1 0.11 0.12 0.13 0.14 0.15 0.16 0.17 0.18 0.19 0.2-1
0
1
(a)
(b)
(c)Time (s)
Ampl
itude
(a.
u.)
Ampl
itude
(a.
u.)
Ampl
itude
(a.
u.)
Tranfer Function and Symbol Spread in Shallow Water
Fo=3500, 1 ms,r=10 km Depth 120m
Fo=6500, .5 ms,r=4km Depth 50m
Fo=15000, .1 ms,r=.16km Depth 12m
MUST deal with Intersymbol Interference (�ISI�)
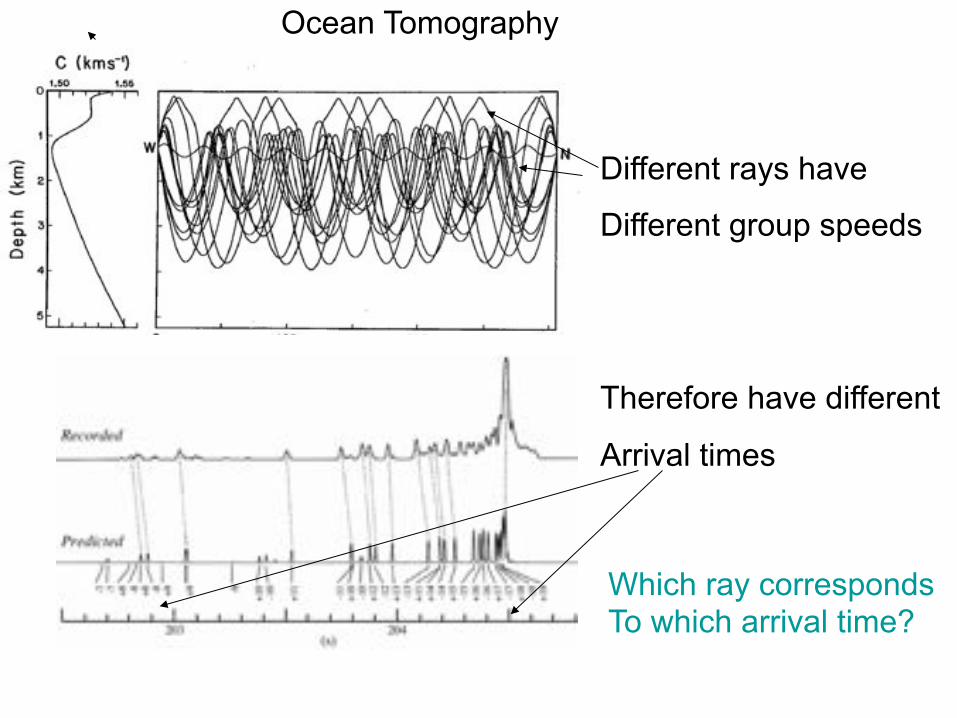
Ocean Tomography
Different rays have
Different group speeds
Therefore have different
Arrival times
Which ray corresponds To which arrival time?

Ships Underway Broadband Source Level (dB re 1 Pa at 1 m)
Tug and Barge (18 km/hour) 171 Supply Ship (example: Kigoriak) 181
Large Tanker 186 Icebreaking 193
Seismic Survey Broadband Source Level (dB re 1 Pa at 1 m )
Air gun array (32 guns) 259 (peak) Military Sonars Broadband Source Level
(dB re 1 Pa at 1 m ) AN/SQS-53C
(U. S. Navy tactical mid-frequency sonar, center frequencies 2.6 and 3.3 kHz)
235
AN/SQS-56 (U. S. Navy tactical mid-frequency sonar, center
frequencies 6.8 to 8.2 kHz)
223
SURTASS-LFA (100-500 Hz) 215 dB per projector, with up to 18 projectors in a vertical array operating
simultaneously Ocean Acoustic Studies Broadband Source Level
(dB re 1 Pa at 1 m ) Heard Island Feasibility Test (HIFT)
(Center frequency 57 Hz 206 dB for a single projector, with up to 5
projectors in a vertical array operating simultaneously
Acoustic Thermometry of Ocean Climate (ATOC)/North Pacific Acoustic Laboratory
(NPAL) (Center frequency 75 Hz)
195
Source Broadband Source Level (dB re 1 Pa at 1 m )
Sperm Whale Clicks 163-223 Beluga Whale Echolocation Click 206-225 (peak-to-peak) White-beaked Dolphin Echolocation Clicks 194-219 (peak-to-peak) Spinner Dolphin Pulse Bursts 108-115 Bottlenose Dolphin Whistles 125-173 Fin Whale Moans 155-186 Blue Whate Moans 155-188 Gray Whale Moans 142-185 Bowhead Whale Tonals, Moans and Song 128-189 Humpback Whale Song 144-174 Humpback Whale Fluke and Flipper Slap 183-192 Southern Right Whale Pulsive Call 172-187 Snapping Shrimp 183-189 (peak-to peak)
Man Made Sounds
Animal Sounds

QUESTIONS?

Underwater Acoustics including Signal and Array Processing
�� ��0'!��!#�+��!,201'!0��3#%2'"#��+3�/'�+1��� �/,-�%�1',+��&#,/4��+"��,"#)'+%�
• ��3#��.2�1',+���/##��-�!#����4#/#"�*#"'��• �-#!1/�)��#1&,"0�• �,/*�)��,"#0�• ��/� ,)'!��.2�1',+��#1&,"0�• ��40�
�� �,'0#�����+1#/$#/#+!#�� �'%+�)��//�4�-/,!#00'+%�� �#+0'1'3'14��#/+#)��� �'*#��#3#/0�)��!,201'!0��� �,'0#������/, '+%��'%+�)��


HIERARCHY OF UNDERWATER ACOUSTIC MODELS


GEOMETRIC SPREADING


SPECTRAL METHOD (FFP)
ONE LAYER ALL LAYERS
X
or Axisymmetric Geometry


Lloyd Mirror Example

Fluid-Fluid Interface

θc
REFLECTIVITY AND SHALLOW WATER PROPAGATION

CONSTRUCTIVE INTERFERENCE: MODAL PROPAGATION

θ1 θ2
θn
θc
a)
Box 2!
r
z
ρb,cb
cω% kr1 kr2 …
krn
b)


Transmission loss
km-kn

Bottom Attenuation

NON CONSTANT PROFILE Munk sound speed profile
COMING ATTRACTION

Ray equivalent of a mode
GROUP SLOWNESS (1/SPEED) ~ MODE WEIGHTED SSP SLOWNESS

Deep Ocean Propagation
MODAL/RAY GROUP SPEED—L/T

Non Model Based Processing
Or DATA BASED PROCESSING

Utilizing First Order Baseline Properties of Waveguide
Propagation
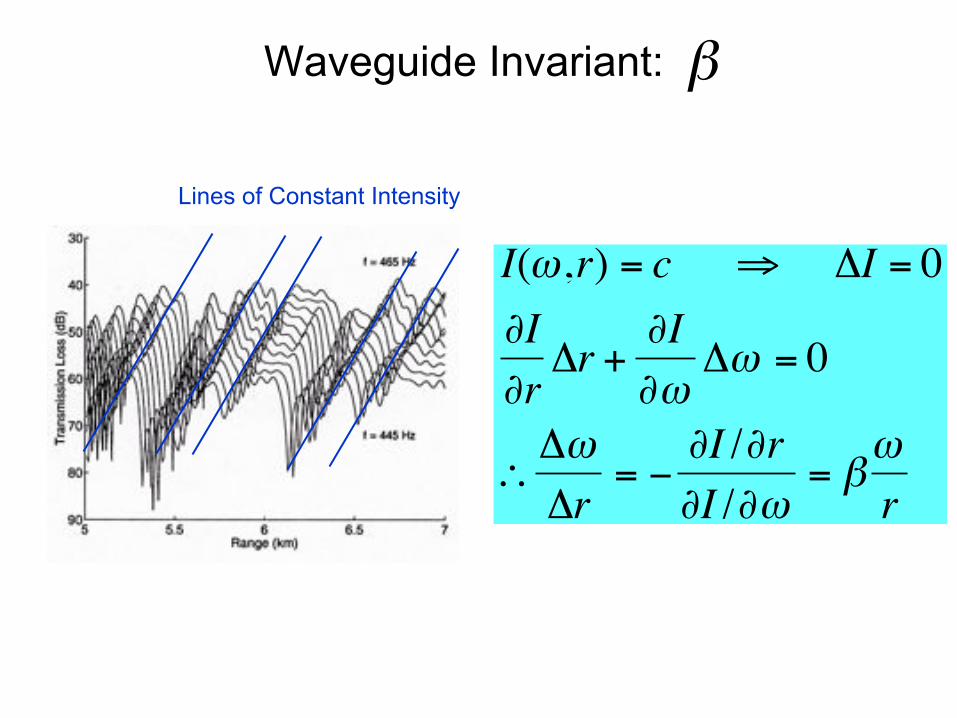
Group vs Phase Speed and Waveguide Invariant

Reminder: Phase and Group Speeds
• Our waveguide speeds are horizontal velocities • Phase speed is related to ray or mode angle
– Horizontal ray has phase speed of medium – Vertical Ray has infinite phase speed
• Refracting ray has phase speed of SSP at turning point • Group Speed of horizontal path is ~ speed of medium • Group Speed of Vertical path is zero • Group Speeds of rays are horizontal range/time • Group Speeds of modes are related to mode weighted
SSP slowness

k=ω/c(z) c
krm= ω/vmp
kzm(z)
θm
vmg=c cos θm
Remember triangles for Range Independent Env.:
• Modal wavenumbers • Modal phase speeds: vmp • Modal group speeds: vmg
Prop down the waveguide


SHALLOW WATER ARRIVALS (Bottom Reflected Paths) Lowest Mode-most direct Arrival comes in first. DEEP WATER ARRIVALS (Refracted Paths) Deep Refracted Arrivals come In before Deep Sounds Channel Axis Arrivals
€
I(ω,r) = c ⇒ ΔI = 0∂I∂rΔr +
∂I∂ω
Δω = 0
∴ΔωΔr
= −∂I /∂r∂I /∂ω
= βωr
Waveguide Invariant:
Lines of Constant Intensity
β

Spectrogram for shallow water data
1≅β

Simple Ranging in shallow water
Range along track
or array Δr
Δω
r
ω
ΔωΔr
= βωr
Note: a single receiver spectrogram has (t,f) not (r,f) axes One solution: use long, horizontal array that provides a measurement of Δr

1+=β
3−=β
Waveguide Invariant: ββ changes sign depending on the
environment
Burenkov, Sov. Phys. Ac., 1989

I(ω, r) = const ⇒ ΔI = 0∂I∂rΔr + ∂I
∂ωΔω = 0
∴ΔωΔr
= −∂I /∂r∂I /∂ω
= βωr
β −1 = −∂Sg∂Sp
= −vpvg
&
'((
)
*++
2∂vg∂vp
MACRO Properties of the Sound Field
Lines of Constant Intensity
βWaveguide Invariant: (Chuprov…)
REFLECTION Dominated

β > 0
β < 0
Waveguide Invariant β
Reflection
Refraction
~Slope of GP-GV curve

Phase and Group Speeds vs Path Types: SIMPLE RANGING
X
X Δ
u
Δt
~3430km (=3514 km)

GENERALIZED Waveguide Invariant Theory Pressure / Intensity Field
Waveguide Invariant Theory: Chuprov (1982), Grachev (1993), Weston (1971,1979),D’Spain & Kuperman (1999)
Stationary Phase Condition (Constant Intensity Lines : striation)
,)exp()( ∑=m
mm rikArP
,)cos()(,∑=nm
mnnm rkAArI Δ
,rkmnΔΦ ≡ 0=Δ
Δδ+
δ=Φδ
mn
mnkk
rr
0hh1
rr
=+−δ
βγ
ωδω
βδ
nmmn kk)c,h,(k −=ωΔ
21 −== γβ ,

Group Speed vs Phase Speed
1480 1500 1520 1540 1560 1580 16001380
1400
1420
1440
1460
1480
1500
Phase Speed (m/s)
Gro
up S
peed
(m/s
)
20 m
40 m
100 m1480 1500 m/s
1600 m/s
Idealized Summer Profile

Shallow Water Group Speed vs Phase Speed
WHERE THE ACTION IS - BUT FIRST:…
MODE # "

QUESTIONS?

CAN WE OVERCOME SINGLE SENSOR INVARIANT RESTRICTION
…THAT WE MEASURE A TIME DIFFERENCE
BUT NEED A RANGE DIFFERENCE

HOW DO WE DO… INVARIANT-BASED RANGE-
LOCALIZATION FROM A FREQUENCY-TIME SPECTROGRAM
Rakotonarivo, Kuperman,JASA,2012.