Gainesville Daily Sun. (Gainesville, Florida) 1907-04-13 ...
Understanding Your Collateral Risk
CUNA Members

• Founded in 1955 in Gainesville, GA
• Owned by The Hearst Corporation
•Business Media Division along with Fitch Ratings, Motor, etc.
• Independent Source with the most Timely updates and most Accurate values
• Over 3K lenders nationwide use Black Book as their Trusted Values in all
aspects of the life of a vehicle/vehicle loan
• We provide:
• Wholesale, Trade-In, Retail, Residual and Historical values updated
daily
• Used Car, New Car, Powersports, RV & Cars of Particular Interest
• Various delivery methods available
• Integration (flat file, portal, web service & API to look up multiple
vehicles at one time)
• Internet Suites (electronically look up values 1 at a time)
• Book Subscriptions (manually look up values 1 at a time)
• 31 of the top 40 auto finance providers use Black Book
About Black Book…..

Auto Finance News – Auto Exec Survey
Recent study shows auto executives consider collateral risk to be extremely important and comparable to credit risk for volatility.
3
1
4
2
Source: Auto Finance Risk Survey

2008 Models : Year Over Year Used Car Market
6 Months
12 Segments UP
Month-Over-Month
2 segments UP
Quarter
15 segments UP
Year-Over-Year
6 Segments UP
The used car market continues to be strong. But our in-the-market research and information is showing us that it is a critical time for lenders to start paying closer attention to vehicle value movements, not
only at the segment level but model by model as well.

Depreciation
Vehicle Values (and as a result LTVs) can change dramatically after origination and
DEPRECIATION CURVES VARY CONSIDERABLY between years/makes/models.
This results is an industry-wide difficulty in predicting and understanding loss severity/recovery
rates. Even within the same segment, depreciation rates after 1-year can vary dramatically.

Why should you refresh your Portfolio?
- Collateral Value Refreshes:
- Show how LTVs migrate from the time of origination to now
- Identify pockets of highest versus lowest collateral risk
- Show the future value (12, 24, 30, 36 up to 72 months) of each vehicle in the
portfolio
- Provide ancillary data on the portfolio like fuel mileage, vehicle
classification, etc.
- Help track the effects of other variables on LTV (Credit Score, Term, vehicle
segment, fuel economy, etc.)
- Lenders currently use refresh values to:
- Develop credit and collection models
- Forecast Loss and recovery rates
- Implement dealer management strategies
- Enhance collection strategies

Portfolio Management
What was the LTV at origination? What is the current LTV?
What will the LTV be in 12 months? 18 months? 24 months?
Clean
Wholesale
July 2011
LTV-
July
2011

Sample File
36%
DATA SOURCE
Lender Sample Total Records 5,000
Originations Period Jan 1, 2006 - Aug 31, 2011 Selection Criteria Random
Report Date October 1, 2011 Sample Size 5%
AVERAGES ACCOUNT AT HIGH RISK
Average Origination LTV 110% Low FICO (<660) 200 4.0%
Average Current LTV 120% Low BBR Score (<-50) 120 2.4%
Average BBR Score -50 High Current LTV (>140%) 170 3.4%
Average Origination FICO 710
LTV ANALYSIS
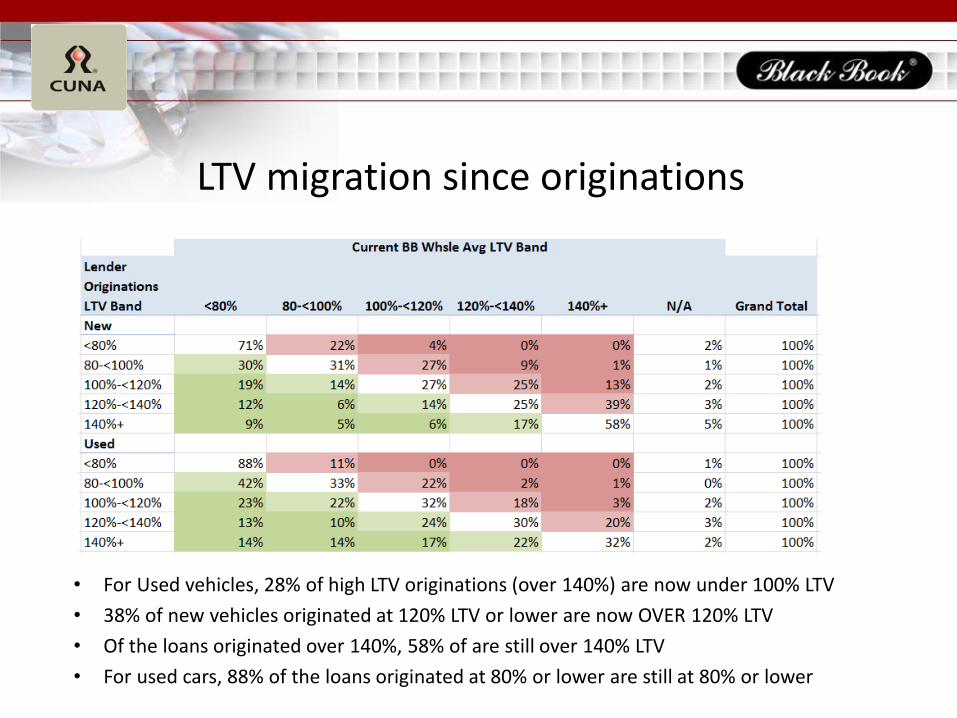
LTV migration since originations
• For Used vehicles, 28% of high LTV originations (over 140%) are now under 100% LTV
• 38% of new vehicles originated at 120% LTV or lower are now OVER 120% LTV
• Of the loans originated over 140%, 58% of are still over 140% LTV
• For used cars, 88% of the loans originated at 80% or lower are still at 80% or lower
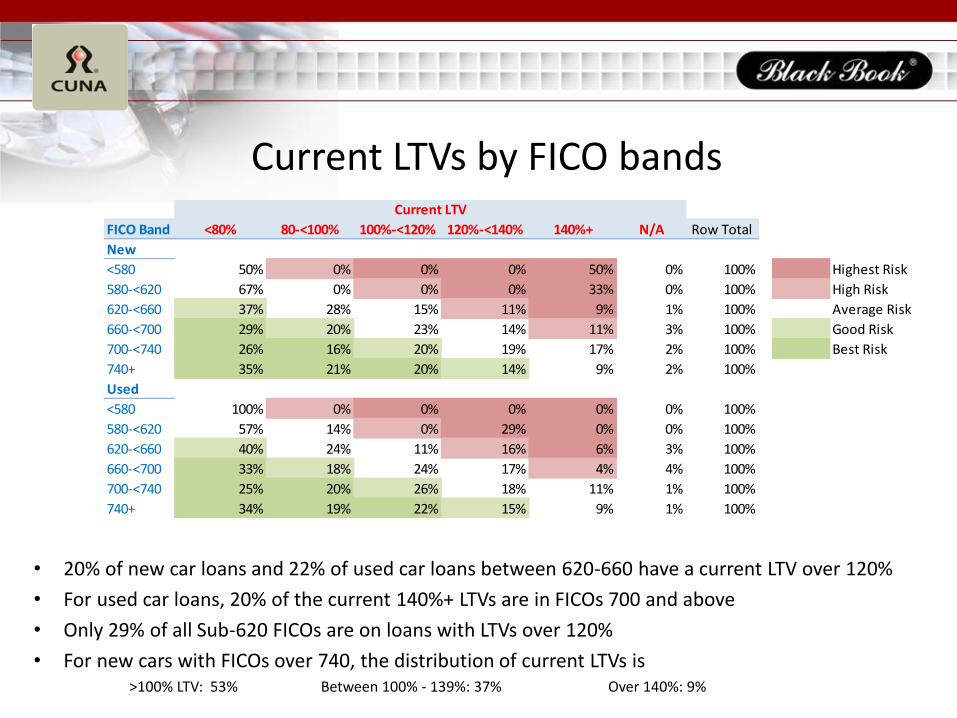
Current LTVs by FICO bands
• 20% of new car loans and 22% of used car loans between 620-660 have a current LTV over 120%
• For used car loans, 20% of the current 140%+ LTVs are in FICOs 700 and above
• Only 29% of all Sub-620 FICOs are on loans with LTVs over 120%
• For new cars with FICOs over 740, the distribution of current LTVs is >100% LTV: 53% Between 100% - 139%: 37% Over 140%: 9%
FICO Band <80% 80-<100% 100%-<120% 120%-<140% 140%+ N/A Row Total
New
<580 50% 0% 0% 0% 50% 0% 100% Highest Risk
580-<620 67% 0% 0% 0% 33% 0% 100% High Risk
620-<660 37% 28% 15% 11% 9% 1% 100% Average Risk
660-<700 29% 20% 23% 14% 11% 3% 100% Good Risk
700-<740 26% 16% 20% 19% 17% 2% 100% Best Risk
740+ 35% 21% 20% 14% 9% 2% 100%
Used
<580 100% 0% 0% 0% 0% 0% 100%
580-<620 57% 14% 0% 29% 0% 0% 100%
620-<660 40% 24% 11% 16% 6% 3% 100%
660-<700 33% 18% 24% 17% 4% 4% 100%
700-<740 25% 20% 26% 18% 11% 1% 100%
740+ 34% 19% 22% 15% 9% 1% 100%
Current LTV

LTV migration since originations
• For Used vehicles, 28% of high LTV originations (over 140%) are now under 100% LTV
• 38% of new vehicles originated at 120% LTV or lower are now OVER 120% LTV
• Of the loans originated over 140%, 58% of are still over 140% LTV
• For used cars, 88% of the loans originated at 80% or lower are still at 80% or lower
LTV at
Originations <80% 80-<100% 100%-<120% 120%-<140% 140%+ N/A Row Total
New<80% 71% 22% 4% 0% 0% 2% 100% Worst Migration
80-<100% 30% 31% 27% 9% 1% 1% 100% Worse Migration
100%-<120% 19% 14% 27% 25% 13% 2% 100% No Migration
120%-<140% 12% 6% 14% 25% 39% 3% 100% Better Migration
140%+ 9% 5% 6% 17% 58% 5% 100% Best Migration
Used
<80% 88% 11% 0% 0% 0% 1% 100%
80-<100% 42% 33% 22% 2% 1% 0% 100%
100%-<120% 23% 22% 32% 18% 3% 2% 100%
120%-<140% 13% 10% 24% 30% 20% 3% 100%
140%+ 14% 14% 17% 22% 32% 2% 100%
Current LTV
Introducing the Black Book Risk Score
The Black Book Risk Score takes a comprehensive look at a multitude
of micro, macro, historical, and projected factors to rank-order vehicles
with regard to their potential collateral risk, allowing lenders to better
understand their recovery rates and loss severity.

What Our Lenders Are Saying…
Head of Risk for Top 3 Auto Lender… “We’re great at predicting who is likely to default, but we suck at predicting the severity of loss
for those that go bad”
Almost every lender we meet with…. “Our recovery rates our great. That’s wonderful. But what about all this business we’re booking
using these sky-high vehicle values? When is the bubble going to pop?”

What is Collateral Risk? – What does it affect
It is the risk associated with:
• the retention of a vehicle’s value over the remaining balance during life of the loan
• the impact of dealer entered adds and deducts
• the likely condition (miles, wear and tear) of each vehicle at the time of sale at auction
It is influenced by several factors, including:
• historical and projected depreciation curves at the vehicle year, make, model and trim level
• the driving patterns and the maintenance of the typical owner for each vehicle
• inaccuracy propensity of the collateral details
• manufacturer - and model - related factors
• macro factors such as supply/demand, oil prices and economy
While BBR cannot tell you what your recovery rate will be, it does show a rank order that has
correlated with recovery rates by specific vehicles. This is a similar approach to credit models built by
FICO and others.

The Black Book Risk Score (BBR) • Through several discussions with the auto-lending community, Black Book identified a need to report
collateral risk inherent in auto lending at the vehicle level.
In 2008 there was a sharp drop in collateral value causing higher than expected losses
In 2009 a significant rebound occurred; the reaction from lenders varied considerably
Currently, vehicle values are at a historic high causing originators and portfolio managers concern about the risk this presents
Many lenders have very basic collateral risk assessments but acknowledge the need for more
• Validation files have shown the score quantifies and rank-orders the degree of collateral risk by vehicles down to the year/make/model/trim level.
Different vehicles have reacted very differently during the past 3 movements and this is a consistent observation going back decades
Predictive data elements have been modeled and turned into an easy to use -150 to 150 score
• Lender identified uses include: underwriting and pricing models; collections models, loss forecasting, dealer profitability and credit analyst performance.
Using collateral risk scores will enhance yields, portfolio quality and returns and assist with better
dealer management strategies.

Different Vehicles Depreciate Differently
There are many factors that affect depreciation curves; Black Book has historical depreciation curves to understand how changes in the economy, vehicle model and the market impact vehicles over time.

Available Data for Score Development
Black Book has extensive data on vehicles that includes:
• Historical (back to 1999) and current trends of vehicle values
• Forecasted residual value trends (12 months to 72 months)
• Auction vehicle and pricing data
• Auction survey data on vehicle conditions
• Manufacturer pricing data on options
• Number of VINs mapped to a vehicle
• Gas mileage efficiency by vehicle
• Fleet usage by vehicle
• Economic data (in partnership with our sister company Fitch Ratings)
Using the industry’s best data allows for the most informed decision-making regarding
underwriting, pricing, collections strategies and remarketing strategies
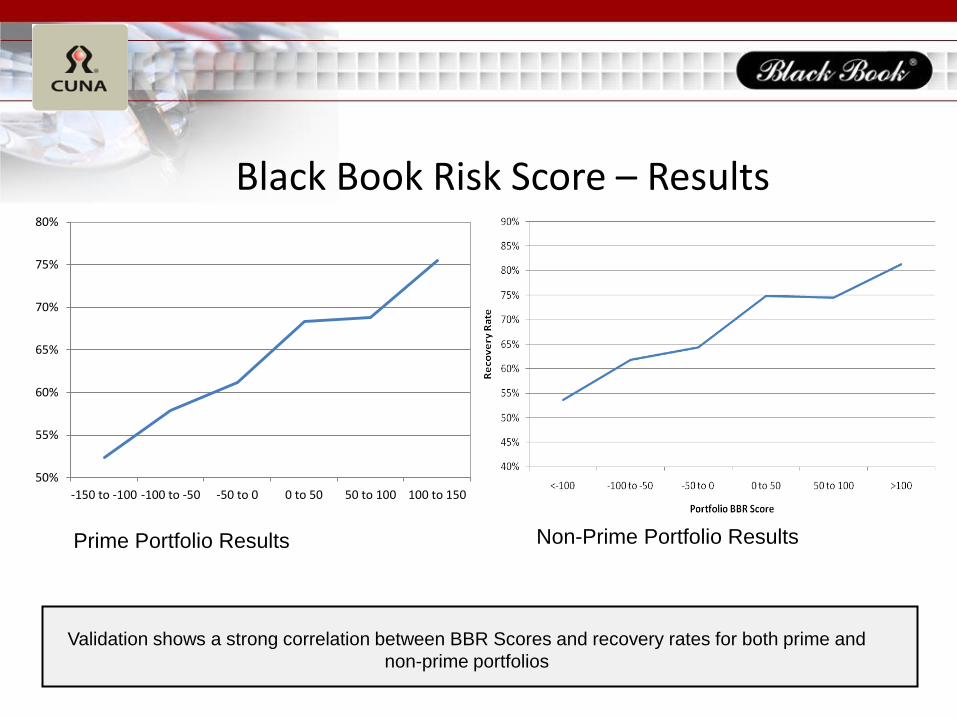
Black Book Risk Score – Results
50%
55%
60%
65%
70%
75%
80%
-150 to -100 -100 to -50 -50 to 0 0 to 50 50 to 100 100 to 150
Prime Portfolio Results Non-Prime Portfolio Results
Validation shows a strong correlation between BBR Scores and recovery rates for both prime and
non-prime portfolios
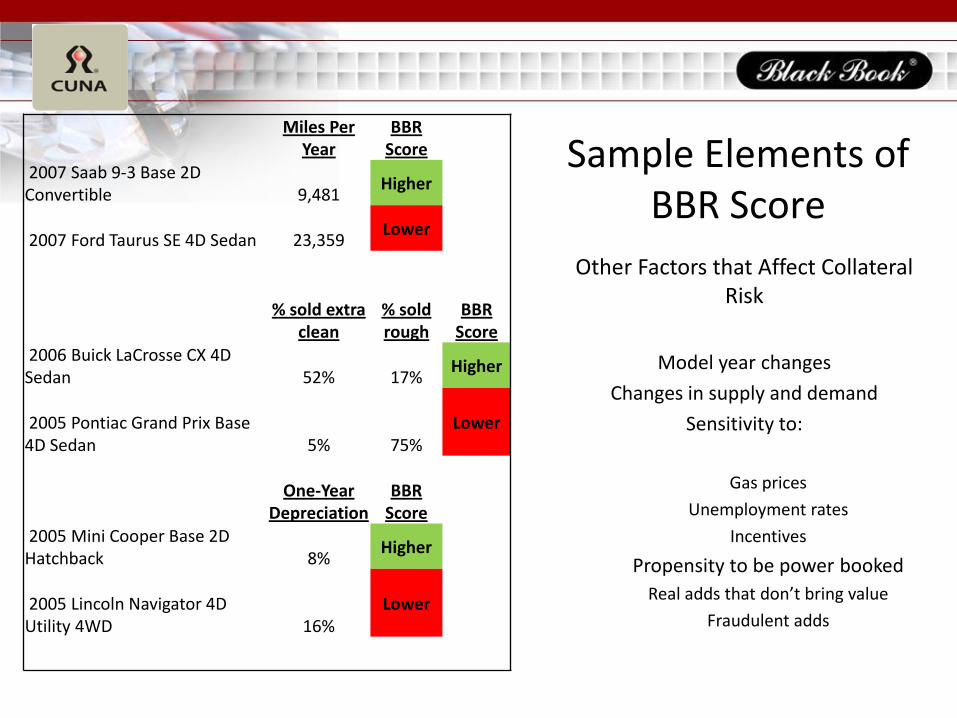
Sample Elements of BBR Score
Miles Per Year
BBR Score
2007 Saab 9-3 Base 2D Convertible
9,481
Higher
2007 Ford Taurus SE 4D Sedan
23,359
Lower
% sold extra
clean % sold rough
BBR Score
2006 Buick LaCrosse CX 4D Sedan 52% 17%
Higher
2005 Pontiac Grand Prix Base 4D Sedan 5% 75%
Lower
One-Year
Depreciation BBR
Score 2005 Mini Cooper Base 2D Hatchback 8%
Higher
2005 Lincoln Navigator 4D Utility 4WD 16%
Lower
Other Factors that Affect Collateral Risk
Model year changes
Changes in supply and demand
Sensitivity to:
Gas prices
Unemployment rates
Incentives
Propensity to be power booked
Real adds that don’t bring value
Fraudulent adds
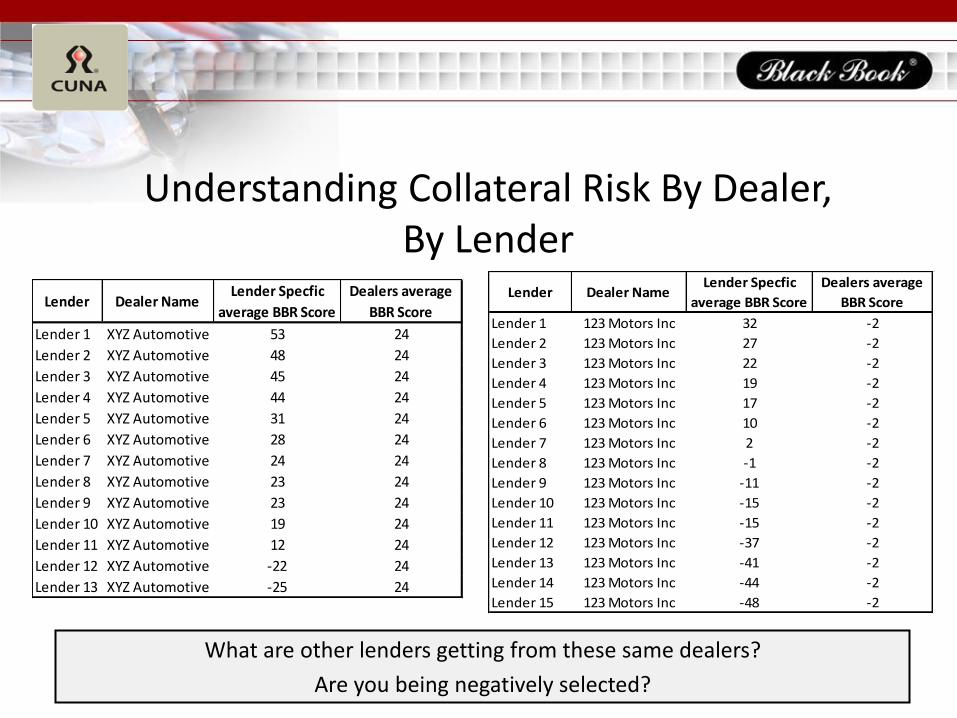
Understanding Collateral Risk By Dealer, By Lender
20
Lender Dealer NameLender Specfic
average BBR Score
Dealers average
BBR Score
Lender 1 XYZ Automotive 53 24
Lender 2 XYZ Automotive 48 24
Lender 3 XYZ Automotive 45 24
Lender 4 XYZ Automotive 44 24
Lender 5 XYZ Automotive 31 24
Lender 6 XYZ Automotive 28 24
Lender 7 XYZ Automotive 24 24
Lender 8 XYZ Automotive 23 24
Lender 9 XYZ Automotive 23 24
Lender 10 XYZ Automotive 19 24
Lender 11 XYZ Automotive 12 24
Lender 12 XYZ Automotive -22 24
Lender 13 XYZ Automotive -25 24
Lender Dealer NameLender Specfic
average BBR Score
Dealers average
BBR Score
Lender 1 123 Motors Inc 32 -2
Lender 2 123 Motors Inc 27 -2
Lender 3 123 Motors Inc 22 -2
Lender 4 123 Motors Inc 19 -2
Lender 5 123 Motors Inc 17 -2
Lender 6 123 Motors Inc 10 -2
Lender 7 123 Motors Inc 2 -2
Lender 8 123 Motors Inc -1 -2
Lender 9 123 Motors Inc -11 -2
Lender 10 123 Motors Inc -15 -2
Lender 11 123 Motors Inc -15 -2
Lender 12 123 Motors Inc -37 -2
Lender 13 123 Motors Inc -41 -2
Lender 14 123 Motors Inc -44 -2
Lender 15 123 Motors Inc -48 -2
What are other lenders getting from these same dealers?
Are you being negatively selected?

BBR Scores by Segments of Your Portfolio
BBR Score Band Under 700 FICO Over 700 FICO Grand Total
<-100 2% 7% 5%
-100 to -50 8% 14% 10%
-50 to 0 24% 30% 27%
0 to 50 33% 29% 31%
50 to 100 17% 13% 15%
>100 7% 3% 5%
N/A 9% 5% 7%
Grand Total 100% 100% 100%
LTV <80% 80-<100% 100%-<120% 120%-<140% 140%+
BBR Scores
<-100 31% 20% 26% 15% 7% 100%
-100 to -50 32% 21% 20% 16% 11% 100%
-50 to 0 35% 16% 27% 16% 7% 100%
0 to 50 32% 18% 24% 17% 7% 100%
50 to 100 37% 21% 18% 13% 10% 100%
>100 26% 19% 23% 19% 12% 100%
N/A 21% 15% 15% 17% 6% 100%
Opportunity for more business
Drive positive selection and avoid negative selection by better understanding collateral risk
High risk segment

2010 Mazda MX-5 Miata • Lower relative historical depreciation
• No unreasonable swings in recent values
• Better than average condition in auction
• Very low mileage at auction
• Low number of add/deduct options
LOW RISK BBR Score: 106
MEDIUM RISK BBR Score: -1
2010 Chevrolet Equinox
• Average relative historical depreciation
• No Unreasonable swings in recent values
• Average Condition at Auction
• Higher Mileage in Auction
• Medium number of add/deduct options

HIGH RISK BBR Score: -106
2010 Honda Civic • Higher relative historical depreciation
• Strong Recent Values at risk of dropping
• Average Condition at Auction
• Higher Mileage in Auction
• Low Number of add/deduct options

How well do you know your collateral RISK???
Let us help you understand how your LTVs have been migrating and where your collateral risk lies….
Lender Solutions
1-800-955-9266