Understanding Weather and Climate - Cloud Object … · Lesson 3, students set up an experiment to...
45
E x p l o r i n g S t u d y i n g I n v e s t i g a ti n g E x p e r i m e n tin g W or k in g D is c o v e r in g U n d e r s t a n d in g R e s e a rc hi n g Understanding Weather and Climate SCIENCE AND TECHNOLOGY CONCEPTS ™
Transcript of Understanding Weather and Climate - Cloud Object … · Lesson 3, students set up an experiment to...

Expl
orin
g S
tudy
ing
Inve
stig
atin
g E
xper
imen
tin
g Working Discovering Understanding Researching
Understanding Weather and Climate
Science and Technology concepTS™


Tab 2: Unit Overview and Goals i
Understanding Weather and Climate Unit Overview .............. 2
Concept Storyline: Understanding Weather and Climate ........ 6
Suggested Pacing Guide: Understanding Weather and Climate ....................... 7
Understanding Weather and Climate Unit Goals .................... 8
CONTENTS

2 STC Unit: Understanding Weather and Climate
UNIT OVERVIEW AND GOALS
UNDERSTANDING WEATHER AND CLIMATE UNIT OVERVIEW
weather, and climate and its changes; a research project; and a final assessment. A concept storyline and a suggested timeline for implementing Understanding Weather and Climate appear on pages 6 and 7 of this section.
LESSON–BY–LESSON SUMMARY
PART 1: STORMS AND WEATHERLesson 1 is an initial assessment of student understanding of weather and its occurrence. Students engage in brainstorming activities to stimulate their thinking and activate prior knowledge of weather and catastrophic events. They develop a concept map and mark the location of catastrophic weather events on a globe and on a world map. From these inquiries, the teacher can measure student understandings and preconceptions, which will serve as a baseline for measuring student growth.
Students look for patterns in photos and satellite views of clouds and storms in Lesson 2. They create a vortex in a bottle and investigate the effects of varying pressure on the movement of fluids in a vortex. Through the reading selections they are introduced to the properties of thunderstorms, tornadoes, and hurricanes, and the scales for measuring their intensities.
In Lesson 3, students set up an experiment to collect data on the heating of soil and water as an introduction to winds and convection currents formed by the uneven heating of the earth’s surface. In a study of the different parts of the earth’s atmosphere, they discover that the earth’s weather occurs in the first layer, the troposphere, and that greenhouse gases moderate the earth’s temperature to make it habitable. The reading selections introduce the concept of the sun as the heat engine and generator of the earth’s weather and the origins of a national weather forecasting system. The concept of long-range weather conditions that determine climate is first mentioned in this lesson so that students can begin to differentiate between weather and climate.
What kinds of atmospheric conditions cause our weather? What causes storms like hurricanes and tornadoes, and why do they occur where they do? How do the oceans affect our weather? What’s the difference between weather and climate? How can we know what the climate was like 350,000 years ago? How do we know that it has changed since then? Students will conduct experiments, make models, simulate weather conditions, and analyze data to answer these questions and others like them in Understanding Weather and Climate.
The unit is based on the underlying principle that the earth is a complex system with interrelated components of earth, air, water, and organisms that affect the whole. Atmospheric events and oceanic processes have a dramatic impact on the earth’s surfaces and inhabitants. In this unit, students experiment with factors that determine daily weather and influences that produce different climate zones and climate changes.
By engaging in inquiries that provide opportunities to explore these relationships and concepts, students begin to construct a knowledge base of their own. Reading selections reinforce these concepts by focusing on such diverse applications as the use of satellites to study atmospheric conditions, occurrence of tornadoes in Dixie Alley, pioneering research in weather by Joseph Henry, and the work of current weather and climate forecasters.
Each lesson builds on skills and concepts presented in previous lessons. As students progress through the unit, they take greater responsibility for their own learning, eventually planning and conducting their own experimental procedures, devising their own data tables, and analyzing the results they obtain. Therefore, the material should be taught as a complete unit. It should not be used as a sourcebook of occasional experiments.
The unit’s 13 lessons include a pre-assessment; 10 lessons in which students explore the concepts of daily and catastrophic weather, the role of the ocean in the world’s

Tab 2: Unit Overview and Goals 3
In Lesson 4, students observe the behavior of air masses formed over warm and cool surfaces. They use a special convection tube apparatus to show the rise of warm air masses and the fall of cool air masses, respectively, and can associate air movement with the uneven heating of different parts of the earth’s surface. The reading selections describe the information gathered by meteorologists, including student forecasters, to make weather predictions.
In Lesson 5, students use the convection apparatus to observe the convection currents formed by converging air masses of different temperature and humidity. They apply their laboratory experience with small air masses to the formation of fronts that generate land and sea breezes, global winds, the jet stream, storms, and tornadoes described in the reading selections.
In Lesson 6, students examine the effect of air pressure on condensation and evaporation by changing the pressure on a container of moisture-laden air. After observing the formation of clouds, they analyze the information shown on a weather map as a visual record of the movement of air masses with different properties (temperature, humidity, and pressure). Students also begin a week-long project in which they collect atmospheric information and seek patterns that may be useful in predicting the weather. After five days of data collection, students analyze data, present weather forecasts, and compare the accuracy of their predictions.
In Lesson 7, students investigate the formation, properties, and impact of hurricanes. They track the path of Hurricane Katrina and its behavior through time on a weather map and view a video of its stages and effects.
PART 2: THE OCEAN’S IMPACT ON WEATHERLesson 8 is an introduction to the role of the ocean in the earth system and its impact on weather and climate. To develop an understanding of bathymetry and oceanic features, students learn to draw contour maps, then draw a bathymetric map of a model of the ocean floor. They read about the history of ocean exploration, from the first Polynesian sailors to the use of satellites for making measurements of ocean temperatures, salinity, currents, and other properties. Maps and
accounts of early bathymetric expeditions show them how similar their own mapping challenges were to those of 19th-century oceanographers, and how profoundly 20th- and 21st-century sounding technology has aided marine science.
In Lesson 9, students investigate and model ocean properties and their impact on weather. Students investigate convection currents in liquids due to temperature and salinity differences, and perform a quantitative analysis to test the proposition that sea ice formation leaves behind very salty water. They then apply their experimental understanding to ocean currents, such as the Gulf Stream and Kuroshio Current, and the upwelling that occurs in El Niño.
PART 3: CLIMATE AND CLIMATE CHANGESIn Lesson 10, students are introduced to the climatologist’s task of making accurate, meaningful statements about climate given incomplete and varying data. Students begin a long-term research project, the Exploration Activity. For this project, each student group analyzes a graphed set of climate change–related data and presents its analysis to the class, explaining what the data mean and why the graph is important.
In Lesson 11, students review factors affecting the climate and investigate climate classification systems. They learn about Köppen’s five main climate zones, then study federal climate projections for their (or another) geographical area for the next century, and generate policy recommendations. They use actual plant fossil data, obtained from Smithsonian Institution research, to determine the climate in Wyoming’s Big Horn Basin during the Cenozoic Era. Again, students are able to see how scientists can use proxy data as an indirect measurement of a variable that cannot be measured directly.
In Lesson 12, students conclude their study by making a rudimentary predictive model of their own and by investigating the impact of burning fossil fuels on the earth system. They analyze their own home energy use and compare it with that of their classmates. They discuss ways to reduce their carbon footprint individually, as a class, and as a school. Before the final assessment, students review the inquiries, concepts, vocabulary, and reading selections of the unit and complete review questions.

4 STC Unit: Understanding Weather and Climate
UNIT OVERVIEW AND GOALS
Lesson 13 is the final assessment, consisting of a performance-based assessment, a written assessment, and a self-assessment. During the performance-based assessment, students observe a laboratory demonstration by the teacher and use their knowledge of convection currents to describe what they observe. The written assessment includes multiple-choice and constructed-response questions. For their self-assessment, students compare their initial understanding of weather and climate with that gained from their experiences with the unit.
GLOSSARY
A glossary is included at the back of the Student Guide. It expresses scientific terms and concepts in a more formal language than students may initially use when they talk about or reflect on the inquiries and their observations. Before you introduce students to and have them use the more formal scientific terms, allow them to develop explanations and express their understanding in their own words.
READING SELECTIONS
The STC Program™ incorporates two types of reading selections into each unit to enhance and extend the lesson material. The first type is embedded directly into the procedure of the lesson. Called “Building Your Understanding,” these reading selections provide background information or further explanation of concepts that are critical to a student’s understanding of the inquiry at hand. A second type, “Extending Your Knowledge,” appears at the end of the lessons, extending the concepts of the lesson to the real world, highlighting the application of the concepts in such contexts as science and technology careers, current events, and the history of science and technology. Each of these reading selections is followed by two open-ended questions designed to help students apply the information from the text and extend their thinking.
SCIENCE NOTEBOOKS
Students should have a science notebook in which to record their observations, data, conclusions, and answers to questions as well as their own ideas and thoughts as they progress through the inquiries in the unit. Students should come to view their notebook as a resource that they can use throughout the unit. Reviewing observations, data, and information will help them refine their understanding of key concepts and conceptual models. Teachers will find the science notebooks to be a valuable assessment tool in tracking student progress in both content knowledge and inquiry skills.
USING THE ANNOTATED TEACHER’S EDITION FOR STC–SECONDARY
The Teacher’s Edition for STC–Secondary was developed to support the teacher in every aspect of the unit. Imagine having everything right at your fingertips, yet in an organized and intuitive design. In each lesson, you will find two types of content—pages that support the teacher, and pages that help the teacher support the students.
Teacher-only Content Pages: These pages have no student guide correlation, and appear at the beginning and end of each lesson. Here, you will find overview and background information, planning and preparation, common misconceptions, homework and extension activities, and assessment guidelines. These pages guide teachers to obtain and prepare materials and highlight the concepts of the lesson.
Annotated Student Pages: These pages include inset full-color Student Guide pages right in the Teacher’s Edition. This way, you’ll always have the student instructions and reading selections right in front of you. The step numbers for each inquiry correspond one-to-one between the Student Guide step and the annotated wrap of the Teacher’s Edition. The notes in the wrap provide anticipated or best responses, guide teachers in informal assessment, and offer classroom management tips. It is important to remember that the Student Guide explains the procedure while the annotation in the Teacher’s Edition wrap-around supports what is presented there.

Tab 2: Unit Overview and Goals 5Tab 2: Unit Overview and Goals 5
TEACHER’S TOOLS CD
The CD included with your kit includes PDF files of all the reproducible sheets needed to teach this unit. Blackline masters are grouped by lesson, so finding exactly what you need is fast and simple. If your unit uses chemicals, you’ll also find PDFs of all the Material Safety Data Sheets (MSDS) to print and have on hand in your classroom or the main office. Additional items include English and Spanish versions of the safety contract and any images or diagrams that need to be printed for use with overhead projectors or document cameras.
TEACHER’S NOTES

6 STC Unit: Understanding Weather and Climate
UNIT OVERVIEW AND GOALS
Concept Storyline: Understanding Weather and Climate
UNIFYING THEME UNIT CONCEPTS GRADE–LEVEL CONCEPT
The earth acts as a complex system with components of air, water, rock, sediments, and living things that interact with each other.
Convection currents in fluids, air, and water influence weather and climate conditions on Earth.
Science is a human endeavor in which scientists gather, analyze, and interpret data to understand natural and catastrophic events that occur in the earth system.
SUBCONCEPT 1Students have ideas, preconceptions, and misconceptions about weather and climate.
Lesson 1: Our Ideas About Weather and ClimateStudents create a concept map on weather events and locate atmospheric and oceanic processes on a world map in an introductory assessment.
SUBCONCEPT 2A vortex is the movement of a fluid around a central axis. A vortex formed in the atmosphere results in winds, breezes, storms, tornadoes, and hurricanes.
Lesson 2: Introducing StormsStudents investigate the appearance of clouds in an atmospheric disturbance and model the movement of a vortex in a container of water and particles.
Lesson 3: Heating Earth’s SurfacesStudents compare the unequal heating and cooling of water and soil.
Lesson 4: Heat Transfer and the Movement of AirStudents investigate the movement of air masses above hot and cold surfaces.
Lesson 5: Convection Currents in the AirStudents investigate the convection currents created by air masses of different temperature and humidity, and the formation of tornadoes.
Lesson 6: Temperature, Pressure, and Cloud Formation
Students observe, track, and seek patterns in local weather, and investigate the formation, properties, and movement of clouds and weather fronts. They learn to read weather maps.
Lesson 7: Hurricanes: Destructive StormsStudents research the formation, behavior, and effects of hurricanes.
SUBCONCEPT 3The dominant feature of Earth, its ocean, plays a major role in the planet’s weather and climate, and in the lives of its living organisms.
Lesson 8: Earth: An Ocean PlanetStudents investigate the locations and properties of oceans, and study the history of oceanography.
SUBCONCEPT 4Vortices in the ocean set up convection currents.
Lesson 9: Ocean CurrentsStudents investigate convection currents in liquids due to temperature and salinity differences in water masses, the causes of these differences, and their impact on weather and climate.
SUBCONCEPT 5Climates, or weather conditions over long periods of time, are associated with specific geographic, atmospheric, and topographic conditions. Climates can change over time.
Lesson 10: Exploration Activity: Introduction to Climate Change Research
Students research and analyze graphed data sets associated with climate change and present their findings to the class.
Lesson 11: Earth’s Climate ZonesStudents investigate climate classification systems, analyze climate change projections, and explore the use of fossil data to determine past climates.
Lesson 12: Climate and Energy UseStudents investigate natural and anthropogenic climate change, predict the rate of ice melt, and analyze their own energy consumption patterns.
Lesson 13: Understanding Weather and Climate Assessment
Students complete performance-based, written, and self assessments of their understanding of the concepts and processes in the unit.

Tab 2: Unit Overview and Goals 7Tab 2: Unit Overview and Goals 7
1 Getting Started
Inquiry 1.1
2 Inquiry 1.2
Reflecting on What You’ve Done
Reading Selections
3 Getting Started
Inquiry 2.1
4 Reflecting on
What You’ve Done Reading Selections
5 Getting Started
Inquiry 3.1
6 Inquiry 3.1 continued
Reflecting on What You’ve Done
Reading Selections
7 Getting Started
Inquiry 4.1
8 Inquiry 4.2
Reflecting on What You’ve Done
Reading Selections
9 Getting Started
Inquiry 5.1
10 Reflecting on
What You’ve Done Reading Selections
11 Getting Started
Inquiry 6.1 Reading Selection
12 Inquiry 6.2 Inquiry 6.3
13 Inquiry 6.4
Reflecting on What You’ve Done Reading Selection
14 Getting Started
Reading Selection
15 Inquiry 7.1
Reading Selection
16 Inquiry 7.2
Reading Selection
17 Inquiry 7.2 continued
Reflecting on What You’ve Done
18 Inquiry 6.5
19 Getting Started
Inquiry 8.1
20 Inquiry 8.1 continued
21 Inquiry 8.2
22 Inquiry 8.2 continued
Reflecting on What You’ve Done
Reading Selections
23 Getting Started
Inquiry 9.1 Reading Selection
24 Inquiry 9.1 continued
25 Inquiry 9.2
26 Inquiry 9.3
Reading Selection
27 Inquiry 9.2 continued
Reflecting on What You’ve Done
Reading Selections
28 EXPLORATION
ACTIVITY Getting Started
Part 1
29 EXPLORATION
ACTIVITY Part 1 continued
Part 2
30 EXPLORATION
ACTIVITY Part 2 continued
31 Getting Started
Reading Selection
32 Inquiry 11.1
33 Inquiry 11.1 continued
Inquiry 11.2 Reading Selection
34 Inquiry 11.2 continued
Reflecting on What You’ve Done
35 EXPLORATION
ACTIVITY Part 3
36 Getting Started
Reading Selections
37 Inquiry 12.1
38 Inquiry 12.2
Reading Selection
39 Inquiry 12.2 continued
Reflecting on What You’ve Done
40 EXPLORATION
ACTIVITY Part 4
41 EXPLORATION
ACTIVITY Part 4 continued
Reflecting on What You’ve Done Reading Selection
42 Getting Started
43 Unit Assessment
Part A
44 Unit Assessment
Part B
45 Unit Assessment
Part C
Lesson 2Lesson 1 Lesson 3
Lesson 9
Lesson 11
Lesson 13
Lesson 6
Lesson 4
Lesson 7
Lesson 8
Lesson 10
Lesson 12
Suggested Pacing Guide: Understanding Weather and ClimatePacing Guide is based on 40- to 50-minute class periods.
Lesson 5
Lesson 6

8 STC Unit: Understanding Weather and Climate
UNIT OVERVIEW AND GOALS
UNDERSTANDING WEATHER AND CLIMATE UNIT GOALS
Atmospheric and oceanic processes can be associated with certain geographical locations on a map or globe.
Clouds in atmospheric disturbances appear to swirl.
A vortex is the movement of a liquid or gas in a spiral around a central axis.
Different surfaces on the earth heat and release heat at different rates.
Unequal heating of soil and water on the earth’s surfaces produces convection currents.
Oceans heat and cool slowly; landmasses heat and cool more quickly.
Surfaces warmer than the air around them transfer heat and warm the air above them.
Surfaces cooler than the air around them absorb heat and cool the air above them.
Warm air is less dense than cool air and has a tendency to rise, creating an unstable air mass.
Cool air is denser than warm air and has a tendency to sink, creating a stable air mass.
Convection currents are formed by the upward movement of warm air and the downward movement of cool air.
Air masses of different temperature and humidity meet to form convection currents.
Weather maps can indicate the presence of clouds in fronts and low-pressure areas.
Water vapor changes to a liquid by condensation.
Clouds form under low air pressure when water vapor from warm, rising air condenses (or when warm and cold air masses meet).
Weather maps provide information about the weather.
Atmospheric conditions can form the basis of weather forecasting.
Weather forecasting once depended on local observations.
Local observations can still be used in weather forecasting.
Data do not always contain or reveal patterns; it is not always possible to know in the first trial how much data is sufficient to reveal patterns .
Local data may be used to predict weather.
Visual representations of data can aid in pattern-spotting.
Failed experiments provide information that guides experimental redesign.
Part of experimental design is determining how much and which data are necessary.
Hurricanes form over tropical waters.
A storm surge is produced by water pushed ahead of the storm by the force of hurricane winds.
Understanding Weather and Climate is based on the organizing principle that the earth is a complex system with interrelated components of earth, air, water, and organisms that affect the whole. Atmospheric events and oceanic processes have a dramatic effect on the earth’s surfaces and inhabitants. In this unit, students experiment with factors that determine daily weather and the influences that produce climatic zones and climatic changes.
CONCEPTS

Tab 2: Unit Overview and Goals 9
The effect of storm surge varies with coastal configuration.
Major damaging effects of hurricanes are caused by wind and by water pushed to shore during the storm surge.
A vast, interconnected ocean is the dominant feature of Earth. It is the main source of water, an important source of oxygen, and supports all life on the planet .
A topographic map shows elevations above a surface by means of contour lines that fall at regular intervals.
A bathymetric map uses contour lines to show the depth of features below a surface.
Uncertainty is inherent in data interpretation.
We cannot see far beneath the ocean surface. Science is required for exploration of what we cannot see.
Thoughtful planning is essential to meaningful data collection.
Good data interpretation requires careful thought.
Longitude is essential to accurate seafloor mapping.
Light heats a surface more as the angle at which it strikes approaches 90 degrees.
Temperature affects the density of water.
Salty and less salty masses of water vary in density and create convection currents in a liquid.
Winds blowing over a liquid ‘s surface create a current.
Scientists must make difficult decisions about measurement, data use, and definitions when they try to describe large, varied systems like the ocean or the atmosphere .
The ocean is tremendously large and varied.
“Climate” refers to weather conditions over a long period of time.
Climate changes have occurred in the past, are happening in the present, and are predicted to occur in the future.
It is important to understand where data comes from and how it is collected so that the limits of our knowledge are clear.
Scientific authority depends upon intelligent, clearly stated interpretation of reliable information.
Numerous organizations—educational, governmental, and professional—have data based on climate research that can be accessed by students .
Data may be of varying quality.
Data are collected by specific people for specific reasons.
Definitions are important.
Visual elements such as graphs, maps, and videos can help convey information.
Sharing knowledge is an important part of the scientific process .
The world is divided into five main climate zones and many more subzones.
Climate zones are defined primarily by precipitation, temperature, and seasonal fluctuations, but they are rooted in questions about the types of life forms that can thrive in each area .
Regions of each climate type are found around the world.
It is possible to make climate projections given the current state of knowledge about climate and how it works.
Climate projections are reasonable scenarios rather than forecasts.
Current climate projections show significant, potentially dramatic climate change in U.S. regions over the next century.
Studying climate change projections lets us consider how best to mitigate climate change and its effects .

10 STC Unit: Understanding Weather and Climate
UNIT OVERVIEW AND GOALS
Noticing things in nature and asking questions about them.
Making accurate observations and measurements of scientific phenomena, including weather.
Learning to work cooperatively with lab partners and classmates.
Learning to follow a sequence of instructions over a period of time to answer an inquiry.
Designing and conducting controlled experiments.
Learning to use scientific instruments and techniques to collect data.
Recognizing patterns in lab-group and class data.
Making careful measurements of temperature.
Analyzing relationships between variables in data sets.
Thinking about the meaning of data.
Making use of models and simulations to analyze systems to identify flaws that might occur or to test possible solutions to a new problem .
Communicating experimental and research results in writings, graphs, tables, and oral presentations.
Researching and managing ideas and information.
Using the results of previous experiments to make predictions for new situations.
Recognizing the need for precise definitions and careful thought about the data required to answer a given question.
Writing complete, coherent accounts of inquiries conducted in class with evidence-based conclusions.
Reflecting upon experiences during Understanding Weather and Climate in writing and oral discussion.
Continuing to seek more information on unit topics in reading and online research.
Developing the ability to assess one’s own learning.
SKILLS
Climates have changed markedly in other geological times.
Studying and envisioning past episodes of rapid climate change may help us understand how the current warming period will go .
Scientists around the world have reached a consensus on global warming. They find compelling evidence that the earth is warming rapidly, and that much if not all of the change is anthropogenic, or caused by human activity .
Environmental systems are complex, which makes modeling them difficult.
The scale of environmental phenomena is extremely large, but they can still be modeled.
Energy use can be computed for individuals, groups, and countries to give a profile, or “carbon footprint.”

Tab 2: Unit Overview and Goals 11
Developing an understanding of the methods of science as experimental and evidence-based and the use of science as argument and explanation .
Having an understanding of that which differentiates science from pseudoscience, dogma, and prejudice.
Recognizing that scientists can and do reach incorrect conclusions, but that over time, other scientists often correct them.
Recognizing the contributions of scientists and science as a human endeavor.
Recognizing that science’s explanatory strength comes from the insight and intelligence people can bring to bear on their observations of nature .
Appreciating the use of scientific principles in many jobs and endeavors.
Developing a sense of personal empowerment to do and understand science in and out of the classroom.
Understanding the importance and relevance of the concepts developed in Understanding Weather and Climate.
Recognizing the risks and benefits associated with energy sources.
Assessing the role of technology in creating risks and benefits to society.
ATTITUDES

Part 1: Storms and Weather
Lesson 1 Our Ideas About Weather and Climate
Lesson at a Glance ..................................................................... 1–A
Inquiry 1.1 Creating a Group Concept Map ...................... 4–B
Images of the Earth........................................................................ 6
Inquiry 1.2 Using a Globe and a World Map ..................... 6
How Scientists Study the Earth ..................................................... 9
Views from Space ........................................................................... 13
Lesson 2 Introducing Storms
Lesson at a Glance ..................................................................... 19–A
Inquiry 2.1 Modeling a Vortex ............................................. 23
Tornado Watch or Warning? ........................................................... 24
What Is a Vortex? ............................................................................ 28
That’s a Fact: An Introduction to Thunderstorms,Tornadoes, and Hurricanes ............................................................ 30
Lesson 3 Heating Earth’s Surfaces
Lesson at a Glance ..................................................................... 37–A
Inquiry 3.1 Investigating Rates of Heating
and Cooling ........................................................ 41
Weather Versus Climate ................................................................. 44
The Source of Earth’s Heat ............................................................. 46
The Atmosphere: A Multilayered Blanket of Air ............................ 50
Joseph Henry: The Father of Weather Forecasting ........................ 53
CONTENTS
STC Earth Science Strand: Earth’s Dynamic Systems i

UNDERSTANDING WEATHER AND CLIMATE
Lesson 4 Heat Transfer and the Movement of Air
Lesson at a Glance ..................................................................... 57–A
Inquiry 4.1 Investigating the Temperature of Air ........... 61
Inquiry 4.2 Investigating How Warm Air
and Cool Air Move ............................................. 64
Air Masses ..................................................................................... 66
What’s the Weather Forecast? ........................................................ 68
Lesson 5 Convection Currents in the Air
Lesson at a Glance ..................................................................... 73–A
Inquiry 5.1 Investigating the Effects of Colliding
Air Masses ........................................................... 77
Why Does the Wind Blow? ............................................................. 80
Weather Fronts .............................................................................. 86
Danger in Dixie Alley ..................................................................... 88
Lesson 6 Temperature, Pressure, and Cloud Formation
Lesson at a Glance ..................................................................... 93–A
Inquiry 6.1 Observing Evaporation and Condensation .. 98
Hurricane Formation and the Water Cycle .................................... 98
Inquiry 6.2 Modeling the Effects of Air Pressure
on Cloud Formation .......................................... 100
Inquiry 6.3 Noticing Patterns and Relationships
in Weather Data ................................................. 102–A
Inquiry 6.4 Reading Weather Maps ..................................... 104–B
Inquiry 6.5 Analyzing Weather Data .................................. 106–A
The Truth About Air ........................................................................ 108
Lesson 7 Hurricanes: Destructive Storms
Lesson at a Glance ..................................................................... 111–A
Hurricane Formation and Impact .................................................. 115
Inquiry 7.1 Investigating the Storm Surge ........................ 117
Inquiry 7.2 Tracking Hurricane Katrina ............................ 120
2005—The Year of Hurricane Firsts ................................................ 122
The Rise and Fall of Katrina ............................................................ 126
ii STC Unit: Understanding Weather and Climate

Part 2: The Ocean’s Impact on Weather
Lesson 8 Earth: An Ocean Planet
Lesson at a Glance ..................................................................... 131–A
Inquiry 8.1 Practicing Drawing Bathymetric Maps .......... 134–B
Inquiry 8.2 Investigating the Ocean Floor ........................ 138–A
Throwing a Grid Over the Waters: Early Oceanography ................ 140
From Oceanography to Marine Science ........................................ 147
Lesson 9 Ocean Currents
Lesson at a Glance ..................................................................... 153–A
Inquiry 9.1 Investigating the Effect of
Temperature on Currents ................................ 156–D
Ocean Currents .............................................................................. 160
Inquiry 9.2 Exploring the Effect of Salinity on
Ocean Currents .................................................. 160–A
How Trade Winds Cause Upwelling ............................................... 161
Currents and the Great Ocean Conveyor Belt ................................ 164
Inquiry 9.3 Investigating Surface Currents ....................... 166
El Niño Stirs Up the World’s Weather ............................................. 168
Ben Franklin, Matthew Maury, Prince Albert, and Rubber Duckies: Mapping Ocean Currents ............................................................... 174
Part 3: Climate and Climate Changes
Lesson 10 Exploration Activity: Introduction to Climate Change Research
Lesson at a Glance ..................................................................... 177–A
Part 1 Introducing the Exploration Activity ...................... 180–B
Part 2 Conducting the Research .......................................... 183
Part 3 Creating the Presentation .......................................... 184
Part 4 Presenting the Research to the Class ...................... 185
Taking the A-Train to Make Coordinated Environmental Measurements ...................................................... 186
STC Earth Science Strand: Earth’s Dynamic Systems iii

UNDERSTANDING WEATHER AND CLIMATE
Lesson 11 Earth’s Climate Zones
Lesson at a Glance ..................................................................... 191–A
Climate Classification System ........................................................ 195
Inquiry 11.1 Projecting Climate Change ............................. 198–A
Inquiry 11.2 Climate Signals: Smooth or Jagged Leaves.. 198–H
Prehistoric Climate Change ........................................................... 200
Causes of Climate Change: Natural and Manmade ....................... 204
Lesson 12 Climate and Energy Use
Lesson at a Glance ..................................................................... 209–A
What’s the Climate Forecast? ........................................................ 213
Inquiry 12.1 Modeling the Rate of Ice Melt ........................ 214–A
Inquiry 12.2 Calculating Your Carbon Footprint .............. 215
Consensus on Warming and Future Climate Predictions .............. 217
Alternatives to Fossil Fuels............................................................. 222
Lesson 13 Understanding Weather and Climate Assessment
Lesson at a Glance ..................................................................... 227–A
Part A Performance-Based Assessment .............................. 230–A
Part B Written Assessment .................................................... 230–A
Part C Reflecting on What You’ve Done ............................. 230–B
iv STC Unit: Understanding Weather and Climate

LESSONCLIMATE AND ENERGY USE
GETTING STARTED INQUIRY 12.1 Modeling the Rate of Ice Melt
OBJECTIVES Read about scientists’ development and use of computer climate models.
Acquire data from an event and use it to estimate the course of a similar event.
CONCEPTS Scientists around the world have reached a consensus on global warming. They find compelling evidence that the earth is warming rapidly, and that much if not all of the change is anthropogenic, or caused by human activity.
Environmental systems are complex, which makes modeling them difficult.
The scale of environmental phenomena is extremely large, but they can still be modeled.
OVERVIEW Students read and discuss two selections on climate change.
Students participate in a teacher demonstration of the rate of ice melt, graph data, and make predictions about future melting. Students then test their predictions using a second demonstration.
KEY TERMS Consensus
Greenhouse gas
Intergovernmental Panel on Climate Change
Axis
Graph
Modeling
TIME 1.0 period 1.0 period
CORRELATION TO NATIONAL
SCIENCE STANDARDS
Content Standard A• Abilities necessary to do scientific inquiry
Content Standard A• Abilities necessary to do scientific inquiry
Content Standard D• Structure of the earth system
209–A STC Unit: Understanding Weather and Climate

LESSON AT A GLANCE
INQUIRY 12.2 Calculating Your Carbon Footprint READING SELECTIONS
Evaluate home energy use.
Consider ways to reduce energy use.
Review the concepts and skills developed in Understanding Weather and Climate.
What’s the Climate Forecast? Read about the work of a climate forecaster for NOAA.
Consensus on Warming and Future Climate Predictions Read about the scientific evidence on global warming and the development of models for climate in the future.
Alternatives to Fossil Fuels Read about other sources of energy.
Energy use can be computed for individuals, groups, and countries to give a profile, or “carbon footprint.”
Scientists have reached a consensus on global warming.
Energy conservation reduces the carbon footprint.
Alternatives to fossil fuels present challenges and offer promise for less damaging energy use.
Scientists continue to develop complex computer models to forecast the extent of global warming and its impact on the earth.
Scientists and government representatives from around the world are seeking alternatives to burning fossil fuels for energy.
Students use personal or other data to compute their energy use.
“What’s the Climate Forecast?” details an interview with NOAA climatologist Dr. Ed O’Lenic.
“Consensus on Warming and Future Climate Predictions” describes the methods of sharing and reviewing data used by scientists to reach conclusions and make predictions.
“Alternatives to Fossil Fuels” explores the pros and cons of alternative forms of energy, such as solar, wind, hydroelectric, and biomass, as well as fuel cells.
Carbon footprint
Emission
Environmental Protection Agency
Fossil fuel
Greenhouse gas
Adaptation
Anthropogenic
Biofuel
Fossil fuel
Geothermal energy
Greenhouse gas
Hydrogen fuel cell
Mitigation
Nuclear power
Photovoltaic cell
Radiative forcing
Solar power
2.0 periods
Content Standard A• Abilities necessary to do scientific inquiry
Content Standard F• Risks and benefits• Science and technology in society
Content Standard G• Nature of science• History of science
STC Earth Science Strand: Earth’s Dynamic Systems 209–B

CLIMATE AND ENERGY USELESSON
OVERVIEW
In this lesson, students extend and personalize the work they began in Lesson 11 on climate change. “Getting Started” returns them to the question of climate models’ sources and reliability. A reading selection, “Consensus on Global Warming,” introduces the method by which scientists have reached a consensus on climate change, and looks into the search for data on the causes of global warming. The question of the extent of human responsibility for global warming, and how we can determine it, is raised here.
Inquiry 12.1 focuses on a key unknown in climate change: how fast the earth’s ice will melt. This experiment in predicting the rate of ice melt introduces students to how trying to model climate drives a need to understand such phenomena better, and fosters keen observation and critical question-asking about how these phenomena work.
In Inquiry 12.2, students use a carbon footprint calculator, which allows them to quantify the amount of carbon dioxide their families’ activities produce annually.
BACKGROUND
Why Carbon Dioxide? We talk frequently about carbon dioxide (CO
2) and its
role in “trapping” heat. But why does carbon dioxide trap heat, and why is it carbon dioxide, rather than some other chemical species, that is the focus of global warming conversations?
The atoms in molecules behave somewhat like balls held together with springs, with the atoms being the balls, and their bonds, the springs. The energy with which the atoms bounce at the end of those bonds is vibrational energy, and for each pair of atoms there is a particular frequency to the vibration. You can model this by attaching varying weights to springs of varying stiffness: each combination allows the weight to bounce with a different frequency. The carbon dioxide molecule has two stiff double bonds, O=C=O, in a straight line. As it happens, the C–O double bond vibrates with about the same frequency as an infrared (IR) wavelength, and the energy that radiates from the warmed earth is infrared.
When IR radiation hits the C–O bond, the chemical bond absorbs the radiant energy. In other words, carbon dioxide isn’t just a shield or blanket that traps heat below it: energy on its way from earth to space is actually trapped in the molecule itself, then released again, not necessarily toward space. The more carbon dioxide molecules exist in the atmosphere, the more energy can be trapped there and diverted from leaving the planet. To simplify, the heat radiating from earth just happens to fit the carbon dioxide molecule.
There are other greenhouse gases, such as methane (CH
4), nitrous oxide (N
2O), ozone (O
3),
chlorofluorocarbons (CFCs), and, notably, water vapor. The global warming conversation is not focused on these gases because, even though most are much more potent greenhouse gases than carbon dioxide, and most also have long lives in the atmosphere, they are relatively small components of the atmosphere, measured in parts per billion or trillion. In contrast, carbon dioxide concentrations are measured in parts per million. We also release significantly more carbon dioxide into the atmosphere than we do other gases. According to the U.S. Environmental Protection Agency, in 2007, carbon dioxide made up 85.4 percent of greenhouse gas emissions, methane accounted for 8.2 percent, nitrous oxide accounted for 4.4 percent, and fluorinated gases such as hydrofluorocarbons (HFCs), perfluorocarbons (PFCs) and sulfur hexafluoride (SF6) accounted for just 2.1 percent of emissions.
209–C STC Unit: Understanding Weather and Climate

Water vapor is a more potent greenhouse gas than carbon dioxide, and there is more of it in the air. However, its molecules come apart relatively quickly and easily, within a few days, which means that water vapor doesn’t build up in the atmosphere. And if there is a lot of water vapor in the air, it tends to form clouds, which can actually help cool the earth by reflecting light back into space. A carbon dioxide molecule, on the other hand, may float for tens or hundreds of years in the atmosphere before being re-absorbed by a plant (or the oceans or soil). The long life span of carbon dioxide in the atmosphere makes its continued release a big problem: it builds up.
Feedback LoopsCarbon dioxide does not act alone in warming the planet. Carbon dioxide’s importance in global warming has much to do with positive feedback loops. If carbon dioxide warms the planet slightly, evaporation increases. If the amount of water vapor in the air increases, more heat is trapped. If more heat is trapped, more water evaporates. Broadly speaking (and it is very broad, because there is much that is not understood about how water vapor behaves in the atmosphere), this process influences the climate projections the class analyzed in Lesson 11. How these feedback loops work, and how powerfully their components affect each other under various conditions, are major questions in climate research.
The Impact of the Rate of WarmingThe gaps in our knowledge about climate’s feedback loops lead us to other important uncertainties: how fast, how much, and how steadily the climate will change.
We do know that climates can vary greatly, and suddenly, with or without additions of greenhouse gases to the atmosphere by humans. What we don’t know is what constitutes a normal pattern of climate variation, or how rapid heating might affect these changes. For instance, we don’t know how the rate of warming affects how fast or how far sea level rises.
The ability to plan effectively depends on this information. Hundreds of millions of people live along coasts; billions are vulnerable to drought, disease migration, and crop failure. Untold species may find their habitats vanishing under rapidly changing conditions. If we know approximately how fast sea levels will rise, or how habitats will change, we could move cities back from the sea or raise them up, act to protect habitats, shift land use, and protect vulnerable populations.
As of this writing, there is no consensus on how fast or how steadily climates are likely to change as the atmosphere heats. Data collection continues, and is intense. Tens of thousands of individually made measurements might inform a single statement about how a particular part of the ocean or atmosphere behaved over a certain time period.
STC Earth Science Strand: Earth’s Dynamic Systems 209–D

CLIMATE AND ENERGY USELESSON
The Intergovernmental Panel on Climate Change: Consensus and DissentThe existence of carbon dioxide molecules might have been controversial two hundred years ago, but it is established fact today. Most climate science, however, is new science, and it is being carried out under considerable social pressures. It is not surprising that the volume of debate is high among scientists, policymakers, and the public. Although there are no absolute answers to give students about climate change, the intensity of debate gives students an excellent window into the process of how scientific facts are established.
The Intergovernmental Panel on Climate Change (IPCC) was formed by the United Nations and the World Meteorological Office to review the growing amount of research done around the world on climate change. In a sense, IPCC functions as an outgrowth of modern science. It does not have a fixed staff of scientists dedicated to reviewing the thousands of papers generated annually; rather, it works more like a scientific journal. A small core of paid officials manages the work of a larger group of volunteer scientists from around the world, who manage the review of papers in four key areas: the physical science of climate change, adaptation to climate change, mitigation of climate change (or how we might slow and control it), and greenhouse gas output. These volunteers collect scientific papers in each area and send them to many well-regarded scientists for review and comment. Their opinions and summaries form the core of IPCC’s statements on climate change. IPCC’s work, in other words, is truly the consensus of thousands of climate scientists all over the world.
Currently, the consensus is that the planet is warming, and that much of the warming in the past 50 years is attributable to human generation of greenhouse gases. This consensus is not universally shared. There are dissenting scientists, and—as rough-and-tumble as the debate may be—dissent helps to keep science honest. Because of dissent, there is now a strong focus on data integrity, what is and is not known, and how far it is possible to model such a complex set of systems.
Building Climate ModelsNow that students have explored several climate projections generated by models, the class will build a very simple model from which to make predictions. Combining the data they collect from an initial class experiment (melting a single ice cube) with their own observations of ice melt, students will predict how a larger volume of ice might melt. A second experiment will be conducted to test student predictions. The class model will be much simpler than climate scientists’ real models of how fast and how completely polar ice will melt, but the basic idea is the same: use observations to try to predict what will happen in a somewhat different circumstance. This is not how climate modelers build the kinds of models used in making the projections studied in Lesson 11. (For a description of how these models are built, see “Background” for Lesson 11 on pages 191-C–191-D.) Students’ work in this inquiry is closer to the empirical work of scientists like Dr. Scott Wing (see “Prehistoric Climate Change” on pages 200–203). Despite the differences in types of modeling, by the end of the inquiry, students should begin to see that climate models’ accuracy depends on how well we understand weather and climate processes, and that the phenomena under study are complex—sometimes surprisingly complex.
209–E STC Unit: Understanding Weather and Climate

READING SELECTIONS
The first reading selection, “Consensus on Global Warming and Future Climate Models,” describes scientists’ analyses of climate data and the development of a scientific consensus. The use of relationships between different climate factors to develop complex models is also explained, along with the limitations of these models. In “What’s the Climate Forecast?” an interview with Dr. Ed O’Lenic, senior meteorologist with NOAA’s Climate Prediction Center, reveals information about his development and testing of climate models. The final selection, “Alternatives to Fossil Fuels,” discusses the advantages of and difficulties inherent in replacing fossil fuels with renewable energy sources.
COMMON MISCONCEPTIONS
• “Global warming” and “climate change” mean the same thing. (In everyday speech, they do. However, climate scientists regard climate change as just that: changes in climate, rather than changes in any particular direction. For instance, shifts from warm periods to ice ages also fall under the heading of climate change.)
• People can’t make a big enough difference to cause global warming. (Even dissenting scientists are plain about this: Increased carbon dioxide levels do cause warming of the earth, and our use of fossil fuels has increased carbon dioxide levels by half over the past century or so.)
• Extra carbon dioxide is great for plants, and will lead to healthier farms and forests. (It’s true that carbon dioxide can help increase crop yields. However, photosynthetic organisms do not absorb all the carbon dioxide released through the use of fossil fuels. Also, carbon dioxide is not the only thing needed for plant growth.)
• Oil is just another kind of biomass fuel, so we shouldn’t worry about it. (Prehistoric photosynthetic organisms [and the animals that ate them] did take carbon dioxide from the atmosphere—hundreds of millions of years ago. The problem is that in burning large quantities of fossil fuels, we are releasing vast reserves of carbon into the atmosphere suddenly.)
• Last winter was very cold; therefore, global warming is a myth. (Climate trends are not driven by a single season’s weather, which may be affected by patterns such as La Niña or El Niño. Also, the earth’s climate changes vary greatly. Some parts of the earth can actually cool while others warm. On average, though, the climate is warming.)
• We had severe weather last week because of global warming. (Similarly, weather variations on individual days cannot be linked definitively to changes in climate. All we can say is that a warming climate means that more severe weather is more likely.)
• Environmentalists have been worrying about climate change forever and nothing has happened, so we can ignore it. (Quite a lot has happened. For example, the earth is warmer, the seas are more acidic, there is substantial damage to marine life, the poles have lost ice, and land species have migrated, as have diseases.)
STC Earth Science Strand: Earth’s Dynamic Systems 209–F

LESSON
210 STC Unit: Understanding Weather and Climate
lesson
INTRODUCTION
You and your classmates have studied multiple graphs and examined data on changes in the concentration of carbon dioxide in the atmosphere, surface sea temperatures, glacial mass, spring snow cover, arctic sea ice extent, permafrost thawing, land and ocean surface temperatures, and other variables related to climate change. You’ve also studied climate projections, in which scientists look for trends in climate data, and try to estimate how those trends will translate to everyday climate realities a hundred years from now.
In this lesson you will model ice melt. In your investigation, you will make a prediction based on careful classroom observations and what you know about ice. Then, you’ll test that prediction. You will also investigate the effect that global warming may have on our future and ways that impact can be reduced or mitigated.
Climate and energy Use
Here, a specialist is installing a solar tree, wHicH will rotate to face tHe sun tHrougHout tHe day and generate enougH energy to power tHree to four Homes. How do energy use and global climate cHange relate? PHOTO: U.S. Navy photo by Boatswain’s Mate 1st Class Christopher Dallaglio
PREPARATION
1. You will need four ice cubes. You may want to have a few extra on hand. Store the ice in a cooler.
2. Make a copy of Inquiry Master 12.1: Graph Paper and Student Sheet 12.1: Predicting the Rate of Ice Melt for each student.
3. Make a copy of each Personal Emissions Calculator Grid, Student Sheets 12.2a and 12.2b, for each student.
4. Not all students will be able to provide the data needed to complete Student Sheet 12.2a. Compile a data set for these students so they can participate in the activity.
5. From the Teacher’s Tools CD, make one copy of each of the five pages of the Global Warming Wheel packet for each student. Make a copy for yourself, and assemble one as a model for students, following the directions in Inquiry 12.2, Step 2.
6. Make a copy of Student Sheet 12: Weather and Climate Review for each student. This will be assigned as homework at the end of this lesson and reviewed with the class in “Getting Started,” Lesson 13.
7. Have glue sticks, paper fasteners, colored pencils, and scissors available for students. A distribution center may work well for this lesson.
8. Set up the materials for measuring the rate of ice melt for one ice cube in Inquiry 12.1. Stretch the mesh fabric square
SETUP FOR INQUIRY 12.1 FIGURE 12.1PHOTO: © 2013 Carolina Biological Supply Company
over the 250 mL beaker and secure it with the rubber band. Place the ruler against the beaker to measure the amount of water collected, using the rubber band to hold it in place (see Figure 12.1). Have a hair dryer available.
210 STC Unit: Understanding Weather and Climate

STC Earth Science Strand: Earth’s Dynamic Systems 211
MATERIALS FOR LESSON 12
For you 1 copy of Inquiry Master 12.1:
Graph Paper 1 copy of Student Sheet 12.1:
Predicting the Rate of Ice Melt 1 copy of Student Sheet 12.2a:
Personal Emissions Calculator—Student Grid 1
1 copy of Student Sheet 12.2b: Personal Emissions Calculator—Student Grid 2
1 copy of Student Sheet 12: Weather and Climate Review
1 Global Warming Wheel packet 1 paper fastener 1 pair of scissors 3 colored pencils, each a
different colorFor each group 1 glue stickFor the class 1 beaker, 250 mL 4 ice cubes 1 rubber band 1 square of mesh fabric 1 stopwatch or watch with
second hand 1 hair dryer
Acquire data from an event and use it to estimate the course of a similar event.
Evaluate home energy use.
Read about scientists’ development and use of computer climate models.
Consider ways to reduce energy use.
Review the concepts and skills developed in Understanding Weather and Climate.
OBJECTIVES FOR THIS LESSON
MATERIALS FOR LESSON 12For the teacher 1 Global Warming Wheel
packet* 1 glue stick* 1 paper fastener* 1 pair of scissors* 1 beaker, 250 mL 4 ice cubes* 1 cooler* 1 mesh fabric square 1 rubber band, #16 1 metric ruler, 30 cm
(12 in)* 1 stopwatch or clock with
second hand* 1 hair dryer* Paper towels* Access to electricity*
For each student 1 copy of Inquiry
Master 12.1: Graph Paper*
1 copy of Student Sheet 12.1: Predicting the Rate of Ice Melt*
1 copy of Student Sheet 12.2a: Personal Emissions Calculator–Student Grid 1*
1 copy of Student Sheet 12.2b: Personal Emissions Calculator–Student Grid 2*
1 copy of Student Sheet 12: Weather and Climate Review*
1 Global Warming Wheel packet*
1 paper fastener* 1 pair of scissors* 3 colored pencils (different
colors)*
For each group of 4 students 1 glue stick* * Needed, but not supplied
STC Earth Science Strand: Earth’s Dynamic Systems 211
LESSON lesson xx
getting started
1
Read “Consensus on Global Warming and Future Climate Models,” on pages 217–221. In your science notebook, record your answers to the following questions:
A. In the 1970s, what kind of climate change did scientists warn of, and why?
B. Is it possible that a warming earth could also be cooled by pollution? Explain.
C. What is the IPCC, and what does it do?
D. Are humans the only cause of increasing carbon dioxide concentrations in the atmosphere? Explain.
E. In the 1990s, how did scientists figure out how much of the carbon dioxide concentration increase could be traced to human activities?
2
Discuss your answers to the questions in Step 2 with your classmates.
3
Read “What’s the Climate Forecast?” and record your answers to the following questions:
A. How well do Dr. O’Lenic’s answers relate to the climate projections and graphs you have seen in the last two lessons? Are the conclusions you draw from them similar to the ones that he has developed in his study of climate?
B. What are some questions about climate forecasting that you would like to ask Dr. O’Lenic?
C. How do you think Dr. O’Lenic’s outdoor activities have influenced his views and appreciation of the natural world?
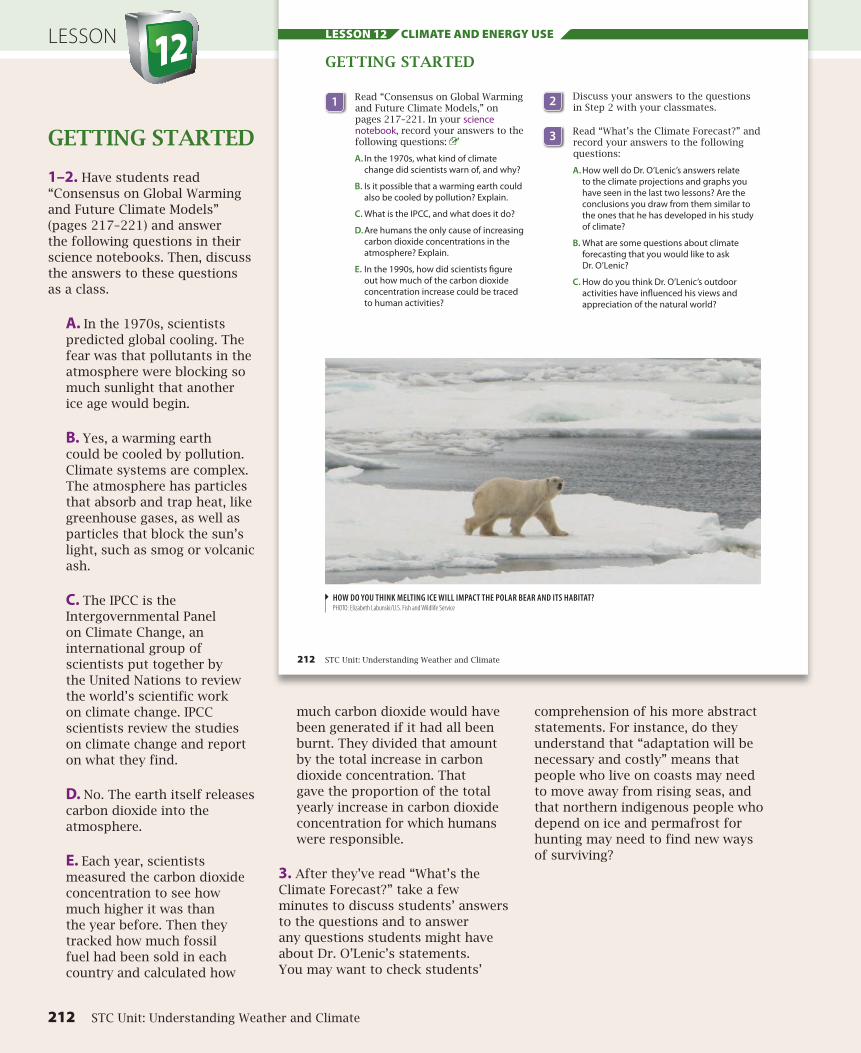
How do you tHink melting ice will impact tHe polar bear and its Habitat? PHOTO: Elizabeth Labunski/U.S. Fish and Wildlife Service
212 STC Unit: Understanding Weather and Climate
Climate and energy Uselesson 12
GETTING STARTED
1–2. Have students read “Consensus on Global Warming and Future Climate Models” (pages 217–221) and answer the following questions in their science notebooks. Then, discuss the answers to these questions as a class.
A. In the 1970s, scientists predicted global cooling. The fear was that pollutants in the atmosphere were blocking so much sunlight that another ice age would begin.
B. Yes, a warming earth could be cooled by pollution. Climate systems are complex. The atmosphere has particles that absorb and trap heat, like greenhouse gases, as well as particles that block the sun’s light, such as smog or volcanic ash.
C. The IPCC is the Intergovernmental Panel on Climate Change, an international group of scientists put together by the United Nations to review the world’s scientific work on climate change. IPCC scientists review the studies on climate change and report on what they find.
D. No. The earth itself releases carbon dioxide into the atmosphere.
E. Each year, scientists measured the carbon dioxide concentration to see how much higher it was than the year before. Then they tracked how much fossil fuel had been sold in each country and calculated how
much carbon dioxide would have been generated if it had all been burnt. They divided that amount by the total increase in carbon dioxide concentration. That gave the proportion of the total yearly increase in carbon dioxide concentration for which humans were responsible.
3. After they’ve read “What’s the Climate Forecast?” take a few minutes to discuss students’ answers to the questions and to answer any questions students might have about Dr. O’Lenic’s statements. You may want to check students’
comprehension of his more abstract statements. For instance, do they understand that “adaptation will be necessary and costly” means that people who live on coasts may need to move away from rising seas, and that northern indigenous people who depend on ice and permafrost for hunting may need to find new ways of surviving?
212 STC Unit: Understanding Weather and Climate

STC Physical Science Strand: Energy in our World 213
reading seleCtiOn bUilding yoUr Understanding
WHAT’S THE CLIMATE FORECAST?
Dr. Ed O’Lenic, the senior meteorologist and chief of the Operations Branch of NOAA’s Climate Prediction Center, has spent his entire career in short- and long-term weather and climate predictions. He became interested in weather and climate because he saw science “as a way for ordinary, but motivated, people to understand, and do something for the world.” He develops and tests complex models of climate change and uses them for short- and long-range climate change predictions. Outside work, the scientist enjoys hiking, and has traveled the Appalachian Trail and other hiking paths around the world.
Recently Dr. O’Lenic answered questions posed to him by a science teacher on behalf of her students. The interview went as follows:
Question: What are the most important things for students to know about global climate change?
Answer: Earth’s climate is changing extremely rapidly, mainly through the actions of humans. Many of these changes are permanent; consequences will be large, widespread, and uncontrollable. Action to mitigate, or reduce the effects of, change is needed to eliminate further changes. Adaptation will be necessary and costly.
Question: What do you think is the most compelling evidence for climate change?
Answer: Evidence is everywhere we look, but the long-term trends in temperature are the most compelling. Then, there is the loss of glaciers, decline in arctic sea ice, rising sea level, high nighttime low temperatures, northward migration of tropical diseases, rising acidity of the oceans, [and] extremely high rate of species extinctions.
Question: What do you see as the greatest impact of climate change?
Answer: Modern humans don’t seem able to grasp the magnitude of the changes we are experiencing, so they don’t have much urgency about them. Our lack of preparation for this, and other similar catastrophes, whose occurrence has uncertainty associated with them, e.g. [a] large volcanic eruption, meteor impact, or solar storm, leaves humanity at a survival disadvantage.
Question: What are steps that students and a school community can take to make a difference in the energy we use and the carbon dioxide we produce?
Answer: The most accessible measure is improving the efficiency of heating and cooling our homes and offices by improving insulation and by lifestyle changes, such as raising the thermostat a degree in summer and lowering it a degree in winter.
Question: When did the National Weather Service and other governmental agencies start to investigate data indicating climate change?
Answer: Svante Arrhenius, in 1896, was the first scientist to correctly discuss in public the implications of the changes of carbon dioxide concentration in the atmosphere.
Question: What is your response to the skeptics of global change?
Answer: Nature cannot be fooled.
Dr. O’Lenic’s response to the last question was based on his belief that nature or the earth is a system of inter-linked parts that have predictable relationships, regardless of human doubt or lack of understanding. n
STC Earth Science Strand: Earth’s Dynamic Systems 213
TEACHER’S NOTES
STC Earth Science Strand: Earth’s Dynamic Systems 213

LESSON
5
Look carefully at your graph. It can help you predict the rate of melting for three ice cubes. With your group, discuss the rate at which you think three ice cubes will melt. You’ve had lots of experiences with melting ice. Recall the experiment you just conducted. Picture a few cubes melting in the bottom of a glass. Consider what factors will affect the way they melt, and how long they will take to melt. Think about how much water will collect in the beaker every 30 seconds. Plot these points on your graph on Inquiry Master 12.1 using a second colored pencil. Connect these points using a dashed line and label the line “Three Ice Cubes (Prediction).” In your science notebook, record your reasoning for why the ice cubes will melt this way.
6
Now the class will test its predictions. Draw another table for recording time and volume data.
7
Work with the class to conduct the experiment a second time, using three ice cubes. Record the data collected during the experiment.
8
When all three ice cubes have melted completely, use a third colored pencil to plot the data points on your graph on Inquiry Master 12.1 and draw the line they suggest. Label this line “Three Ice Cubes (Actual).”
inQUiry 12.1
MOdELINg THE RATE OF ICE MELT
PROCEDURE
1
You have learned about what can affect our planet’s climate, and you have explored climate projections from scientific models. In this inquiry, with your teacher, your class will build a model to explore the rate of ice melt. Listen as your teacher explains the experiment.
2
Set up a table in which you can record data about the melt rate of an ice cube. In your science notebook, make a T-chart with two columns: “Time” and “Volume.”
3
Listen to your teacher’s instructions for conducting the class experiment. Your teacher will ask for student volunteers to help keep time and measure the amount of water collected in the beaker. Record the measurements taken during the experiment in the table you created.
4
Use the data you recorded and a colored pencil to make a graph on Inquiry Master 12.1: Graph Paper that shows the melt rate of one ice cube. Label one axis “Time” and the other “Volume.” Make the axes long enough to accommodate 10 minutes and 30 mm. Label the line you plot “One Ice Cube.”
214 STC Unit: Understanding Weather and Climate
Climate and energy Uselesson 12
214 STC Unit: Understanding Weather and Climate

INQUIRY 12.1
PROCEDURE
1. Remind students that they have explored projections generated by models of what will happen to the climate: how sea levels will rise, how rainfall patterns may change, and so on. Explain that in this inquiry, the class will build an extremely simple model. They will combine the information they collect from melting a single ice cube with their own lifetime observations of ice melt to try to predict how a larger volume of ice might melt. Then they will test their prediction.
2. Guide students to make a two-column chart in their notebooks, labeling one column “Time” and the other “Volume.” Suggest that they leave room for 10 minutes’ worth of data, since they don’t know how many minutes it will take to melt the ice cube. They will record the rate of ice melt in this table as you melt the ice cube.
3. This step is a teacher demonstration, supported by two student volunteers. As you use a hair dryer to melt the ice cube, the class will record time and water volume data in their science notebooks. Follow the steps below to conduct the demonstration:
A. Recruit two student volunteers: one to use the timer to call out the time every 30 seconds, and one to announce the volume of water that has collected in the beaker at each 30-second interval. These measurements should be to the nearest millimeter on the ruler and should be collected by looking at the beaker at eye level. Explain that the rest of the class should record these data as they are called out.
B. You will melt the ice using the hair dryer (see Figure 12.2). Place one ice cube on the mesh fabric. Hold the hair dryer as close to the ice as possible and blow straight across the ice (if you blow down it will cause the water in the beaker to ripple and make measurements difficult). For the best results, use the highest setting on the hair dryer. Continue to blow hot air on the ice cube for 10 minutes or until the ice has melted completely, whichever comes first.
4. Each student should use the class data and a colored pencil to graph the ice cube’s rate of melting on Inquiry Master 12.1: Graph Paper. Students should label one axis “Time” and the other axis “Volume.” Ask them what increments and units they should use (seconds for time, in 30-second increments; millimeters for volume, in increments of no more than 1 mm). Give them several minutes to plot and draw their graphs. Be sure they label the line “One Ice Cube.”
SAFETY TIPS The hair dryer used in this lesson is intended for use by the teacher only. Do not permit students to operate the hair dryer.
Use caution while operating the hair dryer near water. Always use dry hands, and be sure that the cord is positioned away from water at all times.
While the hair dryer is operating, it becomes hot. Hold the hair dryer only by the handle.
While blowing hot air on the ice, the glass beaker and the mesh fabric may become hot. Allow time for this equipment to cool down before touching.
HOW TO POSITION THE HAIR DRYER DURING INQUIRY 12.1FIGURE 12.2PHOTO: © 2013 Carolina Biological Supply Company
STC Earth Science Strand: Earth’s Dynamic Systems 214–A

CLIMATE AND ENERGY USELESSON
5. Direct students to look at the curve they have drawn, and explain that in the next part of the inquiry, they will use the data to predict what the curve will look like for melting three ice cubes.
Encourage students to recall not only the experiment they just conducted, but also their previous experiences with melting ice. For example, what happens to the ice cubes at the bottom of a glass? How do they melt?
Guide students to apply their knowledge of how ice melts and the data they just collected to using the hair dryer to melt three ice cubes. Working together, have groups draw a dashed line on their graphs to show the rate of ice melt they predict for three ice cubes. If students struggle with this idea, ask some of the following questions to those groups, or discuss them as a class:
• Do you think you will get more millimeters of meltwater in 30 seconds melting three ice cubes than you got while melting one?
• If so, will you get exactly three times the volume you got in 30 seconds from one cube?
• Will the time necessary to melt three ice cubes be the same as the time needed to melt one?
• When you draw a curve for how three ice cubes will melt, what do you think it will look like compared with the original curve?
Explain that groups will need to predict the amount of meltwater there will be at every 30-second interval and plot those points before drawing their curve. Tell them to use a dashed line to draw their prediction curve. Make sure students use a second colored pencil and label the line “Three Ice Cubes (Prediction).”
6. Allow time for students to set up another time/volume T-chart in their notebooks.
7. Repeat Step 3, this time with three ice cubes on the mesh above the beaker. Dry out the beaker with a paper towel, and be sure to use the same hair dryer setting and to position the dryer in the same way.
In theory, the model would scale perfectly, and the melting rate of three ice cubes would be exactly three times that of a single cube. You should expect to see the three ice cubes melting at a rate close to three times the rate of the single ice cube, however the model may not
scale perfectly. One possible explanation for this, which is discussed in Step 9B, is that the ice cubes in the three-cube experiment have a lower surface-to-volume ratio, with the interior of the three-cube heap protected from the heat.
NOTE You may assign Steps 8 and 9 for homework if there is not enough time to complete them in class. If you assign Step 8 as homework,
make sure that each student has copied the class data from the experiment into his or her science notebook before the end of the period. If you assign Step 9 as homework, students will need their science notebooks to answer the questions.
8. Have students use a third colored pencil to graph their data, making a new, solid line. They should label this line “Three Ice Cubes (Actual).”
9. With the class, discuss students’ answers to the questions on Student Sheet 12.1:
A. Answers will vary. Look for answers that describe the ice melting more slowly or more quickly than expected, or different volumes of meltwater than expected at various times.
B. Answers will vary. Students may describe the effects of what amounts to a larger interior for a three–cube heap than for a single ice cube, explaining that the larger interior is better protected from the hair dryer’s heat.
C. Answers will vary. Ask a few students to read what they wrote in their notebooks about their assumptions in Step 5.
D. Answers will vary. Students might mention the size of the iceberg relative to the hair dryer and the single ice cube; the fact that icebergs are partially submerged; the fact that icebergs float in their own meltwater; or uncertainty about scaling up so radically.
214–B STC Unit: Understanding Weather and Climate

inQUiry 12.2
CALCuLATINg YOuR CARBON FOOTpRINT
PROCEDURE
1
Read the introduction, “What Is a Carbon Footprint?” on Student Sheet 12.2a: Personal Emissions Calculator—Student Grid 1. The information on this sheet will help you understand the carbon footprint each of us leaves on the earth and ways to reduce that impact on the environment.
2
This activity on energy emissions and savings was developed by the United States Environmental Protection Agency. To get started, follow these directions to create a global warming wheel, which is needed for the inquiry:
A. Cut out the two wheels and the rectangular pieces in the Global Warming Wheel packet.
B. Align the wheels with the blank sides together and match up the four labels on the outside of the circles (Waste Disposal, Electricity Use, Home Heating, Transportation).
C. Cut out the large and small rectangular windows from each of the rectangular sheets “What’s Your Score?” and “What Can You Do?” from the Global Warming Wheel packet.
D. Align the small circle on the wheel of energy use with the small circle on the “What’s Your Score?” sheet. The words on the wheel will appear in the windows on the sheet. Place the paper fastener though the two small circles.
9
Answer the questions on Student Sheet 12.1. Then, discuss your ideas with the class.
A. On your graph of the rates of ice melt, is the line showing how fast the three ice cubes actually melted the same as the dashed line you drew for your prediction? If not, how does it differ?
B. What factors do you think might account for differences between these lines?
C. When you made your prediction and drew the dashed line, what assumptions did you make about how ice melts?
D. Could you use this process to predict how long an iceberg might take to melt? Why or why not? What else would you want to know before you tried to estimate an iceberg’s melt time?
STC Earth Science Strand: Earth’s Dynamic Systems 215
INQUIRY 12.2
PROCEDURE
1. Student Sheet 12.2a: Personal Emissions Calculator—Student Grid 1 was assigned for homework after the first period of this lesson. Ask students to take out their sheets, and have a volunteer read the introduction aloud to the class.
2. Explain that this inquiry will allow students to determine how much carbon dioxide their families’ activities produce each year. Distribute a Global Warming Wheel packet to each student. Display the wheel you have prepared as a model for students, and move around the classroom as students follow Steps A–G in their Student Guide to create their own wheels. Alternatively, you may want to lead the class in constructing the wheel.
STC Earth Science Strand: Earth’s Dynamic Systems 215

LESSONInquiry 12.2 continued
reFleCting ON WHAT YOU’VE DONE
1 Discuss these questions with your group and write your answers in your science notebook:
A. What did Inquiry 12.1 show you about the kinds of problems scientists think about when they try to make models that predict how climate change will affect some part of the earth?
B. What can you do as an individual to reduce your energy consumption and your carbon footprint?
C. What can you do as a class or a school to reduce your energy consumption and carbon footprint?
E. Turn the sheet and wheel combination over and place the second sheet, “What Can You Do?” so that the small circles line up and the smaller window is closer to you. Again, the words on the wheel will show up in the windows of the sheet. Finish connecting the sheets and the wheel with the paper fastener.
F. Glue the corners of the sheets together so that the wheel turns and the pieces hold together.
G. You can highlight the edges of the rectangular windows to make it easier to read.
3
If you haven’t done so already, complete Student Grid 1 on Student Sheet 12.2a.
4
Read the Introduction on Student Sheet 12.2b: Personal Emissions Calculator—Student Grid 2. Use the “What’s Your Score?” side of the global warming wheel to calculate your emissions per year. Record this information on your student sheet.
5
Work with your classmates to calculate the class average for emissions, and record this at the bottom of Student Sheet 12.2b.
6
Use the “What Can You Do?” side of the global warming wheel to calculate potential emissions reductions for your family. Record this information on Student Sheet 12.2b.
7
Read “Alternatives to Fossil Fuels,” on pages 222–227.
216 STC Unit: Understanding Weather and Climate
Climate and energy Uselesson 12
3. Check that students have completed Student Sheet 12.2a. If they do not have data, give them the data you prepared.
4. Have students use their “What’s Your Score?” side of the global warming wheel to calculate their carbon emissions. They should record their data on Student Sheet 12.2b: Personal Emissions Calculator—Student Grid 2.
5. Students should analyze their data and calculate a class average for carbon emissions.
6. Have students use their “What Can You Do?” side of the global warming wheel to calculate potential emissions reductions for their families. Again, this information should be recorded on their student sheets.
7. Have students read “Alternatives to Fossil Fuels” on pages 222–227.
REFLECTING ON WHAT YOU’VE DONE1. Have students answer the questions in their science notebooks, and discuss their answers as a class:
A. Answers will vary. Students may mention specific questions about factors affecting ice melt, or about the uncertainties of scaling up and extrapolating, or they may answer more generally. They may also focus on questions of how one measures a phenomenon.
B. Answers will vary, but should focus on realistic suggestions.
C. A review of projects described online will reveal many possibilities, as well as suggestions from the Environmental Protection Agency and the Department of Energy.
216 STC Unit: Understanding Weather and Climate

HOMEWORK
Period 1Pass out Student Sheet 12.2a: Personal Emissions Calculator—Student Grid 1 and have students fill in the grid in preparation for Inquiry 12.2. If students are unable to get the information, they can use the data you prepared for them. Emphasize that Inquiry 12.2 will be much more meaningful if students use data from their own household, rather than sample data.
Period 3 Have students prepare for the final assessment by reviewing all inquiries and their student sheets, and completing Student Sheet 12. “Getting Started” of Lesson 13 serves as a review session in which students can discuss their answers and ask questions before the final assessment.
ASSESSMENT
Examine students’ science notebooks from Inquiry 12.1 and Inquiry Master 12.1 to assess their ability to record data, build graphs with minimal supervision, project imaginatively and insightfully given new data and prior knowledge, and explain assumptions underlying their hypotheses.
Examine Student Sheet 12.1 to assess students’ ability to use experimental results to critique their own hypotheses. This sheet will also allow you to see how students grapple with a new idea: the question of a model’s scalability.
Examine Student Sheet 12.2b to assess students’ ability to calculate carbon dioxide emissions and potential reductions.
STC Earth Science Strand: Earth’s Dynamic Systems 216–A

CLIMATE AND ENERGY USELESSON
TEACHER’S NOTES
216–B STC Unit: Understanding Weather and Climate

cientists have collected evidence of global climate change for decades. What the data mean, though, has been the subject of intense
debate over the years.
In the 1970s, many scientists forecast a new ice age, with the planet cooling to a point not seen since glaciers covered the upper Midwestern United States. The forecast was based on research on air pollution coupled with a brief cooling trend. At the time, the skies were badly polluted with industrial smog, soot, and exhaust. The pollution made for hazy skies and dim sunlight, and scientific evidence showed that an atmospheric blanket of soot—manmade or volcanic—could block enough sunlight to lower the earth’s temperature.
But atmospheric scientists at this time were also aware of a “greenhouse effect,” the idea that certain gases in the atmosphere could trap heat radiated and reflected from the earth’s surface. It was thought that greenhouse gases might actually protect the planet from a new ice age. Even so, by the 1980s some scientists were sounding an alarm. Not only had they found levels of greenhouse gases rising quickly, but it now looked as though the earth’s temperature was rising, not falling. In the ensuing confusion, scientists met regularly to discuss whether or not global warming was happening. If it was happening, how fast was the planet warming, and just how warm might it get? What might that mean for life on earth? And why was it
happening? There was a great deal they’d have to learn about earth’s climate, they realized, before they could begin to answer these questions.
In 1988, the United Nations formed an international group of highly esteemed scientists to examine the climate-change science being published—thousands of papers—and report on what they read. This was the Intergovernmental Panel on Climate Change (IPCC), and it is still recognized as a major authority on climate-change science.
The IPCC determined that the planet was indeed warming. At first the findings were tentative, but evidence increased as researchers asked new questions related to global warming, and collected data to answer them. There was disturbing evidence that the planet might be warming faster than scientists had originally thought—and there were dismaying reports from polar scientists, who spoke urgently about rapid glacier melting, ice shelf disintegration, and permafrost melting. Consensus that the earth was warming strengthened—and the IPCC’s second report said humans were likely at fault.
Attention turned, urgently, to why the earth was warming. Was it really because of greenhouse gases humans had released into the atmosphere? Was it a natural process? Or was it a combination, and if so, how much were humans responsible for? These were important questions: if global warming was mainly a result of greenhouse-gas pollution, we would have to
reading seleCtiOn extending yoUr knowledge
STC Earth Science Strand: Earth’s Dynamic Systems 217
STC Earth Science Strand: Earth’s Dynamic Systems 217

LESSON
reading seleCtiOn extending yoUr knowledge
change our way of life—and do it fast. It would be an expensive, difficult change, and not one to be undertaken unless it really was necessary.
These were also tough scientific questions to answer. Humans are not the only source of greenhouse-gas pollution on earth. The earth itself releases gases into the atmosphere all the time through volcanoes and other vents. How could human-generated, or anthropogenic, pollution be separated from the earth’s?
In the 1990s, the only way to answer the question was to measure total atmospheric carbon dioxide levels, find the change from the year before, and then try to figure out how much carbon dioxide humans had added to the atmosphere. Scientists did that by totaling the amount of fossil fuel sold worldwide in the previous year, assuming it had all been burned, and calculating how much carbon dioxide it would have released. The difference between the total carbon dioxide change and our contribution would show the percentage for which humans were responsible. This was only a rough estimate, and the imprecision gave scientists and policymakers plenty to argue about.
The IPCC continued to produce reports. In 2007, its fourth report said that, taken together, the world’s climate studies indicated a 90–99% chance that global warming was anthropogenic, and that the earth had warmed by 0.75°C in the last hundred years. It was real, it was still going on, and it was almost certainly our doing.
scientists drill Holes in taylor glacier in antarctica to record its temperature, movement, and melting. tHis information Helps in monitoring global climate cHange. PHOTO: Kristan Hutchison/National Science Foundation
218 STC Unit: Understanding Weather and Climate
Climate and energy Uselesson 12
218 STC Unit: Understanding Weather and Climate

extending yoUr knowledge
scientists from several major institutions—nasa’s goddard institute for space studies (giss), noaa’s national climatic data center (ncdc), tHe japanese meteorological agency, and tHe met office Hadley centre in tHe united kingdom—tally tHe temperature data collected at stations around tHe world and make independent judgments about wHetHer tHe year was warm or cool compared to previous years. all four records in tHis grapH sHow peaks and valleys in sync witH eacH otHer. all sHow particularly rapid warming in tHe past few decades. and all sHow tHat tHe last decade was tHe warmest. PHOTO: NASA Earth Observatory/Robert Simmon, Data Sources: NASA Goddard Institute for Space Studies, NOAA National Climatic Data Center, Met Office Hadley Centre/Climatic Research Unit, and the Japanese Meteorological Agency.
STC Earth Science Strand: Earth’s Dynamic Systems 219
STC Earth Science Strand: Earth’s Dynamic Systems 219

LESSON
reading seleCtiOn extending yoUr knowledge
CLIMATE MODELING AND PREDICTIONSo what does all the IPCC’s information mean for us? Does it really matter if the earth warms by a couple of degrees? If we stop driving cars, does global warming stop? To answer these questions, scientists have taken data on how the climate has changed before—over hundreds, thousands, millions, and billions of years—and tried to determine how and why climates changed in the past. What happened to the earth when it last warmed, when glaciers melted and
their weight was no longer on land masses? What happened to the weather? What happened to life when the earth warmed slowly, and what happened when it warmed quickly?
Answering these seemingly simple questions is a very complex process. It requires trying to determine the relationships between thousands of measurable changes. For instance, for every tenth of a degree that the surface atmosphere warms, how far northward do tropical plants move?
tHis map sHows global temperatures in 2008 in relation to averages from a baseline period from 1950–1980. below-average temperatures (i.e., less tHan tHe baseline period) in 2008 are sHown in blue, average temperatures are wHite, and above-average temperatures are red. PHOTO: NASA image by Robert Simmon, based on GISS surface temperature analysis data
220 STC Unit: Understanding Weather and Climate
Climate and energy Uselesson 12
220 STC Unit: Understanding Weather and Climate

extending yoUr knowledge
Building a reliable description of these relationships is called building a model, or an idea of how things work. Models are built on assumptions. For instance, scientists building a hurricane model might assume that an increase of 2 percent in sea surface temperature (SST) increases the hurricane’s rainfall by 8 percent. Another team might assume that a 2 percent increase in SST increases hurricane rainfall by 14 percent.
Why do different groups of scientists make different assumptions? Because the evidence varies. If there is real evidence suggesting that a 2 percent increase in SST bumps up rainfall by 8 percent sometimes, and 14 percent sometimes, either assumption might be valid. As scientists study hurricanes more and come to understand them better, they may be able to say, “Well, yes, rainfall goes up by 14 percent sometimes, but only when a few other things also happen.” Then they can refine the models to reflect their deeper understanding of hurricanes. They might also understand better when to use each model, choosing among them as if choosing the right tool from a toolbox.
1. What is hindcasting and how does it help us understand climate change?
2. In the 1970s, many scientists thought the earth was cooling. Now most believe the earth is warming. Should we trust them to make predictions? Why or why not?
disCUssion QUestions
By asking precise questions about climate, building models, and combining the models, scientists can predict with increasing accuracy and precision how the earth might change as it warms.
A problem with using models to predict the future is that the future hasn’t happened yet, so scientists can’t test whether a model is correct. What they can do, though, is see how well models work on the past. If a model is applied backwards in time, do the results match the actual past? This type of model testing is called hind-casting, or back-testing.
Our knowledge about the earth’s environment has grown explosively since scientists talked about a new ice age. Urgent questions have driven its growth. But as you explore climate change modeling, take time to enjoy the great payoffs on the way to the answers: the beauty of the models, and just how amazing it is to see and know so much about the earth as a dynamic planet. n
STC Earth Science Strand: Earth’s Dynamic Systems 221
STC Earth Science Strand: Earth’s Dynamic Systems 221

LESSON
reading seleCtiOn extending yoUr knowledge
n the context of the long history of carbon dioxide concentrations in the atmosphere, current levels are relatively low. However,
they are rising rapidly, and because carbon dioxide is a greenhouse gas, its increase contributes to global warming. Reducing global warming is one incentive for a search for renewable alternatives to fossil fuels, which release carbon dioxide when they’re burnt.
Many alternate sources of energy have been around for millennia—thousands of years before we began mining coal, oil, and natural gas from the earth. Wood has been used as a fuel since fire was discovered. The Greeks and Romans used the power of falling water to turn wheels. These ancient sources, along with newer ones, offer promise for renewable sources of power.
Other alternative, renewable sources of energy take advantage of modern chemistry and physics, and have been in use for only a few decades. What all non-fossil energy sources have in common, though, is that they come with their own costs and problems. Here, we’ll look at the pros and cons of several alternatives to fossil fuels.
WIND POWERWindmill blades are attached to a generator housed at the top of a 60- to 90-meter (200- to 300-foot) pole. When wind blows, windmill blades turn a shaft, which spins a turbine even faster. Inside the turbine is a shaft wrapped in wire cables; around the wire lies a ring of magnets. When the wire spins inside this magnetic field, an electric current is generated in the wire.
If you’ve seen a wind farm at work, it might look as though the blades are turning slowly. In fact, because the blades are so long—about 21 to 40 meters (70 to 130 feet)—they’re turning very fast at the tip. The blade tips can reach speeds of over 90 meters (295 feet) per second in a good wind.
The use of wind power has grown from small windmills on individual farms to large numbers arrayed in wind farms. Over the last decade, the amount of electricity generated by wind power has increased by 25 percent per year. Despite the increase, this amount is still small; by the end of 2010, only 2.5 percent of the world’s electricity came from wind power.
Alternatives to Fossil Fuels
222 STC Unit: Understanding Weather and Climate
Climate and energy Uselesson 12
222 STC Unit: Understanding Weather and Climate

extending yoUr knowledge
Windmills have the advantage of working in any place where the wind blows strongly and consistently. They work well in the ocean and in many parts of the United States. They produce no carbon emissions, smog, or smoke, and wind power is renewable as long as the sun shines.
So what’s the downside? The amount of power produced by wind farms changes with the wind, and they often have to be placed far from population centers. Although they’re clean, they’re not pollution free: they produce noise and light-effects pollution. The light flicker they cause can make people feel ill, and the shadows
cast by the blades and windmill towers can damage property values. They can also interfere with bird migration patterns and weather radar.
There’s also the question of what effect taking all that energy out of the atmosphere might have. The atmosphere has a “downstream” just as rivers do, and we don’t know yet what weaker winds downstream might mean for climate. Early evidence says that wind farms have no perceptible downstream effect, but we need to know what problems might emerge if we tried to get a large part of our energy from wind.
wind farm in copenHagen, denmark PHOTO: www.cgpgrey.com/creativecommons.org
STC Earth Science Strand: Earth’s Dynamic Systems 223
STC Earth Science Strand: Earth’s Dynamic Systems 223

LESSON
reading seleCtiOn extending yoUr knowledge
SOLAR POWERWhen we talk about using solar power to generate electricity, though, we are talking about capturing sunlight’s energy ourselves and converting it directly into electrical or heat energy. This energy can be captured by using photovoltaic cells, which are sensitive to individual photons, or particles of light.
In the top layer of a photovoltaic cell are atoms whose electrons can be knocked out of position by photons. These electrons can be made to flow in order to generate an electrical current.
Since many solar cells need bright sunlight to work well, their energy output varies with weather and the seasons. People who use solar power systems store energy on bright days, and can use backup sources of electricity on cloudy
solar array PHOTO: Photo by Jurvetson (flickr)
224 STC Unit: Understanding Weather and Climate
Climate and energy Uselesson 12
224 STC Unit: Understanding Weather and Climate

extending yoUr knowledge
days and at night. The cost of photovoltaic-system installation and maintenance remains relatively high—it’s unlikely, for instance, that your home will have solar cells on the roof—but the costs have come down in the last decade, and new materials are making solar cells more efficient. It’s possible that someday photovoltaic cells will produce energy as cheaply as fossil fuels do today, even in places that don’t get lots of bright, direct sunlight.
GEOThERMAL ENERGyGeothermal energy comes from heat generated deep within the earth by radioactive atoms. This heat is conducted from the molten core through the bedrock to the surface. Hot springs, deep-water reservoirs, and steam vents are all sources of geothermal heat.
Some people heat their homes by pumping water dozens of feet into the ground, where it’s warmed and returned to their homes. But power generation plants need hotter water or even steam to drive turbines. They must go deeper into the earth—sometimes miles deep—or use heat that comes from magma welling up through the crust. Recently, some companies have begun cracking bedrock deep in the earth, pumping water down to it, and returning heated steam to the surface.
Currently less than 1% of the United States’ electricity is geothermally generated, though in a few parts of the world, 10–25% of electricity comes from the earth’s heat. Geothermal is renewable, though individual wells may eventually run out of water or cool off. There are risks with geothermal energy. Geothermally heated steam can carry dissolved toxic elements and compounds from deep within the earth to the surface. They can damage the environment if they’re released. Also, cracking bedrock for geothermal power production can cause earthquakes. This cracked bedrock can’t be repaired, if in the future we discover that this has lead to unintended problems.
BIOFUELSPlants and animals are biomass: the living weight of the world. Wood is a biomass fuel, or biofuel. In many countries, people burn plant and agricultural waste such as the stubble left in fields after harvest. Biofuel also comes in the form of methane, a gas released by bacteria in landfills as they break down plant and animal wastes. Certain crops, such as corn, sugar cane, and switchgrass, can be converted to alcohols and burned as motor fuel. This, too, is biofuel. Biodiesel is a biomass replacement for gasoline, a fossil fuel made from petroleum. Biodiesel is made from vegetable oil, used cooking grease from restaurants, and animal fat.
Biofuels do not, on balance, add carbon dioxide to the atmosphere. Organisms take carbon from the air while living, and return it to the air when burnt. Unfortunately, producing biofuels adds carbon dioxide to the atmosphere. Cheap diesel and gasoline power the equipment used to grow, harvest, process, and transport biofuels.
Clearing land so that farmers can grow biofuels also causes problems. Grassy fields and forests are “carbon sinks:” places where carbon is taken out of the atmosphere and kept out for a long time. Killing those plants and disrupting their soil for biofuel farms destroys that carbon sink. In addition, using farmland to grow fuel also reduces the amount of land and water that can be used to grow food crops, and this may lead to food shortages or higher food prices.
Scientists studying the future of biofuels are studying single-celled organisms, like algae, which can be grown in salt water, and won’t compete with edible crops. Studying algae is not so easy to do: scientists have been working on it for over half a century. Algae farms are easily contaminated. So far, biologists have found that in order to keep large algal cultures alive and well, they need to grow them in controlled environments, in tanks or artificial ponds. And that takes—energy.
STC Earth Science Strand: Earth’s Dynamic Systems 225
STC Earth Science Strand: Earth’s Dynamic Systems 225

LESSON
experts working to install a fuel cell into an f/a-18e super Hornet aircraft. PHOTO: U.S. Navy photo by Mass Communication Specialist 3rd Class Shawn J. Stewart
reading seleCtiOn extending yoUr knowledge
hyDROGEN FUEL CELLSThe hydrogen fuel cell consists of three parts sandwiched together. The “bread slices” are an anode (positively charged) and a cathode (negatively charged); between them is an electrolyte, or liquid, that can carry electrical charges.
The anode is a metal plate, usually platinum, that can strip hydrogen of its electron. All that’s left of hydrogen atoms after stripping are the protons which are pulled through the electrolyte to the cathode. The electrons would like to follow, but the electrolyte won’t let them pass through. They must get to the cathode by flowing outside the cell and back again to the cathode,
and that flow is an electrical current. Once electrons reach the cathode, they and the protons react with oxygen, which is also steamed into the cathode. The reaction creates water (H
2O) and
generates heat.
Hydrogen fuel cells can be used to power many things, from cars to electrical plants. There’s a problem though. Platinum, the favored anode metal, is very expensive. Over time, substitutes are being developed that may prove to be important in getting fuel cells into widespread use. Another issue is how hydrogen fuel stations can be set up and used safely, since hydrogen is explosive.
226 STC Unit: Understanding Weather and Climate
Climate and energy Uselesson 12
226 STC Unit: Understanding Weather and Climate

extending yoUr knowledge
1. Why are we not already reliant just on alternative energy sources, such as wind power, solar power, and geothermal power? Explain what has limited the use of these alternatives.
2. Famous scientists have come out in support of building more nuclear power plants, saying they are a reliable source of power and less dangerous to the environment than burning more fossil fuels. Do you agree? How could you measure the relative dangers and decide in a scientific way?
disCUssion QUestions
NUCLEAR POWERNuclear power plants currently produce about 20 percent of the world’s energy. Nuclear plants split atomic nuclei in a controlled setting to produce very large quantities of energy, which heats water and turns it to steam. The steam drives turbines, which produce electrical current.
Nuclear power does not produce greenhouse gases, and many environmentalists promote its use. However, splitting atoms does produce dangerously radioactive waste, which remains radioactive for thousands of years. There currently is no satisfactory means of storing this waste. In the past, nuclear waste has been dumped into the ocean; the United States has shipped nuclear waste to a hollowed out mountain in Nevada called Yucca Mountain. In 2011, Congress voted to stop funding the nuclear waste repository there, leaving the United States with no long-term nuclear waste storage facility.
Nuclear power plants can be extremely dangerous if explosions damage the reactors and release radioactive gases to the air, or leak radioactive water to the ground. Heavy exposure to radioactivity has a number of impacts on humans, including cancers and birth defects.
There have been serious accidents at nuclear power plants, releasing radioactivity into the environment. Three Mile Island nuclear plant in Pennsylvania averted a major disaster in 1977, but still released radioactivity into the air. In 1986, an explosion at a nuclear power plant in Chernobyl, Ukraine, contaminated much of Europe and the western Soviet Union with radiation. And in 2011, an earthquake and tsunami severely damaged nuclear reactors at Fukushima, Japan, releasing radioactive material into groundwater and the air.
In the wake of the Fukushima disaster, many countries are having second thoughts about nuclear energy. Because the Fukushima plant leaked radiation after being hit by both an earthquake and a tsunami, many governments are considering how to strengthen nuclear plants so that they can withstand natural disasters.
WhAT’S ThE ANSWER?Do the risks associated with alternative energy sources mean we should just stick to fossil fuels? No! Risks are also associated with the use of fossil fuels—burning them adds carbon dioxide to the atmosphere. Furthermore, we are compelled to explore and use alternatives because fossil fuels will eventually run out. We need to do more research into alternative fuels to discover how we might use them in ways we can live with—more cleanly, more cheaply, and more efficiently. n
STC Earth Science Strand: Earth’s Dynamic Systems 227
STC Earth Science Strand: Earth’s Dynamic Systems 227