Understanding Visual Saliency in Mobile User Interfaces
20
Understanding Visual Saliency in Mobile User Interfaces LUIS A. LEIVA, Aalto University, Finland YUNFEI XUE, Aalto University, Finland AVYA BANSAL, Indian Institute Of Technology, Goa, India HAMED R. TAVAKOLI, Nokia Technologies, Finland TUĞÇE KÖROĞLU, Yildiz Technical University, Turkey JINGZHOU DU, Huawei Technologies, China NIRAJ R. DAYAMA, Aalto University, Finland ANTTI OULASVIRTA, Aalto University, Finland For graphical user interface (UI) design, it is important to understand what attracts visual attention. While previous work on saliency has focused on desktop and web-based UIs, mobile app UIs difer from these in several respects. We present indings from a controlled study with 30 participants and 193 mobile UIs. The results speak to a role of expectations in guiding where users look at. Strong bias toward the top-left corner of the display, text, and images was evident, while bottom-up features such as color or size afected saliency less. Classic, parameter-free saliency models showed a weak it with the data, and data-driven models improved signiicantly when trained speciically on this dataset (e.g., NSS rose from 0.66 to 0.84). We also release the irst annotated dataset for investigating visual saliency in mobile UIs. CCS Concepts: · Human-centered computing → Empirical studies in ubiquitous and mobile computing; · Computing methodologies → Computer vision. Additional Key Words and Phrases: Human Perception and Cognition; Interaction Design; Computer Vision; Deep Learning ACM Reference Format: Luis A. Leiva, Yunfei Xue, Avya Bansal, Hamed R. Tavakoli, Tuğçe Köroğlu, Jingzhou Du, Niraj R. Dayama, and Antti Oulasvirta. 2020. Understanding Visual Saliency in Mobile User Interfaces. In 22nd International Conference on Human-Computer Interaction with Mobile Devices and Services (MobileHCI ’20), October 5ś8, 2020, Oldenburg, Germany. ACM, New York, NY, USA, 20 pages. https://doi.org/10.1145/3379503.3403557 1 INTRODUCTION For a graphical object, the notion of visual saliency refers to the ability to attract visual attention, for the given visual properties of that object and the rest of the display [4]. In practice, attention is drawn to visually unique stimuli. Through use of color and boldface, the three words above stand out relative to the rest of this paragraph. Regions and objects that are unique in terms of visual primitives ś such as size, color, shape, orientation, or motion ś tend to stand out [32, 64]. The biological basis for this phenomenon is well-known [59]: saliency emerges in parallel processing of retinal input at lower levels in the visual cortex [61]. From mature-level research on saliency has sprung a wealth of Permission to make digital or hard copies of all or part of this work for personal or classroom use is granted without fee provided that copies are not made or distributed for proit or commercial advantage and that copies bear this notice and the full citation on the irst page. Copyrights for components of this work owned by others than the author(s) must be honored. Abstracting with credit is permitted. To copy otherwise, or republish, to post on servers or to redistribute to lists, requires prior speciic permission and/or a fee. Request permissions from [email protected]. © 2020 Copyright held by the owner/author(s). Publication rights licensed to ACM. Manuscript submitted to ACM
Transcript of Understanding Visual Saliency in Mobile User Interfaces
Understanding Visual Saliency in Mobile User Interfaces
LUIS A. LEIVA, Aalto University, Finland
YUNFEI XUE, Aalto University, Finland
AVYA BANSAL, Indian Institute Of Technology, Goa, India
HAMED R. TAVAKOLI, Nokia Technologies, Finland
TUĞÇE KÖROĞLU, Yildiz Technical University, Turkey
JINGZHOU DU, Huawei Technologies, China
NIRAJ R. DAYAMA, Aalto University, Finland
ANTTI OULASVIRTA, Aalto University, Finland
For graphical user interface (UI) design, it is important to understand what attracts visual attention. While previous work on saliency
has focused on desktop and web-based UIs, mobile app UIs difer from these in several respects. We present indings from a controlled
study with 30 participants and 193 mobile UIs. The results speak to a role of expectations in guiding where users look at. Strong bias
toward the top-left corner of the display, text, and images was evident, while bottom-up features such as color or size afected saliency
less. Classic, parameter-free saliency models showed a weak it with the data, and data-driven models improved signiicantly when
trained speciically on this dataset (e.g., NSS rose from 0.66 to 0.84). We also release the irst annotated dataset for investigating visual
saliency in mobile UIs.
CCS Concepts: · Human-centered computing → Empirical studies in ubiquitous and mobile computing; · Computing
methodologies → Computer vision.
Additional Key Words and Phrases: Human Perception and Cognition; Interaction Design; Computer Vision; Deep Learning
ACM Reference Format:
Luis A. Leiva, Yunfei Xue, Avya Bansal, Hamed R. Tavakoli, Tuğçe Köroğlu, Jingzhou Du, Niraj R. Dayama, and Antti Oulasvirta.
2020. Understanding Visual Saliency in Mobile User Interfaces. In 22nd International Conference on Human-Computer Interaction
with Mobile Devices and Services (MobileHCI ’20), October 5ś8, 2020, Oldenburg, Germany. ACM, New York, NY, USA, 20 pages.
https://doi.org/10.1145/3379503.3403557
1 INTRODUCTION
For a graphical object, the notion of visual saliency refers to the ability to attract visual attention, for the given visual
properties of that object and the rest of the display [4]. In practice, attention is drawn to visually unique stimuli.
Through use of color and boldface, the three words above stand out relative to the rest of this paragraph. Regions and
objects that are unique in terms of visual primitives ś such as size, color, shape, orientation, or motion ś tend to stand
out [32, 64]. The biological basis for this phenomenon is well-known [59]: saliency emerges in parallel processing of
retinal input at lower levels in the visual cortex [61]. From mature-level research on saliency has sprung a wealth of
Permission to make digital or hard copies of all or part of this work for personal or classroom use is granted without fee provided that copies are not
made or distributed for proit or commercial advantage and that copies bear this notice and the full citation on the irst page. Copyrights for components
of this work owned by others than the author(s) must be honored. Abstracting with credit is permitted. To copy otherwise, or republish, to post on
servers or to redistribute to lists, requires prior speciic permission and/or a fee. Request permissions from [email protected].
© 2020 Copyright held by the owner/author(s). Publication rights licensed to ACM.
Manuscript submitted to ACM
MobileHCI ’20, October 5ś8, 2020, Oldenburg, Germany L. A. Leiva et al.
applications in visual computing, scene classiication [53], video summarization [37], image segmentation [40] and
compression [45], object detection [29], and other areas. Nevertheless, predictingwhere people look at is paradigmatically
more ambiguous than typical computer vision tasks such as image segmentation or object detection, since users weight
visual features diferently when deciding where to look [68].
User interface (UI) designers examine visual saliency to understand what users will be drawn to when seeing a
display, and to avoid designs that appear cluttered [48, 54]. Inexpensive commodity eye-trackers have made empirical
data collection more popular. However, while some indings have been reported for desktop- and web-speciic UIs, no
published empirical research on visual saliency has focused on mobile ones. This is alarming, sicne these devices are
among today’s most prevalent computing terminals. To our knowledge, the only study in this area is one by Gupta
et al. [17], who used crowdsourced data to validate computational models on mobile UIs, but did not report factors
afecting saliency.
Xu et al. [65] (with follow-up by Ni et al. [42]) investigated touch saliency for mobile devices as a method estimating
saliency from touch points. However, touch points are not tantamount with visual saliency. Moreover, the experimental
stimuli used were outdoor scenes, not UIs. Later on, Xu et al. [66] predicted saliency for desktop UIs, taking as input the
users’ mouse and keyboard actions, but this setup cannot be transferred to mobile UIs. While Shen et al. [52] used an
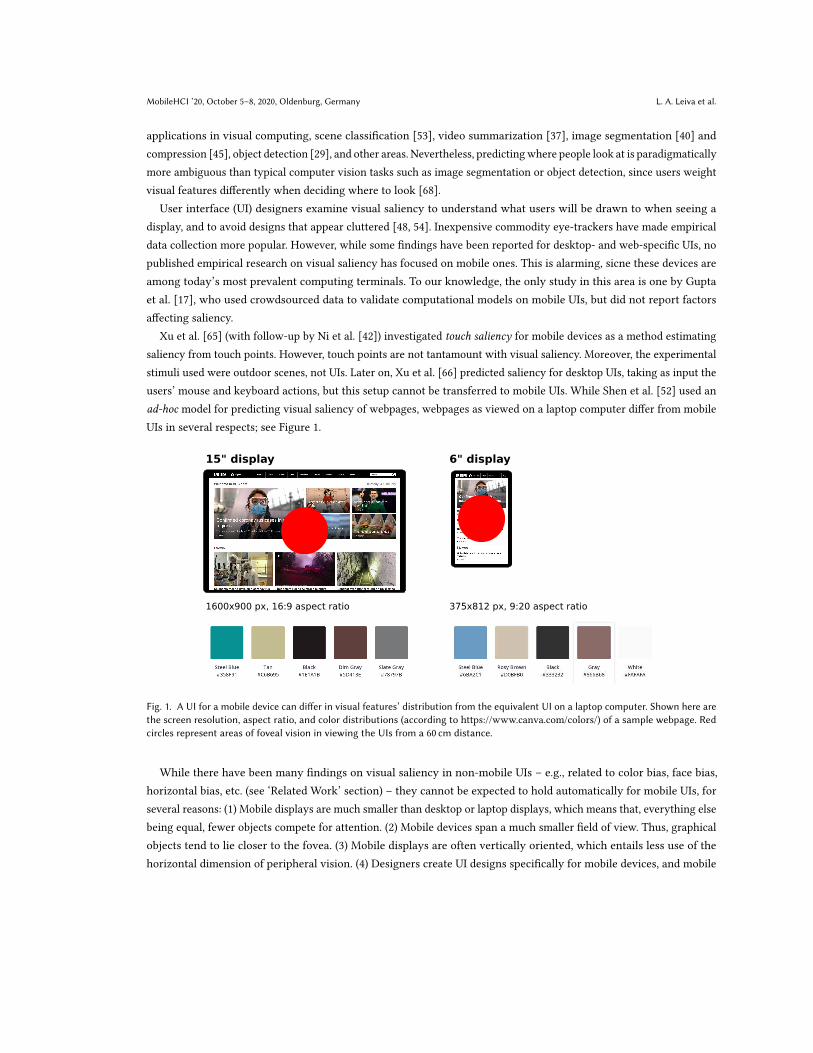
ad-hoc model for predicting visual saliency of webpages, webpages as viewed on a laptop computer difer from mobile
UIs in several respects; see Figure 1.
15" display 6" display
1600x900 px, 16:9 aspect ratio 375x812 px, 9:20 aspect ratio
Fig. 1. A UI for a mobile device can difer in visual features’ distribution from the equivalent UI on a laptop computer. Shown here arethe screen resolution, aspect ratio, and color distributions (according to https://www.canva.com/colors/) of a sample webpage. Redcircles represent areas of foveal vision in viewing the UIs from a 60 cm distance.
While there have been many indings on visual saliency in non-mobile UIs ś e.g., related to color bias, face bias,
horizontal bias, etc. (see ‘Related Work’ section) ś they cannot be expected to hold automatically for mobile UIs, for
several reasons: (1) Mobile displays are much smaller than desktop or laptop displays, which means that, everything else
being equal, fewer objects compete for attention. (2) Mobile devices span a much smaller ield of view. Thus, graphical
objects tend to lie closer to the fovea. (3) Mobile displays are often vertically oriented, which entails less use of the
horizontal dimension of peripheral vision. (4) Designers create UI designs speciically for mobile devices, and mobile
Understanding Visual Saliency in Mobile User Interfaces MobileHCI ’20, October 5ś8, 2020, Oldenburg, Germany
UIs may feature a diferent distribution of visual primitives. For example, interactive elements such as buttons are
relatively large in comparison to their desktop versions. (5) Users may have learned diferent strategies for looking at
mobile UIs, relecting the visual characteristics or underlying tasks involved. As the viewport and the distribution of
visual primitives change, so does saliency. Figure 1 shows an example comparison of screen size and color distribution
between a typical laptop and mobile device. In sum, what may be salient in a desktop UI may be less or more so in its
mobile analogue.
Computational models too need to be reassessed for this special context. In recent decades, plausible and accurate
computational models of visual saliency have emerged. Early (łclassicž) models [25, 46] were based on biologically
motivated visual primitives (color, shape, etc.), followed by centerśsurround operations highlighting local changes,
which were combined into a łconspicuity mapž [19, 25]. In the last ive years, data-driven models, most recently using
deep learning, have surpassed these in predictive accuracy [20]. However, deep learning models are trained on particular
visual features and may fail when the underlying distribution changes. Critical validation of computational models
is important, since they could play a strong role in interface design [48]. We see two main uses of these models: An
inverse approach starts with behavioral data, such as scrolling or cursor movement logs, and produces heatmaps of the
UI regions that are most likely attended [66]. A forward approach takes a display as input and produces a ixation map
depicting predictions as to the most salient areas [11]. Using a sound computational model of visual saliency, designers
can make changes to a UI layout and predict the efects without having to run user studies.
This paper presents the irst empirical investigation of statistical efects of visual saliency in mobile UIs and validation
of several well-known computational models, including state-of-the-art deep learning models, from high-quality eye-
tracking data. We collected the data for a large number of representative (stock) mobile interfaces viewed from a
distance typical for a mobile device, using a high-idelity stationary eye-tracker that is calibrated regularly to minimize
drift. We studied the Chinese mobile ecosystem because it is currently the largest one,1 though our results should be
easy to replicate in other cultures, given that bottom-up saliency is a general phenomenon of attention. In summary,
the contribution of this paper is threefold: (1) we assess known saliency-related phenomena with mobile devices,
among them biases toward learned locations and features; (2) we report several validation metrics for models of visual
saliency, showing that state-of-the-art deep learning models can improve signiicantly in accuracy when trained on a
mobile-speciic dataset; and (3) we release the irst dataset for visual saliency of mobile UIs, which includes ixation
data on 193 UIs annotated with per-element labels and bouding boxes.
2 RELATEDWORK
Visual saliency is the perceptual quality of some objects or regions attracting attention by standing out from the rest of
the view [25]. Saliency has a role in the control of visual attention, especially in picking the next ixation points [24, 60].
Below, we review the empirically known efects of saliency, which we assessed in the case of the new dataset, and the
state of computational modeling in this area.
2.1 Empirical evidence on saliency
What is salient is afected by both bottom-up and top-down factors. The former are characterized by uniqueness in
visual primitives of the stimulus, such as color, shape, size, orientation, or motion. An object that is unique in these
respects tends to draw attention. For instance, in an image full of green tones and green-illed shapes, if a color such as
1 See e.g. https://www.statista.com/topics/1416/smartphone-market-in-china/
MobileHCI ’20, October 5ś8, 2020, Oldenburg, Germany L. A. Leiva et al.
red appears, observers tend to look at the red shape [36]. Top-down factors include task goals and expectations that are
based on the learned statistical distribution of features; see e.g., [50]. For example, in many natural scenes that show a
horizon, most information lies close to the horizontal medial line, which also attracts attention. When the visual task
or content changes, both bottom-up and top-down factors may change. Therefore, a saliency-related empirical efect
reported for one context does not trivially carry over to another.
Prior research looking at saliency of natural scenes has found several replicated efects, or biases, which we revisit in
this paper:
1. Center bias: Studies have reported a bias toward looking at the center of the screen when viewing natural
scenes [22, 43]. This is supposedly driven by the statistical distribution of image features in such scenes [55, 58].
However, the efect has been replicated with other media, such as video [38], text [47], and single objects [43]. Whether
this holds for mobile UIs is unclear, since much of their most informative elements lie in the upper half of the UI. That
said, gazing in the middle might yield the best overview of the UI for peripheral vision.
2. Horizontal bias: In looking at natural images featuring objects, ixations tend to be distributed more horizontally
than vertically [43, 44]. Again, mobile UIs difer from natural scenes in that they organize the information vertically,
not horizontally. Therefore, we might see this efect weaken.
3. Color bias: Thus far, color brightness and contrast have been counted among the primary features driving bottom-
up saliency [13, 18]. Mobile UIs typically contain colorful icons and images that may be perceived as highly salient;
therefore, we would expect this efect to hold.
4. Text bias: Perhaps due to the importance of textual materials in lived environments, a bias toward textual elements
has been reported [23, 63]. When an observer is told not to look at text, initial ixations take longer [8]. In mobile UIs,
text plays a similarly important role, also in icons, labels, headings, logos, etc. This efect may, therefore, still exist.
5. Face bias: Perhaps because of evolutionary advantages, attention is drawn to human faces [8, 29]. Initial ixations
have been found to take longer when the user is asked to avoid faces [8]. Mobile UIs often include graphics that may
contain faces. However, faces play a less informative role in mobile UIs, because they are typically not interactive
elements. Hence, this efect might be expected to decrease or disappear.
2.2 Computational saliency models
Given a stimulus image, a computational model of visual saliency produces a density map showing the amount of
conspicuity ś that is, how much a pixel stands out against other pixels. In this paper, we compare two model types.
(1) Bottom-up models, or stimulus-driven, are based on visual primitives such as color, size, and shape [4, 5]. These models
can be expected to work well in the case of a user shown a UI for the irst time for free viewing [14, 25]. (2) Data-driven
models are models that, though make predictions based on image features [3], are trained using eye-movement data and
may have architectural assumptions inspired by bottom-up models. They can therefore better capture domain-speciic
phenomena, such as variations in viewing strategies or expectations as to where the most interesting elements are.
They may better capture visual statistical learning, or how people learn to predict where to look on the basis of learned
feature distributions [50]. However, while deep-learning-based data-driven approaches are currently outperforming
stimulus-driven models with natural scenes, they fall short in terms of ability to capture some pop-out efects in
synthetically generated patterns [21]. Given the strengths and weaknesses of the two approaches, we decided to
investigate both. In the łComputational Modelingž section, we describe the models chosen for our experiments and
compare their performance.

Understanding Visual Saliency in Mobile User Interfaces MobileHCI ’20, October 5ś8, 2020, Oldenburg, Germany
2.2.1 Applications on graphical UIs. Despite saliency being one of the better-known aspects of the human visual system,
designers often use rules of thumb instead of theory or rely on experimental evaluations [48, 54]. Computational
saliency models could be beneicial, because they can make predictions for the designer about where users are likely to
ixate within a given UI. They can be used, for example, in delving into the quality of a given design or as a quick way
to facilitate comparisons between designs. Without necessitating dedicated user studies, they can simulate how a user
will attend new, unseen layouts.
Still, the abundant literature on saliency modeling that predicts where humans might look within a scene contains
only a few studies of graphical UIs. The irst computational visual saliency model to predict human attention, with
particular regard to webpages, was proposed by Shen et al. [52]. They added several feature maps (text and face detectors,
positional bias correction, etc.) to the classic ITTI saliency model [25]. Even with ad-hoc training, they could not achieve
competitive performance (correlation with ground truth was 0.45). Xu et al. [66] proposed a bottom-up approach that
was speciically designed with WIMP graphical user interfaces in mind. The model takes information about the UI
alongside users’ mouse and keyboard actions as input to predict joint spatiotemporal attention maps. Regrettably, this
setup cannot be applied for investigating saliency in mobile UIs, where no keyboard or mouse is available. Vidyapu
et al. [62] were interested in predicting visual attention scanpaths for webpage images and did not investigate other
webpage elements, such as headers, navigation menus, and paragraphs of text. Finally, as mentioned earlier, Gupta et al.
[17] compared stimulus- and data-driven models against crowdsourced mobile eye-tracking data, concluding that a
data-driven deep learning model has the highest it. However, they selected the elements in the top 20% for saliency as
their ground-truth dataset, which makes prediction less challenging (we predict saliency for the whole UI).
2.3 Visual impression, importance, and cluter
HCI research has looked also at constructs that come close to saliency but are not quite the same. Visual impression
refers to perceived aesthetics of a graphical UI formed during free viewing. This is typically measured via rating scales,
with results reported for both desktop [33] and mobile interfaces [39]. Visual saliency is a construct related to the
control of visual attention, not regarding aesthetics or design quality. A concept more closely related to saliency is that
of visual importance. Bylinskii et al. [7] extended a pre-trained neural network [51] for predicting which regions in a
graphic design are felt to be more important. Importance was measured by means of cursor exploration of a blurred
page. However, a łpoor man’s eye-trackerž [10], which involves an element of introspective judgment of importance, is
not a good proxy for gauging visual saliency [56]. Finally, research on visual clutter is directly motivated by theories of
saliency. The work of Rosenholtz [48] shows how models of visual saliency can be exploited to compute indices of how
cluttered a display is perceived to be.
3 METHOD
The design of our experiment follows earlier studies on desktop settings [52], which we accordingly adapt to our mobile
setup [35]. We collected a large set of representative mobile interfaces, which in the study were viewed from a distance
resembling that of mobile use. The set of mobile UIs is varied and has a rich distribution of diferent element types. We
used a carefully calibrated high-idelity eye tracker to collect gaze data during free viewing. Note that an alternative
setup, for example including walking (e.g., on a treadmill or a closed circuit) would mainly add nuisance factors that
would detract from the quality of data and would require signiicantly larger sample sizes.
MobileHCI ’20, October 5ś8, 2020, Oldenburg, Germany L. A. Leiva et al.
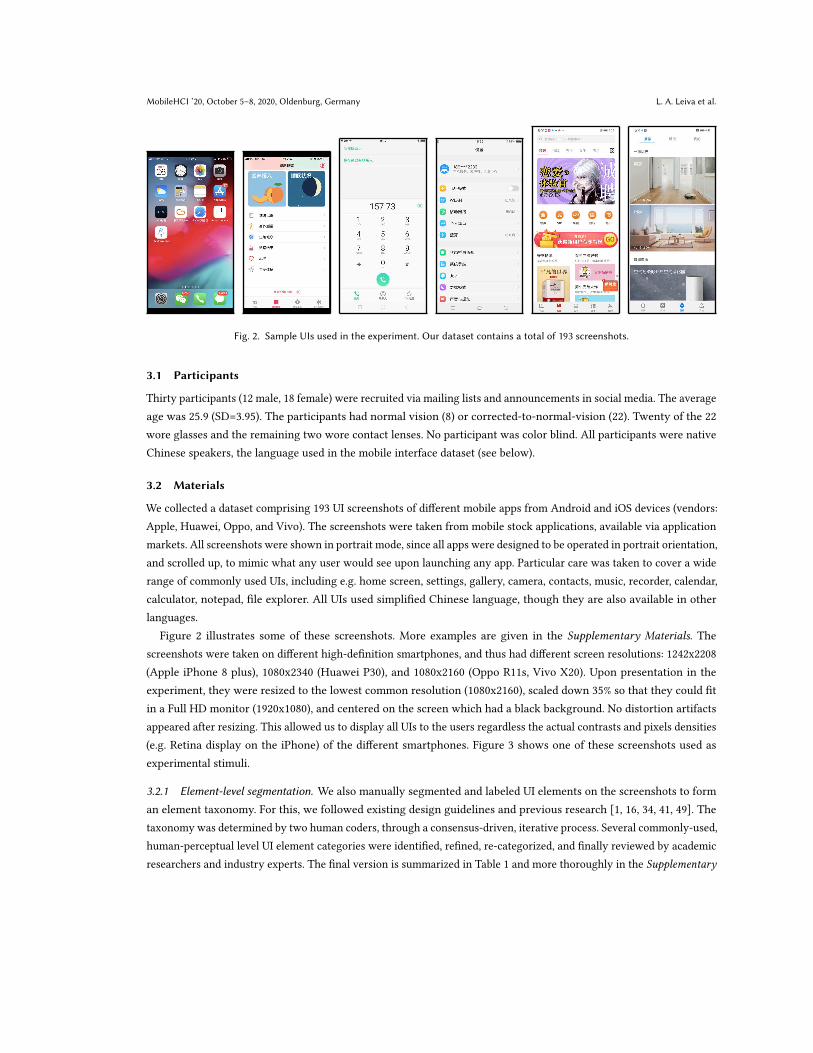
Fig. 2. Sample UIs used in the experiment. Our dataset contains a total of 193 screenshots.
3.1 Participants
Thirty participants (12 male, 18 female) were recruited via mailing lists and announcements in social media. The average
age was 25.9 (SD=3.95). The participants had normal vision (8) or corrected-to-normal-vision (22). Twenty of the 22
wore glasses and the remaining two wore contact lenses. No participant was color blind. All participants were native
Chinese speakers, the language used in the mobile interface dataset (see below).
3.2 Materials
We collected a dataset comprising 193 UI screenshots of diferent mobile apps from Android and iOS devices (vendors:
Apple, Huawei, Oppo, and Vivo). The screenshots were taken from mobile stock applications, available via application
markets. All screenshots were shown in portrait mode, since all apps were designed to be operated in portrait orientation,
and scrolled up, to mimic what any user would see upon launching any app. Particular care was taken to cover a wide
range of commonly used UIs, including e.g. home screen, settings, gallery, camera, contacts, music, recorder, calendar,
calculator, notepad, ile explorer. All UIs used simpliied Chinese language, though they are also available in other
languages.
Figure 2 illustrates some of these screenshots. More examples are given in the Supplementary Materials. The
screenshots were taken on diferent high-deinition smartphones, and thus had diferent screen resolutions: 1242x2208
(Apple iPhone 8 plus), 1080x2340 (Huawei P30), and 1080x2160 (Oppo R11s, Vivo X20). Upon presentation in the
experiment, they were resized to the lowest common resolution (1080x2160), scaled down 35% so that they could it
in a Full HD monitor (1920x1080), and centered on the screen which had a black background. No distortion artifacts
appeared after resizing. This allowed us to display all UIs to the users regardless the actual contrasts and pixels densities
(e.g. Retina display on the iPhone) of the diferent smartphones. Figure 3 shows one of these screenshots used as
experimental stimuli.
3.2.1 Element-level segmentation. We also manually segmented and labeled UI elements on the screenshots to form
an element taxonomy. For this, we followed existing design guidelines and previous research [1, 16, 34, 41, 49]. The
taxonomy was determined by two human coders, through a consensus-driven, iterative process. Several commonly-used,
human-perceptual level UI element categories were identiied, reined, re-categorized, and inally reviewed by academic
researchers and industry experts. The inal version is summarized in Table 1 and more thoroughly in the Supplementary

Understanding Visual Saliency in Mobile User Interfaces MobileHCI ’20, October 5ś8, 2020, Oldenburg, Germany
Materials. The ine-grained semantic information on elements permits detailed analyses of how UI elements may afect
visual saliency.
3.3 Task and Experimental Design
The task was free-viewing a set of mobile UI screenshots. Each UI is shown for 3.5 seconds, informed by previous work
[52] that noticed that ixations start to diverge after 3 s. Then there is a blackout period of 1.5 s before auto-advancing
to the next trail, which we found to be an adequate tradeof while avoiding visual fatigue. The order of the stimulus UIs
was randomized per participant.
3.4 Apparatus
We used the SMI RED250 eye-tracker, which has a sampling rate of 250Hz and an accuracy of 0.4 degrees. A stationary
eye-tracker ensures very high quality of data, impossible to achieve presently with mobile trackers. We used the
SMI Experiment Center software to implement the experimental design, calibrate the eye-tracker to each participant,
compute the ixation data, and automate the administration of visual stimuli. Then we used SMI BeGaze software to
save and export the recorded data. Besides ixations data, the software generates gaze paths and heatmaps. The desktop
monitor was 24.5ž wide and had full HD resolution (1920x1080).
3.5 Setup
Participants sat comfortably in front of the eye-tracker, see Figure 3. The height of the desk was adjusted to the height
that best suited each individual. We advised participants not to lean toward the monitor. We corrected for screen
distance and the size of screenshot stimuli according to Long et al. [35], who reported that the mean viewing distance to
a mobile phone is 29.2 ± 7.3 cm. Then, considering that the physical size of the displayed stimuli is roughly twice larger
than it is on a mobile screen, the distance between participants’ eyes and the screen was kept within the 60ś70 cm
range in our experiment. Therefore, our setup approximates well the deining real-world parameters afecting the data.
3.6 Procedure
At the beginning of the experiment, participants were told about the goals of the study and were provided with informed
consent. The eye-tracker was calibrated for each participant using the usual 3x3 point grid.
Each participant was exposed up to three batches of 60 mobile UI screenshots each, to avoid visual fatigue. They
were told to look at each UI screenshot without any prescribed aim (free viewing task), since asking users to search for
a particular goal would be afected not only by saliency but also by expectations, location memory, search strategies,
etc. As previously hinted, screenshots were shown in randomized order for 3.5 seconds, followed by 1.5 seconds of
blank screen. The software automatically advanced to the next UI screenshot, until the end of the batch. After this,
participants could take a rest as long as they needed and then were asked to either proceed with the next batch or inish
the experiment. Nineteen users completed the three batches, ten users completed two batches, and one user did only
Icon Header Text Text button Text group Label Image Card
Popup Dialog box Multi-tab Bottom bar Switch Slider Date picker Search bar
Table 1. Taxonomy used for element-level segmentation of UI elements in our mobile UI dataset. See the Supplementary Materialsfor examples of each element type.

MobileHCI ’20, October 5ś8, 2020, Oldenburg, Germany L. A. Leiva et al.
Fig. 3. Experimental setup, depicting (1) the monitor where the UIs were displayed and (2) the eye-tracker. The keyboard was onlyused by the experimenter. The inner diagram (b) illustrates how our seting preserved the viewing angle of a mobile scenario.
one batch. A batch is 5min long and the average session lasted 13min. Each UI was assessed by 24 participants on
average (min 16, max 29).
To help the participants get familiarized with the experimental procedure, a warm-up session was always conducted
before starting the actual data collection. Participants were allowed to talk with and ask questions to the experimenter
during the warm-up session. Four UI screenshots were used in the warm-up session, which were not shown in the
actual experiment.
3.7 Data preprocessing
Fixations that happened outside the viewport of the mobile UI (8% of the ixations) were not included in the following
analyses. The dataset we release includes the raw data.
4 RESULTS
The data permit revisiting the phenomena found in studies with natural scenes, discussed above.
4.1 Efect of location
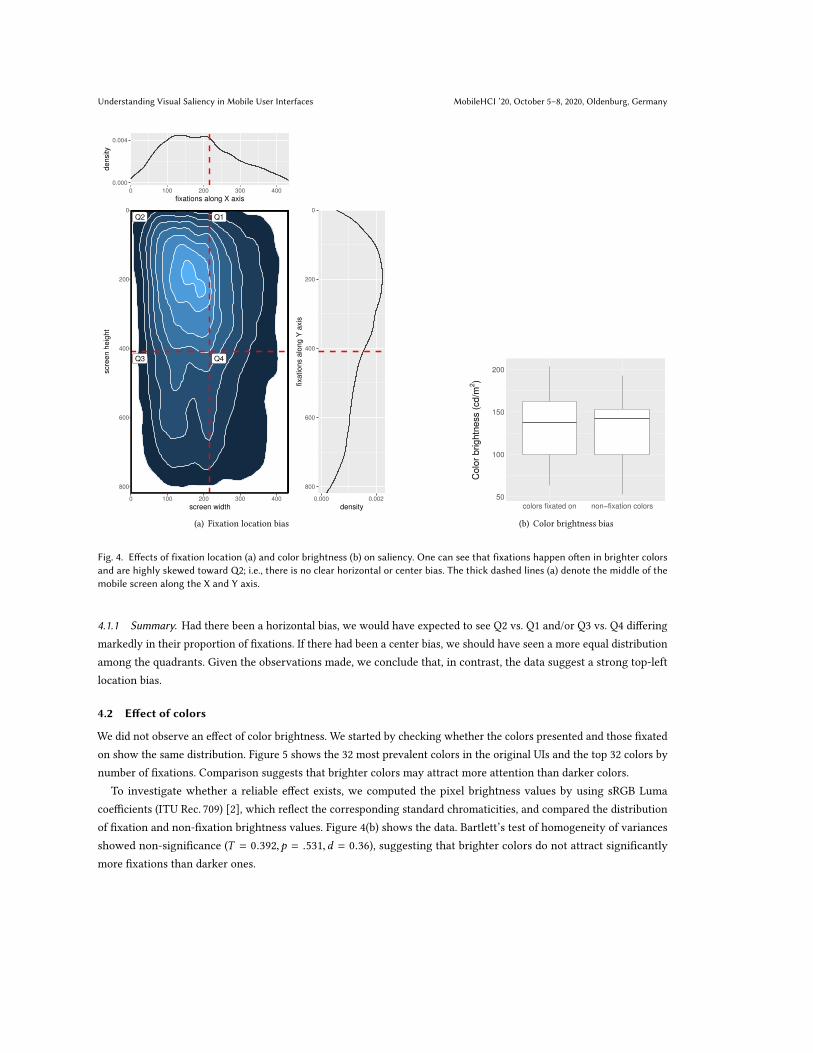
We observed a strong location bias. Figure 4(a) shows the spatial distribution of eye ixations across the quadrants
of the mobile display. The top-left quadrant (Q2) attracted the most ixations (43.3%). Quadrants 1 (top right) and 3
(bottom left) together attracted about as many as Q2. Quadrant 4 showed clearly the fewest ixations (13.1%).
The omnibus test revealed a statistically signiicant diference between the average number of ixations per user
and UI for each of the quadrants: χ2(3,N=1347)
= 357.65,p < .001,ϕ = 0.515. Efect size ϕ suggests a high practical
importance of the diferences [31]. We then ran Bonferroni-Holm corrected pairwise comparisons as post-hoc test
and found that Q2 attracted signiicantly more ixations than any other part of the UI, followed by the top right (Q1),
bottom left (Q3), and bottom right (Q4). No statistically signiicant diference was found between Q1 and Q3 (p > .05).
All other comparison results were found to be statistically signiicant (p < .001).
Understanding Visual Saliency in Mobile User Interfaces MobileHCI ’20, October 5ś8, 2020, Oldenburg, Germany
0.000
0.004
0 100 200 300 400
fixations along X axis
de
nsity
●
Q1Q2
Q3 Q4
0
200
400
600
800
0 100 200 300 400
screen width
scre
en
he
igh
t
0
200
400
600
800
0.000 0.002
density
fixa
tio
ns a
lon
g Y
axis
(a) Fixation location bias
50
100
150
200
colors fixated on non−fixation colors
Co
lor
bri
gh
tne
ss (
cd
/m2)
(b) Color brightness bias
Fig. 4. Efects of fixation location (a) and color brightness (b) on saliency. One can see that fixations happen oten in brighter colorsand are highly skewed toward Q2; i.e., there is no clear horizontal or center bias. The thick dashed lines (a) denote the middle of themobile screen along the X and Y axis.
4.1.1 Summary. Had there been a horizontal bias, we would have expected to see Q2 vs. Q1 and/or Q3 vs. Q4 difering
markedly in their proportion of ixations. If there had been a center bias, we should have seen a more equal distribution
among the quadrants. Given the observations made, we conclude that, in contrast, the data suggest a strong top-left
location bias.
4.2 Efect of colors
We did not observe an efect of color brightness. We started by checking whether the colors presented and those ixated
on show the same distribution. Figure 5 shows the 32 most prevalent colors in the original UIs and the top 32 colors by
number of ixations. Comparison suggests that brighter colors may attract more attention than darker colors.
To investigate whether a reliable efect exists, we computed the pixel brightness values by using sRGB Luma
coeicients (ITU Rec. 709) [2], which relect the corresponding standard chromaticities, and compared the distribution
of ixation and non-ixation brightness values. Figure 4(b) shows the data. Bartlett’s test of homogeneity of variances
showed non-signiicance (T = 0.392,p = .531,d = 0.36), suggesting that brighter colors do not attract signiicantly
more ixations than darker ones.
MobileHCI ’20, October 5ś8, 2020, Oldenburg, Germany L. A. Leiva et al.
4.5% 4.2% 3.9% 3.9% 3.8% 3.2% 2.4% 1.0%
(a) Color distribution of the pixels displayed
11.6% 6.2% 5.7% 4.3% 3.8% 2.8% 2.2% 0.7%
(b) Color distribution of the pixels ixated on
Fig. 5. Colors displayed vs. those fixated upon, sorted by frequency. Although brighter colors tend to receive more atention, wefound no significant diference.
4.2.1 Summary. We did not ind a color bias afecting saliency of mobile UIs. If attention is drawn to brighter colors,
the efect is too modest to be of practical signiicance.
4.3 Efect of element type
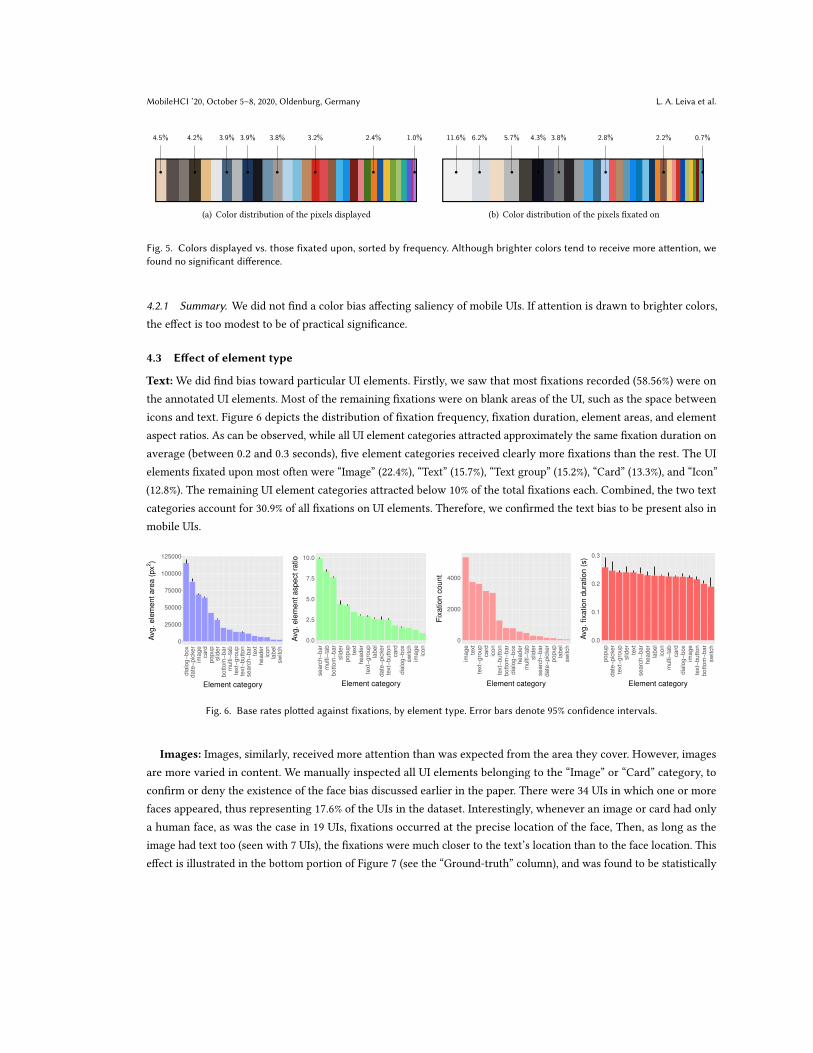
Text: We did ind bias toward particular UI elements. Firstly, we saw that most ixations recorded (58.56%) were on
the annotated UI elements. Most of the remaining ixations were on blank areas of the UI, such as the space between
icons and text. Figure 6 depicts the distribution of ixation frequency, ixation duration, element areas, and element
aspect ratios. As can be observed, while all UI element categories attracted approximately the same ixation duration on
average (between 0.2 and 0.3 seconds), ive element categories received clearly more ixations than the rest. The UI
elements ixated upon most often were łImagež (22.4%), łTextž (15.7%), łText groupž (15.2%), łCardž (13.3%), and łIconž
(12.8%). The remaining UI element categories attracted below 10% of the total ixations each. Combined, the two text
categories account for 30.9% of all ixations on UI elements. Therefore, we conirmed the text bias to be present also in
mobile UIs.
0
25000
50000
75000
100000
125000
dia
log−
box
date
−pic
ker
image
card
popup
slid
er
bottom
−bar
multi−
tab
text−
gro
up
text−
button
searc
h−
bar
text
header
icon
label
sw
itch
Element category
Avg. ele
ment are
a (
px
2)
0.0
2.5
5.0
7.5
10.0
searc
h−
bar
multi−
tab
bottom
−bar
slid
er
popup
text
header
text−
gro
up
label
date
−pic
ker
text−
button
card
dia
log−
box
sw
itch
image
icon
Element category
Avg. ele
ment aspect ra
tio
0
2000
4000
image
text
text−
gro
up
card
icon
text−
button
bottom
−bar
dia
log−
box
header
multi−
tab
slid
er
searc
h−
bar
date
−pic
ker
popup
label
sw
itch
Element category
Fix
ation c
ount
0.0
0.1
0.2
0.3
popup
date
−pic
ker
text−
gro
up
slid
er
text
searc
h−
bar
header
label
icon
multi−
tab
card
dia
log−
box
image
text−
button
bottom
−bar
sw
itch
Element category
Avg. fixation d
ura
tion (
s)
Fig. 6. Base rates ploted against fixations, by element type. Error bars denote 95% confidence intervals.
Images: Images, similarly, received more attention than was expected from the area they cover. However, images
are more varied in content. We manually inspected all UI elements belonging to the łImagež or łCardž category, to
conirm or deny the existence of the face bias discussed earlier in the paper. There were 34 UIs in which one or more
faces appeared, thus representing 17.6% of the UIs in the dataset. Interestingly, whenever an image or card had only
a human face, as was the case in 19 UIs, ixations occurred at the precise location of the face, Then, as long as the
image had text too (seen with 7 UIs), the ixations were much closer to the text’s location than to the face location. This
efect is illustrated in the bottom portion of Figure 7 (see the łGround-truthž column), and was found to be statistically
Understanding Visual Saliency in Mobile User Interfaces MobileHCI ’20, October 5ś8, 2020, Oldenburg, Germany
signiicant: χ2(2,N=34)
= 27.137,p < .001,ϕ = 0.893. Therefore, we conirmed the face bias to be present also in mobile
UIs.
Size: Finally, we also investigated whether the size of a UI element had an efect on the ixations made. We ran
Pearson’s product-moment correlation tests between area vs. number of ixations made (r = 0.08) and vs. ixation
duration (r = 0.21), and on aspect ratio vs. number of ixations (r = −0.39) and vs. ixation duration (r = 0.05). No
signiicant correlation was found for any of these (p > .05). Therefore, we conclude that element size does not play an
important role in visual saliency with mobile UIs.
4.3.1 Summary. We found evidence for a strong text bias and a bias toward images and faces. There was no evidence
for a size bias.
5 COMPUTATIONAL MODELING
In this section, we assess a number of classic and data-driven computational models in light of the saliency data collected.
As examples of classic models we consider three well-known stimulus-driven models that are often used as baseline
models in the literature: ITTI [25], GBVS [19], and BMS [67]. ITTI employs diference of Gaussians for feature extraction
and pools the features together in order to infer saliency. GBVS uses image pyramids for feature extraction and employs
graph difusion to ind salient points. BMS uses thresholding to obtain feature maps at diferent scales and combines
them to one inal map. Regarding the data-driven deep learning (DL) models, we consider SAM [11], a state-of-the-art
model that has publicly available source code, and ResNet-Sal, a custom DL model we developed on the basis of SAM
that has a simpler decoding pipeline.
Our model evaluation used the gaze recordings as ground-truth data. Since the classic models are training-free, they
can be evaluated directly, with no added efort. The DL models, however, require a large volume of training data. We
explored various ways to train these models, aiming for the best possible conditions. Here, we refer to the SALICON
dataset [26] (2015 and 2017 releases), a reference dataset in visual saliency experiments that consists of natural images.
We also ine-tuned SAM to the mobile UI dataset via transfer learning [15], so that the model could learn particular
characteristics of our graphical interfaces. Note that no model uses the UI annotations as an additional feature because
they are designed to predict bottom-up saliency.
5.1 Model implementations
The three classic computational models have public implementations in Matlab code, while the DL models are available
in Python. In SAM, the popular ResNet-50 convolutional neural network [20] is used as a pre-trained feature-encoding
backbone, and an attentive ConvLSTM recurrent neural network acts as an integration (saliency decoding) network.
To better understand the role of such a sophisticated attentive decoding network, we developed ResNet-Sal, which
uses the same encoding architecture as SAM and a non-attentive, much simpler decoding network composed of three
upscaling blocks (each having a convolution transpose) followed by two 2D convolution layers.
In summary, we used three classic saliency models łas-isž and the following DL models:
SAM-S2015: Encoding network pre-trained on ResNet-50 weights. Attentive decoding network trained on SALI-
CON 2015 dataset.
SAM-S2017: Encoding network pre-trained on ResNet-50 weights. Attentive decoding network trained on SALI-
CON 2017 dataset.
MobileHCI ’20, October 5ś8, 2020, Oldenburg, Germany L. A. Leiva et al.
SAM-mobile: Encoding network pre-trained on ResNet-50 weights. Attentive decoding network trained on
SALICON 2017 dataset and ine-tuned to our mobile dataset.
ResNet-Sal: Encoding network pre-trained on ResNet-50 weights. Non-attentive decoding network trained on
SALICON 2017 dataset and ine-tuned to our mobile dataset.
As noted, all DL models have the same pre-trained encoding network but the SAM variants use an attentive decoding
network trained on diferent datasets.
5.2 Training and testing
Our dataset is divided into a training partition, comprising 80% of the screenshots and their associated ixation data, and
a test partition, consisting of the remaining 20% of the data. We took special care to balance the number of representative
screenshots from each mobile vendor in both the training and the test partition. We used the RMSprop optimizer [57]
and the following loss function [11]:
L(S, F ) = α NSS(S, FB ) + β CC(S, FC ) + γ KL(S, FC ) (1)
where S is the predicted saliency map and F is the ground-truth ixation data, in either continuous (FC ) or binary (FB )
form. As described below, NSS is the normalized scanpath saliency, CC is the correlation coeicient, and KL refers to the
Kullback-Leibler divergence, which are commonly used to evaluate saliency prediction models. As observed, the model
places particular emphasis on predicting a saliency distribution that matches the ground-truth human visual saliency
as closely as possible. The loss scalars above are set to α = −1, β = −2, γ = 10, as suggested by Cornia et al. [11].
5.3 Ground truth
The eye tracker provides ixation points (FB in the equations above) so we computed the ground-truth continuous
density map FC by smoothing each ixation point with a 2D Gaussian ilter using a standard deviation of 25 px. This size
approximates that of the foveal region of the human eye [52], as 1 visual degree approximates 50 px in our experimental
setup. As stated previously, ixation points falling outside the viewport of the mobile UIs were not taken into account.
5.4 Evaluation metrics
Given the goal of predicting the ixation locations in an image, a saliency map can be interpreted as a classiier of
which pixels do or do not receive ixations [6]. With that notion in mind, the literature has proposed the following
set of evaluation metrics to benchmark the performance of a given saliency model. Some metrics have been designed
speciically for saliency evaluation (NSS), while others have been adapted from signal detection (AUC), image matching
and retrieval (SIM), and statistics (CC). We report results on all of them.
Area under the ROC curve (AUC): There are several variants of the AUC location-based metric, from among which we
chose Judd et al.’s [28] for historical reasons ś for example, the popular MIT benchmark ranks models based on the
AUC-Judd score [3]. The saliency map is treated as a binary classiier of ixations for various threshold values (level
sets), and an ROC curve (true-positive rate vs. false-positive rate) is swept out by measuring the true- and false-positive
rates under each binary classiier. Hence, the higher the AUC value, the better, indicating a greater ability to predict the
salient locations in an image.
Normalized scanpath saliency (NSS): The NSS location-based metric is computed as the average normalized saliency
at ixation locations. Unlike with AUC, the absolute saliency values are part of the normalization calculation. Given a
Understanding Visual Saliency in Mobile User Interfaces MobileHCI ’20, October 5ś8, 2020, Oldenburg, Germany
saliency map S and a binary map of ixation locations FB ,
NSS(S, FB ) =1
N
∑
i
S̄i FBi (2)
where N =∑i F
Bi and S̄ =
S−µ(S )σ (S )
. A higher NSS value is better, indicating that the predicted map accumulates more
saliency at the ixation points.
Similarity (SIM): SIM is a distribution-based metric for the similarity between two map distributions, viewed as
histograms. It is computed as the sum of the minimum values at each pixel, after normalization of the input maps.
Given a saliency map S and a continuous map of ixation locations FC ,
SIM(S, FC ) =∑
i
min(Si , FCi ) (3)
where∑i Si =
∑i F
Ci = 1. The higher the SIM value, the better, indicating greater consistency with human saliency.
Correlation coeicient (CC): Pearson’s Correlation Coeicient is a distribution-based metric that measures how
correlated or dependent two map distributions are:
CC(S, FC ) =σ (S, FC )
σ (S)σ (FC )(4)
where σ (S, FC ) is the covariance of S and FC . The higher the CC value, the better, though CC is a bounded score and
CC=1 denotes the predicted saliency map perfectly matching the ground-truth distribution. In other words, higher CC
values indicate greater consistency with human saliency.
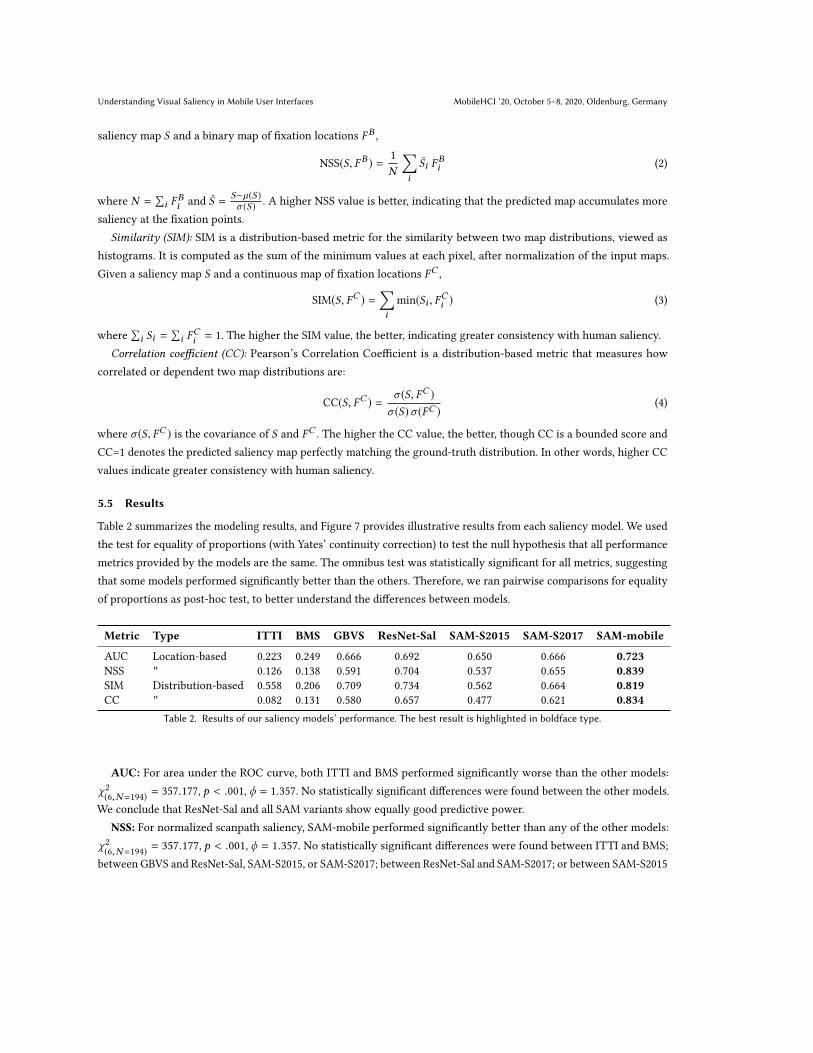
5.5 Results
Table 2 summarizes the modeling results, and Figure 7 provides illustrative results from each saliency model. We used
the test for equality of proportions (with Yates’ continuity correction) to test the null hypothesis that all performance
metrics provided by the models are the same. The omnibus test was statistically signiicant for all metrics, suggesting
that some models performed signiicantly better than the others. Therefore, we ran pairwise comparisons for equality
of proportions as post-hoc test, to better understand the diferences between models.
Metric Type ITTI BMS GBVS ResNet-Sal SAM-S2015 SAM-S2017 SAM-mobile
AUC Location-based 0.223 0.249 0.666 0.692 0.650 0.666 0.723
NSS " 0.126 0.138 0.591 0.704 0.537 0.655 0.839
SIM Distribution-based 0.558 0.206 0.709 0.734 0.562 0.664 0.819
CC " 0.082 0.131 0.580 0.657 0.477 0.621 0.834
Table 2. Results of our saliency models’ performance. The best result is highlighted in boldface type.
AUC: For area under the ROC curve, both ITTI and BMS performed signiicantly worse than the other models:
χ2(6,N=194)
= 357.177, p < .001, ϕ = 1.357. No statistically signiicant diferences were found between the other models.
We conclude that ResNet-Sal and all SAM variants show equally good predictive power.
NSS: For normalized scanpath saliency, SAM-mobile performed signiicantly better than any of the other models:
χ2(6,N=194)
= 357.177, p < .001, ϕ = 1.357. No statistically signiicant diferences were found between ITTI and BMS;
between GBVS and ResNet-Sal, SAM-S2015, or SAM-S2017; between ResNet-Sal and SAM-S2017; or between SAM-S2015

MobileHCI ’20, October 5ś8, 2020, Oldenburg, Germany L. A. Leiva et al.
Source UI Ground-truth SAM-mobile SAM-S2015 SAM-S2017 ResNet-Sal GBVS BMS ITTI
Source UI Ground-truth SAM-mobile SAM-S2015 SAM-S2017 ResNet-Sal GBVS BMS ITTI
Source UI Ground-truth SAM-mobile SAM-S2015 SAM-S2017 ResNet-Sal GBVS BMS ITTI
Source UI Ground-truth SAM-mobile SAM-S2015 SAM-S2017 ResNet-Sal GBVS BMS ITTI
Source UI Ground-truth SAM-mobile SAM-S2015 SAM-S2017 ResNet-Sal GBVS BMS ITTI
Fig. 7. Examples of saliency maps predicted for classic (ITTI, BMS, and GBVS) and modern (SAM and ResNet-Sal) models.
Understanding Visual Saliency in Mobile User Interfaces MobileHCI ’20, October 5ś8, 2020, Oldenburg, Germany
and SAM-S2017. All other comparison results were found to be statistically signiicant. We conclude that SAM-mobile
yields the ixation predictions most closely aligned with ground-truth data.
SIM: For similarity, SAM-mobile performed signiicantly better than all other models except GBVS and ResNet-
Sal: χ2(6,N=194)
= 195.214, p < .001, ϕ = 1.003 No statistically signiicant diferences were found between ITTI and
SAM-S2015 or SAM-S2017, between GBVS and ResNet-Sal or SAM-S2017, or between ResNet-Sal and SAM-S2015 or
SAM-S2017. All other comparisons were found to be statistically signiicant. We conclude that SAM-mobile, GBVS, and
ResNet-Sal provide equally good similarity between the predicted and ground-truth ixation maps.
CC: Finally, for the coeicient of correlation, SAM-mobile performed signiicantly better than any of the other
models: χ2(6,N=194)
= 362.549, p < .001, ϕ = 1.367. No statistically signiicant diferences were found between ITTI and
BMS, between GBVS and ResNet-Sal, SAM-S2015, and SAM-S2017, and between ResNet-Sal and SAM-S2017. All other
comparisons showed statistical signiicance. We conclude that SAM-mobile is the model that correlates the best with
human visual saliency.
5.5.1 Summary. Stimulus-driven models such as ITTI and BMS performed worse in general, with data-driven models
generally achieving a higher it. SAM-mobile emerges as the overall winner with these evaluation metrics. We discuss
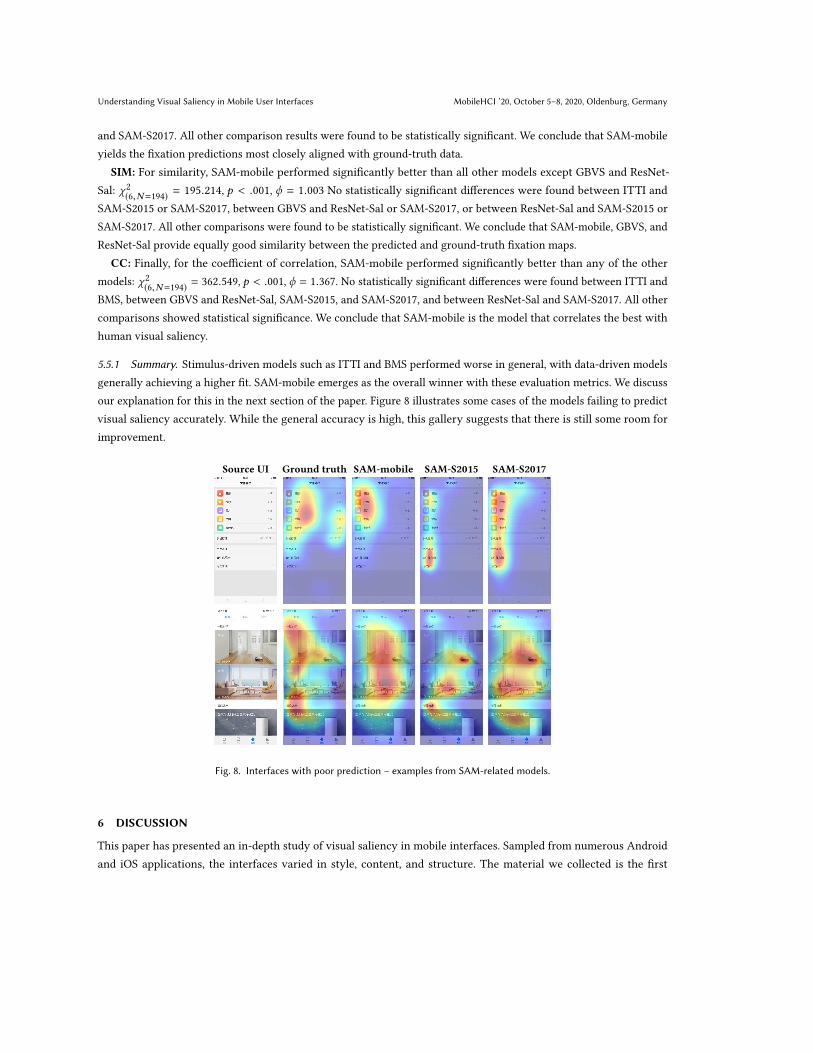
our explanation for this in the next section of the paper. Figure 8 illustrates some cases of the models failing to predict
visual saliency accurately. While the general accuracy is high, this gallery suggests that there is still some room for
improvement.
Source UI Ground truth SAM-mobile SAM-S2015 SAM-S2017
Fig. 8. Interfaces with poor prediction ś examples from SAM-related models.
6 DISCUSSION
This paper has presented an in-depth study of visual saliency in mobile interfaces. Sampled from numerous Android
and iOS applications, the interfaces varied in style, content, and structure. The material we collected is the irst

MobileHCI ’20, October 5ś8, 2020, Oldenburg, Germany L. A. Leiva et al.
representative and comprehensive dataset for this topic. We assessed known empirical efects and tested several classical
and state-of-the-art saliency models against the ixation data collected.
In reporting the irst empirical indings from this dataset, we have focused on testing some known saliency biases.
Our key indings from comparing mobile UIs to natural scenes are the following:
(1) Strong location bias toward the top-left quadrant of the screen
(2) Strong text bias
(3) Strong image bias
(4) Strong face bias
(5) No efect of element size
(6) Neither center nor horizontal bias
(7) No color bias
Location had the strongest efect on saliency in our data, with the top-left quadrant (Q2) dominating the ixation
data. This has not been reported before for mobile devices, although the efect is predictable. F-shaped and triangular
gaze patterns have been reported for webpages [12]. We believe the most plausible reason is statistical learning of
visual-feature distribution. In other words, designers prioritize the upper left for information that helps orient the user.
Logos, headers, and instructions are most likely to reside in that region. Moreover, labels, text, and headings are often
read from top to bottom, left to right. With repeated exposure to designs of this type, users learn that the top-left corner
makes a wise ixation choice.
It was somewhat surprising to ind a lack of bias based on color or size, since these are elementary stimulus features
considered in bottom-up saliency models. There is an explanation, though. If the distributions of these features are
uninformative, the cue cannot be exploited for saliency, and users learn to avoid them. It could be that the size of an
element, similarly, is not a useful cue for identifying which elements are informative. Consider the wide distribution we
found for colors in the UIs. The only prominent color is gray, which is prevalent in backgrounds.
In contrast, it was less surprising that text and images attract attention, since they have a role in a user’s orientation.
The text bias attests to the visual system’s ability to utilize visual cues that hint at the semantics of an object, even
when as inconspicuous as text elements are. Images, on the other hand, are typically placed in a UI with the goal of
attracting attention, with the colors, objects etc. chosen to stand out.
Taken together, these indings suggest that users exhibit viewing strategies tuned to their expectations of the feature
distributions of mobile UIs. Indeed, UIs are accessed by users for speciic purposes, with particular interactions and a
goal in mind. We argue that visual statistical learning may help explain the thrust of these results, which could further
help explain the modeling output.
A more general inding is that classic models performed worse than the data-driven deep learning models. This might
relect the fact that the classic models are based on stimulus-driven computations, whereas the data-driven models were
trained such that they had access to data on users’ viewing strategies. Across all metrics we examined, the SAM-mobile
deep learning model achieved the best performance. Other models came close but never surpassed it. The superiority of
the SAM-mobile model is explained by (1) the attentive saliency decoding network and (2) the use of transfer learning
for the mobile dataset. The latter case is particularly important, since classic models of saliency were mainly developed
for natural images and the vast majority of DL models of visual saliency are trained and evaluated with natural images.
If users’ viewing strategies are indeed tuned to particular distributions of features, a model trained speciically for
the relevant type of data is bound to have a better it. Why, then, was ResNet-Sal, which was trained on the same data
Understanding Visual Saliency in Mobile User Interfaces MobileHCI ’20, October 5ś8, 2020, Oldenburg, Germany
and ine-tuned to the mobile domain, performed worse than SAM-mobile? We attribute the diference to SAM-mobile’s
attentive saliency decoding network, which may be better at learning strategies of overt attention from data. Related
to this, we noticed that many ixations happened on backgrounds, which can be attributed to covert attention cases
since our eye-tracker was re-calibrated for each participant. In covert attention cases, the user is attending to an object
without precisely placing the eye gaze on that object.
Overall, our modeling results will beneit practitioners who routinely employ saliency models. In light of the results,
we conclude that all deep-learning-based models provide reasonable accuracy of-the-shelf. However, as our study
shows, accuracy can be further improved by training from a mobile-speciic dataset. While this observation has been
highlighted by others [3, 7], until now it was not possible to analyze saliency in mobile UIs because of the lack of a
public dataset. Our results together fuel a recommendation that practitioners should calibrate their models to this
domain.
6.1 Limitations and Future Work
More work is needed for reining our understanding of saliency in the mobile domain. For example, our study should
be replicated in task environments with users who are truly mobile. Paradigmatically, visual saliency has been studied
under free-viewing (bottom-up) conditions as opposed to speciic goals (top-down). While quantifying bottom-up
saliency, user’s familiarity with various mobile platforms plays a lesser important role, however we suspect that it
may play a key role while quantifying top-down saliency. Bottom-up saliency is frequently considered by designers
and researchers (see e.g. [7]), so this paper contributes important information on the unique aspects of mobile UIs.
Top-down saliency is afected by expectations, location memory, search strategies, among other fenomena, which is a
complex topic worthy of future work.
We note also that, according to previous work [9, 30], Eastern people often look at and perceive objects diferently
from Westerners. Chua et al. [9] found that the latter attend more to focal objects in natural scenes, while East Asians
pay more attention to contextual information, and Kelly et al. [30] reported that East Asian subjects displayed central
ixations across all categories of visual stimuli. To investigate these diferences between holistic and analytic vision,
further research is warranted.
In addition, our saliency models predict a static global distribution of visual attention over the image, ignoring the
active role of attention in planning the next ixation point. We believe that models combining goal-driven, learned, and
bottom-up features are required for enhancing predictions of the sequence of ixation points. Future work should also
consider the role of individuals’ diferences as well as visual search strategies, which are mostly guided by top-down
saliency principles [27].
7 CONCLUSION
Our work has shown that the common understanding of visual saliency, especially with regard to some prominent efects
identiied in studies of natural scenes, does not transfer trivially to mobile UIs. In particular, we learned that saliency is
dominated by location and semantic biases, which we believe to be due to their informativeness as conspicuous cues. In
contrast, it is dominated less by some of the core bottom-up features, such as size and color, perhaps relecting that
those feature distributions tend to be less informative in this domain. For designers, our results mean that it is better to
follow the style and conventions of the domain in, for instance, the choice of where to place important elements. Even
conspicuous cues, such as use of red or large size, may go unnoticed, given that mobile UIs are rich in features of this
sort. That said, additional analyses could exploit our data, for better understanding of this phenomena. For example,

MobileHCI ’20, October 5ś8, 2020, Oldenburg, Germany L. A. Leiva et al.
one could look at the interaction efect between visual features and element types. Do images grab attention more
because they are more colorful? What kinds of color distributions do we see in the four quadrants? Our observations
highlight a need for more research into what, if anything, makes mobile UIs special.
8 THE ‘MOBILE UI SALIENCY’ DATASET
The outcome of our study is a rich annotated dataset characterizing the attraction of visual attention in mobile interfaces.
We are publicly releasing the dataset, which includes:
• Screenshots of 193 mobile UIs sampled from present-day application markets.
• Annotations (bounding boxes) of all UI elements in the screenshots.
• Eye-tracking data, including ixation points, timestamps, and aggregated indices like heatmaps.
• The full list of mobile apps and vendors.
ACKNOWLEDGMENTS
We thank Marko Repo for his help with UI element annotation and the anonymous referees for their feedback. We also
thank the computational resources provided by the Aalto Science-IT project. This work has been supported by the
Academy of Finland (grant no. 318559), the Huawei UCD Center, and the European Research Council (ERC) under the
European Union’s Horizon 2020 research and innovation programme (grant agreement no. 637991).
REFERENCES
[1] Apple. 2019. Human Interface Guidelines: iOS. Available: https://developer.apple.com/design/human-interface-guidelines/ios/overview/themes/
(last accessed January 2020).
[2] S. Bezryadin, P. Bourov, and D. Ilinih. 2007. Brightness Calculation in Digital Image Processing. In Proc. TDPF Symposium.
[3] A. Borji. 2019. Saliency Prediction in the Deep Learning Era: Successes, Limitations, and Future Challenges. In CoRR abs/1810.03716 (arXiv preprint).
[4] A. Borji and L. Itti. 2013. State-of-the-art in visual attention modeling. IEEE Trans. Pattern Anal. Mach. Intell. 35, 1 (2013).
[5] A. Borji, H. R. Tavakoli, D. N. Sihite, and L. Itti. 2013. Analysis of Scores, Datasets, and Models in Visual Saliency Prediction. In Proc. ICCV.
[6] Z. Bylinskii, T. Judd, A. Oliva, A. Torralba, and F. Durand. 2019. What Do Diferent Evaluation Metrics Tell Us About Saliency Models? IEEE Trans.
Pattern Anal. Mach. Intell. 41, 3 (2019).
[7] Z. Bylinskii, N. W. Kim, P. O’Donovan, S. Alsheikh, S. Madan, H. Pister, F. Durand, B. Russell, and A. Hertzmann. 2017. Learning Visual Importance
for Graphic Designs and Data Visualizations. In Proc. UIST.
[8] M. Cerf, E. P. Frady, and C. Koch. 2009. Faces and text attract gaze independent of the task: Experimental data and computer model. J. Vis. 9, 12
(2009).
[9] H. F. Chua, J. E. Boland, and R. E. Nisbett. 2005. Cultural variation in eye movements during scene perception. PNAS 102, 35 (2005).
[10] L. Cooke. 2006. Is the mouse a poor man’s eye tracker?. In Proc. STC.
[11] M. Cornia, L. Baraldi, G. Serra, and R. Cucchiara. 2018. Predicting Human Eye Fixations via an LSTM-Based Saliency Attentive Model. IEEE Trans.
Image Process. 27, 10 (2018).
[12] G. B. Duggan and S. J. Payne. 2011. Skim Reading by Satisicing: Evidence from Eye Tracking. In Proc. CHI.
[13] S. Etchebehere and E. Fedorovskaya. 2017. On the Role of Color in Visual Saliency. Intl. Symp. Electronic Imaging 6 (2017).
[14] S. Frintrop, E. Rome, and H. I. Christensen. 2010. Computational visual attention systems and their cognitive foundations: A survey. ACM Trans.
Appl. Percept. 7, 1 (2010).
[15] I. Goodfellow, Y. Bengio, and A. Courville. 2016. Deep Learning.
[16] Google. 2019. Google Material Guidelines. Available: https://material.io/design/ (last accessed January 2020).
[17] P. Gupta, S. Gupta, A. Jayagopal, S. Pal, and R. Sinha. 2018. Saliency Prediction for Mobile User Interfaces. In Proc. WACV Workshop.
[18] S. Hamel, N. Guyader, D. Pellerin, and D. Houzet. 2014. Contribution of Color Information in Visual Saliency Model for Videos. In Proc. ICISP.
[19] J. Harel, C. Koch, and P. Perona. 2007. Graph-Based Visual Saliency. In Proc. NIPS.
[20] K. He, X. Zhang, S. Ren, and J. Sun. 2016. Deep Residual Learning for Image Recognition. In Proc. CVPR.
[21] S. He, H. R. Tavakoli, A. Borji, Y. Mi, and N. Pugeault. 2019. Understanding and Visualizing Deep Visual Saliency Models. In Proc. CVPR.
[22] J. M. Henderson. 1993. Eye movement control during visual object processing: efects of initial ixation position and semantic constraint. Can. J.
Exp. Psychol. 47, 1 (1993).
[23] K. Humphrey and G. Underwood. 2012. The potency of people in pictures: Evidence from sequences of eye ixations. J. Vis. 12, 6 (2012).
Understanding Visual Saliency in Mobile User Interfaces MobileHCI ’20, October 5ś8, 2020, Oldenburg, Germany
[24] L. Itti. 2007. Visual salience. Scholarpedia 2, 9 (2007).
[25] L. Itti, C. Koch, and E. Niebur. 1998. A model of saliency based visual attention for rapid scene analysis. IEEE Trans. Pattern Anal. Mach. Intell. 20, 11
(1998).
[26] M. Jiang, S. Huang, J. Duan, and Q. Zhao. 2015. SALICON: Saliency in Context. In Proc. CVPR.
[27] J. P. Jokinen, Z. Wang, S. Sarcar, A. Oulasvirta, and X. Ren. 2020. Adaptive feature guidance: Modelling visual search with graphical layouts. Int. J.
Hum-Comput. Stud. 136 (2020).
[28] T. Judd, F. Durand, and A. Torralba. 2012. A Benchmark of Computational Models of Saliency to Predict Human Fixations. Technical Report.
[29] T. Judd, K. Ehinger, F. Durand, and A. Torralba. 2009. Learning to predict where humans look. In Proc. ICCV.
[30] D. J. Kelly, S. Miellet, and R. Caldara. 2010. Culture shapes eye movements for visually homogeneous objects. Front. Psychol. 1 (2010).
[31] H.-Y. Kim. 2017. Statistical notes for clinical researchers: Chi-squared test and Fisher’s exact test. Restor. Dent. Endod. 42, 2 (2017).
[32] G. Li and Y. Yu. 2015. Visual Saliency Based on Multiscale Deep Features. In Proc. CVPR.
[33] G. Lindgaard, G. Fernandes, C. Dudek, and J. Brown. 2006. Attention web designers: You have 50 milliseconds to make a good irst impression!
Behav. Inform. Technol. 25, 2 (2006).
[34] T. F. Liu, M. Craft, J. Situ, E. Yumer, R. Mech, and R. Kumar. 2018. Learning Design Semantics for Mobile Apps. In Proc. UIST.
[35] J. Long, R. Cheung, S. Duong, R. Paynter, and L. Asper. 2017. Viewing distance and eyestrain symptoms with prolonged viewing of smartphones.
Clin. Exp. Optom. 100, 2 (2017).
[36] S. Lu and J.-H. Lim. 2012. Saliency Modeling from Image Histograms. In Proc. ECCV.
[37] Y. Ma, X. Hua, L. Lu, and H. Z. HJ. 2005. A generic framework of user attention model and its application in video summarization. IEEE Trans.
Multimed. 7, 5 (2005).
[38] S. Marat, A. Rahman, D. Pellerin, N. Guyader, and D. Houzet. 2013. Improving Visual Saliency by Adding ‘Face Feature Map’ and ‘Center Bias’. Cogn.
Comput. 5, 1 (2013).
[39] A. Miniukovich and A. De Angeli. 2014. Visual Impressions of Mobile App Interfaces. In Proc. NordiCHI.
[40] A. Mishra, Y. Aloimonos, and C. Fah. 2009. Active segmentation with ixation. In Proc. ICCV.
[41] Mobile UI 2019. Mobile UI guidelines. Available: https://mobileui.github.io/ (last accessed January 2020).
[42] B. Ni, M. Xu, T. V. Nguyen, M. Wang, C. Lang, Z. Huang, and S. Yan. 2014. Touch Saliency: Characteristics and Prediction. IEEE Trans. Multimed. 16,
6 (2014).
[43] A. Nuthmann and J. M. Henderson. 2014. Object-based attentional selection in scene viewing. J. Vis. 10, 8 (2014).
[44] J. P. Ossandon, S. Onat, and P. König. 2014. Spatial biases in viewing behavior. J. Vis. 14, 2 (2014).
[45] N. Ouerhani, J. Bracamonte, H. Hugli, M. Ansorge, and F. Pellandini. 2001. Adaptive color image compression based on visual attention. In Proc.
ICIAP.
[46] D. Parkhurst, K. Law, and E. Niebur. 2002. Modeling the role of salience in the allocation of overt visual attention. Vis. Res. 42, 1 (2002).
[47] K. Rayner, S. P. Liversedge, A. Nuthmann, R. Kliegl, and U. G. 2009. Rayner’s 1979 paper. Perception 38, 6 (2009).
[48] R. Rosenholtz, A. Dorai, and R. Freeman. 2011. Do Predictions of Visual Perception Aid Design? ACM Trans. Appl. Percept. 8, 2 (2011).
[49] Semantic UI 2019. Semantic UI guidelines. Available: https://semantic-ui.com (last accessed January 2020).
[50] P. Seriès and A. Seitz. 2013. Learning what to expect (in visual perception). Front. Hum. neurosci. 7 (2013).
[51] E. Shelhamer, J. Long, and T. Darrell. 2017. Fully Convolutional Networks for Semantic Segmentation. IEEE Trans. Pattern Anal. Mach. Intell. 39, 4
(2017).
[52] C. Shen and Q. Zhao. 2014. Webpage Saliency. In Proc. ECCV.
[53] C. Siagian and L. Itti. 2007. Rapid biologically-inspired scene classiication using features shared with visual attention. IEEE Trans. Pattern Anal.
Mach. Intell. 29, 2 (2007).
[54] J. D. Still and C. M. Masciocchi. 2010. A Saliency Model Predicts Fixations in Web Interfaces. In Proc. MDDAUI Workshop.
[55] B. W. Tatler. 2007. The central ixation bias in scene viewing: selecting an optimal viewing position independently of motor bases and image feature
distributions. J. Vis. 14, 7 (2007).
[56] H. R. Tavakoli, F. Ahmed, A. Borji, and J. Laaksonen. 2017. Saliency Revisited: Analysis of Mouse Movements Versus Fixations. In Proc. CVPR.
[57] T. Tieleman and G. Hinton. 2012. RMSProp: Divide the gradient by a running average of its recent magnitude. Coursera: Neural networks for machine
learning 4, 2 (2012).
[58] P.-H. Tseng, R. Carmi, I. G. Cameron, D. P. Munoz, and L. Itti. 2009. Quantifying center bias of observers in free viewing of dynamic natural scenes.
J. Vis. 9, 7 (2009).
[59] J. K. Tsotsos. 1991. Is Complexity Theory appropriate for analysing biological systems? Behav. Brain Sci. 14, 4 (1991).
[60] R. Veale, Z. Hafed, and M. Yoshida. 2017. How is visual salience computed in the brain? Insights from behaviour, neurobiology and modelling. Phil.
Trans. R. Soc. B. 1 (2017).
[61] R. Veale, Z. M. Hafed, and M. Yoshida. 2017. How is visual salience computed in the brain? Insights from behaviour, neurobiology and modelling.
Philos. Trans. R. Soc. Lond. B. Biol. Sci. 372, 1714 (2017).
[62] S. Vidyapu, V. S. Vedula, and S. Bhattacharya. 2019. Quantitative Visual Attention Prediction on Webpage Images Using Multiclass SVM. In Proc.
ETRA.
[63] H.-C. Wang and M. Pomplun. 2012. The attraction of visual attention to texts in real-world scenes. J. Vis. 12, 26 (2012).

MobileHCI ’20, October 5ś8, 2020, Oldenburg, Germany L. A. Leiva et al.
[64] J. M. Wolfe and T. S. Horowitz. 2004. What attributes guide the deployment of visual attention and how do they do it? Nat. Rev. Neurosci. 5, 6 (2004).
[65] M. Xu, B. Ni, J. Dong, Z. Huang, M. Wang, and S. Yan. 2012. Touch Saliency. In Proc. ACM Multimedia.
[66] P. Xu, Y. Sugano, and A. Bulling. 2016. Spatio-Temporal Modeling and Prediction of Visual Attention in Graphical User Interfaces. In Proc. CHI.
[67] J. Zhang and S. Sclarof. 2013. Saliency Detection: A Boolean Map Approach. In Proc. ICCV.
[68] Q. Zhao and C. Koch. 2013. Learning saliency-based visual attention: A review. Signal Process. 93 (2013).


![Exploring visual attention and saliency modeling for task-based visual …€¦ · Exploring visual attention and saliency modeling for task-based visual analysis ... [22–24], computer](https://static.fdocuments.net/doc/165x107/5f0c58647e708231d434f0d8/exploring-visual-attention-and-saliency-modeling-for-task-based-visual-exploring.jpg)