Understanding the State Budget: The Big...
23
Understanding the State Budget: The Big Picture 1 Colorado Legislative Staff New Legislator Orientation Information Paper Understanding the State Budget: The Big Picture Joint Budget Committee Staff Office of Legislative Legal Services Legislative Council Staff December 1, 2016 Each year, the General Assembly is tasked with balancing constitutional, statutory, and federal requirements with a host of other considerations, such as competing policy priorities, caseload pressures, and the health of the state’s economy, in order to create a budget. This report is intended to serve as a primer on Colorado’s budget and some of the factors that help shape it. This primer begins with a discussion of Colorado’s tax burden and how the taxes people and businesses pay in Colorado are distributed among local, state, and federal governments. It then focuses on the sources of revenue that fund the Colorado state budget and constitutional limits on that revenue. An outline of the process for preparing, reviewing, and approving the state’s budget is presented. The state’s operating budget for the current fiscal year, FY 2016-17, is then described, including how each of the three primary funding sources (General Fund, cash funds, and federal funds) is allocated. The focus is then placed on the General Fund budget and constitutional, federal, and statutory spending mandates that the General Assembly must balance. This is followed by a discussion of constitutional mandates on various cash funds. Colorado Tax Burden and Distribution of Tax Dollars Since 2010, the taxes people and businesses have paid each year in Colorado to the federal, state, and local governments have averaged 27.5 percent of Colorado personal income (Figure 1). 1 This tax burden varies slightly each year depending on variations in the growth rates of tax collections and the economy as a whole. Much of the variability in the federal tax burden is due to volatility in corporate income taxes. Variability in the state tax burden is primarily due to volatility in corporate income taxes and individual income taxes on capital gains, entrepreneurial income, and oil and gas royalties. 1 Taxes include those paid by nonresidents and tourists, whereas income includes that of Colorado residents. Table of Contents Colorado Tax Burden and Distribution of Tax Dollars 1 Sources of State Government Revenue 3 TABOR Limit on State Government Revenue 7 State Budget Process 11 State Operating Budget 13 General Fund Budget and Spending Mandates 16 Constitutional Cash Fund Spending Mandates 20
Transcript of Understanding the State Budget: The Big...
Understanding the State Budget: The Big Picture 1
Colorado Legislative Staff New Legislator Orientation Information Paper
Understanding the State Budget: The Big Picture
Joint Budget Committee Staff Office of Legislative Legal Services Legislative Council Staff
December 1, 2016
Each year, the General Assembly is tasked with balancing constitutional, statutory, and federal requirements with a host of other considerations, such as competing policy priorities, caseload pressures, and the health of the state’s economy, in order to create a budget. This report is intended to serve as a primer on Colorado’s budget and some of the factors that help shape it.
This primer begins with a discussion of Colorado’s tax burden and how the taxes people and
businesses pay in Colorado are distributed among local, state, and federal governments. It then focuses on the sources of revenue that fund the Colorado state budget and constitutional limits on that revenue.
An outline of the process for preparing, reviewing, and approving the state’s budget is presented.
The state’s operating budget for the current fiscal year, FY 2016-17, is then described, including how each of the three primary funding sources (General Fund, cash funds, and federal funds) is allocated. The focus is then placed on the General Fund budget and constitutional, federal, and statutory spending mandates that the General Assembly must balance. This is followed by a discussion of constitutional mandates on various cash funds.
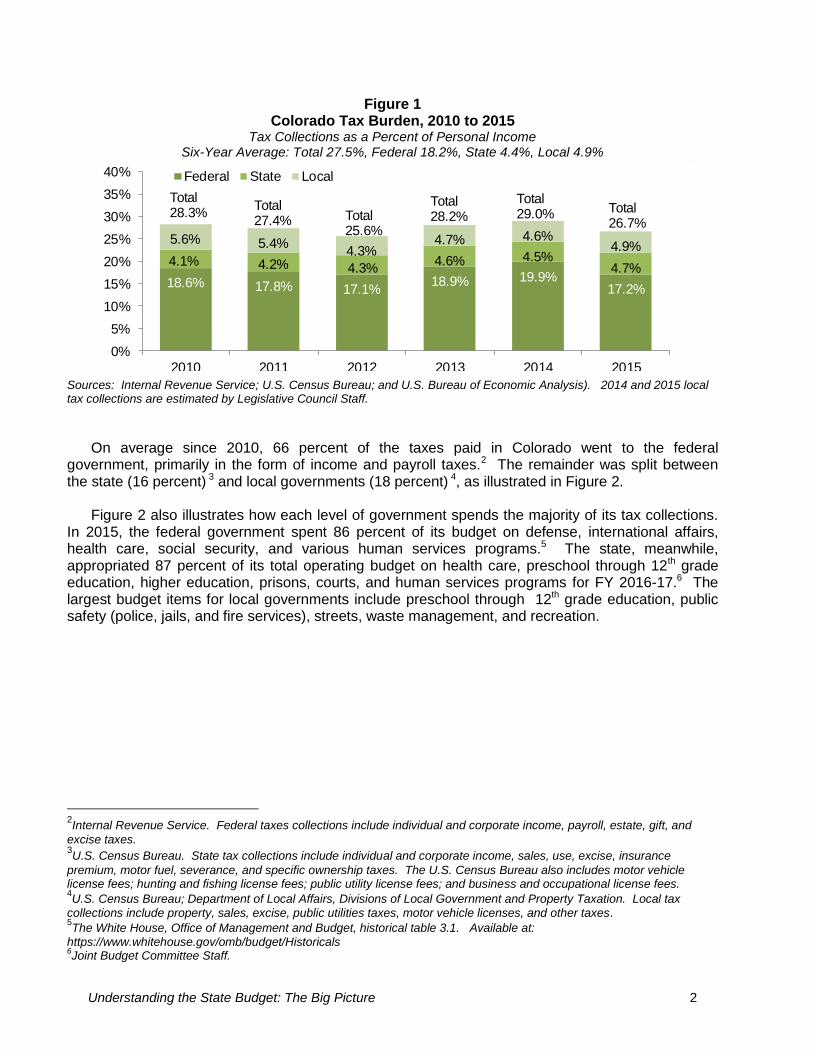
Colorado Tax Burden and Distribution of Tax Dollars Since 2010, the taxes people and businesses have paid each year in Colorado to the federal, state, and local governments have averaged 27.5 percent of Colorado personal income (Figure 1).1 This tax burden varies slightly each year depending on variations in the growth rates of tax collections and the economy as a whole. Much of the variability in the federal tax burden is due to volatility in corporate income taxes. Variability in the state tax burden is primarily due to volatility in corporate income taxes and individual income taxes on capital gains, entrepreneurial income, and oil and gas royalties.
1Taxes include those paid by nonresidents and tourists, whereas income includes that of Colorado residents.
Table of Contents
Colorado Tax Burden and Distribution of Tax Dollars 1
Sources of State Government Revenue 3
TABOR Limit on State Government Revenue 7
State Budget Process 11
State Operating Budget 13
General Fund Budget and Spending Mandates 16
Constitutional Cash Fund Spending Mandates 20
Understanding the State Budget: The Big Picture 2
Figure 1 Colorado Tax Burden, 2010 to 2015
Tax Collections as a Percent of Personal Income Six-Year Average: Total 27.5%, Federal 18.2%, State 4.4%, Local 4.9%
Sources: Internal Revenue Service; U.S. Census Bureau; and U.S. Bureau of Economic Analysis). 2014 and 2015 local tax collections are estimated by Legislative Council Staff.
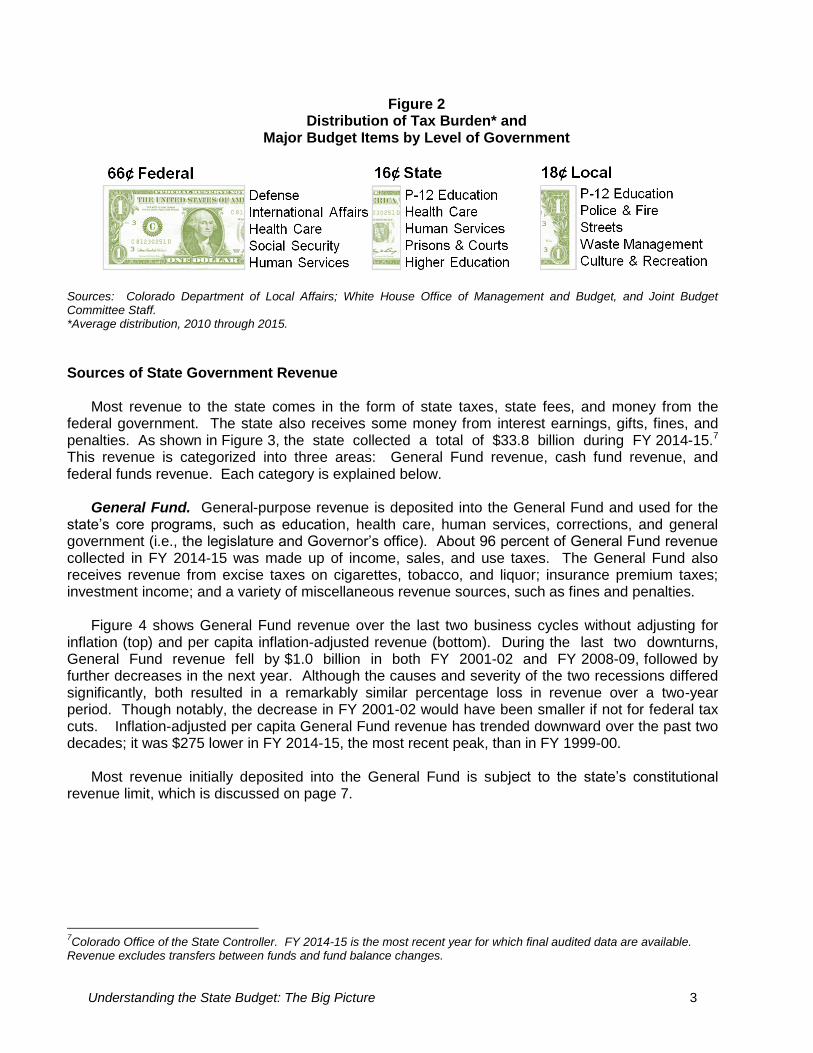
On average since 2010, 66 percent of the taxes paid in Colorado went to the federal government, primarily in the form of income and payroll taxes.2 The remainder was split between the state (16 percent) 3 and local governments (18 percent) 4, as illustrated in Figure 2.
Figure 2 also illustrates how each level of government spends the majority of its tax collections. In 2015, the federal government spent 86 percent of its budget on defense, international affairs, health care, social security, and various human services programs.5 The state, meanwhile, appropriated 87 percent of its total operating budget on health care, preschool through 12th grade education, higher education, prisons, courts, and human services programs for FY 2016-17.6 The largest budget items for local governments include preschool through 12th grade education, public safety (police, jails, and fire services), streets, waste management, and recreation.
2Internal Revenue Service. Federal taxes collections include individual and corporate income, payroll, estate, gift, and
excise taxes. 3U.S. Census Bureau. State tax collections include individual and corporate income, sales, use, excise, insurance
premium, motor fuel, severance, and specific ownership taxes. The U.S. Census Bureau also includes motor vehicle license fees; hunting and fishing license fees; public utility license fees; and business and occupational license fees. 4U.S. Census Bureau; Department of Local Affairs, Divisions of Local Government and Property Taxation. Local tax
collections include property, sales, excise, public utilities taxes, motor vehicle licenses, and other taxes. 5The White House, Office of Management and Budget, historical table 3.1. Available at:
https://www.whitehouse.gov/omb/budget/Historicals 6Joint Budget Committee Staff.
18.6% 17.8% 17.1%18.9% 19.9%
17.2%
4.1% 4.2% 4.3%4.6% 4.5%
4.7%
5.6% 5.4%4.3%
4.7% 4.6%4.9%
0%
5%
10%
15%
20%
25%
30%
35%
40%
2010 2011 2012 2013 2014 2015
Federal State Local
Total28.3%
Total27.4%
Total29.0%
Total28.2%Total
25.6%
Total26.7%
Understanding the State Budget: The Big Picture 3
Figure 2 Distribution of Tax Burden* and
Major Budget Items by Level of Government
Sources: Colorado Department of Local Affairs; White House Office of Management and Budget, and Joint Budget Committee Staff. *Average distribution, 2010 through 2015.
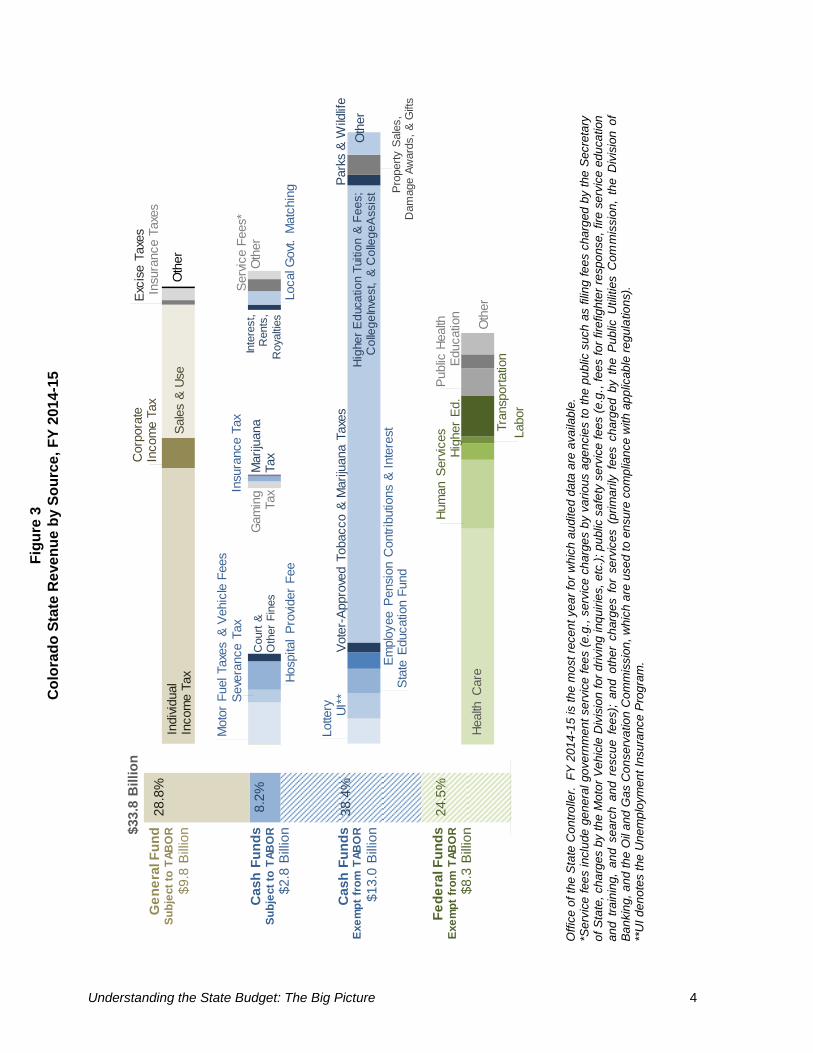
Sources of State Government Revenue
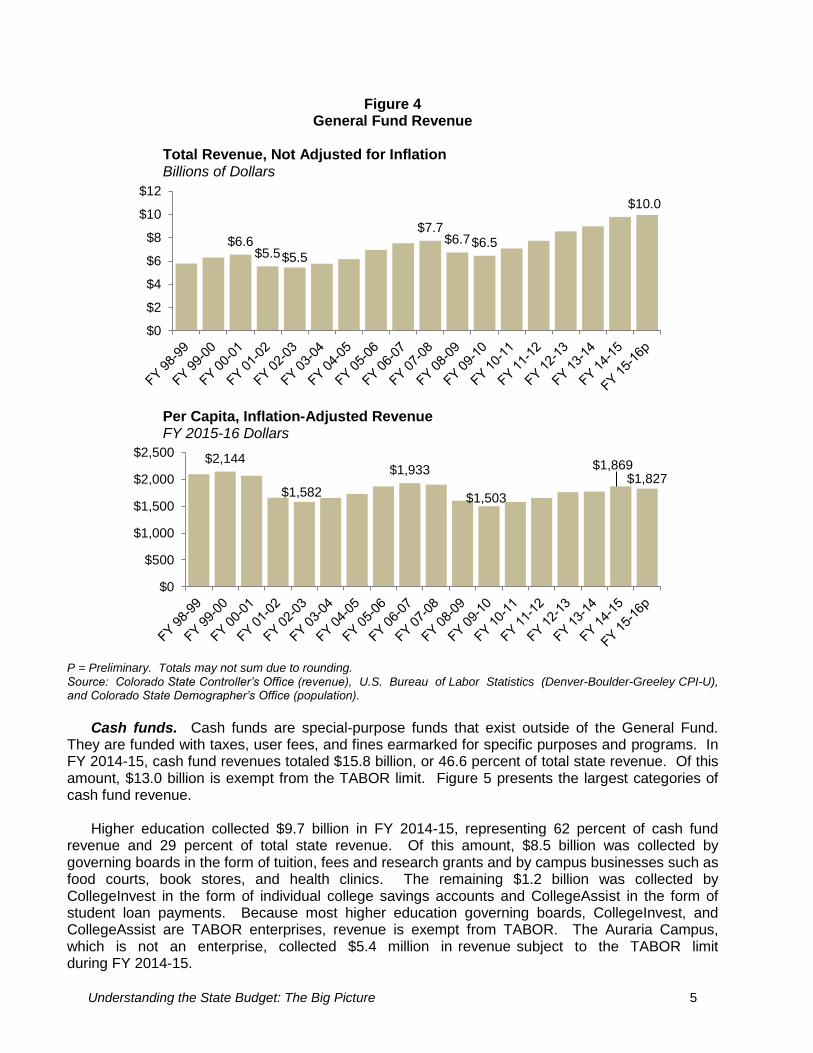
Most revenue to the state comes in the form of state taxes, state fees, and money from the federal government. The state also receives some money from interest earnings, gifts, fines, and penalties. As shown in Figure 3, the state collected a total of $33.8 billion during FY 2014-15.7 This revenue is categorized into three areas: General Fund revenue, cash fund revenue, and federal funds revenue. Each category is explained below. General Fund. General-purpose revenue is deposited into the General Fund and used for the state’s core programs, such as education, health care, human services, corrections, and general government (i.e., the legislature and Governor’s office). About 96 percent of General Fund revenue collected in FY 2014-15 was made up of income, sales, and use taxes. The General Fund also receives revenue from excise taxes on cigarettes, tobacco, and liquor; insurance premium taxes; investment income; and a variety of miscellaneous revenue sources, such as fines and penalties. Figure 4 shows General Fund revenue over the last two business cycles without adjusting for inflation (top) and per capita inflation-adjusted revenue (bottom). During the last two downturns, General Fund revenue fell by $1.0 billion in both FY 2001-02 and FY 2008-09, followed by further decreases in the next year. Although the causes and severity of the two recessions differed significantly, both resulted in a remarkably similar percentage loss in revenue over a two-year period. Though notably, the decrease in FY 2001-02 would have been smaller if not for federal tax cuts. Inflation-adjusted per capita General Fund revenue has trended downward over the past two decades; it was $275 lower in FY 2014-15, the most recent peak, than in FY 1999-00. Most revenue initially deposited into the General Fund is subject to the state’s constitutional revenue limit, which is discussed on page 7.
7Colorado Office of the State Controller. FY 2014-15 is the most recent year for which final audited data are available.
Revenue excludes transfers between funds and fund balance changes.
Understanding the State Budget: The Big Picture 4
28
.8%
8.2
%
38
.4%
24
.5%
$33.8
Billio
n
1
Corp
ora
te
Incom
e T
ax
1In
div
idual
Incom
e T
ax
Sale
s &
Use
Exc
ise T
axe
sIn
sura
nce T
axe
s
Oth
er
Inte
rest,
Rents
,
Roya
lties
Local G
ovt
. M
atc
hin
g
Oth
er
Moto
r F
uel Taxe
s &
Vehic
le F
ees
Court
&
Oth
er
Fin
es
Hospital
Pro
vider
Fee
1
Hum
an S
erv
ices
Hig
her
Ed.
Health
Care
Public
Health
Education
Tra
nsport
ation
Labor
Oth
er
Lottery UI*
*
V
ote
r-A
ppro
ved T
obacco &
Mari
juana T
axe
s
Hig
he
r E
duca
tio
n T
uitio
n&
Fe
es;
Co
lleg
eIn
vest, &
Co
lleg
eA
ssis
t
Park
s &
Wild
life
Oth
er
Sta
te E
ducation F
und
Seve
rance T
ax
Gam
ing
TaxIn
sura
nce
Tax
Mari
juana
Tax
Serv
ice F
ees*
Em
plo
yee P
ensio
n C
ontr
ibutions &
Inte
rest
Pro
pert
y S
ale
s,
Dam
age A
ward
s,
& G
ifts
28.8
%
8.2
%
38.4
%
24.5
%
Ge
ne
ral F
un
dS
ub
ject
to T
AB
OR
$9
.8 B
illio
n
Cash
Fu
nd
sS
ub
ject
to T
AB
OR
$2.8
Bill
ion
Cash
Fu
nd
sE
xe
mp
t fr
om
TA
BO
R
$13.0
Bill
ion
Fe
de
ral F
un
ds
Exe
mp
t fr
om
TA
BO
R
$8.3
Bill
ion
Fig
ure
3
Co
lora
do
Sta
te R
eve
nu
e b
y S
ou
rce
, F
Y 2
01
4-1
5
Off
ice
of
the
Sta
te C
on
tro
ller.
F
Y 2
01
4-1
5 is th
e m
ost
rece
nt ye
ar
for
wh
ich
au
dite
d d
ata
are
ava
ilab
le.
*Serv
ice
fee
s inclu
de
ge
ne
ral g
ove
rnm
en
t se
rvic
e f
ee
s (
e.g
., s
erv
ice
ch
arg
es b
y v
ario
us a
ge
ncie
s t
o t
he
pu
blic
such
as f
ilin
g f
ee
s c
ha
rged
by t
he
Secre
tary
o
f S
tate
, ch
arg
es b
y t
he
Mo
tor
Ve
hic
le D
ivis
ion
fo
r d
rivin
g inq
uir
ies,
etc
.);
pu
blic
sa
fety
se
rvic
e f
ees (
e.g
., f
ee
s f
or
fire
fig
hte
r re
sp
onse
, fire
se
rvic
e e
du
ca
tion
an
d t
rain
ing,
an
d s
ea
rch
an
d r
escu
e f
ee
s);
an
d o
the
r ch
arg
es f
or
se
rvic
es (
pri
ma
rily
fee
s c
ha
rge
d b
y t
he
Pu
blic
Utilit
ies C
om
mis
sio
n,
the
Div
isio
n o
f B
an
kin
g, a
nd
th
e O
il a
nd
Gas C
on
se
rva
tio
n C
om
mis
sio
n,
whic
h a
re u
se
d t
o e
nsu
re c
om
plia
nce
with
ap
plic
ab
le r
eg
ula
tio
ns).
**
UI d
en
ote
s t
he
Un
em
plo
ym
en
t In
su
rance
Pro
gra
m.
Understanding the State Budget: The Big Picture 5
Figure 4 General Fund Revenue
Total Revenue, Not Adjusted for Inflation
Billions of Dollars
Per Capita, Inflation-Adjusted Revenue FY 2015-16 Dollars
P = Preliminary. Totals may not sum due to rounding. Source: Colorado State Controller’s Office (revenue), U.S. Bureau of Labor Statistics (Denver-Boulder-Greeley CPI-U), and Colorado State Demographer’s Office (population).
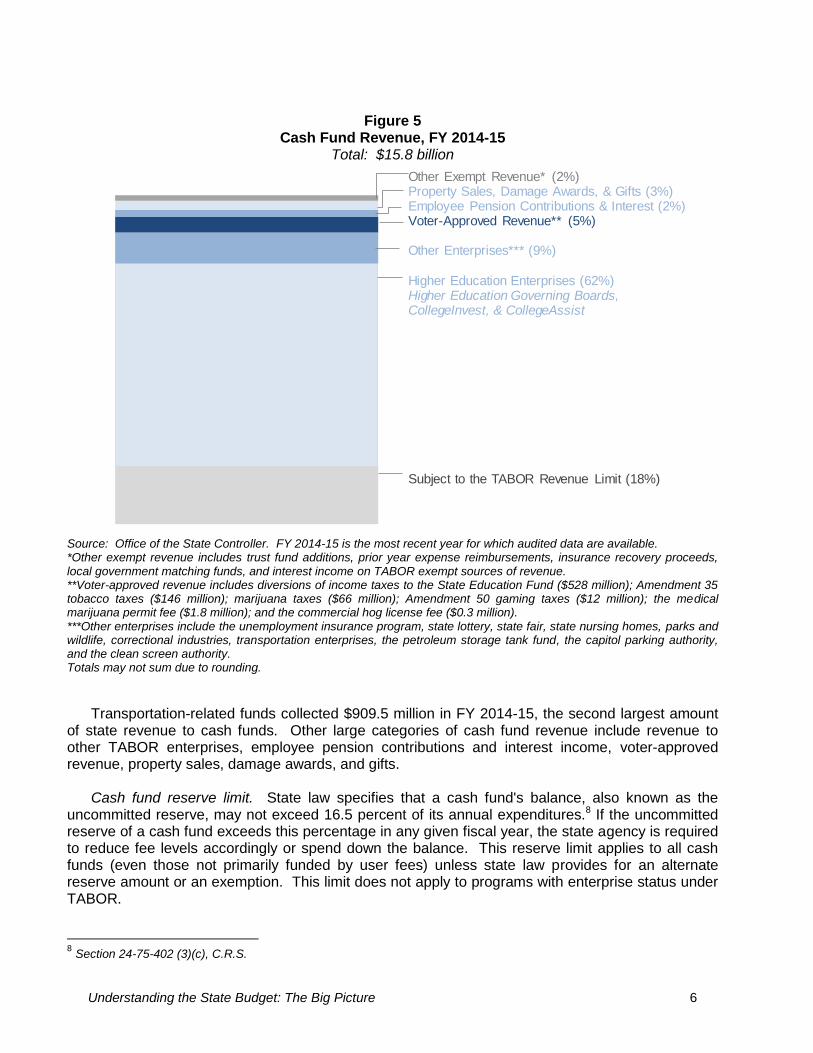
Cash funds. Cash funds are special-purpose funds that exist outside of the General Fund. They are funded with taxes, user fees, and fines earmarked for specific purposes and programs. In FY 2014-15, cash fund revenues totaled $15.8 billion, or 46.6 percent of total state revenue. Of this amount, $13.0 billion is exempt from the TABOR limit. Figure 5 presents the largest categories of cash fund revenue. Higher education collected $9.7 billion in FY 2014-15, representing 62 percent of cash fund revenue and 29 percent of total state revenue. Of this amount, $8.5 billion was collected by governing boards in the form of tuition, fees and research grants and by campus businesses such as food courts, book stores, and health clinics. The remaining $1.2 billion was collected by CollegeInvest in the form of individual college savings accounts and CollegeAssist in the form of student loan payments. Because most higher education governing boards, CollegeInvest, and CollegeAssist are TABOR enterprises, revenue is exempt from TABOR. The Auraria Campus, which is not an enterprise, collected $5.4 million in revenue subject to the TABOR limit during FY 2014-15.
$6.6 $5.5 $5.5
$7.7 $6.7 $6.5
$10.0
$0
$2
$4
$6
$8
$10
$12
Billio
ns o
f D
ollars
$2,144
$1,582
$1,933
$1,503
$1,869 $1,827
$0
$500
$1,000
$1,500
$2,000
$2,500
Understanding the State Budget: The Big Picture 6
Figure 5
Cash Fund Revenue, FY 2014-15 Total: $15.8 billion
Source: Office of the State Controller. FY 2014-15 is the most recent year for which audited data are available. *Other exempt revenue includes trust fund additions, prior year expense reimbursements, insurance recovery proceeds, local government matching funds, and interest income on TABOR exempt sources of revenue. **Voter-approved revenue includes diversions of income taxes to the State Education Fund ($528 million); Amendment 35 tobacco taxes ($146 million); marijuana taxes ($66 million); Amendment 50 gaming taxes ($12 million); the medical marijuana permit fee ($1.8 million); and the commercial hog license fee ($0.3 million). ***Other enterprises include the unemployment insurance program, state lottery, state fair, state nursing homes, parks and wildlife, correctional industries, transportation enterprises, the petroleum storage tank fund, the capitol parking authority, and the clean screen authority. Totals may not sum due to rounding.
Transportation-related funds collected $909.5 million in FY 2014-15, the second largest amount of state revenue to cash funds. Other large categories of cash fund revenue include revenue to other TABOR enterprises, employee pension contributions and interest income, voter-approved revenue, property sales, damage awards, and gifts. Cash fund reserve limit. State law specifies that a cash fund's balance, also known as the uncommitted reserve, may not exceed 16.5 percent of its annual expenditures.8 If the uncommitted reserve of a cash fund exceeds this percentage in any given fiscal year, the state agency is required to reduce fee levels accordingly or spend down the balance. This reserve limit applies to all cash funds (even those not primarily funded by user fees) unless state law provides for an alternate reserve amount or an exemption. This limit does not apply to programs with enterprise status under TABOR.
8 Section 24-75-402 (3)(c), C.R.S.
Other Exempt Revenue* (2%)Property Sales, Damage Awards, & Gifts (3%)Employee Pension Contributions & Interest (2%)Voter-Approved Revenue** (5%)
Other Enterprises*** (9%)
Higher Education Enterprises (62%)Higher Education Governing Boards, CollegeInvest, & CollegeAssist
Subject to the TABOR Revenue Limit (18%)
Understanding the State Budget: The Big Picture 7
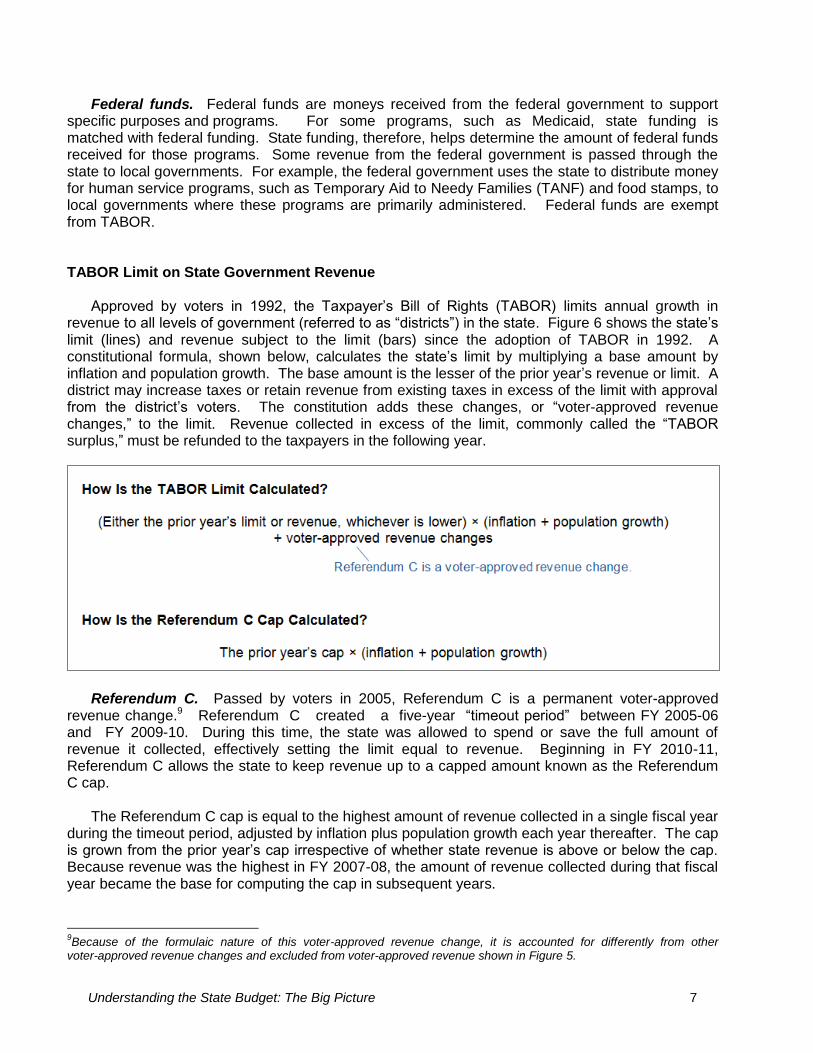
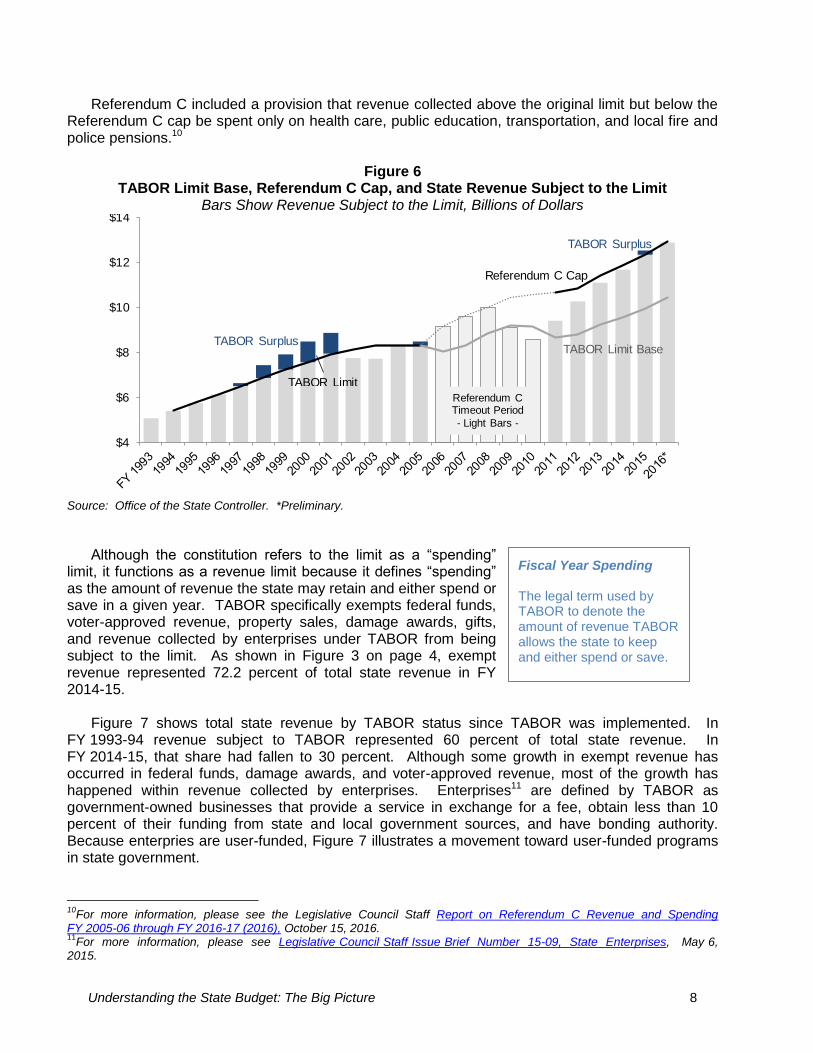
Federal funds. Federal funds are moneys received from the federal government to support specific purposes and programs. For some programs, such as Medicaid, state funding is matched with federal funding. State funding, therefore, helps determine the amount of federal funds received for those programs. Some revenue from the federal government is passed through the state to local governments. For example, the federal government uses the state to distribute money for human service programs, such as Temporary Aid to Needy Families (TANF) and food stamps, to local governments where these programs are primarily administered. Federal funds are exempt from TABOR. TABOR Limit on State Government Revenue Approved by voters in 1992, the Taxpayer’s Bill of Rights (TABOR) limits annual growth in revenue to all levels of government (referred to as “districts”) in the state. Figure 6 shows the state’s limit (lines) and revenue subject to the limit (bars) since the adoption of TABOR in 1992. A constitutional formula, shown below, calculates the state’s limit by multiplying a base amount by inflation and population growth. The base amount is the lesser of the prior year’s revenue or limit. A district may increase taxes or retain revenue from existing taxes in excess of the limit with approval from the district’s voters. The constitution adds these changes, or “voter-approved revenue changes,” to the limit. Revenue collected in excess of the limit, commonly called the “TABOR surplus,” must be refunded to the taxpayers in the following year.
Referendum C. Passed by voters in 2005, Referendum C is a permanent voter-approved revenue change.9 Referendum C created a five-year “timeout period” between FY 2005-06 and FY 2009-10. During this time, the state was allowed to spend or save the full amount of revenue it collected, effectively setting the limit equal to revenue. Beginning in FY 2010-11, Referendum C allows the state to keep revenue up to a capped amount known as the Referendum C cap. The Referendum C cap is equal to the highest amount of revenue collected in a single fiscal year during the timeout period, adjusted by inflation plus population growth each year thereafter. The cap is grown from the prior year’s cap irrespective of whether state revenue is above or below the cap. Because revenue was the highest in FY 2007-08, the amount of revenue collected during that fiscal year became the base for computing the cap in subsequent years.
9Because of the formulaic nature of this voter-approved revenue change, it is accounted for differently from other
voter-approved revenue changes and excluded from voter-approved revenue shown in Figure 5.
X X
Understanding the State Budget: The Big Picture 8
Referendum C included a provision that revenue collected above the original limit but below the Referendum C cap be spent only on health care, public education, transportation, and local fire and police pensions.10
Figure 6 TABOR Limit Base, Referendum C Cap, and State Revenue Subject to the Limit
Bars Show Revenue Subject to the Limit, Billions of Dollars
Source: Office of the State Controller. *Preliminary.
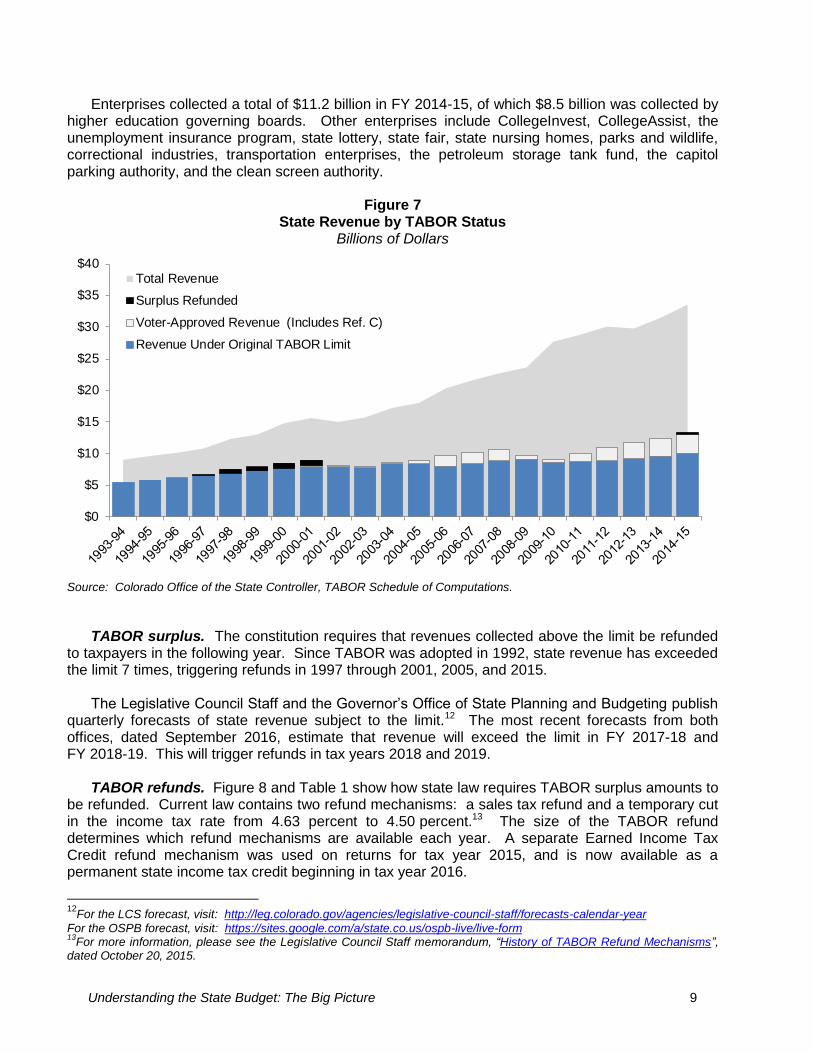
Although the constitution refers to the limit as a “spending” limit, it functions as a revenue limit because it defines “spending” as the amount of revenue the state may retain and either spend or save in a given year. TABOR specifically exempts federal funds, voter-approved revenue, property sales, damage awards, gifts, and revenue collected by enterprises under TABOR from being subject to the limit. As shown in Figure 3 on page 4, exempt revenue represented 72.2 percent of total state revenue in FY 2014-15. Figure 7 shows total state revenue by TABOR status since TABOR was implemented. In FY 1993-94 revenue subject to TABOR represented 60 percent of total state revenue. In FY 2014-15, that share had fallen to 30 percent. Although some growth in exempt revenue has occurred in federal funds, damage awards, and voter-approved revenue, most of the growth has happened within revenue collected by enterprises. Enterprises11 are defined by TABOR as government-owned businesses that provide a service in exchange for a fee, obtain less than 10 percent of their funding from state and local government sources, and have bonding authority. Because enterpries are user-funded, Figure 7 illustrates a movement toward user-funded programs in state government.
10
For more information, please see the Legislative Council Staff Report on Referendum C Revenue and Spending FY 2005-06 through FY 2016-17 (2016), October 15, 2016. 11
For more information, please see Legislative Council Staff Issue Brief Number 15-09, State Enterprises, May 6, 2015.
$4
$6
$8
$10
$12
$14
Referendum CTimeout Period
- Light Bars -
TABOR Surplus
TABOR Surplus
TABOR Limit
TABOR Limit Base
Referendum C Cap
Fiscal Year Spending The legal term used by TABOR to denote the amount of revenue TABOR allows the state to keep and either spend or save.
Understanding the State Budget: The Big Picture 9
Enterprises collected a total of $11.2 billion in FY 2014-15, of which $8.5 billion was collected by higher education governing boards. Other enterprises include CollegeInvest, CollegeAssist, the unemployment insurance program, state lottery, state fair, state nursing homes, parks and wildlife, correctional industries, transportation enterprises, the petroleum storage tank fund, the capitol parking authority, and the clean screen authority.
Figure 7
State Revenue by TABOR Status Billions of Dollars
Source: Colorado Office of the State Controller, TABOR Schedule of Computations.
TABOR surplus. The constitution requires that revenues collected above the limit be refunded to taxpayers in the following year. Since TABOR was adopted in 1992, state revenue has exceeded the limit 7 times, triggering refunds in 1997 through 2001, 2005, and 2015. The Legislative Council Staff and the Governor’s Office of State Planning and Budgeting publish quarterly forecasts of state revenue subject to the limit.12 The most recent forecasts from both offices, dated September 2016, estimate that revenue will exceed the limit in FY 2017-18 and FY 2018-19. This will trigger refunds in tax years 2018 and 2019. TABOR refunds. Figure 8 and Table 1 show how state law requires TABOR surplus amounts to be refunded. Current law contains two refund mechanisms: a sales tax refund and a temporary cut in the income tax rate from 4.63 percent to 4.50 percent.13 The size of the TABOR refund determines which refund mechanisms are available each year. A separate Earned Income Tax Credit refund mechanism was used on returns for tax year 2015, and is now available as a permanent state income tax credit beginning in tax year 2016.
12
For the LCS forecast, visit: http://leg.colorado.gov/agencies/legislative-council-staff/forecasts-calendar-year
For the OSPB forecast, visit: https://sites.google.com/a/state.co.us/ospb-live/live-form 13
For more information, please see the Legislative Council Staff memorandum, “History of TABOR Refund Mechanisms”, dated October 20, 2015.
$0
$5
$10
$15
$20
$25
$30
$35
$40Total Revenue
Surplus Refunded
Voter-Approved Revenue (Includes Ref. C)
Revenue Under Original TABOR Limit
Understanding the State Budget: The Big Picture 10
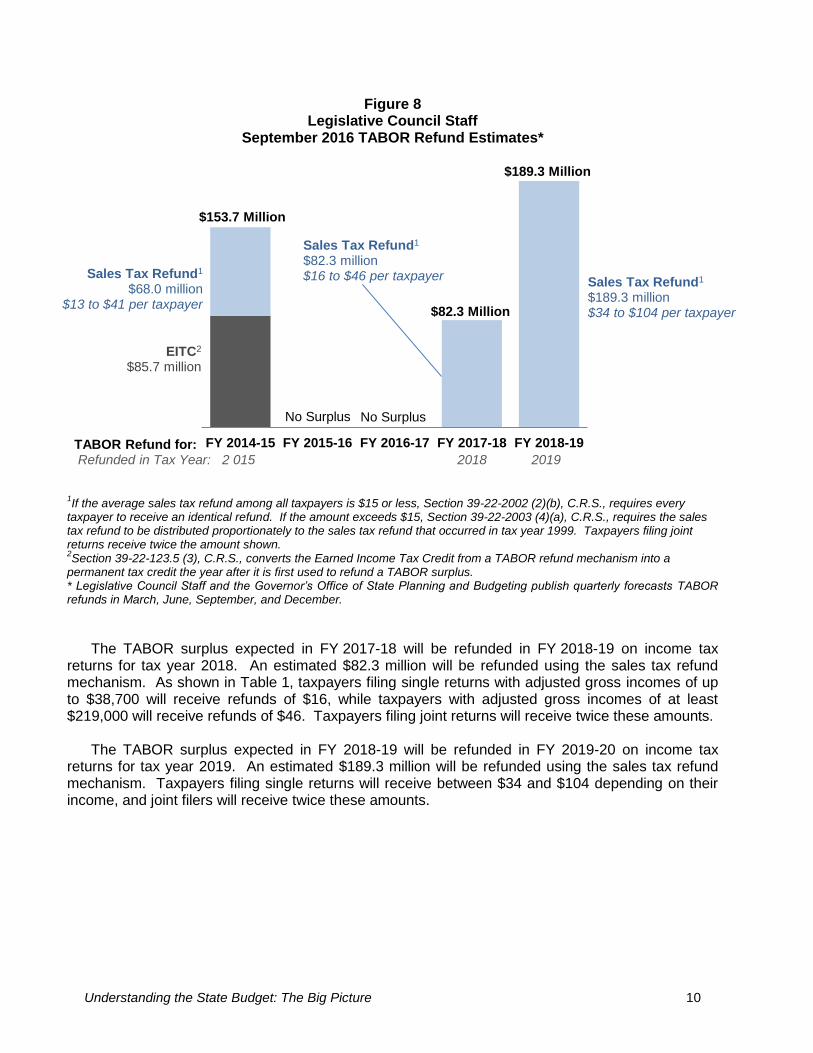
Figure 8 Legislative Council Staff
September 2016 TABOR Refund Estimates*
1If the average sales tax refund among all taxpayers is $15 or less, Section 39-22-2002 (2)(b), C.R.S., requires every
taxpayer to receive an identical refund. If the amount exceeds $15, Section 39-22-2003 (4)(a), C.R.S., requires the sales tax refund to be distributed proportionately to the sales tax refund that occurred in tax year 1999. Taxpayers filing joint returns receive twice the amount shown.
2Section 39-22-123.5 (3), C.R.S., converts the Earned Income Tax Credit from a TABOR refund mechanism into a
permanent tax credit the year after it is first used to refund a TABOR surplus. * Legislative Council Staff and the Governor’s Office of State Planning and Budgeting publish quarterly forecasts TABOR refunds in March, June, September, and December.
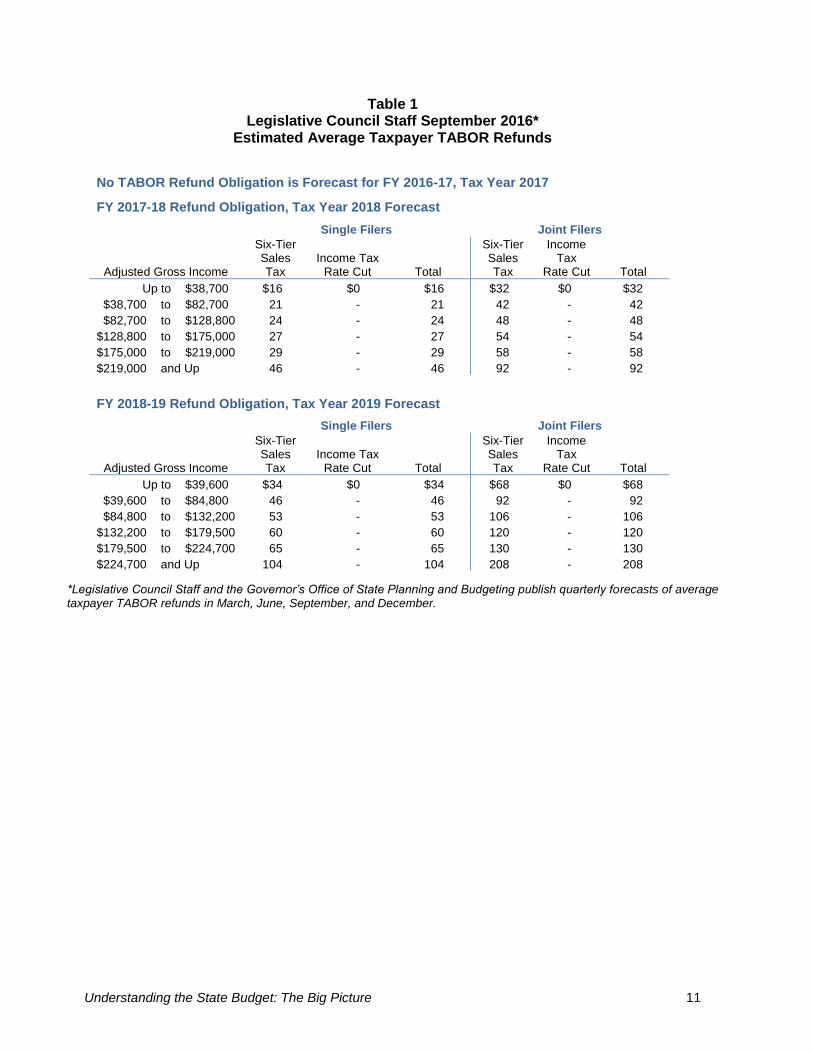
The TABOR surplus expected in FY 2017-18 will be refunded in FY 2018-19 on income tax returns for tax year 2018. An estimated $82.3 million will be refunded using the sales tax refund mechanism. As shown in Table 1, taxpayers filing single returns with adjusted gross incomes of up to $38,700 will receive refunds of $16, while taxpayers with adjusted gross incomes of at least $219,000 will receive refunds of $46. Taxpayers filing joint returns will receive twice these amounts. The TABOR surplus expected in FY 2018-19 will be refunded in FY 2019-20 on income tax returns for tax year 2019. An estimated $189.3 million will be refunded using the sales tax refund mechanism. Taxpayers filing single returns will receive between $34 and $104 depending on their income, and joint filers will receive twice these amounts.
FY 2014-15 FY 2015-16 FY 2016-17 FY 2017-18 FY 2018-19
Sales Tax Refund1
$68.0 million $13 to $41 per taxpayer
EITC2
$85.7 million
$153.7 Million
$82.3 Million
Sales Tax Refund1
$189.3 million $34 to $104 per taxpayer
No Surplus
TABOR Refund for: Refunded in Tax Year: 2 015 2018 2019
No Surplus
$189.3 Million
Sales Tax Refund1
$82.3 million $16 to $46 per taxpayer
Understanding the State Budget: The Big Picture 11
Table 1 Legislative Council Staff September 2016*
Estimated Average Taxpayer TABOR Refunds
*Legislative Council Staff and the Governor’s Office of State Planning and Budgeting publish quarterly forecasts of average taxpayer TABOR refunds in March, June, September, and December.
No TABOR Refund Obligation is Forecast for FY 2016-17, Tax Year 2017
FY 2017-18 Refund Obligation, Tax Year 2018 Forecast
Adjusted Gross Income
Single Filers Joint Filers
Six-Tier Sales Tax
Income Tax Rate Cut Total
Six-Tier Sales Tax
Income Tax
Rate Cut Total
Up to $38,700 $16 $0 $16 $32 $0 $32
$38,700 to $82,700 21 - 21 42 - 42
$82,700 to $128,800 24 - 24 48 - 48
$128,800 to $175,000 27 - 27 54 - 54
$175,000 to $219,000 29 - 29 58 - 58
$219,000 and Up 46 - 46 92 - 92
FY 2018-19 Refund Obligation, Tax Year 2019 Forecast
Adjusted Gross Income
Single Filers Joint Filers
Six-Tier Sales Tax
Income Tax Rate Cut Total
Six-Tier Sales Tax
Income Tax
Rate Cut Total
Up to $39,600 $34 $0 $34 $68 $0 $68
$39,600 to $84,800 46 - 46 92 - 92
$84,800 to $132,200 53 - 53 106 - 106
$132,200 to $179,500 60 - 60 120 - 120
$179,500 to $224,700 65 - 65 130 - 130
$224,700 and Up 104 - 104 208 - 208
Understanding the State Budget: The Big Picture 12
CD
C: C
apital D
evelo
pm
en
t C
om
mitte
e
CD
HE
: C
olo
rado
Co
mm
issio
n o
n H
ighe
r E
du
cation
JB
C: J
oin
t B
ud
get
Co
mm
itte
e
LC
S:
Le
gis
lative C
ou
ncil
Sta
ff
OS
PB
: O
ffic
e o
f S
tate
Pla
nnin
g a
nd B
udg
etin
g
Understanding the State Budget: The Big Picture 13
State Budget Process
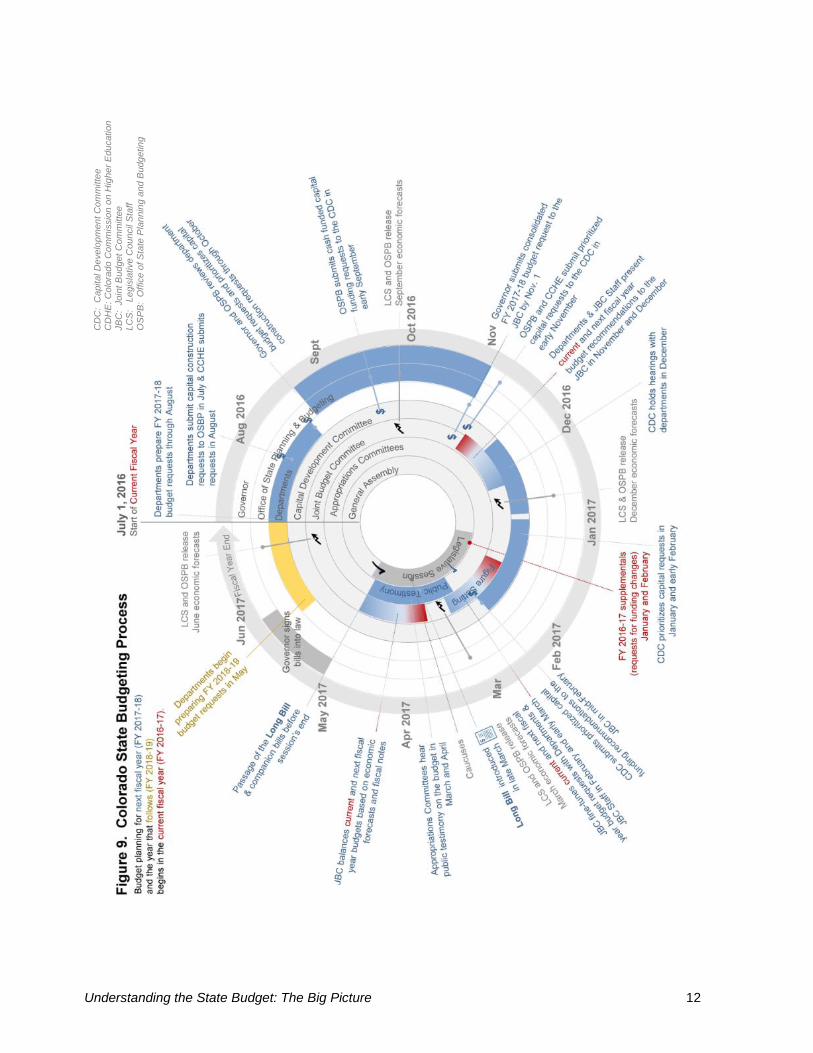
Figure 9 illustrates the state budget process for FY 2016-17. The state budget operates on a fiscal year basis between July 1 and June 30. Colorado’s budget is set largely through a general appropriations act (known as the “Long Bill”) and its companion supplemental appropriations acts. Formulating the state’s annual budget involves state departments, the Judicial Branch, the Office of State Planning and Budgeting (OSPB), and the General Assembly, including its Joint Budget Committee (JBC), JBC staff, Capital Development Committee (CDC), the Office of Legislative Legal Services, and Legislative Council Staff.
The process begins in May when executive branch departments begin preparing a budget
request for review and approval by OSPB. State departments also submit any capital construction, property acquisition and controlled maintenance requests to OSPB each September. OSPB then prepares a consolidated request from the Governor, an overview of which is presented to the JBC in early November.
Between November and January, each department and the Judicial Branch hold a “briefing”
meeting and a “hearing” meeting with the JBC. These meetings allow JBC members and a JBC staff analyst to discuss operational considerations with each department and to review base funding and requests for additional or new funding. During this period, the CDC also holds hearings on capital construction requests prioritized by the Governor before submitting its recommendations to the JBC in January.
In December, Legislative Council Staff and OSPB each prepare an economic forecast that
projects the amount of General Fund and cash fund moneys that will be available for appropriation during the next fiscal year. Forecasts released in December are used by the JBC the following January to prepare ”supplemental appropriation” bills, which make mid-year adjustments to the budget for the current fiscal year.
Between February and March, JBC staff makes recommendations on each department’s
request for the coming budget year to the JBC in a process that is referred to as “figure setting.” During this process, the JBC votes on appropriations to be included in the Long Bill for each department. The process includes an opportunity for departments to appeal certain decisions made by the committee, which is referred to as a “comeback.” Simultaneous to this, agencies of the General Assembly submit a budget request, which is enacted in a separate bill, to the Legislative Council for review.
In mid-March, LCS and OSPB update their respective revenue forecasts. After reviewing
these, the JBC prepares and introduces the Long Bill for consideration by the entire General Assembly. To implement portions of the Long Bill, “companion” bills may be introduced to change other parts of state law. For instance, the Long Bill could contain funding to expand an existing program and a companion bill might adjust the eligibility criteria contained in statute. The Long Bill and its companion bills are collectively colloquially referred to as the “budget package” and are summarized in the “budget narrative” published by the JBC Staff.
Members of the General Assembly review the budget package and propose amendments.
In each chamber, each caucus meets to review the budget and potential amendments in advance of hearing the bills in committee. The Appropriations Committee in each chamber is usually the committee of reference for the budget, and public testimony is offered before each bill is acted upon. If needed, the JBC serves as a conference committee on the budget package following its passage by both chambers. These bills are then signed into law in order to take effect on July 1, the first day of the next fiscal year.
Understanding the State Budget: The Big Picture 14
State Operating Budget Altogether, appropriations are set to provide sufficient funding to state agencies to meet the requirements in law. The Colorado Constitution requires that the state spend only what it has available to it each year, prohibits general obligation debt, and requires voters to approve other forms of debt. Therefore, the state does not spend more than it takes in or has previously saved in a reserve during a given fiscal year.14 Figure 10 shows total state appropriations by department and funding source in FY 2016-17. When the General Assembly makes an appropriation, it is granting a state agency the authority to spend money. During the 2016 legislative session, the General Assembly appropriated a total of $27.0 billion to 22 departments, of which $25.5 billion represented appropriations of unique dollars. Reappropriated funds, or appropriations of dollars that have already been appropriated at least once before, totaled $1.5 billion in FY 2016-17. The General Assembly appropriates some dollars more than once in order to maintain control over the life of the dollar as it moves between agencies within the state. For example, the Governor’s Office of Information Technology (OIT) provides information technology services to the entire executive branch. To finance these services, money that has already been appropriated to each department is then appropriated a second time (reappropriated) to OIT.
Appropriations are categorized based on funding source. Money may not be spent out of the General Fund or a cash fund without a specific annual appropriation from the General Assembly. Continuous appropriations are the exception. A continuous appropriation is a statutory or constitutional provision that allows a government entity to spend whatever moneys are available in a specified fund without receiving an annual appropriation. State law specifies the purposes for which a continuous appropriation may be spent. Examples include the expenditure of revenue collected by many enterprises under TABOR; distributions of Conservation Trust Fund moneys to local governments; and various insurance funds, such as the workers compensation Major Medical Insurance and Subsequent Injury funds in the Department of Labor and Employment.
Because cash fund revenue is designated for specific purposes, the expenditure of cash
fund revenue is less flexible than General Fund revenue. Many fees are set at a specific amount in statute. However, the state legislature has also granted statutory authority for some fees to be adjusted within certain parameters by program administrators.
Like cash funds, federal funds are usually restricted for a specified purpose and are therefore custodial.15 Custodial funds are under the control of the Governor and may not be appropriated by the General Assembly,16 although some are shown in the Long Bill for informational purposes only. Federal law and court decisions require some federal funds to be appropriated, including the Social Services Block Grant, the Maternal and Child Health Block Grant, Temporary Assistance for Needy Families (TANF), and Child Care Development Funds.
14
Colorado’s constitution specifies that total appropriations by the General Assembly may not exceed the total tax revenue collected each fiscal year, thus prohibiting deficit spending. Colo. Const. Art. X, § 16. 15
Custodial funds include any cash or federal funds restricted for specific programs and purposes by the donor. 16
In re Interrogatories submitted by General Assembly on House Bill 04-1098, 88 P.3d 1196, 1200 (Colo. 2004).
Understanding the State Budget: The Big Picture 15
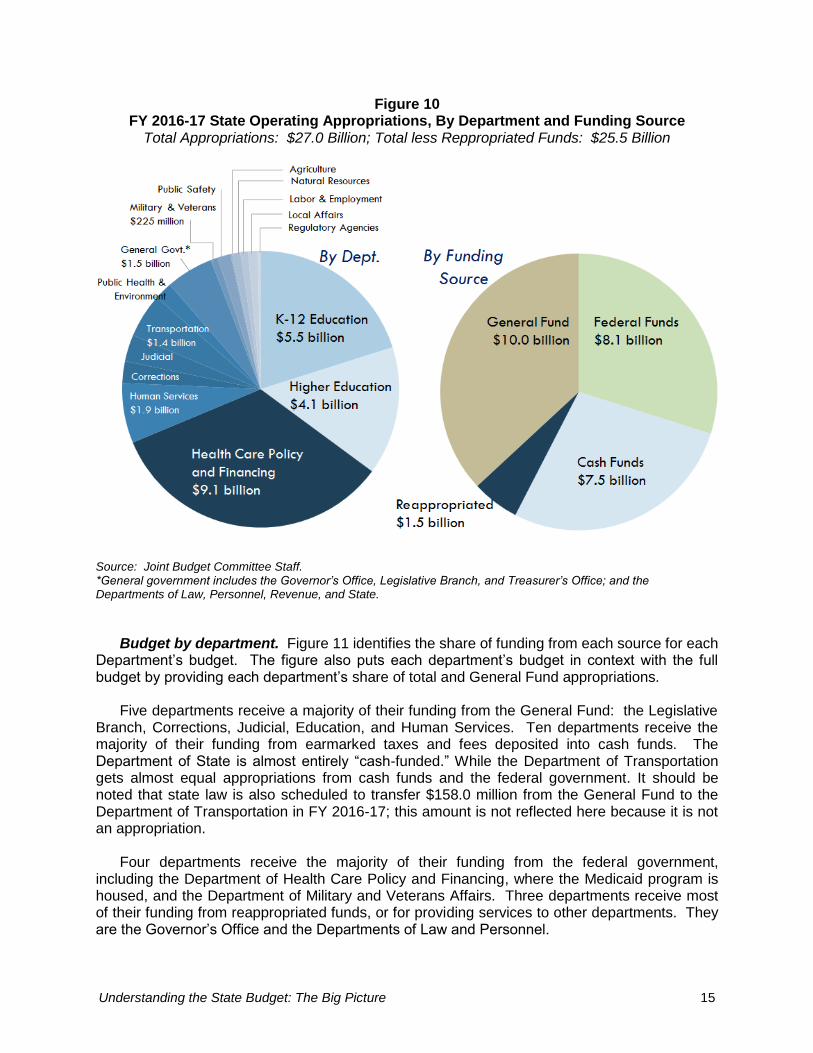
Figure 10 FY 2016-17 State Operating Appropriations, By Department and Funding Source
Total Appropriations: $27.0 Billion; Total less Reppropriated Funds: $25.5 Billion
Source: Joint Budget Committee Staff. *General government includes the Governor’s Office, Legislative Branch, and Treasurer’s Office; and the Departments of Law, Personnel, Revenue, and State.
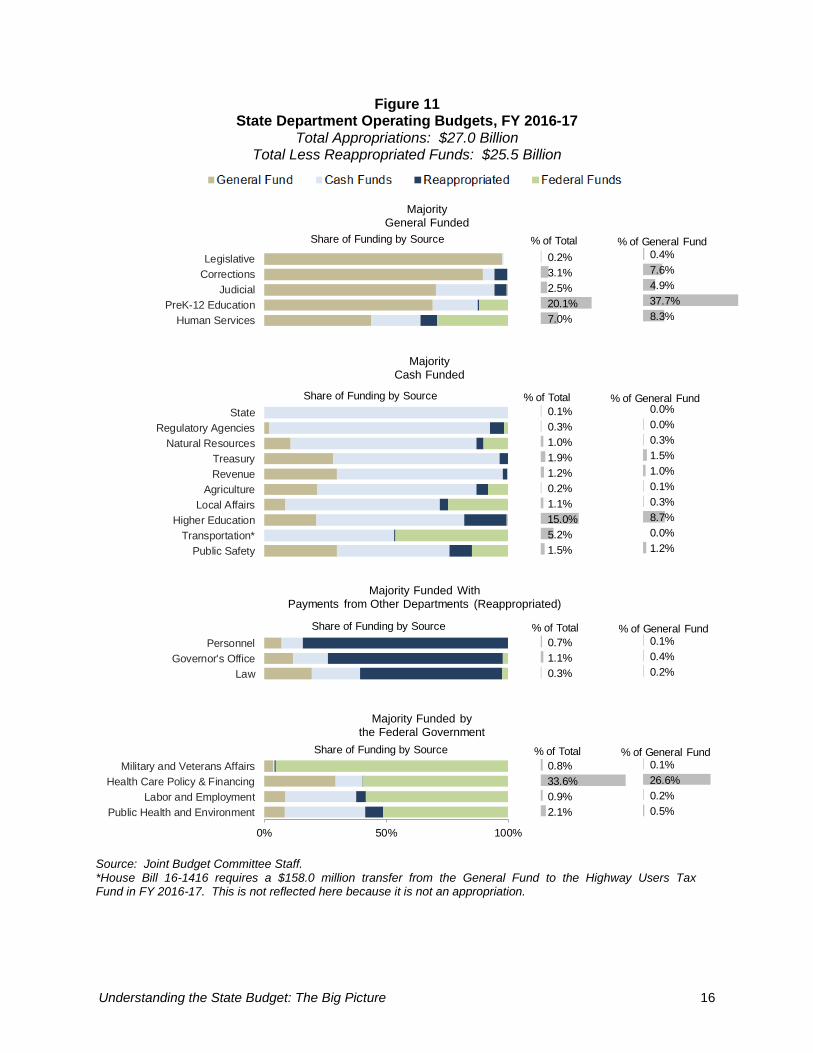
Budget by department. Figure 11 identifies the share of funding from each source for each Department’s budget. The figure also puts each department’s budget in context with the full budget by providing each department’s share of total and General Fund appropriations. Five departments receive a majority of their funding from the General Fund: the Legislative Branch, Corrections, Judicial, Education, and Human Services. Ten departments receive the majority of their funding from earmarked taxes and fees deposited into cash funds. The Department of State is almost entirely “cash-funded.” While the Department of Transportation gets almost equal appropriations from cash funds and the federal government. It should be noted that state law is also scheduled to transfer $158.0 million from the General Fund to the Department of Transportation in FY 2016-17; this amount is not reflected here because it is not an appropriation.
Four departments receive the majority of their funding from the federal government, including the Department of Health Care Policy and Financing, where the Medicaid program is housed, and the Department of Military and Veterans Affairs. Three departments receive most of their funding from reappropriated funds, or for providing services to other departments. They are the Governor’s Office and the Departments of Law and Personnel.
Understanding the State Budget: The Big Picture 16
Figure 11 State Department Operating Budgets, FY 2016-17
Total Appropriations: $27.0 Billion Total Less Reappropriated Funds: $25.5 Billion
Source: Joint Budget Committee Staff. *House Bill 16-1416 requires a $158.0 million transfer from the General Fund to the Highway Users Tax Fund in FY 2016-17. This is not reflected here because it is not an appropriation.
0% 50% 100%
Public Health and Environment
Labor and Employment
Health Care Policy & Financing
Military and Veterans Affairs
Law
Governor's Office
Personnel
Public Safety
Transportation*
Higher Education
Local Affairs
Agriculture
Revenue
Treasury
Natural Resources
Regulatory Agencies
State
Human Services
PreK-12 Education
Judicial
Corrections
Legislative
2.1%
0.9%
33.6%
0.8%
0.3%
1.1%
0.7%
1.5%
5.2%
15.0%
1.1%
0.2%
1.2%
1.9%
1.0%
0.3%
0.1%
7.0%
20.1%
2.5%
3.1%
0.2%
0.5%
0.2%
26.6%
0.1%
0.2%
0.4%
0.1%
1.2%
0.0%
8.7%
0.3%
0.1%
1.0%
1.5%
0.3%
0.0%
0.0%
8.3%
37.7%
4.9%
7.6%
0.4%
Majority Funded by the Federal Government
Majority Funded With Payments from Other Departments (Reappropriated)
Majority Cash Funded
Majority General Funded
Share of Funding by Source % of Total % of General Fund
Share of Funding by Source % of Total % of General Fund
Share of Funding by Source % of Total % of General Fund
Share of Funding by Source % of Total % of General Fund
Understanding the State Budget: The Big Picture 17
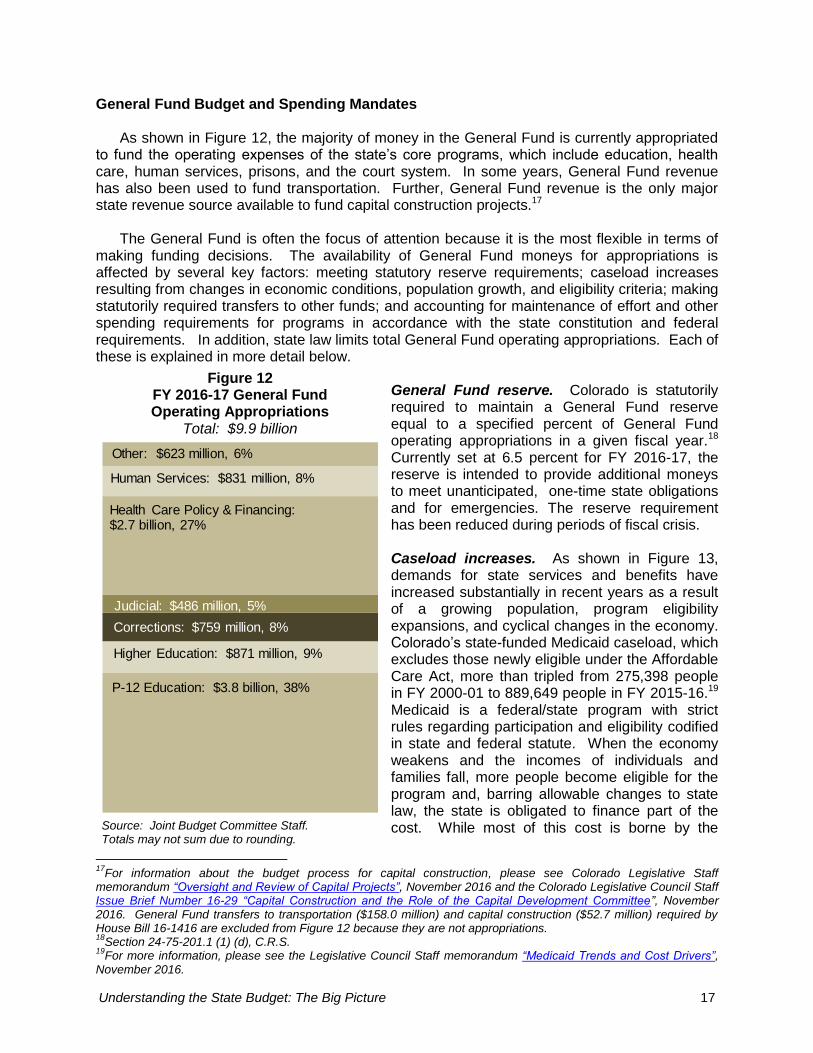
General Fund Budget and Spending Mandates As shown in Figure 12, the majority of money in the General Fund is currently appropriated to fund the operating expenses of the state’s core programs, which include education, health care, human services, prisons, and the court system. In some years, General Fund revenue has also been used to fund transportation. Further, General Fund revenue is the only major state revenue source available to fund capital construction projects.17
The General Fund is often the focus of attention because it is the most flexible in terms of making funding decisions. The availability of General Fund moneys for appropriations is affected by several key factors: meeting statutory reserve requirements; caseload increases resulting from changes in economic conditions, population growth, and eligibility criteria; making statutorily required transfers to other funds; and accounting for maintenance of effort and other spending requirements for programs in accordance with the state constitution and federal requirements. In addition, state law limits total General Fund operating appropriations. Each of these is explained in more detail below.
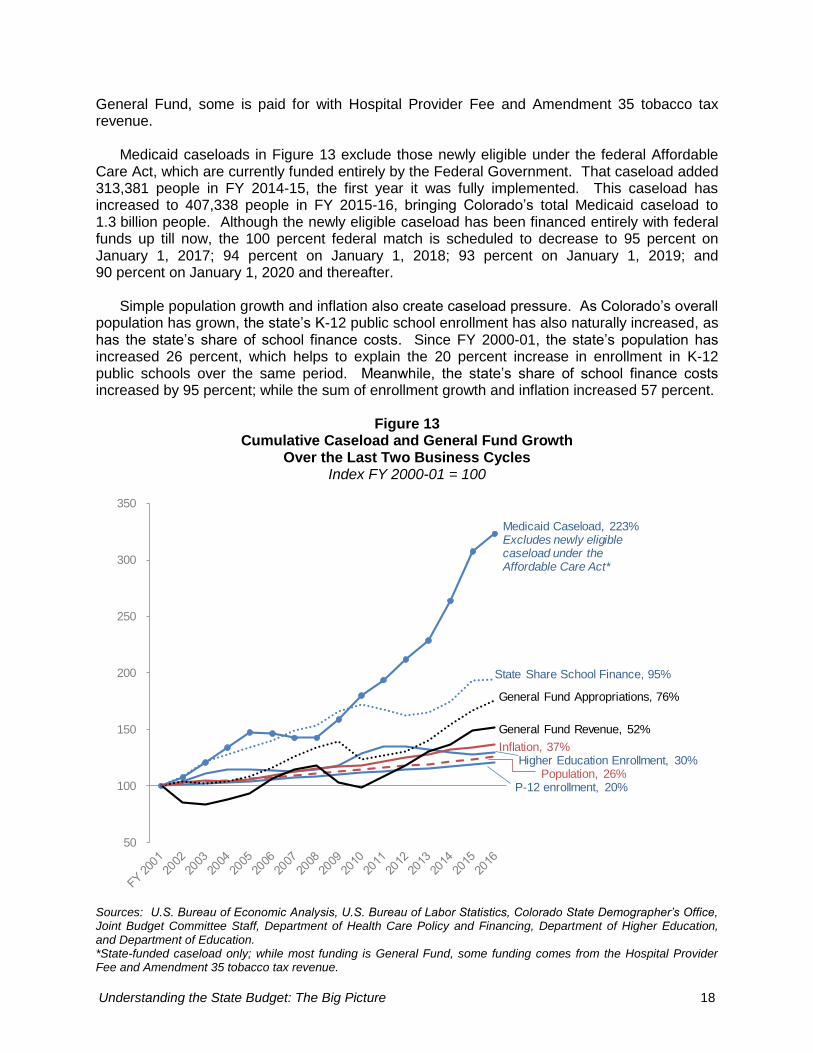
General Fund reserve. Colorado is statutorily required to maintain a General Fund reserve equal to a specified percent of General Fund operating appropriations in a given fiscal year.18 Currently set at 6.5 percent for FY 2016-17, the reserve is intended to provide additional moneys to meet unanticipated, one-time state obligations and for emergencies. The reserve requirement has been reduced during periods of fiscal crisis. Caseload increases. As shown in Figure 13, demands for state services and benefits have increased substantially in recent years as a result of a growing population, program eligibility expansions, and cyclical changes in the economy. Colorado’s state-funded Medicaid caseload, which excludes those newly eligible under the Affordable Care Act, more than tripled from 275,398 people in FY 2000-01 to 889,649 people in FY 2015-16.19 Medicaid is a federal/state program with strict rules regarding participation and eligibility codified in state and federal statute. When the economy weakens and the incomes of individuals and families fall, more people become eligible for the program and, barring allowable changes to state law, the state is obligated to finance part of the cost. While most of this cost is borne by the
17
For information about the budget process for capital construction, please see Colorado Legislative Staff memorandum “Oversight and Review of Capital Projects”, November 2016 and the Colorado Legislative Council Staff Issue Brief Number 16-29 “Capital Construction and the Role of the Capital Development Committee”, November 2016. General Fund transfers to transportation ($158.0 million) and capital construction ($52.7 million) required by House Bill 16-1416 are excluded from Figure 12 because they are not appropriations. 18
Section 24-75-201.1 (1) (d), C.R.S. 19
For more information, please see the Legislative Council Staff memorandum “Medicaid Trends and Cost Drivers”, November 2016.
Figure 12 FY 2016-17 General Fund Operating Appropriations
Total: $9.9 billion
Source: Joint Budget Committee Staff. Totals may not sum due to rounding.
Health Care Policy & Financing:$2.7 billion, 27%
Higher Education: $871 million, 9%
Corrections: $759 million, 8%
Judicial: $486 million, 5%
Human Services: $831 million, 8%
Other: $623 million, 6%
P-12 Education: $3.8 billion, 38%
Understanding the State Budget: The Big Picture 18
General Fund, some is paid for with Hospital Provider Fee and Amendment 35 tobacco tax revenue.
Medicaid caseloads in Figure 13 exclude those newly eligible under the federal Affordable
Care Act, which are currently funded entirely by the Federal Government. That caseload added 313,381 people in FY 2014-15, the first year it was fully implemented. This caseload has increased to 407,338 people in FY 2015-16, bringing Colorado’s total Medicaid caseload to 1.3 billion people. Although the newly eligible caseload has been financed entirely with federal funds up till now, the 100 percent federal match is scheduled to decrease to 95 percent on January 1, 2017; 94 percent on January 1, 2018; 93 percent on January 1, 2019; and 90 percent on January 1, 2020 and thereafter.
Simple population growth and inflation also create caseload pressure. As Colorado’s overall
population has grown, the state’s K-12 public school enrollment has also naturally increased, as has the state’s share of school finance costs. Since FY 2000-01, the state’s population has increased 26 percent, which helps to explain the 20 percent increase in enrollment in K-12 public schools over the same period. Meanwhile, the state’s share of school finance costs increased by 95 percent; while the sum of enrollment growth and inflation increased 57 percent.
Figure 13
Cumulative Caseload and General Fund Growth Over the Last Two Business Cycles
Index FY 2000-01 = 100
Sources: U.S. Bureau of Economic Analysis, U.S. Bureau of Labor Statistics, Colorado State Demographer’s Office, Joint Budget Committee Staff, Department of Health Care Policy and Financing, Department of Higher Education, and Department of Education. *State-funded caseload only; while most funding is General Fund, some funding comes from the Hospital Provider Fee and Amendment 35 tobacco tax revenue.
50
100
150
200
250
300
350
Medicaid Caseload, 223%Excludes newly eligible caseload under the Affordable Care Act*
State Share School Finance, 95%
General Fund Appropriations, 76%
General Fund Revenue, 52%
Inflation, 37%Higher Education Enrollment, 30%
Population, 26%P-12 enrollment, 20%
Understanding the State Budget: The Big Picture 19
Constitutionally required expenditures are prioritized over other expenditures. The Colorado Constitution includes the following requirements:
Public school funding. 20 Approved by voters in 2000, Amendment 23 requires increases in funding for public elementary and secondary education. From FY 2001-02 through FY 2010-11, the amendment required an annual increase in base per-pupil funding under the School Finance Act and the total state funding for categorical programs of at least the inflation rate plus one percentage point. Beginning in FY 2011-12, this increase is required to be at least the rate of inflation. In Colorado, school districts may receive state funding to pay for specific “categorical” programs designed to serve particular groups of students or particular student needs.
TABOR refunds. Money must be set aside to refund money in excess of the TABOR limit.
Old Age Pension (OAP). The OAP was established in the constitution by voters in 1936 and amended in 1956.21 The fund was established to provide minimum assistance for needy Colorado residents 60 years of age or older. The program is funded with continuously appropriated revenue from the state sales tax (General Fund revenue), and is expected to require $112.2 million in FY 2016-17 to fulfill its obligations.22
Senior homestead and veteran property tax exemptions.23 Voters approved adding the senior homestead exemption and the veteran’s property tax exemption to the state constitution in 2000 and 2006, respectively.24 The senior homestead property tax exemption is available to taxpayers in Colorado over the age of 65 who have owned and lived in their current residence for 10 years immediately preceding the tax year in which a claim is made. Veterans must be rated permanently disabled by the U.S. Department of Veterans Affairs or qualify for a permanent 100 percent military medical retirement and must have owned and occupied the property as their primary residence on January 1st of the year in which they are applying for the exemption.
The state reimburses local governments for the amount of the benefit granted to the homeowner with General Fund moneys. In FY 2015-16, reimbursements totaled $127.1 million, of which $124.5 million was for the senior homestead exemption. The constitution authorizes the General Assembly to adjust the $200,000 threshold for the market value of a home eligible for the exemption. To address budget shortfalls, the General Assembly reduced the benefit of the senior exemption to zero in tax years 2003, 2004, 2005, 2009, 2010, and 2011, rendering them unavailable. The disabled veteran exemption has not been reduced since its establishment in tax year 2007.
Maintenance of effort requirements for federal programs. The following federal public
health and human services programs have maintenance of effort (MOE) spending requirements:
the federal Supplemental Security Income (SSI) program;
20
For more information, please see the Legislative Council Staff memorandum titled “School Finance and the State Constitution,” December 2016. 21
Colo. Const. Art. XXIV, § 2. 22
September 2016 Legislative Council Staff forecast, page 10. 23
For more information, please see the Legislative Council Staff memorandum titled “History of the Senior Property Tax Exemption”, November 9, 2016. 24
Colo. Const. Art. X, § 3.5 and Section 39-3-201, C.R.S.
Understanding the State Budget: The Big Picture 20
the federal Temporary Assistance to Needy Families (TANF) program;
services for people with developmental disabilities, Part C, Early Intervention and Case Management Program;
the Substance Abuse Prevention and Treatment Block Grant Program; and
the Mental Health Block Grant Program.
While most of the programs are not required to be operated, a significant portion of each program’s cost is paid by the federal government if MOE requirements are met. In some cases, the MOE requirement must be met in another program area in order to receive federal funds. For example, there is no federal requirement to operate the state’s Medicaid program, but the federal government pays approximately 51 percent of its cost as long as the state meets its MOE requirements for the federal SSI program.
The state may request a MOE waiver for “extraordinary economic conditions,” defined as a
financial crisis in which the total tax revenues declined at least 1.5 percent, and either the unemployment rate increases by at least 1 percentage point, or employment declines by at least 1.5 percent.
In addition, there are two principal human services-related programs required by the federal
government for which some state contribution is also required. These include the Child Support Program (for which 66 percent is paid with federal funds and the rest is comprised of state funds) and the Older American Act programs, which require a 15 percent match for program services and a 25 percent match for administration.
General Fund infrastructure transfers (Senate Bill 09-228). Senate Bill 09-228 requires a five-year block of infrastructure transfers as soon as the U.S. Bureau of Economic Analysis reports that Colorado personal income increased by at least 6.0 percent during any calendar year following the Great Recession. This occurred for 2014, triggering the first year of the five-year block of infrastructure transfers. House Bill 16-1416 fixed Senate Bill 09-228 transfers in FY 2015-16 and FY 2016-17 to set amounts: the Highway Users Tax Fund received $199.2 million in FY 2015-16 and will receive $158.0 million in FY 2016-17; while the Capital Construction Fund received $49.8 million in FY 2015-16 and will receive $52.7 million in FY 2016-17.25 In FY 2017-18 through FY 2019-20, Senate Bill 09-228 transfers are variable, depending on the amount of money the state collects in excess of the TABOR revenue limit. The bill requires transfers equal to 1.0 percent and 2.0 percent of General Fund revenue to the Capital Construction Fund and the Highway Users Tax Fund, respectively. However, if during any particular year the state incurs a large enough TABOR surplus, these transfers will either be cut in half or eliminated for that year. The transfers are cut in half if the TABOR surplus during that year is between 1.0 percent and 3.0 percent of General Fund revenue, and eliminated if the surplus exceeds 3.0 percent of General Fund revenue.26 Limit on General Fund Operating Appropriations. State law limits total General Fund operating appropriations to an amount equal to 5 percent of Colorado personal income plus
25
Because they are not appropriations, the FY 2016-17 transfers are excluded from Figure 12 on page 17. 26
For more information, please see Legislative Council Staff Issue Brief Number 16-09 “Statutory Transfers to Fund
Transportation and Capital Construction”, August 2016. New estimates for transfers are published each quarter in the General Fund Budget Overview chapter of the Legislative Council Staff revenue forecast.
Understanding the State Budget: The Big Picture 21
appropriations for property tax reappraisals.27 In FY 2016-17, that amount is equal to $13.1 billion, or more than $3 billion above actual operating appropriations. Constitutional Cash Fund Spending Mandates
The Colorado Constitution mandates how marijuana, tobacco, gaming, lottery, and
transportation revenue may be spent. Each mandate is discussed more fully below.
Marijuana revenue. When voters approved retail marijuana legalization with Amendment 64 in 2012, they dedicated the first $40 million in excise tax revenue to school construction in the state constitution. To facilitate this, the General Assembly referred Proposition AA to the voters in 2013, asking voters to approve a 10 percent special sales tax and a 15 percent excise tax on retail marijuana.
Proposition AA, which amends state statute, conformed with this constitutional requirement
by allocating the first $40 million collected each year from the excise tax to the Building Excellent Schools Today (BEST) fund. The BEST fund is used to provide grants to school districts to repair or replace deteriorating public schools. The program prioritizes funding based on issues such as asbestos removal, building code violations, overcrowding, and poor indoor air quality. BEST grants are awarded annually on a competitive basis.
Each year, any excise tax revenue in excess of $40 million is deposited into the Public
School Fund. Proposition AA distributes 85 percent of the revenue from the special sales tax to the Marijuana Tax Cash Fund and 15 percent to local governments. Revenue collected from the special sales and excise taxes is exempt from TABOR. Because retail marijuana is a tangible good, Colorado also collects the regular 2.9 percent sales tax on the sale of retail and medical marijuana; this revenue is deposited into the Marijuana Tax Cash Fund and is subject to TABOR.28
Tobacco revenue. Approved by voters in 2004, Amendment 35 increased the tax collected
on cigarette and tobacco products to fund an expansion of health care services and tobacco education and cessation programs.29 The tax revenue collected under Amendment 35 is exempt from the constitutional revenue limit. In FY 2014-15, the state collected $142.2 million in Amendment 35 taxes. The constitution requires this revenue to be allocated as follows:
46 percent to increase enrollment of children, pregnant women, and parents in the Children’s Basic Health Plan (CHP+) and Medicaid;
19 percent to fund comprehensive primary care through community health centers or providers serving uninsured and indigent populations;
16 percent to fund school and community-based tobacco education programs;
16 percent for the prevention, early detection, and treatment of cancer and cardiovascular and pulmonary diseases; and
3 percent for health-related purposes funded from the General Fund, the Old Age Pension Fund, or local governments.
27
Section 24-75-201.1 (1)(a)(II.5), C.R.S. 28
For more information, please see Legislative Council Staff Issue Brief Number 16-04, Distribution of Marijuana Tax Revenue, July 2016. 29
For more information, please see Legislative Council Staff Issue Brief Number 16-03, Use of State Tobacco Revenue, April 2016.
Understanding the State Budget: The Big Picture 22
However, if the General Assembly declares a state fiscal emergency, tobacco tax moneys collected under Amendment 35 may be used for any health-related purpose for up to one fiscal year. Between FY 2009-10 and FY 2011-12, additional moneys were transferred from the Department of Public Health and Environment to the Department of Health Care Policy and Financing (HCPF) to provide funding for Medicaid in the context of General Fund shortfalls following the Great Recession. As a result, HCPF's share of Amendment 35 moneys increased from approximately 67 percent in FY 2009-10 to 84 percent in FY 2010-11 and 89 percent in FY 2011-12. Funding ratios have since been restored to prior levels.
The state also collects a statutory tax on cigarette and tobacco products, the revenue from
which is subject to the TABOR limit and is deposited into the General Fund.
Gaming revenue. In 1990, Colorado voters approved a constitutional amendment authorizing limited casino gaming in Central City, Black Hawk, and Cripple Creek.30 In 2008, voters approved Amendment 50, which expanded casino gaming by increasing betting limits, expanding casino operating hours, and adding new games. The Limited Gaming Control Commission is a five-member regulatory body appointed by the Governor to promulgate rules and regulations governing gaming in Colorado. The commission is also required to establish gaming tax rates and adjust tax rates on an annual basis. However, Amendment 50 requires statewide voter approval for any increases in gaming tax rates above July 1, 2008, levels.
Colorado’s gaming tax generated $110.1 million in FY 2014-15, of which $12.0 million is
statutorily attributable to Amendment 50. Gaming tax revenue is held in the Limited Gaming Fund and, after administrative expenses, is distributed through a constitutional and statutory formula. Distributions are divided between what are referred to as "Pre-Amendment 50" and "Amendment 50" distributions. Half of Pre-Amendment 50 moneys is required under the constitution to be distributed to the State Historical Fund (28 percent) and gaming cities (10 percent) and counties (12 percent). The other half of Pre-Amendment 50 moneys is allocated according to a statutory formula to the General Fund and various economic development programs. After administrative expenses, Amendment 50 moneys are required by the constitution to be allocated to community colleges (78 percent) and gaming cities and counties (22 percent).
Lottery revenue. In 1980, Colorado voters amended the constitution to allow the General Assembly to create a state-supervised lottery, which was implemented in 1983. Since its inception, the lottery has expanded to include electronic lottery games and multi-state games such as Powerball. Prior to 1992, when Colorado voters approved a constitutional amendment creating Great Outdoors Colorado (GOCO), proceeds were primarily allocated to capital construction.31 The constitution requires that all net proceeds from lottery games in Colorado be distributed as follows:
10 percent to the Colorado Division of Parks and Wildlife;
40 percent to the Conservation Trust Fund; and
50 percent to the Great Outdoors Colorado (GOCO) Trust Fund.
30
Colo. Const. Art. XVIII, § 9. 31
Colo. Const. Art. XXVII, § 3.
Understanding the State Budget: The Big Picture 23
The constitution limits the amount of annual revenue to the GOCO fund at $35 million in 1992 dollars, adjusted for inflation. The limit for FY 2014-15 was $62.0 million. Any amount above this limit (known as the “GOCO spillover”) is distributed into the Public School Capital Construction Assistance fund. This spillover was $2.0 million for FY 2014-15.32 These funds are controlled by the General Assembly and are currently used to promote health and safety in public schools.33
Transportation revenue. Colorado’s constitution requires that transportation-related
revenues be spent on transportation-related purposes. Specifically, motor vehicle license and registration fees and excise (fuel) tax revenue must be spent on the construction, maintenance, and supervision of public highways.34 These revenues are allocated to the Highway Users Tax Fund (HUTF), from which statutory distributions are made to the State Highway Fund and local governments. A total of $1.0 billion was collected in the HUTF during FY 2014-15.35 ____________________________________________________________________________ Legislative Staff Contacts John Ziegler, Director Joint Budget Committee Staff [email protected] 303-866-4956 Natalie Mullis, Chief Economist Legislative Council Staff [email protected] 303-866-4778 Gregg Fraser, Managing Senior Attorney Office of Legislative Legal Services [email protected] 303-866-4325
32
This provision was added by voters through Referendum E in November 2000. 33
For more information, please see Office of Legislative Legal Services Law Summary “Distribution of Colorado Lottery Proceeds.” 34
Colo. Const. Art. X, § 18. 35
For more information, please see Colorado Legislative Staff interested persons memorandum “Colorado Transportation Finance”, November, 2016