Gymnasium N23, Krasnodar, Russia Teacher: Helen Savitskaya Pupil: Yevgeniy Sorokin.

Marc J. de Vries, Hanno van Keulen, Sylvia Peters and Juliette Walma van der Molen (eds.), Professional development for primary teachers in science and technology.
The Dutch VTB-Pro project in an international perspective
© 2011 Sense Publishers. All rights reserved.
CHARLOTTE VAN CLEYNENBREUGEL, VEERLE DE WINTER, EVELIEN
BUYSE, & FERRE LAEVERS
UNDERSTANDING THE PHYSICAL WORLD:
TEACHER AND PUPIL ATTITUDES TOWARDS
SCIENCE AND TECHNOLOGY
AN INTERVENTION STUDY IN PRIMARY EDUCATION
INTRODUCTION
In this study, an intervention was set up aimed at improving both teachers’
attitudes and competences in relation to science and technology, and teaching these
subjects. The present report focuses specifically on teacher attitudes and how these
evolve throughout the school year. A pre- and posttest design was used to evaluate
teacher attitudes in relation to science and technology (and teaching these subjects)
before and after the intervention trajectory. Additionally, children’s attitudes were
investigated to explore the relations between teachers’ attitudes (and how these
evolve) on the one hand, and (changes in) their pupils’ attitudes on the other. At
last, we explored the intervention inputs for critical tools/aids to change attitudes.
Trying to foster positive attitudes towards science and technology is a worthy goal
in itself. Moreover, a positive attitude towards a certain topic is considered a
necessary condition for the development of a broad and in-depth understanding of
that topic in several areas (e.g., Cheung, 2009; Ho & Kuo, 2010; Ogbuehi &
Fraser, 2007). More positive attitudes towards science and technology may
concord with higher involvement in and deeper understanding of the physical
world (Laevers, 1993; Laevers, 1998; Walma van der Molen, 2007).
In international literature, attitudes have consistently been described as
multidimensional constructs, consisting of a cognitive, affective, and behavioural
dimension. The cognitive dimension refers to perceptions and views, the affective
component covers feelings with regard to a certain topic and the behavioural
dimension captures the intentions to undertake actions in a particular field (e.g.,
Ajzen, 2005; Vazquez-Alonso, Manassero-Mas, & Acevedo-Diaz, 2006; Walma
van der Molen, de Lange, & Kok 2009). In relation to education, teachers’ feelings
of self-efficacy have often been described as an important additional dimension of
teachers’ attitudes. Teachers’ feelings of self-efficacy have been shown to be
powerful predictors of positive teaching behaviour in the classroom, and are
therefore also linked with pupil outcomes, such as achievement and motivation
(e.g., Pajares, 1996; Tschannen-Moran, Woolfolk Hoy, & Hoy, 1998). It may not
surprise that positive attitudes in teachers towards specific teaching practices to
address certain topics can also be considered important antecedents of their actual
teaching behaviour and related pupil outcomes. Although Shrigley and Johnson

CHARLOTTE VAN CLEYNENBREUGEL, VEERLE DE WINTER, EVELIEN BUYSE, & FERRE
LAEVERS
2
already acknowledged this in 1974, attitudes towards teaching have not often been
included in research. Chen (2006), for example, stated that “although teachers’
positive attitudes towards teaching are essential for instruction to succeed, a related
attitude survey is not available in the literature” (p. 804). With regard to
technological and scientific topics in primary classes in particular, recent efforts
have been made to stress the importance of positive attitudes towards active
teaching strategies to address these topics. Active strategies focus heavily on the
development of pupils’ understanding of science and technology in ‘co-
construction’. Children are thought to learn the most about technological and
scientific issues by designing and actively inquiring things together in class. The
active strategies encompass four pedagogical strategies with a positive effect on
learning: collaborative, contextual, reflective and project-based learning (Sidawi,
2009). The teachers’ role can then be defined as one of guiding and supporting
pupils’ learning processes (Kemmers, Klein Tank, & Van Graft, 2007). According
to Jalil, Sbeih, Boujettif and Barakat (2009), teachers who act as a coach with
minimal interference and who offer children autonomy in their knowledge
building, cause a significant positive attitude shift on pupil level. These teaching
strategies also have a positive impact on pupils’ motivation (Barak & Zadok,
2009). The strategies create opportunities for creative thinking and offer pupils the
possibility to obtain a better self-image and view glimpses of their potential
(Lewis, 2009). The active teaching strategies considered in this study, are
intertwined, but address different underlying questions. In ‘learning by design’ a
solution for a technical problem is searched; in ‘inquiry-based learning’ a broad
and in-depth understanding of science topics is at the centre of attention (Van Graft
& Kemmers, 2007).
Positive attitudes towards a certain topic and related teacher practices have been
found to foster more positive attitudes in children as well (e.g., Abulude, 2009;
Jarvis, 2006; Pell and Jarvis, 2003). Based on these findings, we hypothesise more
positive (changes in) teacher attitudes to foster (positive changes in) pupil attitudes
in the field of science and technology in particular. Therefore, in the present study,
we also examined the relation between teacher and pupil attitudes in these fields.
In the study, an intervention trajectory was set up to promote teachers’ attitudes
and competences in relation to the domain of science and technology. The ‘teacher
profile’, that served as a basis for the interventions, contains five dimensions: (1)
openness to and interest in science and technology (attitude); (2) intuitive
understanding of physical phenomena (competence); (3) the capacity to extract
knowledge from experience (conceptualisation); (4) the ability to create learning
environments where children engage in intense mental activity (didactics
enhancing involvement); and (5) the competence to identify the cognitive load of
activities, i.e. the developmental domains triggered in pupils through the activity
and the mental operations that can be challenged by the activity (critical view on
content and material). While teachers implement a module on science and
technology in their class during the school year, they are exposed to four specific

TEACHER AND PUPIL ATTITUDES TOWARDS SCIENCE AND TECHNOLOGY
3
intervention inputs. These were designed to support development in the five above-
mentioned dimensions and respond to the experiential view on learning and
development (Laevers, 1993; 1998).
A first input consisted of a half day workshop titled ‘The Eye and the Fire’
(introduction session). In the first part, the teachers responded to pictures (taken in
outside areas) which made them aware of the paramount presence of physical
phenomena and technological applications. Developing ‘an eye’ for these
phenomena can be regarded as one of the main objectives in the domain of science
and technology. A broadened view on science and technology gives teachers the
opportunity to facilitate transfer between daily life experiences and science and
technology activities. This awareness increases teachers’ observational skills: it
will be easier for them to recognise and appreciate children’s talents in the science
and technology domain. The second part of the workshop offered a framework in
which children’s level of involvement is presented as an indicator for the power of
learning environments. Here, the active ingredients of an approach that elicits
interest and fascination in children are considered. Particular attention is paid to the
‘open framework model’ (Laevers, 2006a) in which both children and teacher take
initiative in co-construction of learning. As highlighted above, co-construction is
also a key concept in inquiry-based learning and learning by design.
Secondly, a visit to a Science Centre was organised, where an interactive
trajectory consisting of ten selected exhibits was laid out for the teachers
(interactive visit science centre). With the support of key questions, in groups of
four, the teachers concentrated on the perceptions, thoughts and questions that
arose while they were experimenting with the materials. They were also invited to
formulate a ‘thoughtful’ explanation of the phenomena. This exercise does not only
help teachers be receptive to the technological and scientific dimensions in their
environment (develop ‘The Eye’) but also helps them identify mental processes
within themselves and articulate these in a dialogue with others. This way, they
encounter their own limitations in knowledge and insights and try to overcome
these with the help of their colleagues. They are put in the position of the learner
and therefore experience for themselves how an environment can affect a person’s
interest and cognition.
A third input consisted of a training session containing an in-depth analysis of
video recordings of children dealing with science and technology activities. These
were developed by the Dutch project TalentenKracht [Curious Minds]i (in-depth
session Curious Minds). The guide to view the clips is based on the PaLe (Laevers,
2006b), a tool designed to make a process-oriented analysis of learning
environments. Here, well-being, involvement and mental activity are at the centre
of attention. Furthermore, the activity is held against several developmental
domains to identify the cognitive load, i.e. the domains that are mobilised during
the viewed episodes. These domains are not limited to an understanding of the
physical world, but may also, for example, refer to social competence, or meta-
competences such as entrepreneurship or creativity. Finally, the context factors to
enhance involvement in the observed situation are explored, including adult style
dimensions (sensitivity, support of autonomy, stimulation), the richness of the

CHARLOTTE VAN CLEYNENBREUGEL, VEERLE DE WINTER, EVELIEN BUYSE, & FERRE
LAEVERS
4
materials at hand, and which specific layers of understanding of the physical world
are inherent to the material and can hence be triggered by interaction with it.
A fourth intervention consisted of a coaching session, grafted on the science and
technology projects in which teachers were already engaged. Reflections in groups
started with a specific practice example teachers were proud of, thereby inspiring
colleagues and creating a more positive self-concept. Starting from these strong
points, weaker points and personal obstructions were explored, followed by an
attempt to overcome these in co-construction with teachers who encountered the
same challenges.
A closer analysis of the interventions allows to identify which dimensions of
teachers’ attitudes are likely to be addressed. In general, there is a particular focus
on the behavioural dimension (supporting change at the level of planning actions),
the affective dimension (enjoying the experimentation and exploration of the
physical reality) and the cognitive dimension (offering teachers a view on science
and technology that is more linked to daily life experiences, which makes science
and technology less difficult and more compelling. Furthermore, feelings of self-
efficacy may be mobilised (the feeling to be able to successfully engage in teaching
science and technology). Finally, rooted in Experiential Education, the intervention
inputs emphasise the importance of a rich learning environment, where activities
evolve in interaction or co-construction with the children (Laevers, 2006a). This
may lead to more positive teacher attitudes towards learning, also by design and
inquiry-based learning, which both adhere to the same essential learning principles.
In sum, four research goals are addressed. Firstly, we evaluated the impact of the
intervention on change in teacher and pupil attitudes. Secondly, we investigated the
change in attitude scores over the school year for teachers who followed the
intervention trajectory, compared to control teachers. We hypothesised a larger
growth in every dimension of the attitudes towards science and technology for the
teachers who followed the intervention trajectory, as compared to the control
group. Thirdly, we evaluated the impact of changes in teacher attitudes (for the
teachers who followed the intervention trajectory) on pupil attitudes towards
science and technology. We expected a positive change in teacher attitudes
resulting in a positive change in their pupils’ attitudes as well. Fourthly, we made
an exploratory analysis in order to find out which ‘tools/aids’ offered by the
intervention inputs can cause a growth in teacher attitudes. Therefore, at the end of
each input, teachers were asked to indicate what they had learned and to rate their
level of involvement during each session.
METHOD
Participants
The study involved schools from Flanders (Belgium) and the Netherlands. In a first
stage, teachers were recruited to participate in the intervention, making them part of

TEACHER AND PUPIL ATTITUDES TOWARDS SCIENCE AND TECHNOLOGY
5
the ‘trajectory group’. In Flanders, these teachers were involved in an on-going
technology project, called ‘Dorp op school’ [‘Village at School’]. Similarly, the
Dutch teachers worked at schools that were engaged in integrating science and
technology more in their programme (so-called ‘VTB schools’). The 39 colleagues
of these (26) teachers, who did not follow the intervention, were assigned to the
‘control group’.
Table 1. Division of participating teachers over Flemish and Dutch schools
# Teachers
Trajectory group Control group
Flemish schools
(n = 9)
15 29
Dutch schools
(n = 6)
11 10
26 39
As presented in Table 1, 44 Flemish teachers participated as opposed to 21 Dutch
teachers. The trajectory group consisted of 58% Flemish teachers, whereas the
proportion of Flemish teachers equalled 74% in the control group. However, these
proportions did not differ significantly (χ2(1) = 1.98, ns). There were no significant
differences detected between the trajectory and control group with regard to other
available background features. Firstly, the proportion of male teachers, equalling
15% and 10% in the trajectory and control group respectively, did not differ
between both groups (χ2(1)= 0.38, ns). Secondly, seniority of the teachers (defined
as a categorical variable with 1 = < 10 years, 2 = 10-15 years, and 3 = > 15 years of
teaching experience respectively) did not differ between both groups (χ2(1) = 1.48,
ns).
For the trajectory teacher group, scores on attitude scales were also available for
the pupils in their class. In total, 489 children completed the questionnaires, of
which 327 were Flemish and 233 were boys. The proportion of boys in Flanders
(46%) and the Netherlands (50%) did not differ significantly (χ2(1) = 0.74, ns).
Procedure
The intervention offered to the teachers of the ‘trajectory group’ consisted of four
inputs, described in the introduction. Each input was concluded with an evaluation
by the teachers (see ‘Instruments’).
During an intake with the participating teachers and their principals, the schools
received the teacher and pupil attitude questionnaires for pretesting. These were
completed by (a) the ‘trajectory teachers’; (b) the ‘control teachers’; and (c) the
pupils of the teachers following the intervention trajectory. The ‘pretest
questionnaires’ were handed back before the first intervention input. All intakes
took place between October 2009 and January 2010. In June 2010, after the final

CHARLOTTE VAN CLEYNENBREUGEL, VEERLE DE WINTER, EVELIEN BUYSE, & FERRE
LAEVERS
6
intervention input, schools received the attitude questionnaires for posttesting,
which were completed by the same three groups as described for the pretest.
Instruments
Teacher attitudes To measure teachers’ attitudes towards science and
technology, we used a Dutch questionnaire, developed by VTB. Previous research
established that this questionnaire is a comprehensive instrument which
operationalises attitude as a set of thoughts, feelings, and behaviours (Walma van
der Molen, 2009). We also included the VTB questionnaire on attitudes for pupils,
because of its similar design. This would enable us to explore the connection
between teacher and pupil attitudes towards science and technology.
The pupil questionnaire consists of scales on two domains, i.e. ‘attitudes
towards technology’ and ‘attitudes towards science’. Two other domains were
added to the teacher questionnaire, referring to their attitudes towards designing
and inquiring as classroom practices to foster learning in the field of science and
technology. More specifically, the scales on ‘attitudes towards learning by design’
and ‘attitudes towards inquiry-based learning’ were selected from the Oberon study
(2009).
Within each domain, a cognitive, affective, and behavioural dimension of
attitudes are distinguished, in accordance with the attitude concept. The cognitive
component is further divided into two subcomponents: the evaluation of the
difficulty and the importance of science and technology (and inquiry-based
learning and learning by design in the teacher form). The affective subscales refer
to the enjoyment teachers and pupils experience in relation to science and
technology (and related practices). The behavioural subscales cover the intentions
to invest time and energy in these topics. In addition, Oberon (2009) defined a fifth
subscale on the teacher questionnaire, self-efficacy, which we also included. Here,
teachers rate how they perceive their ability to act appropriately in a given area.
The respective scales within each domain will be referred to as DIFFICULTY,
IMPORTANCE, ENJOYMENT, INTENTIONS and SELF-EFFICACY.
We checked the quality of the teacher attitude questionnaire, using factorii and
reliability analysis. Based on the findings, we made a few (small) changes in the
composition of the scales. Like Oberon (2009), we omitted the IMPORTANCE and
SELF-EFFICACY scales for attitudes towards science and the DIFFICULTY scale for
attitudes towards inquiry-based learning and learning by design. We also omitted
the DIFFICULTY scale for attitudes towards technology. More details on these
analyses can be found in the Appendix (Table A.1) and in the internal report (De
Winter & Van Cleynenbreugel, 2010).
Each scale of the final teacher questionnaire contains a series of items to be
rated on a five point scale from ‘I completely disagree’ to ‘I completely agree’.
Items formulated in a negative sense were inverted and subsequently, scale scores
were computed by averaging item scores. Higher scores on each scale indicate that
teachers perceive the respective domains (i.e., technology, science, and related

TEACHER AND PUPIL ATTITUDES TOWARDS SCIENCE AND TECHNOLOGY
7
practices) as more difficult (DIFFICULTY scales), more important (IMPORTANCE
scales), and more enjoyable (ENJOYMENT scales); that they intend to invest more
time and energy in the domain (INTENTIONS scales); and that they have more
confidence in their own capacities (SELF-EFFICACY scales).
Correlations between the different attitude scales for the four domains were
calculated and reported in the internal report (De Winter & Van Cleynenbreugel,
2010) and in the Appendix (Tables A.2, A.3 and A.4). Furthermore, the pretest did
not show any differences in attitude scores between countries. At the end of the
school year, 2 out of the 15 attitude scales showed a significant difference, i.e. with
regard to IMPORTANCE, learning by design (t(22) = 2.17, p < .05) and ENJOYMENT,
inquiry-based learning (t(13.07) = 3.19, p < .01). More specifically, Flemish
teachers describe learning by design as significantly more important than their
Dutch counterpartsiii. Furthermore, Flemish teachers report significantly more
enjoyment in inquiry-based learning than Dutch teachersiv. Although no significant
differences were detected between seniority groups for any of the posttest attitude
scales, these were found for INTENTIONS, learning by design (F(2,23) = 4.28, p <
.05) and inquiry-based learning (F(2,23) = 4.75, p < .05) on the pretest, with the
youngest group scoring significantly lower than the oldestv, vi.
Pupil attitudes In accordance with the teacher questionnaire, the pupil
questionnaire consists of the DIFFICULTY, IMPORTANCE, ENJOYMENT and
INTENTIONS subscales. The GENDER differences subscales were added for attitudes
towards science and technology because perception of gender differences, i.e. the
idea that boys are better in technology and/or science, is considered an additional
element of the cognitive aspect of attitudes (Walma van der Molen, 2009). Similar
to the analyses of the teacher questionnaire, a factorvii and reliability analysis was
performed on the pupil questionnaire. All the original scales were included, except
for the science DIFFICULTY scale. More details on these analyses can be found in
the Appendix (Table A.5) and the internal report (De Winter & Van
Cleynenbreugel, 2010).
Each scale of the final pupil questionnaire contains a series of items to be rated
on a four point scale from ‘I completely disagree’ to ‘I completely agree’. Items
formulated in a negative sense were inverted and subsequently, scale scores were
computed by averaging item scores. Higher scores for the DIFFICULTY,
IMPORTANCE, ENJOYMENT and INTENTIONS scales must be interpreted similarly as
explained for the teacher questionnaire. Additionally, higher scores on GENDER
reflect pupils’ beliefs that boys are better in technology and/or science than girls.
Correlations between the different attitude scales in science and technology
were calculated and reported in the internal report (De Winter & Van
Cleynenbreugel, 2010) and the Appendix (Table A.6). Moreover, the pretest score
of Flemish pupils was significantly higher than the ENJOYMENT and INTENTIONS
score for science and technology of the Dutch pupils. However, Flemish pupils
perceive technology as significantly more difficult than their Dutch counterparts.
On the posttest, all significant differences between the two countries disappear,
except for ENJOYMENT and INTENTIONS for science. As on the pretest, both mean

CHARLOTTE VAN CLEYNENBREUGEL, VEERLE DE WINTER, EVELIEN BUYSE, & FERRE
LAEVERS
8
attitude scores are significantly higher in Flanders. Detailed information on these
group differences can be found in the Appendix (Table A.7). Both on pre- and
posttest, pupil gender has a meaningful influence on their attitudes. All differences
are significant (see Table A.8 in Appendix for more details), except for the scores
on IMPORTANCE of technology in the pretest. Boys enjoy both science and
technology more, they find it easier and generally more important, and they are
more interested in learning more about it than girls. Furthermore, boys perceive
themselves as better at both domains, while girls do not report these gender
differences.
Input evaluation At the end of each intervention input, all participants were
asked to rate their involvement during the session on a five point scale. Score 1
means “I was bored, I only stayed because I had to” and score 5 means “I was
interested almost constantly. I felt seriously involved, challenged to think about it
and/or engage myself to work with it”. The participants were also asked to report in
an open form what they had gained from the sessions for their personal
development and/or what they could transfer to their classroom practices.
Data-analysis
To evaluate change in teacher and pupil attitudes after the intervention (first
research goal), pre- and posttest scores of trajectory teachers and their pupils were
compared by means of paired samples t-tests. For comparison, similar tests were
performed on the scores of control group teachers. While we expected these t-tests
to indicate significantly positiveviii changes in attitude scores for trajectory teachers
and pupils, we did not expect this for the control teachers. In order to obtain a
straightforward comparison between trajectory and control teachers (second
research goal) posttest attitude scores were predicted by the variable ‘belonging to
the trajectory vs. control group’ (with 0 = control teacher and 1 = trajectory
teacher), controlling for pretest scores. As we expected the intervention to have a
beneficial effect on teacher attitudes, we hypothesised the regression coefficient of
the dummy coded predictor to be positively significant for each outcome (except
for DIFFICULTY).
Thirdly, multilevel analyses were performed to predict (changes in) pupil
attitudes by means of changes in teacher attitudes. Preliminary, the variance in
pupil attitude scores was partitioned into a component at both class and pupil level.
Class level variables (i.e. teacher attitude scores) were only added as potential
predictors (Hox, 2002; Snijders & Bosker, 1999) for outcomes where a significant
amount of variance was situated on class level.
Finally, the hypothesised influence of the intervention inputs on attitude change
was explored through the evaluating information gathered after each input (fourth
research goal). On the one hand, regression analyses were performed to predict the
posttest attitude scores based on the involvement scores related to each input,
controlling for pretest attitude scores. On the other hand, the qualitative

TEACHER AND PUPIL ATTITUDES TOWARDS SCIENCE AND TECHNOLOGY
9
information obtained from the teachers with regard to their learning gains on a
personal and professional level, was clustered and summarised.
RESULTS
Changes in Teacher and Pupil Attitudes over the School Year
For the ‘trajectory teachers’, the means, standard deviations, and ranges of attitude
scores concerning technology, science, and related practices are presented in Table
2, for the pre- as well as posttest scoresix.
Table 2. Paired samples t-tests for mean differences in teacher attitudes for the trajectory
group (n = 24-26)
Posttest scores Pretest scores t-test(a)
M SD Min. Max. M SD Min. Max. df t p
Attitude Technology
Importance 4.37 .35 3.83 5.00 4.28 .35 3.50 4.83 24 1.09 .286
Enjoyment 3.85 .70 2.33 4.83 3.60 .84 1.67 4.83 24 1.89 .071
Intentions 3.86 .45 3.00 4.75 3.69 .52 2.75 5.00 25 2.41* .024
Self-efficacy 3.33 .65 1.71 4.29 3.17 .74 1.57 4.86 23 1.73 .097
Attitude Science
Difficulty 3.25 .74 1.50 4.00 3.56 .68 1.50 5.00 25 -2.96** .007
Enjoyment 3.76 .54 2.50 4.50 3.68 .55 2.75 5.00 24 0.56 .578
Intentions 3.47 .66 2.00 4.50 3.34 .73 2.00 5.00 25 1.33 .195
Attitude Learning by design
Importance 4.18 .47 3.00 5.00 4.03 .41 3.00 5.00 23 0.76 .454
Enjoyment 4.19 .41 3.50 5.00 3.96 .34 3.00 5.00 23 2.04 .053
Intentions 3.99 .44 3.00 4.67 3.96 .34 3.00 5.00 23 0.29 .775
Self-efficacy 3.35 .59 2.33 4.33 3.14 .66 2.00 4.67 23 1.46 .158
Attitude Inquiry-based learning
Importance 4.22 .45 3.25 5.00 4.10 .37 3.25 4.75 22 1.05 .307
Enjoyment 4.22 .45 3.67 5.00 3.96 .36 3.33 5.00 22 2.49* .021
Intentions 4.02 .50 3.00 5.00 4.06 .48 3.00 5.00 23 -0.33 .747
Self-efficacy 3.43 .48 2.00 4.33 3.23 .56 2.33 4.67 22 1.27 .217
*p < .05. **p < .01. (a) two-tailed paired samples t-tests for mean differences.
Table 2 further reveals that the posttest scores for the ‘trajectory teachers’ are
beneficially higherx than the pretest scores on all comparable scales, with one
exception (i.e. slightly reduced intentions to include more inquiry-based learning in
their school practices). Paired samples t-tests for mean differences revealed that
three of these changes in mean attitude scores over the year reached significance.
In more detail, we found that after the intervention trajectory teachers significantly
(a) intend to learn more about technology; (b) perceive science as less difficult; and
(c) find inquiry-based learning more pleasant, as compared to the pretest measure.

CHARLOTTE VAN CLEYNENBREUGEL, VEERLE DE WINTER, EVELIEN BUYSE, & FERRE
LAEVERS
10
Additionally, three mean differences are borderline significant, indicating that after
the intervention, teachers also tend to (a) enjoy technology more; (b) enjoy learning
by design more; and (c) feel more self-efficient in the technology domain.
For the pupils, the means, standard deviations, and ranges of attitude scores
concerning science and technology are presented in Table 3, for the pre- as well as
the posttestxi.
Table 3. Paired samples t-tests for mean differences concerning pupil attitudes
(n = 478 – 485)
Posttest scores Pretest scores t-test(a)
M SD Min. Max. M SD Min. Max. df t p
Attitude Technology
Difficulty 1.99 .66 1.00 4.00 2.07 .66 1.00 4.00 483 -2.75* .006
Importance 2.84 .50 1.14 4.00 2.90 .46 1.43 4.00 484 -2.80* .005
Gender 2.12 .94 1.00 4.00 2.23 .91 1.00 4.00 484 -2.83* .005
Enjoyment 3.15 .64 1.00 4.00 3.27 .55 1.00 4.00 484 -4.50** .000
Intentions 2.11 .83 1.00 4.00 2.17 .84 1.00 4.00 479 -1.70 .089
Attitude Science
Importance 2.85 .54 1.00 4.00 2.93 .51 1.00 4.00 483 -3.12* .002
Gender 1.80 .89 1.00 4.00 1.86 .92 1.00 4.00 484 -1.85 .065
Enjoyment 3.00 .65 1.00 4.00 3.14 .61 1.00 4.00 483 -4.92** .000
Intentions 1.99 .77 1.00 4.00 2.02 .81 1.00 4.00 477 -0.98 .327
* p < .01. ** p < .001. (a) two-tailed paired samples t-tests for mean differences.
As for the teachers, pre- and posttest attitude scores were also compared with
paired samples t-tests for the pupils in the ‘trajectory classes’ (see Table 3). In
accordance with the expectations, we found a decrease in stereotypical thinking
about gender in technology. Although not significant, a similar result was found for
gender stereotypes in science. Pupils also find technology less difficult at the end
of the school year, compared to the beginning of the year. However, unexpectedly,
we also detected significant decreases in ENJOYMENT and IMPORTANCE of both
science and technology over the course of the school year. Pupils’ intentions
towards science and technology also decreased over the year, but not significantly.
Comparison of Trajectory and Control Group Teachers
Preliminary analysis on pretest scores, comparing the initial attitudes of trajectory
and control group teachers, only revealed significant initial differences in mean
scores for two scales (see Table 4). On average trajectory teachers score higher on
the ENJOYMENT scales for technology as well as learning by designxii. No

TEACHER AND PUPIL ATTITUDES TOWARDS SCIENCE AND TECHNOLOGY
11
significant differences were detected between the control and trajectory teachers
for the other 13 attitude scales.

CHARLOTTE VAN CLEYNENBREUGEL, VEERLE DE WINTER, EVELIEN BUYSE, & FERRE
LAEVERS
12
Table 4. Pretest comparison of mean attitude scores between trajectory and control group
teachers
Control group
(N =38 -39)
Trajectory group
(N = 25-26)
t-test(a)
M SD Min. Max. M SD Min Min. Max. df t p
Attitude Technology
Importance 4.12 .39 3.00 5.00 4.28 .35 3.50 4.83 62 1.71 .092
Enjoyment 3.35 .78 1.83 4.67 3.60 .84 1.67 4.83 63 1.23 .222
Intentions 3.45 .54 2.25 4.75 3.69 .52 2.75 5.00 63 1.82 .074
Self-efficacy 2.91 .64 1.71 4.57 3.17 .74 1.57 4.86 62 1.49 .141
Attitude Science
Difficulty 3.60 .58 2.00 5.00 3.56 .68 1.50 5.00 63 -0.29 .776
Enjoyment 3.40 .51 2.25 4.25 3.68 .55 2.75 5.00 62 2.10* .039
Intention 3.01 .74 1.00 4.50 3.34 .73 2.00 5.00 63 1.74 .087
Attitude Learning by design
Importance 3.91 .32 3.00 4.67 4.03 .41 3.00 5.00 63 1.22 .227
Enjoyment 3.68 .52 2.50 5.00 3.96 .34 3.00 5.00 63 2.63* .011
Intentions 3.89 .47 2.00 5.00 3.96 .34 3.00 5.00 62 0.70 .484
Self-efficacy 3.22 .52 2.33 4.00 3.14 .66 2.00 4.67 62 -0.53 .597
Attitude Inquiry-based learning
Importance 4.03 .30 3.25 4.50 4.10 .37 3.00 5.00 62 0.88 .382
Enjoyment 3.86 .42 2.67 4.67 3.96 .36 3.00 5.00 62 0.94 .351
Intentions 3.96 .45 3.00 5.00 4.06 .48 3.00 5.00 63 0.83 .413
Self-efficacy 3.30 .53 2.00 4.00 3.23 .56 2.00 4.67 62 -0.52 .605
* p < .05. (a) two-tailed, independent samples t-test for mean differences.
Paired sampled t-tests to evaluate changes in attitude scores over the year for the
control group of teachers only revealed a significant change in positive attitudes for
the DIFFICULTY scale of science, indicating that also control group teachers
perceive science as less difficult over the course of one school year (with t(38) =
2.71, p < .05).
However, to obtain a straightforward comparison between trajectory and control
teachers, regression analyses were performed, including type of intervention (i.e.
intervention followed vs. not followed) as well as pretest scores as predictor
variables for posttest scores. Results of the regression analyses, comparing
estimated posttest scores for control and trajectory teachers, are reported in Table
5. Estimated posttest scores are significantly higher for the trajectory teachers than
for the control teachers, for the same five attitude scales where the trajectory
teachers have grown (marginally) significantly over the course of the trajectory
school year. Furthermore, it must be noted that the significant decrease in
perceived difficulty of science over the year, which we detected for both trajectory
and control teachers, does not differ significantly between both groups.

TEACHER AND PUPIL ATTITUDES TOWARDS SCIENCE AND TECHNOLOGY
13
Table 5. Predicting posttest attitude scores by pretest scores and ‘control vs. trajectory
group’ (n = 61-65)
Regression coefficient(a) Estimated posttest score
Mpretest βgroup P Control group Trajectory group
Attitude Technology
Importance 4.18 .19 .078 4.15 4.31
Enjoyment 3.45 .18* .027 3.43 3.70
Intentions 3.55 .23** .008 3.51 3.76
Self-efficacy 3.01 .22* .014 2.99 3.26
Attitude Science
Difficulty 3.58 -.05 .585 3.34 3.27
Enjoyment 3.51 .10 .379 3.54 3.65
Intentions 3.14 .11 .262 3.19 3.35
Attitude Learning by design
Importance 3.96 .21 .095 3.96 4.16
Enjoyment 3.79 .28* .021 3.80 4.11
Intentions 3.92 .17 .153 3.81 3.97
Self-efficacy 3.19 .08 .477 3.26 3.36
Attitude Inquiry-based learning
Importance 4.05 .25 .055 4.01 4.21
Enjoyment 3.90 .26* .035 3.95 4.19
Intentions 4.00 .22 .090 3.78 3.90
Self-efficacy 3.27 .11 .354 3.31 3.43 (a) Regression coefficient of the dummy coded variable, with 0 = control group and 1 =
trajectory group.
Associations Between (Changes in) Teacher and Pupil Attitudes
Table 6 shows the estimation and significance of the class level variance in pupil
attitude scores for pretest, posttest and changes over the school year. Overall,
the proportion of variance on class level for the outcomes as presented in Table 6
ranges between 0% and 13%. Class level features matter the most for gender
stereotypical attitudes (significant class level variances ranging between 9% and
13%).

CHARLOTTE VAN CLEYNENBREUGEL, VEERLE DE WINTER, EVELIEN BUYSE, & FERRE
LAEVERS
14
Table 6. Estimation of class level variance in attitude scores, concerning the pre- and
posttest measurement, and changes over the school year (n = 478-490)
Pretest scores Posttest scores Change scores
B SE p B SE p B SE p
Attitude Technology
Difficulty .03* .02 .033 .00 .00 1.00 .02 .01 .093
Importance .03* .01 .025 .02* .01 .023 .01 .01 .208
Gender .04 .02 .087 .09* .04 .014 .06* .03 .022
Enjoyment .01 .01 .181 .05* .02 .017 .02 .01 .057
Intentions .04* .02 .046 .02 .02 .189 .02 .02 .286
Attitude Science
Importance .01 .01 .113 .02* .01 .040 .01 .01 .588
Gender .08* .03 .016 .10** .04 .008 .05* .02 .018
Enjoyment .02 .01 .060 .04* .02 .026 .02 .01 .079
Intentions .02 .02 .154 .01 .01 .470 .02 .01 .261
*p < .05. **p < .01.
To explain significant class level variances in pupil attitude scores, teacher attitude
scores were added as predictors of pupil scores. More specifically, teacher scales of
technology and learning by design were used as predictors of pupil scores on
attitudes towards technology, and teacher scales of science and inquiry-based
learning as predictors for pupil attitudes towards science. Pretest, posttest, and
change scores of teachers were included as predictors of pretest, posttest, and
change scores of pupils, and were not mixed.
No significant predictors were found concerning pretest scores. With regard to
posttest scores, pupils’ enjoyment of technology can be predicted by the self-
efficacy teachers experience for technology (β = -0.15, p < .01), and for design-
based learning (β = -0.20, p < .001). However, the associations are negative,
indicating that higher feelings of self-efficacy in teachers at the end of the school
year are associated with lower feelings of enjoyment in children with regard to
technology.
The Impact of the Intervention Inputs: An Exploratory Analysis
As shown in Table 7, self-reported mean involvement scores during the inputs
range from 4.13 to 4.61 on a five-point scale. Significant correlations are found
between involvement scores for the introduction session on the one hand, and the
science centre visit and the in-depth session about talents on the other hand. Scores
for the latter also significantly correlate with involvement scores for the coaching
session.
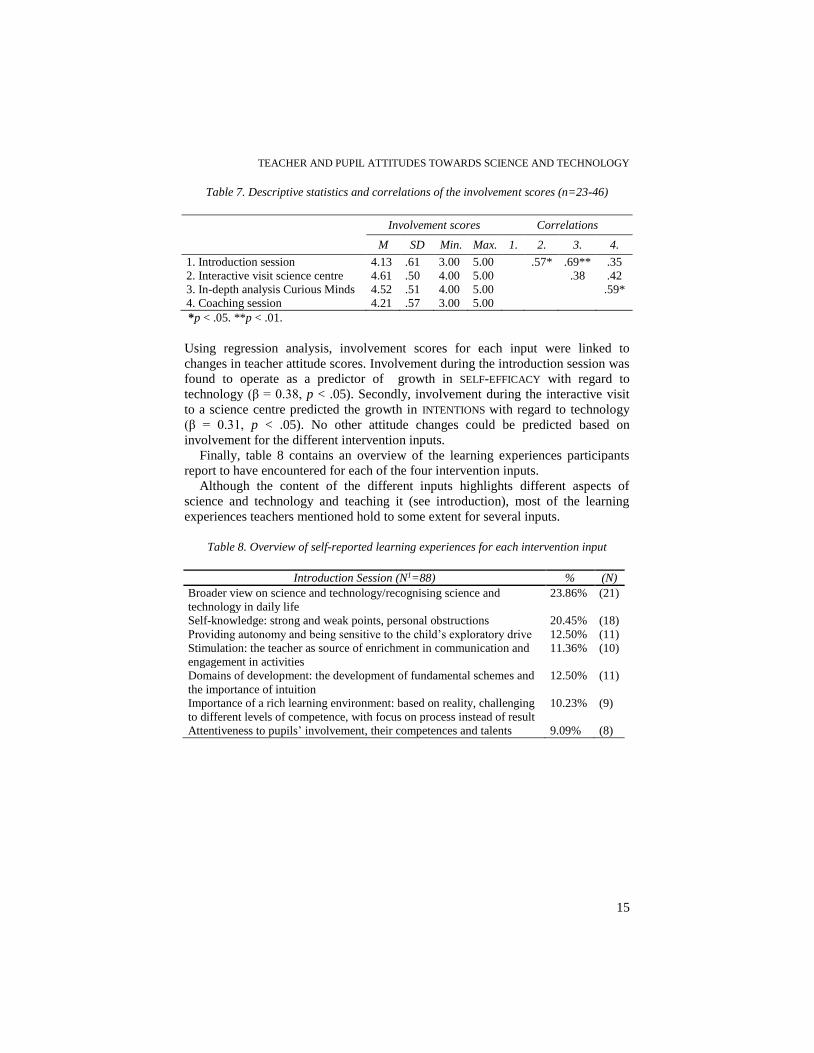
TEACHER AND PUPIL ATTITUDES TOWARDS SCIENCE AND TECHNOLOGY
15
Table 7. Descriptive statistics and correlations of the involvement scores (n=23-46)
Involvement scores Correlations
M SD Min. Max. 1. 2. 3. 4.
1. Introduction session 4.13 .61 3.00 5.00 .57* .69** .35
2. Interactive visit science centre 4.61 .50 4.00 5.00 .38 .42
3. In-depth analysis Curious Minds 4.52 .51 4.00 5.00 .59*
4. Coaching session 4.21 .57 3.00 5.00
*p < .05. **p < .01.
Using regression analysis, involvement scores for each input were linked to
changes in teacher attitude scores. Involvement during the introduction session was
found to operate as a predictor of growth in SELF-EFFICACY with regard to
technology (β = 0.38, p < .05). Secondly, involvement during the interactive visit
to a science centre predicted the growth in INTENTIONS with regard to technology
(β = 0.31, p < .05). No other attitude changes could be predicted based on
involvement for the different intervention inputs.
Finally, table 8 contains an overview of the learning experiences participants
report to have encountered for each of the four intervention inputs.
Although the content of the different inputs highlights different aspects of
science and technology and teaching it (see introduction), most of the learning
experiences teachers mentioned hold to some extent for several inputs.
Table 8. Overview of self-reported learning experiences for each intervention input
Introduction Session (N1=88) % (N)
Broader view on science and technology/recognising science and
technology in daily life
23.86% (21)
Self-knowledge: strong and weak points, personal obstructions 20.45% (18)
Providing autonomy and being sensitive to the child’s exploratory drive 12.50% (11)
Stimulation: the teacher as source of enrichment in communication and
engagement in activities
11.36% (10)
Domains of development: the development of fundamental schemes and
the importance of intuition
12.50% (11)
Importance of a rich learning environment: based on reality, challenging
to different levels of competence, with focus on process instead of result
10.23% (9)
Attentiveness to pupils’ involvement, their competences and talents 9.09% (8)

CHARLOTTE VAN CLEYNENBREUGEL, VEERLE DE WINTER, EVELIEN BUYSE, & FERRE
LAEVERS
16
Table 8 (continuation). Overview of self-reported learning experiences for each intervention
input
Interactive visit science centre (N=101) % (N)
Importance of a rich learning environment: with room for experimenting
(in co-construction), starting from wonderment, with focus on process
instead of result
26.73% (27)
Self-knowledge: strong and weak points, personal obstructions 22.77% (23)
Knowledge about science and technology and inspiration for the
classroom practices
17.82% (18)
Broader view on science and technology/recognizing science and
technology in daily life
12.87% (13)
Enjoyment of science and technology 5.94% (6)
Attentiveness to the nature of cognitive processes mobilised through the
activity
5.94% (6)
Stimulation: the teacher as source of enrichment in communication and
engagement in activities
2.97% (3)
Importance of science and technology for pupils 2.97% (3)
Attentiveness to pupils’ involvement, their competences and talents 1.98% (2)
In-depth session about talents (N=60) % (N)
Providing autonomy and being sensitive to the child’s exploratory drive 30.00% (18)
Stimulation: the teacher as source of enrichment in communication and
engagement in activities
28.33% (17)
Attentiveness to pupils’ involvement, their competences and talents 23.33% (14)
Importance of a rich learning environment: challenging to different levels
of competence, with focus on the process instead of the results
8.33% (5)
Attentiveness to the nature of cognitive processes mobilised through the
activity
6.67% (4)
Broader view on science and technology/recognizing science and
technology in daily life
3.33% (2)
Coaching session (N=54) % (N)
Self-knowledge: strong and weak points, personal obstructions 38.89% (21)
Inspiration for classroom practices 22.22% (12)
Confirmation of self-efficacy 12.96% (7)
Providing autonomy and being sensitive to the child’s exploratory drive 11.11% (6)
Broader view on science and technology recognizing science and
technology in daily life
5.56% (3)
Attentiveness to pupils’ involvement, their competences and talents 5.56% (3)
Attentiveness to the nature of cognitive processes mobilised through the
activity
3.70% (2)
1 Total number of remarks of the participants.
Over the different inputs, teachers’ specific learning experiences can be combined
into three categories. The first category concerns a broader view on science and
technology, which (a) helps teachers recognise science and technology in daily life;
and (b) helps see connections with their own knowledge and image of the physical
world more easily. Related to this, teachers indicate to have learned about how

TEACHER AND PUPIL ATTITUDES TOWARDS SCIENCE AND TECHNOLOGY
17
specific science and technology issues can be translated into classroom practices.
In this regard, they refer to the importance of a rich learning environment, with
room for exploring and experimenting, based on reality. In a second (related)
category, teachers indicate to have learned about specific teacher competences that
are highly relevant in guiding children’s learning processes with regard to science
and technology. Here, providing autonomy and stimulating thoughts,
communication and creativity are specifically stressed. Furthermore, according to
what teachers have learned, attentiveness to pupils’ involvement, competences and
talents is an important teaching skill in this domain. Finally, knowledge of different
developmental domains and the capability to recognise (possible) mental loads in
an activity is considered an important additional competence for teaching science
and technology. In a third category, personal feelings and notions can be grouped
together. Teachers pointed out that they gained better insight into themselves
through the input sessions. They mentioned their strong and weak points and the
personal obstructions they encountered. This was, for example, translated into a
more accurate and overall more positive perception of their self-efficacy. Apart
from the three main content categories teachers mentioned, particularly with regard
to the interactive science centre visit, teachers indicated that they experienced
enjoyment during activities in science and technology domains.
DISCUSSION AND CONCLUSION
The main purpose of this article was to examine the impact of an intervention
trajectory on changes in teacher and pupil attitudes towards science and
technology. Furthermore, we explored whether, and if so, which elements of the
intervention inputs could provide an explanation for these changes.
With regard to the effectiveness of the intervention, our goal to enhance positive
teacher attitudes has especially been reached in relation to the technology domain.
By the end of the year, compared to the beginning, teachers who followed the
intervention (a) intended to learn more about technology; (b) felt more self-
efficient about their capacities in the field, and (c) enjoyed it more. Their attitudes
in these three aspects evolved to a significantly stronger extent than was the case
for the teachers who did not follow the intervention. For two out of these three
effects, self-attributed involvement scores of teachers evaluating the inputs can
offer some insight into the specific active ingredients of the intervention. Firstly,
higher involvement scores for the visit to the science centre predicted a larger
growth in intentions with regard to technology. The interactive visit to a science
centre primarily aimed at allowing the teachers to experience what a wondering
child experiences in relation to science and technology in a rich and open context.
The qualitative analysis on the evaluation sheets showed that teachers especially
reported to have learned from this visit that a rich environment is an important
basis for children to learn about science and technology in co-construction.
Furthermore, confronting teachers with rich environments, i.e., the exhibits at the
centre, offers a lot of inspirational material that teachers can translate into their
classroom practices. For teachers who were more involved during the visit, this

CHARLOTTE VAN CLEYNENBREUGEL, VEERLE DE WINTER, EVELIEN BUYSE, & FERRE
LAEVERS
18
may consequently evoke more intentions to implement more science and
technology activities in their classrooms. Secondly, higher involvement scores
during the introduction session predicted a larger growth in feelings of self-efficacy
with regard to technology. In the introduction session, participants were confronted
with the principles of experiential education and the link to a science and
technology implementation that starts from a rich context and daily life
experiences. Furthermore, teachers receive the message that an intuitive
understanding is very important and that as a teacher, you can make a difference by
stimulating and coaching your pupils, and hence finding a solution in co-
construction with your pupils. This may give teachers more grip on how to conduct
a science or technology activity and may make it more achievable. In accordance
with the aims of the input, many teachers mentioned these items in the evaluation
forms as learning experiences: they gained a broader view on science and
technology and better self-knowledge. Teachers also mentioned the importance of
‘providing autonomy’ and ‘stimulation’ to children. As teachers may experience
these aspects of good teaching behaviour as feasible, the combination of the above
elements may lead to higher estimated feelings of self-efficacy. With regard to the
growth in enjoyment of technology over the year, the involvement during the
inputs does not operate as a significant predictor. However, the enjoyableness of
science and technology is mentioned by six teachers during the visit to a science
centre. Part of the goal of this visit was getting teachers to wonder (again).
Moreover, the possibility to operate in active co-construction with their pupils
during the science and technology module in their classroom, might have given
teachers the chance to become acquainted with a more enjoyable way of working
with science and technology. Additionally, the intervention had similar effects on
teachers’ enjoyment of teaching practices related to science and technology
(learning by design and inquiry-based learning), which are stressed as good
practices in these domains throughout the intervention inputs. Also with regard to
these two attitude scales, teachers who followed the intervention trajectory have
grown significantly more than their control group counterparts.
With respect to pupil scores, attitudes with regard to gender stereotypes and the
perception of difficulty of science and technology improved over the year, whereas
pupil attitudes decreased concerning (a) their perceptions of importance of both
domains; (b) their enjoyment in both domains; and (c) their intentions to invest
more time and effort in these domains. The latter results were unexpected and
deserve future research attention. As there were no data available on pupil attitude
scores in the control group, findings are however hard to interpret. However, the
pupil results suggest that although intervention efforts may aim at improving
teacher attitudes and related teacher practices, this does not necessarily improve
pupil attitudes directly. This idea was also confirmed by the (striking) finding that
more feelings of self-efficacy in teachers (with regard to technology and design-
based learning) are related to less enjoyment of technology by pupils at the end of
the school year. As one possible explanation, it may not be unlikely that through
the intervention, teachers become ‘too’ self-confident and consequently tend to

TEACHER AND PUPIL ATTITUDES TOWARDS SCIENCE AND TECHNOLOGY
19
impose new content on pupils, rather than building knowledge in co-construction
with them. In line with experiential education, this lack of autonomy and self-
initiative for children may result in less enjoyment of tasks related to technology
(Laevers, 2005). Alternatively, as innovation in teacher practices does not go
without adaptation, this may cause some friction and drops in satisfaction and
enjoyment for the pupils confronted with it. Perhaps if the intervention was spread
over a longer period, and/or we conducted a follow-up measure on pupil attitudes,
we might have discovered an increase in enjoyment again. Therefore, finding
significant improvements in positive attitudes over the period of only one year in
pupils, and especially in teachers, holds a strong promise for the future. However,
further (in depth) study is certainly necessary based on the unexpected findings on
pupil attitudes, as additional and/or alternative explanations may be equally
valuable. Perhaps intentions to learn more about science and technology as well as
enjoyment in both domains drop by the end of the school year, because it is
traditionally a period with a lot of testing, close to the holidays, for example.
With respect to gender, it is also interesting to note that gender-stereotypic
beliefs may be determined by class and/or teacher features, as the amount of class
level variance was meaningful. Fairly straightforward, it is possible that equivalent
teacher attitudes about gender stereotypes play a significant role here. This could
however not be evaluated, as this scale was omitted in the version of the teacher
questionnaire we used. Other (possibly related) determinants of the detected
decrease in gender stereotypic beliefs of pupils may lay in the ‘active ingredients’
of the intervention we imposed, such as a focus on hidden talents and intensified
working with science and technology. This offers pupils and teachers a chance to
appreciate the skills of their feminine counterparts, even more when using co-
construction and working in a rich environment that provides many opportunities
to explore and experiment. Further study would be useful to determine tools and
aids to positively affect pupils’ views on gender in relation to science and
technology, as this is a major issue, especially in the Netherlands (Joukes, 2010).
In general, three remarks are at stake. First, comparison of effects between
trajectory group and control group teachers may hold an underestimation of effects,
as the control group teachers belonged to the same schools as the teachers who
followed the intervention. As these teachers shared the same school environment,
this may have led to communication and interaction about the interventions,
restoring an influence on the attitudes of the control teachers as well. However, on
five attitude scales, we still detected a significant difference in growth on attitude
scales in favour of the trajectory group teachers, underscoring the effectiveness of
the intervention. Second, it may not surprise that the intervention seems to have a
more meaningful influence on attitudes towards technology vs. attitudes towards
science. After all, interventions were imbedded in a technology module which was
implemented through the school year. Third, concerning attitudes towards teacher
practices in the field of science and technology, only teachers’ enjoyment was
fostered through the intervention. Yet, as the correlation analysis showed, both for
teachers and pupils, enjoyment of science and technology are associated with all
other attitude scales, except for the gender scales. This may indicate that enjoyment

CHARLOTTE VAN CLEYNENBREUGEL, VEERLE DE WINTER, EVELIEN BUYSE, & FERRE
LAEVERS
20
in science and technology activities hold a key to improve attitudes on both
domains, not only concerning the affective component, but also concerning the
cognitive and behavioural components in an indirect way as well.
Finally, we note that next to the fact that effects on (teacher and especially
pupil) attitudes may be underestimated due to the limited period of active
intervention mentioned above, some other limitations have to be articulated with
regard to the present study. First, the aim of the larger study was broader, and
hence, future analyses including different outcomes, may show a larger impact of
the intervention on the actual competence, behaviour and involvement in science
and technology practices of pupils and/or teachers, compared to the impact on their
attitudes. As gathering all data through questionnaires, interviews, and
observations during the intervention year was very time-consuming, the limited
number of participating teachers in the study has to be acknowledged as a
downside as well. Consequently, if in future studies the statistical power could be
enhanced by enlarging the teacher sample, this may lead to more significant effects
on a broader variety of subscales concerning teacher attitudes. We may expect this,
because the changes in teacher attitude scores after the intervention year, although
not statistically significant for each single outcome, all go in the expected
direction.
NOTES
i http://www.talentenkracht.nl; for English: http://www.talentenkracht.nl/content/files/SITE1765/Brochure_CuriousMinds_eng.pdf
ii We made use of factor analysis with Oblimin rotation, while Oberon used Varimax rotation. iii With mean scores of 4.36 and 3.97 for Flemish and Dutch teachers respectively. iv With mean scores of 4.44 and 3.97 for Flemish and Dutch teachers respectively. v With mean scores for learning by design of 4.12 and 3.71 for the oldest and youngest group of
teachers respectively, and mean scores for inquiry-based learning of 4.27 and 3.69 for the oldest and youngest group of teachers respectively.
vi Due to the small number of male participants, gender differences were not calculated. vii We made use of factor analysis with Oblimin rotation, while Walma van der Molen used Varimax
rotation. viii Except for DIFFICULTY and GENDER, for which scales we expected significantly negative t-values,
because we expected the posttest scores to be lower than the pretest scores on these subscales. ix The reported t-statistics in Table 2 will be discussed later. x Or lower, concerning DIFFICULTY. xi The reported t-statistics in Table 3 will be discussed later. xii With mean scores for technology of 3.68 and 3.40 for the trajectory and control teachers
respectively, and mean scores for learning by design of 3.96 and 3.68 for the trajectory and control teachers respectively.
REFERENCES
Abulude, F. (2009). Students’ attitudes towards chemistry in some selected secondary schools in akure
south local government area, Ondo State. Post graduate thesis, the national teachers institute,
Kaduna, Nigeria. Retrieved from http://www.scribd.com/doc/34545165/students%E2%80%99-attitudes-towards-chemistry-in-some-selected-secondary-schools-in-akure-south-local-government-
area-ondo-state.

TEACHER AND PUPIL ATTITUDES TOWARDS SCIENCE AND TECHNOLOGY
21
Ajzen, I. (2005). Attitudes, personality and behavior. Berkshire, United Kingdom: Open University.
Barak, M. & Zadok, Y. (2009). Robotics projects and learning concepts in science, technology and
problem solving. International Journal of Technology and Design Education, 19(3), 289-307. Chen, S. (2006). Development of an instrument to assess views on nature of science and attitudes
toward teaching science. Science Education, 90, 803-819.
Cheung, D. (2009). Students’ attitudes chemistry lessons: The interaction effect between grade level and gender. Research in Science Education, 39, 75-91.
De Winter, V., & Van Cleynenbreugel, C. (2010). Leerkrachtprofielen en onderwijs in wetenschap en
techniek in het basisonderwijs: Werkzame bestanddelen voor deskundigheidsbevordering en attitudeverandering (VTB-Pro aanvullend onderzoek). [Teacher profiles and education in science
and technology in primary education: Active ingredients to promote professionalism and a positive
change in attitudes (VTB-Pro complementary research).] Internal report (draft), Centre for Experiential Education, Catholic University Leuven, Belgium.
Ho, L., & Kuo, T. (2010). How can one amplify the effect of e-learning? An examination of high-tech
employees’ computer attitude and flow experience. Computers in Human Behavior, 26, 23-31. Hox, J. (2002). Multilevel analysis: Techniques and applications. Mahwah, NJ: Erlbaum.
Jalil, P.A., Sbeih, A.M.Z., Boujettif, M., & Barakat, R. (2009). Autonomy in science education: a
practical approach in attitude shifting towards science learning. Journal of Science Education and Technology, 18(6), 476-486.
Jarvis, T. (2006). Guide for the seed city trainer. Barcelona, Spain: P.A.U. Education.
Joukes, G. (2010). Meiden en wetenschap & techniek: Van tegenpolen tot aantrekkingskracht. [Girls and science & technology: From opposites to attraction.] Maarssen, the Netherlands: Kaldenbach
Grafische Producties.
Kemmers, P., Klein Tank, M., & Van Graft, M. (2007). Onderzoekend en ontwerpend leren bij natuur en techniek: Evalueren van brede ontwikkeling van leerlingen in open onderwijsvormen. [Inquiry-
based learning and learning by design in science and technology: Evaluation of the broad development of pupils in open education forms.] Enschede, the Netherlands: Institute for
Curriculum Development (SLO).
Laevers, F. (1993). Deep level learning: an exemplary application on the area of physical knowledge. European Early Childhood Research Journal, 1, 53-68.
Laevers, F. (1998). Understanding the world of objects and of people: Intuition as the core element of
deep level learning. International Journal of Educational Research, 29, 69-85. Laevers, F. (2005). The curriculum as means to raise the quality of ECE. Implications for policy.
European Early Childhood Education Research Journal, 13, 17-30.
Laevers, F. (2006a). Onderwijs op een nieuwe leest. Een reconstructie van de actuele paradigma-shift. [A new approach for education. A reconstruction of the actual paradigma-shift]. In: F. Laevers, en E.
Bertrands (Eds.), Draagkracht geven. Uitkomst voor de toekomst. (pp.5-24). Leuven: CEGO.
Laevers, F. (2006b). Kijkwijzer voor een Procesgerichte Analyse van Onderwijsleersituaties. [Monitoring system for a process-oriented analysis of learning situations in education]. Leuven:
Centrum voor Ervaringsgericht Onderwijs.
Lewis, T. (2009). Creativity in technology education: providing children with glimpses of their
inventive potential. International Journal of Technology and Design Education, 19(3), 255-268.
Oberon (2009). Een selectie uit de tussenrapportage effectstudie VTB-Pro. Schooljaar 2008/09. [A
selection from the interim rapport effectstudy VTB-Pro. 2008/09]. Utrecht, the Netherlands:
Platform Bèta Techniek.
Ogbuehi, P., & Fraser, B. (2007). Learning environment, attitudes and conceptual development associated with innovative strategies in middle-school mathematics. Learning Environments
Research, 10, 101-114.
Pajares, F. (1996). Self-efficacy beliefs in academic settings. Review of Educational Research, 66, 543-578.
Pell, A., & Jarvis, T. (2003). Developing attitude to science education scales for use with primary teachers. International Journal of Science Education, 25, 1273-1295.
Shrigley, R., & Johnson, T. (1974). The attitude of inservice elementary teachers toward science. School
Science and Mathematics, 74, 437-446. Sidawi, M.M. (2009). Teaching science through designing technology. International Journal of
Technology and Design Education, 19(3), 269-287.

CHARLOTTE VAN CLEYNENBREUGEL, VEERLE DE WINTER, EVELIEN BUYSE, & FERRE
LAEVERS
22
Snijders, T. A. B., & Bosker, R. J. (1999). Multilevel analysis: An introduction to basic and advanced multilevel modeling. London, United Kingdom: Sage.
Tschannen-Moran, M., Woolfolk Hoy, A., & Hoy, W. K. (1998). Teacher efficacy: Its meaning and
measure. Review of Educational Research, 68, 202-248. Van Graft, M., & Kemmers, P. (2007). Onderzoekend en ontwerpend leren bij Natuur en Techniek.
[Inquiry-based learning and learning by design in science and technology]. Den Haag, the
Netherlands: Platform Bèta Techniek. Vazquez-Alonso, A., Manassero-Mas, M. A., & Acevedo-Diaz, J. A. (2006). An analysis of complex
multiple choice science technology items: Methodological development and preliminary results.
Science Education, 90, 681-706.
Walma van der Molen, J. (2007). Eindrapportage VTB attitude monitor. De ontwikkeling van een
attitude-instrument op het gebied van wetenschap en techniek voor leerlingen in het basisonderwijs.
[Final rapport VTB attitude monitor. The development of an attitude instrument on the domain of
science and technology for pupils in primary education.] Den Haag, the Netherlands: Platform Bèta
Techniek.
Walma van der Molen, J. (2009). Wat vinden leraren basisonderwijs van wetenschap en techniek? De
attitudemonitor maakt hun gevoelens, gedachten en gedrag inzichtelijk. [What do teachers in
primary education think about science and technology? The attitude-monitor makes their feelings,
thoughts and behaviour visible.] In H. van Keulen en J. W. van der Molen (Eds.), Onderzoek naar
wetenschap en techniek in het Nederlandse basisonderwijs. (pp. 157-163). Den Haag, the
Netherlands: Platform Bèta Techniek.
Walma van der Molen, J., de Lange, J., & Kok, J. (2009). Theoretische uitgangspunten bij de
professionalisering van leraren basisonderwijs op het gebied van wetenschap en techniek. [Theoretical starting points at the professionalisation of primary education teachers on science and
technology domains.] In H. van Keulen, en J. W. van der Molen (Eds.), Onderzoek naar wetenschap
en techniek in het Nederlandse basisonderwijs. (pp. 29-39). Den Haag, the Netherlands: Platform Bèta Techniek.
AFFILIATIONS
Charlotte Van Cleynenbreugel
Veerle De Winter
Evelien Buyse
Ferre Laevers
Research Centre for Experiential Education
Katholieke Universiteit Leuven

TEACHER AND PUPIL ATTITUDES TOWARDS SCIENCE AND TECHNOLOGY
23
APPENDIX
The appendix contains more detailed information on instruments and statistical
analysis.
Table A.1. Overview of scales, example items and study results concerning the teacher
questionnaire on attitudes towards science, technology, and related practices
Subscales Example item
Oberon study(a) Present study
# items α(b) # items α(b)
Attitude Technology R2 (c) = 59% R2 (c) = 57%
Difficulty The technology course can only
be given by specially trained
teachers.
2 .67 /(d) /
Importance Technology is important for the
community.
7 .75 6(e) .77
Enjoyment I like to repair things myself. 6 .87 6 .89
Intentions I would like to learn more about
technology in primary school.
4 .81 4 .78
Self-efficacy I wonder whether I have the
necessary skills to teach
technology.
5 .78 7(d) .84
Attitude Science R2 (c) = 59% R2 (c) = 57%
Difficulty Science is complicated. 2 .60 2 .67
Importance Researchers do important work. /(f) .46 /(f) .52
Enjoyment I like to invent things. 4 .79 4 .72
Intentions I like to read about new
inventions, for example in the
newspaper or on the Internet.
4 .72 4 .68
Self-efficacy /(g) /(g)
Attitude Learning by design R2 (c) = 55% R2 (c) = 58%
Difficulty It seems difficult to me to apply
learning by design in primary
school.
/(f) (.57) /(f) (.22)
Importance Learning by design in primary
school is necessary to prepare
children for secondary school.
3 .62 3 .71
Enjoyment It appeals to me to let children
solve technical problems.
5 .84 2(h) .70
Intentions I would like to learn more about
how to conduct children with
learning by design.
/(h) / 3(h) .85
Self-efficacy When children can’t figure out a
technical problem, I can help
them.
3 .62 3 .68

CHARLOTTE VAN CLEYNENBREUGEL, VEERLE DE WINTER, EVELIEN BUYSE, & FERRE
LAEVERS
24
Table A.1 (continuation). Overview of scales, example items and study results concerning
the teacher questionnaire on attitudes towards science, technology, and related practices
Subscales Example item
Oberon study(a) Present study
# items α(b) # items α(b)
Attitude Inquiry-based Learning R2 (c) = 60% R2 (c) = 62%
Difficulty It seems difficult to me to apply
inquiry-based learning in primary
school.
/(f) (.55) /(f) (.49)
Importance It is important that even young
children learn how to do research
(at their level).
4 .75 4 .77
Enjoyment It appeals to me to let children
unravel things.
3 .74 3 .75
Intentions I would like to learn more about
inquiry-based learning at primary
school.
3 .78 3 .84
Self-efficacy I know how to motivate pupils
for inquiry-based learning.
3 .60 3 .64
(a) Extracted from the interim report on an effect study VTB-Pro (school year 2008-2009) by
Oberon (2009). (b) Cronbach’s alpha coefficients. (c) Explained variance in attitudes towards technology, science, learning by design, and
inquiry-based learning respectively, based on factor analysis. (d) Based on factor and/or reliability analysis, the items of the DIFFICULTY scale, i.e., ‘The
course technology can only be taught by specially trained teachers’ and ‘To be able to be a
good teacher in technology, you need a specialised training’ were added to the ‘self-
efficacy’ scale. This adaptation is theoretically defendable. (e) Compared to the Oberon study, the item ‘The government should spend more money on
technology’, was excluded. (f) Based on factor and/or reliability analysis, this subscale was excluded. (g) In the interim report of Oberon (2009, p. 6), it is stated that the ‘self-efficacy’ scale is not
applicable for attitude towards science. (h) Other than in the Oberon study, the items on the INTENTIONS scale were not added to the
ENJOYMENT scale.

TEACHER AND PUPIL ATTITUDES TOWARDS SCIENCE AND TECHNOLOGY
25
Table A.2. Correlations between teacher attitude scales concerning science and technology
(posttest, n = 25-26)
2. 3. 4. 5. 6. 7.
Attitude Technology
1. Importance .06 .18 -.09 -.29 .11 .05
2. Enjoyment .34 .49* -.15 .70** .62**
3. Intentions .36 -.20 .42* .37
4. Self-efficacy -.47* .61*** .43*
Attitude Science
5. Difficulty -.50** -.20
6. Enjoyment .59**
7. Intentions
*p < .05. **p < .01.
Table A.3. Correlations between technology related teacher subscales
(posttest, n = 23-24)
Attitude Learning by design
Importance Enjoyment Intentions Self-efficacy
Attitude Technology
Importance .47 * .48 * .08 -.07
Enjoyment .38 .24 .23 .05
Intentions .18 .27 .26 .14
Self-efficacy .03 -.04 .22 .33
*p < .05.
Table A.4. Correlations between science related teacher subscales (posttest, n = 24)
Attitude Inquiry-based learning
Importance Enjoyment Intentions Self-efficacy
Attitude Science
Difficulty -.16 -.04 -.16 -.34
Enjoyment .07 .42 * .35 .28
Intentions .23 .16 .19 .09
*p < .05.

CHARLOTTE VAN CLEYNENBREUGEL, VEERLE DE WINTER, EVELIEN BUYSE, & FERRE
LAEVERS
26
Table A.5. Overview of scales, example items and study results concerning the pupil
questionnaire on attitudes towards science and technology
Subscales Example item
Design study(a) Present study
# items α(b) # items α(b)
Attitude Technology R2 (c) = 51% R2 (c) = 54%
Difficulty I find it hard to learn about
technology.
4 .50 3(d) .66
Importance Technology has a big influence
on people.
7 .73 7 .70
Gender Boys are better car-mechanics
than girls.
3 .76 3 .77
Enjoyment I enjoy fixing things myself. 6 .78 6 .80
Intentions Later, I want to follow a
technical profession.
3 .92 3 .84
Attitude Science R2 (c) = 56% R2 (c) = 56%
Difficulty I find science difficult. 3 .60 /(e) (.36)
Importance People who figure out new ideas
are important to society.
7 .70 7 .76
Gender Boys are better scientists than
girls.
3 .85 3 .88
Enjoyment I like to figure out new ideas. 7 .88 7 .82
Intentions Later, I would like to have a job
in science.
3 .84 3 .83
(a) Extracted from the design report of the pupil attitude monitor (Walma van der Molen,
2007). (b) Cronbach’s alpha coefficients. (c) Explained variance in attitudes towards science and technology respectively, based on
factor analysis. (d) Compared to the design study, the item ‘Technology is only for smart people’, was
excluded. (e) Based on factor and/or reliability analysis, this subscale was excluded.

TEACHER AND PUPIL ATTITUDES TOWARDS SCIENCE AND TECHNOLOGY
27
Table A.6. Correlations between pupil attitude scales (post-test, n = 480-487)
2. 3. 4. 5. 6. 7. 8. 9.
Attitude Technology 1. Difficulty -.07 .00 -.36*** -.18*** -.09* -.06 -.26*** -.18***
2. Importance -.02 .29*** .32*** .65*** .07 .27*** .17***
3. Gender .02 .13** .07 .76*** .03 .11*
4. Enjoyment .45*** .27*** .10* .68*** .28***
5. Intentions .34*** .21*** .41*** .45***
Attitude Science 6. Importance .15*** .43*** .33***
7. Gender .12* .17***
8. Enjoyment .52***
9. Intentions
*p < .05. **p < .01. ***p < .001.

CHARLOTTE VAN CLEYNENBREUGEL, VEERLE DE WINTER, EVELIEN BUYSE, & FERRE
LAEVERS
28
Table A.7. Comparison of mean attitude scores between Flemish and Dutch pupils
Flanders
(N = 320-327)
The Netherlands
(N = 158-163) t-test(a)
M SD M SD df t p
PRETEST
Technology
Difficulty 2.19 .65 1.86 .64 487.00 5.32*** .000
Importance 2.90 .44 2.90 .49 488.00 -0.13 .895
Gender 2.17 .87 2.33 .98 291.96 -1.69 .092
Enjoyment 3.32 .52 3.17 .58 488.00 2.85** .005
Intentions 2.25 .82 2.03 .86 485.00 2.75** .006
Science
Importance 2.94 .47 2.90 .59 265.67 0.63 .531
Gender 1.82 .87 1.94 1.00 282.24 -1.32 .188
Enjoyment 3.22 .55 2.97 .70 260.19 4.00*** .000
Intentions 2.10 .80 1.87 .80 482.00 2.93** .004
POSTTEST
Technology
Difficulty 2.02 .66 1.93 .65 483.00 1.47 .141
Importance 2.81 .46 2.88 .56 278.07 -1.26 .208
Gender 2.18 .91 2.01 .98 483.00 1.82 .069
Enjoyment 3.18 .63 3.09 .65 483.00 1.50 .134
Intentions 2.15 .83 2.03 .83 481.00 1.56 .119
Science
Importance 2.85 .49 2.84 .63 260.27 0.25 .804
Gender 1.77 .83 1.86 .98 277.00 -0.96 .338
Enjoyment 3.05 .62 2.89 .71 485.00 2.65** .008
Intentions 2.04 .76 1.88 .79 482.00 2.04* .042
* p < .05. **p<.01. ***p<.001. (a) two-tailed independent samples t-test for mean differences.

TEACHER AND PUPIL ATTITUDES TOWARDS SCIENCE AND TECHNOLOGY
29
Table A.8. Comparison of mean attitude scores between boys and girls on the pupil
questionnaire
Boys
(N = 230-233)
Girls
(N = 250-256) t-test(a)
M SD M SD df t p
PRETEST
Technology
Difficulty 1.97 .69 2.18 .63 486.00 -3.51** .001
Importance 2.94 .43 2.86 .48 487.00 1.87 .063
Gender 2.74 .89 1.75 .63 414.65 14.04*** .000
Enjoyment 3.40 .53 3.15 .54 487.00 5.11** .001
Intentions 2.48 .88 1.90 .70 486.00 7.98*** .000
Science
Importance 3.01 .53 2.85 .48 484.00 3.361** .001
Gender 2.40 .98 1.36 .49 333.06 14.61*** .000
Enjoyment 3.23 .62 3.05 .59 484.00 3.31** .001
Intentions 2.19 .89 1.88 .69 432.70 4.26*** .000
POSTTEST
Technology
Difficulty 1.84 .69 2.12 .60 457.83 -4.65*** .000
Importance 2.90 .52 2.78 .47 482.00 2.57*** .000
Gender 2.58 .98 1.70 .65 393.83 11.54*** .000
Enjoyment 3.29 .64 3.02 .62 482.00 4.77*** .000
Intentions 2.37 .89 1.87 .70 435.24 6.79* .011
Science
Importance 2.97 .53 2.74 .53 484.00 4.81*** .000
Gender 2.27 .96 1.36 .51 348.39 12.79*** .000
Enjoyment 3.12 .64 2.88 .64 484.00 4.15*** .000
Intentions 2.14 .84 1.83 .67 442.33 4.49*** .000
* p < .05.**p<.01.***p<.001. (a) two-tailed, independent samples t-test for mean differences.