Understanding the Normal Curve and its Parameters in ...The normal curve, or the Bell Curve, or...
19
Editha E. Josue 53 Understanding the Normal Curve and its Parameters in Standardized Tests Editha E. Josue Stephen F. Austin High School INTRODUCTION Every year, more than half of all African Americans, Hispanics and Native Americans, three ethnic groups considered to be American society‟s minority populations, fail to graduate from high school (Bridgeland, DiLulio, and Morison). Addressing this stark reality in education, the Houston Independent School District, the country‟s seventh largest school district, and one attended by a predominantly Hispanic population, is waging a campaign called “Expectation: Graduation” in order to bring dr op-outs back into the classroom and to encourage those who are in schools to stay on track. Not only is the HISD trying to increase graduation rate but there is also an increasing effort to encourage students to move on into college education. In the words of Dr. Abelardo Saavedra, HISD‟s Superintendent, schools should foster a college-bound culture (“Superintendent Makes Creating a „College-Bound Culture‟ the District‟s Priority for 2006”). Advanced placement courses are offered on high school campuses in order to allow advanced high school students an early entry into postsecondary education by way of qualifying exams for college-level credits in these courses. These placement courses also improve students‟ competency in the various disciplines, ultimately improving their readiness for postsecondary education. The dual credit courses are similar courses given in high schools, granting qualified high school students the credit hours in certain college courses that they take right on their own high school campuses. A number of schools, like Austin High School, have magnet programs geared towards enhancing students‟ interest in specific professions or areas of human endeavor that exemplify the practice of careers. HISD‟s secondary school directory shows 26 schools offering magnet programs in a variety of areas, among them being the teaching professions, foreign languages, research and technology, aviation, health professions, environmental science, engineering, and meteorology and space sciences (“Magnet Programs”). Austin High School‟s magnet program is in the teaching profession. I have been invited to teach an innovative course entitled “Seminar in the Educational Process” next school year. The course is an elective for academically qualified students in their senior year. As a TEA-approved course, it encourages high school students to consider teaching as a profession. This is, therefore, a college preparatory course that will give participating magnet school students a preview of the college courses they are going to take in education. My curriculum unit will be a part of this magnet course. “Seminar in the Educational Process” may be considered as a preparatory course aligned with a foundation course coded with the title Teacher Education 1300 at the Houston Community College. The college course covers psychological issues related to the practice of the teaching profession: theories of learning, memory and cognition, heredity and environmental factors in the learning process, and history and framework of psychological testing (including intelligence, ability and achievement testing).
Transcript of Understanding the Normal Curve and its Parameters in ...The normal curve, or the Bell Curve, or...
Editha E. Josue 53
Understanding the Normal Curve and its Parameters in Standardized Tests
Editha E. Josue
Stephen F. Austin High School
INTRODUCTION
Every year, more than half of all African Americans, Hispanics and Native Americans, three
ethnic groups considered to be American society‟s minority populations, fail to graduate from high school (Bridgeland, DiLulio, and Morison).
Addressing this stark reality in education, the Houston Independent School District, the
country‟s seventh largest school district, and one attended by a predominantly Hispanic
population, is waging a campaign called “Expectation: Graduation” in order to bring drop-outs back into the classroom and to encourage those who are in schools to stay on track.
Not only is the HISD trying to increase graduation rate but there is also an increasing effort to
encourage students to move on into college education. In the words of Dr. Abelardo Saavedra, HISD‟s Superintendent, schools should foster a college-bound culture (“Superintendent Makes
Creating a „College-Bound Culture‟ the District‟s Priority for 2006”). Advanced placement
courses are offered on high school campuses in order to allow advanced high school students an early entry into postsecondary education by way of qualifying exams for college-level credits in
these courses. These placement courses also improve students‟ competency in the various
disciplines, ultimately improving their readiness for postsecondary education.
The dual credit courses are similar courses given in high schools, granting qualified high school students the credit hours in certain college courses that they take right on their own high
school campuses.
A number of schools, like Austin High School, have magnet programs geared towards enhancing students‟ interest in specific professions or areas of human endeavor that exemplify the
practice of careers. HISD‟s secondary school directory shows 26 schools offering magnet
programs in a variety of areas, among them being the teaching professions, foreign languages, research and technology, aviation, health professions, environmental science, engineering, and
meteorology and space sciences (“Magnet Programs”).
Austin High School‟s magnet program is in the teaching profession. I have been invited to
teach an innovative course entitled “Seminar in the Educational Process” next school year. The course is an elective for academically qualified students in their senior year. As a TEA-approved
course, it encourages high school students to consider teaching as a profession. This is, therefore,
a college preparatory course that will give participating magnet school students a preview of the college courses they are going to take in education. My curriculum unit will be a part of this
magnet course.
“Seminar in the Educational Process” may be considered as a preparatory course aligned with
a foundation course coded with the title Teacher Education 1300 at the Houston Community College. The college course covers psychological issues related to the practice of the teaching
profession: theories of learning, memory and cognition, heredity and environmental factors in the
learning process, and history and framework of psychological testing (including intelligence, ability and achievement testing).
Houston Teachers Institute 54
This curriculum unit attempts to integrate some introductory statistical tools and parameters
around the concept of the normal curve as it applies to standardized tests. Standardized tests are a big part of students‟ school experience, and it would always be timely and relevant if they get to
understand how their knowledge and skills in specific academic areas are evaluated. Discussion
and readings will bring awareness on the construct and breakdown of tests into items that seek to
measure the attainment of specific learning objectives and student expectations. A clear understanding of standards will improve success in tests used as evaluation tool for their
achievement of competency, which is a requirement for graduation from high school, or as
assessment tool for their scholastic aptitude, which is a significant basis for admission into a college of their choice.
A simpler version of this unit will mesh well, too, in advanced classes in Algebra II or in
math skill enhancement classes that are offered in addition to the high school math core courses. At this level, the topic of statistics in standardized tests to evaluate competency and appraise the
level of achievement in reference to a norm would be as equally eye-opening. The inclusion of
the unit in these classes would make students aware of academic standards assessed statistically.
According to brain development research, teenagers are entirely capable of abstract and more complex higher-order thinking tasks, but their brain is undergoing massive pruning in that part
that is responsible for goal and priority setting, planning and organization, executive decision and
judgment (Wolfe). Teenagers have the tendency to be shortsighted in terms of situating their lives and the consequences of their actions. At this developmental stage, it is education‟s role to
enable them to blossom gracefully into adulthood. The unit will provide the opportunity for
pruning.
The topic of normal curve will potentially bring discussions to the higher-order reflective
exercise of looking at achievement and competency scores‟ implication in the status of ethnic
populations in education and American society in general. Given that educational attainment is a
path to greater socio-economic integration, this broader framework will hopefully strengthen their motivation to strive to perform well on these tests. No longer will their scores be isolated
personal measures of their competencies, for which it is their individual freedoms to strive or
forego achieving.
THE BELL CURVE: A MATHEMATICAL MODEL FOR A VARIETY OF REAL-
WORLD PROCESSES
The Nature of the Normal Curve and the Normal Curve of Nature
The normal curve is a ubiquitous model in the subject of intelligence and achievement measurement, and is, therefore, a fixture, too, in an introductory course in educational psychology
or teacher education. This curriculum unit will revolve around the Bell Curve as a springboard
for the discussion of standardized tests, a topic in Austin High School‟s Magnet Program Course entitled “Seminar in the Educational Process.” The course gives the assigned instructor a good
degree of freedom to design the course as a parallel to a foundational course in Teacher Education
in college.
The normal curve, or the Bell Curve, or Gaussian curve, is rather the graphical and
mathematical representation of a discovery about the observed behavior and manifested attribute
of people and things in a variety of real-world processes and phenomena. It is the graph of a
normal distribution of observed scores in these situations. Because it is a graph that amazingly fit data from observed phenomena, psychological and biological processes, and a variety of physical
attributes in things and people in the real world, the normal curve models the so-called empirical
rule on distribution (Brase 291).

Editha E. Josue 55
The normal curve is also called the normal density curve. The x-axis scales the scores for the
observed attribute or behavior, and the y-axis scales values obtained from the normal density function formula defining normal density as a function of observed data or scores. Normal
density function values, the y-values of the graph, correspond to the frequencies of different
scores from an observed population or sample. Frequency is the number of times a score appears
in a set of scores or observed data. When a histogram of scores versus frequency is constructed, the peak points of the bars outline a bell-shaped curve; hence, the term bell curve for the normal
distribution of scores into which this frequency histogram is converted. Figure 1 below illustrates
this relationship between a frequency histogram and the normal curve.
Scores for the x-
variable representing
this attribute are obtained by using
simple measuring tools,
or in the case of
psychological attributes, for instance, from an
instrument that has been
validated to measure the construct of said
attribute. Measuring
tools may include meter-sticks for height,
weighing scales for
weight, a graduated
flask or cylinder for volume, etc.
Constructed instruments
to measure psychological attributes
may be an intelligence
test, a state assessment
test like the TAKS, or a college admission test like the Scholastic Achievement Test. Scores may mean measurements in
some industrial or sales concern such as the sizes of women‟s shoes for production and sale, or
the amount of milk production in a cattle ranch. Scores may mean tallies or counts of occurrences, people or things, such as the variable longevity of an industrial product, classroom
sizes, number of siblings in families, etc., so that the frequency and the related normal density
would represent the distribution of the different scores obtained through these tallies or counts.
In statistics, a minimum sample size of 30 from a population that is believed to exhibit a
normal distribution of the attribute or process being observed is considered to be sufficiently
representative of the population itself, and can, therefore, generate the parameter values needed
for the construction of the normal curve. First, the data or scores are arranged in ascending order, averaged and scaled using a statistical formula that gives a value called the standard deviation.
The standard deviation provides the scale unit for calibrating the observed scores along the x-
axis. The resulting graph will plot scores against the density, corresponding to the frequencies of these scores.
It is not the scope of this curriculum unit to discuss the mathematical intricacy and the
abstract concept of the normal density function, but students who will be in this course and are
Scores Figure 1
Houston Teachers Institute 56
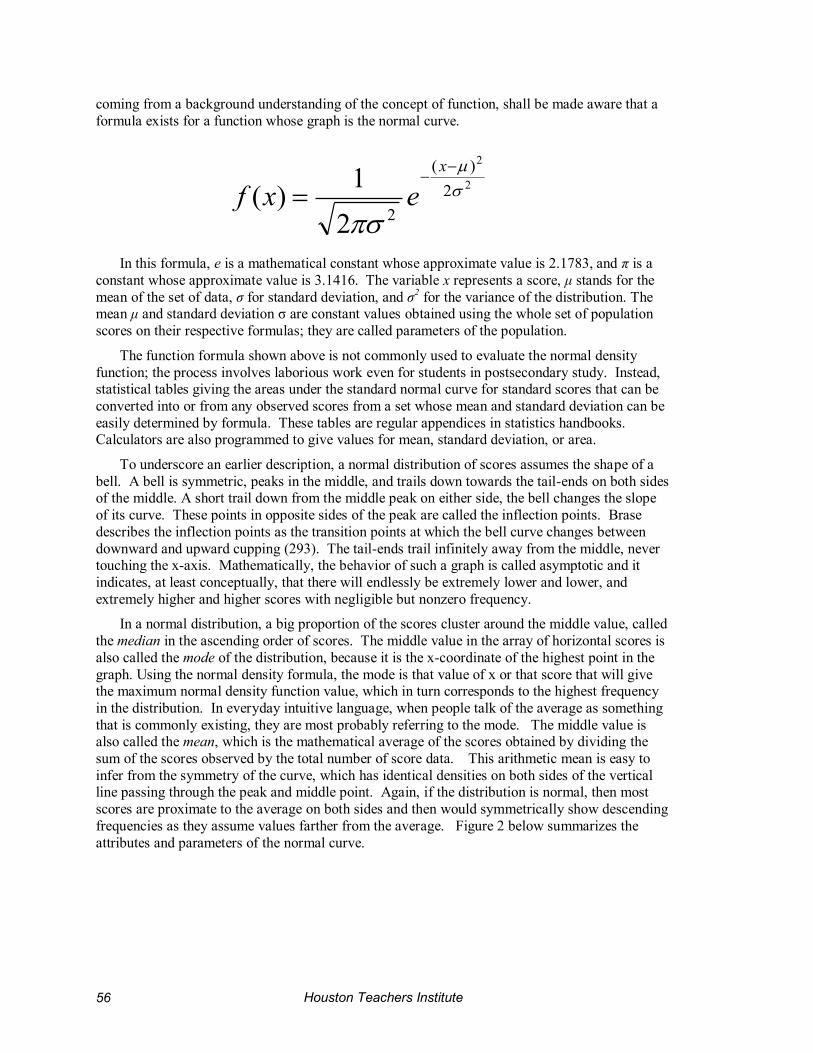
coming from a background understanding of the concept of function, shall be made aware that a
formula exists for a function whose graph is the normal curve.
In this formula, e is a mathematical constant whose approximate value is 2.1783, and π is a
constant whose approximate value is 3.1416. The variable x represents a score, μ stands for the
mean of the set of data, σ for standard deviation, and σ2 for the variance of the distribution. The
mean μ and standard deviation σ are constant values obtained using the whole set of population
scores on their respective formulas; they are called parameters of the population.
The function formula shown above is not commonly used to evaluate the normal density
function; the process involves laborious work even for students in postsecondary study. Instead, statistical tables giving the areas under the standard normal curve for standard scores that can be
converted into or from any observed scores from a set whose mean and standard deviation can be
easily determined by formula. These tables are regular appendices in statistics handbooks. Calculators are also programmed to give values for mean, standard deviation, or area.
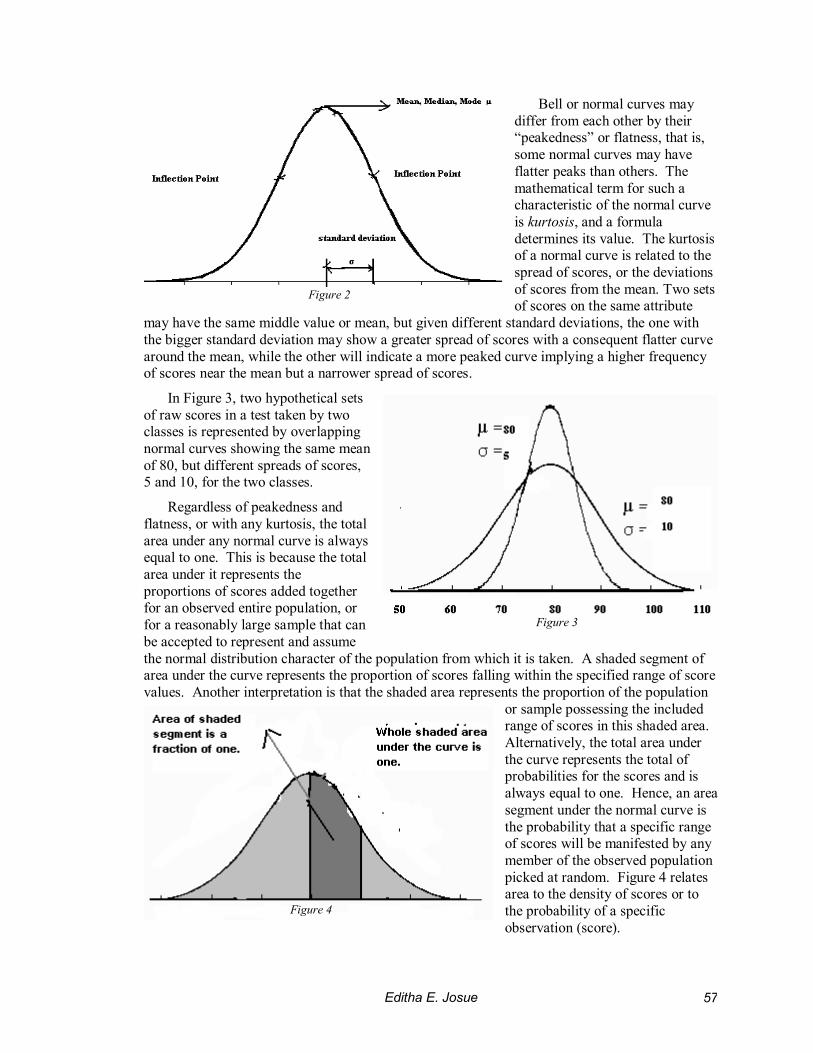
To underscore an earlier description, a normal distribution of scores assumes the shape of a
bell. A bell is symmetric, peaks in the middle, and trails down towards the tail-ends on both sides of the middle. A short trail down from the middle peak on either side, the bell changes the slope
of its curve. These points in opposite sides of the peak are called the inflection points. Brase
describes the inflection points as the transition points at which the bell curve changes between
downward and upward cupping (293). The tail-ends trail infinitely away from the middle, never touching the x-axis. Mathematically, the behavior of such a graph is called asymptotic and it
indicates, at least conceptually, that there will endlessly be extremely lower and lower, and
extremely higher and higher scores with negligible but nonzero frequency.
In a normal distribution, a big proportion of the scores cluster around the middle value, called
the median in the ascending order of scores. The middle value in the array of horizontal scores is
also called the mode of the distribution, because it is the x-coordinate of the highest point in the
graph. Using the normal density formula, the mode is that value of x or that score that will give the maximum normal density function value, which in turn corresponds to the highest frequency
in the distribution. In everyday intuitive language, when people talk of the average as something
that is commonly existing, they are most probably referring to the mode. The middle value is also called the mean, which is the mathematical average of the scores obtained by dividing the
sum of the scores observed by the total number of score data. This arithmetic mean is easy to
infer from the symmetry of the curve, which has identical densities on both sides of the vertical line passing through the peak and middle point. Again, if the distribution is normal, then most
scores are proximate to the average on both sides and then would symmetrically show descending
frequencies as they assume values farther from the average. Figure 2 below summarizes the
attributes and parameters of the normal curve.
2
2
2
)(
22
1)(
x
exf
Editha E. Josue 57
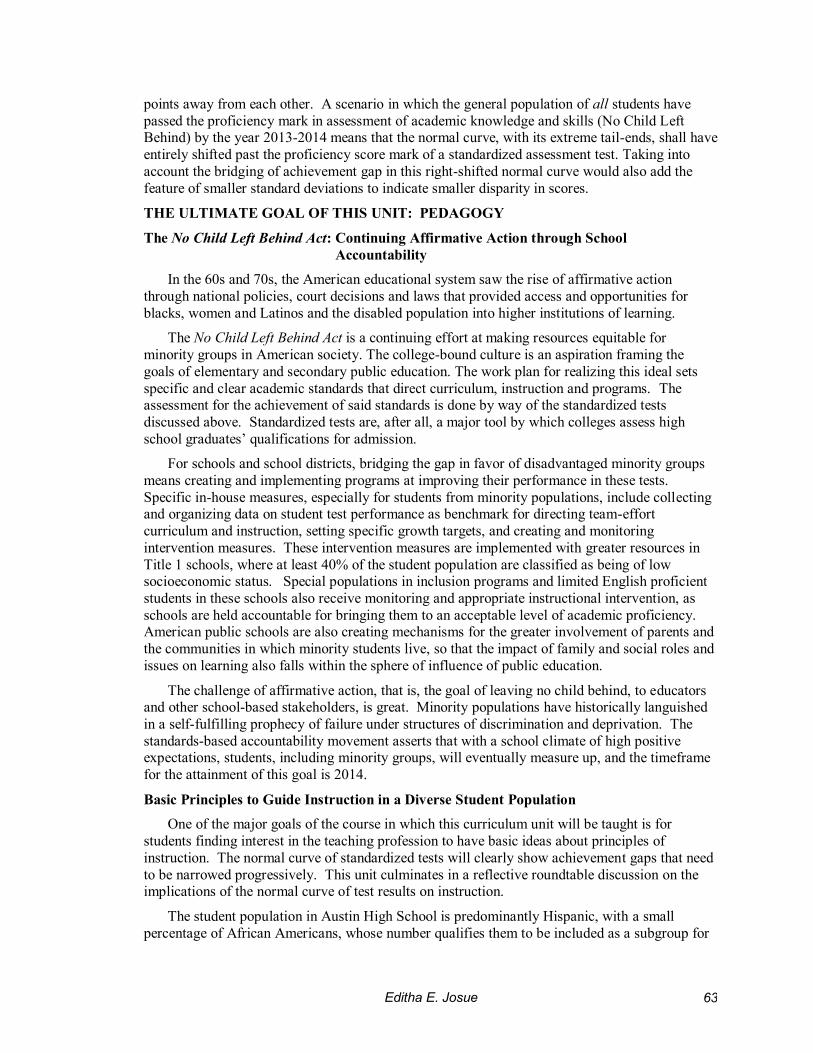
Bell or normal curves may
differ from each other by their “peakedness” or flatness, that is,
some normal curves may have
flatter peaks than others. The
mathematical term for such a characteristic of the normal curve
is kurtosis, and a formula
determines its value. The kurtosis of a normal curve is related to the
spread of scores, or the deviations
of scores from the mean. Two sets of scores on the same attribute
may have the same middle value or mean, but given different standard deviations, the one with
the bigger standard deviation may show a greater spread of scores with a consequent flatter curve
around the mean, while the other will indicate a more peaked curve implying a higher frequency of scores near the mean but a narrower spread of scores.
In Figure 3, two hypothetical sets
of raw scores in a test taken by two classes is represented by overlapping
normal curves showing the same mean
of 80, but different spreads of scores, 5 and 10, for the two classes.
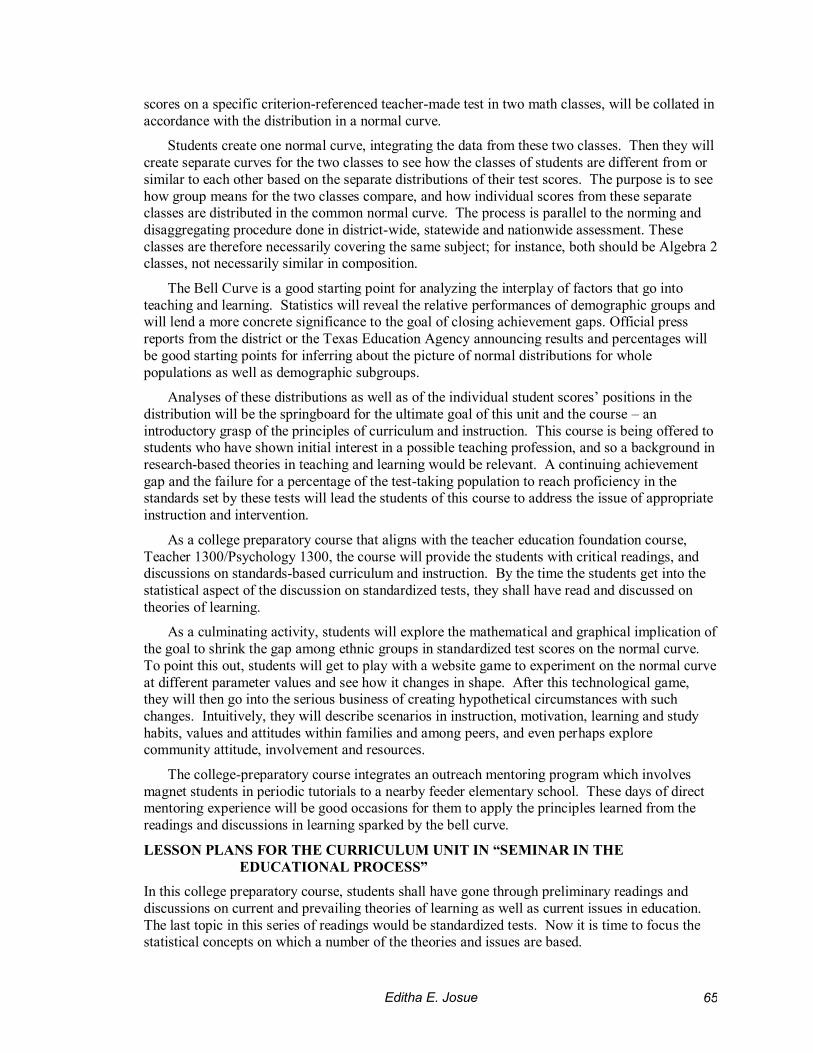
Regardless of peakedness and
flatness, or with any kurtosis, the total
area under any normal curve is always equal to one. This is because the total
area under it represents the
proportions of scores added together for an observed entire population, or
for a reasonably large sample that can
be accepted to represent and assume
the normal distribution character of the population from which it is taken. A shaded segment of area under the curve represents the proportion of scores falling within the specified range of score
values. Another interpretation is that the shaded area represents the proportion of the population
or sample possessing the included range of scores in this shaded area.
Alternatively, the total area under
the curve represents the total of probabilities for the scores and is
always equal to one. Hence, an area
segment under the normal curve is
the probability that a specific range of scores will be manifested by any
member of the observed population
picked at random. Figure 4 relates area to the density of scores or to
the probability of a specific
observation (score).
Figure 2
Figure 3
Figure 4

Houston Teachers Institute 58
As a model for the distribution of observed data, the normal curve depicts the empirical rule
of distribution. It is an empirical rule because it reflects the distribution from observed practice. This empirical rule has the following distribution of scores:
1. Sixty-eight per cent, 68 %, of the scores are one standard deviation, or one scale unit, above or below the middle value or the mean.
2. 95.44% of the scores are within two scale units on both sides of the middle value.
3. 99.7% of the score data, practically including the whole population measured, fall within three standard deviations from the mean.
The scale along the horizontal axis in the normal distribution figure in Figure 5 clearly shows
the relationship between the mean μ and the standard deviation σ. Students in the course shall have earlier gotten acquainted with the concept and computation of the mean of a data set.
Knowing the mean, students get to understand the concept of variance. Computationally, the
variance is the average of the squared deviations of the scores from the mean of scores. The square root of the variance will give the standard deviation of the distribution, the length of each
of the equal intervals dividing the scores. As a statistic, the standard deviation gives information
on the spread of scores of examinees. It will show how disparate or proximate these scores are.
As mentioned earlier, a highly disparate set of scores would give a bell curve that has a wider but lower peak in the middle, and stretches out more widely to both tail-ends. On the other hand,
using the same coordinate plane, the bell curve of a more proximate set of scores having the same
mean, would have a steep peak in the middle and scale down more abruptly toward the tail-ends. Below is a summary of the formulas used in the process of constructing the bell curve for a
population or sample of test-takers.
For a set of n individual scores or observations where x1, x2, x3 ….xn, are the respective individual scores or observations, the arithmetic mean or average is obtained using the formula:
Mean: μ or x = Σ x
n
Figure 5

Editha E. Josue 59
If some or all of the individual observation measurements or counts exist more than
once, then respective frequencies are taken into account in the formula for the mean:
k k
μ or x = Σ1 fi xi = Σ1 fi xi
n Σ f In this formula, n represents the total number of scores or observations, i refers to a specific
score with a specific frequency f, and k represents the number of different values of x in the set of
data; k also refers to the number of products fixi.
The notation Σ means sum and in the above formula, it denotes the sum of the products of
scores and their frequencies for the numerator part of the right side expression as well as the sum
of the frequencies of the different scores.
While the mean is the arithmetic average that measures the central tendency of a normally distributed set of scores, the variance is the arithmetic average of the squared deviations of the
individual scores from the mean.
Variance σ2 = Σ (x - x)2
n Again, the standard deviation determines the scale parameter for the normal curve
distribution of the set of scores or observations. Standard deviation, denoted by σ, is obtained by
computing for the square root of the variance.
σ = Σ (x - x)2
n The above formula gives the population standard deviation. This is used when computing
for the standard deviation of the scores of all test-takers in a specific subject and level of the TAKS. The formula may also be used for a sample of 30 or greater number of observations from
the population. For a sample size less than 30 (that is, if number of observations is less than 30),
the formula above tends to underestimate the actual standard deviation of the population. To
correct for this negative bias, the sample standard deviation instead uses the more approximate value from the formula:
σ = Σ (x - x)2
n-1 Any normal curve may be converted into a standardized scale so that scores on two different
tests with differing scoring systems but relating to the same attribute may be compared. We may
convert the differently scaled scores measuring the same attribute of the same population or group into the standard z-score using the formula below:
Standard score z = x - μ
σ where X is the scaled score based on a test‟s scoring system, μ is the arithmetic mean of scores
based on that scoring system, and σ is the standard deviation of scores in that scoring system.

Houston Teachers Institute 60
In a standard normal curve, the mean is assigned the conversion value of 0, and the standard
deviation or scale interval is 1. Scores to the left of the zero mean will have negative values and scores to the right will have positive values.
The Normal Curve of Standardized Tests
The Texas Assessment of Knowledge and Skills (TAKS) is a criterion-referenced test that
seeks to measure proficiencies in the areas of reading/language arts, mathematics, science, and social studies at Grades 3-11. Eleventh graders take the exit level TAKS the passing of which is
part of the requirement for graduation from high school. The percentage of students reaching or
surpassing the proficiency scale mark in these tests across academic areas and across grade levels provides the basis for a school‟s meeting or failing to meet the adequate yearly progress (AYP) as
defined in the NCLB accountability. Starting from a statistically determined baseline, these
percentages of passing scores are evaluated against recommended yearly incremental increases (“Texas Consolidated State Application Accountability Workbook” 10-11).
TAKS scores fall under three categories or levels: Did not Meet Standards, Met Standards,
and Commended Performance. These categories correspond to the following levels of
proficiency: basic, proficient, advanced. Just to give an idea about the TAKS score scale, results in the TAKS 11
th grade mathematics taken by students in 2006 indicate the proficiency level at
2211 score mark, equivalent to a maximum of 27 wrong answers, and commended performance
level starts at the 2400 mark, equivalent to at most seven wrong answers out of the total of 60 test items. While scores signify the failure on, achievement, or surpassing of the proficiency mark,
the normal curve also becomes a graphic analytical tool of information on a student‟s
performance in comparison to the population of test-takers (“Texas Assessment of Knowledge and Skills: Raw Score Conversion Table, Mathematics - Spring 2006 Administration, Exit
Level”).
For special populations who are beneficiaries of inclusion programs in regular public schools,
the State-Developed Alternative Assessment (SDAA) and the Locally Determined Alternate Assessment are alternative assessment tools that replace the TAKS when the latter is deemed
inappropriate to measure their gains in proficiency. Similarly, for students with limited English
proficiency, the Reading Proficiency Tests in English (RPTE) is the standardized test deemed appropriate for assessment.
The HISD has also been a participant to the Stanford and Aprenda national standardized tests
sponsored by the National Assessment of Educational Progress (NAEP) since 1997. The
Stanford Achievement Test assesses student achievement in reading, mathematics, language, spelling, study skills, thinking skills, listening, environment/science, and social science. The
Aprenda is the Spanish language version of the Stanford and is administered to Hispanic students
with limited English proficiency. The SAT/Aprenda is a series of 11 steps that track students‟ academic achievement from primary years to eleventh grade. As such, score reports also include
an indicator on a test-taker‟s grade level in skills and knowledge. The Stanford Achievement
Tests are also norm-referenced, so that, again, the normal curve plays a key role in assessing the state of American education, as individuals, schools, and groups are compared against the
national norm (“Glossary: Definition of Terms and Data Sources”).
The Scholastic Aptitude/Assessment Test, or SAT, gives raw scores on a scale ranging from
200 to 800 with a mean of 500 and a standard deviation of 100. But scores are reported in relation to a norm group, or a similar group of test-takers, and are, therefore, converted into a
standard score for college admission purposes. The SAT consists of two sections: verbal and
mathematical reasoning abilities, and student‟s knowledge in specific subject areas and the student‟s ability to apply the knowledge (Samuda 131-133).

Editha E. Josue 61
Standardized test results are oftentimes reported along with percentiles and percentile ranks,
which give information on the performance of the taker in comparison to the population of test-takers, or in accordance with the scores of a predetermined norm group that has been established
as representative of the group of test-takers. If a particular examinee‟s score is determined to be
in the 75th percentile, his or her percentile rank of 75 puts him/her in a position above 75% of the
examinees. In a normal distribution, when a student‟s or test-taker‟s score has been converted to a z or standard score, his or her percentile rank among the population of test-takers may be
obtained by referring to a standard or unit normal table. Such a table is normally found in the
appendix section of a statistics reference book. For a start, the reader may refer to Gravetter and Wallnau‟s “Statistics for the Behavioral Sciences (690 – 693).
By definition, percentile ranks can be obtained for any distribution, whether normal or
skewed (not symmetrical), in a set of data arranged in ascending order. The special nature of the distribution of a normal curve makes scale scores that are assumed to be normally distributed
easily convertible into the percentile rank associated with standard scores. First, an examinee‟s
scaled score is converted into a standard z score. The area to the left of this standard score,
representing the probability or proportion of scores below that score, is determined using the normal table for areas, or using a probability calculator. This probability or area is then
multiplied by 100 to obtain the percentile rank based on an assumption of normal distribution of
achievement scores.
Pr = 100(Area to the left of z score)
Since the percentile rank for any examinee is determined by his or her position in the ranked
order of the population of examinees, it can be obtained from a frequency table that arranges scores, with their corresponding frequencies, in ascending order. Percentile rank for a particular
scale score is obtained by adding the proportion of scores below that score to half the frequency
of that score. The sum is a fraction or decimal, which is then multiplied by 100 to give the
percentile rank. TEA‟s Student Assessment Division illustrates this procedure for obtaining the percentile rank of a student directly from the frequency table of scaled scores for the 2003 exit
level Grade (“Converting a TAKS Scale Score to a Percentile Rank”). The formula is worked out
independently of the mean μ and standard deviation σ:
PR(x) = ((f / 2 + L ) / N)100
x = scale score of interest
f = frequency of the scale score of interest
L = cumulative frequency associated with the next lowest scale score N = population size (number of persons tested).
In a normal distribution, scores are closer around the mean and much farther apart at the
extreme ends. Percentile ranks derived from a standard normal table would not be scaled on
equal intervals the way the above formula based on a frequency table would generate their values. Normal table percentile ranks would show values that are more proximate around the mean and
more disparate at extreme scores. The normal curve equivalent (NCE) corrects for this
misleading ranking. The ranking according to the normal curve is modified such that the calibrated scores along the horizontal axis are rescaled into 99 equal divisions with 50 as the
middle value and 1 and 99 as the first and last percentile ranks. The Stanford/Aprenda tests of
achievement utilize the NCE when ranking the population of examinees, because scores are interpreted in comparison to a preexisting norm representing a nationwide population.

Houston Teachers Institute 62
Figure 6: (“Normal Curve Equivalent.” http://www.rochesterschools.com/Webmaster/StaffHelp/rdgstudy/nce.html)
Performances of students in achievement and proficiency tests are always disaggregated into
the performances of subgroups of the population of test-takers, evaluated against the same criteria
of target gains and percentage of those passing proficiency. In the accountability system of the NCLB Act, these subgroups are the ethnic subpopulations (whites, African-Americans, Hispanics,
Asians, Native Americans), special education populations, those with limited English proficiency
(LEP), and those who fall under the definition of low socio-economic status (SES). Under the Texas state accountability system, comparison of the performance of demographic and program
groups is done on TAKS scale score averages and the percentages of students meeting standards.
SAT and ACT mean scores for demographic groups are compared to the norm or to each other to assess differences and deviations from each other. The Stanford/Aprenda is likewise norm-
referenced.
There is great concern about closing of the achievement gap among these groups. This has
always been the ultimate standard or indicator by which the success of educational reforms is gauged. Very recently, Dr. Abelardo Saavedra, HISD‟s Superintendent, reminded all
stakeholders to students‟ education, that while gains have been made in terms of the percentage of
students performing satisfactorily in TAKS and Stanford/Aprenda, there continues an unacceptably large achievement gap among the ethnic and disadvantaged groups that need to be
bridged completely (“Achievement Gap Among Fifth-Graders in HISD Narrows”).
In all these ways of assessing, the normal distribution of achievement is an underlying assumption. This means that demographic groups and general populations follow a distribution
where majority of the students in a group perform around a norm or central average. If a normal
distribution always depicts a set of data, what does it mean then to close the achievement gap?
The integration of the mathematical concept with the goals of accountability is the challenge that students in the magnet program course will address. While the tests norm groups and
compare group averages, individual scores indicate whether students are performing at par with
standards or are performing better. The implication of a scenario where a growing number of students have been meeting standards or achieving higher scores in these tests would translate
into group score means, the peaks in subpopulation normal curves that would be fewer score
Editha E. Josue 63
points away from each other. A scenario in which the general population of all students have
passed the proficiency mark in assessment of academic knowledge and skills (No Child Left Behind) by the year 2013-2014 means that the normal curve, with its extreme tail-ends, shall have
entirely shifted past the proficiency score mark of a standardized assessment test. Taking into
account the bridging of achievement gap in this right-shifted normal curve would also add the
feature of smaller standard deviations to indicate smaller disparity in scores.
THE ULTIMATE GOAL OF THIS UNIT: PEDAGOGY
The No Child Left Behind Act: Continuing Affirmative Action through School
Accountability
In the 60s and 70s, the American educational system saw the rise of affirmative action
through national policies, court decisions and laws that provided access and opportunities for
blacks, women and Latinos and the disabled population into higher institutions of learning.
The No Child Left Behind Act is a continuing effort at making resources equitable for
minority groups in American society. The college-bound culture is an aspiration framing the
goals of elementary and secondary public education. The work plan for realizing this ideal sets
specific and clear academic standards that direct curriculum, instruction and programs. The assessment for the achievement of said standards is done by way of the standardized tests
discussed above. Standardized tests are, after all, a major tool by which colleges assess high
school graduates‟ qualifications for admission.
For schools and school districts, bridging the gap in favor of disadvantaged minority groups
means creating and implementing programs at improving their performance in these tests.
Specific in-house measures, especially for students from minority populations, include collecting and organizing data on student test performance as benchmark for directing team-effort
curriculum and instruction, setting specific growth targets, and creating and monitoring
intervention measures. These intervention measures are implemented with greater resources in
Title 1 schools, where at least 40% of the student population are classified as being of low socioeconomic status. Special populations in inclusion programs and limited English proficient
students in these schools also receive monitoring and appropriate instructional intervention, as
schools are held accountable for bringing them to an acceptable level of academic proficiency. American public schools are also creating mechanisms for the greater involvement of parents and
the communities in which minority students live, so that the impact of family and social roles and
issues on learning also falls within the sphere of influence of public education.
The challenge of affirmative action, that is, the goal of leaving no child behind, to educators and other school-based stakeholders, is great. Minority populations have historically languished
in a self-fulfilling prophecy of failure under structures of discrimination and deprivation. The
standards-based accountability movement asserts that with a school climate of high positive expectations, students, including minority groups, will eventually measure up, and the timeframe
for the attainment of this goal is 2014.
Basic Principles to Guide Instruction in a Diverse Student Population
One of the major goals of the course in which this curriculum unit will be taught is for
students finding interest in the teaching profession to have basic ideas about principles of
instruction. The normal curve of standardized tests will clearly show achievement gaps that need
to be narrowed progressively. This unit culminates in a reflective roundtable discussion on the implications of the normal curve of test results on instruction.
The student population in Austin High School is predominantly Hispanic, with a small
percentage of African Americans, whose number qualifies them to be included as a subgroup for

Houston Teachers Institute 64
assessment for the adequate yearly progress discussed earlier. The succeeding discussions briefly
apply current research-based principles in the particular classroom setting of Austin High School.
First, a standards-based curriculum and instruction outlines the specific set of knowledge and
skills in every academic area and clearly defines student expectations. Since students are taught
by these standards of competency, their achievement of these standards can be periodically
assessed and finally evaluated in a standardized manner.
Second, effective instruction is sensitive to and accommodates ethnic diversity and
differences in individual learning styles in the classroom through varied activities. There is great
consideration about the fact that minority students bring into the classroom the values, attitudes, burdens and hopes brought about by their socio-cultural experiences. Locke and Ciechalski
caution that it is not enough for their healthy self-concept, however, to demonstrate just an
attitude of understanding and sympathy for minority students by virtue of the abovementioned factors. They need to genuinely feel that teachers have high positive expectations about their
capacity to learn and succeed by the same standards that they and non-minority groups are
evaluated on (120-125). Moreover, instructional activities recognize that some students learn
through kinesthetic means, others predominantly visually, some auditorily, etc. In addition, though there is diversity and there are differences among individual learners, knowledge and
skills are also socially mediated or constructed, so that cooperative learning activities can
effectively intersperse with direct instruction.
Third, research has also shown that the brain learns following specific paths of construction.
It learns by accommodating and assimilating new information and skill into its already existing
schema. Learning is facilitated when new information or skill is given in the context of a familiar concept or logic, or as a significant integral part of something that has been acquired. Application
of knowledge and skills in familiar real-world problem-solving situations facilitates the
understanding of concepts and strengthens their retention. Piaget‟s schemata and Vygotsky‟s
zones of proximal development (Byrnes 22-28, 36-37) are theoretical guides for students of this course to create lesson plans that address the learning needs of their elementary school mentees,
or to propose instructional interventions for performing at par with the standards of proficiency.
INSTRUCTIONAL FRAMEWORK & STRATEGY
This curriculum unit will be tackled as part of the topic of intelligence and achievement tests.
After a presentation and discussion on standardized tests and the construct of testing, the normal
curve will be discussed. Frequency tables for test scores in past TAKS tests are available at the
Texas Education Agency website and can provide the needed sets of data for computational exercises.
On the other hand, data that show the norm across vast populations, like the nationwide scale
of Scholastic Assessment Test (SAT), will be appropriate and relevant materials to develop their understanding of the technical and mathematical nature of the bell curve.
Individual scores may also be analyzed in terms of the norm. Such data may come from the
Confidential Student Reports (CSR) students in this class have received in recent TAKS tests taken, or may be furnished to them individually by the teacher. This report includes the level of
proficiency each individual student has achieved as revealed by his/her test score; it also breaks
down his/her raw score into scores under specific skill and knowledge objectives into which the
test items are classified.
As the hands-on application of the concept and process discussed earlier on standardized
tests, students are then given the opportunity to create normal curves from local empirical data,
such as scores and grades in a classroom. The latter will provide a smaller set of data that is easier to handle in computations and graphing. Without revealing students‟ names, individual
Editha E. Josue 65
scores on a specific criterion-referenced teacher-made test in two math classes, will be collated in
accordance with the distribution in a normal curve.
Students create one normal curve, integrating the data from these two classes. Then they will
create separate curves for the two classes to see how the classes of students are different from or
similar to each other based on the separate distributions of their test scores. The purpose is to see
how group means for the two classes compare, and how individual scores from these separate classes are distributed in the common normal curve. The process is parallel to the norming and
disaggregating procedure done in district-wide, statewide and nationwide assessment. These
classes are therefore necessarily covering the same subject; for instance, both should be Algebra 2 classes, not necessarily similar in composition.
The Bell Curve is a good starting point for analyzing the interplay of factors that go into
teaching and learning. Statistics will reveal the relative performances of demographic groups and will lend a more concrete significance to the goal of closing achievement gaps. Official press
reports from the district or the Texas Education Agency announcing results and percentages will
be good starting points for inferring about the picture of normal distributions for whole
populations as well as demographic subgroups.
Analyses of these distributions as well as of the individual student scores‟ positions in the
distribution will be the springboard for the ultimate goal of this unit and the course – an
introductory grasp of the principles of curriculum and instruction. This course is being offered to students who have shown initial interest in a possible teaching profession, and so a background in
research-based theories in teaching and learning would be relevant. A continuing achievement
gap and the failure for a percentage of the test-taking population to reach proficiency in the standards set by these tests will lead the students of this course to address the issue of appropriate
instruction and intervention.
As a college preparatory course that aligns with the teacher education foundation course,
Teacher 1300/Psychology 1300, the course will provide the students with critical readings, and discussions on standards-based curriculum and instruction. By the time the students get into the
statistical aspect of the discussion on standardized tests, they shall have read and discussed on
theories of learning.
As a culminating activity, students will explore the mathematical and graphical implication of
the goal to shrink the gap among ethnic groups in standardized test scores on the normal curve.
To point this out, students will get to play with a website game to experiment on the normal curve
at different parameter values and see how it changes in shape. After this technological game, they will then go into the serious business of creating hypothetical circumstances with such
changes. Intuitively, they will describe scenarios in instruction, motivation, learning and study
habits, values and attitudes within families and among peers, and even perhaps explore community attitude, involvement and resources.
The college-preparatory course integrates an outreach mentoring program which involves
magnet students in periodic tutorials to a nearby feeder elementary school. These days of direct mentoring experience will be good occasions for them to apply the principles learned from the
readings and discussions in learning sparked by the bell curve.
LESSON PLANS FOR THE CURRICULUM UNIT IN “SEMINAR IN THE
EDUCATIONAL PROCESS”
In this college preparatory course, students shall have gone through preliminary readings and
discussions on current and prevailing theories of learning as well as current issues in education.
The last topic in this series of readings would be standardized tests. Now it is time to focus the statistical concepts on which a number of the theories and issues are based.
Houston Teachers Institute 66
Lesson I: Introducing the Bell Curve
In earlier grades, students learned the following statistical concepts: measures of central tendency – mean median, and mode. Now it is time to focus on computational and data-organizing
exercises to reinforce this background knowledge. Discussion will proceed to the relation of
mode to the mathematical meaning of frequency, an easy concept that is not intensively tackled in
earlier grade levels. Median will be related to the new concept of percentile rank. By now, students are familiar with rank ordering of scores, because they have had an earlier understanding
of median, the number in the middle of an array of values arranged from lowest to highest.
Again, an earlier understanding of percent tackled under TAKS Math Objective #9 will help them in understanding the meaning of percentile as some value related but not equivalent to a
percentage. Aside from measures of central tendency and percents, Objective # 9 also covers
ratio and proportion, and probability. This prior knowledge will help students understand area under the normal curve, and percentile ranks obtained from a standard normal curve conversion
table.
With the help of an overhead projector, the normal curve will be introduced, a graph consisting of
points smoothly joined on the coordinate plane. The graph‟s situation on a two-axes coordinate plane is important, because students have taken up math courses that emphasized the concept of
functional relationship, in which some dependent variable y depends on an independent variable
x, and this relationship can be translated into a coordinate graph . Looking at the normal curve graph, students, either in groups, or in a whole-class discussion, will be guided to identify its
properties: symmetrical, has a peak in the middle, has inflection points, asymptotic with respect
to the x-axis at the tail-ends. If it is technologically possible, the teacher will try to shade different portions under this curve and will lead students to identify at which sections the area is
densest.
The teacher will then label the horizontal axis with the variable score, and will scale it in
accordance with a hypothetical set of scores with corresponding frequencies. Such a set of data may be lifted from a published report on SAT, or an improvised sample distribution of heights of
people to facilitate understanding of the concept. Students will then calibrate the y-axis with
frequencies of the different scores. A histogram conventionally achieves this coordinate relationship between scores and their frequencies. It will be shown, as is done in the preceding
pages, that the areas covered by the rectangular graphs will approximate the area under a bell-
shaped curve which is at this point given the term normal curve. Further description of the
normal curve in terms of the values that situate it in the coordinate plane will ensue.
The concept of the normal distribution being the approximate distribution of a variety of
empirical quantitative data in physical and biological processes, as well as in psychological and
educational measurements, will be the next important point in the development of this lesson.
Frequency is not the actual value in the y-axis of a normal curve, because frequency, by
computational practice, refers to the tallies or counts of specific scores in the population. The
normal density function value, on the other hand, which is a y-coordinate of the curve, is the value obtained using a formula, but it corresponds to the frequency of every score in the normal
curve. This idea will be emphasized; the normal density function formula will be briefly
discussed only because of students‟ background in the algebraic concept of functional
relationships. The variable y must be equal to some function f(x).
A technological (interactive computer) manipulation of the kurtosis (which term may be
introduced also) of the initial bell-shaped normal curve will next illustrate the idea that normal
distributions of data may have a variety of spreads. One illustration will present two sets of scores with the same mean but different spreads.

Editha E. Josue 67
Standard deviation will then be formally defined. There will be a step-by-step walk through the
mathematical process of relating dispersion to the deviations of scores from the mean, squaring these deviations so that their values do not cancel out, averaging these squared deviations, and
finally obtaining the square root of this average to determine the standard deviation of the
distribution.
Students in groups will perform computational exercises on the mean and standard deviation, and will exercise literacy skills by verbally describing the distribution of the given sets of data.
Percentile rank will also be defined formally in this lesson. Computational exercises will make
use of the frequency table of scores in the 2003 TAKS exit level mathematics.
A word wall will highlight statistical vocabulary learned in the process of getting mathematically
acquainted with the Bell Curve.
This lesson will probably take up two 90-minute class sessions.
Lesson II: Hands-on Application of Statistical Concepts
Understanding of the normal curve parameters introduced in the previous lesson will be
reinforced by way of using empirical data from two math classes. This is the assessment activity
for the preceding lesson. Aside from assessing their grasp of the computational procedure, the ultimate objective of this activity is to assess how well students can describe and compare the
spread of scores. Students will venture into what factors will account for the disparity or
proximity of scores, or the difference or similarity in the spreads of scores. They will do this intuitively, but by this time, they shall also have had some background in educational research
and theory through the readings and discussions. Possible factors for consideration include
instructional issues, motivation, learning styles, discipline, etc.
Lesson III: Interpreting and Reading Statistical Reports in the Context of the Normal
Curve
This lesson aims to illustrate how the above normal curve parameters come into play in the
collation and presentation of results in standardized tests. But first, a discussion of the different standardized tests given to high school students and what they measure is in order. Tests will be
distinguished from each other as criterion-referenced, norm-referenced, as proficiency tests or
tests of achievement.
Press releases, articles and documents, and data sheets that are downloadable from the Internet,
available from newspapers and books on educational measurements will provide statistical
information on standardized tests. Students will be asked to infer individual and group
performances when given normal curves of scores in certain standardized tests. By this time, the y-axis of the normal curve shall have shrunk in significance because the important parameters
being scrutinized in these tests are the mean, standard deviation, percentile rank and normal curve
equivalency. The last term shall be discussed as it comes up in an available material.
Students will also be made aware of the language of statistical reporting: one group being several
deviations away from another; a district‟s performance having improved 10 points better than the
last; the achievement gap between two demographic groups having narrowed by a few points, and so on. What are the underlying computational tasks that came with a final report like a press
release? This part of the lesson will primarily be teacher-directed open class discussion.
Students will try to use the normal curve as a model to illustrate the persistent but narrowing
achievement gap among the ethnic groups.
Students will transcend the statistical framework of previous discussions. They will now attempt
to understand the standards-based educational reform and accountability within which these tests
Houston Teachers Institute 68
operate. Scrutinizing the Confidential Student Report form, for instance, students will look more
closely into the breakdown of student expectations on proficiency into clear and specific learning objectives. They will look into patterns of strengths and weaknesses in students‟ attainment of
the competencies addressed by these objectives. They do this exercise not only like apprentice
teachers, but also as self-reflective students exhibiting a metacognitive awareness of their own
problem-solving, concept development and skill acquisition strategies. They will now move on to propose instructional approaches that will enable students and schools to meet the standards. A
roundtable discussion and an essay will provide the venue for their analytic integration of their
ideas on learning and instruction. They will be encouraged to undertake further individual readings in preparation for the roundtable discussion and a deeper theoretical background for
their essay.
Lesson IV: How Do We Shrink the Gap?
The class will recap on their construction of normal curves that illustrate continuing achievement
gaps. In this lesson, the Internet or, possibly, Microsoft Excel, will provide the interactive tool to
manipulate parameter values so that students are able to create normal curves that will narrow
achievement gaps among demographic groups in standardized tests. For instance, the document posted by Balasubramanian Narasimhan offers a simple exercise of manipulating values of the
mean and standard deviation to create different normal curves. Although the normal curves
change one at a time on screen, the students will get to understand visually and graphically that test scores can collectively go past a marked proficiency score, and can be proximate or less
dispersed, as can be shown by changing the standard deviation values in the applet.
Students will use the scale scores of standardized tests to construct the normal curves. Will the peak points marking the mean of scores of ethnic groups shift to the right and be of a shorter
distance from each other? Will the common normal curve of score distribution for the entire
population of test-takers, inclusive of demographic and program (special education, limited
English proficient) subpopulations, be more narrow or “peaked” and have a mean that is shifted to the right? A narrower bell will mean smaller standard deviation and less disparity in scores; a
right-shifted curve will indicate an increased mean for the whole population.
ANNOTATED BIBLIOGRAPHY
Works Cited
Books
Brase, Charles Henry, and Corrinne Pellillo Brase. Understandable Statistics: Concepts and Methods. 8th ed. Boston: Houghton Mifflin Company, 2006. This is a good resource for high school students as it provides easy-to-understand explanations of statistical
concepts.
Byrnes, James P. Cognitive Development and Learning in Instructional Contexts.2nd Ed. Needham Heights, MA: Allyn & Bacon, 2001. Discusses theories of cognitive development and learning, memory, higher-order thinking and motivation, and proposes useful ways of translating these theories into classroom practice.
Gravetter, Frederick, and Larry Wallnau. Statistics for the Behavioral Sciences. 5th ed. Belmont, CA: Wadsworth/Thomson Learning, 2000. This is an easy-to-read reference for students, educators and researchers who want to understand the statistical
tools employed in the conduct of research in the behavioral sciences.
Locke, Don C. and Joseph Ciechalski. Psychological Techniques for Teachers, 2nd ed. Washington, D.C.: Taylor & Francis Group, 1995. Presents models of learning that are applicable to teaching, communication techniques that employ these models, paradigms at improving self-concept of students and their relationships with teachers, methods of working with special groups like the ethnic minorities, academically challenged, gifted and talented, ways of handling special problems such as drug and alcohol abuse, students from single-parent families, death and dying, juvenile
Editha E. Josue 69
delinquency. Finally, the last few chapters deal extensively on the measurement of teaching impact – the standardized and non-standardized tests – and how these are utilized in instruction.
Samuda, Ronald. Psychological Testing of American Minorities: Issues and Consequences. Thousand Oaks, California: SAGE Publications, 1998. It discusses some issues of controversy in standardized testing, including technical problems in appraisal, the
nature versus nurture controversy, the educational and social consequences of testing.
Web Sources
“Achievement Gap among Fifth-Graders in HISD Narrows.” 23 March 2006. News @ HISD. Houston Independent School District. 25 May 2006. <http://www.houstonisd.org/HISD/portal/article/front/0,2731,20856_142973398_155441014,00.html>. While this news article gives the big picture about HISD‟s performance across schools, it also provides cues for students to make inferences about statistical process that led to the summary report.
Bridgeland, John M., John J. DiIulio, Jr., and Karen Burke Morison. “The Silent Epidemic: Perspectives of High
School Drop-outs.” March 2006. Civic Enterprises. 25 June 2006. <http://www.civicenterprises.net/pdfs/thesilentepidemic3-06.pdf#search='The%20Silent%20Epidemic'>. This is the report of a research conducted by Civic Enterprises in association with Peter D. Hart Research Associates for the Bill and Melinda Gates Foundation. Through surveys and focus groups on high school drop-outs of ages 16-25 years, the research explored the reasons why a big percentage of high school students drop out of school, a problem that is referred to in this report as the silent epidemic.
“Converting a TAKS Scale Score to a Percentile Rank.” Student Assessment Division Texas Education Agency. 19 June 2006. <http://www.tea.state.tx.us/student.assessment/reporting/freq/convertscalescore.pdf>.
Explains the computational process for obtaining the percentile rank from the frequency table for the 2003 TAKS exit level mathematics.
“Glossary: Definition of Terms and Data Sources.” Houston Independent School District Profiles 2004–05. 22 June 2006. <http://www.houstonisd.org/vgn/images/portal/cit_23015118/38872969Glossary%202004-05.pdf#search='normal%20curve%20equivalents%20and%20TAKS%20scale%20scores'>. This glossary includes information on standardized tests administered to HISD schools.
“Magnet Programs.” Houston Independent School District. June 2006. <http://www.houstonisd.org/Departments/site_front/0,3121,28991668,00.html>.
Narasimhan, Balasubramanian. “The Normal Distribution.” 22 July 1996. No Title. 1 July 2006. <http://www- stat.stanford.edu/~naras/jsm/NormalDensity/NormalDensity.html>. This page discusses basic features of the normal distribution and provides applets for students to interact with for better understanding of the mean and standard deviation of the normal curve and the empirical rule of normal distribution.
“Normal Curve Equivalent.” Rochester Schools. June 22, 2006. <http://www.rochesterschools.com/Webmaster/StaffHelp/rdgstudy/nce.html>. A resource for comparing percentile rank with normal curve equivalent (NCE). Explains the use of the normal curve equivalent in assessing school-wide performance as NCEs can be averaged. An NCE can also be used to
gauge whether a student has progressed in academic achievement from the previous year as he is compared to the same norm population.
“Superintendent Makes Creating a „College-Bound Culture‟ the District‟s Priority for 2006.” 7 Feb. 2006. News @ HISD. Houston Independent School District. 15 May 2006. <http://www.houstonisd.org/HISD/portal/article/front/0,2731,20856_142973398_148897691,00.html>. This news article enumerates the main points in the State of the Schools Address given by HISD‟s Dr. Abelardo Saavedra at the Brown Convention Center on February 2, 2006. In this speech, Dr. Saavedra announced the opening of pre-kindergarten classes to qualified four-year olds, the start of SUCCESS Initiative, an outreach
program for parents of elementary school children, and the strengthening of the dual credit program in high schools. He said that all these measures are geared towards fostering a college-bound culture, starting all the way down in pre-school, where children need the starting skill to move up.
“Texas Assessment of Knowledge and Skills: Raw Score Conversion Table, Mathematics - Spring 2006 Administration, Exit Level”. Student Assessment Division. Last Update – June 2006. Texas Education Agency. June 21, 2006. <http://www.tea.state.tx.us/student.assessment/scoring/convtables/2006/apriltaks/g11m_apr06.pdf>. This page explains steps of converting a score from a frequency table of TAKS scale scores into a percentile rank.
Houston Teachers Institute 70
“Texas Consolidated State Application Accountability Workbook.” 27 July 2004. U. S. Department of Education - Office of Elementary and Secondary Education. 21 June 2006. <http://www.ed.gov/admins/lead/account/stateplans03/txcsa.doc>. This document lays out the details of an approved and final work plan proposed by the Texas Education Agency for the implementation of the accountability system of the No Child Left Behind Act in Texas schools.
Wolfe, Pat. “The Adolescent Brain: A Marvelous Work in Progress.” January 2003. The RMC Health Educator. Vol. 4, No. 1, Autumn 2003. Rocky Mountain Center for Health Promotion and Education. 30 June 2006. <http://www.rmc.org/pdf/RMCHEV4N1.pdf#search='pruning%20the%20adolescent'>. This article discusses what brain research says about the changes taking place in the adolescent brain, a stage given the term “pruning” of the synapses in the frontal lobes. Called the CEO of the brain, these lobes are responsible for the following functions: executive decision-making and mediation of ethical and moral behavior.
Supplemental Sources
Clarizio, Harvey F., et al. Contemporary Issues in Educational Psychology, 4th ed. Boston, MA: Allyn and Bacon,
Inc., 1981. Discusses a wide range of issues in the field of educational psychology that stir controversies and debate, including laws of learning and cognition, the various alternative strategies that complement and challenge the application of classic learning principles, the case for or against standardized testing and even grading in the classroom, the issue of direct instruction versus stimulating discovery and creativity, etc. All these are in the realm of the possible topics to be covered in the college preparatory course “Seminar in the Educational Process” in whose context this curriculum unit is being conceived.
Ebel, Robert L. and David A. Frisbie. Essentials of Educational Measurement. Englewood Cliffs, New Jersey:
Prentice-Hall, Inc., 1991. This book dwells in great detail on achieving reliability and validity in a variety of tests. Provides ample information on how tests are constructed to measure learning achievements. Complements discussion on standards-based instruction and assessment.
Green, John A. Introduction to Measurement and Evaluation. New York: Dodd, Mead & Company, 1970. Discusses the origin and development of standardized tests and the theoretical background for measurement. In evaluating student growth and change, it offers psychometric methods on learning outcomes not only in the specific areas of knowledge and understanding, but also in such psychological processes as reflective thinking and
problem solving, attitude and opinion, as well as learning products and procedures in performance assessment.
Gunn, Harry E. and Jaswinder Singh. Minority Report: How African Americans and Hispanics Can Increase Their Test Scores. Lanham, Maryland: The Rowman & Littlefield Publishing Group, Inc., 2004. While this book asserts that standardized tests have cultural bias that puts minority groups like the African Americans and Hispanics at a disadvantage, it presents explanations along lines of social, environmental and psychological factors of learning, and suggests practical ways by which teachers and parents can work within these contexts to help minority students achieve better in standardized tests.
Hereford, Carl F. et al., eds. Statistics and Measurement in the Classroom. Dubuque, Iowa: Kendall/Hunt Publishing Company, 1969.
The chapters entitled “The Concept of the Normal Curve” by Susan McFarland, and “How to Talk Back to a Statistic” are valuable in this curriculum. The book underscores the need for teachers to be equipped with knowledge of statistical definitions, methods and tools, for them to gain better understanding of educational research and testing in an accountability-driven educational environment.
Kennedy, Eugene. Raising the Test Scores: An Administrator’s Guide to Improving Standardized Test Performance. Thousand Oaks, California: Corwin Press, Inc, 2005. Focusing on standardized test scores, the book offers suggestions on working on teacher and staff characteristics and addressing social and environmental factors as areas for consideration in a school improvement plan in order
to raise student achievement in these tests.
Lambert, Nadine N. and Barbara L. McCombs, eds. How Students Learn: Reforming Schools through Learner-Centered Education. Washington, D.C.: American Psychological Association, 1998. The authors clearly come from learner-centered perspectives – the constructivist and cognitive/metacognitive approaches - that tend to undermine the role that high-stakes testing plays in directing educational policy and classroom instruction. It underscores dilemmas in academic achievement as it asserts the shortcomings of standardized tests. The book is useful in offering the opposite pole of the debate in high-stakes testing, and can provide insights in classroom instruction that can bridge the gap between accountability-driven assessment and
individual student assessment.
Editha E. Josue 71
Maynard, Ashley E. and Mary I. Martini. Learning in Cultural Context: Family, Peers and School. New York: Kluwer Academic/Plenum Publishers, 2005. Working from Vygotsky‟s social construct of learning, this book asserts that the effective way to improve school learning is by using everyday socio-cultural contexts of learning. This is particularly useful to this curriculum unit because it bridges the gap between the “bias” or detachment of high-stakes standardized testing and students‟ real-
world socially constructed experiences.
Neisser, Uric, ed. The Rising Curve: Long-Term Gains in IQ and Related Measures. Washington, DC: American Psychological Association, 1998. This book presents statistical reports indicating that achievement test scores have been improving for blacks, and that the gap in test scores between whites and blacks is now actually shrinking. The book then offers a number of factors, including policies and programs instituted to improve the education of blacks (and other minority groups). Provides a supportive framework for the current standards-based accountability movement of the No Child Left Behind Act.
Pellegrino, James W. et al., eds. Knowing What Students Know: The Science and Design of Educational Assessment. Washington, D.C.: National Academy of Sciences, 2001. Clearly coming from a positivist or quantitative paradigm, this book discusses the scientific foundations of assessment and the contributions of measurement and statistical modeling to assessment. Written and published at a time when the accountability movement for schools is the order of the day, the book concludes with surfacing implications and recommendations for research, policy and practice in education.
Scott, David, ed. Curriculum and Assessment. Westport, Connecticut: Ablex Publishing, 2001. Authors of the various chapters of this book address a range of raging controversies in curriculum and assessment,
among them the debate on psychometric or statistical frameworks of assessments versus holistic frameworks, and high-stakes assessment versus low-stakes assessment. Chapters also provide insights on new methods of assessment that take into consideration recent findings in educational research and lessen stress on standardized “decontextualized” testing.