Understanding the nonlinear optical response of epsilon ...
39
Understanding the nonlinear optical response of epsilon near zero materials in the time-domain Joshua Baxter, *,† Adriana P´ erez-Casanova, ‡ Luis Cortes-Herrera, ‡,¶ Antonio Cal` a Lesina, § Israel De Leon, *,‡,k,⊥ and Lora Ramunno *,†,⊥ †University of Ottawa, Department of Physics and Centre for Research in Photonics, Ottawa, Canada ‡Tecnol´ ogico de Monterrey, School of Engineering and Sciences, Monterrey, Mexico ¶University of Rochester, Institute of Optics, Rochester, New York, USA §Leibniz Universit¨ at Hannover, Hannover Centre for Optical Technologies, Cluster of Excellence PhoenixD, and Fakult¨ at f¨ ur Maschinenbau (Institut f¨ ur Transport- und Automatisierungstechnik), Hannover, Germany kUniversity of Ottawa, School of Electrical Engineering and Computer Science, Ottawa, Canada ⊥Max Planck–University of Ottawa Centre for Extreme and Quantum Photonics, Ottawa, K1N 6N5 Canada E-mail: [email protected]; [email protected]; [email protected] Abstract The promise of active nanophotonics technology relies on the confinement and con- trol of light at the nanoscale. Confinement via plasmonics, dielectric resonators, and waveguides can be complemented with materials whose optical properties can be con- trolled using nonlinear effects. Transparent conducting oxides (TCOs) exhibit strong optical nonlinearities in their near zero permittivity spectral region, on the femtosecond 1 arXiv:2110.14806v1 [physics.optics] 27 Oct 2021
Transcript of Understanding the nonlinear optical response of epsilon ...

Understanding the nonlinear optical response of
epsilon near zero materials in the time-domain
Joshua Baxter,∗,† Adriana Perez-Casanova,‡ Luis Cortes-Herrera,‡,¶ Antonio
Cala Lesina,§ Israel De Leon,∗,‡,‖,⊥ and Lora Ramunno∗,†,⊥
†University of Ottawa, Department of Physics and Centre for Research in Photonics,
Ottawa, Canada
‡Tecnologico de Monterrey, School of Engineering and Sciences, Monterrey, Mexico
¶University of Rochester, Institute of Optics, Rochester, New York, USA
§Leibniz Universitat Hannover, Hannover Centre for Optical Technologies, Cluster of
Excellence PhoenixD, and Fakultat fur Maschinenbau (Institut fur Transport- und
Automatisierungstechnik), Hannover, Germany
‖University of Ottawa, School of Electrical Engineering and Computer Science, Ottawa,
Canada
⊥Max Planck–University of Ottawa Centre for Extreme and Quantum Photonics, Ottawa,
K1N 6N5 Canada
E-mail: [email protected]; [email protected]; [email protected]
Abstract
The promise of active nanophotonics technology relies on the confinement and con-
trol of light at the nanoscale. Confinement via plasmonics, dielectric resonators, and
waveguides can be complemented with materials whose optical properties can be con-
trolled using nonlinear effects. Transparent conducting oxides (TCOs) exhibit strong
optical nonlinearities in their near zero permittivity spectral region, on the femtosecond
1
arX
iv:2
110.
1480
6v1
[ph
ysic
s.op
tics]
27
Oct
202
1

time-scale. Harnessing full control over the nonlinear response requires a deeper under-
standing of the process. To achieve this, we develop a self-consistent time-domain model
for the nonlinear optical response of TCOs and implement it into a three-dimensional
finite-difference time-domain code. We compare and tune our simulation tools against
recently published experimental results for intense laser irradiation of thin indium tin
oxide (ITO) films. Finally, by simulating intense laser irradiation of ITO-based plas-
monic metasurfaces, we demonstrate the full power of our approach. As expected, we
find validating the significant enhancement of the nonlinear response of an ITO-based
metasurface over bare ITO thin films. Our work thus enables quantitative nanopho-
tonics design with epsilon-near-zero materials.
1. Introduction
The nonlinear optical response of materials enables a broad range of capabilities within
nanophotonics and plasmonic devices, such as extreme refractive index tuning and frequency
conversion1. These capabilities are of utmost importance for applications such as all optical
data processing2, optical switching3–5, and active photonics6. However, the efficiency and
scalability of nonlinear optical devices is typically limited by the weak nonlinear response of
most natural materials. This results in bulky devices that require long interaction lengths
and/or large optical intensities, making it difficult to scale up and integrate nonlinear optical
processes in photonic devices with a small footprint.
There has been much effort toward the development and understanding of materials
with a large nonlinear optical response7–9. In particular, natural and artificial materi-
als that exhibit a vanishingly small electric permittivity at optical frequencies, known as
epsilon-near-zero (ENZ) materials, promise to be an efficient platform for enhancing non-
linear optical interactions10–13. Enhanced nonlinear processes such as intensity-dependent
refractive index14–19 and harmonic generation20–23, have been observed in both thin film and
nanostructured ENZ materials. A widely studied subset of ENZ materials includes trans-
2

parent conductive oxides (TCOs), which are degenerately doped semiconductors such as
indium tin oxide (ITO) and aluminum-doped zinc oxide (AZO). Their enhanced nonlinear
response14,16,17,20,21, the modification of their linear optical properties through doping24, and
their suitability for nanoscale integration through complementary metal-oxide-semiconductor
(CMOS) fabrication25, have positioned these materials as a promising option for enabling
nonlinear nanophotonic and nanoplasmonic devices.
The nonlinear optical response of TCOs has been extensively studied in their ENZ spec-
tral ranges14,17, where a large nonlinear response has been experimentally observed. This is
attributed to intraband transitions occurring in the nonparabolic conduction band of these
materials26,27. For the case of ITO, different models accounting for the temperature depen-
dence of the plasma frequency14,15,28,29, the effect of free-carrier scattering30, other carrier
kinetics effects31 and nonlocality32,33 have been proposed. However, the temporal nature of
the nonlinearity is either not accounted for or, when it has been considered, the modelling of
the transient response of electron dynamics is separate from the electrodynamics modelling
of optical propagation14,15. Currently, no model can account for the temporal dynamics of
the electron distribution and the optical properties simultaneously and self-consistently as
the incident pulse propagates through and interacts with the material. This poses a limita-
tion to describing the time-domain nonlinear response of complex nanophotonic structures
that include ENZ materials, thus posing a limitation in their understanding and design.
In this work, a self-consistent multi-physics numerical model is presented that accounts
for the temporal modification of the optical properties and electron distribution in TCO-
based ENZ materials, as well fully accounting for electrodynamic propagation. We use a
two temperature model (TTM) to describe the electron excitation and thermalization, and
account for its effect on the material’s optical properties with a temperature-dependent
plasma frequency. The implementation of this numerical model in a finite-difference time-
domain (FDTD) electrodynamics solver provides access to local optical properties in the
3

time domain. This enables the simulation of the material’s nonlinear optical response in
space and time, and the design and optimization of complex nonlinear photonic structures
incorporating TCO-based ENZ materials
The structure of the article is as follows. We introduce our material model for the optical
nonlinearity in Section 2 and provide an intuitive explanation of the physical processes
behind the temporal change in the optical properties. In Section 3, we refine and validate
our model by reproducing experimental results from experiments published in Ref. [14],
where we explore the effect of the pump pulse’s central wavelength, incident angle, and
intensity on the nonlinear optical response of ITO thin films. Comparisons between the
simulation results and experimental data demonstrate quantitative agreement. In Section
4, we investigate the time-domain nature of the nonlinearity, and compare our findings
to pump-probe experiments published in Ref. [14]. There, we also present movies of our
simulations that show the evolution of the electric field amplitudes for both pump and probe
simulations. In Section 5, we simulate an ITO-based plasmonic metasurface, demonstrating
the versatility of the FDTD implementation of our model. We find that the presence of the
plasmonic particle enhances the refractive index change by a factor of five over a bare ITO
thin film. Finally, in Section 6, we conclude our work.
2. Model for TCO nonlinear optical response
Transparent conductive oxides (TCOs) are wide-bandgap, degenerate semiconductors that
possess a metallic optical response in the near infrared (NIR) due to an abundance of free
electrons in the conduction band. Therefore, the frequency-domain permittivity of TCOs is
well described in the NIR spectral range by the Drude model29
ε (ω) = ε∞ −ω2p
ω2 + iγω, (1)
where ωp =√Ne2/ε0m∗ is the plasma frequency, γ is the damping coefficient, ε∞ is the
4
high-frequency permittivity, ω is the angular frequency of the electromagnetic field, m∗ is
the effective mass of the conduction electrons, e is the charge of an electron, N is the free
electron density, and ε0 is the permittivity of free space. Note that according to Eq. 1,
the wavelength at which the real part of the permittivity equals zero (the zero-crossing
wavelength) is given by λZC = 2π√ε∞c/ωp.
The properties of the conduction electrons are dictated by the conduction-electron energy
band. Typically, the parabolic band approximation can be applied, such that m∗ does not
change upon interaction with light. This is generally not the case in TCOs exposed to
intense, ultrafast laser pulses. Due to their high doping concentration (and thus high carrier
density), a correction term is required in the dispersion relation34,
h2k2
2m∗0= E + CE2, (2)
where E is the electron energy, hk is the magnitude of the crystal momentum, h is the reduced
Planck’s constant, m∗0 is the effective mass at the conduction band minimum, and C is a non-
parabolicity factor. This non-parabolic band structure results in a plasma frequency that
depends on conduction band electron temperature, Te. An expresion for ωp(Te) is derived
in the Supplementary Information (SI) Section 1, where we use the semiclassical Boltzmann
equation in the relaxation-time approximation, assuming an isotropic conduction band. The
resulting formula is
ω2p (Te) =
e2
3m∗0ε0π2
(2m∗0h2
)3/2 ∫ ∞0
dE (E + CE2)3/2
(1 + 2CE)−1(−∂fFD (E, Te)
∂E
), (3)
where fFD = (exp ((E − µ)/kBTe) + 1)−1 is the Fermi-Dirac distribution, µ is the chemical
potential (discussed later) , and kB is the Boltzmann constant. This temperature dependence
of the plasma frequency is a consequence of the energy dependence of the electronic effective
mass in the conduction band29. Note that a different derivation of Eq. 3 is given in Ref.
5

[27], resulting in the same equation.
In Fig. 1, we plot both the plasma frequency (evaluated via numerical integration of Eq.
3) and the resulting real component of the Drude permittivity (Eq. 1) for several wavelengths
as a function of electron temperature, Te. The plasma frequency decreases monotonically
with Te, leading to a dramatic increase in the relative permittivity. For wavelengths between
1200 nm and 1300 nm, room-temperature (300 K) ITO is an ENZ material. In fact, for
λ > 1240 nm, room-temperature ITO behaves as a metal since Re(ε) < 0, but as the ITO
heats, Re(ε) becomes positive, and it transitions to a dielectric. We discuss the dynamics of
this metal-to-dielectric transition further in Section 4.
Figure 1: Left vertical axis: Real component of the relative permittivity of ITO plotted asa function of electron temperature for wavelengths ranging from 1200 nm (top solid curve)to 1300 nm (bottom solid curve), calculated using Eq. 1. The parameters used for thisplot are given in Section 3. Right vertical axis: Plasma frequency plotted as a function oftemperature (dashed line), calculated via numerical integration of Eq. 3.
Before introducing our model for the electron thermalization dynamics, we first qual-
itatively describe the effect on the material’s electron distribution upon irradiation by an
intense pulse with a center angular frequency of ωpump. As with other degenerate semicon-
ductors, the Fermi energy EF is dependent on the doping concentration, though it typically
lies in the conduction band. Defining the zero-energy level to be at the conduction band
edge, the Fermi level of ITO is on the order of 1 eV inside the conduction band. As il-
lustrated in Fig. 2, when a pump pulse is incident on TCOs, conduction band electrons
6

with energies E between EF − hωpump and EF are excited above the Fermi level leading to
an athermal (nonequilibrium) distribution of electrons (Fig. 2b) that is perturbed from the
original Fermi-Dirac distribution (Fig. 2a)35. Subsequent electron-electron scattering results
in the athermal energy being rapidly redistributed in the electron gas, resulting in a heated
Fermi distribution with temperature Te (Fig. 2c).
𝑓 𝐹𝐷𝐸,𝑇𝑒,0
𝐸𝑛𝑒𝑟𝑔𝑦 𝐸
𝐸𝐹
𝑓 𝐹𝐷𝐸,𝑇𝑒,0
+𝛿𝑓𝐸
𝐸𝑛𝑒𝑟𝑔𝑦 𝐸
ℏ𝜔𝑝𝑢𝑚𝑝
ℏ𝜔𝑝𝑢𝑚𝑝
𝐸𝐹
Pump PulseEquilibrium(un-perturbed)
Non-equilibrium(athermal)
𝐸𝑛𝑒𝑟𝑔𝑦 𝐸
𝑓 𝐹𝐷𝐸,𝑇𝑒,1
𝐸𝐹
--
Electron-electron collisions
Equilibrium(thermalized)
𝑇𝑒,1 > 𝑇𝑒,0
𝑇𝑒,0 = 𝑎𝑚𝑏𝑖𝑒𝑛𝑡 𝑡𝑒𝑚𝑝.
a) b)
c)
Figure 2: Qualitative illustration of the electron distribution thermalization process. a)Initially the material is in thermal equilibrium with the ambient medium and is described bya Fermi-Dirac distribution fFD(E, Te,0) at ambient temperature Te,0. b) The pump pulse actsby exciting electrons below the Fermi level in the range (EF−hωpump) to EF (red shading) tostates above the Fermi level, EF to (EF + hωpump) (blue shading). This can be described asa perturbation added to the Fermi-Dirac distribution δf(E). c) Through electron-electroncollisions, the distribution thermalizes to a hot Fermi Dirac distribution with temperatureTe,1 > Te,0.
Now we turn to our deriving our quantitative model. The thermalized electron and lattice
subsystems are treated using an extended two temperature model (TTM)36 given by
7

∂U(t, r)
∂t= −U(t, r)
τee(Te)− U(t, r)
τep(Te, Tl)+ P (r, t) , (4a)
Ce (Te)∂Te(t, r)
∂t= −gep (Te, Tl) (Te (t, r)− Tl (t, r)) +
U (t, r)
τee (Te), (4b)
Cl (Tl)∂Tl (t, r)
∂t= gep (Te, Tl) (Te (t, r)− Tl (t, r)) +
U (t, r)
τep (Te, Tl), (4c)
where Tl is the lattice temperature, Ce is the electron heat capacity, Cl is the lattice heat
capacity, gep is the electron-phonon coupling coefficient, τee is the electron-electron scattering
time, τep is the electron-phonon scattering time, and P is the electromagnetic power absorbed
by the conduction electrons. In Eqs. 4, the electron and lattice subsystems are treated
separately, and energy is exchanged between the electron and lattice subsystems via electron-
phonon coupling gep. This version is referred to as the extended TTM since it accounts for
the athermal electron energy density U(r, t) (J/m3), a scalar field which acts as a thermal
energy source to the conduction electrons.
Due to the relatively low Fermi energy of ITO, the electron-electron scattering time τee
is on the order of a few femtoseconds (becoming sub-femtosecond for a hot electron gas)
as we describe in the SI Section 2. Because time scales of interest in optical simulations
are typically on the order of hundreds of femtoseconds (much larger than τee), the effect of
including U in our modelling is negligible. For simplicity we thus use a simplified version of
the TTM,
Ce (Te)∂Te(t, r)
∂t= −gep (Te, Tl) (Te (t, r)− Tl (t, r)) + P (r, t) , (5a)
Cl (Tl)∂Tl (t, r)
∂t= gep (Te, Tl) (Te (t, r)− Tl (t, r)) . (5b)
The parameters Ce, Cl, and gep are all temperature dependent; expressions for calculat-
8

ing them are given in SI Section 3, along with a method for calculating the temperature-
dependent chemical potential µ.
In order to complete our model, Maxwell’s equations are solved in the time domain
concurrently with the Drude model via
µ0∂H
∂t= −∇× E, (6)
ε∞ε0∂E
∂t= ∇×H− J, (7)
∂J
∂t= −γJ + ε0ω
2p(Te)E, (8)
where E is the electric field, H is the magnetic field, and J is the conduction electron current
density that accounts for intraband transitions. For constant ωp, Eq. 8 is equivalent to the
Drude model (Eq. 1). As there are no interband transitions in the NIR for ITO, we use a
constant permittivity to describe the effects of the bound electrons that is absorbed into ε∞.
The TTM and electrodynamics equations are coupled via two terms: (i) the absorbed
power P = J · E, given by Poynting’s theorem, and used as the source in Eq. 5a; and (ii)
the plasma frequency ωp(Te), calculated via Eq. 3 and Eqs. 5, and used as the source of the
nonlinearity in the electrodynamics equations. Solved together, Eqs. 3, 5 and 6 - 8 describe
the time-dependent, thermally driven optical nonlinearity in TCOs.
As mentioned in the introduction, a more accurate treatment would involve including
hydrodynamic terms in Eq. 8 and a nonlinear model for the bound electrons as in Ref.
[37]. After some numerical experiments using our existing hydrodynamics solver38, we found
that including hydrodynamic terms has very little effect on the nonlinearity when solved in
conjunction with the TTM.
We use an in-house parallel 3D-FDTD code37,39 to solve Eqs. 6 - 8. In the same code, we
9

also solve the TTM (Eqs. 5) using the Runge-Kutta method40. At each step in the FDTD
simulation, the electric field, magnetic field, current density, and the electron and lattice
temperatures are updated self-consistently.
3. Model Validation and Refinement in ITO thin films
To validate the model presented in the previous section, we compare it against experimental
results obtained by femtosecond laser irradiation of ITO thin films. Although there have been
many experimental studies in recent years14,15,26,29,31,32,41, due to the sensitivity of ITO’s
optical properties to manufacturing specifications, we focus on reproducing the results of
the article by Alam, De Leon and Boyd14, in which the effect of the pump pulse on the
strength of the nonlinearity in 310 nm ITO thin films is investigated using several tests.
First, the authors measure the effect of the pump central wavelength and incident angle on
the nonlinear refractive index of ITO. Second, they show how the reflection, transmission,
and absorption shift as a function of the pump intensity. Third, they measure the time-
domain dynamics of the nonlinearity via pump-probe measurements of the transmission.
We use our model to reproduce the first two of these tests in this section, and tackle the
third (time-domain dynamics) in the next section. Through these comparisons, we are able
to further refine our model to most accurately match this particular set of experimental
data. We also perform an optimization procedure to determine optimal pulse parameters for
maximizing the nonlinearity.
We consider a 310 nm layer of ITO on glass, as in Ref. [14]. To model the one-dimensional
thin-film geometry (along y), we apply Bloch periodic boundary conditions to the x and
z directions of our three-dimensional (3D) simulation domain enabling us to use oblique-
incident pulses42,43, which we set to be p-polarized. We use the room-temperature Drude
model parameters for ITO reported in Ref. [14], ωp = 2π × 473 THz, γ = 0.0468 ωp, and
ε∞ = 3.8055, which result in a zero-crossing wavelength of λZC = 1237 nm.
10

Ref. [14] quantifies the nonlinear response by assuming it is Kerr-like with an intensity
dependent refractive index n = n0 + n2I. The real part of the effective nonlinear index,
Re(n2), and the effective nonlinear attenuation constant, β = (4π/λ) Im(n2), are extracted
via z -scan measurements. It was observed that the maximum Re(n2) and minimum β are
found when the pump wavelength is centered at 1240 nm and the angle of incidence is
60-degrees with respect to the ITO surface normal.
Treating the thermal nonlinearity described in Section 2 as Kerr-like is a rough approx-
imation for two primary reasons: (i) there is no reason to assume that higher odd-order
terms do not contribute to the nonlinearity, and (ii) the nonlinearity is not instantaneous.
Although our numerical implementation allows us to calculate the nonlinear polarization
(or current density) field using more formal definitions, to compare with the experimental
results, we calculate an effective n2 from the simulation data. Though there are several ways
to go about this, we use the following computationally efficient method. We calculate the
mean conduction electron temperature (Te) within the ITO over space and time. This is used
to obtain an effective plasma frequency and thus, by applying Eq. 1, an effective, tempera-
ture dependent, refractive index n(Te) = Re(√ε), which differs from the room temperature
refractive index n0 by ∆n = n(Te)− n0. We then extract an effective n2 using
n2 =∆n
I, (9)
where I is the time-averaged pulse intensity. The true refractive index n(r, t) will vary in
space and time during pulse irradiation and therefore ∆n(r, t) = n(r, t) − n0 also varies in
space and time. While the time and space dependence of n2 is not measured in Ref. [14],
we do explicitly calculate ∆n(r, t) in Section 5 and SI Section 4.
We carry out a two-dimensional parameter sweep of incident angle (in 10-degree incre-
ments) and wavelength (in 50 nm increments) and plot the effective n2 and β values in Fig. 3.
Our results indicate that n2 is maximized at a wavelength of 1250 nm and an angle of 60 de-
11

a) b)
Figure 3: Angle (horizontal axis) and central wavelength (vertical axis) dependence of thea) real part of the nonlinear refractive index and b) the attenuation constant of an ultrafastpulse incident on a 310 nm ITO thin film on glass.
grees, in agreement with the experimental results. Further, our values of n2 ≈ 0.16 cm2/GW
and β ≈ −13000 cm/GW are in reasonable quantitative agreement with the values obtained
in Ref. [14], which are n2 ≈ 0.11 cm2/GW and β ≈ −7500 cm2/GW.
Next, we determine the effect of the incident pulse intensity on the reflectance, transmit-
tance, and absorptance for a central pump wavelength of 1240 nm and an incident angle of
30 degrees as in Ref. [14]. We show the results of our calculations in Fig. 4 where we see an
increase in the transmittance from T ≈ 0.13 to T ≈ 0.4 as the intensity increases from 0 to
250 GW/cm2, and a corresponding decrease in the reflectance from R ≈ 0.19 to R ≈ 0.02.
Our results agree quantitatively with the experimental measurements14 which show an in-
crease in the transmittance from T ≈ 0.12 to T ≈ 0.4 and a corresponding decrease in
reflectance from R ≈ 0.2 to R ≈ 0.04 for the same intensity range.
A feature of note in Fig. 4 is the saturation of the nonlinearity for high intensities.
For simulations in which we assume that the Drude damping coefficient γ is temperature
independent, this saturation occurs for intensities larger than 250 GW/cm2. In order to
produce Fig. 4, and reach agreement with experiments, we needed to consider a model
wherein the damping coefficient increases with temperature. As a first-order approximation,
we use
12

γ(Te) = γ0
(1 +
TeT0
), (10)
0 50 100 150 200Intensity (GW/cm2)
0.0
0.2
0.4
0.6
0.8TransmittanceReflectanceAbsorptance
Figure 4: Intensity dependence of the transmittance (blue), reflectance (red), and absorp-tance (black) of a 1240 nm pump incident at a 30 degree angle from vacuum onto a 310 nmITO thin film on glass.
where γ0 is the low-intensity Drude damping coefficient and T0 = 15000 K is a fitting
parameter with units of temperature. The increase in the Drude damping coefficient is
reasonable because we would indeed expect a decrease in electron mobility due to an increase
in electron-phonon, electron-impurity, and grain boundary collisions. This effect was also
found experimentally in Ref. [29], where an almost-linear relationship was found between
an effective γ and the pulse intensity by fitting the measured spectra to the Drude model.
The fact that γ depends on the temperature highlights the benefit of time-domain modelling
as we can extract simple, yet effective models for optical parameters that otherwise would
require semi-classical or quantum mechanical calculations.
Finally, we optimize properties of the pump pulse (center wavelength, incident angle,
and linear chirp for a given intensity) in order to maximize the change in the refractive
index ∆n(r, t). Using a Nelder Mead algorithm, we find that for lower intensities, ∆n
is largest when the center wavelength is tuned to the ENZ wavelength. Interestingly, for
higher intensities, a larger center wavelength is required to maximize ∆n. For all intensities,
13

the optimal incident angle is θinc ≈ 30◦ and the linear chirp has negligible effect. These
results are presented and further explained in SI Section 4.
4. Analysis of time-domain dynamics
Part of the interest in ITO’s strong nonlinearity stems from its ultrafast response time,
limited mainly by the pulse width (since the athermal relaxation time is small), meaning
that we can have precise control of the instantaneous refractive index. Degenerate pump-
probe measurements have shown that the rise time is less than 200 fs for a 150 fs laser pulse
and the fall time was approximately 360 fs14. In this section, we present corresponding pump-
probe simulations using a two-step numerical process. A primary FDTD-TTM simulation
computes the temperature fields as a function of space and time as the material is excited by
a pump pulse. These temperature fields are stored and subsequently used in separate probe
simulations, where it is assumed that the probe intensity is low enough that it has no effect
on the temperature field.
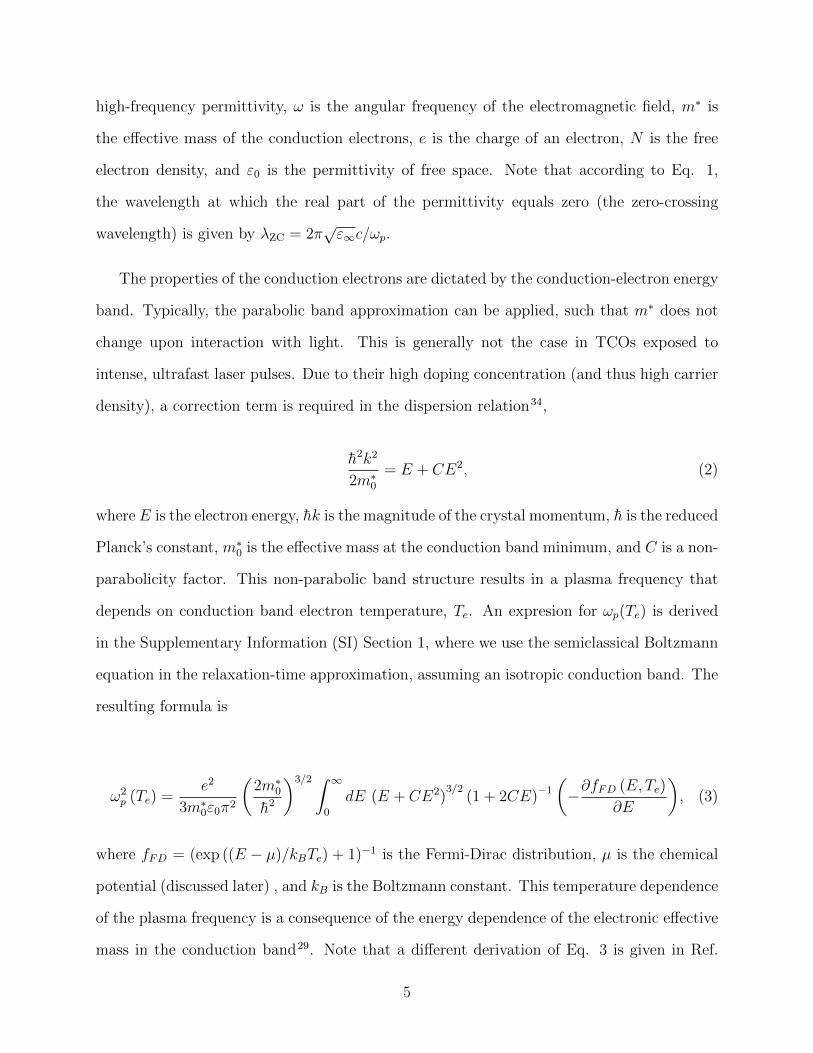
We plot the transmission at λ = 1240 nm as a function of probe pulse delay in Fig.
5, which shows a rise time of 170 fs and a fall time of 385 fs. As in Ref. [14] these are
defined as the time it takes for the transmittance to rise (fall) from 10% (90%) to 90% (10%)
of its maximum change. In order to obtain Fig. 5, we needed to adapt a model for the
electron-phonon coupling strength gep that was originally derived for metals (Eq. 34) and
contains a free parameter. Since the fall time of the optical response is controlled by gep, we
compared numerical calculations to the experimental results to obtain the free parameter;
this is presented in SI Section 3.
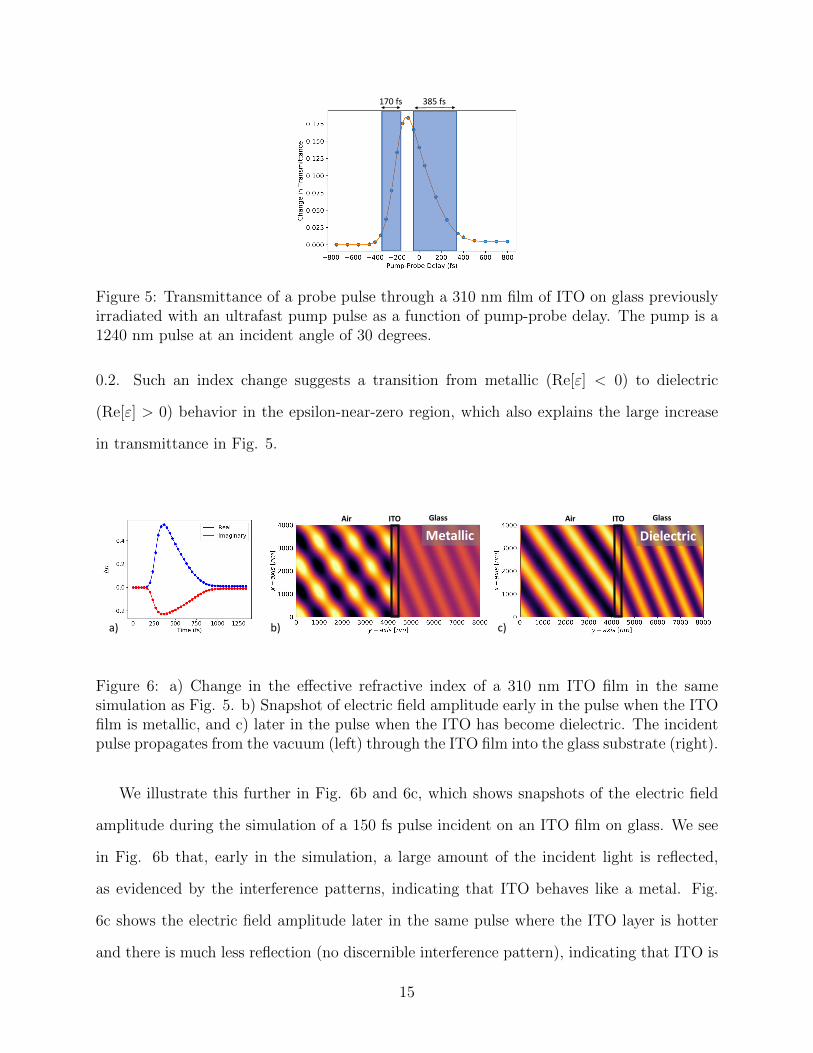
In Fig. 6a we show the corresponding effective refractive index of the ITO film as a
function of time, which is extracted using an effective medium theory where we consider the
thin film to be an effective (uniform) medium44. We see that the real part of the refractive
index increases by approximately 0.5 and the imaginary part decreases by approximately
14
170 fs 385 fs
Figure 5: Transmittance of a probe pulse through a 310 nm film of ITO on glass previouslyirradiated with an ultrafast pump pulse as a function of pump-probe delay. The pump is a1240 nm pulse at an incident angle of 30 degrees.
0.2. Such an index change suggests a transition from metallic (Re[ε] < 0) to dielectric
(Re[ε] > 0) behavior in the epsilon-near-zero region, which also explains the large increase
in transmittance in Fig. 5.
ITOAir Glass ITOAir Glass
DielectricMetallic
b) c)a)
Figure 6: a) Change in the effective refractive index of a 310 nm ITO film in the samesimulation as Fig. 5. b) Snapshot of electric field amplitude early in the pulse when the ITOfilm is metallic, and c) later in the pulse when the ITO has become dielectric. The incidentpulse propagates from the vacuum (left) through the ITO film into the glass substrate (right).
We illustrate this further in Fig. 6b and 6c, which shows snapshots of the electric field
amplitude during the simulation of a 150 fs pulse incident on an ITO film on glass. We see
in Fig. 6b that, early in the simulation, a large amount of the incident light is reflected,
as evidenced by the interference patterns, indicating that ITO behaves like a metal. Fig.
6c shows the electric field amplitude later in the same pulse where the ITO layer is hotter
and there is much less reflection (no discernible interference pattern), indicating that ITO is
15

behaving as a dielectric.
All of our results above show that the coupled FDTD-TTM model for ITO agrees re-
markably with experiments. The results of this section further indicates the strength of the
FDTD implementation. Because our modelling is in the time domain, we can track the
nonlinear dynamics as a function of space and time. In the Supplementary Materials (SM),
we present 10 sets of movies showing the evolution of the pump electric field amplitude for
different incident angles, center wavelengths, and intensities. Also included are the corre-
sponding videos of the electronic temperature field evolution. These are briefly discussed in
SI Section 5.
Here we highlight one example set of movies. Movie1 shows the electric field amplitude
evolution of a 250 GW/cm2 intensity pump, centered at 1240 nm, incident at 30 degrees, and
Movie1-T shows the corresponding electronic temperature field evolution. In Movie1, we see
that at low temperatures (before the pump peak), the ITO film exhibits metallic properties
as it reflects much of the incident pulse and absorbs much of the transmitted light, resulting
in an evanescent wave in the ITO layer. Indeed, the angle of transmission in the ITO is
small due to the low refractive index. As the pulse grows in intensity (and Te increases), we
see the skin depth of the ITO increase (Im(∆n)<0), the angle of transmission in the ITO
increase (Re(∆n)>0), and a corresponding increase in transmission into the glass substrate.
At this point ITO is behaving like a dielectric. Finally, near the end of the pulse, we see the
interference pattern in vacuum diminish significantly due to the decreased reflectance.
5. Nonlinear response of a plasmonic metasurface on
ITO
In the previous sections, we refined and validated our model using experimental measure-
ments published in Ref. [14] using both spectral and time domain results. It was found
16

that the pump’s wavelength and angle of incidence have a strong effect on the magnitude of
the refractive index change. Intuitively, one might suppose that the strength of the nonlin-
ear optical response can be further increased by enhancing the near fields within ITO films
by including nanostructures. Plasmonic nanoparticles have been used to enhance optical
processes of all sorts, including, nonlinear optical effects45. Since our model is built into
FDTD, we are not restricted to simulations of simple planar geometries, but we can simulate
the refractive index shift in ITO in the presence of near-by plasmonic particles, where the
3D spatial structure and dispersion of the plasmonic material are taken into account self
consistently.
As an illustrative example, we consider a plasmonic metasurface consisting of a periodic
array of gold rectangular nanoparticles on a 310 nm thick layer of ITO on glass. The
nanoparticle has a length of 500 nm, width of 300 nm, and thickness of 40 nm, and is
centered in a 600 nm × 600 nm unit cell. This geometry was chosen because its has a very
large absorption peak (A ≈ 0.9) within the frequency range of interest; this peak occurs
at λpeak = 1350 nm. We use Bloch boundary conditions in our FDTD simulations, where
a plane wave that is linearly polarized along the length of the particle, is incident on an
infinitely periodic metasurface at an angle of 30 degrees. As in SI Section 4, we use a 2
GW/cm2, pump pulse which allows for ease of comparison to our results there.
We calculate the instantaneous effective index change of the metasurface (using effective
medium theory44 as described above) as a function of time, which is plotted in Fig. 7a. We
find that the maximum of ∆n is now five times larger than for the bare ITO thin film (SI
Section 4, Fig. 11b) irradiated at the same incident pump intensity. In Fig. 7b we plot
the change in reflectance and transmittance, ∆R and ∆T , respectively. We find that the
transmittance decreases during the pulse irradiation (∆T < 0), in contrast to the increase
that was demonstrated for bare ITO thin films (∆T > 0) in the previous section (Fig. 5)
and SI Section 4 (Fig. 11c). In addition to this change in sign, the magnitude of ∆T is also
17

two times larger than that seen in Fig. 11c in SI Section 4. The large enhancement in ∆T
is due to the plasmonic particle, which creates electromagnetic hotspots when excited near
the localized surface plasmon resonance. As their names imply, these hotspots are regions
of enhanced Joule heating leading to a stronger nonlinearity being induced in the ITO film.
By comparing Fig. 7b to Fig. 11c we also observe a longer transient nonlinear response
when the plasmonic particle is present. This occurs because the decay time of the plasmon
resonance is longer than the decay time of the ITO nonlinear response.
Here, it is worth noting that the effective medium theory does not just output an effective
refractive index n =√εµ, but also an effective admittance Y =
√ε/µ. Typically, for
sufficiently small feature sizes, we expect these values to be equal as long as the material
is non-magnetic (µ = 1). We have verified that this indeed remains true for bare ITO
films considered in the previous sections. However, this is not the case for the metasurface
investigated in this section, where applying effective medium theory suggests an effective
magnetic response of the metasurface. In fact, we can see this effect in Fig. 7 where we
see an increased imaginary component of the effective index (Fig. 7a), however, there is a
decrease in the absorptance (Fig. 7b), which can only occur if µ 6= 1. This effective magnetic
behaviour is due to complex response of the plasmonic particle, and will change the ENZ
behaviour, because we must take µ into account. This will be investigated in future work.
Previous experimental work has investigated ultrafast irradiation of ITO-based plasmonic
metasurfaces15. There, it was also found that the transmittance decreases during pulse
irradiation for the metasurface but increases (with a smaller line-width) for a bare ITO film.
This further validates the results of this (and the previous) section. The magnitudes of ∆T
and ∆n are not directly comparable between our work and that of Ref. [15], as a different
ITO sample was used there, with different optical properties and a different pump intensity.
However, the enhancement of ∆n when a plasmonic particle is present versus a bare ITO
film is comparable.
18

a) b) c)
Figure 7: a) Enhanced change in refractive index and b) change in reflectance and trans-mittance of an ITO-based plasmonic metasurface. c) 3-D time-domain snapshot of thetemperature field in the ITO film at the peak of the laser pulse, with the plasmonic particleshown on top.
We also present movies showing the time evolution of the electric field amplitude and
temperature field of the plasmonic metasurface on ITO while being irradiated by an oblique
incidence pump pulse. In Movie11, we see the incident pulse exciting the plasmonic particle
and creating electromagnetic hotspots at the particle edges. These result in electronic tem-
perature hotspots as shown in Movie11-T and Fig. 7c. As the pump pulse peaks, we start
to see strong interference between the incident and reflected pulse in the vacuum region due
to the increased reflectance (as also indictated by the ∆R plot in Fig. 7b). There is very
little decrease in the transmittance to balance the reflectance (∆T plot in Fig. 7b) which,
in Movie11, is evident by the increased penetration of the field into the ITO film, suggesting
an increased skin depth during intense field irradiation.
Conclusion
We introduced a self-consistent time-domain numerical model for the intensity-dependent
refractive index of TCO-based ENZ materials. The nonlinear optical response of TCOs
is described by a Drude-like permittivity where the plasma frequency is dependent upon
electron temperature. A two-temperature model describing the electron temperature distri-
bution in time and space as induced by irradiation with an ultrafast intense laser pulse was
implemented directly into a three dimensional finite-difference time-domain electrodynamics
solver. Our self-consistent numerical method captures the full nonlinear spatio-temporal dy-
19

namics in TCO-based ENZ materials, including those within complex geometries containing,
for example, plasmonic nanostructures in close proximity. We validated our implementation
via comparisons with experimental results for a bare ITO film, where we obtained quanti-
tative agreement, as well as an ITO film decorated with plasmonic nanoantennas. We also
demonstrated the use of the model for optimizing the strength of the optical nonlinearity
over pump-pulse parameters. This approach to modeling the nonlinear optical response of
TCO-based ENZ materials will be instrumental for understanding the complex dynamics of
hot-electron nonlinearity of TCOs and for designing sophisticated nonlinear nanophotonic
devices with femtosecond-scale response times.
20

Supplemental Information
Section 1: Temperature dependence of plasma frequency
In this section, we derive a model for the temperature dependence of the plasma frequency.
We begin with the Boltzmann transport equation, which describes the time evolution of
the conduction band non-equilibrium distribution function f(r,k, t), where r and k are the
three-dimensional position vector and wave-vector respectively, and where f(r,k, t)drdk/4π3
is the number of conduction electrons in phase space from r to r + dr and k to k + dk. As
we will see, our final result is equivalent to that given by Ref. [27].
In equilibrium, f(r,k, t) is given by the Fermi-Dirac distribution fFD and thus deviations
from equilibrium are quantified by the athermal distribution
δf(r,k, t) = f(r,k, t)− fFD, (11)
whose dynamics in an external force F are described by the semi-classical Boltzmann trans-
port equation46
∂δf
∂t+ vk ·
∂δf
∂x+ F · 1
h
∂f
∂k=(∂δf∂t
)collisions
, (12)
where vk = h−1∂E/∂k is the group velocity of a Bloch electron in the conduction band
(where E is its energy), and where the last term describes the effects of electronic collisions.
For the latter, we use the relaxation-time approximation
(∂δf∂t
)collisions
= −δfτ, (13)
where τ is the inverse scattering rate. To simplify the equation further, we will assume that
∂f/∂k = ∂fFD/∂k in the third term on the left hand side of Eq. 12.
We take the external force to be F = −eE , where E is the local electric field. Since the
optical wavelength is much larger than the lattice spacing, we disregard the spatial variation
21

of δf . Further, using, ∂fFD
∂k= hvk
∂fFD
∂E, and setting γ = 1/τ , Eq. 12 becomes
∂δf
∂t− eE · vk
∂fFD∂E
= −γδf, (14)
which in the frequency domain gives
(−iω + γ)δf = eE · vk∂fFD∂E
. (15)
We calculate the current density J by integrating evK over all k states weighted by
δf(k)/(4π3)46
J = − e
4π3
∫d3k δf(k)vk = − e2
4π3
∫d3k vk
(E · vk
∂fFD∂E
)(−iω + γ)−1, (16)
from which we identify the conductivity tensor
σ = − 1
−iω + γ
e2
4π3
∫d3k vkvk
∂fFD∂E
, (17)
where vkvk is a dyadic tensor defined by (vkvk)ij = (vk)i(vk)j, where i and j refer to
Cartesian coordinates.
Under the assumption of an isotropic band structure, vk = h−1∇kE is parallel to k
and therefore, in spherical coordinates vk = (sin θ cosφ, sin θ sinφ, cos θ)vk, where vk is the
magnitude of the velocity vector, thus giving
vkvk =
sin2 θ cos2 φ sin2 θ cosφ sinφ sin θ cos θ sinφ
sin2 θ cosφ sinφ sin2 θ sin2 φ sin θ cos θ sinφ
sin θ cos θ cosφ sin θ cos θ sinφ cos2 θ
v2k = M(θ, φ)v2k. (18)
Rewriting the integral in Eq. 17 in spherical coordinates, we obtain
22

σ = − 1
−iω + γ
e2
4π3
∫ 2π
0
∫ π
0
M(θ, φ) sin θdθdφ
∫dk k2v2k
∂fFD∂E
. (19)
By integrating over θ and φ, we find that the non-diagonal terms vanish, and the diagonal
terms are all equal to 43π, thus confirming that the conductivity is isotropic, given by
σ = − 1
−iω + γ
e2
3π2
∫dk k2v2k
∂fFD∂E
. (20)
Now we use Eq. 2 from which we can determine expressions for k and vk. Changing the
integration variable from momentum magnitude k to energy E, using Eq. 2 in the main
text, we obtain
σ = − 1
−iω + γ
e2
3m∗0π2
(2m∗0h2
)3/2 ∫dE (E + CE)3/2(1 + 2EC)−1
∂fFD∂E
. (21)
Comparing Eq. 21 to the form of the Drude model conductivity
σ = −ε0ω
2p
−iω + γ, (22)
we find that the plasma frequency is then, as given by Eq. 3 in the main text,
ω2p =
e2
3m∗0ε0π2
(2m∗0h2
)3/2 ∫dE (E + CE)3/2(1 + 2EC)−1
∂fFD∂E
. (23)
Eq. 23 is also derived in Ref. [27] using a different method, but with the same conclusion.
When C = 0, this expression becomes the traditional expression for the plasma frequency,
ω2p =
e2n
ε0m∗0. (24)
For ITO the nonparabolicity factor was found to be C = 0.4191 (eV -1)26 and the effective
mass was found to be m∗0 = 0.4me,29 where me is the free-electron mass.
23

Section 2: Validation for Neglecting the Athermal Electron Distri-
bution
In this section, we justify why the athermal electrons do not need to be accounted for
explicitly in the two-temperature model for ITO (Eq. 5) that we introduced in the main
text. Our theoretical analysis follows Ref. [47], and we find that since the Fermi energy of
ITO and the photon energy of our laser pulses are approximately the same, EF ≈ hωpulse ≈ 1
eV, the thermalization time is negligible compared to the pump pulse duration, and therefore
we can neglect the athermal electrons in our model. This is not the case for materials with
higher Fermi energies, like gold, to which the extended TTM is commonly applied (for
example see Refs. [35, 36, 47]).
Recall that the electron distribution function can be written as a sum of the thermal
fFD(Te, t) and athermal δf(E, t) components as in Eq. 11. The athermal electrons are the
result of the ultrafast pulse perturbing the conduction electrons out of thermal equilibrium.
As the pulse irradiates the sample, the electronic distribution deviates further from a thermal
distribution. The electrons eventually become thermalized via collisions resulting in a Fermi-
Dirac distribution at an increased temperature. The thermalization process is thus described
by δf(E, t)→ 0 and fFD(Te,0, t = 0)→ fFD(Te,1 > Te,0, t).
We begin by assuming that the lifetime of an excited electron (of energy E) in a degenerate
system due to both elastic and inelastic electron-electron collisions is given by Fermi-liquid
theory under the random-phase approximation as47,48
τ =128
π2√
3ωp
( EFE − EF
)2≈ 7.5
ωp
( EFE − EF
)2, (25)
where ωp is the plasma frequency. In the relaxation time approximation, we have
∂δf
∂t≈ δf
τ≈ δf
ωp7.5
(E − EF )2
E2F
, (26)
24

and therefore
δf(E, t) = δf(E, t = 0) exp[− ωp
7.5
(E − EF )2
E2F
t], (27)
where δf(E, t = 0) is the initial athermal distribution. Here we assume that the perturbation
δf(E, t = 0) is instantaneous which, physically, is not the case. The perturbation will occur
gradually as the pulse propagates through the sample. However, this assumption should not
affect the conclusion of the following analysis, as we are only interested in how long it takes
for conduction electrons to thermalize (on average).
The initial distribution is described by the simplified model described in the main text (see
discussion accompanying Fig 2), where electrons below the Fermi energy (EF−Epump → EF )
are excited above the Fermi energy (EF → EF + Epump) and is thus given by36
δf(E, t = 0) = A(fFD(E − Epump)[1− fFD(E)]− fFD(E)[1− fFD(E + Epump)]), (28)
where A is a constant amplitude which depends on the optical fluence of the pump pulse, and
where we use Te,0 = 300 K for the evaluation of fFD(E) which, as we will see, gives an upper
bound for the athermal decay time. This function is plotted in Fig. 8 for EF = Epump = 1.0
eV and A = 1.0. We also plot fFD + δf(t = 0) in Fig. 2b of the main text.
The energy density stored in the initial athermal distribution is given by
U =
∫ ∞0
D(E)δf(E, t = 0)E dE, (29)
where D(E) is the density of states, which for non-parabolic bands can be derived using Eq.
2, and is given by29
D(E) =1
2π2
(2m∗0h2
)3/2(E + CE2)1/2(1 + 2CE). (30)
25

1 0 1 2 3Energy (eV)
1
0
1
f(t=
0)Figure 8: Initial athermal electron distribution as a function of energy (above conductionband minimum) given by Eq. 28.
Energy lost from the athermal electrons will be passed primarily to the thermal electron
subsystem with (time-dependent) temperature Te and therefore we write Eq. 5a of the main
text as
Ce∂Te∂t
= −G(Te − Tl) +∂U
∂t, (31)
where the last term is the energy source of the thermalized electrons which will henceforth
be denoted by
S(t) =∂U
∂t=
∂
∂t
∫ ∞0
D(E)δf(E, t = 0)E dE. (32)
We numerically integrate Eq. 32 (using Eq. 28), which we plot in Fig. 9 where the blue
line is the numerical integration, and the yellow line is an exponential fit with decay constant
t0 = 4.2 fs. This means that the athermal electrons decay with an effective decay time of
approximately 4 fs and therefore the characteristic time of this process is negligible when
compared to pulse duration (on the order of 100 fs).
As the thermalized electronic temperature Te increases, the thermalization time decreases
even further. This is because there are more available high-energy states into which the
athermal electrons can thermalize. In fact, for temperatures in the thousands of Kelvins,
the thermalization time becomes sub-femtosecond.
26

0 10 20 30 40 50Time (fs)
0
1
2
S(t)
S(t)Exp[ t/t0]
Figure 9: Athermal electron energy density source function S(t) for ITO. The blue line isthe numerical integration of Eq. 32 and the yellow line is an exponential fit with t0 = 4.2 fs.
For reference, we repeat this calculation for gold with a room temperature Fermi energy
of 5.53 eV and a plasma frequency of ωp ≈ 1.3× 10¹⁶ rad/s using the same pulse energy of
1 eV. S(t), for this case, is plotted in Fig 10 (blue) along with an exponential fit (yellow).
Here we find the decay constant of the exponential fit to be t0=30fs, which is comparable to
typical ultrafast pulse widths of interest. Therefore, for gold (and indeed any other materials
with EF >> Epump), the athermal electron distribution must be considered.
0 50 100 150 200 250Time (fs)
0
20
40
60
S(t)
S(t)Exp[ t/t0]
Figure 10: Athermal electron energy density source function S(t) for gold. The blue line isthe numerical integration of Eq. 32 and the yellow line is an exponential fit with t0 = 30 fs.
27

Section 3: Temperature Dependent Parameters of the Two Tem-
perature Model
In this section we give the formulas used for calculating the temperature-dependent pa-
rameters used in the two-temperature model Eqs. 5, including the heat capacities and the
electron-phonon coupling coefficient.
The electron heat capacity Ce is calculated using49
Ce(Te) =
∫ ∞0
∂fFD(E, µ, Te)
∂TeD(E)E dE, (33)
where D(E) is the density of states given in Eq. 30, and µ is the chemical potential (that
will be discussed later). The lattice heat capacity is assumed constant at Cl = 2.54 × 10⁶
Jm-3K-1 due to the small change in lattice temperature during the simulation.15
The electron-phonon coupling coefficient is calculated using15,50
gep(Te) =AepπhkBD(EF )
∫ ∞−∞
D2(E)∂fFD(E, µ, Te)
∂TedE, (34)
where Aep is the product of the electron-phonon mass enhancement parameter and the second
moment of the phonon spectrum. As with Ref. [15], we take this to be a free parameter
with Aep = 5.25× 10⁻⁴ eV2.
In the above formulas, we specify the dependence of the Fermi-Dirac distribution on the
chemical potential µ, which is also a temperature-dependent quantity. Numerically, its value
can be extracted using the fact that the conduction band electron density is independent of
temperature (in the absence of interband transitions), i.e., n(Te) = n(Te = 0) with
n(Te) =
∫ ∞0
fFD(E, Te)D(E) dE, (35)
and
28

n(Te = 0) =
∫ EF
0
D(E) dE, (36)
where EF is the Fermi energy (EF ≈ 1 eV for ITO). Thus we extract µ(Te) by minimizing
the function |n(µ(Te)
)− n(Te = 0)| using a minimization algorithm.
Eqs. 33, 34, and 23 can be integrated numerically. For our application, we fit these
functions of Te to fifth-order, single-variable polynomials and use those in the TTM-FDTD
code.
Section 4: Optimizing pump parameters for maximum index change
The main text was dedicated to validating and refining our hybrid TTM-FDTD approach.
In doing so, we found that the properties of the incident excitation have a large effect on the
response of ITO, a fact that is not necessarily surprising, but one that can be harnessed. In
this section we use a Nelder-Mead optimizer to find the maximum change in refractive index,
max[∆n(r, t)]a , using three of the pump’s parameters: incident angle, central wavelength,
and linear chirp parameter. Through previous trials, we find that by increasing the pulse
width and laser intensity, we also increase the nonlinearity since this results in a larger energy
density being deposited into the ITO. We therefore keep these values constant with a peak
intensity of Ipump = 2 GW/cm2 and a full-width at half-maximum pulse width of τpump =
150 fs.
The optimization results are found in Fig. 11a, where the main plot shows the evolution
of max[∆n] as the optimization progresses, and the insets show the progression of the wave-
length (red line) and angle (green line). The optimization algorithm was run several times
with different initial conditions so we are confident that we have found a global maximum.
We find that the maximum change in the refractive index is on the order of 0.02 and occurs
aNote that ∆n presented in Fig. 11a and n2 presented in Fig. 3 of the main text are different values.The nonlinear refractive index n2 is a space and time average of ∆n and is normalized by the intensity ofthe pump in the ITO layer, whereas ∆n(r, t) is the instantaneous change of the refractive index.
29

when λ0 = 1228 nm, θinc = 35 degrees, and with negligible chirp (not shown). We found
that the chirp of the pulse had very little effect on the nonlinearity.
a) b) c)
Figure 11: a) Optimization of refractive index change by tuning pump pulse wavelength andincident angle using Nelder-Mead. The horizontal axis is the optimization iteration, andthe vertical axis is the maximum change in the refractive index. The insets show how thecentral wavelength of the pump pulse and its angle of incidence (with respect to the interfacenormal) evolve during the optimization process. b) Complex refractive index change and c)reflectance and transmittance change as a function of time for the optimized pump pulse.
0 25 50 75 100
1240
1260
1280
1300
1320
1340
1360
Optim
al c
ente
r wav
elen
gth
(nm
)
0 25 50 75 100
28
30
32
34
36
Optim
al in
ciden
t ang
le (d
egre
es)
0 25 50 75 100
0.1
0.2
0.3
0.4
0.5
0.6
0.7
Max
imum
n(
r,t)
Peak Electric Field Intensity (GW/cm2)b)a) c)
Figure 12: The a) center wavelength, b) incident angle and c) resultant change in therefractive index of the optimized pump pulses found via Nelder Mead optimization, plottedhere as a function of peak electric field intensity of the pulse. The pulses were modulatedGaussians with a pulse width of 150 fs.
The results in Fig. 11b shows the time dependence of the optical response of the ITO
film. We see that the real part of the refractive index increases and the imaginary part
decreases by approximately 0.02. In Fig. 11c we plot the corresponding change in reflectance
and transmittance, ∆R and ∆T , respectively, as functions of time where we see that the
transmittance increases during the pulse irradiation. This is not surprising as it is expected
30

there would be less overall absorption in the ITO layer.
We repeated this optimization for higher pulse intensities (up to 110 GW/cm2). The
results are summarized in Fig. 12, where we show (a) the optimal central wavelength, (b)
incident angle, and (c) the maximum of ∆n as functions of pump intensity. As expected, we
see an increase in the maximum of ∆n with increasing intensity. We also see that the optimal
incident angle remains relatively constant with a slight decrease with increasing intensity.
Interestingly, we see an increase in the optimal wavelength with increasing intensity, which
can be easily explained. As shown in Fig. 1 of the main text, as the temperature is increased,
the ENZ wavelength red-shifts. Therefore, in order for the pump pulse to remain in the ENZ
spectral range, and thus to maximize the nonlinearity, we must tune our pulse to higher
wavelengths for increased intensities.
Section 5: Time-domain movies
In Section 4 of the main text, we discuss the time-domain results of our model, and we
introduce movies that can be found in the Supplementary Materials. We describe Movie1
and Movie1-T in detail in Section 4, and we will briefly describe the others here.
Movie2, Movie3, and Movie4 are also for a 1240 nm pulse, incident at 30 degrees, for
intensities of 150, 50, and 10 GW/cm2, respectively. In Movie2 and Movie3, we see the
aforementioned decreasing skin depth and change in transmission angle (in the ITO layer),
however the reflectance remains high enough that the interference pattern is observed long
after the pulse peak. In Movie4 there is no perceivable change in the optical response due
to the low pump intensity.
Movie5 to Movie8 have the same intensity and incident angle as Movie1, but with central
wavelengths of 1160, 1200, 1280, and 1320 nm, respectively. We see the same effects as
mentioned previously (angle shift and change in skin depth), however, we observe that the
initial transmission angles are all different, which is because the initial permitivities are all
31

different for the different wavelengths (as illustrated in Fig. 1 of the main text). From
these videos, we cannot observe a perceptible difference in the strength of the nonlinearity,
however, we know from spectral results (see Fig. 3 of the main text) that they do exist.
Finally, Movie9 and Movie10 have the same intensity and center wavelength as Movie1
but with incident angles of 0 and 60 degrees, respectively. In Movie9, we see negligible
change in the optical response as expected from Fig. 3 of the main text (for 0 degrees). In
Movie10, the reflectance is strong throughout the simulation due to the large incident angle.
However a perceptible shift in the transmitted angle in the ITO is visible.
Acknowledgement
The authors would like to thank Compute Canada and Scinet for computational resources.
J.B. and L.R. acknowledge the Natural Sciences and Engineering Research Council (NSERC)
Vanier Canada Graduate Scholarships program and the Canada Research Chairs program for
financial support. I.D.L., A.P.C. and L.C.H acknowledge financial support from CONACyT
(Ciencia Basica) grant no. 286150. I.D.L. acknowledges the support of the Federico Baur En-
dowed Chair in Nanotechnology. A.C.L. acknowledges the Bundesministerium fur Buldung
und Furschung (German Federal Ministry of Education and Research) under the Tenure-
Track Program, and the Deutsche Forschungsgemeinschaft (DFG, German Research Foun-
dation) under Germany’s Excellence Strategy within the Cluster of Excellence PhoenixD
(EXC 2122, Project ID390833453). The authors also thank the Max Planck Institute for the
Science of Light for enabling this collaborative effort, through funding the travel of photonics
researchers and their annual meeting.
32

Supporting Information Available
A supplemental information section is included with this paper which includes extra details
supporting the main text. Movie files of our simulations are also included that show how
the electric field amplitude and temperature fields evolve in time.
References
(1) Boyd, R. W. Nonlinear optics, 4th ed.; Academic Press is an imprint of Elsevier: San
Diego, 2019.
(2) Cotter, D.; Manning, R. J.; Blow, K. J.; Ellis, A. D.; Kelly, A. E.; Nesset, D.;
Phillips, I. D.; Poustie, A. J.; Rogers, D. C. Nonlinear optics for high-speed digital
information processing. Science 1999, 286, 1523–1528.
(3) Guo, Q.; Cui, Y.; Yao, Y.; Ye, Y.; Yang, Y.; Liu, X.; Zhang, S.; Liu, X.; Qiu, J.;
Hosono, H. A Solution-Processed Ultrafast Optical Switch Based on a Nanostructured
Epsilon-Near-Zero Medium. Advanced Materials 2017, 29, 1–7.
(4) Jiang, X.; Lu, H.; Li, Q.; Zhou, H.; Zhang, S.; Zhang, H. Epsilon-near-zero medium
for optical switches in a monolithic waveguide chip at 1.9 µm. Nanophotonics 2018, 7,
1835–1843.
(5) Daghooghi, T.; Soroosh, M.; Ansari-Asl, K. Ultra-fast all-optical decoder based on
nonlinear photonic crystal ring resonators. Applied Optics 2018, 57, 2250.
(6) Shaltout, A. M.; Shalaev, V. M.; Brongersma, M. L. Spatiotemporal light control with
active metasurfaces. Science 2019, 364, eaat3100.
(7) Leuthold, J.; Koos, C.; Freude, W. Nonlinear silicon photonics. Nature Photonics 2010,
4, 535–544.
33

(8) M. Kauranen, A. V. Z. Nonlinear plasmonics. Nature Photonics 2012, 6, 5–7.
(9) Li, G.; Zhang, S.; Zentgraf, T. Nonlinear photonic metasurfaces. Nature Reviews Ma-
terials 2017, 2, 1–14.
(10) Naik, V. G.; Shalaev, V. M.; Boltasseva, A. Alternative plasmonic materials: Beyond
gold and silver. Advanced Materials 2013, 25, 3264–3294.
(11) Reshef, O.; De Leon, I.; Alam, M. Z.; Boyd, R. W. Nonlinear optical effects in epsilon-
near-zero media. Nature Reviews Materials 2019,
(12) Kinsey, N.; Khurgin, J. Nonlinear epsilon-near-zero materials explained: opinion. Op-
tical Materials Express 2019, 9, 2793.
(13) Kinsey, N.; DeVault, C.; Boltasseva, A.; Shalaev, V. M. Near-zero-index materials for
photonics. Nature Reviews Materials 2019,
(14) Alam, M. Z.; De Leon, I.; Boyd, R. W. Large optical nonlinearity of indium tin oxide
in its epsilon-near-zero region. Science 2016, 352, 795–797.
(15) Alam, M. Z.; Schulz, S. A.; Upham, J.; De Leon, I.; Boyd, R. W. Large optical non-
linearity of nanoantennas coupled to an epsilon-near-zero material. Nature Photonics
2018, 12, 79–83.
(16) Lee, Y. U. et al. Strong Nonlinear Optical Response in the Visible Spectral Range with
Epsilon-Near-Zero Organic Thin Films. Advanced Optical Materials 2018, 6, 1–12.
(17) Caspani, L.; Kaipurath, R. P.; Clerici, M.; Ferrera, M.; Roger, T.; Kim, J.; Kinsey, N.;
Pietrzyk, M.; Di Falco, A.; Shalaev, V. M.; Boltasseva, A.; Faccio, D. Enhanced Non-
linear Refractive Index in ε-Near-Zero Materials. Physical Review Letters 2016, 116,
1–5.
34

(18) Carnemolla, E. G.; Caspani, L.; DeVault, C.; Clerici, M.; Vezzoli, S.; Bruno, V.; Sha-
laev, V. M.; Faccio, D.; Boltasseva, A.; Ferrera, M. Degenerate optical nonlinear en-
hancement in epsilon-near-zero transparent conducting oxides. Optical Materials Ex-
press 2018, 8, 3392.
(19) Kinsey, N.; DeVault, C.; Kim, J.; Ferrera, M.; Shalaev, V. M.; Boltasseva, A. Epsilon-
near-zero Al-doped ZnO for ultrafast switching at telecom wavelengths. Optica 2015,
2, 616.
(20) Luk, T. S.; de Ceglia, D.; Liu, S.; Keeler, G. A.; Prasankumar, R. P.; Vincenti, M. A.;
Scalora, M.; Sinclair, M. B.; Campione, S. Enhanced third harmonic generation from the
epsilon-near-zero modes of ultrathin films. Applied Physics Letters 2015, 106, 151103.
(21) Capretti, A.; Wang, Y.; Engheta, N.; Negro, L. D. Enhanced third-harmonic generation
in Si-compatible epsilon-near-zero indium tin oxide nanolayers. Opt. Lett. 2015, 40,
1500–1503.
(22) Capretti, A.; Wang, Y.; Engheta, N.; Dal Negro, L. Comparative Study of Second-
Harmonic Generation from Epsilon-Near-Zero Indium Tin Oxide and Titanium Nitride
Nanolayers Excited in the Near-Infrared Spectral Range. ACS Photonics 2015, 2, 1584–
1591.
(23) Vincenti, M. A.; Kamandi, M.; de Ceglia, D.; Guclu, C.; Scalora, M.; Capolino, F.
Second-harmonic generation in longitudinal epsilon-near-zero materials. Phys. Rev. B
2017, 96, 45438.
(24) Noginov, M. A.; Gu, L.; Livenere, J.; Zhu, G.; Pradhan, A. K.; Mundle, R.; Ba-
houra, M.; Barnakov, Y. A.; Podolskiy, V. A. Transparent conductive oxides: Plas-
monic materials for telecom wavelengths. Applied Physics Letters 2011, 99, 12–
15file:///D:/adria/Desktop/Paper work/Reviews/N.
35

(25) Babicheva, V. E.; Boltasseva, A.; Lavrinenko, V. A. Transparent conducting oxides for
electro-optical plasmonic modulators. Nanophotonics 2015, 4, 165–185.
(26) Liu, X.; Park, J.; Kang, J.-H.; Yuan, H.; Cui, Y.; Hwang, H. Y.; Brongersma, M. L.
Quantification and impact of nonparabolicity of the conduction band of indium tin
oxide on its plasmonic properties. Applied Physics Letters 2014, 105, 181117.
(27) Guo, P.; Schaller, R. D.; Ketterson, J. B.; Chang, R. P. Ultrafast switching of tunable
infrared plasmons in indium tin oxide nanorod arrays with large absolute amplitude.
Nature Photonics 2016, 10, 267–273.
(28) Guo, P.; Schaller, R. D.; Ocola, L. E.; Diroll, B. T.; Ketterson, J. B.; Chang, R. P.
Large optical nonlinearity of ITO nanorods for sub-picosecond all-optical modulation
of the full-visible spectrum. Nature Communications 2016, 7, 1–10.
(29) Wang, H.; Du, K.; Jiang, C.; Yang, Z.; Ren, L.; Zhang, W.; Chua, S. J.; Mei, T.
Extended Drude Model for Intraband-Transition-Induced Optical Nonlinearity. Physical
Review Applied 2019, 11, 1.
(30) Mei, T.; Wang, H.; Du, K.; Dai, X.; Zhang, W.; Liu, R.; Chua, S. J. Role of hot electron
scattering in epsilon-near-zero optical nonlinearity. Nanophotonics 2020, 9, 4287–4293.
(31) Secondo, R.; Khurgin, J.; Kinsey, N. Absorptive loss and band non-parabolicity as a
physical origin of large nonlinearity in epsilon-near-zero materials. arXiv 2020, 10,
22–25.
(32) Rodrıguez-Sune, L.; Scalora, M.; Johnson, A. S.; Cojocaru, C.; Akozbek, N.; Cop-
pens, Z. J.; Perez-Salinas, D.; Wall, S.; Trull, J. Study of second and third harmonic
generation from an indium tin oxide nanolayer: Influence of nonlocal effects and hot
electrons. APL Photonics 2020, 5 .
36

(33) Scalora, M.; Trull, J.; de Ceglia, D.; Vincenti, M. A.; Akozbek, N.; Coppens, Z.;
Rodrıguez-Sune, L.; Cojocaru, C. Electrodynamics of conductive oxides: Intensity-
dependent anisotropy, reconstruction of the effective dielectric constant, and harmonic
generation. Physical Review A 2020, 101, 053828, Publisher: American Physical Soci-
ety.
(34) Pisarkiewicz, T.; Kolodziej, A. Nonparabolicity of the Conduction Band Structure in
Degenerate Tin Dioxide. physica status solidi (b) 1990, 158, K5–K8.
(35) Voisin, C.; Del Fatti, N.; Christofilos, D.; Vallee, F. Ultrafast Electron Dynamics and
Optical Nonlinearities in Metal Nanoparticles. The Journal of Physical Chemistry B
2001, 105, 2264–2280.
(36) Carpene, E. Ultrafast laser irradiation of metals: Beyond the two-temperature model.
Physical Review B 2006, 74, 024301.
(37) Baxter, J.; Lesina, A. C.; Ramunno, L. Parallel FDTD Modeling of Nonlocality in
Plasmonics. IEEE Transactions on Antennas and Propagation 2021, 69, 3982–3994,
Conference Name: IEEE Transactions on Antennas and Propagation.
(38) Bin-Alam, M. S.; Baxter, J.; Awan, K. M.; Kiviniemi, A.; Mamchur, Y.; Lesina, A. C.;
Tsakmakidis, K. L.; Huttunen, M. J.; Ramunno, L.; Dolgaleva, K. Hyperpolarizability
of Plasmonic Meta-Atoms in Metasurfaces. Nano Letters 2021, 21, 51–59, Publisher:
American Chemical Society.
(39) Lesina, A. C.; Vaccari, A.; Berini, P.; Ramunno, L. On the convergence and accuracy
of the FDTD method for nanoplasmonics. Optics Express 2015, 23, 10481–10497.
(40) DeVries, P. L.; Hasbun, J. E.; DeVries, P. L. A first course in computational physics,
2nd ed.; Jones and Bartlett Publishers: Sudbury, Mass, 2011; OCLC: ocn437300527.
37

(41) Zhou, Y.; Alam, M. Z.; Karimi, M.; Upham, J.; Reshef, O.; Liu, C.; Willner, A. E.;
Boyd, R. W. Broadband frequency translation through time refraction in an epsilon-
near-zero material. Nature Communications 2020, 11, 2180, number: 1 publisher: Na-
ture Publishing Group.
(42) Yang, F.; Chen, J.; Qiang, R.; Elsherbeni, A. A simple and efficient FDTD/PBC algo-
rithm for scattering analysis of periodic structures. Radio Science 2007, 42, [Online;
accessed 2018-12-04].
(43) Aminian, A.; Rahmat-Samii, Y. Spectral FDTD: a novel technique for the analysis of
oblique incident plane wave on periodic structures. IEEE Transactions on Antennas
and Propagation 2006, 54, 1818–1825.
(44) Smith, D. R.; Schultz, S.; Markos, P.; Soukoulis, C. M. Determination of effective
permittivity and permeability of metamaterials from reflection and transmission coef-
ficients. Physical Review B 2002, 65, 195104.
(45) Gaponenko, S. V.; Guzatov, D. V. Colloidal Plasmonics for Active Nanophotonics.
Proceedings of the IEEE 2020, 1–17, event: Proceedings of the IEEE.
(46) Ashcroft, N. W.; Mermin, N. D. Solid state physics ; Holt, Rinehart and Winston: New
York, 1976.
(47) Fann, W. S.; Storz, R.; Tom, H. W. K.; Bokor, J. Electron thermalization in gold.
Physical Review B 1992, 46, 13592–13595.
(48) Nozieres, P.; Pines, D. The theory of quantum liquids ; Advanced book classics; Perseus
Books: Cambridge, Mass, 1999.
(49) Kittel, C. Introduction to solid state physics, 8th ed.; Wiley: Hoboken, NJ, 2005.
(50) Lin, Z.; Zhigilei, L. V.; Celli, V. Electron-phonon coupling and electron heat capacity
38

of metals under conditions of strong electron-phonon nonequilibrium. Physical Review
B 2008, 77, 075133.
39