Understanding the Intervention and Implementation Factors ...
126
4 Department of Veterans Affairs Health Services Research & Development Service Evidence-based Synthesis Program Understanding the Intervention and Implementation Factors Associated with Benefits and Harms of Pay for Performance Programs in Healthcare May 2015 Prepared for: Department of Veterans Affairs Veterans Health Administration Quality Enhancement Research Initiative Health Services Research & Development Service Washington, DC 20420 Prepared by: Portland Evidence-based Synthesis Program (ESP) Center Portland VA Medical Center Portland, OR Devan Kansagara, MD, MCR, Director Investigators: Principal Investigator: Karli Kondo, PhD Contributing Investigators: Cheryl Damberg, PhD, MPH Aaron Mendelson, BA Makalapua Motu’apuaka, BS Michele Freeman, MPH Maya O’Neil, PhD Rose Relevo, MLIS, MS Devan Kansagara, MD, MCR
Transcript of Understanding the Intervention and Implementation Factors ...

4
Department of Veterans Affairs
Health Services Research & Development Service Evidence-based Synthesis Program
Understanding the Intervention and Implementation Factors Associated with Benefits and Harms of Pay for Performance Programs in Healthcare
May 2015
Prepared for: Department of Veterans Affairs Veterans Health Administration Quality Enhancement Research Initiative Health Services Research & Development Service Washington, DC 20420
Prepared by: Portland Evidence-based Synthesis Program (ESP) Center Portland VA Medical Center Portland, OR Devan Kansagara, MD, MCR, Director
Investigators: Principal Investigator:
Karli Kondo, PhD
Contributing Investigators: Cheryl Damberg, PhD, MPH Aaron Mendelson, BA Makalapua Motu’apuaka, BS Michele Freeman, MPH Maya O’Neil, PhD Rose Relevo, MLIS, MS Devan Kansagara, MD, MCR
Pay for Performance Programs in Healthcare Evidence-based Synthesis Program
PREFACE Quality Enhancement Research Initiative’s (QUERI) Evidence-based Synthesis Program (ESP) was established to provide timely and accurate syntheses of targeted healthcare topics of particular importance to Veterans Affairs (VA) clinicians, managers and policymakers as they work to improve the health and healthcare of Veterans. The ESP disseminates these reports throughout the VA, and some evidence syntheses inform the clinical guidelines of large professional organizations.
QUERI provides funding for four ESP Centers and each Center has an active university affiliation. The ESP Centers generate evidence syntheses on important clinical practice topics, and these reports help:
· develop clinical policies informed by evidence;· guide the implementation of effective services to improve patient
outcomes and to support VA clinical practice guidelines and performancemeasures; and
· set the direction for future research to address gaps in clinical knowledge.
In 2009, the ESP Coordinating Center was created to expand the capacity of HSR&D Central Office and the four ESP sites by developing and maintaining program processes. In addition, the Center established a Steering Committee comprised of QUERI field-based investigators, VA Patient Care Services, Office of Quality and Performance, and Veterans Integrated Service Networks (VISN) Clinical Management Officers. The Steering Committee provides program oversight, guides strategic planning, coordinates dissemination activities, and develops collaborations with VA leadership to identify new ESP topics of importance to Veterans and the VA healthcare system.
Comments on this evidence report are welcome and can be sent to Nicole Floyd, ESP Coordinating Center Program Manager, at [email protected].
Recommended citation: Kondo K, Damberg C, Mendelson A, Motu’apuaka M, Freeman M, O’Neil M, Relevo R, Kansagara D. Understanding the intervention and implementation factors associated with benefits and harms of pay for performance programs in healthcare. VA-ESP Project #05-225; 2015.
This report is based on research conducted by the Evidence-based Synthesis Program (ESP) Center located at the VA Portland Health Care System, Portland, OR, funded by the Department of Veterans Affairs, Veterans Health Administration, Office of Research and Development, Quality Enhancement Research Initiative. The findings and conclusions in this document are those of the author(s) who are responsible for its contents; the findings and conclusions do not necessarily represent the views of the Department of Veterans Affairs or the United States government. Therefore, no statement in this article should be construed as an official position of the Department of Veterans Affairs. No investigators have any affiliations or financial involvement (eg, employment, consultancies, honoraria, stock ownership or options, expert testimony, grants or patents received or pending, or royalties) that conflict with material presented in the report.
ii

Pay for Performance Programs in Healthcare Evidence-based Synthesis Program
ACKNOWLEDGMENTS The authors would like to thank the Key Informants and Technical Expert Panel for their participation and valued input. In particular we would also like to recognize and thank Laura Damschroder, MS, MPH for her contribution the conceptual framework used in this review.
iii

Pay for Performance Programs in Healthcare Evidence-based Synthesis Program
TABLE OF CONTENTS Preface............................................................................................................................................. ii
Acknowledgments...................................................................................................................... iii Table of Contents ........................................................................................................................... iv
Executive Summary ........................................................................................................................ 1
Introduction ................................................................................................................................. 1
Methods....................................................................................................................................... 1
Results ......................................................................................................................................... 2
Key Question 1: What are the effects of pay for performance programs on patient outcomes and processes of care? ............................................................................................................. 2
Key Question 2: What implementation factors modify the effectiveness of pay for performance?........................................................................................................................... 3
Table 1. Key Question 2 Evidence and Policy Implications by Implementation Framework Category .................................................................................................................................. 4
Key Question 3: What are the positive and negative unintended consequences, associated with pay for performance? ...................................................................................................... 6
Discussion ................................................................................................................................... 7
Recommendations for Future Research .................................................................................. 8
Limitations .............................................................................................................................. 8
Conclusions ............................................................................................................................. 8
Background ................................................................................................................................... 10
Conceptual Framework ................................................................................................................. 11
Figure 1. Technical Expert Panel Framework ...................................................................... 12
Table 1. Examples of Possible Responses ............................................................................ 14
Methods......................................................................................................................................... 15
Topic Development ................................................................................................................... 15
Search Strategy ......................................................................................................................... 15
Study Selection ......................................................................................................................... 16
Data Abstraction ....................................................................................................................... 16
Quality Assessment ................................................................................................................... 16
Data Synthesis and Analysis ..................................................................................................... 16
Summary of RAND’s Findings on Pay for Performance Programs ......................................... 17
Discussions with Key Informants ............................................................................................. 17
Results ........................................................................................................................................... 18
Literature Flow.......................................................................................................................... 18
Figure 2. Literature Flow Diagram ....................................................................................... 19
iv

Pay for Performance Programs in Healthcare Evidence-based Synthesis Program Key Question 1: What are the effects of pay for performance on patient outcomes and processes of care? ..................................................................................................................... 20
Table 2. Number of Studies Summarized by Setting, Outcome, and Source ....................... 20
Process of Care Outcomes .................................................................................................... 20
Ambulatory P4P Programs ................................................................................................... 20
Table 3. KQ1 Processes of Care Ambulatory P4P Programs QOF ...................................... 22
Table 4. KQ1 Processes of Care Ambulatory P4P Programs non-QOF ............................... 26
Hospital P4P Programs ......................................................................................................... 35
Table 5. KQ1 Processes of Care Hospital P4P Programs ..................................................... 36
Patient Outcomes .................................................................................................................. 39
Ambulatory P4P Programs ................................................................................................... 39
Table 6. KQ1 Patient Outcomes Ambulatory P4P Programs QOF ...................................... 41
Table 7. KQ1 Patient Outcomes Ambulatory P4P Programs non-QOF ............................... 45
Hospital P4P Programs ......................................................................................................... 49
Table 8. KQ1 Patient Outcomes Hospital P4P Programs ..................................................... 51
Key Question 2: What are the implementation factors that modify the effectiveness of pay for performance?............................................................................................................................. 53
What implementation factors are associated with changes in processes of care or patient outcomes? ............................................................................................................................. 53
Table 9. KQ2 Implementation Factors Associated with Changes in Processes of Care or Patient Outcomes .................................................................................................................. 56
What implementation factors are associated with changes in provider cognitive and/or behavioral outcomes?............................................................................................................ 69
Table 10. KQ2 Implementation Factors Associated with Changes in Provider Cognitive and/or Behavioral Responses ................................................................................................ 73
Key Question 3: What are the positive and negative unintended consequences, including any effect on health disparities, associated with pay for performance? .......................................... 79
Health Disparities.................................................................................................................. 79
Table 11. KQ3 Health Disparities: Race/Ethnicity ............................................................... 81
Table 12. KQ3 Health Disparities: Socioeconomic Status ................................................... 86
Table 13. KQ3 Health Disparities: Other (Not in Relation to Race/Ethnicity or SES) ........ 92
Other Unintended Consequences .......................................................................................... 97
Table 14. KQ3 Other Unintended Consequences Stratified by Type ................................. 100
Summary and Discussion ............................................................................................................ 110
Summary of Evidence by Key Question ................................................................................. 110
Key Question 1: What are the effects of financial incentive programs on patient outcomes and processes of care? ......................................................................................................... 110
v

Pay for Performance Programs in Healthcare Evidence-based Synthesis Program Key Question 2: What are the implementation factors modify the effectiveness of pay for performance?....................................................................................................................... 110
Table 15. KQ2 Evidence and Policy Implications by Implementation Framework Category............................................................................................................................................. 112
Key Question 3: What are the positive and negative unintended consequences, including any effect on health disparities, associated with pay for performance? ............................. 114
Discussion ............................................................................................................................... 116
References ................................................................................................................................... 120
Appendix A. Technical Expert Panel.......................................................................................... 130
Appendix B. PICOTS Table ....................................................................................................... 131
Appendix C. Search Strategies ................................................................................................... 132
Appendix D. Inclusion and Exclusion Criteria ........................................................................... 134
Appendix E. Studies Summarized in Damberg, 20141 ............................................................... 136Appendix F. Key Informant Discussion Guide, Template ......................................................... 138
Appendix G. Key Informants ...................................................................................................... 139
Appendix H. Peer Review Comments and Responses................................................................ 140
vi

Pay for Performance Programs in Healthcare Evidence-based Synthesis Program
EVIDENCE REPORT BACKGROUND Pay for performance (P4P) refers to the use of financial incentives to stimulate improvements in health care efficiency and quality. P4P belongs to a collection of financing schemes known as alternative payment models (APMs), which are designed to replace fee-for-service (FFS) payment. Whereas FFS payment rewards volume of services, APMs are designed to incentivize better outcomes and value. This is typically achieved through making providers and systems financially vested in patient health status and efficient care delivery. In addition to P4P, other prominent models include bundled payments and medical homes. Although P4P had previously been implemented by private payers on a small scale, there has been an increase in large-scale ambulatory and hospital P4P programs over the last decade in the United States and internationally.
In the early 1990s, the Robert Wood Johnson Foundation funded Rewarding Results, which provided funding to evaluate several large-scale, sustained P4P demonstrations in a handful of markets, including California, Massachusetts, and Rochester, New York. Unfortunately, these evaluations suffered from the lack of a control group, which made it difficult to distinguish P4P effects from those of concurrently implemented initiatives (eg, public reporting of results, use of registries and other electronic monitoring tools).
More recently, the United Kingdom (UK), implemented the Quality Outcomes Framework (QOF), a large-scale ambulatory P4P program which was universally applied to all UK family practices starting in 2004. The QOF was implemented in a single-payer system, with universal electronic medical records (EMRs), and offered large incentives (eg, 35% bonus in addition to a large salary increase). From an evaluation perspective, one of the strengths of the QOF program is the availability of performance data over an extended period prior to the launch of their P4P program, which has allowed evaluators to compare outcome trends before and after the implementation of the P4P program.43 In addition, in the decade since the QOF was introduced the program has undergone a number of changes, including the addition of new measures and removal of others, changes to overall payment size/potential and to minimum and maximum payment thresholds (minimum thresholds are the minimum percentage of targeted patients achieving a measure required to earn an incentive, with maximum thresholds as the required percentage of targeted patients achieving a measure necessary to earn the maximum incentive). A large body of evidence has accumulated, examining not only the effectiveness of the program on targeted measures, but also comparing the effectiveness by socioeconomic status (ie, deprivation), examining issues related to gaming associated with exception reporting (identifying and not being penalized for patients for whom a measure may not apply under certain circumstances such as contraindications or failure to attend a review), and evaluating factors such as the impact of changes to incentivized measures and thresholds, differences in provider group size, and provider characteristics.
In the US, the Centers for Medicare and Medicaid Services (CMS) implemented the Premier Hospital Quality Incentive Demonstration (HQID) in hospital settings and the Physician Group Practice (PGP) demonstration in group practice settings. In both cases, participation was voluntary rather than universally implemented. Of note, CMS began to publicly report the
10
Pay for Performance Programs in Healthcare Evidence-based Synthesis Program
performance of all Inpatient Prospective Payment System hospitals around the time these P4P initiatives began.44
The VHA instituted its performance pay program in 2004 after passage of the VA Heath Care Personnel Enhancement Act. The amount of performance pay awarded to each provider is determined by the degree to which they achieve a set of performance goals which may include measures of care processes (eg, ordering periodic hemoglobin A1c tests in diabetic patients), health outcomes, or fulfillment of work responsibilities (eg, timely completion of training activities). There is also a managerial performance pay program for administrators. The VHA performance pay program allows medical centers and regional networks autonomy in determining the choice of measures that comprise the performance goals for different types of providers. In 2011, approximately 80 percent of VA providers received performance pay at an average of $8,049 per provider.45
In recent years, there have been an increasing number of studies examining the effects of these large-scale and other P4P programs. As experience with and evidence examining these programs have increased, there have been questions raised about the effectiveness of such programs and concerns voiced about the potential for negative unintended consequences.46,47 However, financial incentives programs are complex interventions and vary widely in their implementation, including characteristics of the measures chosen, such as the number of measures incentivized, the type of measure (eg, structural, cost/efficiency, clinical processes, patient/intermediate outcomes, patient experience, etc), as well as features related the incentive structure, such as who the incentive targets (eg, providers, groups, managers, administration), amount, and whether incentives are in the form of rewards (eg, fee differentials, bonuses) or penalties (eg, withholds, repayments to payers), and the frequency of the incentive. Added to the complexity are differences in the contexts in which they are implemented, such as the type of setting (eg, ambulatory settings, hospitals, nursing home, etc), the organizational culture within the setting, and other factors such as patient population. The positive and negative effects associated with any given P4P program likely depends in part on the combination of all of these factors.
The goal of this evidence report is to summarize current evidence examining the effectiveness of financial incentive schemes on processes of care and patient outcomes, as well as the intervention and implementation factors associated with benefits and harms, notably within the VHA and similar large health organizations. A better understanding of the impact of pay for performance schemes aimed at individual providers, managerial staff, and medical practices will guide the VHA in modifying P4P programs to maximize potential benefits and minimize harms.
CONCEPTUAL FRAMEWORK Through an examination of previous conceptual frameworks of financial incentives (see Dudley et al 2004 and Damberg et al 2014), and in consultation with our Technical Expert Panel (TEP), we developed a framework from which to examine P4P.1,48 Our framework is based primarily on the framework developed by Damberg and others; however, we modified it to focus on the relationship between contextual and local implementation features as described by the Consolidated Framework for Implementation Research (CFIR), and providers’ cognitive/affective responses and behaviors (see Figure 1).49
11

Pay for Performance Programs in Healthcare Evidence-based Synthesis Program
Figure 1. Technical Expert Panel Framework
P4P Program Design Features Program Monitoring & Evaluation
Process of Care/ Short-term
Patient Outcomes
Long-term Patient Outcomes
External Factors
Local Implementations
(Processes & Contextual)
Provider Cognitive/ Affective
Responses
Provider Behavioral Response
12

Pay for Performance Programs in Healthcare Evidence-based Synthesis Program
Central to the framework are:
· Program design features – properties of the intervention itself such as the type of qualitymeasure used or the size of the financial incentive.
· Implementation factors – the following factors are hypothesized to be high-priorityconstructs influencing P4P outcomes:
o Implementation Processes – actions taken to implement the P4P program such asplanning, stakeholder engagement, academic detailing, audit and feedback, andwhether the incentive was targeted at the team or individual level.
o Outer Setting – refers to the broader health system context within which anintervention is implemented; the cultural and social norms at the state and federallevel; and characteristics of the patient population.
o Inner Setting – refers to characteristics of the institution or organization itself.Examples include institutional goals and priorities, information technologycapabilities, learning climate, leadership engagement, and support available forimplementation of programs.
o Characteristics of providers.· Provider cognitive and behavioral responses – refers to provider beliefs and attitudes.
Includes cognitive response constructs such as biases, professionalism, heuristics,identification with one’s organization. Also includes behavioral response constructs such asrisk selection, gaming, systems improvement responses.
· Outcomes – includes process of care outcomes such as performance of recommendedscreening or disease monitoring, as well as patient outcomes such as achieving target diseasemanagement goals (eg, blood pressure, cholesterol levels) and health outcomes.
We conceive provider responses from the perspective of a motivational model that describes a reinforcing cycle of constructs (ie, actions, results, evaluations, outcomes, need satisfaction) which create a negative or positive reinforcing cycle to encourage more or less of a chosen action, depending on how each construct is linked to the next.50,51 P4P is a strong driver, and can strengthen positive or entrench negative behaviors, depending on what happens to reinforce or weaken (positively or negatively) the linkages between each “event” in the chain above. See Table 1 for 2 extreme examples of possible responses that serve to highlight how the same financial incentive intervention may play out in different contexts.
13

Pay for Performance Programs in Healthcare Evidence-based Synthesis Program
Table 1. Examples of Possible Responses
“Improvement” Context “Treat to the Numbers” Context Actions Reinforcing linkages between Actions and Results
Background: HbA1c target “relaxed” to 9 to provide the latitude needed to personalize HbA1c goals between 7-9, as specified by VA treatment guidelines. An analysis of patients with uncontrolled glycemia reveals that many patients who should be on insulin are not. Talking with providers reveal that many are hesitant about starting patients on insulin because their patients resist and they are unsure when to start. Better guidance on when and how to start patients on insulin is provided and support by others is provided eg, clinical pharmacist. Positive reinforcing linkage between Action and Results: Provider is given actionable feedback report that lists patients who are candidates for starting on insulin based on criteria developed by a colleague physician. The provider appreciates this information and writes a treatment plan to start a patient on insulin.
Background: Clinical reminder pops up during an encounter with a patient indicating uncontrolled HbA1c at 7.5 instead of the performance target of 7. Provider is concerned that increasing meds will lead to potential harm and patient does not want to take more medications. Negative reinforcing linkage between Action and Results: At first, the provider follows medical judgment (things are not always black and white) even when it does not meet the clinical reminder target and makes no changes in medication. Provider receives “bad boy” letter with this patient listed along with other patients who did not make administrative target of 7. …after receiving multiple letters, eventually bows under pressure from the “dashboard cowboys” who monitor progress toward performance targets and starts to more aggressively intensify medication for this patient and others
Results Reinforcing linkages between Results and Evaluations
Feedback reports of candidate patients who have been started on insulin show trends over time. Also, receives feedback on the HbA1c performance measure.
Provider is pretty sure s/he made the best medical decision when not intensifying medications but reports indicate performance targets were not being met. Provider feels ill-equipped to address supposed “fall out” patients.
Evaluations Reinforcing linkages between Evaluations and Outcomes/ Need Satisfaction
Provider sees that his/her panel of patients are under better control. Performance targets are met as a result of this clinical improvement initiative. Bonuses are received though linkage of this particular initiative’s contribution is unclear because of delays in disbursement and complex and poorly understood criteria. Nonetheless, provider feels satisfaction in job, engaged with organizational goals, and looks for other opportunities to improve clinical care.
Providers say, “we are doing A work, but feel like a failure.” It is unclear how bonuses are tied to meeting the HbA1c target versus many other criteria used to determine bonuses; this disconnect is exacerbated by receiving bonuses months later with no apparent connection with actual work done. Feeling increasingly disengaged and distrustful of non-clinician administrators who “own” performance measures and targets, and as pressure increases to make performance targets that seem at odds with patient needs à creates a “high-stakes” environment which may lead to gaming.
14

Pay for Performance Programs in Healthcare Evidence-based Synthesis Program
METHODS
TOPIC DEVELOPMENT This topic was submitted to the ESP Coordinating Center for development by David Atkins, MD, MPH, Director, Health Services Research and Development in collaboration with Joe Francis, MD, Director, Clinical Analytics and Reporting and Carolyn Clancy, MD, Interim Under Secretary for Health. We also received input from a Technical Expert Panel (TEP; see Appendix A).
The Key Questions, which were developed in concert with the stakeholders, are as follows:
KQ 1: What are the effects of pay for performance programs on patient outcomes and processes of care?
KQ 2: What implementation factors modify the effectiveness of pay for performance?
KQ 3: What are the positive and negative unintended consequences, including any effect on health disparities, associated with pay for performance?
Criteria for population, interventions, comparators, outcomes, timing, and setting were developed in collaboration with our stakeholders and TEP (see Appendix B).
A report on Value-Based Purchasing (VBP) programs conducted by Damberg and colleagues at the RAND Corporation, and commissioned by the Office of the Assistant Secretary for Planning and Evaluation (ASPE) in the Department of Health and Human Services (HHS) was released during the writing of this report.1 The RAND report examined 3 VBP models: pay for performance (P4P), accountable care organization (ACO), and bundled payments. Our report examines only P4P, focuses on large health organizations and other systems similar to the VHA, and includes a summary of the findings related to P4P from the RAND report written in collaboration with the primary author.
SEARCH STRATEGY We based our search on 2 of the P4P search strategies performed for the RAND report,1 and searched PubMed, PsycINFO (Ovid), and CINAHL (EBSCO) for studies published between December 1, 2012 and April 30, 2014 for the primary search, and between June 1, 2007 to April 30, 2014 for the secondary. Our search was limited to peer-reviewed articles involving human subjects published in English language that were not included in either of the previous RAND reports.1,52 We also conducted a grey literature search of Business Economics and Theory (Gale), Business Source Elite (EBSCO), Scopus, Faculty of 1000, Gartner Research, and websites for the RAND Corporation, the Agency for Healthcare Research And Quality (AHRQ), Health Services Research in Progress, Kaiser Permanente’s Center for Health Research, Quest for Quality and Improved Performance (QQUIP), the Campbell Collaboration, National Institute for Health and Care Excellence (NICE), Medical Research Institute, and NIH Reporter. We performed targeted searches of PubMed and Google for the following programs: Quality and Outcomes Framework (QOF), Centers for Medicare and Medicaid Services (CMS) Premier Hospital Quality Initiative Demonstration Project (HQID), CMS Hospital Value Based Purchasing Program, CMS Physician Group Practice Demonstration, Hawaii Medical Service
15

Pay for Performance Programs in Healthcare Evidence-based Synthesis Program
Association (HMSA) P4P Program, Integrated Health Association’s California Pay for Performance Program, Blue Cross Blue Shield of Massachusetts Alternative Quality Contract, and the Massachusetts Medicaid Hospital Based (MassHealth) P4P Program. The search strategy is reported in Appendix C. We obtained additional articles from systematic reviews, reference lists of pertinent studies, reviews, editorials, and by consulting experts. All citations were imported into an electronic database (EndNote X4).
STUDY SELECTION Five investigators trained in the critical analysis of literature independently reviewed titles and abstracts identified from literature searches for relevance to the Key Questions. Two investigators independently assessed each study for inclusion based on the criteria provided in Appendix D. We used a “best evidence” approach to guide study design criteria depending on the question under consideration and the literature available.53 We included direct pay for performance programs targeting healthcare providers at the individual, group, managerial, or institutional level. We excluded studies examining patient-targeted financial incentives, as well as payment models other than direct pay for performance, such as managed care, capitation, bundled payments, and accountable care organizations. Only studies examining systems and patient populations similar to the VHA were included, thus we excluded studies conducted in countries with healthcare systems that differ widely from US or VHA settings (eg, Africa, Philippines), studies that were not conducted in hospital or ambulatory settings (eg, nursing homes), and studies with child patient populations. To assess patient and process outcomes, but not implementation characteristics or unintended consequences, we included only studies with patient populations of greater than 10,000, and studies with a comparison group or longitudinal studies with 3 or more time points reporting trends. Studies with smaller patient samples and pre-post study designs were included to assess implementation characteristics and harms/unintended consequences.54
DATA ABSTRACTION We abstracted data from each included study on study design; sample size; country; relevance to the VHA; program description; incentive structure; target of the incentive (eg, provider, management, administration); comparator; outcome measures; and results. Tables 3-15 report these data. Data were abstracted by one investigator, and reviewed for accuracy by at least one additional investigator.
QUALITY ASSESSMENT We assessed the quality of included studies pertaining to all 3 Key Questions. Due to the variation in study designs and large number of observational studies, we used the Newcastle-Ottawa Quality Assessment Scale to appraise study quality.55 Data related to risk of bias were abstracted by one investigator, and reviewed for accuracy by at least one additional investigator.
DATA SYNTHESIS AND ANALYSIS We qualitatively synthesized the results of included studies. Due to the large number of observational trials and heterogeneity among the studies, meta-analysis was not performed. We constructed evidence tables outlining study characteristics and results, organized by key question, and analyzed individual and program-related study findings to draw conclusions.
16

Pay for Performance Programs in Healthcare Evidence-based Synthesis Program
SUMMARY OF RAND’S FINDINGS ON PAY FOR PERFORMANCE PROGRAMS In March 2014, the RAND Corporation released a review examining Value-Based Purchasing, a component of which examined P4P programs.1 RAND’s review was conducted for the US Department of Health and Human Services and comprehensively examines research related to P4P, particularly in the United States. The RAND report included a total of 103 studies, 48 of which examined ambulatory programs, and 38 examining P4P programs in hospital settings. In collaboration with the primary author, we summarized RAND’s findings related to studies examining P4P programs in populations and settings similar to the VHA. Damberg and others at RAND found that many of the P4P evaluations they examined suffered from methodological problems or represented very short-term tests of P4P, and these studies tended to show positive effects as compared to studies that had strong study designs and were of longer duration. Due to the heterogeneous nature of the studies and programs, synthesizing evidence across studies presented a challenge, as the studies also used different variables of interest, study periods, incentive structure, and analysis designs. In addition, some of the studies were poorly described, making it difficult to understand key aspects of the study, such as the methods used and the duration of the intervention. For the purpose of this report, we limit our summary of RAND’s report to the findings from methodologically strong studies of sustained P4P experiments in ambulatory and hospital settings, examining the effects on (1) clinical quality, (2) health outcomes, and (3) unintended effects (including disparities in care). These studies tended to have multiple years of data, focused on large ongoing national or regional efforts, and used methodologies such as difference-in-differences or instrumental variable models to address confounding that might result from unobserved variable bias. See Appendix E for a list of summarized studies.
DISCUSSIONS WITH KEY INFORMANTS We engaged experienced P4P researchers as key informants (KI) to gain insight into issues related to implementation and unintended consequences (Key Questions 2 and 3). Key informants were identified as having expertise on pay for performance programs in healthcare through a review of relevant literature, and through consultation with our stakeholders and Technical Expert Panel. We developed a general semi-structured discussion guide addressing implementation, unintended consequences, health disparities, recommendations for the improvement of P4P programs, future research needs, and applicability to the VHA (see Appendix F), which was approved and determined to be exempt by the VA Portland Health Care System’s (VAPORHCS) Institutional Review Board. We invited 45 individuals, of which 14 agreed to participate (see Appendix G for a list of key informants).
Key informant interviews were conducted via telephone, and lasted an average of 60 minutes. A minimum of 2 investigators were present, with one investigator dedicated to taking notes. One call was recorded and transcribed at the request of the KI. We individually customized the discussion guide for each participant, and provided the guide prior to the scheduled call.
Five investigators conducted independent inductive open-coding of interview notes. One investigator with qualitative research experience (KK) reviewed investigators’ codes and identified common themes.
17

Pay for Performance Programs in Healthcare Evidence-based Synthesis Program
RESULTS
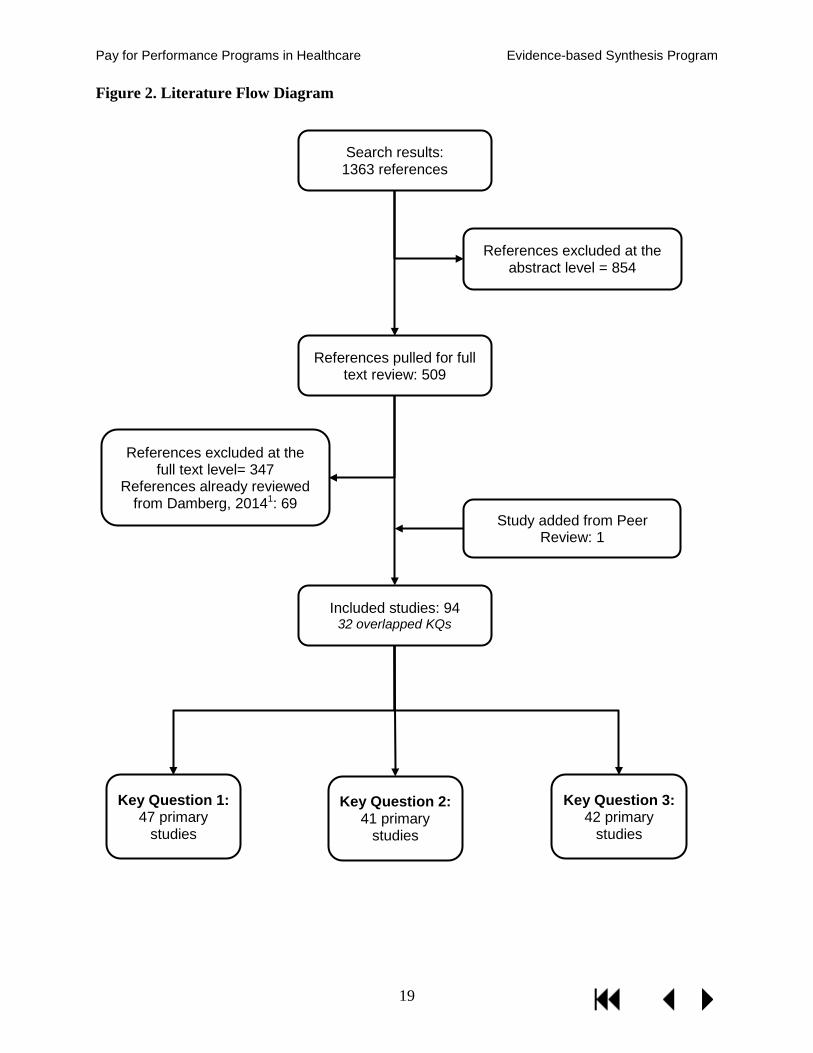
LITERATURE FLOW We reviewed 1,363 titles and abstracts from the electronic search. 509 articles met inclusion criteria. Upon full text review, we excluded 416 articles, for a total of 93 included studies. We added one additional study recommended by a peer reviewer, for a total of 94 included studies. We identified 47 primary studies for Key Question 1, 41 primary studies meeting inclusion criteria for Key Question 2, and 42 primary studies addressing Key Question 3. Thirty-two studies provided information for more than one key question (see Figure 2). Among the included studies, 47 examined the UK’s QOF, 10 examined P4P in Taiwan’s national health system, and 23 were studies conducted in the United States. A total of 78 studies examined P4P in ambulatory settings, with 11 conducted in hospital settings, of which 5 reported results for CMS P4P demonstrations/programs, and 2 were conducted in VHA settings.
18
Pay for Performance Programs in Healthcare Evidence-based Synthesis Program
Figure 2. Literature Flow Diagram
Search results: 1363 references
References pulled for full text review: 509
Included studies: 94 32 overlapped KQs
References excluded at the abstract level = 854
References excluded at the full text level= 347
References already reviewed from Damberg, 20141: 69
Key Question 1: 47 primary
studies
Key Question 2: 41 primary
studies
Key Question 3: 42 primary
studies
Study added from Peer Review: 1
19

Pay for Performance Programs in Healthcare Evidence-based Synthesis Program
KEY QUESTION 1: What are the effects of pay for performance on patient outcomes and processes of care? Forty-seven studies met inclusion criteria for Key Question 1. Nineteen studies examined processes of care or patient outcomes associated with the QOF. Among the remaining 28 studies, 11 were conducted in the United States, and 8 in Taiwan, with the remaining examining programs in the Netherlands, Canada, Australia, France, and Italy. Forty-two studies examined processes of care outcomes, with 23 evaluating the effect of P4P on patient outcomes. Outcomes related to programs targeting ambulatory care are presented and discussed separately from those targeting and incentivizing at the hospital level. Forty studies examined P4P programs targeting ambulatory care and incentivizing providers or provider groups, with the remaining 7 focused on hospital P4P programs and providing incentives to the hospitals or hospital administration. In addition to findings from our literature search, we provide a summary of relevant findings from RAND’s report.1
Table 2. Number of Studies Summarized by Setting, Outcome, and Source
Process of Care Patient Outcomes Hospital
RAND 6 7 PDX 6 4
Ambulatory programs RAND 7 13 PDX
QOF 17 11 Non-QOF 19 8
Note. Studies commonly reported both process of care and patient outcomes.
Process of Care Outcomes
Forty-two of the 47 studies meeting inclusion criteria for Key Question 1 examined outcomes related to processes of care. Thirty-six studies were ambulatory P4P programs, of which 17 examined the QOF. The remaining 6 studies examined processes of care in hospital programs.
Ambulatory P4P Programs
Summary of RAND’s Findings1
The stronger studies as a whole generally showed either no improvements or relatively modest improvements in treatment, screening, and prevention measures (eg, chronic disease care, cancer screening, and immunizations). For example, a study by Mullen et al of a P4P program sponsored by PacifiCare in California found no improvement on any incentivized measures related to screening (cervical cancer, breast cancer), prevention (childhood immunizations), chronic disease care (HbA1c testing, asthma medication), or appropriate antibiotic usage relative to comparison practices in the Pacific Northwest over a 5-year period.56 Fagan et al found mixed results on 2-year trends on 5 incentivized measures between 9 physician practices that received incentives from a large national managed care organization and comparison practices. P4P practices had significant improvement compared with non-P4P practices on one measure (influenza vaccine: OR=1.79), had significant reductions on 2 measures (HbA1c testing: OR= 0.44; LDL screening: OR=0.62), and were no different on one measure (eye exam for diabetes).57 In 2 separate studies of a New York Medicaid P4P plan, Chien et al observed no
20

Pay for Performance Programs in Healthcare Evidence-based Synthesis Program
significant improvement in diabetes process measures over a 5-year period but a statistically significant improvement in immunization rates.58,59 A study by Pearson et al of the Massachusetts P4P experiment found P4P was not associated with regular improvements in diabetes scores over a 3-year period among 5 health plans’ P4P programs and was also not associated with regular improvements in scores for breast cancer, cervical cancer, or chlamydia screening.60 Levin-Scherz et al studied a P4P program within a large integrated delivery system and found that P4P practices experienced significant improvement (2-19% points) compared with non-P4P practices on 4 diabetes measures across a 3-year period.61 Rosenthal et al in a 4-year cross-sectional comparison, found that P4P practices had significantly better performance on cervical (3.9 percentage points) and breast cancer (2.2 percentage points) screening than non-P4P practices.62
Summary of Findings from Studies Examining Processes of Care in the UK’s Quality and Outcomes Framework
Seventeen studies examining processes of care associated with the QOF met inclusion criteria. The included studies examined a wide range of processes, such as influenza immunizations, prescribing patterns, and the measurement and/or recording of numerous incentivized indicators such as blood pressure, hypertension, glucose, total cholesterol, smoking status and cessation advice, and body mass index. Table 3 reports study details. Findings indicate modest improvements associated with the QOF, with the largest increases during the program’s first and second year, followed by either a plateau or slowing in improvement rates.63-67 For example, a study by Doran and others (2011) examined 23 incentivized indicators over a 7-year period beginning 4 years prior to the introduction of the QOF.63 Results indicate that all 17 process of care indicators improved significantly in the first year, and by the third year of the QOF, achievement for 10 of the 17 indicators remained significantly higher than projected pre-QOF trends; however, between the first and the third year, achievement plateaued, with mean rates increasing by only 1.9% (95% CI [1.4, 2.5]).
21

Pay for Performance Programs in Healthcare Evidence-based Synthesis Program
Table 3. KQ1 Processes of Care Ambulatory P4P Programs QOF
Study; Design; N
Condition; Observation period
Comparison Program/Process Outcomes
Arrowsmith et al, 201423 longitudinal cohort, Interrupted time series 581 GPs
Women's Health; Contraceptives 2007-2012
Compared the trends for prescribing of long-acting reversible contraception (LARC), introduced as a QOF indicator in 2009, before, during and up to 4 years post-introduction.
LARC prescribing rate changed from -0.4% annually at baseline to 4% (RR = 1.04, 95% CI [1.03, 1.06]) increase annually after introduction of QOF contraception incentive. The overall increase in LARC prescribing was 10% in the 4 years post, compared with pre-QOF baseline.
Calvert et al, 200967 Longitudinal cohort 147 practices
Diabetes 2002-2007
Compared percentage of patients with type 1 and type 2 diabetes meeting diabetes intermediate outcomes (HbA1c, blood pressure, cholesterol) from 2002-2007.
Improvements were observed over the study period for all indicators; however, intermediate outcome improvements were smaller than those seen for process indicators. For example 26% of patients with type 1 diabetes met cholesterol targets in 2002, 40.9% in 2004, increasing to 55.6% after the first year of the QOF, then plateauing in the next 2 years (2007 = 62.5%). Similar patterns were observed for blood pressure and HbA1c indicators.
Doran et al, 201163 Large cohort sample 148 practices 653,500 Patients
Multiple chronic diseases 2000-2001 2002-2003 2004-2005 2006-2007
Compared performance trends for 23 incentivized process (17) and prescribing (6) indicators before and up to 3 years post-QOF.
In the first year of the QOF, achievement rates were significantly higher for all 17 process of care indicators and 5 of 6 prescribing indictors. Increases above pre-QOF trends ranged from 1.2% to 37.7%, with 4 indicators (all related to smoking) over 30%. The increase in mean achievement above the projected pre-QOF trend for all incentivized indictors was 14.5% (95% CI [14.0, 15.0]). In the third year, achievement remained significantly above predicted rates for 10 of 17 process indicators and 4 of 6 prescribing indicators; however, rates were significantly below projections for 5 process indicators and 1 prescribing indicator. The increase in mean achievement above the projected pre-QOF trend for all incentivized indictors was 3.9% (95% CI [3.2, 4.5]). Between the first and third year of the QOF achievement plateaued, with the mean achievement rates increasing only 1.9% (95% CI [1.4, 2.5]).
Karunaratne et al, 201368 Large prospective cohort study examining 3 time periods 10,040 patients
Chronic Kidney Disease 2004-2006, 2006-2008, 2008-2010
Compared the proportion of hypertensive patients taking ARBs, the proportion of patients with stage 3-5 CKD taking 2 or more hypertensive medications, the proportion of patients receiving no treatment, and prescribing rates for diuretics, calcium channel blockers and beta blockers in patients with CKD prior to, and 2 and 4 years following the introduction of the renal indicators.
Between the first and third time period, the proportion of patients taking ARBs increased from 66% to78% to 82%. In addition, the proportion of patients with stage 3-5 CKD taking 2 or more hypertensive medications rose from 16% to 36%, the proportion of patients receiving no treatment for hypertension fell from 40% pre to 26% post-QOF, and there was an increase in prescribing for diuretics, calcium channel blockers and beta blockers.
22

Pay for Performance Programs in Healthcare Evidence-based Synthesis Program
Study; Design; N
Condition; Observation period
Comparison Program/Process Outcomes
Kontopantelis et al, 201364 longitudinal cohort, Interrupted time series 23,780
Diabetes 2000-2007
Compared the achievement trends for 13 diabetes processes of care indicators and a diabetes quality composite (13 processes of care, 4 patient outcome) pre-QOF (2000-2003) to post-QOF (2004-2007).
In the first year of the QOF, performance on the diabetes composite improved significantly as compared with the pre-QOF trend (14.2% increase (95% CI [13.7, 14.6], p<.001). By the third year, differences were smaller but still significant (7.3%, 95% CI [6.7, 8], p<.001). Absolute improvements ranged from 4.2% for HbA1c control to 85.5% for providing smoking cessation advice.
MacBride-Stewart et al, 200869,70 longitudinal cohort, Interrupted time series 92 practices
Multiple conditions 4 years, 2002-2006: 2 yrs pre and post GMS contract (2004)
Compares prescribing of QOF and non-QOF drugs over time.
Both pre-QOF and after QOF introduction, the prescribing rates of QOF drugs increased much faster than non-QOF drugs (p<.001); however, after April 2005, the rate of increase for QOF drugs slowed significantly, whereas the rate of increase for non-QOF drugs did not. The defined daily doses (DDD) per prescribing unit (PU) per month increased for all classes of QOF drugs, with the exception of centrally acting antihypertensive drugs and vasodilator antihypertensive drugs. Almost half of the change in QOF DDDs was for lipid regulating drugs, with a relatively small change in other classes.
Millett et al, 200771 Pre-post 32 practices
Diabetes 2003 2005-2006
Compared smoking status recording, and smoking cessation advice among patients with diabetes pre-and post-QOF implementation.
Smoking status was significantly more likely to be recorded in 2005 than in 2003 (98.8% vs 90%, p<.001). The proportion of patients with documented cessation advice increased from 48% in 2003 to 83.5% in 2005 (p<.001), and smoking prevalence decreased from 20% in 2003 to 16.2% in 2005 (p<.001).
Millett et al, 200972 Large pre-post cohort 154,945 patients, 422 practices
Diabetes 1997-2005
Compared achievement trends for blood pressure, HbA1c, and cholesterol measurement and prescribing in patients with diabetes pre- and post-QOF implementation.
Measurements of blood pressure, HbA1c, and cholesterol increased significantly post-QOF as compared with pre-QOF trends (p<0.001); however, there were large variation by number of co-morbid conditions. Similarly, prescribing of medications for secondary prevention increased during the study period, with variations by number of co-morbid conditions.
Murray et al, 201073 Longitudinal trend analysis 3200 pts
CHD 1998-2007
Compared achievement trends for blood pressure and cholesterol recording among patients with CHD.
The proportion of patients with CHD who had their blood pressure recorded rose from 33.2% in 1998 to 93.9% in 2007. In the same timeframe, cholesterol monitoring increased from 21.7% to 83.5%.
Norbury et al, 201140 Retrospective 315 practices 300K patients
Multiple chronic diseases 2003-2004 2006-2007
Compared influenza immunizations for incentivized patient groups pre-and post-QOF implementation.
Overall, immunization rates rose by 3.5% (95% CI [3.3, 3.7]) from 67.9% pre-QOF to 71.4%. Changes ranged from a slight decrease of -0.5% (95% CI [-1.2, 0.2]) in patients with diabetes ≥ 65 to an increase of 16.1% (95% CI [14.6, 17.7]) in patients younger than 65 with stroke or transient ischaemic attack.
Simpson et al, 201165 Large Cohort - 6 time points 315 practices
Hypertension 2001-2006
Compared blood pressure recording in patients with hypertension pre- and post-QOF implementation.
Blood pressure measurement increased over the study period; however most of the increase occurred pre-QOF (absolute difference = 46.8%, 95% CI [46.5, 47.1]).
23

Pay for Performance Programs in Healthcare Evidence-based Synthesis Program
Study; Design; N
Condition; Observation period
Comparison Program/Process Outcomes
Smith et al, 200874 large cohort pre/post 2,020,424 patients
COPD 2003-2005
Compared spirometry recording (FEV1) in patients with COPD as well as combined inhaler prescriptions for patients with FEV1 <50% pre- and post-QOF implementation.
The recording of spirometry data (FEV1) for people with COPD increased from 18% to 62% from 2003 to 2005, and the percentage of people with FEV1 < 50% prescribed a combined inhaler increased from 25% to 44%.
Sutton et al, 201075 Large cohort - 6 time points 315 practices
Multiple chronic diseases 2000-2006
Compared performance smoking status, alcohol consumption, blood pressure, BMI, and cholesterol indicators by whether the indicator is incentivized and whether the disease category (group) was targeted or untargeted at 6 time points.
Following the introduction of QOF, the estimated overall increase in recording for incentivized indicators was 19.9% for targeted patients and 5.3% for untargeted patients with a positive spillover of 10.9% increase in the recording of clinically effective unincentivized indicators for targeted patients, with a greater response on indicators attracting more payment and requiring more stringent performance.
Szatkowski et al, 201166 2 million patients
Primary care 2000-2009
Compared the recording of smoking cessation advice pre-and post-QOF (9 time points).
The recording of smoking cessation advice increased from 1.2% in 2000 to 10.9% in 2009, with the largest increase between 2003 and 2005.
Taggar et al, 201276 Cross-sectional ~2 million
Multiple conditions 2002-2008
Compared the recording of smoking status and cessation advice pre-and post-QOF (9 time points).
The recording of smoking status increased for all patients over study period from 25.6% pre-QOF, to 44% in 2004, and 64.5% in 2008. Similarly, recorded smoking cessation advice also increased from 11.3% in 2002, to 32.4% in 2004, and 50.5% in 2008.
Tahrani et al, 200777 Pre-post 66 practices N=460,000 pts Diabetes N=16,858
Diabetes 2004-2006
Compared proportion of patients achieving diabetes indicator targets (recording of BMI, smoking, HbA1c, blood pressure, creatinine, cholesterol, microalbumin testing, neuropathy testing, retinal screening, peripheral pulses, smoking cessation advice, influenza vaccine, and ACE inhibitors) pre-QOF and one and 2 years post-QOF
In the first 2 years of the QOF improvement were seen in all examined process of care indicators (all p<.001).
Vamos et al, 201141 Retrospective open-cohort Interrupted Time Series Diabetes patients n=154,945
Diabetes 1997-2005
Compared the pre- and post-QOF recording HbA1c, blood pressure, and total cholesterol and prescribing of antihypertensive and lipid-lowering drugs in diabetic patients.
Blood pressure, cholesterol, and HbA1c recording, as well as prescribing of antihypertensive and lipid-lowering drugs increased significantly from 1997 to 2005.
24

Pay for Performance Programs in Healthcare Evidence-based Synthesis Program
Summary of Findings from Studies Examining Process of Care Measures in Other Ambulatory P4P Programs
We included 19 studies examining processes of care outcomes in other ambulatory P4P programs. Commonly examined outcomes included immunizations (eg, influenza), screenings (eg, HbA1c, blood pressure, cholesterol, glucose, eye exams), and prescribing patterns, with other studies examining outcomes related to coordination of care, costs, and training. Table 4 provides study details. Similar to the findings reported by Damberg and others, recent studies examining P4P in ambulatory settings report modest to no improvement in process-related measures.1 For example, 5 studies reported findings related to Taiwan’s diabetes mellitus P4P program (DM-P4P).78-82 The DM-P4P, which began in 2001, is a voluntary program focused on guideline adherence that allows physicians who had completed a continuing medical education (CME) program to participate. While P4P was significantly associated with increased screening rates,78-80,82 and survival,81 physicians who had completed the required CME but chose not to participate in the DM-P4P also screened patients at a significantly higher rate than physicians who were program-ineligible.79
Studies examining other ambulatory programs covered a range of processes of care and found that results varied according to patient population, disease condition, and care process examined.26,39,83,84 A handful of studies report modest improvements associated with P4P,12,13,15,38,39,85 and findings from short-term and cross-sectional studies report generally positive associations between P4P and screenings and preventive care.84,86 However, others, and particularly longer-term studies, report little to no association,84,87,88 or that the effect of P4P fades over time.25,83
25
Pay for Performance Programs in Healthcare Evidence-based Synthesis Program
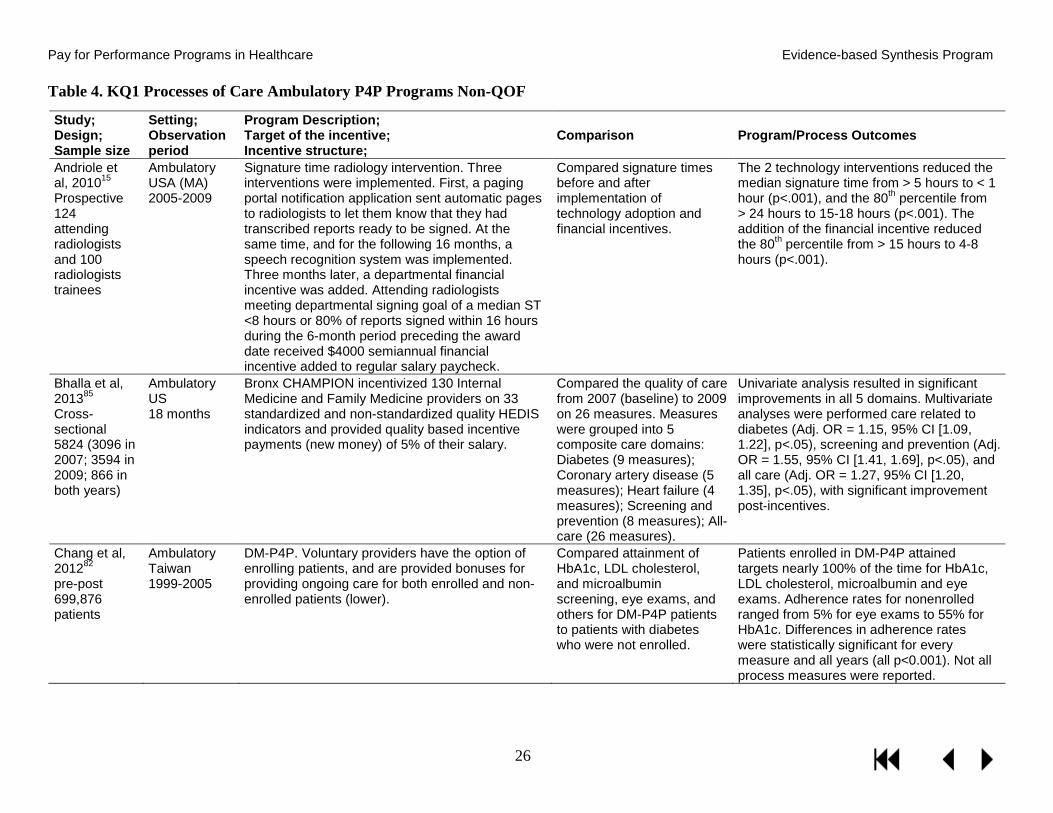
Table 4. KQ1 Processes of Care Ambulatory P4P Programs Non-QOF
Study; Design; Sample size
Setting; Observation period
Program Description; Target of the incentive; Incentive structure;
Comparison Program/Process Outcomes
Andriole et al, 201015 Prospective 124 attending radiologists and 100 radiologists trainees
Ambulatory USA (MA) 2005-2009
Signature time radiology intervention. Three interventions were implemented. First, a paging portal notification application sent automatic pages to radiologists to let them know that they had transcribed reports ready to be signed. At the same time, and for the following 16 months, a speech recognition system was implemented. Three months later, a departmental financial incentive was added. Attending radiologists meeting departmental signing goal of a median ST <8 hours or 80% of reports signed within 16 hours during the 6-month period preceding the award date received $4000 semiannual financial incentive added to regular salary paycheck.
Compared signature times before and after implementation of technology adoption and financial incentives.
The 2 technology interventions reduced the median signature time from > 5 hours to < 1 hour (p<.001), and the 80th percentile from > 24 hours to 15-18 hours (p<.001). The addition of the financial incentive reduced the 80th percentile from > 15 hours to 4-8 hours (p<.001).
Bhalla et al, 201385 Cross-sectional 5824 (3096 in 2007; 3594 in 2009; 866 in both years)
Ambulatory US 18 months
Bronx CHAMPION incentivized 130 Internal Medicine and Family Medicine providers on 33 standardized and non-standardized quality HEDIS indicators and provided quality based incentive payments (new money) of 5% of their salary.
Compared the quality of care from 2007 (baseline) to 2009 on 26 measures. Measures were grouped into 5 composite care domains: Diabetes (9 measures); Coronary artery disease (5 measures); Heart failure (4 measures); Screening and prevention (8 measures); All-care (26 measures).
Univariate analysis resulted in significant improvements in all 5 domains. Multivariate analyses were performed care related to diabetes (Adj. OR = 1.15, 95% CI [1.09, 1.22], p<.05), screening and prevention (Adj. OR = 1.55, 95% CI [1.41, 1.69], p<.05), and all care (Adj. OR = 1.27, 95% CI [1.20, 1.35], p<.05), with significant improvement post-incentives.
Chang et al, 201282 pre-post 699,876 patients
Ambulatory Taiwan 1999-2005
DM-P4P. Voluntary providers have the option of enrolling patients, and are provided bonuses for providing ongoing care for both enrolled and non-enrolled patients (lower).
Compared attainment of HbA1c, LDL cholesterol, and microalbumin screening, eye exams, and others for DM-P4P patients to patients with diabetes who were not enrolled.
Patients enrolled in DM-P4P attained targets nearly 100% of the time for HbA1c, LDL cholesterol, microalbumin and eye exams. Adherence rates for nonenrolled ranged from 5% for eye exams to 55% for HbA1c. Differences in adherence rates were statistically significant for every measure and all years (all p<0.001). Not all process measures were reported.
26

Pay for Performance Programs in Healthcare Evidence-based Synthesis Program
Study; Design; Sample size
Setting; Observation period
Program Description; Target of the incentive; Incentive structure;
Comparison Program/Process Outcomes
Cheng et al, 201278 Cohort study 3582 physicians
Ambulatory Taiwan 6 years
DM-P4P. Voluntary providers have the option of enrolling patients, and are provided bonuses for providing ongoing care for both enrolled and non-enrolled patients (lower). In 2006, DM-P4P added an intermediate outcome measure tournament, with only the top 25% providers receiving bonuses.
Compared the number of essential exams (ophthalmoscopic exam, and blood glucose, HbA1c, lipid profile, erum creatinin, SGPT/ALT, urinalysis) for 2 groups of DM-P4P patients (all patients regardless of length of program participation, and “consecutive participants” who were enrolled in DM-P4P from 2005-2009) to non DM-P4P patients, as well as pre- and 1-4 years post-DM-P4P.
At baseline, DM-P4P patients and non-DM-P4P patients were receiving a similar number of essential exams (3.90 vs 3.76). For both the all DM-P4P participant group as well as the consecutive participant group, there was an immediate significant impact in the first year (all participants M = 6.32, consecutive M = 6.41 of 7 exams). In the following years the mean number of exams for both groups dropped below the first year, but were still significantly higher than baseline (p<.001 for all years). The number of essential exams in non-DM-P4P participants increased gradually over time, which resulted in a narrowing of the differences between the DM-P4P groups and comparison groups; however, the differences remained significant at the p<.001 level in all years.
Esse et al, 201386 Cross-sectional 4240 (1,225 w/P4P PCPs, 3,015 w/ non P4P PCPs)
Ambulatory US (TX) 2010
P4P program within a Medicare Advantage Drug Plan. No additional information provided. This analysis examined heart failure patients.
Compared serum creatinine, LDL-C, HbA1c, and microalbumin screenings, as well as influenza immunizations and prescriptions for ACEIs/ARBs, statins, loop diuretics, spironolactone, hydralazine, isosorbide dinitrate, direct rennin inhibitor, and digoxin in heart failure patients with and without providers enrolled in the P4P program.
After adjusting for covariates, the P4P group had significantly higher percentages of achievement for LCL-C tests (OR = 1.425, 95% CI [1.194, 1.702], p<,.0001), HbA1c (OR = 1.468, 95% CI [1.219, 1.769], p<.0001), serum creatinine (OR = 1.891, 95% CI [1.586, 2.255,] p<.001), influenza vaccines (OR = 1.383, 95% CI [1.205, 1.589], p<.0001), and microalbumin (OR = 2.319, 95% CI [1.939, 2.774], p<.0001). While univariate analysis of prescriptions resulted in significantly more loop diuretics received by P4P patients (49.2% vs 44.9%, p=.011), and more spironolactone prescriptions received by non-P4P patients (7.9% vs 6%, p=.036), after adjusting for covariates no significant differences emerged.
27

Pay for Performance Programs in Healthcare Evidence-based Synthesis Program
Study; Design; Sample size
Setting; Observation period
Program Description; Target of the incentive; Incentive structure;
Comparison Program/Process Outcomes
Friedberg et al, 201487 Prospective cohort pre-post w/controls 61 practices 120,202 pts
Ambulatory US (PA) 3 years
PA Chronic Care Initiative (PACCI) was a statewide multi-payer medical home pilot for volunteering small and medium sized primary care practices from 6/2008 to 5/2011. The intervention consisted of technical assistance, web based disease registries to create monthly QI reports and assistance from practice coaches to facilitate practice transformation and achievement of NCQA Physician Practice Connections Patient Centered Medical Home recognition. Performance improvement efforts targeted asthma for pediatric patients and diabetes for adults. P4P in the form of practice level and provider level bonuses. Practices were eligible to receive a $20K payment in year one and annual bonus payments per full time equivalent clinician (physician or nurse practitioner) that varied based on NCQA medical home recognition and practice size ranging from $28K per clinician in NCQA level 1 practices with 10-20 clinicians to $95K per clinician in solo NCQA level 3 practices.
Compared screening for HbA1c, LDL-C, neuropathy, and breast and cervical cancer, as well as eye exams, and numerous structural changes pre-intervention and at years 1, 2, and 3, as well as to comparison practices that were similar in size, specialty, location, and affiliation with local health systems.
Pilot participation was significantly associated with greater performance improvement on only one measure - nephropathy monitoring (p = .03 in year 1, .002 in year 2, and <.001 in year 3). No other significant differences in processes of care emerged pre-post intervention or as compared with comparison practices. In addition to processes of care, at the organizational level, pilot participation was associated with structural changes related to NCQA PCC-PCMH recognition, with significant increases in practices meeting multiple standards related to performance feedback (p<.001), use of registries for patients, care management, outreach systems to contact patients, EMR capabilities, and 2 week wait time maximums.
Greene, 20125 Retrospective cohort 541 GPs
Ambulatory Australia 1995-2010
The Practice Incentives Program is a voluntary P4P program open to accredited practices or those undergoing accreditation. Practices receive sign on bonuses as well as incentives for each patient completing the cycle of care, and for completing the cycle of care for 20% or more patients. GPs are given varying bonuses for patients completing a 12-month cycle of care depending on the condition, for asthma and diabetes, and paid a set incentive for cervical cancer screening.
Compared the impact of PIP on the number of P4P claims for HbA1c and microalbumin tests for patients with diabetes, and the number of cervical cancer screening claims and treatments over time and by participation status.
There was an increase in the number of HbA1c and microalbumin tests for all GPs in the first full year of implementation. However, providers participating in PIP, particularly those who were actively claiming incentives had a higher baseline for the number of HbA1c screenings pre-participation; thus, the 26% increase in tests over 6 years was smaller as compared with non-P4P providers and those claiming fewer incentives. Neither participation in PIP, nor the number of incentive claims was significantly related to the number of diabetes tests or cervical cancer screenings. The asthma incentive was claimed less frequently, and was unlikely to have impacted the quality of care.
28

Pay for Performance Programs in Healthcare Evidence-based Synthesis Program
Study; Design; Sample size
Setting; Observation period
Program Description; Target of the incentive; Incentive structure;
Comparison Program/Process Outcomes
Kalwij et al, 201289 pre-post 52 GPs (Lambeth) and 43 GPs (Southwark)
Ambulatory UK 2003-2004 2010-2011
English National Chlamydia Screening Program (NCSP) Chlamydia screening is not incentivized by the QOF. GPs were offered an incentive for screening a proportion of their 15-24 year old patients with targets increasing each year. In Lambeth, practices screening 5% of the cohort was awarded £100 to £500/year; however, those reaching higher targets were awarded from £850 up to £2,600 depending on practice size. In Southwark, practices were paid per test according to the following sliding scale: £6 per screen under 10% of sexually active15–24 year old population, £10 for screening 10% and £15 for screening 15%. Incentives were discontinued in Lambeth in 2011, but not in Southwark. In addition to P4P, both Lambeth and Southwark provided educational support to GPs, including peer support, workshops and feedback on performances; however, in Lambeth support was a GP at only 8 hours/month; whereas Southwark had a full time chlamydia screening coordinator.
Compared the percentage of 15-24 year-olds screened for chlamydia in 2003 (pre-incentive) and in 2010/2011 in Lambeth/Southwark, London, and the rest of England.
Although testing for chlamydia increased simultaneously across community testing sites in England, the percentage of patients tested for chlamydia in both Lambeth and Southwark were significantly better than both London and the rest of England (p<.01). Authors conclude that other factors may have confounded results, including a national media campaign on chlamydia and other STI testing in 2010, and both the educational component in general as well as the differences between the two.
Kirschner et al, 201326 Pre-post 65 practices mean pts 4865
Ambulatory Netherlands 1 year pre, 1 year post
P4P program took into consideration factors from behavioral economics and instituted smaller and more frequent incentives, with separate rewards for performance on clinical indicators and practice management, and thresholds were tiered to allow for attainable bonuses for each practice. In addition, time to bonus was 4 months, and bonuses were tied explicitly to the program. Practices received 5-10% of income.
Compared achievement on performance on processes related to diabetes (9), COPD (5), asthma (4), CV risk management (8), flu vaccinations (2), and cervical cancer screening pre and post intervention. In addition, 27 patient experience measures (related to GP functioning, organization of care, and accessibility) were evaluated pre-post.
The P4P intervention was associated with significant improvements (p<0.05) for process indicators for patients with chronic conditions. Improvements ranged from +4.2% to +26.3%. No improvements in flu vaccination and cervical cancer screening.
29

Pay for Performance Programs in Healthcare Evidence-based Synthesis Program
Study; Design; Sample size
Setting; Observation period
Program Description; Target of the incentive; Incentive structure;
Comparison Program/Process Outcomes
Kruse et al, 201338 Cross-sectional 20774 pts
Ambulatory USA 2008-2011
Partners Community Healthcare Inc. (PHCI) is provider network covering a majority of commercially insured patients in MA. Incentive was a withheld amount that was returned to practices for meeting targets. Payments ranged from 3-4.8% of practice revenue. At the same time, PHCI adopted a system-wide EMR automatic reminder that prompted physicians to record smoking status.
Compared high-risk P4P patients with hypertension, diabetes, or coronary heart disease to a) all non-P4P patients, and b) non-P4P patients with similar characteristics on smoking status documentation (80% target).
Smoking status documentation increased each year among all patients from 47% in 2008 to 63% post-intervention in 2010 and 74% in 2011. Increase in documentation was greatest in P4P eligible patients. Documentation increased in non- P4P patients from 48-71% post-intervention, as compared with 56-83% for P4P patients and 56-80% non-P4P but similar patients. Multivariate results indicate that pre-P4P implementation, documentation rates were similar in P4P-eligible and non-P4P but similar patients (Adj. OR = 1.0, 95% CI [1.0, 1.1]). After P4P, documentation was significantly higher in P4P eligible patients (Adj. OR = 1.3, 95% CI [1.1, 1.4], p=.009). Pre-post results indicate an increase for both eligible (Adj. OR = 3.6, 95% CI [2.9, 4.5], p<.001) and non-P4P but similar patients (Adj. OR = 3.0, 95% CI [2.3, 3.9], p<.001). Among providers seeing P4P eligible patients, documentation was positively related to the proportion of P4P eligible patients seen. Authors conclude that EMR accounted for the improved documentation, with a small intervention effect, and that spillover effects cannot be determined.
Lai and Hou, 201379 Large cross-sectional 146,467 patients
Ambulatory Taiwan 2008
DM-P4P. Voluntary providers have the option of enrolling patients, and are provided bonuses for providing ongoing care for both enrolled and non-enrolled patients (lower). In 2006, DM-P4P added an intermediate outcome measure tournament, with only the top 25% providers receiving bonuses.
Compared DM-P4P providers and DM-P4P eligible providers to comparison providers on adherence to screening guidelines for HbA1c, glucose, lipid profile, serum creatinine, ALT, urine microalbumin, and eye exams.
Patients of DM-P4P providers and potential DM-P4P providers received all screenings at a significantly higher rate than the comparison group (p<.001). Statistically significant differences were observed between the enrollee group and the comparison group.
30

Pay for Performance Programs in Healthcare Evidence-based Synthesis Program
Study; Design; Sample size
Setting; Observation period
Program Description; Target of the incentive; Incentive structure;
Comparison Program/Process Outcomes
Lee et al, 201080 Large cross-sectional 38,671 (12,499 intervention and 26,172 comparison)
Ambulatory Taiwan 2005 & 2006
DM-P4P. Voluntary providers have the option of enrolling patients, and are provided bonuses for providing ongoing care for both enrolled and non-enrolled patients (lower). In 2006, DM-P4P added an intermediate outcome measure tournament, with only the top 25% providers receiving bonuses.
Compared the number of essential diabetes exams and diabetes-related physician visits for patients enrolled in DM-P4P to comparison practices pre- and post DM-P4P.
The mean number of essential diabetes exams increased significantly for both groups from pre to post (p<.001), and differed significantly between intervention and comparison group with higher mean visits for the intervention group (p<.001). In addition, the mean number of physician visits increased significantly for both groups (p<.001), with a significantly higher number of visits for DM-P4P patients (p<.001).
Li et al, 201339 Large cross-sectional with control group 2154 physicians
Ambulatory Canada 1998-2008
In Ontario, CA a P4P program was instituted in 2002, for which only providers in primary care reform (PCR) practice models (and not FFS models) were eligible. Incentives included a contact payment ($6.86/patient) and a bonus payment for target achievement. Payments were made to either providers or practices (depending on the practice model), and had a maximum of $11K contact and $11K bonus, which equals slightly less than 10% of provider income. The program’s incentivized measures were flu shots for seniors, toddler immunization, Pap smears, mammograms, and colorectal cancer
Compared the effect of P4P on the achievement of targets (flu shots for seniors, toddler immunization, Pap smears, mammograms, and colorectal cancer screenings) at baseline and post-P4P.
P4P was significantly related to increases in flu shots for seniors (5.1%, p<.01), pap smears, (7%, p<.01), mammograms (2.8%, p<.01), and colorectal screenings (57%, p<.01). There was no significant difference in toddler immunizations before and after the intervention.
31

Pay for Performance Programs in Healthcare Evidence-based Synthesis Program
Study; Design; Sample size
Setting; Observation period
Program Description; Target of the incentive; Incentive structure;
Comparison Program/Process Outcomes
Martens et al, 200783 Cross-sectional concurrent controlled pre-post 119 intervention + 118 control physicians with at least 500 patients in their practices
Ambulatory Netherlands 2000-2002
Bonus to physicians by insurance company in return for adherence to prescription guidelines that included recommendations on frequently prescribed drugs and less expensive alternatives for expensive new drugs.
Compared prescriptions of antibiotics, gastric medicines, and new drugs from P4P GPs to a control region before, immediately after, and one year after implementation.
P4P was significantly related to a short term improvement in prescriptions for amoxicillin plus clavulan acid (17% vs 0%, p=.008) and trimethoprim (7% vs 0%, p=.006), as compared with controls. Conversely, controls improved to a great degree than P4P GPs in doxycyclin prescriptions (14% vs 2%, p=.01) in the short term, with better performance by P4P providers; however, the difference between the groups were not significant. No significant long term effects were found for antibiotics. For gastric medicines, P4P was associated with significant improvement over controls in both the short (16% vs -5%,p=.001) and long term (27% vs -4%, p<.001). For newly introduced drugs, there was an increase of 27% by P4P providers, and 29% by controls, which was significant only in the long term (p=.01). Authors conclude that there was a limited temporary effect of P4P; however, most effects disappeared in 8-11 months.
Pechlivanoglou et al, 201488 Large cohort 58,700 pts included for statin prescriptions and 111,850 PPI prescriptions
Ambulatory Netherlands 2005-2007
A rational prescribing (RP) intervention offered incentives for prescribing lower cost statins and proton pump inhibitor treatment alternatives to new patients for lowering cholesterol and reducing gastric acid. Incentives ranged from €0.25 per new patient for GPs who started 75% of their patients on simvastatin or 95% on omeprazole starters, to €0.75 per patients who started 85% of their patients on simvastatin and/or 95% on omeprazole starters.
Compared the prescribing of simvastatin or omeprazole in RP providers before and after P4P implementation.
While there was an increase in the prescribing of simivastatin and omeprazole during the study period, these increases coincided with national increases and may be attributed to guideline changes and other interventions during the same general timeframe, with no effect attributed to the RP P4P program.
32

Pay for Performance Programs in Healthcare Evidence-based Synthesis Program
Study; Design; Sample size
Setting; Observation period
Program Description; Target of the incentive; Incentive structure;
Comparison Program/Process Outcomes
Rat et al 201484 Pre-post 1350 GPs
Ambulatory France 2011-2012
P4P in France resulted in an estimated €5000/year for each GP. €490/year was awarded to GPs who decreased the proportion of patients continuing benzodiazepine prescriptions 12 weeks after initiation to 12% and decreased the proportion of patients > 65 prescribed long-acting benzodiazepines to 5%.
Compared benzodiazepine prescriptions longer than 12 weeks and long-acting benzodiazepine prescriptions for older adults pre- and post- P4P.
The percentage of patients continuing benzodiazepine prescriptions longer than 12 weeks increased following the incentive program (18.18% to 18.97%, p=.03). Long-acting benzodiazepine prescriptions in older adults decreased from 53.5% to 48.8% (p<.005); however, patients >65 who were prescribed short-acting benzodiazepines were more likely to continue treatment beyond 12 weeks than those taking long-acting benzodiazepines (p<.005). Authors conclude that the P4P was not successful.
Tan et al, 201481 Retrospective cohort 260 patients. 65 treatment, 195 control.
Ambulatory Taiwan 2004-2005
DM-P4P. Voluntary providers have the option of enrolling patients, and are provided bonuses for providing ongoing care for both enrolled and non-enrolled patients (lower). In 2006, DM-P4P added an intermediate outcome measure tournament, with only the top 25% providers receiving bonuses.
Compared life years and quality adjusted life years (QALY) of DM-P4P patients and comparisons.
DM-P4P was associated with an increase in life years of 0.09 (95% CI [0.091, 0.039] and in QALY of 0.08 (95% CI [0.077, 0.080]) QALYs. Medical costs were higher in DM-P4P patients ($572.57, p<.0001) for diabetes related outpatient costs, with medication and treatment accounting for most of the difference.
33

Pay for Performance Programs in Healthcare Evidence-based Synthesis Program
Study; Design; Sample size
Setting; Observation period
Program Description; Target of the incentive; Incentive structure;
Comparison Program/Process Outcomes
Torchiana et al, 201312 pre-post 1300-1700 providers
Ambulatory US (MA) 2007-2012
MA General Physicians Organization (MGPO) incentive program. Physicians and psychologists were assigned to one of 3 activity tiers, with the highest tier eligible for up to $5000 annually, the second tier eligible for $2500, and the third tier eligible for $1000 bonus payments. Incentives were awarded every 6 months, with the first payment mailed in advance in accordance with Prospect Theory. For each 6-month term, 3 quality measures were chosen, 2 that were chosen by program leaders and were intended for all providers (if applicable), the third was chosen by department/division in consultation with program leaders. Performance targets for measures are set at 80%.
Compared baseline and post- performance on a wide range of measures, including those related to the use of electronic systems, use of electronic prescribing, other institutional priorities (eg, hand washing, training, etc), communication skills, meaningful use criteria, primary care, radiology, and hematology/oncology.
The average percentage of providers meeting all performance targets in a 6-month term averaged 62%. For use of EMRs, all departments met the 80% target, and the target was subsequently increased to 90%. This was similar for electronic prescribing (raised to 85%). A measure of physician communication was effective in increasing patient satisfaction significantly from 79.6% to 82%. Nine of 25 stage 1 criteria for meaningful use were incentivized, with 80% of all eligible providers meeting targets. At the department level, for 90% of providers, P4P reduced turnaround times in radiology from 23 to 4 hours, and in hematology, providers decreased the frequency of orders of exceptions to cycle 1 chemotherapy treatment from 12% to 2%. Providers met 80% targets for 14/15 measures that applied to every provider (exception was use of radiology order entry system at 52%).
Young et al, 201213 quasi-experimental 337: 171 responses (57% response rate)
Ambulatory US (NY) 1999-2004
Rochester Independent Practice Association (RIPA) primary care incentives for the management of diabetes (only one component of RIPA). Physicians had to be a RIPA physician for at least 24 months, with 10+ continuously enrolled patients. Physicians were eligible for bonus payments of approximately $15,000 depending on their relative ranking on a composite measure.
Compared the performance on diabetes quality of care (composite, HbA1c, LDL, nephropathy screenings, and eye exams) for RIPA physicians before, at 1 year, and at 3 years after implementation, and to national performance data.
In the first year of the program, eye exams (DID = 0.09, p<.01), HbA1c tests (DID = 0.04, P<.05), LDL screenings (DID = 0.03, p<.05), and nephropathy testing (DID = 0.02, p<.05) improved at a significantly higher rate than at the national population level. These improvements and differences in improvements were sustained in year 3.
34

Pay for Performance Programs in Healthcare Evidence-based Synthesis Program
Hospital P4P Programs
Summary of RAND’s Findings1
We summarize the findings of 6 good-quality studies of hospital P4P programs, 5 of which evaluated the effect of the CMS HQID while one evaluated the Massachusetts Medicaid P4P program which used the same measures (ie, process of care measures for acute myocardial Infarction (AMI), congestive heart failure (CHF), pneumonia, and surgical infection prevention) and incentive methodology as the HQID. These studies found modest differential effects between hospitals exposed to P4P and those not exposed that may have been related to the fact that virtually all hospitals were reporting their data to CMS for the purposes of public reporting of results, which in and of itself was a strong motivator for improvement. Two studies evaluated the first 3-year phase of the HQID and found generally positive but modest results.44,90 Werner et al found that, over the first 3 years of the HQID, participating hospitals had higher performance on an overall composite measure of AMI, CHF, and pneumonia than non-participating hospitals; however, after 5 years, the scores were virtually identical between HQID participants and non-participants.91 Ryan and colleagues found that P4P hospitals improved more (a difference of 1 to 2 percentage points) than non-P4P hospitals on the AMI, CHF, and pneumonia care composite measures; P4P hospitals improved less in Phase II than Phase I of HQID, compared with non-P4P hospitals, in large measure because the performance of these hospitals had topped out.92 The evaluation of the Massachusetts Medicaid hospital P4P program found no effect of P4P for pneumonia or surgical infection prevention in the 2 years after the start of the P4P program.93
Summary of Findings from Studies Examining Process of Care Measures in Hospital P4P Programs
Six studies examined processes of care in hospital P4P programs. Among the included studies, 3 studies evaluated P4P in US populations, with one study evaluating the CMS HQID,94 one evaluating the CMS hospital value-based purchasing (HVBP) program,95 and one study evaluating a VHA P4P program.16 Of the remaining studies, one evaluated a program in Italy,96 and 2 evaluated hospital P4P programs in Taiwan.97,98 Table 5 provides study details.
In the United States, both the HQID and the HVBP programs used a combination of hospital payment penalties and rewards to incentivize process of care improvements. In both cases, quasi-experimental design studies found no significant change in nearly all the measures examined.94,95
In contrast, a large retrospective cohort study using latent growth modeling found performance bonuses to VHA regional and facility-level senior managers targeted to acute coronary syndrome, heart failure, and pneumonia process measures, were associated with significant improvement on 6 of the 7 measures evaluated.16 Given the lack of control group, it is impossible to know whether the incentives were directly responsible for, or were coincident with, the change. Baseline performance was already quite high for some of the measures (eg, diagnostic catheterization for acute myocardial infarction patients, use of ace inhibitors in heart failure patients, and pneumococcal vaccination rates), while the clinical validity of at least one of the measures (timely use of antibiotics in suspected pneumonia) has since been challenged.99 Internationally, studies evaluating hospital P4P programs report generally positive effects,96-98,100 with a slowing of improvements or a plateau over time.100
35

Pay for Performance Programs in Healthcare Evidence-based Synthesis Program
Table 5. KQ1 Processes of Care Hospital P4P Programs
Study; Design; N
Setting; Observation period
Program and Incentive Description Comparison Program/Process Outcomes
Benzer et al, 201416 Retrospective cohort 128 (VA Medical Centers), # pts varied by site
Hospital US 2004-2010
VHA. For purposes of P4P, VA’s central office sets performance goals in consultation with clinical leaders and reported performance scores to medical centers quarterly. As such, this system-level intervention entailed both public reporting and financial incentives. Performance bonuses were distributed, based on the attainment of performance goals, to both regional network and facility-level senior managers, who, in turn, had discretion to distribute bonus payments to front-line clinicians and other employees.
Compared performance on 7 quality measures related to acute coronary syndrome, heart failure, and pneumonia before and until the end of the incentivized period.
Latent growth models showed that 6 of the 7 indicators showed significant improvement associated with P4P, with attainment of acute coronary syndrome measures for cardiology involvement increasing from 74-94% (p<.001), troponin returned from 74-96% (p<.001), and diagnostic catheterization from 91-95% (p=.03), weight monitoring in patients with heart failure increasing from 80-92% (p<.001), and timely antibiotics (64-82%, p<.001) and pneumococcal immunizations (85-92%, p<.001) increasing in patients with pneumonia. Only the measure for ACE-I or ARB in patients with heart failure showed no significant improvement (89-92%).
Colais et al, 201396 Pre/post 12,433 pts
Hospital Italy 2008-2009 2010-2011
P4P program based on the diagnosis related group (DRG) system by which the National Health Service pays hospitals a flat rate per case for inpatient hospital care. Since 2010 the full DRG rate has been paid only for patients that have undergone surgical treatment within 48 hours of admissions, with rates proportionally reduced for intervals of more than 48 hours. There are 4 different payment systems, with local health unit hospitals not receiving the DRG incentives, public and teaching hospitals being partially reimbursed by DRG, classified hospitals paid by the DRG with an additional budget to cover expenses, and private hospitals paid entirely by DRG.
Compared the proportion hip fracture surgeries performed within 48 hours of admission before and after implementation and
For all hospital types/payment systems, the proportion of patients undergoing hip fracture surgery within 48 hours increased significantly from 11.7% to 22.2%, and increases were significant for all 4 types/payment systems, with the largest increase seen in private hospitals entirely dependent on DRG (Adj. RR = 2.80, p<.0001), and the smallest increase seen in public and teaching hospitals reimbursed partially by DRG (Adj. RR = 1.42, p<.0001). Authors conclude that increases may be partially due to the development of public reporting programs during the same time frame.
36

Pay for Performance Programs in Healthcare Evidence-based Synthesis Program Study; Design; N
Setting; Observation period
Program and Incentive Description Comparison Program/Process Outcomes
Kuo et al, 201197 Cross-sectional 1,393 patients
Hospital Taiwan 2002-2008
Taiwan’s national breast cancer P4P program (BC-P4P) launched in 2001. Hospitals with more than 100 cases of breast cancer annually, a multidisciplinary team for breast cancer care, and an in-hospital database that routinely collects recurrence and survival information on patients with breast cancer are eligible. Incentives include both a bundled payment for treatments based on guideline recommended treatments that are reduced if a patient doesn’t complete the treatment plan, and an annual bonus for meeting stage-specific survival goals.
Compared the quality of care (composite of core breast cancer indicators) of patients enrolled in BC-P4P hospitals to those enrolled in non-P4P hospitals.
Patients enrolled in the BC-P4P program received better quality care than those in other programs (p<0.001) and a higher proportion of negative surgical margins (97.5% v 93.6%; p<0.001).
Li et al, 201098 Retrospective Before P4P: 25754; after P4P: 33,536
Hospital Taiwan 2002-2005
Taiwan’s P4P on TB program allowed hospitals to choose to participate if they met a number of criteria that included providers licensed in infectious disease, a full-time TB case manager, and more than 100 new cases at any point in time. Incentives are based on TB outcomes and vary by the stages of treatment and management, and payments are made to hospitals, providers, and case managers.
Compared the number of treatment days for TB patients cured within 9-months before and after P4P on TB and number of treatment days for TB patients cured within 12 months by participation status.
Among patients with TB who were cured in 9 months, the average length of treatment decreased from 257 days in 2002 to 249 days in 2005 (p<.01). As compared with non P4P on TB hospitals, the average number of treatment days differed significantly by P4P participation only in regional hospitals (and not medical centers or local hospitals), with a shorter treatment period in P4P on TB hospitals (p=.02).
Ryan et al, 201495 Large cohort 2873 HBVP hospitals and 399 comparison
Hospital US 2008-2012
Medicare HVBP Incentivizes attainment and improvement equally, is budget neutral using penalties and rewards by redistributing a portion of 1% withholds from “losing” to “winning” hospitals, and incentivizes clinical quality (12) and patient experience (8) measures.
Compared HVBP and matched non-HVBP hospitals on composite quality (12).
In the first period, HVBP was associated with (non-significant) reductions on the clinical quality composite (-0.51 percentage points, 95% CI [-1.37, 0.34], p>.10). Improvements in clinical processes pre-dated program implementation in HVBP hospitals but not controls possibly in anticipation of the program; thus, HVBP hospitals showed greater improvement over the entire study period. There was no variation in the effect of HVBP by hospitals’ pre-HVBP performance on processes of care. Authors hypothesize that effects may have spilled over to non-HVBP hospitals.
37

Pay for Performance Programs in Healthcare Evidence-based Synthesis Program Study; Design; N
Setting; Observation period
Program and Incentive Description Comparison Program/Process Outcomes
Ryan et al, 201494 Cohort 260
Hospital US 2004-2006
HQID Hospitals received a 1% bonus on Medicare payments for scoring between the 80th and 90th percentiles on a composite quality measure ($60/discharge for an average of $30,000 for AMI, $46/discharge for an average of $20,000 for heart failure, and $68/discharge for an average of $29,000 for pneumonia), and a 2% bonus for scoring at the 90th percentile or above.
Evaluated whether hospitals with quality scores just above payment thresholds for acute myocardial infarction (AMI), heart failure, and pneumonia improved quality more in subsequent periods than hospitals with quality scores just below the payment thresholds.
There was no association between the P4P bonuses and subsequent quality performance, with the exception of the 2% bonus for AMI in 2006 using the 5 percentage point bandwidth (0.8 percentage point increase, p < .01), and the 1% bonus for pneumonia in 2005 using all bandwidths (3.7 percentage point increase using the 3 percentage point bandwidth, p < .05). Authors conclude that there is limited evidence to support that hospitals’ receipt of quality bonuses facilitates subsequent quality improvement.
38

Pay for Performance Programs in Healthcare Evidence-based Synthesis Program
Patient Outcomes
Twenty-three of the 47 studies meeting inclusion criteria for Key Question 1 examined outcomes related to patient outcomes. Nineteen studies evaluated ambulatory P4P programs, of which 11 examined the QOF. The remaining 4 studies examined patient outcomes in hospital programs.
Ambulatory P4P Programs
Summary of RAND’s Findings1
Only a small number of studies have investigated the effect of P4P on measures of clinical outcomes (n=13), and the results are generally insignificant.1 The studies focused on a relatively small number of outcome measures; 30-day mortality (8 articles) and in-hospital mortality (7 articles) were the most commonly assessed outcomes, while few studies examined complications (2 articles), 30-day readmissions (2 articles), or one-year survival (1 article). The studies typically used cross-sectional data and examined correlations between individual or composite clinical process measures with one or more outcomes. The studies generally faced important challenges in establishing the link between receipt of process and outcome in an observational study, namely limited power to detect an effect, small expected effect sizes in practice, and potential bias due to unmeasured confounding factors. Given these challenges, the fact that most currently published process-outcome studies could not find an effect is not surprising.
A 2011 systematic review summarized the literature on the relationship between performance on clinical processes and outcomes for diabetes: evidence on the relationship between receipt of the clinical processes and patient outcomes was mixed at best.101 A study by Rosenthal et al found that a P4P program that provided incentives to pregnant members and their prenatal care providers did not result in a reduction of low birth weight deliveries.102 A study of a Medicaid plan-sponsored P4P program found that changes in the percentage of patients with LDL control as well as changes in emergency department use and hospitalizations were not significantly different than comparison practices over a 5-year period.59 A study by Ryan and Doran evaluated the association between improvements in incentivized process and intermediate outcomes in the UK QOF for 5 conditions: diabetes, coronary heart disease, stroke, epilepsy, and hypertension.103 The study showed that a 10 percentage point increase in the process composite was associated with an increase in performance on intermediate outcome measures of 3.16 percentage points for diabetes, 4.32 percentage points for coronary heart disease, 7.60 percentage points for stroke, 7.24 percentage points for epilepsy, and 7.16 percentage points for hypertension.
Summary of Findings from Studies Examining Patient Outcomes in the UK’s Quality and Outcomes Framework
The 11 included studies examining patient outcomes associated with the UK’s QOF evaluated clinical outcomes related to glucose, blood pressure, cholesterol, and hemoglobin levels, as well as the prevalence of COPD, and smoking prevalence. Table 6 reports study details. There is no strong evidence that the QOF increased clinical target achievement, as reported results vary by patient outcome, and by study period, as similar to findings related to processes of care; overall, larger improvements were generally observed in the initial year of the QOF, with a subsequent plateau or slowing of improvement for many of the measures,41,67,68,104,105 and unlike findings related to processes of care, achievement of certain intermediate targets (eg, HbA1c)41,104 was lower than predicted by pre-QOF trends. For example, one study examined trends from 1997 to
39

Pay for Performance Programs in Healthcare Evidence-based Synthesis Program
2005, and found that there was an immediate increase in achievement of blood pressure targets, with an additional increase the following year. There was no immediate improvement in cholesterol target attainment; however, significant improvement was observed in the year after implementation. For HbA1c, there was no immediate improvement, with a non-significant decline in the following year.41 Another study examining trends between 2000-2007 found that immediately, and in the 3 years following QOF introduction, systolic blood pressure decreased significantly, but there was no effect on diastolic levels. Cholesterol levels decreased significantly as compared with pre-QOF trend predictions, and continued to over the following 3 years; however, HbA1c levels were decreasing prior to the QOF, but increased significantly in the 3 years following QOF implementation.104
40

Pay for Performance Programs in Healthcare Evidence-based Synthesis Program
Table 6. KQ1 Patient Outcomes Ambulatory P4P Programs QOF
Study; Design; N
Condition; Observation period
Comparison Patient Outcomes
Alshamsan et al, 2012104 Interrupted time series – longitudinal cohort 7,434 patients, 29 practices
Diabetes 2000-2007
8 time points beginning in 2000-2007. QOF started in 2004. Compared white, black, and South Asian patients with diabetes on achievement of HbA1c, total cholesterol, systolic blood pressure, and diastolic blood pressure.
Prior to the QOF, mean HbA1c, total cholesterol, and diastolic blood pressure levels were decreasing. For HbA1c, there was a non-significant increase in the first year, then a significant increase over the next 3 years relative to the pre-QOF trend (p<.01). For mean total cholesterol, there was a significant decrease in the first year (p<.01), then over the next 3 years total cholesterol increased significant relative to the pre-QOF trend (p<.05). Mean systolic blood pressure was steady in the years before QOF, with significant decreases in the initial year (p<.05) and additional decreases over the next 3 years (p<.05). Diastolic blood pressure was decreasing prior to QOF (p<.05), with no change in the initial year or the following 3 years. Overall, prior to the QOF, HbA1c and cholesterol were decreasing, with significant increases in the post QOF trend. Only systolic blood pressure was sustained in the overall sample.
Calvert et al, 200967 Longitudinal cohort 147 practices
Diabetes 2002-2007
Compared percentage of patients with type 1 and type 2 diabetes meeting diabetes process indictors from 2002-2007.
Improvements were observed over the study period for all indicators. In 2007, the proportion of patients with type 1 diabetes attaining process targets was greater than 70%, with the exception of microalbuminuria testing, which improved from 11.2% in 2002, to 26.5% in 2004, rose to 56.8% with in the first year of the QOF, then plateaued in the low 60s, with 64.6% of patients meeting targets in 2007. Despite higher levels of attainment for other indicators, the pattern was similar, with large improvements in the first year of the QOF, and plateauing thereafter. While no data was provided for patients with type 2 diabetes, authors note that target attainment for this group was higher.
Karunaratne et al, 201368 Large prospective cohort study examining 3 time periods 10,040 patients
Chronic Kidney Disease 2004-2006, 2006-2008, 2008-2010
Compared reported blood pressure in patients with chronic kidney disease (CKD) and without, prior to, and 2 and 4 years following the introduction of the renal indicators.
The proportion of patients with CKD attaining blood pressures targets increased from 41.5% pre-QOF to 50% in the first 2 years post-QOF, with CKD patients who had been hypertensive in period one increasing from 28.8% to 45.1%. Mean blood pressure for both hypertensive and non-hypertensive CKD fell pre-to post-QOF. All reductions were sustained 4 years post-QOF (p<.01). In patients without CKD, target attainment increased as well both in the first 2 years post-QOF (48.2-51.4%) and through 2010 (53.5%). Between the 2 post-QOF periods, mean blood pressure decreased in patients without CKD; however, these decreases were not clinically significant. In non-CKD patients with hypertension, blood pressure reductions were greater than non-CKD patients without hypertension, but less than patients with CKD. Authors conclude that the larger increases in attainment and reductions in blood pressure in the CKD group suggests a positive effect attributable to P4P.
Millett et al, 200771 Pre-post 32 practices
Diabetes 2003 and from 2005-6
Compared smoking prevalence among patients with diabetes pre-and post-QOF implementation.
From 2003 to 2005, smoking prevalence decreased significantly by 3.8% from 20% to 16.2% (p<.001) with variations by demographic characteristics such as age, sex, race/gender, and by degree of deprivation.
41

Pay for Performance Programs in Healthcare Evidence-based Synthesis Program
Study; Design; N
Condition; Observation period
Comparison Patient Outcomes
Millett et al, 200972 Large pre-post cohort 154,945 patients, 422 practices
Diabetes 1997-2005
Compared achievement trends for blood pressure, HbA1c, and cholesterol in patients with diabetes pre- and post-QOF implementation.
Performance on blood pressure targets in 2004 and 2005 was significantly greater than predicted by the pre-QOF trend (36.4% vs 33.9% in 2005, p<0.001). HbA1c target attainment improved post-QOF, but less than predicted by the pre-QOF trend (45.7% achieved in 2005 vs 48% expected, p<0.001). Cholesterol target achievement was significantly greater than the pre-QOF trend (72.8% vs 67.9% in 2005, p<.001).
Murray et al, 201073 Longitudinal trend analysis 3200 pts
CHD 1998-2007
Compared achievement trends for blood pressure and cholesterol targets among patients with CHD.
The mean systolic blood pressure of patients with CHD decreased from 140.4 (95% CI [138.3, 142.5] in 1998 to 132.9 (95% CI [132.3, 133.5) mmHg in 2007 (p<.001). In the same time frame, diastolic blood pressure decreased from 80.1 (95% CI [79.6, 82]) to 74.2 (95% CI [73.9, 74.6]; p<.001), and cholesterol decreased from 5.2 (95% CI [5, 5.4]) to 4.3 (95% CI [4.3, 4.3]; p<.001). Mean cholesterol and blood pressure decreased both before and after the QOF, with similar decreases before and after for both systolic and diastolic blood pressure, and a larger decrease pre-QOF than after for cholesterol.
Simpson et al, 201165 Large Cohort - 6 time points 315 practices
Hypertension 2001-2006
Compared the attainment of blood pressure targets in patients with hypertension pre- and post-QOF implementation.
Blood pressure control improved each year throughout the study period (absolute increase ≤140/90 mmHg = 18.9%; 95% CI [8.5, 19.4]). There was no evidence of a change in trend in blood pressure target attainment after the introduction of pay for performance; however, both mean diastolic blood pressure (7.6 mmHg, 95% CI [7.4, 7.7], p<.001) and mean systolic blood pressure fell significantly (3.8 mmHg, 95% CI [3.8, 3.9]).
Smith et al, 200874 large cohort pre/post 2,020,424 patients
COPD 2003-2005
Compared COPD prevalence pre and post QOF implementation.
COPD prevalence increased by 14%, from 1.27% pre-QOF in 2003 to 1.45% in 2005.
Tahrani et al, 200777 Pre-post 66 practices N=460,000 pts Diabetes N=16,858
Diabetes 2004-2006
Compared proportion of patients achieving diabetes indicator targets (2 HbA1c targets, blood pressure, total cholesterol) pre-QOF and one and 2 years post-QOF
In the first 2 years of the QOF improvement were seen in all examined patient outcome indicators (all p<.001).
Vaghela et al, 2009105 Large sample 8192 to 8423 practices
Diabetes 2004 - 2008
Compared the proportion of patients with diabetes achieving blood pressure, cholesterol, and HbA1c targets in the first, second and third full years of the QOF.
The median practice-specific proportion achieving the HbA1c target in 2004-2005 was 59.1%, with an increase to 66.7% in 2007-2008. Attainment of blood pressure targets increased from 70.9% in 2004-2005 to 80.2% in 2007-2008, and attainment of cholesterol targets increased from 72.6% to 83.6%. The estimated annual increase in percent of diabetes patients achieving targets was 3.03% (95% CI [2.95, 3.10], p<.001) for HbA1c, 3.26% (95% CI [3.18, 3.34], p<.001) for blood pressure, and 3.99% (95% CI [3.92, 4.07], p<.001) for cholesterol.
42

Pay for Performance Programs in Healthcare Evidence-based Synthesis Program
Study; Design; N
Condition; Observation period
Comparison Patient Outcomes
Vamos et al, 201141 Retrospective open-cohort Interrupted Time Series Diabetes patients n=154,945
Diabetes 1997-2005
Compared the pre- and post-QOF achievement of targets for HbA1c, blood pressure, and total cholesterol in patients with diabetes.
In the year the QOF was introduced, there was an immediate improvement in the attainment of blood pressure attainment of 2.2 (95% CI [1.9, 2.6], p<.05) percentage points on top of the pre-QOF trend. There was an additional increase of 1.6 percentage points the following year. There was no immediate improvement on cholesterol target attainment; however, in the year after implementation, there was an improvement of 2.5 percentage points (95% CI [4.3, 5.3], p<.05) over the pre-existing trend. HbA1c did not improve immediately; however, in the year after implementation target attainment declined by 0.2 percentage points.
43

Pay for Performance Programs in Healthcare Evidence-based Synthesis Program
Summary of Findings from Studies Examining Patient Outcome Measures in Other Ambulatory P4P Programs
The 8 included studies evaluated patient outcome measures related to P4P programs in other ambulatory settings, and examined emergency department (ED) and hospital admissions, elective cesarean sections, and clinical outcomes related to diabetes and other chronic illnesses, and provided no strong evidence of an effect of P4P on patient outcomes. Table 7 provides study detail. Among these studies, 3 evaluated Taiwan’s DM-P4P and reported that despite increases in diabetes-related hospitalizations for non DM-P4P patients, there was no significant difference between P4P and comparison patients.80 In the long term, DM-P4P was associated with marginally fewer diabetes-related hospitalizations and diabetes-related complications.78,82 Included studies evaluating ambulatory P4P programs in the United States found fewer ED visits,12,106 and marginally higher acute and ambulatory care-sensitive hospital admissions,86,87,106 with one study reporting an increase in ambulatory care-sensitive hospitalizations in the second year of a 3-year patient centered medical home pilot that provided both practice-level incentives and annual bonuses to providers, and another reporting a slightly higher but non-significant trend for acute admissions in P4P patients.86,87
44

Pay for Performance Programs in Healthcare Evidence-based Synthesis Program
Table 7. KQ1 Patient Outcomes Ambulatory P4P Programs Non-QOF
Study; Design; N
Setting; Observation period
Program Description; Target of the incentive; Incentive structure
Comparison Patient Outcomes
Chang et al, 201282 pre-post 699,876 patients
Ambulatory Taiwan 1999-2005
DM-P4P. Voluntary providers have the option of enrolling patients, and are provided bonuses for providing ongoing care for both enrolled and non-enrolled patients (lower).
Compared the frequency of complications (diabetic ophthalmopathy, diabetic nephropathy, diabetic neuropathy, angina, diabetic peripheral vascular disease, foot wound and complication, ulcer of lower limbs) and Diabetes Complications Severity Index [DCSI]) for DM-P4P patients to patients with diabetes who were not enrolled.
The mean index scores of DM-P4P patients rose slightly (delta ≈ 0.3), while among non-enrolled patients, index scores were both higher at baseline and increased more (delta ≈ 1.0). In addition, complications were significantly more frequent in non-enrolled patients with diabetes (eg, in 2002 p<.01 for all complications except diabetic ophthalmologic disease and diabetic nephropathy, both p<.05).
Chen et al, 2014107 Pre/post 1,637,039
Ambulatory Taiwan 2003.5-2005.4 data used for pre, 2005.5-2006.4 for post
C-section P4P in Taiwan. Two financial incentive interventions. Policy I) In 2005, reimbursement rates changed from $506-609 for vaginal deliveries and $900-1050 for C-sections (US) to a global fee of $905-1132 regardless of mode of delivery; Policy II) In 2006, instituted a copayment for women electing C-sections. Providers received payments from 2 sources (eg, in medical centers they received the equivalent of $609 from the Bureau of National Health Insurance, and $523 from mothers).
Compared percentage of C-sections (all, medically indicated, elective) before and after implementation of policy I and policy II.
In all women, the percentage of C-section use increased from 32.81% pre policy I, to 33.36% post. There was large variation by age for all C-sections, those that were medically indicated, and elective C-sections, with a decrease in elective C-sections in younger women (eg, from 2.05% to 1.72% in women aged 25), and an increase in elective C-sections in women over 40 (eg, 8.96% to 11.76% in 45 year old women). Authors conclude that providers were incentivized by an increase in reimbursements for vaginal deliveries were employing less frequent elective C-sections for younger and less risky patients. For policy II, total C-sections increased from 33.36% to 34.29%, with elective C-sections increasing from 2.38% to 3.18%. Increases in elective C-sections were seen in all age groups except 45 year olds, which decreased from 11.76% to 10.55%. Similar to univariate results, multivariate analysis for policy I indicates that women under 30 are less likely to have an elective C-section (OR = 0.745, p<.01 for 20 year olds and OR = 0.714, p<.01 for 25 year olds). Multivariate results for policy II indicate that in younger women were more likely to elect a C-section (eg, OR – 1.509, p<.01 for 20 year olds, OR = 1.394, p<.01 for 25 year olds). There was no significant effect for either policy intervention for women aged 40 or older.
45

Pay for Performance Programs in Healthcare Evidence-based Synthesis Program
Study; Design; N
Setting; Observation period
Program Description; Target of the incentive; Incentive structure
Comparison Patient Outcomes
Cheng et al, 201278 Cohort study 3582 physicians
Ambulatory Taiwan 2004-2009
DM-P4P. Voluntary providers have the option of enrolling patients, and are provided bonuses for providing ongoing care for both enrolled and non-enrolled patients (lower). In 2006, DM-P4P added an intermediate outcome measure tournament, with only the top 25% providers receiving bonuses.
Compared diabetes-related hospitalization for 2 groups of DM-P4P patients (all patients regardless of length of program participation and “consecutive participants” who were enrolled in DM-P4P from 2005-2009) to non DM-P4P patients, as well as pre and 1-4 years post-DM-P4P.
Diabetes related hospitalizations increased gradually over the study period for all patients. For all patients, regardless of length of DM-P4P participation, the P4P was associated with marginally fewer hospitalizations over the study period (significant at p<.05 2 and 3 years post P4P). For the consecutive participants, the effect was larger, with a significant reduction in hospitalizations in years one and 2 (both p<.001), and a significant difference between consecutive DM-P4P patients and non-DM-P4P patients in all years.
Esse et al, 201386 Cross-sectional 4240 (1,225 w/P4P PCPs, 3,015 w/ non P4P PCPs)
Ambulatory US - TX 2010
P4P program within a Medicare Advantage Drug Plan. No additional information provided. This analysis examined heart failure patients.
Compared acute hospital admissions and emergency department (ED) visits in heart failure patients with and without providers enrolled in the P4P program.
While a slightly higher trend for acute admissions was observed in P4P patients, there was no significant difference between P4P patients and non-P4P patients for either acute admissions (32.9% vs 30.32%) or ED visits (26.69% vs 26.07%). Similarly, after adjusting for covariates, there was no significant difference between the P4P and non-P4P groups in acute admissions or ED visits.
46

Pay for Performance Programs in Healthcare Evidence-based Synthesis Program
Study; Design; N
Setting; Observation period
Program Description; Target of the incentive; Incentive structure
Comparison Patient Outcomes
Friedberg et al, 201487 prospective cohort pre-post w/controls 61 practices (32 pilot and 29 comparison) 120,202 pts
Ambulatory US - PA 3 years
PA Chronic Care Initiative (PACCI) was a statewide multipayer medical home pilot for volunteering small and medium sized primary care practices from 6/2008 to 5/2011. The intervention consisted of technical assistance, web based disease registries to create monthly QI reports and assistance from practice coaches to facilitate practice transformation and achievement of NCQA Physician Practice Connections Patient Centered Medical Home recognition. Performance improvement efforts targeted asthma for pediatric patients and diabetes for adults. P4P in the form of practice level and provider level bonuses. Practices were eligible to receive a $20K payment in year one and annual bonus payments per full time equivalent clinician (physician or nurse practitioner) that varied based on NCQA medical home recognition and practice size ranging from $28K per clinician in NCQA level 1 practices with 10-20 clinicians to $95K per clinician in solo NCQA level 3 practices.
Compared all cause hospitalization rates and emergency department (ED) visits, as well as ambulatory care-sensitive hospitalizations, ED visits, and percentage of patients with abnormal HbA1c and LDL-C results pre-intervention and at years 1, 2, and 3, as well as to comparison practices that were similar in size, specialty, location, and affiliation with local health systems.
Pilot participation was associated with a greater increase in the rate of ambulatory care-sensitive hospitalization in year 2 (p = .007). No other significant differences emerged pre-post intervention or as compared with comparison practices.
Lee et al, 201080 Large cross-sectional 38,671 (12,499 intervention and 26,172 comparison)
Ambulatory Taiwan 2005 & 2006
DM-P4P. Voluntary providers have the option of enrolling patients, and are provided bonuses for providing ongoing care for both enrolled and non-enrolled patients (lower). In 2006, DM-P4P added an intermediate outcome measure tournament, with only the top 25% providers receiving bonuses.
Compared the number of diabetes-related hospitalizations for patients enrolled in DM-P4P to comparison practices pre- and post DM-P4P.
The number of diabetes-related hospitalizations increased significantly for the comparison group (p<.001) but not the intervention group pre vs post-DM-P4P, with no significant differences between groups.
47

Pay for Performance Programs in Healthcare Evidence-based Synthesis Program
Study; Design; N
Setting; Observation period
Program Description; Target of the incentive; Incentive structure
Comparison Patient Outcomes
Share and Mason, 2012106 Cohort 994 designated practices are medical homes
Ambulatory US (Michigan) 3 years of reported data
Physician Group Incentive Program, Michigan Blue Cross Blue Shield. Physician groups were formed into “designated medical homes.” Incentives take into account absolute performance and improvement, and the degree of organization’s participation in initiatives (more engaged = larger payments). Performance was measured at the population level, removing barriers to treating low SES patients. Payments to physician groups consisted of increased amounts for visits, but groups were allowed to allocate funds as they chose (physician bonus, office needs, QI, training, etc).
Compared designated medical homes to other practices in years 2, 3, and 4 on emergency department (ED) visits, primary care-sensitive ED visits, ambulatory care-sensitive inpatient discharges, high tech radiology services, low tech radiology services, and generic dispensing rates.
As compared with other practices, designated medical homes had fewer ED visits (6.6-9.9%), primary care-sensitive ED visits (7.0-11.4%), ambulatory care-sensitive inpatient discharges (11.1-23.8%), high-tech radiology services (6.3-8.3%), low-tech radiology services (4.8-7.3%), and dispensed generic prescriptions at a higher rate (3.0-3.8%).
Torchiana et al, 201312 pre-post 1300-1700 providers
Ambulatory US (MA) 2007-2012
MA General Physicians Organization (MGPO) incentive program. Physicians and psychologists were assigned to one of 3 activity tiers, with the highest tier eligible for up to $5000 annually, the second tier eligible for $2500, and the third tier eligible for $1000 bonus payments. Incentives were awarded every 6 months, with the first payment mailed in advance in accordance with Prospect Theory. For each 6-month term, 3 quality measures were chosen, 2 that were chosen by program leaders and were intended for all providers (if applicable), the third was chosen by department/division in consultation with program leaders. Performance targets for measures are set at 80%.
Compared baseline and post- performance on ED visits for primary care providers.
P4P reduced ED visits per 1,000 primary care visits by 3.7% pre vs post, with an 18% reduction in September 2010 as compared with September 2009. Only 2 of 18 practices did not meet the target.
48

Pay for Performance Programs in Healthcare Evidence-based Synthesis Program
Hospital P4P Programs
Summary of RAND’s Findings1
Studies have consistently found either no association or weak associations between better performance on process measures and patient outcomes (some of these studies were done in the context of quality improvement interventions or pay-for-reporting, rather than P4P). A study by Krumholz et al examined the association between receipt of process measures for AMI, CHF, and pneumonia and 30-day all-cause risk-standardized mortality rates and 30-day, all-cause, risk-standardized readmission rates.108 No association was observed for AMI or pneumonia, and a negative association was observed between for both outcomes for CHF (r= –0.17, 95% CI). In a study of the surgical infection prevention (SCIP) measures implemented by CMS, Nicholas et al examined their relationship with risk-adjusted postoperative mortality rate, venous thromboembolism, and surgical site infection and found no statistically significant associations.109 Werner and Bradlow examined the 10 measures in the Hospital Quality Alliance starter set (pneumonia, CHF, and AMI) and found that hospitals in the 75th percentile of performance had significantly lower inpatient mortality than those in the 25th percentile for each condition’s composite measure and most of the individual measures;110 however, the absolute risk reduction (ARR) was small, ranging from .001 for CHF to .005 for both AMI and pneumonia. Petersen found that a broader set of AMI measures were associated with lower in-hospital mortality among a small group of hospitals participating in the “Can Rapid Risk Stratification of Unstable Angina Patients Suppress Adverse Outcomes with Early Implementation of the American College of Cardiology/American Hospital Association Guideline” (CRUSADE) National Quality Improvement Initiative.47 The adjusted in-hospital mortality rate for hospitals in the top quartile was 6.31% versus 4.15% for hospitals in the 4th quartile (OR=0.81, p<.001).
Three studies assessed the impact of hospital P4P programs on in-hospital or 30-day mortality. Two studies of the HQID found no difference in mortality between P4P and non-P4P hospitals.90,111 The third study by Sutton et al found that risk-adjusted mortality for the conditions included in the UK’s hospital program decreased significantly compared to hospitals not involved in the P4P program 18 months after the introduction of the P4P program.112 A study by Ryan et al raised questions about whether observed associations are causal in nature.111 While many studies controlled for hospital characteristics in multivariable analyses, Ryan, in contrast, included hospital fixed effects to adjust for unobservable characteristics that could affect hospital performance on both process measures and outcome measures, such as interest in quality improvement. The models without hospital fixed effects showed negative associations between composite measures of quality and 30-day mortality; however, once hospital fixed effects were included, the associations reduced in magnitude and became statistically insignificant.
Summary of Findings from Studies Examining Patient Outcomes in Hospital P4P Programs
Four studies evaluated the relationship between hospital P4P programs and patient outcomes, of which 2 assessed programs in Taiwan, one evaluated the UK’s HQID, and one US study evaluating the HVBP programs. Table 8 provides study details. In Taiwan, results from a study examining 5-year breast cancer survival and 5-year breast cancer recurrence, and from another assessing cure rates of tuberculosis, reported higher survival (OR = .167, 95% CI [0.064, 0.432]) and lower recurrence rates (OR = .370, 95% CI [0.200, 0.685]) in patients enrolled in P4P,97 and
49

Pay for Performance Programs in Healthcare Evidence-based Synthesis Program
a higher 9-month tuberculosis cure rate (46.9% vs 63%, p<.01) 2 years post-P4P as compared to 2 years pre-P4P, as well as a higher 12-month cure rate as compared with patients in non-P4P hospitals (68.1% vs 42.4%, p<.01).98 In the United States, a study examining the HVBP reports a non-significant reduction on a patient experience composite.95 In the UK, a study examining the HQID found that risk-adjusted mortality rates associated with acute myocardial infarction, heart failure, and pneumonia in P4P program hospitals were significantly lower at 18 months; however, by 24 months, while rates remained lower than they were prior to the program, the differences returned to pre-intervention levels.100
50

Pay for Performance Programs in Healthcare Evidence-based Synthesis Program
Table 8. KQ1 Patient Outcomes Hospital P4P Programs
Study; Design; Sample size
Setting; Observation period
Program Description Target of the incentive; Incentive structure
Comparison Patient Outcomes
Kristensen et al, 2014100 161 Hospitals 390,652 patients with AMI 338,921 patients with heart failure 761,954 patients with pneumonia 333,991 patients with other conditions
Hospital UK 2007-2012
UK HQID Premier. Began in 2008, with 3 changes to the incentive. In Year 1, hospitals in the top quartile received a 4% bonus, second quartile a 2% bonus. For the next 6 months, incentives were rewarded on attainment and improvement. After the first 18 months, a fixed proportion of the hospital's expected income was withheld and paid out only if thresholds were reached, with quality scores based on the levels achieved in Year 1.
Compared HQID hospitals to controls on risk-adjusted mortality for patients with incentivized conditions (acute myocardial infarction, heart failure, and pneumonia) and non-incentivized conditions (acute renal failure, alcoholic liver disease, intercranial injury, paralytic ileus and intestinal obstruction without hernia, and duodenal ulcer).
Risk adjusted mortality decreased for all 8 conditions in study and control hospitals, as well as all of England during the study period. While the intervention had a significant effect in the short term (−0.9 percentage points; 95% CI [−1.3, −0.4]), in the long term, other regions experienced greater reductions in mortality (1.6 percentage points for HQID hospitals vs 2.3 percentage points for controls), as did mortality rates for non-incentivized conditions; thus, short term improvements were not maintained with no significant differences between HQID and control hospitals before and after the intervention.
Kuo et al, 201197 Cross-sectional 1,393 patients
Hospital Taiwan 2002-2008
Taiwan’s national breast cancer P4P program (BC-P4P) launched in 2001. Hospitals with more than 100 cases of breast cancer annually, a multidisciplinary team for breast cancer care, and an in-hospital database that routinely collects recurrence and survival information on patients with breast cancer are eligible. Incentives include both a bundled payment for treatments based on guideline recommended treatments that are reduced if a patient doesn’t complete the treatment plan, and an annual bonus for meeting stage-specific survival goals.
Compared 5-year recurrence and survival rates of patients enrolled in BC-P4P hospitals to those enrolled in non-P4P hospitals.
After controlling for confounding factors, BC-P4P patients had better 5-year survival (OR = 0.167, p=.003) and less recurrence (OR = 0.370, p=.002).
Li et al, 201098 Retrospective Before P4P: 25754; after P4P: 33,536
Hospital Taiwan 2002-2005
Taiwan’s P4P on TB program allowed hospitals to choose to participate if they met a number of criteria that included providers licensed in infectious disease, a full time TB case manager, and more than 100 new cases at any point in time. Incentives are based on TB outcomes and vary by the stages of treatment and management, and payments are made to hospitals, providers, and case managers.
Compared the 9-month TB cure rate before and after P4P on TB and 12-month cure rate by participation status.
The 9-month cure rate for TB increased significantly from 43.4% before implementation to 63.5% after (p<.01). As compared with non P4P on TB hospitals, P4P on TB hospitals had a higher percentage of patients cured in 12 months (68.1% vs 42.4%, p<.01).
51

Pay for Performance Programs in Healthcare Evidence-based Synthesis Program
Study; Design; Sample size
Setting; Observation period
Program Description Target of the incentive; Incentive structure
Comparison Patient Outcomes
Ryan et al, 201495 Large cohort 2873 HBVP hospitals and 399 comparison
Hospital US 2008-2012
Medicare HVBP. Incentivizes attainment and improvement equally, is budget neutral using penalties and rewards by redistributing a portion of 1% withholds from “losing” to “winning” hospitals, and incentivizes clinical quality (12) and patient experience (8) measures
Compared HVBP and matched non-HVBP hospitals on composite patient experience measures (8).
HVBP was associated with (non-significant) reductions on the patient experience composite (-0.3 percentage points, 95% CI [-0.79, 0.19], p<.10). There is no evidence that HVBP was associated with improved patient experience, nor was there any variation based on hospitals’ pre-HVBP performance.
52

Pay for Performance Programs in Healthcare Evidence-based Synthesis Program
KEY QUESTION 2: What are the implementation factors that modify the effectiveness of pay for performance? Despite numerous P4P programs in the United States, as a health system the VHA differs greatly from others in the US, which are with a few exceptions multi-payer and heterogeneous in numerous ways, such as size, infrastructure (eg, use of electronic medical records [EMR]), practice characteristics, etcetera. The fundamental differences in the characteristics of US health systems, and thus, the settings in which P4P programs are implemented, present challenges related to generalizability, particularly to a system that differs greatly, such as the VHA. As such, as a P4P program, the QOF may be the model to examine closely, for as a system it similar in many ways to the VHA, being a large (primarily) single-payer system, having the ability to create system-wide changes and enforce or prompt behavior, with shared information through the use of EMRs, the ability to disseminate information in a systematic fashion, and with a commitment to providing integrated care.
Forty-one studies met inclusion criteria for Key Question 2, of which 17 examined the QOF. Based on key informant interviews with 14 experienced P4P researchers, we identified 2 main questions related to implementation.
1. What implementation factors are associated with changes in processes of care or patient outcomes? (28 studies)
2. What implementation factors are associated with changes in provider cognitive and/or behavioral responses? (14 studies)
Study details are presented in Tables 9 and10. We report brief summaries of the evidence and themes from key informant interviews related to each question below.
What Implementation Factors are Associated with Changes in Processes of Care or Patient Outcomes?
Twenty-eight of the included studies examined factors associated with processes of care or patient outcomes, of which 16 examined the QOF (Table 9 provides study detail). In addition, discussions with our key informants revolved around program development, flexibility, and evaluation.
Findings from Included Studies
Studies examining implementation factors related to the setting in the UK found that for providers, being a contractor rather than being employed by a practice was associated with greater efficiency and higher quality.33 Under the QOF, practices improved regardless of list size, with larger practices performing better in the short term,27-29 particularly when examining total QOF points32 rather than specific patient populations, disease conditions, or indictors. However, when these factors are taken into consideration, few significant differences existed based on practice size.30,40,41 In addition, 2 studies found that group practice and training practice status was associated with a higher quality of care;27,28 however, 2 others found no significant effect of training practice status after controlling for covariates.29,40 Studies in the United States and other countries such as the Netherlands, Canada, and Australia differed widely with regard to program structure and system level infrastructure (eg, technology). Findings from these studies indicate
53

Pay for Performance Programs in Healthcare Evidence-based Synthesis Program
that factors related to higher quality or greater quality improvement include culture change interventions introduced along with P4P31 and clinical support tools;38 however, findings were mixed regarding quality improvement visits/groups and trainings.7,36 Contrary to findings related to the QOF however, differences in quality associated with P4P within urban and rural settings,25,26 independent versus group practices,26 type of hospital (eg, training, public, private, etc),24 and patient panel size/volume are less clear, with studies reporting conflicting results.24,39
Findings from studies examining factors related to the relationship between provider demographic characteristics and processes of care or patient outcomes are mixed, with some studies reporting that being younger 28,39 and female23 are related to adherence with or better performance on measures associated with P4P programs, while others found no significant differences.5,42
Seven studies evaluated changes related to updating or retiring a measure. Three included studies 18,20,21 examined threshold changes in the QOF, and found that after threshold changes, quality continued to increase, with lower performing providers improving significantly more than those who were performing at a high level under the previous threshold.20,21 In the United States, the incentive structure of the HQID changed from Phase I to Phase II, with changes enabling hospitals to receive incentives for both performance and improvement. A study by Shih and others compared adverse events related to coronary artery bypass graft (CABG) surgery and total hip and knee replacements, and found that while both inpatient mortality and complications related to all 3 procedures decreased from Phase I to Phase II, there were no significant differences by phase after controlling for secular trends in other hospitals.19 In addition, we identified 3 studies examining clinical process and patient outcomes after the removal of an incentive. A study by Kontopantelis and others evaluated the effect of the incentive withdrawal of 5 clinical processes that had sustained high performance over a 2- to 6-year period.22 Four of the 5 processes were linked to outcome indicators that remained incentivized (eg, an incentive for blood pressure monitoring was removed; however, blood pressure control remained incentivized). Findings indicated that that level of performance achieved prior to the incentive withdrawal was generally maintained, with some difference by indicator and disease condition. Two studies examined changes in incentives within the VHA. Benzer et al (2013) evaluated the effect of incentive removal and found that all improvements were sustained for up to 3 years.16 Similarly, Hysong and others (2011) evaluated changes in measure status, that is, the effect on performance when measures shift from being passively monitored (ie, no incentive) to actively monitored (ie, incentivized), and vice versa.17 Findings indicate that regardless of whether a measure was incentivized, all remained stable or improved over time. Quality did not deteriorate for any of the measures in which incentives were removed, and that of the 6 measures that changed from passive to active monitoring, only 2 improved significantly after the change (HbA1c and colorectal cancer screening).
In addition, one study examined different methods of constructing composite quality scores and found that more statistically stringent methods of creating composite quality scores were more reliable than raw sum scores.3 Another study compared bonuses and payments for 5 P4P payment strategies, and found that payment strategies based on relative rank resulted in large gradients between high and low performers, with target attainment and percentage recommended strategies resulting in a more even distribution, and the percentage recommended strategy creating incentives for all participating to improve.14 The final study examined the cost
54

Pay for Performance Programs in Healthcare Evidence-based Synthesis Program
effectiveness of 9 indicators and found that although most indicators required only a fraction of 1% to change to be cost effective, for others, improvements of 20% were needed.92
Themes from Key Informant Interviews
Similar to the findings reported in the literature, key informants believed that measures should be evaluated regularly (eg, yearly), to allow for continued increases in quality. Once achievement rates are high, those measures should be evaluated, with the possibility of increasing thresholds if relevant, or replacing them with others representing areas in need of quality improvement.
Key informants also stressed that, while the optimal number of incentivized measures is unknown, it is likely that a surplus of measures will be burdensome to providers and increase the likelihood "box-ticking/check-listing," "teaching to the test," and gaming. Key informants familiar with the QOF pointed out that when the QOF was first introduced in 2004, incentives were linked to 146 indicators. Realizing that this was excessive, program administrators began retiring indicators with each successive contract; the most recent (2014/2015) includes 81 indicators.
When asked about contextual/setting-related features important in P4P programs, the importance of financial incentives as just one piece of an overall quality improvement program was a common theme, as was the importance and influence of other factors such as a strong infrastructure and ongoing infrastructural support (particularly with regard to information technology and EMRs), the organizational culture around P4P and associated measures, the alignment/allocation of resources with P4P measures, and public reporting. Public reporting was described as many of our KIs as a strong motivator, particularly for hospital administrators, but also for individual providers operating within systems in which quality achievement scores are shared publically. One key informant believed that success in quality improvement programs lies not with financial incentives, but with transparency and public reporting, and stressed that future research should focus on untangling the two.
55

Pay for Performance Programs in Healthcare Evidence-based Synthesis Program
Table 9. KQ2 Implementation Factors Associated with Changes in Processes of Care or Patient Outcomes
Study; Design; N
Setting; Observation period
Program and incentive description Comparison Findings on Implementation Factors – Program
Features
Features related to processes of care Andriole et al, 201015 Prospective 124 attending radiologists and 100 radiologist trainees
Ambulatory USA (MA) 2005-2009
Signature time radiology intervention. Three interventions were implemented. First, a paging portal notification application sent automatic pages to radiologists to let them know that they had transcribed reports ready to be signed. At the same time, and for the following 16 months, a speech recognition system was implemented. Three months later, a departmental financial incentive was added. Attending radiologists meeting departmental signing goal of a median ST <8 hours or 80% of reports signed within 16 hours during the 6-month period preceding the award date received $4000 semiannual financial incentive added to regular salary paycheck. P4P lasted one year, then the incentive was removed.
Compared signature times before and 19 months after incentive removal.
The financial incentive reduced the 80th percentile from > 15 hours to 4-8 hours (p<.001). The 80th percentile signature time fluctuated slightly in the 31 months after P4P implementation with discontinuation of P4P beyond the first year, but was not significant and without trend, indicating that the gains 80th percentile signature times were sustained over the final 31 months of the study period, including the 19 months following discontinuation of the departmental P4P tied to signature time performance.
Arrowsmith et al, 201423 Retrospective cohort interrupted time series 581 GPs
Ambulatory UK 2007-2012
QOF
Compared the prescribing of long-acting reversible contraception (LARC), which was introduced as a QOF indicator in 2009, by provider, gender, and by urban vs rural practices.
The presence of one or more female GPs in a practice was associated with a doubling in LARC prescribing compared to those with no female GP in the practice (RR = 2.03, 95%CI [1.82, 2.27]), and was particularly significant for IUCD and implants. GPs in urban practices were 23% less likely to prescribe LARC than GPs in rural practices (RR = 0.77, 95% CI [0.66, 0.91]).
56

Pay for Performance Programs in Healthcare Evidence-based Synthesis Program
Study; Design; N
Setting; Observation period
Program and incentive description Comparison Findings on Implementation Factors – Program
Features
Benzer et al, 201416 Retrospective cohort 128 VA Medical Centers
Hospital US 2004-2010
VHA. For purposes of P4P, VA’s central office sets performance goals in consultation with clinical leaders and reported performance scores to medical centers quarterly. As such, this system-level intervention entailed both public reporting and financial incentives. Performance bonuses were distributed, based on the attainment of performance goals, to both regional network and facility-level senior managers, who, in turn, had discretion to distribute bonus payments to front-line clinicians and other employees.
Compared performance on 7 quality measures related to acute coronary syndrome, heart failure, and pneumonia before and for 3 years after removal of the incentive.
Up to 3 years after removal of the incentive, latent growth models showed that performance was sustained for all measures, with no significant positive or negative slope (however weight monitoring showed a significant positive slope in the year following removal, then a significant negative slope the following year, and a non-significant slope in year 3 following removal).
Bhattacharyya et al, 200824 Retrospective cohort 257
Hospital US 3 yrs
HQID. Hospitals were assessed by a composite quality score (CMS). Hospitals scoring in the top 10% received a bonus of 2% of annual DRG payment for hip and knee replacements. Hospitals in the top 20% but not the 10% received a 1% bonus.
Compared practice characteristics (location, specialization, type, size, revenue, etc) of hospitals in top 20% performance status for hip and knee replacement vs the remaining hospitals.
Hospitals performing in the top 20% for knee and hip replacements were more likely to be in the Midwest (OR = 3.59, 95% CI [1.66, 7.78], p<.001), be a teaching hospital (OR = 2.54, 95% CI [1.05, 5.53], p<.001), and have a higher number of patients receiving orthopedic treatments (p<.002). Hospital size and revenue were not significantly associated.
Dalton et al, 201137 Retrospective cohort 23 practices
Ambulatory UK 2004-2007
QOF Compared exception reporting in the first 3 years of the QOF by practice size among adult patients with diabetes for HbA1c, blood pressure, and cholesterol.
There was a higher level of exception reporting for the HbA1c indicator in practices with larger list sizes, although the effect size decreased over the 3 years (Adj. OR = 6.56 (95% CI [3.92, 10.99]) in 2004–2005, 3.52 [2.35, 5.27] in 2005–2006 and 1.43 [1.05, 1.95] in 2006–2007 for practices with list sizes ≥ 7000 compared with < 3000).
57

Pay for Performance Programs in Healthcare Evidence-based Synthesis Program
Study; Design; N
Setting; Observation period
Program and incentive description Comparison Findings on Implementation Factors – Program
Features
Greene, 201325 Three methods: Medicare data, physician-level data, qualitative 541 GPs
Ambulatory Australia 1995-2010
The Practice Incentives Program is a voluntary P4P program open to accredited practices or those undergoing accreditation. Practices receive sign on bonuses as well as incentives for each patient completing the cycle of care, and for completing the cycle of care for 20% or more patients. GPs are given varying bonuses for patients completing a 12-month cycle of care depending on the condition, for asthma and diabetes, and paid a set incentive for cervical cancer screening. Incentives included a rural practice loading, with a 15-50% increase depending on degree of remoteness.
Compared the impact of PIP on HbA1c and microalbumin tests for patients with diabetes, and the number of cervical cancer screenings and treatments among participating practicing in rural and urban settings.
No significant differences were found in performance for GPs working in urban and rural areas, despite higher incentives for providers working in rural areas.
Hysong et al, 201117 Retrospective cohort 133 VAMCs
Hospital US 2000-2008
VHA. Facility directors receive bonuses based on performance targets.
Compares performance on measures related to changes from active to passive monitoring (classification as support indicators) to active monitoring (classification as performance targets) or vice versa.
All measures improved or remained stable over time regardless of whether they changed from actively assessed to passively monitored or vice versa. After risk adjusting for organizational characteristics, no organizational characteristics effects were found. 2/6 measures that changed from passive to active had significantly increased slopes after the change (HbA1c levels < 9, and colorectal cancer screening), indicating significant improvement in performance. 4/11 that changed from active to passive exhibited significant differences in slope; 2 exhibited positive slopes before the change, followed by negative slopes (lipid profile every 2 yrs; MDD screening), and 2 exhibited the opposite pattern (diabetic foot inspections; and pedal pulses). Remaining measures exhibited no significant changes indicating sustained performance after changing from performance measure to support indicator.
58

Pay for Performance Programs in Healthcare Evidence-based Synthesis Program
Study; Design; N
Setting; Observation period
Program and incentive description Comparison Findings on Implementation Factors – Program
Features
Kirschner et al, 201326 Pre-post 65 practices, Mean 4865 pts/practice
Ambulatory Netherlands 1 year pre, 1 year post
P4P program took into consideration factors from behavioral economics and instituted smaller and more frequent incentives, with separate rewards for performance on clinical indicators and practice management, and thresholds were tiered to allow for attainable bonuses for each practice. In addition, time to bonus was 4 months, and bonuses were tied explicitly to the program. Practices received 5-10% of income.
Compared achievement on performance on diabetes, COPD, asthma, CV risk management, flu vaccinations, and cervical cancer screenings by practice type and degree of urbanization.
Practices in large cities improved 14.4% less than practices in rural areas on HbA1c for diabetes patients. In addition, solo practices improved 15.5% and 14.4% more on the COPD indicators than duo and group practices (both p<.01).
Kontopantelis et al, 201221 Retrospective cohort QMAS Data (Contains 99% of English language practices)
Ambulatory UK 2004-2005 2009-2010
QOF
Compared changes in reported and population (includes excluded patients) achievement for influenza immunization for patients with CHD before and after an increase in the upper threshold from 85-90% to patients with COPD, diabetes, and stroke, for whom the upper threshold remained 85%.
Compared to patients with COPD, diabetes, and stroke, reported achievement rates for patients with CHD increased, with the largest increases in practices achieving below the old upper threshold in 2005/2006 (1.47%, 95% CI [1.27, 1.68]). Similarly, population achievement increased more for patients with CHD as compared with other groups, with the largest increases in practices previously achieving less than 85% (0.85%, 95% CI [0.62, 1.08]).
59

Pay for Performance Programs in Healthcare Evidence-based Synthesis Program
Study; Design; N
Setting; Observation period
Program and incentive description Comparison Findings on Implementation Factors – Program
Features
Kontopantelis et al, 201422 Retrospective cohort 644 practices
Ambulatory UK 2004-2012
QOF Examined the effect of the incentive withdrawal of 5 clinical processes on performance on both the same indicator and related indicators.
Influenza immunizations for patients with asthma experienced a small drop following incentive withdrawal (-.70%, 95% CI [-1.01%, -.39%]); however, 6 years after withdrawal, immunization rates were 0.6% higher than the last year incentivized. There were no significant differences in performance over time after removal of the lithium level monitoring for patients with psychosis indicator, with the linked control indicator continuing to improve before dropping off, but remaining higher than pre-incentive removal. Indicators for blood pressure monitoring for patients with coronary heart disease, diabetes, or stroke, and HbA1c and cholesterol monitoring showed no statistically significant differences over time; however, cholesterol monitoring for patients with CHD showed a significantly lower observed mean as compared with expectation (-1.19%, 95% CI [-1.56%, -0.81%]). Performance on patient outcome indicators related to blood pressure control for CHD, diabetes and diabetes were close to expectation, with only the related indicator for stroke significantly lower than expected (-0.35%, 95% CI [-0.65%, -0.05%]). The 2 cholesterol control indicators were slightly but significantly lower than expectation, and the difference in the control indicator for HbA1c was large and significant (-2.08%, 95%CI [-2.45%, -1.71%]).
60

Pay for Performance Programs in Healthcare Evidence-based Synthesis Program
Study; Design; N
Setting; Observation period
Program and incentive description Comparison Findings on Implementation Factors – Program
Features
Kruse et al, 201338 Cross-sectional 20774 pts
Ambulatory US 2008-2011
Partners Community Healthcare Inc. (PHCI) is provider network covering a majority of commercially insured patients in MA. Incentive was a withheld amount that was returned to practices for meeting targets. Payments ranged from 3-4.8% of practice revenue. At the same time, PHCI adopted a system-wide EMR automatic reminder that prompted physicians to record smoking status.
Compared high-risk P4P-eligible patients with hypertension, diabetes, or coronary heart disease to a) all non-P4P patients, and b) non-P4P patients with similar characteristics on smoking status documentation (80% target).
Smoking status documentation increased each year among all patients from 47% in 2008 to 63% post-intervention in 2010 and 74% in 2011. Increase in documentation was greatest in P4P eligible patients. Documentation increased in non- P4P patients from 48-71% post-intervention, as compared with 56-83% for P4P patients and 56-80% non-P4P but similar patients. Multivariate results indicate that pre-P4P implementation, documentation rates were similar in P4P-eligible and non-P4P but similar patients (Adj. OR = 1.0, 95% CI [1.0, 1.1]). After P4P, documentation was significantly higher in P4P eligible patients (Adj. OR = 1.3, 95% CI [1.1, 1.4], p=.009). Pre-post results indicate an increase for both eligible (Adj. OR = 3.6, 95% CI [2.9, 4.5], p<.001) and non-P4P but similar patients (Adj. OR = 3.0, 95% CI [2.3, 3.9], p<.001). Among providers seeing P4P eligible patients, documentation was positively related to the proportion of P4P eligible patients seen. Authors conclude that EMR accounted for the improved documentation, with a small intervention effect, and that spillover effects cannot be determined.
Li et al, 201339 Large cross-sectional with control group 2154 physicians
Ambulatory Canada 1998-2008
In Ontario, CA a P4P program was instituted in 2002, for which only providers in primary care reform (PCR) practice models (and not FFS models) were eligible. Incentives included a contact payment ($6.86/patient) and a bonus payment for target achievement. Payments were made to either providers or practices (depending on the practice model), and had a maximum of $11K contact and $11K bonus, which equals slightly less than 10% of provider income. The program’s incentivized measures were flu shots for seniors, toddler immunization, Pap smears, mammograms, and colorectal cancer screenings.
Compared the effect of P4P on the achievement of targets (flu shots for seniors, toddler immunization, Pap smears, mammograms, and colorectal cancer screenings) by patient panel size, baseline scores, and provider age and gender.
There was a weak positive relationship between patient panel size and adherence on flu shot, mammogram and colorectal cancer screening, and providers with lowest levels of baseline provision for flu shots and mammograms or low and mid low for cancer screenings showed the greatest response. Younger providers responded more to incentives for Pap smears, mammograms, and colorectal cancer screenings, but not senior flu shots and toddler immunizations.
61

Pay for Performance Programs in Healthcare Evidence-based Synthesis Program
Study; Design; N
Setting; Observation period
Program and incentive description Comparison Findings on Implementation Factors – Program
Features
Norbury et al, 201140 Retrospective cohort 315 practices, 300K patients
Ambulatory UK 2003-2004 2006-2007
QOF Compared influenza immunizations for incentivized patient groups by practice list size and training practice status.
Patients in larger practices were more likely to be immunized post-QOF; however, this finding did not retain significance after controlling for covariates. There were no other differences found between practice size or by training practice status.
Vamos et al, 201141 Retrospective cohort Interrupted Time Series Diabetes patients n=154,945
Ambulatory UK 1997-2005
QOF
Compared the pre- and post-QOF recording and prescribing trends for HbA1c, blood pressure, and total cholesterol in diabetic patients by practice size.
Blood pressure, cholesterol, and HbA1c recording, as well as prescribing of antihypertensive and lipid-lowering drugs increased from 1997 to 2005; however, no significant differences were found by practice size.
Features related to patient outcomes Shih et al, 201419 Pre-post 44 participants/ 321 comparison for CABG, and 93 participating/ 1046 comparison for hip/knee replacement
Hospital US 2003-2009. Phase 1 = 2003-2006; Phase 2 = 2006-2009.
HQID Premier Phases I & II In phase I, the top 20% of hospitals received a 1-2% incentive. In phase II the incentive changed, and hospitals received incentives for ranking in the top 20% for performance, or the top 20% for improvement, or performing above the median level for a composite quality score benchmark from 2 years prior on process and quality indicators for 3 medical conditions (acute myocardial infraction, congestive heart failure, and pneumonia), and 2 surgical procedures (coronary artery bypass graft surgery (CABG, and total hip or knee replacements).
Compared adverse events (inpatient mortality, complications, serious complications) for CABG surgery and hip and knee replacements in Phase I and Phase II.
Inpatient mortality and complications related to all 3 procedures decreased from Phase I to Phase II (for mortality, CABG surgery Adj. OR = 0.70, 95% CI [0.66, 0.75], hip and knee replacement Adj. OR = 0.78, 95% CI [0.61, 1.00]), there were no significant differences by phase after controlling for secular trends in other hospitals (for mortality CABG Adj. OR = 1.09, 95% CI [0.90, 1.32], hip and knee replacement Adj. OR = 0.85, 95% CI [0.54, 1.32]). Sensitivity analysis founds similar results when examining just hospitals in the bottom 20%.
62

Pay for Performance Programs in Healthcare Evidence-based Synthesis Program
Study; Design; N
Setting; Observation period
Program and incentive description Comparison Findings on Implementation Factors – Program
Features
Vamos et al, 201141 Retrospective cohort Interrupted Time Series Diabetes patients n=154,945
Ambulatory UK 1997-2005
QOF
Compared the pre- and post-QOF achievement trends for HbA1c, blood pressure, and total cholesterol in diabetic patients by practice size.
The proportion of diabetic patients achieving blood pressure targets was rising before the QOF, increased by 2.2 percentage points in the year the QOF was introduced, and an additional 1.6 percentage point in the second year. There was no significant difference by practice size. For cholesterol, prior to the QOF, there was an annual improvement of 4.9 percentage points, with no change in the first year, and an additional 2.5 percentage points in year 2. While larger practices had lower rates of achievement in 1998, there was no difference by practice size after QOF implementation. For HbA1c, there as annual increase in achievement of 2.0 percentage points, with no change in year one, and a 0.2 percentage point decline in year 2. In 1999 and 2000, larger practices had lower target achievement than smaller practices; however, there was no difference in achievement after QOF implementation.
Features related to processes of care and patient outcomes Ashworth and Armstrong, 200627 Retrospective cohort 8480 practices
Ambulatory UK 2004-2005
QOF
Examined the relationship between total QOF score and practice characteristics (group vs singlehanded, training practice, practice list size, and proportion of patients older than 75.
Group practices had an average of 76.1 more QOF points than single-handed (individual) practices. Being a training practice (p<.001), and having more full time GPs, and having a larger proportion of patients 75 or older were predictive of higher QOF scores; whereas, having fewer than 1,000 patients and or more than 2,500, or less than 5% or more than 10% patient turnover were predictive of lower QOF scores.
Ashworth et al, 201128 Retrospective cohort 212 practices
Ambulatory UK 2005-2008
QOF
Examined characteristics of poorly performing practices (lowest 10% over 4 years) by practice characteristics (group vs singlehanded), practice list size, and provider age and gender.
The strongest predictors of poor performance were single-handed (individual) status (OR = 32.12, 95% CI [15.65, 65.91], p<.001), and training practice status, with non-training practices more likely to perform poorly (OR = 16.56, 95% CI [6.77, 39.99], p<.001). In addition, as compared with practices with list sizes of 1500-2000 patients, poorer-performing practices were more likely to have less than 1500 patients, or more than 3500. Providers in poorer-performing practices were more likely to be male (OR = 2.03, 95% CI [1.24, 3.33], p<.001) and older, with odds ratios increasing significantly for each age group (<45, 45-54, 55-64, >65; OR = 7.32, 95% CI [3.68, 14.58], p<.001 for providers >65 as compared with providers <45).
63

Pay for Performance Programs in Healthcare Evidence-based Synthesis Program
Study; Design; N
Setting; Observation period
Program and incentive description Comparison Findings on Implementation Factors – Program
Features
Caley et al, 201418 Simulation of a change in performance thresholds using most recent data 55.5 million patients, 8123 practices
Ambulatory UK 2011-2012
QOF
Examined the effect of applying a proposed 75th percentile upper payment threshold to clinical performance indicators on the estimated impact of clinical workload and incentives if performance remained static, and any differential effect by practice characteristics.
Moving the maximum threshold to the 75th percentile of national performance would effectively increase the upper achievement threshold of each indicator by a mean of 7.47%. If performance remained static, practices would lose an average of 47.68 QOF points, which translates to a loss of £279.60. The average practice would need to improve on 339 metrics to retain previous compensation level but because multiple metrics relate to the same disease area it means that care would need to be improved for a small number of patients and conditions. There was a significant negative relationship between income and deprivation score and percentages of patients who are <15 and ≥65, and a positive relationship was significant for the percentage of female GPs in a practice.
Chen et al, 20123 Cross-sectional 146,481 pts
N/A Taiwan 2007
Data from the DM-P4P and Taiwan’s National Health Insurance database.
Compared the reliability and accuracy of latent and non-latent methods of constructing composite quality scores. Compared raw sum composite measures with those based on latent constructs using a) Item Response Theory, and b) Principle Component Analysis.
There was moderately high correlation between the 3 methods in the agreement of hospital rankings. For non-latent methods, raw sum scores more reliable than all or none scores. However, latent methods were more reliable than non-latent methods. Authors recommend adding latent scores into P4P structures, particularly for measures that might have a ceiling effect.
Walker et al, 20102 Economic analysis N=NR
Ambulatory UK 2004-2005
QOF Examined the cost effectiveness of 9 indicators by calculating the mean payments per treated patient, post-QOF utilization levels, quality-adjusted life years, and examining prior cost-effectiveness literature.
Average indicator payments ranged from £0.63 to £40.61 per patient, and the percentage of eligible patients treated ranged from 63% to 90%. The proportional changes required for QOF payments to be cost-effective varied widely between the indicators. Although most indicators required only a fraction of a 1% change to be cost-effective, for some indicators improvements in performance of around 20% were needed. The lower cost per quality-adjusted life years and the lower price received per patient, the lower the increase in utilization required for the payments to be a cost-effective use of resources.
64

Pay for Performance Programs in Healthcare Evidence-based Synthesis Program
Study; Design; N
Setting; Observation period
Program and incentive description Comparison Findings on Implementation Factors – Program
Features
Werner & Dudley, 200914 Simulation of different payment strategies using CMS data
Hospital US 2004-2005
Data from CMS Hospital Compare system. Calculated diagnosis-related group (DRG) based bonus payments using the 2005 Medicare Provider Analysis and Review (MedPAR) file.
Compared bonuses payment strategies and payments for 5 P4P payment strategies (relative rank; relative rank with penalties; target attainment; target attainment plus improvement; percentage recommended) on 18 measures for 3 conditions (AMI, heart failure, pneumonia).
Findings indicate that relative rank strategies concentrate bonuses among the top performing hospitals, creating a large gradient between high/low performers, with the potential of providing low performers little incentive to improve. This is further accentuated by the penalties added in the relative rank with penalty strategy, with payments potentially worsening care in low performing hospitals. The target attainment strategy results in a more even distribution of bonuses. However, it may provide little incentive for improvement beyond the target, and lower performing hospitals may have little incentive for improvement. Adding improvements into the target attainment strategy may mitigate this risk. The percentage recommended strategy creates incentives for all hospitals to improve. However, it creates only a small gradient between low and high performing hospitals, and may results in inefficiencies associated with fee for service. Authors conclude that P4P strategies should be designed with program goals in mind within the context of the setting, and that the use of multiple strategies may engage providers across the spectrum of performance levels.
65

Pay for Performance Programs in Healthcare Evidence-based Synthesis Program
Study; Design; N
Setting; Observation period
Program and incentive description Comparison Findings on Implementation Factors – Program
Features
Doran et al, 2010 32 Retrospective Cohort 7502 practices 46.7 million patients
Ambulatory UK 2004-2005 2005-2006 2006-2007
QOF Compared the median percentage of QOF points scored, variation in points scored, the percentage of practices scoring maximum points, achievement, exception reporting, and population achievement (includes excluded patients) by practice size.
For the median percentage of QOF points scored, there was a clear progression based on practice size, with larger practices scoring higher (eg, practices with ≥12,000 patients 97.6%) than smaller practices (eg, practices with 1000-1999 patients 92.6%) in year one, with gaps decreasing in years 2 (5.1%) and 3 (2.5%). Variation in points scored decreased with increasing number of patients (eg, 13.7% for practices with 1000-1999 patients and 4.9% for practices with ≥ 12,000 patients), with variation decreasing in year 2 and no change in year 3. The fewest practices with 2000-2999 patients scored maximum points (7%), with the greatest number of practices scoring maximum points having patient list sizes between 6000-7999 (10.5%). The rate of increase was the slowest for the smallest practices (1000-1999 patients), and by year 3 50% fewer practices with 1000-1999 patients achieved maximum points as compared with the largest practices (≥12,000 patients). Regardless of practice size, the percentage of patients for whom targets were achieved increased after introduction to the QOF. In year one, patients with the fewest patients had the lowest median percentage of patients achieving targets (83.8%) with the highest mean percentage for practices with 5000-7999 (85.9%). Similar to points scored, variation decreased with list size; however, both the lowest and highest achievement rates were attained by the smallest practices (13.2% were among the top 5% and 12.1% were among the bottom 5% in year one). By year 3 there was little difference in achievement rates by practice size; however, the smallest practices had the highest achievement rate (91.5%) and the largest practices had the lowest (90.4%). For exception reporting, practices with larger list sizes excluded a larger percent of patients (6.8% in practices with ≥12,000 patients vs 6.3% in practices with 1000-1999 patients). There was greater variation in small practices, with the smallest practices having both the highest and lowest exception reporters. When excluded patients were considered, the smallest practices had the highest median population achievement, but also the greatest variation. Thus, small practices achieving both high and low levels was not accounted for by exception reporting.
66

Pay for Performance Programs in Healthcare Evidence-based Synthesis Program
Study; Design; N
Setting; Observation period
Program and incentive description Comparison Findings on Implementation Factors – Program
Features
Feng et al, 201420 Retrospective cohort 854 practices
Ambulatory UK 2004-2007
QOF
Compared performance before and after an increase in maximum payment thresholds.
The increased maximum threshold resulted in an increase in GP performance by a mean of 1.77%. Low-performing GPs improved significantly more (13%) than their high-performing counterparts (0.24%). Increased thresholds were positively related to exception reporting in competent and underperforming practices, and findings suggest that the maximum achievable points, # of patients per GP, and workload are negatively associated with GP performance.
Morgan and Beerstecher, 200633 Retrospective cohort 164 practices within 6 primary care trusts
Ambulatory UK (2004-5 QOF data)
QOF
Compared contract and employment status to determine association with practice funding and QOF scores.
Higher funding levels in practices with employed providers were associated with lower QOF scores, but higher funding levels in contract practices were associated with higher QOF scores. Being a contractor rather than being employed by a practice was associated with greater efficiency and higher quality.
Tahrani et al, 200834 Observational retrospective County N=460,000; Diabetes N=16,858
Ambulatory UK April 2004-March 2006
QOF
Compared proportion of patients achieving diabetes indicator targets pre-QOF and one and 2 years post-QOF by practice size.
The majority of indicators did not significantly differ by practice size prior to the QOF, with the exception of eye exam recording and HbA1c targets. After QOF implementation, HbA1c target attainment improved significantly regardless of size, and while there was no difference in attainment for HbA1c ≤ 7.4% by practice size, patients in small practices were significantly more likely to attain HbA1c ≤ 10% (p = .04) and attain ACE inhibitor prescription targets (p = .001)
Walker et al, 201129 Cross-sectional survey 230 GPs, Pt range 707-34494
Ambulatory UK April 2007-March 2008
QOF .
Compared recording rates of chronic kidney disease (CKD) by practice characteristics (list size, training practice status, total QOF points attained, % of patients older than 64, recording rate of stroke, hypertension, and diabetes).
Findings from univariate results indicated significant correlations (Spearman’s rho) between CKD recording and recording rates of hypertension (0.49, 95% CI [0.37, 0.58], p<.001), diabetes (0.22, 95% CI [0.09, 0.34], p<.001), stroke (0.43, 95% CI [0.31, 0.53], p<.001), practice list size (0.17, 95% CI [0.04, 0.3], p=.009), total QOF attainment (0.30, 95% CI [0.17, 0.41], p<.001) and patients > 64 (r = 0.45, 95% CI [0.33, 0.55], p<.001). There was no significant association for training practice status. Multivariate analysis resulted indicated that higher CKD recording rates were associated with higher recording rates for hypertension (p<0.001) and stroke (p<0.01).
67

Pay for Performance Programs in Healthcare Evidence-based Synthesis Program
Study; Design; N
Setting; Observation period
Program and incentive description Comparison Findings on Implementation Factors – Program
Features
Wang et al, 200630 Cross-sectional 638 practices; 3,781,046 pts
Ambulatory UK - Scotland 2002 and 2005
QOF
Compared median points obtained in each QOF domain and disease category by practice size.
The mean total QOF points was higher for larger practices than smaller practices (p=.003); however, the only domain-specific difference that reached significance was organizational, with more points attained by larger practices (p-.002). Within the clinical domain, the only statistically significant differences in point achievements were for COPD (p=.02), with single-handed (individual) and medium practices achieving more points, and CHD (p<.0001) with larger practices achieving more points; however, the absolute differences in points were very small. When examining only practices in the most deprived areas, larger practices had a higher median score on the organizational domain (p=.002), and larger practices obtained more mental health points (p=.045). No other significant differences emerged.
68

Pay for Performance Programs in Healthcare Evidence-based Synthesis Program
What Implementation Factors are Associated with Changes in Provider Cognitive and/or Behavioral Outcomes?
Fourteen of the included studies examined factors associated with changes in provider cognitive and/or behavioral outcomes, of which one examined the QOF (Table 10 provides study detail). In addition, many of our key informants stressed the importance of thoughtful consideration of a balance between intrinsic and extrinsic motivation, as well as designing and implementing programs to maximize positive outcomes and mitigate negative unintended consequences.
Findings from Included Studies
Studies found that an emphasis on clinical quality and patient experience criteria was related to increased coordination of care, improved office staff interaction, and provider confidence in providing high-quality care.6,11 Conversely, an emphasis on productivity and efficiency measures were associated with poorer provider and office staff communication, and that incentives tied to a reduction in services were perceived as lowering providers’ ability to provide high levels of care.9,11 In addition, one study surveyed administrators and managers about the overall effectiveness of a P4P program and found that factors predictive of the perceived effectiveness of the program included both the communication of goal alignment and the alignment of individual goals to institutional goals, and another found that providers believed that the P4P program increased a clinician’s focus on issues related to quality of care.7,12,13
Related to the decision to participate in P4P, one study, examined the extent to which incentive size related to the decision to participate in P4P programs, and found no that no clear amounts determined decisions to or not to participate, but rather that there was a positive relationship between participation and the potential for rewards, which often related to the ability to participate in multiple P4P programs.8 In addition, Saint-Lary and others surveyed providers in France about their decision not to sign an optional P4P contract.42 Findings indicate that providers who had knowledge of the indicators were more likely to have signed the contract, and that among those who did not sign, providers were concerned about ethical risks such as the lack of patients’ knowledge of P4P, the potential for conflicts of interest, that patients might interpret a provider’s participation in P4P as unethical, and the risk of excluding vulnerable patients.
Related to performance, one study compared providers participating in a P4P program whose underlying payment structures were fee-for-service or blended capitation, and found that the underlying payment structure influences P4P performance, and found that those in a blended capitation model were more responsive to P4P, and that that higher incentives may be necessary when the degree of cost sharing is lower.4 Another study found that after controlling for covariates, while perceived financial salience was significantly related to a high degree of performance, attitudes, such as the effectiveness of targets influencing health outcomes and that benchmarks would influence patient health, were not. In addition, greater perceived autonomy was associated with lower odds of being in the top tercile.5 Finally, the third study found that while prior to P4P program implementation there was no relationship between perceived goal importance or work autonomy, after P4P was implemented, individuals placing a higher degree of importance on goals/quality targets performed better, with poorer performance by providers who believed that P4P reduces work autonomy.13
69

Pay for Performance Programs in Healthcare Evidence-based Synthesis Program
With regard to the influence of the size of incentives, a study by Rodriguez and others examined the relationship between P4P and patient experience in California over a 3-year period, and found that as compared with larger incentives (>10%), smaller incentives were associated with greater improvements in provider communication and office staff interaction measures.11 These findings were contrary to the authors’ hypotheses, and they determined that their findings may have been influenced by the tendency of practices with smaller incentives to incentivize clinical quality and patient experience measures (vs productivity measures), which were also associated with improvements in office staff interaction. Finally, Gemmell and colleagues (2009) compared weekly staff workloads pre-and-post QOF, and found that while the number of hours worked by physicians and nurses did not change post-QOF, the rate of nursing visits increased while at the same time visit rates for physicians decreased, and that after the introduction of the QOF, nurses saw a significantly higher number of complex patients.35
Themes from Key Informant Interviews
Discussions of provider characteristics, behavior, and particularly the balance between intrinsic and extrinsic motivation were a common topic in our key informant interviews. Most KIs framed these discussions around increasing intrinsic motivation through the alignment of programs to provider values and provider buy-in, and minimizing the potential unintended consequences that may be associated with too much focus on extrinsic rewards. However, one KI stressed the belief that intrinsic motivation will “trump” extrinsic rewards (in the absence of other accompanying interventions) and cited self-determination theory (SDT) as the primary force that drives provider behavior.113 According to SDT, intrinsic motivation is enhanced through communication and feedback, allowing one to make the link between intrinsic motivation, autonomy, and competence. Within the context of P4P, our KI suggested that given the data necessary to support improvement within an environment that is supportive and encouraging, providers will default to what they are intrinsically motivated to do – or the “right thing for patients.” The key, stressed by our key informant, is that reliable data (eg, their scores as compared with others) are presented to providers in a way that is non-judgmental and within the context of a quality improvement model, and that congruence exists between what they are being asked to do and what they believe is best for their patients. This KI, along with others, also stressed the importance of providing clear, consistent, constructive, and non-judgmental feedback to providers – that providers will respond if they understand how their scores compare with other providers within their organization, and are given the opportunity to vocalize concerns, and are provided with examples of methods used by high-performing providers.
Key informants also felt that P4P programs currently place too much emphasis on physicians. Quality of care and patient experience is contingent upon all members of a practice, and P4P programs often increase workloads for nurses and other staff; thus, distributing incentives to both clinical and non-clinical staff will increase professionalism and buy-in. Related to buy-in, KIs also stressed the importance devoting resources to implementation in P4P programs, particularly when new measures are introduced. One important component is the proper dissemination of the evidence behind, and the rationale for, incentivized measures to enable providers to make the connection between the measures and patient care. They also strongly suggested guidance to providers on how to best meet targets. Transparency and the availability of information was seen as vital, and KIs also felt that programs should have resources devoted to providing support to at the local level (eg, alleviating concerns and addressing program-related questions), including the designation of a local champion to influence and encourage peers. KIs in the UK pointed to
70

Pay for Performance Programs in Healthcare Evidence-based Synthesis Program
guidance documents for the GMS contract, released yearly, which clearly outline all indicators including the rationale for the targets, and provide easy-to-understand information regarding program changes. In addition, indicators in the UK are managed by NICE through a transparent process that involves policy makers, providers, clinical staff, researchers, and patients. Stakeholders are involved throughout the process, and provide feedback as advisory board members, through open meetings with the public, and through the ability to comment publicly on NICE’s website. The importance of stakeholder involvement and provider buy-in was echoed by our key informants.
A number of KIs suggested a “bottom-up” approach when developing P4P programs, that is, that providers and other staff, both clinical and non-clinical, be involved in all stages of program development, as part of a panel, or through open forum discussions. They stressed that starting from the “bottom-up” will help to align intrinsic and extrinsic motivation, and that input from and discussions with clinicians and front line staff throughout the process will also help to alleviate concerns, garner buy-in, and thus greatly contribute to program success.
Related to the measures, KIs strongly supported the combination of patient outcomes and processes of care. While incentives should ideally target patient outcomes, key informants also agreed that process of care variables are easier to measure and improve, and may also be valuable in ensuring needed services are available (eg, translators, case management for low-income patients). They stressed process of care measures should be evidence-based, clear and simple, linked to specific actions rather than complex processes, and clearly connected to a desired outcome. In addition, measures should be realistic within the patient population and health system in which they are used, and measure targets should be grounded in clinical significance rather than data improvement. To emphasize this point, one key informant questioned the achievability of, for example, 85% of patients meeting a clinical outcome measure that is reflective of the population mean.
Furthermore, key informants emphasized that measures should reflect the priorities of the organization, its providers, and its local population. Incentives should be designed to stimulate different actions depending on the level of the organization at which they are targeted. For example, incentives targeted to leadership or administrative-level incentives are more likely to result in structural improvements such as investment in information technology, while provider-level incentives are aimed at behavior change. Team-level incentives might address the quality of patient-provider interactions, as well as patient experiences with other members of the team.
Key informants also discussed the influence of features related to the incentive. With regard to the size of the incentive, key informants agreed that that there is no “magic number,” but that the incentive must be large enough to motivate providers or hospital administrators, and not so large as to encourage gaming – with hypotheses ranging from 5-15% as optimal, but that effects may vary based on the organizational culture, the type of incentivized measures, and numerous other factors. In addition, consistent across KIs was the belief that incentives should be based on improvements, and that all program participants should have the ability to earn incentives. In the case of competition-based programs, one KI suggested grouping participants by similar characteristics (eg, patient socioeconomic status [SES]) with competitions within groups to allow hospitals/providers in areas of lower SES to better compete. KIs stressed that the magnitude of the incentive attached to a specific measure should be relative to organizational priorities, as not only does the presence of an incentive alone suggest prioritization, but the degree of priority is
71

Pay for Performance Programs in Healthcare Evidence-based Synthesis Program
further emphasized by the magnitude of the incentive. Furthermore, one KI suggested that the magnitude of incentives be relative to the degree of clinical improvement. KIs also agreed that when designing incentives, penalties, as compared to rewards, may be more effective at the provider level, and stressed the importance of linking provider-level incentives to the program (ie, providers must be able to make the connection between their behavior and the reward). Despite decreases over time for the QOF in the percentage of general practitioner (GP) income linked to incentives (from roughly 35% to 15%), incentives remain much higher in the UK than in the US, where incentives have approximated 1 to 2% federally and roughly 5 to 10% in many private programs. The relatively small incentives in the US present a challenge, in that the more frequent incentive payments (eg, monthly) recommended by some of our KIs in order to better link behavior and reward for providers would likely be too low to be noticed, and while yearly payments would be larger, they may still be too low in addition to not being frequent enough to reinforce behavior. KIs agreed that in general the lack of consistent effect (both positive and negative) associated with P4P in the United States likely stems from the size of the incentive.
72

Pay for Performance Programs in Healthcare Evidence-based Synthesis Program
Table 10. KQ2 Implementation Factors Associated with Changes in Provider Cognitive and/or Behavioral Responses
Study; Design; N
Setting; Observation period
Program and incentive description Comparison Findings on Implementation Factors – Provider
Responses
Baek et al, 20136 Survey 1733 physicians
Ambulatory US 2004-2005
Secondary analysis of nonfederal PCPs from the 2004-2005 Community Tracking Study Physician Survey.
Compared whether financial incentives targeting care quality/care content affect the ability to provide high-quality care differently than incentives targeting productivity increases, after accounting for a PCMH consistent practice climate.
Incentives linked to care quality/content were associated with greater confidence in providing quality care, after adjusting for PCMH practice climate and other structural constraints (strongly agree Adj. OR = 1.33, 95% CI [1.13, 1.56], p<.01). Productivity-linked FI was negatively associated with ability to provide quality care (strongly agree Adj. OR = 1.89, 95% CI [0.79, 0.99], p<.05), but adjusting for PCMH practice climate mitigates the negative effect (strongly agree Adj. OR = 0.95, 95% CI [0.84, 1.08], ns).
Begum et al, 201336 Survey 140 small practices with at least 200 CVD pts
Ambulatory US 2009-2011
Health eHearts was a 2-year program that included 140 small practices that had an EMR and a minimum of 200 patients with CVD. Incentives ranged from $20-150 per patient with higher payments to treat patients from low SES or with co-morbid conditions. Providers were incentivized on aspirin therapy, BP control, cholesterol control, and smoking cessation intervention.
Compared program evaluation survey results for the incentive group vs a control (recognition) group.
As compared with the control (recognition) group, providers receiving incentives were more likely to report that they received and reviewed quality reports (p=.02), that they had a QI visit (68% vs 43%, p=.01), and that they had a positive response to trainings and webinars.
De Brantes and D'Andrea, 20098 Cross-sectional 3521 practices in MA; 971 practices in NY
Ambulatory US (KY, OH, NY, MA) 2003-2005
Bridges to Excellence (BTE). The key feature of BTE is the active collaboration of employers and health plans wherein all agree to focus on 1 or more of the programs for at least 3 years in order to encourage physicians to meet or exceed the programs' performance criteria. Each program (within BTE) has a recommended fixed bonus reward to providers or a practice per eligible patient. Bonus is paid to physician or practice once their performance is assessed and recognized based on patient care for all a provider/practice’s patients, not just BTE purchasers.
Examined total bonus potential for all providers in 2 BTE programs by calculating for each reward level the percentage of providers/practices that achieved recognition.
Provider response rates to P4P programs indicated that higher rewards lead to greater participation; however, there was no single “cut off” reward above which providers chose to participate in optional programs. In comparing responses specific to the 2 programs, authors concluded that providers likely go through an individual “return on investment” analysis before considering participation. Results appear to dispel the hypothesis that a provider’s readiness to meet quality standards is the primary cause for optional P4P participation, as participation was positively related to the amount of the reward.
73

Pay for Performance Programs in Healthcare Evidence-based Synthesis Program
Study; Design; N
Setting; Observation period
Program and incentive description Comparison Findings on Implementation Factors – Provider
Responses
Gemmell et al, 200935 Before-after study 42 practices
Ambulatory UK 2003-2005
QOF
Compares staff workload and the number and complexity of patient visits among physicians and nursing staff pre-and post-QOF introduction.
There was no significant change in the mean number of hours worked per week by nursing staff or physicians, but nurse visit rates increased while physicians' rates decreased. In addition, nursing staff dealt with more complex visits post-QOF introduction (p<0.001) but there was no change for doctors. Authors conclude that nursing staff absorbed a higher proportion of the clinical workload, while doctors focused more attention on chronic and preventive care.
Hadley et al, 20069 Telephone Survey 12,406 physicians
N/A US N/A
Analyzed the 2000-2001 Community Tracking Study Physician Survey.
Examined factors related to incentives that favor reducing services to individual patients, expanding services to individual patients, or neither.
Physicians perceived incentives tied to a reduction in services as lowering their ability to provide a high level of care. There was no difference in perceptions of ability to provide high quality of care between incentives that are neutral or those that incentivize increased services.
Helm et al, 20077 Survey 4754 (2005), 7112 (2006) employees
N/A US 2005-2006
Survey of administrators, managers, and employees to evaluate the effectiveness of a new performance management system that included P4P.
Examined survey responses by administrators and managers related the communication of goals, alignment of goals and the usefulness of tools to the program’s effectiveness.
Administrators and managers’ perceptions that the process was effective in aligning individual goals to institutional goals (p<.01) and communicating the institutional goals to link pay for performance (p<.01) were predictive of perceptions of effectiveness. Administrators and managers did not perceive tools such as an intranet site and training as predicting program effectiveness.
Hearld et al, 2014 10 Survey 1809 practices
Ambulatory US 2007-2009
Secondary analysis of data from the National Survey of Small and Medium-Sized Physician Practices (NSSMPP) funded by the Robert Wood Johnson Foundation. Surveys were conducted with the highest-ranking physician or non-physician administrator in the practice, and asked about participation in P4P and public reporting programs, administrative problems associated with program participation, and practice characteristics.
Examined administrative problems related to P4P program participation.
21.9% reported a high level of administrative problems due to lack of standardization in quality performance measures. More administrative problems were associated with larger practice size and smaller percentages of low-income uninsured patients.
74
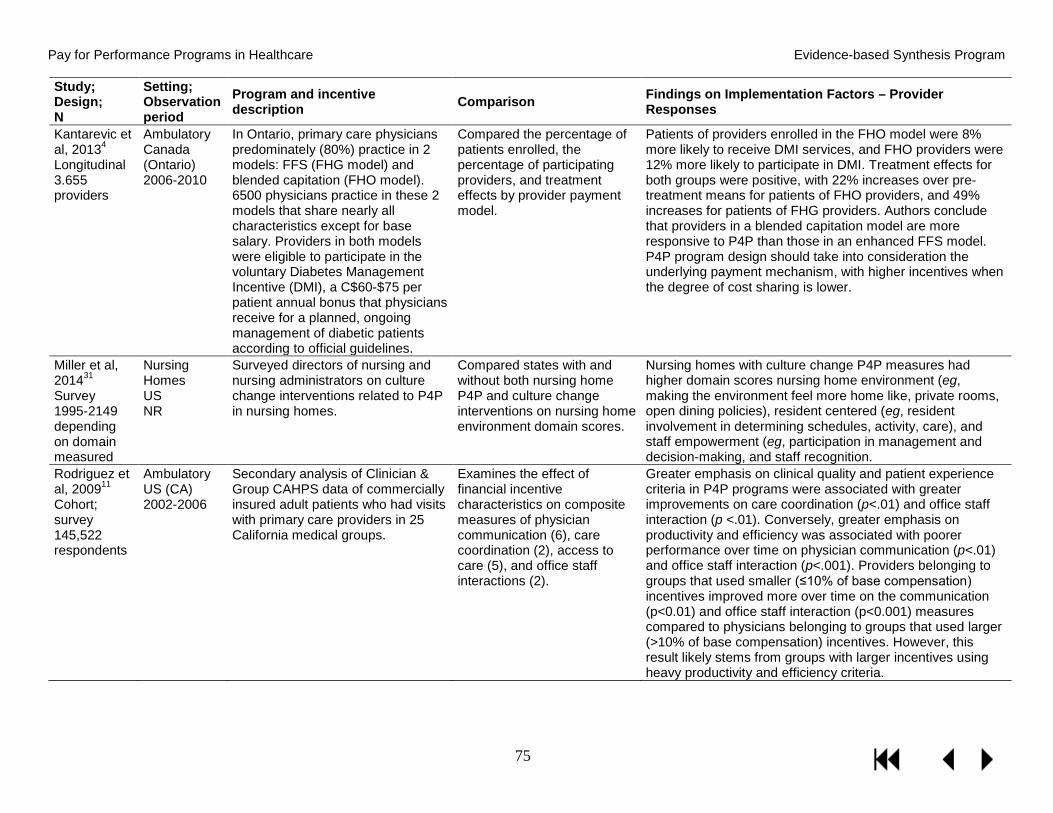
Pay for Performance Programs in Healthcare Evidence-based Synthesis Program
Study; Design; N
Setting; Observation period
Program and incentive description Comparison Findings on Implementation Factors – Provider
Responses
Kantarevic et al, 20134 Longitudinal 3.655 providers
Ambulatory Canada (Ontario) 2006-2010
In Ontario, primary care physicians predominately (80%) practice in 2 models: FFS (FHG model) and blended capitation (FHO model). 6500 physicians practice in these 2 models that share nearly all characteristics except for base salary. Providers in both models were eligible to participate in the voluntary Diabetes Management Incentive (DMI), a C$60-$75 per patient annual bonus that physicians receive for a planned, ongoing management of diabetic patients according to official guidelines.
Compared the percentage of patients enrolled, the percentage of participating providers, and treatment effects by provider payment model.
Patients of providers enrolled in the FHO model were 8% more likely to receive DMI services, and FHO providers were 12% more likely to participate in DMI. Treatment effects for both groups were positive, with 22% increases over pre-treatment means for patients of FHO providers, and 49% increases for patients of FHG providers. Authors conclude that providers in a blended capitation model are more responsive to P4P than those in an enhanced FFS model. P4P program design should take into consideration the underlying payment mechanism, with higher incentives when the degree of cost sharing is lower.
Miller et al, 201431 Survey 1995-2149 depending on domain measured
Nursing Homes US NR
Surveyed directors of nursing and nursing administrators on culture change interventions related to P4P in nursing homes.
Compared states with and without both nursing home P4P and culture change interventions on nursing home environment domain scores.
Nursing homes with culture change P4P measures had higher domain scores nursing home environment (eg, making the environment feel more home like, private rooms, open dining policies), resident centered (eg, resident involvement in determining schedules, activity, care), and staff empowerment (eg, participation in management and decision-making, and staff recognition.
Rodriguez et al, 200911 Cohort; survey 145,522 respondents
Ambulatory US (CA) 2002-2006
Secondary analysis of Clinician & Group CAHPS data of commercially insured adult patients who had visits with primary care providers in 25 California medical groups.
Examines the effect of financial incentive characteristics on composite measures of physician communication (6), care coordination (2), access to care (5), and office staff interactions (2).
Greater emphasis on clinical quality and patient experience criteria in P4P programs were associated with greater improvements on care coordination (p<.01) and office staff interaction (p <.01). Conversely, greater emphasis on productivity and efficiency was associated with poorer performance over time on physician communication (p<.01) and office staff interaction (p<.001). Providers belonging to groups that used smaller (≤10% of base compensation) incentives improved more over time on the communication (p<0.01) and office staff interaction (p<0.001) measures compared to physicians belonging to groups that used larger (>10% of base compensation) incentives. However, this result likely stems from groups with larger incentives using heavy productivity and efficiency criteria.
75

Pay for Performance Programs in Healthcare Evidence-based Synthesis Program
Study; Design; N
Setting; Observation period
Program and incentive description Comparison Findings on Implementation Factors – Provider
Responses
Saint-Lary et al, 01342 Cross-sectional survey 1,016 GPs
Ambulatory France 2011
French GPs had the option of signing a P4P contract (CAPI) and earn up to €5,000 bonuses based on achievement of 16 indicators (prevention and screening, chronic diseases, prescription). Providers had the option of opting out at any time without penalty.
Compared the perception of ethical risks associated with P4P by contract participation and the provider characteristics associated with signing CAPI contracts.
The perception of potential ethical risks was significantly associated with providers’ decisions about whether to sign CAPI contracts. The 4 perceived ethical risks that were significantly associated with a greater probability of not signing a CAPI were the perceived discomfort with the fact that patients were not informed of whether their GP has signed a CAPI or not (OR = 8.24; 95% CI [4.61,14.71]), the potential occurrence of new conflicts of interest (OR = 4.50, 95% CI [2.42, 8.35]), the potential interpretation by patients that the physician has breached professional ethics (OR = 4.35, 95% CI [2.43, 7.80]), and the risk of excluding the most vulnerable patients (OR = 2.66, 95% CI [1.53, 4.63]). Conversely, considering that a low premium amount could minimize the risk of adverse events (OR = 0.38, 95% CI [0.19, 0.76]) and viewing the P4P as a reflection of the quality of medical practice (OR = 0.31, 95% CI [0.16, 0.61]) decreased the probability of failing to sign and thus favored the signing of a P4P. The socio-demographic characteristics of GPs were not associated with decisions to sign CAPI contracts.
76
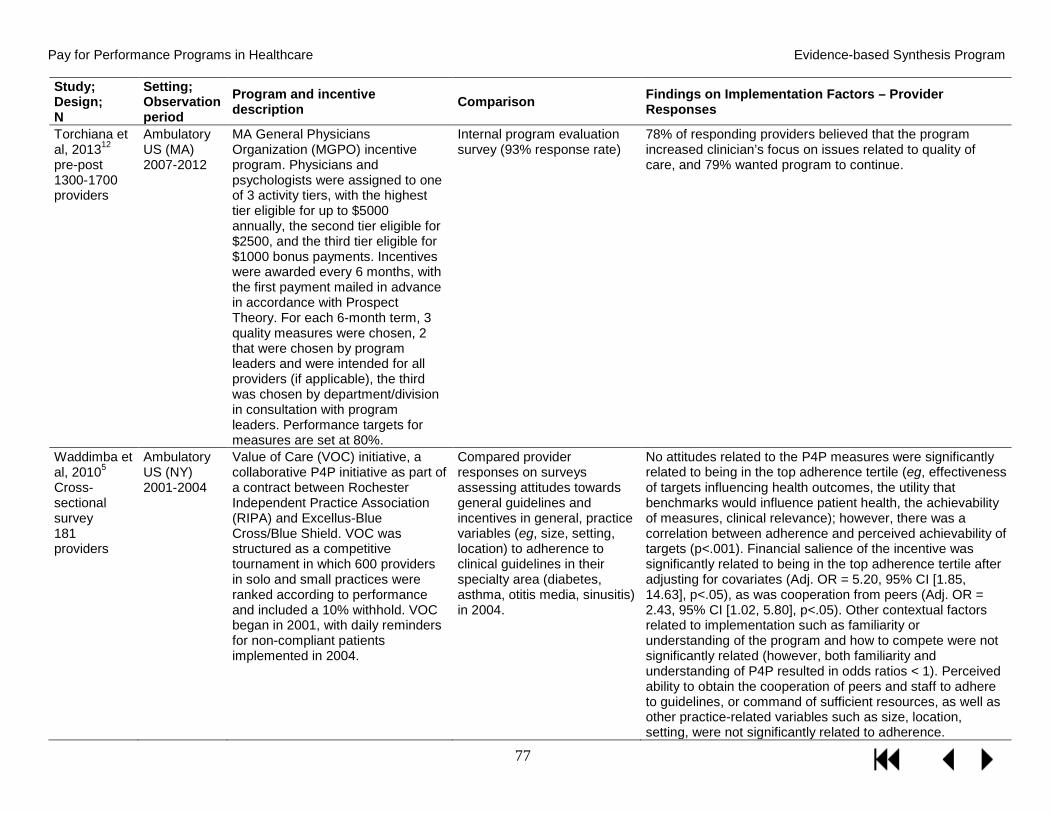
Pay for Performance Programs in Healthcare Evidence-based Synthesis Program
Study; Design; N
Setting; Observation period
Program and incentive description Comparison Findings on Implementation Factors – Provider
Responses
Torchiana et al, 201312 pre-post 1300-1700 providers
Ambulatory US (MA) 2007-2012
MA General Physicians Organization (MGPO) incentive program. Physicians and psychologists were assigned to one of 3 activity tiers, with the highest tier eligible for up to $5000 annually, the second tier eligible for $2500, and the third tier eligible for $1000 bonus payments. Incentives were awarded every 6 months, with the first payment mailed in advance in accordance with Prospect Theory. For each 6-month term, 3 quality measures were chosen, 2 that were chosen by program leaders and were intended for all providers (if applicable), the third was chosen by department/division in consultation with program leaders. Performance targets for measures are set at 80%.
Internal program evaluation survey (93% response rate)
78% of responding providers believed that the program increased clinician’s focus on issues related to quality of care, and 79% wanted program to continue.
Waddimba et al, 20105 Cross-sectional survey 181 providers
Ambulatory US (NY) 2001-2004
Value of Care (VOC) initiative, a collaborative P4P initiative as part of a contract between Rochester Independent Practice Association (RIPA) and Excellus-Blue Cross/Blue Shield. VOC was structured as a competitive tournament in which 600 providers in solo and small practices were ranked according to performance and included a 10% withhold. VOC began in 2001, with daily reminders for non-compliant patients implemented in 2004.
Compared provider responses on surveys assessing attitudes towards general guidelines and incentives in general, practice variables (eg, size, setting, location) to adherence to clinical guidelines in their specialty area (diabetes, asthma, otitis media, sinusitis) in 2004.
No attitudes related to the P4P measures were significantly related to being in the top adherence tertile (eg, effectiveness of targets influencing health outcomes, the utility that benchmarks would influence patient health, the achievability of measures, clinical relevance); however, there was a correlation between adherence and perceived achievability of targets (p<.001). Financial salience of the incentive was significantly related to being in the top adherence tertile after adjusting for covariates (Adj. OR = 5.20, 95% CI [1.85, 14.63], p<.05), as was cooperation from peers (Adj. OR = 2.43, 95% CI [1.02, 5.80], p<.05). Other contextual factors related to implementation such as familiarity or understanding of the program and how to compete were not significantly related (however, both familiarity and understanding of P4P resulted in odds ratios < 1). Perceived ability to obtain the cooperation of peers and staff to adhere to guidelines, or command of sufficient resources, as well as other practice-related variables such as size, location, setting, were not significantly related to adherence.
77

Pay for Performance Programs in Healthcare Evidence-based Synthesis Program
Study; Design; N
Setting; Observation period
Program and incentive description Comparison Findings on Implementation Factors – Provider
Responses
Young et al, 201213 quasi-experimental 337: 171 responses (57% response rate)
Ambulatory US (NY) 1999-2004
Rochester Independent Practice Association (RIPA) primary care incentives for the management of diabetes (only one component of RIPA). Physicians had to be a RIPA physician for at least 24 months, with 10+ continuously enrolled patients. Physicians were eligible for bonus payments of approximately $15,000 depending on their relative ranking on a composite measure.
Assessed the impact of the importance of goals/quality targets and attitudes related to the degree to which providers believe that P4P affects their work autonomy on the performance on diabetes quality of care (composite, HbA1c, LDL, nephropathy screenings, and eye exams) for RIPA physicians before and after P4P implementation.
Prior to P4P implementation there was no significant relationship between goal importance or work autonomy and performance. However, after implementation, there were significant differences between performance and goal importance (Cohen’s d= .402, p<.01), as well as work autonomy (Cohen’s d= .487, p<.001), with those placing a higher degree of importance on goals/quality targets performing better after P4P implementation, and poorer performance by providers believing that P4P reduces work autonomy.
78

Pay for Performance Programs in Healthcare Evidence-based Synthesis Program
KEY QUESTION 3: What are the positive and negative unintended consequences, including any effect on health disparities, associated with pay for performance? Forty-two studies examining unintended consequences associated with P4P met inclusion criteria for Key Question 3, of which 33 evaluated the QOF. Among these studies, 28 of the 42 evaluated the effect of P4P on health disparities in populations of low socioeconomic status or racial/ethnic minorities, or examined disparities associated with other characteristics such as age, and multiple conditions. Nineteen studies report findings related to other unintended consequences, such as the effect on unincentivized areas of care (eg, spillover effects), gaming, and cherry-picking/risk selection.
Summary of RAND’s Findings1
The research regarding negative effects associated with P4P is quite limited, providing insufficient evidence to understand these effects. The few empirical studies that have been conducted have either no effects or ambiguous effects. Only one relatively weak study found positive effects in lessening gaps in performance.
A recent RAND review found insufficient evidence of an association between use of quality measures in hospitals and increased the prevalence of teaching-to-the-test (zero out of 4 fair/good-quality studies demonstrating undesired effects), overtreatment/unnecessary care (0 out of one), or worsening disparities (one out of 4).1 In nursing homes, there is insufficient evidence regarding teaching-to-the-test (0 out of 2), cherry-picking (0 out of one), and gaming (0 out of one).1 In the ambulatory setting, the research team could not identify consistent relationships between use of quality measures and cherry-picking (2 out of 3), gaming (one out of 2), teaching-to-the-test (3 out of 8), worsening disparities (one out of 4). There were 3 positive studies suggesting that intermediate outcome measures of ambulatory care for diabetes may have been associated with overtreatment.114 The RAND review found limited evidence regarding a relationship between use of performance measures in P4P and public reporting applications and either worsening or reducing disparities.115,116
Health Disparities
Most of the studies examining differential effects of P4P by race/ethnicity, socioeconomic, or other demographic characteristics came from the UK’s QOF program. In general, there was no strong consistent evidence that P4P had different effects on different patient subgroups, though there were exceptions as noted below. Groups with lower baseline care quality tended to experience greater absolute levels of improvement over the short term.
In key informant discussions about health disparities, it became clear that differences exist by program, and particularly between the UK’s QOF and programs in the United States. A consistent message across our KIs in the UK was that in the first 2 years after its introduction, the QOF successfully decreased health disparities, largely because in general, quality improved in all practices, with lower-performing practices (most often those in areas of high deprivation) demonstrating larger improvements and quickly catching up to practices in more affluent areas. However, key informants noted that once practices were performing near the upper thresholds, the costs associated with eliminating the small gap that remained were higher in areas with
79

Pay for Performance Programs in Healthcare Evidence-based Synthesis Program
higher deprivation, and that therefore providers in more affluent areas were more likely to receive incentives.
In the United States, the relationship between P4P and health disparities has not been well-studied. A number of KIs stressed the lack of formal evaluation of health disparities in US programs, the importance of the collection of cultural variables to allow for an accurate assessment, and the need for consistency across measures to allow for formal evaluation. They felt that targeted measures to assess health disparities are needed, but also recognized the challenges associated with different patient populations by practices/hospitals, thus limiting the ability to conduct meaningful analyses due to limited sample sizes.
KI’s with knowledge of P4P within the VHA felt that VHA P4P programs have been successful in improving quality in low-income and racial/ethnic minority patients, and that programs have not exacerbated health disparities. Key informants both in the United States and the United Kingdom recommended stratifying providers/hospitals by SES, with one KI suggesting that in the case of competition-based programs, hospitals compete only with others with similar characteristics, and another KI suggesting that providers in low-income areas be awarded a greater number of points.
Race/Ethnicity
Of the 24 studies evaluating the effect of P4P on health disparities (see Table 11 for study detail), 12 examined disparities in more than one category (eg, race/ethnicity and SES), and all but 3 studies examined the QOF. Thirteen studies examined the differential effect of P4P by race/ethnicity. Findings indicate that in the short term, the QOF was associated with a reduction in blood pressure for whites.117 However, results for black and South Asian populations are less clear, with mixed findings across studies.73,117-119 Over a 3-year period, the QOF was related to better blood pressure and cholesterol monitoring and control regardless of race/ethnicity.73,104,118 In addition, the QOF was associated also with increases in smoking status recording for all patients, with Bangladeshis71 experiencing the lowest rate of improvement, and little variation among racial/ethnic groups in smoking cessation advice.117,120 Furthermore, while the QOF was related to reductions in HbA1c for South Asians in the first year, no reductions were seen in other groups, and by the third year of the QOF, levels for all groups increased. Finally, blacks and South Asians104 were more likely than whites to be excluded from the HbA1c indicator37 through exception reporting and were less likely to achieve treatment targets for HBA1c, blood pressure, and cholesterol. In the United States, a study examining the Bronx CHAMPION program, serving primarily low-income ethnic minority patients, found that with the exception of Asians, all groups (black, Hispanic, white, Multiracial) experienced a significant improvement in quality of care along a wide range of measures. In addition, the degree to which blacks improved was similar to that of non-Hispanic whites, with Hispanics, particularly Spanish-speakers,85 experiencing the smallest improvements.
80

Pay for Performance Programs in Healthcare Evidence-based Synthesis Program
Table 11. KQ3 Health Disparities: Race/Ethnicity
Study; Design; N
Setting; Observation period
Program and incentive description Comparison Findings related to health disparities - Race/Ethnicity
Addink et al, 2011121 Survey comparison 222 GPs
Ambulatory UK 2006-2008
QOF Compared differences in patient survey responses (2006-2007 vs 2007-2008) by % of ethnic minority patients (< 35% vs ≥ 35% minority) for perception of access to care.
Practices with higher proportions of ethnic minority patients were more likely to be perceived by patients as delivering poorer access (being satisfied with opening hours, being able to see a particular doctor, being able to see a doctor within 48 hours, satisfaction with telephone access), although there were some improvements over time.
Alshamsan et al, 2012104 Longitudinal cohort Interrupted time series 7,434
Ambulatory UK 2000-2007
QOF Compared white, black, and South Asian patients with diabetes on achievement of HbA1c, total cholesterol, systolic blood pressure, and diastolic blood pressure.
Prior to the QOF, mean HbA1c, total cholesterol, and diastolic blood pressure levels were decreasing for all 3 groups. Mean systolic blood pressure was decreasing only in white patients. Relative to the pre-QOF trend, the first year of the QOF was associated with significant reductions in total cholesterol and systolic blood pressure for white and black patients, but not South Asians. Significant diastolic blood pressure reductions were experienced by white patients only, and mean HbA1c levels increased for South Asian patients, but not other groups. Over the next 3 years, relative to the pre-QOF trend, for diastolic blood pressure all 3 groups remained unchanged, there were significant reductions in systolic blood pressure for black and South Asian, but not white patients, mean total cholesterol levels remained unchanged in black and South Asian patients, and increased significantly in white patients, and HbA1c increased significantly for all 3 groups.
Ashworth and Armstrong, 200627 Cross-sectional 8480 practices
Ambulatory UK 2004-2005
QOF
Examined the relationship between total QOF score and percent of patients born in a developing country.
Having less than 5% of patients born in a developing country was predictive of a higher QOF score (p<.01), whereas having greater than 10% of patients born in a developing country predicted lower scores on the QOF (p<.05)
Ashworth et al, 201128 Retrospective cohort 212 practices
Ambulatory UK 2005-2008
QOF
Examined characteristics of poorly performing practices (lowest 10% over 4 years) by percentage of non-white residents.
Poorer-performing practices were more likely to be in areas with large numbers of non-white residents (OR = 5.5, 95% CI [3.17, 9.55], p<.001.
81

Pay for Performance Programs in Healthcare Evidence-based Synthesis Program
Study; Design; N
Setting; Observation period
Program and incentive description Comparison Findings related to health disparities - Race/Ethnicity
Bhalla et al, 201385 Cross-sectional 5824 (3096 in 2007; 3594 in 2009; 866 in both years)
Ambulatory US 18 months
Bronx CHAMPION incentivized 130 Internal Medicine and Family Medicine providers on 33 standardized and non-standardized quality HEDIS indicators and provided quality based incentive payments (new money) of 5% of their salary.
Compared the quality of care from 2007 (baseline) to 2009 by race (Asian, African American, Multiracial, declined), ethnicity (Hispanic/Latino, non-Hispanic/Latino, declined), and preferred language (English, Spanish, other) on 26 measures. Measures were grouped into 5 composite care domains: Diabetes (9 measures); Coronary artery disease (5 measures); Heart failure (4 measures); Screening and prevention (8 measures); All-care (26 measures).
Univariate analysis resulted in significant improvements in all 5 domains for African American, Hispanic/Latino, and Spanish language preferring patients, with the exception of heart failure for Hispanic/Latino and Spanish language preferring patients. Multivariate logistic regression resulted in significant odds ratios for diabetes care (all groups but Asian and Multiracial); screening and prevention (all groups but Asian); all care (all groups but Asian). The degree of improvement for AA/black patients was similar to white patients, and the degree of improvement for non-Hispanic ethnicity and English language preferred was greater than for Hispanic/Latino and Spanish language preferred patients.
Dalton et al, 201137 Cross-sectional 23 practices
Ambulatory UK 2004-2007
QOF Compared exception reporting in the first 3 years of the QOF by race (white, black, South Asian, Other) among adult patients with diabetes for HbA1c, blood pressure, and cholesterol.
After adjusting for covariates, black and South Asian patients were more likely than white patients to be excluded from the HbA1c indicator than white patients (OR = 1.64, 95%CI [1.17, 2.29]).
Hamilton et al, 2013120 Cross-sectional 29 practices
Ambulatory UK 2007
QOF Compared smoking rates, smoking status ascertained, and smoking cessation advice or referrals by ethnicity (white British, white Other, black African, black Caribbean, Indian, Pakistani, Bangladeshi, Chinese, Mixed Ethnicity, not stated) among patients with CVD and respiratory disease, for whom smoking indicators are incentivized, as well as patients with depression and “none,” for whom smoking indicators are not.
While slight variations existed among patients of different ethnicities in general, within each disease category, and for each measure, no clear patterns were found.
82
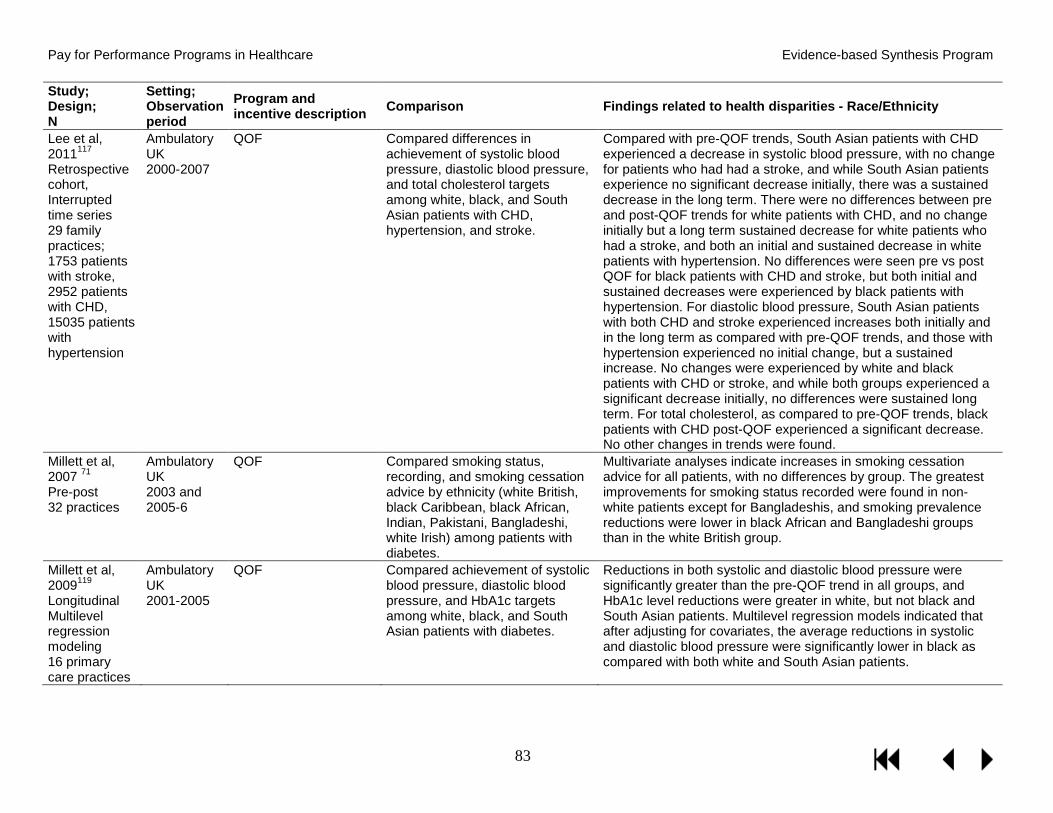
Pay for Performance Programs in Healthcare Evidence-based Synthesis Program
Study; Design; N
Setting; Observation period
Program and incentive description Comparison Findings related to health disparities - Race/Ethnicity
Lee et al, 2011117 Retrospective cohort, Interrupted time series 29 family practices; 1753 patients with stroke, 2952 patients with CHD, 15035 patients with hypertension
Ambulatory UK 2000-2007
QOF Compared differences in achievement of systolic blood pressure, diastolic blood pressure, and total cholesterol targets among white, black, and South Asian patients with CHD, hypertension, and stroke.
Compared with pre-QOF trends, South Asian patients with CHD experienced a decrease in systolic blood pressure, with no change for patients who had had a stroke, and while South Asian patients experience no significant decrease initially, there was a sustained decrease in the long term. There were no differences between pre and post-QOF trends for white patients with CHD, and no change initially but a long term sustained decrease for white patients who had a stroke, and both an initial and sustained decrease in white patients with hypertension. No differences were seen pre vs post QOF for black patients with CHD and stroke, but both initial and sustained decreases were experienced by black patients with hypertension. For diastolic blood pressure, South Asian patients with both CHD and stroke experienced increases both initially and in the long term as compared with pre-QOF trends, and those with hypertension experienced no initial change, but a sustained increase. No changes were experienced by white and black patients with CHD or stroke, and while both groups experienced a significant decrease initially, no differences were sustained long term. For total cholesterol, as compared to pre-QOF trends, black patients with CHD post-QOF experienced a significant decrease. No other changes in trends were found.
Millett et al, 2007 71 Pre-post 32 practices
Ambulatory UK 2003 and 2005-6
QOF Compared smoking status, recording, and smoking cessation advice by ethnicity (white British, black Caribbean, black African, Indian, Pakistani, Bangladeshi, white Irish) among patients with diabetes.
Multivariate analyses indicate increases in smoking cessation advice for all patients, with no differences by group. The greatest improvements for smoking status recorded were found in non-white patients except for Bangladeshis, and smoking prevalence reductions were lower in black African and Bangladeshi groups than in the white British group.
Millett et al, 2009119 Longitudinal Multilevel regression modeling 16 primary care practices
Ambulatory UK 2001-2005
QOF Compared achievement of systolic blood pressure, diastolic blood pressure, and HbA1c targets among white, black, and South Asian patients with diabetes.
Reductions in both systolic and diastolic blood pressure were significantly greater than the pre-QOF trend in all groups, and HbA1c level reductions were greater in white, but not black and South Asian patients. Multilevel regression models indicated that after adjusting for covariates, the average reductions in systolic and diastolic blood pressure were significantly lower in black as compared with both white and South Asian patients.
83

Pay for Performance Programs in Healthcare Evidence-based Synthesis Program
Study; Design; N
Setting; Observation period
Program and incentive description Comparison Findings related to health disparities - Race/Ethnicity
Murray et al, 201073 Longitudinal trend analysis 3200 pts
Ambulatory UK 1998-2007
QOF Compared blood pressure recording, and achievement of systolic blood pressure and diastolic blood pressure targets, and cholesterol recording and target achievement among white, black, and South Asian patients with CHD.
Blood pressure recording improved significantly across all ethnic groups, and cholesterol monitoring increased in all groups, with greater increases in black and South Asian groups as compared with whites. While not all were statistically significant, mean systolic and diastolic blood pressure and cholesterol decreased for all 3 groups. Systolic blood pressure decreased significantly for white patients regardless of gender, and for South Asian men. Diastolic blood pressure decreased significantly for all groups but black women, and cholesterol decreased significantly for all but black men. As compared with pre-QOF trends, the systolic blood pressure of South Asian patients post-QOF decreased significantly more, as did the cholesterol for white males and black females.
Schofield et al, 2011118 Cross-sectional 16,613
Ambulatory UK 2009 15 months total
QOF Compared blood pressure monitoring and target achievement by ethnicity (white British, other white, Asian, Caribbean, African, and a combined black group) among patients with diabetes, hypertension, CHD, stroke and chronic kidney disease.
A limited number of significant differences emerged for blood pressure monitoring between ethnic groups when stratified by disease condition, with little evidence of ethnic inequality overall. When conditions were pooled, as compared with white patients, Caribbean (OR = 1.32, 95% CI [1.07, 1.64], p <.05) and Asian (OR = 1.34, 95% CI [1.08, 1.67], p <.01) patients were more likely to have their blood pressure monitored. Disparities existed in blood pressure control, with black patients significantly less likely to meet QOF targets than whites when conditions were pooled (OR = 0.73, 95% CI [0.64, 0.82], p <.001), as well for blood pressure values, with higher systolic (B = 2.96, 95% CI [2.17, 3.75], p <.001), diastolic (B = 1.94, 95% CI [1.41, 2.46], p <.001), and mean arterial blood pressure (B = 2.31, 95% CI [1.74, 2.88], p <.001) for black patients as compared with whites, and lower systolic (B = -1.42, 95% CI [-2.70, -0.14], p <.001) and mean arterial blood pressures (B = -0.68, 95% CI [-1.34, -0.03], p <.05) in Asians.
Walker et al, 201129 Cross-sectional survey 230 GPs, Pt range 707-34494
Ambulatory UK April 2007-March 2008
QOF Compared recording rates of chronic kidney disease (CKD) by percentage of ethnic minority patients.
Lower recording of CKD was negatively related to high percentages of ethnic minority patients (Spearman’s rho = -0.22, 95% CI [-0.34, -0.08], p<.001)
84

Pay for Performance Programs in Healthcare Evidence-based Synthesis Program
Socioeconomic Status
Seventeen studies examined the effect of P4P on health disparities in patients of low socioeconomic status, 11 of which evaluated the relationship between SES and the QOF. Table 12 provides study detail. Many of the included studies were congruent with the findings from our KI interviews, and report that the QOF increased quality, regardless of SES,25,76,122-125 for both process of care measures such as recording of smoking status,71,76 hypertension,65 long-acting injectable reversible contraceptives (LARCs),23 and blood pressure,122 as well as patient outcomes such as achievement of blood pressure and cholesterol targets,123,125 and that practices with lower SES populations showed greater improvement; thereby, narrowing the gap in performance124 and quality that existed prior to the QOF. Other studies, however, report poorer performance/quality in low SES patient populations, including lower rates of blood pressure recording,65 lower rates of immunizations,40 patient perception of poorer access,121 lower rates of chronic kidney disease recording,29 and a smaller magnitude of improvement in the quality of diabetes care as compared to patients residing in affluent areas.64,126 Studies differed widely by patient sample (eg, condition, region) and SES measure (eg, deprivation index, occupation), with most studies examining outcomes within the first 2 years of the QOF.
85

Pay for Performance Programs in Healthcare Evidence-based Synthesis Program
Table 12. KQ3 Health Disparities: Socioeconomic Status
Study; Design; N
Setting; Observation period
Program and Incentive Description Comparison Findings related to health disparities - SES
Addink et al, 2011121 Survey comparison 222 GPs
Ambulatory UK 2006-2008
QOF Compared differences in patient survey responses (2006-2007 vs 2007-2008) by degree of area deprivation (index of multiple deprivation) for perception of access to care.
Practices in areas of greater deprivation were more likely to be perceived by patients as delivering poorer access.
Arrowsmith et al, 201423 longitudinal cohort, Interrupted time series 581 GPs
Ambulatory UK 2007-2012
QOF Compared the prescribing of long-acting reversible contraception (LARC), which was introduced as a QOF indicator in 2009, by deprivation (index of multiple deprivation).
A compared with practices in the least deprived areas, practices in the more deprived areas prescribed more LARCs after QOF implementation (most deprived RR = 1.64, 95%CI [1.40, 1.93]).
Ashworth and Armstrong, 200627 Cross-sectional 8480 practices
Ambulatory UK 2004-2005
QOF
Examined the relationship between total QOF score and deprivation (index of multiple deprivation; Townsend Index, Carstairs index).
Social deprivation was negatively related to QOF score. Correlation coefficients with QOF scores were nearly identical for the IMD (Spearman's rho = -0.256, p<.001), Townsend Index (Spearman's rho = -0.261, p<.001), and the Carstairs Index (Spearman's rho = -0.275, p<.001).
Ashworth et al, 2008122 Cross-sectional data for 3 consecutive years 7831 practices
Ambulatory UK 2004-2007
QOF Compared differences in blood pressure recording and the achievement of blood pressure targets for patients ≥ 45 with hypertension, CHD, stroke, diabetes, and chronic kidney disease by the most and least deprived areas (index of multiple deprivation).
Blood pressure recording increased for patients in both the most and the least deprived areas, with greater improvements by patients in areas with greater deprivation. By 2007, differences had all but disappeared. For all conditions, attainment of blood pressure targets improved over the first 3 years of the QOF, with greater improvements by patients with greater deprivation. By 2007, differences had largely disappeared, with a larger mean percentage of patients with diabetes attaining blood pressure control targets (79.2% vs 78.6%). Multivariate analysis of 2007 data indicated that practices who performed more poorly on blood pressure monitoring had higher proportions of black or black British residents, were situated in less deprived areas, had larger number of general practitioners, and had larger list sizes, and that once confounding variables were controlled for, deprivation had a weak positive effect.
86

Pay for Performance Programs in Healthcare Evidence-based Synthesis Program
Study; Design; N
Setting; Observation period
Program and Incentive Description Comparison Findings related to health disparities - SES
Ashworth et al, 201128 Retrospective cohort 212 practices
Ambulatory UK 2005-2008
QOF
Examined characteristics of poorly performing practices (lowest 10% over 4 years) by deprivation (index of multiple deprivation)
Deprivation was a strong predictor of being a poor performing practice, with the most deprived groups more than 4 times more likely than the least deprived group (OR = 4.27, 95% CI [2.57, 7.11], p<.001).
Crawley et al, 2009123 National survey N pts by year: DM 611; 562 CHD 861; 557 HTN 3717; 2996
Ambulatory UK 2003 and 2006
QOF Compared differences in achievement of blood pressure, cholesterol, and HbA1c targets in patients with diabetes, CHD (BP and cholesterol) and hypertension (BP only), by social class (manual vs non-manual occupations).
There were no significant differences among social classes in achievement of blood pressure targets for any of the disease conditions pre-QOF. In 2006, for patients with diabetes and hypertension, there were no differences by social class; however, for patients with CHD, patients with manual occupations were less likely to achieve the blood pressure target than those with non-manual occupations (75.8% vs 84.5%; Adj. OR = 0.44, 95% CI [0.21, 0.90]). Both pre-QOF and in 2006, there were no differences in the achievement of cholesterol targets. The achievement of HbA1c was significantly lower for those with manual occupations in 2003 (55.7% vs 71.2%; Adj. OR = 0.47, 95% CI [0.28, 0.80]. In 2006, differences still existed; however, they were not statistically significant (59.7% vs 68.3%; Adj. OR = 0.66, 95% CI [0.37, 1.15]),
Dalton et al, 201137 Cross-sectional 23 practices
Ambulatory UK 2004-2007
QOF Compared exception reporting in the first 3 years of the QOF by deprivation (index of multiple deprivation) among adult patients with diabetes for HbA1c, blood pressure, and cholesterol.
Patients from more deprived areas were more likely to be exception reported on all indicator in all 3 years in both univariate and multivariate analyses controlling for covariates; however, the effect size decreased over the study period.
Dixon et al, 2012124 Retrospective cohort 8339 practices
Ambulatory UK 2004-2006
QOF Compared the unweighted mean reported achievement (# of patients achieved/# of recorded patients) for 26 clinical indicators by deprivation (Spearhead status as well the most and least deprived areas according to the index of multiple deprivation)
Non-Spearhead practices performed significantly better in all years; however, Spearhead practices showed greater improvement. Regardless of Spearhead status, more deprived practices performed more poorly, but improved more; however, the least deprived practices with Spearhead status performed worse than similar non-Spearhead practices. Results of a multiple regression analysis indicate that Spearhead status did not predict achievement after adjusting for practice-level factors.
87

Pay for Performance Programs in Healthcare Evidence-based Synthesis Program
Study; Design; N
Setting; Observation period
Program and Incentive Description Comparison Findings related to health disparities - SES
Downing et al, 2007127 Retrospective cohort 2 primary care trusts with 360,000 and 157,000 pts respectively
Ambulatory UK 2004-2005
QOF Compared emergency admissions for asthma, cancer, COPD, CHD, diabetes, stroke, and other, and all-cause mortality in neighboring primary care trusts (PCT) with different area deprivation scores (index of multiple deprivation).
Increasing deprivation was associated with significantly increased mortality in both PCT 1 (OR =1.10, 95%CI [1.06, 1.14], and PCT2 (OR = 1.11, 95%CI [1.06, 1.17]), and higher deprivation scores were associated with increased likelihood of admission for all conditions.
Greene, 201325 Retrospective cohort 541 GPs
Ambulatory Australia 1995-2010
The Practice Incentives Program is a voluntary P4P program open to accredited practices or those undergoing accreditation. Practices receive sign on bonuses as well as incentives for each patient completing the cycle of care, and for completing the cycle of care for 20% or more patients. GPs are given varying bonuses for patients completing a 12-month cycle of care depending on the condition, for asthma and diabetes, and paid a set incentive for cervical cancer screening.
Compared the impact of PIP on HbA1c and microalbumin tests for patients with diabetes, and the number of cervical cancer screenings and treatments by SES.
No significant differences were found for GPs working in lower and higher areas of socio-economic status.
88

Pay for Performance Programs in Healthcare Evidence-based Synthesis Program
Study; Design; N
Setting; Observation period
Program and Incentive Description Comparison Findings related to health disparities - SES
Hamilton et al, 2010125 Time series 422 practices
Ambulatory UK 1997-2005
QOF Compares achievement of targets for HbA1c, blood pressure, and total cholesterol in patients with diabetes by deprivation (index of multiple deprivation).
Trend analysis indicated that the achievement of blood pressure targets was greater than predicted by pre-QOF trends, with no significant differences between the least and most deprived areas in 2005. HbA1c achievement was lower than predicted in all but the most deprived group, with no significant differences in attainment by deprivation pre-and post-QOF. For the cholesterol target, achievement by deprived groups was higher than expected by the pre-QOF trend, with no significant differences by deprivation in 2007, and patients in the most deprived areas significantly more likely to achieve targets in 2005 (Adj. OR = 1.14, 95% CI [1.02, 1.28])
Kontopantelis et al, 201364 Longitudinal cohort, interrupted time series 23,780
Ambulatory UK 2000-2007
QOF Compared the achievement of a composite of 17 diabetes quality indicators (13 processes of care, 4 patient outcome) by deprivation (index of multiple deprivation).
Composite scores improved regardless of degree of deprivation. There were no significant differences by deprivation pre or post-QOF; however, the effect of the intervention was greater in patients attending the least deprived vs the most deprived practices.
McLean et al, 2006126 Retrospective cohort 1024 practices
Ambulatory UK (Scotland) 2005
QOF Compared “payment quality,” which is the percentage of non-excluded patients meeting targets to “delivered quality,” the percentage of all patients meeting targets for 33 clinical indicators by deprivation (Scottish index of multiple deprivation).
For 17/33 indicators, mean delivered quality was lower in practices serving more deprived populations, and higher in only 4; however, absolute differences for simpler processes (eg, blood pressure recording) were generally small, with larger differences observed in more complex diagnostic, intermediate/patient outcome, and treatment indicators. For process indicators, the largest differences were observed for 2 diagnostic indicators for COPD, with a maximum change in measured quality of 37.2% (in the most deprived practices, payment quality was 14.3% higher, and delivered quality was 18.4% lower). Similar results were found for vascular and neuropathic foot screenings and eye exams in patients with diabetes. For patient outcome indicators, deprivation was significantly negatively related to delivered quality for 4/9 indicators, and was negatively related to 5/6 treatment indicators at p<.001.
89

Pay for Performance Programs in Healthcare Evidence-based Synthesis Program
Study; Design; N
Setting; Observation period
Program and Incentive Description Comparison Findings related to health disparities - SES
Millett et al, 2007 71 Pre-post 32 practices
Ambulatory UK 2003 and 2005-6
QOF Compared smoking status recording, smoking cessation advice, and prevalence by deprivation (index of multiple deprivation).
Multivariate analyses indicate increases in smoking cessation advice and recording, and a reduction in prevalence for all patients, with no differences by deprivation status.
Norbury et al, 201140 Retrospective 315 practices, 300K patients
Ambulatory UK 2003-2004 to 2006-2007
QOF
Compared influenza immunizations for incentivized patient groups by area deprivation (Carstairs postcode categorization)
In both 2003/4 (Difference = 11.7%, 95% CI [10.7, 12.7]) and 2006/7 (Difference = 8.2%, 95% CI [7.3, 9.1]), patients living in most deprived were less likely to immunized than those living in most affluent; however, odds ratios were similar both pre- and post-QOF.
Simpson et al, 201165 Cohort 315 providers
Ambulatory UK (Scotland) 2001-2006
QOF Compared blood pressure recording and achievement of blood pressure targets in patients with hypertension by area deprivation (Carstairs postcode categorization)
Patients with the greatest level of deprivation became less likely to have their blood pressure recorded after the introduction of the QOF than patients with the least level of deprivation.
Smith et al, 200874 large cohort pre/post 2,020,424 patients
Ambulatory UK 2003-2005
QOF Compared spirometry recording (FEV1) in patients with COPD as well as combined inhaler prescriptions for patients with FEV1 <50% by deprivation (Townsend score)
There was no difference by deprivation in the effect of the QOF on the recording of spirometry data (FEV1) for people with COPD or the percentage of people with FEV1 < 50% prescribed a combined inhaler.
Taggar et al, 2012 76 Cross-sectional ~2 million pts
Ambulatory UK 2002-2008
QOF Compared differences in smoking status recording and cessation advice by deprivation (Townshend score).
More deprived patients were more likely to have had smoking status recorded and been given cessation advice. Multivariate analysis for 2008 indicate that patients with greater deprivation were 35% more likely to have smoking status recorded (Adj. OR = 1.35, 95% CI [1.21, 1.49], p<.001), and 20% more likely to have been given cessation advice (Adj. OR = 1.20, 95% CI [1.10, 1.30], p<.001).
Walker et al, 201129 Cross-sectional survey 230 GPs, Pt range 707-34494
Ambulatory UK April 2007-March 2008
QOF Compared recording rates of chronic kidney disease (CKD) by deprivation (index of multiple deprivation)
Deprivation was negatively associated with recording of chronic kidney disease (Spearman’s rho = -0.45, 95% CI [-0.55, -0.33], p<.001).
90

Pay for Performance Programs in Healthcare Evidence-based Synthesis Program
Other Health Disparities
Eleven studies reported the differential effects of P4P on health based on other subgroup factors. Table 13 provides study detail. Findings indicate that the QOF may be particularly effective for patients with co-morbid conditions, as certain indicators apply to multiple conditions (eg, recording of blood pressure for both diabetes and coronary heart disease);27,40,64,71,72 however, more complicated patients may be excluded through exception reporting at a higher rate.37 Conversely, slower improvements were seen in newly diagnosed patients, women, and younger patients.65,71,74,76,125 These are groups that had been recognized as experiencing lower levels of care prior to the QOF, and though they experienced some gains after the QOF began, their slower rate of improvement as compared with others resulted in a widening of the gap;64,125 however, findings related to between-group differences were often non-significant, and varied by disease condition and indicator. Conversely, in Taiwan’s DM-P4P, which was both optional for providers and allowed providers the choice of which patients to enroll, a study by Chen and others (2011) found that patients enrolled in the DM-P4P were more likely to be female, were younger, and had fewer co-morbid conditions.128
91

Pay for Performance Programs in Healthcare Evidence-based Synthesis Program
Table 13. KQ3 Health Disparities: Other (Not in Relation to Race/Ethnicity or SES)
Study; Design; N
Setting; Observation period
Program and incentive description Comparison Unintended consequences related to health disparities, other
Ashworth and Armstrong, 200627 Cross-sectional 8480 practices
Ambulatory UK 2004-2005
QOF
Examined the relationship between total QOF score by age and composite disease prevalence score.
A higher composite disease prevalence score positively related to higher QOF scores (Spearman's rho =, p<.001), as was having a larger proportion of patients over the age of 75.
Chen et al, 2011128 146,481 P4P patients
Ambulatory Taiwan Jan 2007 to December 2007
DM-P4P. Voluntary providers have the option of enrolling patients, and are provided bonuses for providing ongoing care for both enrolled and non-enrolled patients (lower). In 2006, DM-P4P added an intermediate outcome measure tournament, with only the top 25% providers receiving bonuses.
Compared the likelihood of patient enrolment by age, gender, frequency of complications, Diabetes Complications Severity Index (DCSI), co-morbidity (Chronic Illness with Complexity [CIC]), and # of visits. Also examined associated hospital characteristics (patient volume, baseline DM-P4P score.
Non-enrolled patients were older, with more co-morbid conditions (p<.001), and more severe conditions (p<.001) with the odds of exclusion increasing with DCSI score and CIC count.
Dalton et al, 201137 Cross-sectional 23 practices
Ambulatory UK 2004-2007
QOF Compared exception reporting in the first 3 years of the number of co-morbid disorders, duration of illness, gender, and age among adult patients with diabetes for HbA1c, blood pressure, and cholesterol.
There were no differences in exception reporting by age in the first 2 years, but in 2006/2007 patients > 60 were significantly more likely to be excluded for blood pressure and cholesterol indicators. In the second and third years, patients with diabetes for ≥ 10 years were excluded more often for all 3 indicators (eg, Adj. OR = 2.01, 95% CI [1.65, 2.45] for HbA1c in 2006/2007), and patients with > 3 co-morbidities were exception reported on all 3 indicators significantly more than patients without (Adj. OR = 2.97, 95% CI [1.54, 5.71]).
92
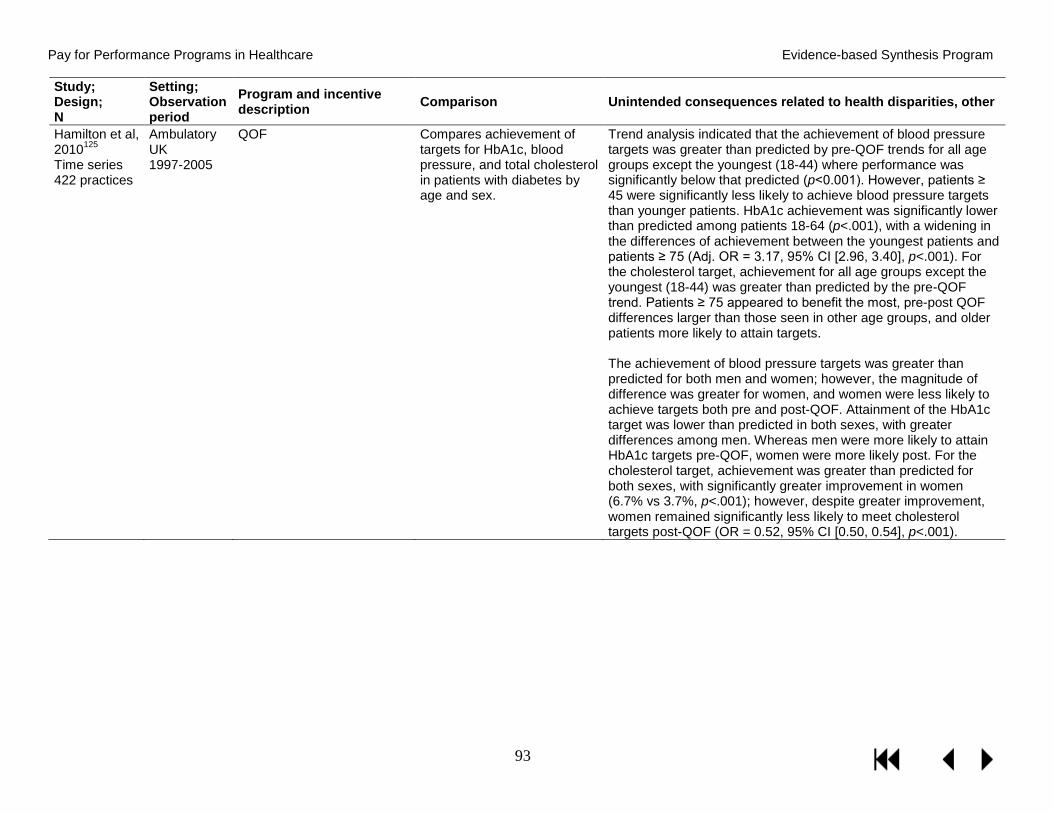
Pay for Performance Programs in Healthcare Evidence-based Synthesis Program
Study; Design; N
Setting; Observation period
Program and incentive description Comparison Unintended consequences related to health disparities, other
Hamilton et al, 2010125 Time series 422 practices
Ambulatory UK 1997-2005
QOF Compares achievement of targets for HbA1c, blood pressure, and total cholesterol in patients with diabetes by age and sex.
Trend analysis indicated that the achievement of blood pressure targets was greater than predicted by pre-QOF trends for all age groups except the youngest (18-44) where performance was significantly below that predicted (p<0.001). However, patients ≥ 45 were significantly less likely to achieve blood pressure targets than younger patients. HbA1c achievement was significantly lower than predicted among patients 18-64 (p<.001), with a widening in the differences of achievement between the youngest patients and patients ≥ 75 (Adj. OR = 3.17, 95% CI [2.96, 3.40], p<.001). For the cholesterol target, achievement for all age groups except the youngest (18-44) was greater than predicted by the pre-QOF trend. Patients ≥ 75 appeared to benefit the most, pre-post QOF differences larger than those seen in other age groups, and older patients more likely to attain targets. The achievement of blood pressure targets was greater than predicted for both men and women; however, the magnitude of difference was greater for women, and women were less likely to achieve targets both pre and post-QOF. Attainment of the HbA1c target was lower than predicted in both sexes, with greater differences among men. Whereas men were more likely to attain HbA1c targets pre-QOF, women were more likely post. For the cholesterol target, achievement was greater than predicted for both sexes, with significantly greater improvement in women (6.7% vs 3.7%, p<.001); however, despite greater improvement, women remained significantly less likely to meet cholesterol targets post-QOF (OR = 0.52, 95% CI [0.50, 0.54], p<.001).
93

Pay for Performance Programs in Healthcare Evidence-based Synthesis Program
Study; Design; N
Setting; Observation period
Program and incentive description Comparison Unintended consequences related to health disparities, other
Kontopantelis et al, 201364 Longitudinal cohort, interrupted time series 23,780
Ambulatory UK 2000-2007
QOF Compared the achievement of a composite of 17 diabetes quality indicators (13 processes of care, 4 patient outcome) by the number of co-morbid conditions, time since diagnosis, age, and sex.
Composite scores improved regardless of co-morbidity, and both pre-and post-QOF, patients with multiple co-morbidities had better performance scores (6.3% pre, and 6.1% post-QOF for patients with 3+ conditions vs no co-morbidities).Practices with fewer diabetic patients performed better before the intervention but less well after the intervention. Practices in the second and third quartiles improved by more than practices in the first quartile (1.4% and 2.1% respectively in the short run and 3.2% and 4.8% in the long run). In addition, composite scores were the lowest for newly diagnosed patients, with a widening of differences as compared with the highest group (1-4 years since diagnosis) from 4.7% pre-QOF to 9.1% post. There were no significant differences by age; however, composite QOF scores for patients ≥ 65 were on average 11% higher than patients 17-39 pre-QOF, and 11.7% after QOF introduction. There was no significant difference in effect by gender; however, QOF scores were 2% lower for women in both periods.
Millett et al, 2007 71 Pre-post 32 practices
Ambulatory UK 2003 and 2005-6
QOF Compared smoking status recording, smoking cessation advice, and prevalence by age and sex among patients with diabetes.
Multivariate analyses indicate increases in smoking cessation advice for all patients, with no differences by age or sex. The greatest improvements for smoking status recorded were found in women after adjusting for age. Pre-QOF, smoking status recording was lower among younger adults (18-44); however, by 2005 this difference had been attenuated. Reductions in smoking prevalence were lower among women than men (Adj. OR = 0.71, 95% CI {0.53, 0.95]), and the higher rates of smoking among younger adults pre-QOF had not been attenuated in 2005.
94

Pay for Performance Programs in Healthcare Evidence-based Synthesis Program
Study; Design; N
Setting; Observation period
Program and incentive description Comparison Unintended consequences related to health disparities, other
Millett et al, 200972 Large pre-post cohort, Trend analysis 154,945 patients, 422 practices
Ambulatory UK 1997-2005
QOF Compared attainment of blood pressure, HbA1c, and cholesterol targets in patients with diabetes by number of co-morbid conditions.
While performance on blood pressure targets in 2004 and 2005 was greater than predicted by the pre-QOF trend (p<0.001) and the magnitude of change was similar for patients irrespective of number of co-morbidities, patients with 1-3 co-morbidities had a significantly lower attainment than patients with no co-morbidities, and patients with 5 or more co-morbidities had significantly higher (OR = 1.36, 95% CI [1.28–1.44]). HbA1c target attainment improved post-QOF, but less than predicted by the pre-QOF trend (p<0.001). Differences were the greatest in patients with no co-morbidities (3.8% below trend in 2005) and smallest for patients with 4-5 co-morbidities. Attainment increased with number of co-morbidities up to 5, and as compared with patients with no-co-morbidities in 2003, the greatest improvement was in patients with 5 co-morbidities in 2005 (OR = 3.71, 95% CI [3.39, 4.07]). Cholesterol target achievement was significantly greater than the pre-QOF trend. Target achievement increased with number of co-morbidities; however, the differences in attainment between 0 and 5 co-morbidities remained relatively constant.
Norbury et al, 201140 Retrospective 315 practices, 300K patients
Ambulatory UK 2003-2004 2006-2007
QOF Compared influenza immunizations for incentivized patient groups by age, number of chronic conditions, and sex.
There were larger increases in immunization rates in patients ≥ 65 (8.8%, 95% CI [8.3, 9.4]) than those under 65 (3.3%, 95% CI [3.1, 3.6]). Regardless of age, there was a positive relationship between immunization and number of chronic conditions, with a steeper gradient post-QOF; however in both time periods, younger patients with chronic conditions were more likely to be immunized than older patients without a chronic condition, and similarly, increases in immunization rates post-QOF were larger for the younger group (10.1%, 95% CI [8.7, 11.5] vs 4.8%, 95% CI [4.2, 5.5]). Women were significantly more likely to be immunized; however, absolute differences were small (1.2%).
Simpson et al, 201165 Cohort 315 providers
Ambulatory UK (Scotland) 2001-2006
QOF Compared blood pressure recording and achievement of blood pressure targets in patients with hypertension by age and sex.
A larger proportion of women were recorded as having hypertension. The oldest group of women (≥ 76) was less likely than the youngest women (40-59) to have their blood pressure recorded (p<0.05).
95

Pay for Performance Programs in Healthcare Evidence-based Synthesis Program
Study; Design; N
Setting; Observation period
Program and incentive description Comparison Unintended consequences related to health disparities, other
Smith et al, 200874 large cohort pre/post 2,020,424 patients
Ambulatory UK 2003-2005
QOF Compared spirometry recording (FEV1) in patients with COPD as well as combined inhaler prescriptions for patients with FEV1 <50% by age and gender.
There was some evidence that women and people < 50 and >80 were less likely to have FEV1 values recorded post-QOF. There was no difference by age or gender in the percentage of people with FEV1 < 50% prescribed a combined inhaler.
Taggar et al, 2012 76 Cross-sectional ~2 million pts
Ambulatory UK 2002-2008
QOF Compared differences in smoking status recording and cessation advice by age, sex, and number of co-morbid conditions.
Smoking status recording and cessation advice increased over the study period regardless of gender, with higher rates for women at all 3 time points. Multivariate analysis for 2008 indicate that women were 71% more likely to have had both a record of status (Adj. OR = 1.71, 95% CI [1.65, 1.77], p<.001) and cessation advice (Adj. OR = 1.71, 95% CI [1.66, 1.77], p<.001). The strength of the association by gender was stronger after QOF implementation. Age was positively related to smoking status recording in 2008, with 80.4% of patients over 75 having a documented status, as compared to 53.8% of patients aged 15-24. There was a U-shaped curve associated with the recording of cessation advice, with 47.5% of 15-24 year olds and 40% of 25-44 year olds, increasing through other age categories to 74.9% of patients over 75. Age associations were independently significant in both univariate and multivariate analyses.
96

Pay for Performance Programs in Healthcare Evidence-based Synthesis Program
Other Unintended Consequences
Nineteen studies examined other unintended consequences, both positive and negative, associated with P4P programs. Table 14 provides study detail. Of these studies, 12 evaluated the QOF, 2 evaluated Taiwan’s healthcare system, and 2 were set in the United States. Studies examined a variety of unintended consequences, including the positive and negative effect of P4P on unincentivized measures, gaming, risk selection, and others. In addition, much of our discussions with key informants centered on the risk and presence of unintended consequences associated with P4P programs. Both KIs within and outside of the US suggested that both the lack of consistent effects and the general lack of unintended consequences associated with P4P programs in the United States relate directly to the small percentage of provider income linked to incentives.
Gaming
Only 3 of the included studies looked for the possibility of gaming. One study found that post-QOF introduction, while there was no evidence of a bias towards recording values just below target thresholds, the proportion of patients who achieved target BP values rose.68 However, another study found that after systolic target changed to 150, there was an increase of recording of 148-149, and a decrease in recorded values of 151-152.129 Despite the lack of empirical evidence, consistent across KIs was a clear message that once financial incentives are introduced, gaming will occur, with one KI describing gaming in P4P programs as “rampant.” Related to the QOF, one KI suggested that although the percentage of provider income linked to incentives has dropped, gaming may still occur as a result of factors such as increasingly tougher targets associated with lower financial rewards. KIs stressed that programs must be designed under the assumption that some of those incentivized will game the system, and that design and implementation strategies should be developed in a way to mitigate the potential for harm. KIs suggested that those incentivized must both recognize and buy in to benefits associated with the program that are not financial – and that these benefits must outweigh both the financial incentives and the risks associated with gaming. In addition, professionalism and compassion should be emphasized. To accomplish this, KIs stressed the importance of measures that are predictable, precise, evidence-based, simple, clear, and realistic, that stakeholders at all levels are involved in program development and dissemination, and that new measures must be implemented in a way that ensures accurate dissemination of the purpose for and evidence related to the measure.
Risk Selection
The QOF allows for the exclusion of patients meeting certain criteria from indicator calculations through exception reporting. KIs in the UK felt that overall exception reporting was not being abused. However, they did express concern for racial/ethnic minority populations and patients with multiple co-morbidities. In the US, KIs expressed concern about risk selection – in particular with regard to the use of algorithms created by consulting firms to identify higher-risk patients, giving providers the ability to select based on risk and either exclude patients completely or delay procedures until the next reporting period.
Eight included studies evaluated programs for risk selection, 6 of which examined exception reporting associated with the QOF (see Table 14 for study detail). One study by Kontopantelis and others concluded that increases in exception reporting after a target threshold increase were
97
Pay for Performance Programs in Healthcare Evidence-based Synthesis Program
likely due to better documentation.21 However, a study evaluating the first year of the QOF found that exception reporting was positively related to total QOF score.27 In addition, a study by Dalton and others found that excluded patients were more likely to have more co-morbid disorders or be of lower SES, that older patients were more likely to excluded from the blood pressure and cholesterol indicators, and those excluded from the HbA1c indicator were more likely to be black or South Asian, with excluded patients less likely to meet targets for HbA1c, blood pressure, and cholesterol.37 Another examined the differences between target achievement in non-excluded patients and population achievement, and found lower levels of quality in 31/33 examined indicators, with smaller absolute differences for simple processes (eg, blood pressure recording), and larger differences for more complex processes (eg, neuropathy testing) and treatment and immunization indicators.126 Two studies examining Taiwan’s DM-P4P program found that not only did non-enrolled patients have a higher number of co-morbid conditions, they were older, were more likely to have suffered from diabetes-related complications, and have higher diabetes risk scores.82,128
Impact on Unincentivized Areas of Care
Eleven studies evaluated the effect of P4P on unincentivized areas of care. Table 14 provides study detail. Incentivizing certain aspects of care has the potential to affect both unincentivized measures and populations in both positive and negative ways. One such negative way is through “attention shift,” or “teaching to the test,” that is, that providers will focus primarily on those measures on which they are incentivized. Three studies found some evidence of attention shift, with a study by Doran and others (2011) that examined pre-QOF trends for both incentivized and non-incentivized measures and found that while there was no effect on achievement rates for non-incentivized measures in the first year of the QOF, by the third year, rates of achievement were significantly lower than pre-QOF trends.63 Similarly, one study found that patients without conditions for which smoking indicators were incentivized had significantly lower rates of recorded smoking status and cessation advice,120 and another found significant reductions in blood pressure in patients with chronic kidney disease, but no significant reductions in patients for whom blood pressure recording was not incentivized.68
In addition to the potential for a negative effect on unincentivized areas of care, P4P programs may also result in positive outcomes such as increased quality in other areas or in other patient groups due to an incentive “spilling over.” Key informants agreed that spillover effects may occur. As an example, according to one KI, in studies comparing P4P to controls, one potential reason for a lack of significant findings may not be due to a lack of effect or quality improvement, but a spilling over to controls. Similarly, another KI reported that P4P in the VHA had resulted in a positive spillover to professionalism in nursing staff.
Seven studies evaluated spillover effects related to P4P programs. Studies evaluating the QOF found that recording rates (eg, smoking status, blood pressure, cholesterol, etc) increased not only in populations for which recording was incentivized, but in untargeted groups as well.75,130,131 Also in the UK, a recent study by Kristensen and others reported positive spillover effects associated with the HQID, both to non-program hospitals due to public reporting, as well as within hospitals to patients with unincentivized conditions.100 Similar findings were reported in US programs, with possible improvements due to spilling over to unincentivized conditions,38 and performance on incentivized measures improving in both HBVP and non-HBVP hospitals.95 While evidence exists supporting improvements on unincentivized areas of care associated with
98

Pay for Performance Programs in Healthcare Evidence-based Synthesis Program
P4P, the mechanisms through which these positive spillovers occur, however, remain unclear, as they may result from changes in provider behavior, as suggested by a study that found that reduced mortality rates associated with unincentivized conditions in patients who were treated by providers who also saw patients with conditions that were incentivized.100 However, they may also result from social/setting level factors such as public reporting or other quality improvement efforts such as electronic medical records.38,95,100
99

Pay for Performance Programs in Healthcare Evidence-based Synthesis Program
Table 14. KQ3 Other Unintended Consequences Stratified by Type
Study; Design; N
Setting; Observation period
Program and Incentive Description Comparison Other Unintended Consequences
Gaming Carey et al, 2009129 Interrupted time series 152 practices 182,614 patients
Ambulatory UK 2000-2005
QOF Compared the trend of recording of systolic blood pressure (150) before and after the QOF (150 was a new target introduced with the QOF. Diastolic blood pressure and systolic values of 140 and 160 were also examined to determine if any phenomena observed around 150 were seen in other values.
There was a steady fall in systolic blood pressure over the study period (36% of patients > 150 in pre- vs 19% post-QOF implementation). Values with a terminal zero were more common than other numbers, but decreased from 60% in 2000-2001 to 41% in 2004-2005. Over the study period, there was a relative increase in recording systolic values of 148-149 as compared with 151-152, with patients 3 times more likely to have 148-194 (4.2%) than 151-152 (1.3%), and 148 was recorded more often than predicted by the pre-QOF trend. Recording of diastolic blood pressure was similar, with recordings just below 90 recorded more often than those just above. Furthermore, in 2004-2005 the percentages of patients with a diastolic blood pressure £ 90 were similar in patients with systolic blood pressures of 148-149 (93%) and 150 (92%), but was lower in patients with a systolic blood pressure of 151-152 (78%).
Chang et al, 201282 699,876 patients
Ambulatory Taiwan 1999-2005
DM-P4P. Voluntary providers have the option of enrolling patients, and are provided bonuses for providing ongoing care for both enrolled and non-enrolled patients (lower).
Compared the patient profiles (eg, frequency of complications, Diabetes Complications Severity Index [DCSI]) and quality of care delivered to and the of enrolled and not enrolled patients (HbA1c screening, glucose screening, cholesterol screening, microalbumin screening, eye exam) with a secondary aim of evaluating provider responses to see if gaming had occurred.
Providers typically met 100% of targets for patients enrolled in the P4P program. However, only 28.4% of eligible patients were ever enrolled, and those enrolled were demonstrably healthier. Authors concluded that while their study could not make the distinction, it is possible that providers started by enrolling “easier” patients then added more difficult patients over time. Conversely, it is also possible that the differences between the 2 groups were due to undercoding of enrolled patients.
Karunaratne et al, 201368 Prospective cohort study 10,040 patients
Ambulatory UK 2004-2006, 2006-2008, 2008-2010
QOF Compared reported blood pressure in patients with chronic kidney disease and without, prior to, and 2 and 4 years following the introduction of the renal indicators to assess recording bias.
There was no evidence of preferential recording of BP just below the P4P blood pressure threshold of 140/85 in period 2 as compared with period 1. However, there appeared to be a greater proportion of patients achieving both systolic and diastolic targets post-QOF, with reductions sustained in period 3. No reductions in blood pressure were seen in patients for whom blood pressure recording was not incentivized.
100

Pay for Performance Programs in Healthcare Evidence-based Synthesis Program
Study; Design; N
Setting; Observation period
Program and Incentive Description Comparison Other Unintended Consequences
Risk Selection Ashworth and Armstrong, 200627 Cross-sectional 8480 practices
Ambulatory UK 2004-2005
QOF Examined the relationship between total QOF score and rates of exception reporting.
Higher levels of exception reporting was related to higher QOF scores (Spearman's rho =, p<.001).
Carey et al, 2009129 Interrupted time series 152 practices 182,614 patients
Ambulatory UK 2000-2005
QOF Compared the trend of recording of systolic blood pressure (150) before and after the QOF (150 was a new target introduced with the QOF. Diastolic blood pressure and systolic values of 140 and 160 were also examined to determine if any phenomena observed around 150 were seen in other values.
The prevalence of exception reporting was higher for patients with systolic blood pressure >150 (5.2%) than £150 (2.8%).
Chang et al, 201282 699,876 patients
Ambulatory Taiwan 1999-2005
DM-P4P. Voluntary providers have the option of enrolling patients, and are provided bonuses for providing ongoing care for both enrolled and non-enrolled patients (lower).
Compared the patient profiles (eg, frequency of complications, Diabetes Complications Severity Index [DCSI]) and quality of care delivered to and the of enrolled and not enrolled patients (HbA1c screening, glucose screening, cholesterol screening, microalbumin screening, eye exam).
Providers typically met 100% of targets for patients enrolled in the P4P program. However, only 28.4% of eligible patients were ever enrolled, and adherence rates were significantly lower in all years (p<.001). Furthermore, those enrolled were demonstrably healthier. Non-enrolled patients were significantly more likely to suffer from diabetes related complications and have higher diabetic risk scores, with scores rising faster than patients who were enrolled (p<.001).
101

Pay for Performance Programs in Healthcare Evidence-based Synthesis Program
Study; Design; N
Setting; Observation period
Program and Incentive Description Comparison Other Unintended Consequences
Chen et al, 2011128 146,481 P4P patients
Ambulatory Taiwan Jan 2007 to December 2007
DM-P4P. Voluntary providers have the option of enrolling patients, and are provided bonuses for providing ongoing care for both enrolled and non-enrolled patients (lower). In 2006, DM-P4P added an intermediate outcome measure tournament, with only the top 25% providers receiving bonuses.
Compared the likelihood of patient enrolment by age, gender, frequency of complications, Diabetes Complications Severity Index (DCSI), co-morbidity (Chronic Illness with Complexity [CIC]), and # of visits. Also examined associated hospital characteristics (patient volume, baseline DM-P4P score
Non-enrolled patients were older, with more co-morbid conditions (p<.001), and more severe conditions (p<.001) with the odds of exclusion increasing with DCSI score and CIC count. For hospitals, size had a negative effect on enrollment, with larger hospitals excluding more patients than clinics.
Dalton et al, 201137 Cross-sectional 23 practices
Ambulatory UK 2004-2007
QOF Compared exception reporting in the first 3 years of the QOF by race (white, black, South Asian, Other), and deprivation (index of multiple deprivation) among adult patients with diabetes for HbA1c, blood pressure, and cholesterol.
After adjusting for covariates, black and South Asian patients were more likely than white patients to be excluded from the HbA1c indicator than white patients (OR = 1.64, 95%CI [1.17, 2.29]). In addition, patients from more deprived areas were more likely to be exception reported on all indicators in all three years; however, the effect size decreased over the study period. Excluded pts were less likely to achieve treatment targets for HBA1c, blood pressure, and cholesterol. The differences were statistically significant in some but not all years.
Doran et al, 2010 32 Retrospective Cohort 7502 practices 46.7 million patients
Ambulatory UK 2004-2005 2005-2006 2006-2007
QOF Compared exception reporting, and population achievement (includes excluded patients) by practice size.
For exception reporting, practices with larger list sizes excluded a larger percent of patients (6.8% in practices with ≥ 12,000 patients vs 6.3% in practices with 1000-1999 patients). There was greater variation in small practices, with the smallest practices having both the highest and lowest exception reporters. When excluded patients were considered, the smallest practices had the highest median population achievement, but also the greatest variation. Thus, small practices achieving both high and low levels was not accounted for by exception reporting.
102

Pay for Performance Programs in Healthcare Evidence-based Synthesis Program
Study; Design; N
Setting; Observation period
Program and Incentive Description Comparison Other Unintended Consequences
Kontopantelis et al, 201221 Controlled Before-After Multiple Regression Multilevel Model QMAS Data (Contains 99% of English language practices)
Ambulatory UK 2004-2005 2009-2010
QOF Compared changes in reported and population (includes excluded patients) achievement, and exception reporting for influenza immunization for patients with CHD before and after and increase in the upper threshold from 85-90% to patients with COPD, diabetes, and stroke, for whom the upper threshold remained 85%.
Compared to patients with COPD, diabetes, and stroke, reported achievement rates for patients with CHD increased, with the largest increases in practices achieving below the old upper threshold in 2005/2006 (1.47%, 95% CI [1.27, 1.68]). Similarly, population achievement increased more for patients with CHD as compared with other groups, with the largest increases in practices previously achieving less than 85% (0.85%, 95% CI [0.62, 1.08]). Relative to other conditions, there was a small but significant increase (0.26%, 95% CI [0.12, 0.40]) in exception reporting for CHD after the increased threshold, with practices previously achieving less than 85% increasing 0.5% (95% CI [0.29, 0.72]), and no significant increase for those already achieving 90%. Increases in achievement and exception reporting may not be due to gaming but better documentation and record keeping of valid exceptions.
McLean et al, 2006126 Retrospective cohort 1024 practices
Ambulatory UK (Scotland) 2005
QOF Compared “payment quality,” which is the percentage of non-excluded patients meeting targets to “delivered quality,” the percentage of all patients meeting targets for 33 clinical indicators, and compared payment and delivered quality by deprivation.
Mean delivered quality was significantly lower for 31/33 clinical indicators at the p<.001 level; however, absolute differences for simpler processes (eg, blood pressure recording) were generally small, with larger differences observed in more complex processes such as eye and foot screenings for patients with diabetes, and for intermediate/patient outcome indicators. The largest differences were seen in treatment indicators (eg, beta-blockers = 17% lower) and immunization indicators for CHD (10.8%), stroke (12.1%), and diabetes (13.3%). For 17/33 indicators, delivered quality was lower in practices serving more deprived populations, and higher in only 4.
103

Pay for Performance Programs in Healthcare Evidence-based Synthesis Program
Study; Design; N
Setting; Observation period
Program and Incentive Description Comparison Other Unintended Consequences
Impact on Unincentivized Areas of Care
Dhalwani et al, 2013131 Time series 277,552 pregnancies
Ambulatory UK 2000-2009
QOF Compared recording of smoking status of pregnant women for each year between 200-2009. The QOF incentivizes the recording of smoking status for patients with certain disease conditions (hypertension, diabetes, asthma, and mental illness) and for those who have been recorded as a smoker up to 3 years prior.
Recording of smoking status increased steadily from 8.8% in 2000, to 32.3% in 2004 when the QOF was introduced, to 43.3% in 2009. Pregnant women from the most deprived group were 17% more likely to have their smoking status recorded during pregnancy than pregnant women from the most affluent group pre-QOF (OR = 1.17, 95% CI [1.10, 1.25]), and 42% more likely after QOF implementation (OR = 1.42, 95% CI [1.37, 1.47]). ]). In addition, recording of smoking status was more likely for pregnant women if they had a disease condition for which smoking cessation advice was incentivized, or if they were younger, or overweight or obese.
Doran et al, 201163 Interrupted time series 148 GPs 653,500 Patients
Ambulatory UK 2000-2001 2002-2003 2004-2005 2006-2007
QOF Compared performance trends for 42 incentivized and non-incentivized process and prescribing indicators before and up to 3 years post-QOF.
In the first year of the QOF, achievement rates for all 17 process, and 5 of 6 prescribing incentivized indicators were significantly higher than predicted by the pe-QOF trend (1.2-37.7% higher). For non-incentivized process indicators, 2 of 9 increased significantly, with 1 decreasing significantly. Performance increased for 2 of 10 prescribing indicators and decreased significantly for 3. By 2006-2007, performance on all 4 indicator groups increased significantly. Performance on 10 of the 17 incentivized process indicators and 4 of 6 prescribing had increased significantly more than predicted, with 5 process and 1 prescribing indicator significantly showing significant decreases; however, group level achievement rates remained significantly higher than predicted. For non-incentivized indicators, achievement was significantly higher than predicted for 1 of 9 process indicator, 1 of 10 prescribing indicator, and significantly lower for 7 of the 9 process and 4 of the 10 prescribing indicators. Overall achievement for non-incentivized indicators was significantly lower than predicted, and significantly lower than incentivized indicators.
104

Pay for Performance Programs in Healthcare Evidence-based Synthesis Program
Study; Design; N
Setting; Observation period
Program and Incentive Description Comparison Other Unintended Consequences
Fernandez Urrusuno, 2014132 Cross-sectional 169 providers mean 1549 pts per
Ambulatory Spain N/A
Andalusian Public Health Care Service. P4P for prescribing was based on the value reached on a synthetic quality index that included all indicators of quality of prescribing, with 6 chosen to identify compliant prescribers, 6 based on drug selection of other therapeutic groups, and 8 based on the appropriateness of prescribing to the patient’s clinical condition.
Compared compliance to incentivized and non-incentivized indicators, and the prescribing behavior related to non-incentivized indicators of GPs who demonstrated compliance to incentivized indicators and those who did not.
GPs showing high compliance with incentivized indicators had better compliance with non-incentivized indicators; however, they differed statistically from those with low compliance on only 2 of 6 drug selection indicators (p<.001), with no differences on other indicators. Overall, no difference in 12 of 14 non-incentivized indicators.
Hamilton et al, 2013120 Cross-sectional 29 practices
Ambulatory UK 2007
QOF Compared smoking rates, smoking status ascertained, and smoking cessation advice or referrals by disease condition - CVD and respiratory disease, for whom smoking indicators are incentivized, as well as patients with depression and “none,” for whom smoking indicators are not.
Patients without conditions for which smoking indicators were incentivized had significantly lower rates of recorded smoking status (eg, 91.38% of women with CVD and 77.53% of women with respiratory disease vs 64.29% of women with depression, and 66.27% of women with no diagnosis), and cessation advice (eg, 92.7% of men with CVD and 88.86% of men with respiratory disease vs 80.03% of men with depression and 73.21% of men with no diagnosis).
Hardy et al, 2014130 Longitudinal cohort 45,296 pregnant women who smoke
Ambulatory UK 2000-2005 2006-2009
QOF Compared smoking cessation advice offered to pregnant women before and after QOF smoking indicators stabilized. The QOF incentivizes smoking cessation advice for patients with hypertension, diabetes, asthma, and mental illness, but not pregnancy.
Documentation of smoking cessation advice increased over time, from 7% in 2000, to 33% in 2004, 37% in 2005, and stabilizing between 26-29% between 2006-2009. Younger (15-19; OR = 1.21, 95% CI [1.10, 1.35]) and older pregnant women (45-49; OR = 2.37, 95% CI [1.11, 5.10]) were more likely than women 25-29 to have received cessation advice, as were patients from the most deprived group as compared with the least (OR = 1.38, 95% CI [1.14, 1.68]). In addition, advice was more likely for pregnant women if they had a disease condition for which smoking cessation advice was incentivized.
105

Pay for Performance Programs in Healthcare Evidence-based Synthesis Program
Study; Design; N
Setting; Observation period
Program andIncentive Description Comparison Other Unintended Consequences
Karunaratne et al, 201368 Large prospective cohort study examining 3 time periods 10,040 patients
Ambulatory UK 2004-2006, 2006-2008, 2008-2010
QOF Compared reported blood pressure in patients with chronic kidney disease (CKD) and without, prior to, and 2 and 4 years following the introduction of the renal indicators.
There was a greater proportion of patients achieving both systolic and diastolic targets post-QOF, with reductions sustained in period 3. However, there were no significant reductions in blood pressure in patients for whom blood pressure recording was not incentivized.
Kirschner et al, 201326 Pre-post 65 practices, Mean 4865 pts/practice
Ambulatory Netherlands 1 year pre, 1 year post
P4P program took into consideration factors from behavioral economics and instituted smaller and more frequent incentives, with separate rewards for performance on clinical indicators and practice management, and thresholds were tiered to allow for attainable bonuses for each practice. In addition, time to bonus was 4 months, and bonuses were tied explicitly to the program. Practices received 5-10% of income. Program incentivized processes of care, and collected data on clinical outcomes, but did not apply incentives to outcome measures.
Examined achievement of unincentivized clinical outcomes for diabetes (control of HbA1c, blood pressure, total cholesterol), COPD (no exacerbation), asthma (no exacerbation), and CV risk management (blood pressure controlled, cholesterol controlled with statins), pre and post intervention.
Five out of 7 unincentivized outcome indicators (no significant improvement for exacerbation of COPD and asthma) showed significant improvements, ranging from +5.9% to +14.7%, with higher baseline scores significantly related to lower improvement scores.
106

Pay for Performance Programs in Healthcare Evidence-based Synthesis Program
Study; Design; N
Setting; Observation period
Program andIncentive Description Comparison Other Unintended Consequences
Kristensen et al, 2014100 161 Hospitals 390,652 patients with AMI 338,921 patients with heart failure 761,954 patients with pneumonia 333,991 patients with other conditions
Hospital UK 2007-2012
UK HQID Premier. Began in 2008, with 3 changes to the incentive. Year 1 was a pure tournament, with hospitals in the top quartile receiving a 4% bonus, second quartile a 2% bonus. For the next 6 months, incentives were rewarded on attainment and improvement. After the first 18 months, a fixed proportion of the hospital's expected income was withheld and paid out only if thresholds were reached, with quality scores based on the levels achieved in Year 1.
Compared HQID hospitals to controls on risk-adjusted mortality for patients with incentivized conditions (acute myocardial infarction, heart failure, and pneumonia) and non-incentivized conditions (acute renal failure, alcoholic liver disease, intercranial injury, paralytic ileus and intestinal obstruction without hernia, and duodenal ulcer).
Risk-adjusted mortality decreased for all 8 conditions in study and control hospitals, as well as all of England during the study period. While the intervention had a significant effect in the short term, in the long term, other regions experienced greater reductions in mortality, as did mortality rates for non-incentivized conditions; thus, short term improvements were not maintained. Authors found limited evidence for positive spillover effects from program hospitals to non-program hospitals due to widespread reporting, and 2 other regions adopting a form of incentives, as well as within program spillover effects to conditions not linked to incentives, with the largest reductions in mortality in the long term seen for conditions treated by specialists who also treated conditions that were incentivized.
107

Pay for Performance Programs in Healthcare Evidence-based Synthesis Program
Study; Design; N
Setting; Observation period
Program andIncentive Description Comparison Other Unintended Consequences
Kruse et al, 201338 Cross-sectional 20774 pts
Ambulatory US 2008-2011
Partners Community Healthcare Inc. (PHCI) is provider network covering a majority of commercially insured patients in MA. Incentive was a withheld amount that was returned to practices for meeting targets. Payments ranged from 3-4.8% of practice revenue. At the same time, PHCI adopted a system-wide EMR automatic reminder that prompted physicians to record smoking status.
Compared high-risk P4P patients with hypertension, diabetes, or coronary heart disease to a) all non-P4P patients, and b) non-P4P patients with similar characteristics on smoking status documentation (80% target).
Smoking status documentation increased each year among all patients from 47% in 2008 to 63% post-intervention in 2010 and 74% in 2011. Increase in documentation was greatest in P4P patients. Documentation increased in non- P4P patients from 48-71% post-intervention, as compared with 56-83% for P4P patients and 56-80% non-P4P but similar patients. Authors conclude that EMR accounted for the improved documentation, with a small intervention effect, and that spillover effects cannot be determined.
Ryan et al, 201495 2873 HBVP Hospitals and 399 Comparison
Hospital US 2008-2012
Medicare HVBP Incentivizes attainment and improvement equally, is budget neutral using penalties and rewards by redistributing a portion of 1% withholds from “losing” to “winning” hospitals, and incentivizes clinical quality (12) and patient experience (8) measures.
Compared HVBP and matched non-HVBP hospitals on composite quality (12) and patient experience measures (8).
In the first period, HVBP was associated with (non-significant) reductions on both clinical quality and patient experience composites. Improvements in clinical processes but not patient experience pre-dated program implementation in HVBP hospitals but not controls possibly in anticipation of the program; thus, HVBP hospitals showed greater improvement over the entire study period. Authors hypothesize that effects may have spilled over to non-HVBP hospitals.
Sutton et al, 201075 Cohort, 6 time points 315 providers
Ambulatory UK (Scotland) 2000-2006
QOF Compared performance smoking status, alcohol consumption, blood pressure, BMI, and cholesterol indicators by whether the indicator is incentivized and whether the disease category (group) was targeted or untargeted, in patients ≥ 45 to evaluate spillover effects.
Following the introduction of QOF, the estimated overall increase in recording for incentivized indicators was 19.9% for targeted patients and 5.3% for untargeted patients with a positive spillover of 10.9% increase in the recording of clinically effective unincentivized indicators for targeted patients, with a greater response on indicators attracting more payment and requiring more stringent performance.
108

Pay for Performance Programs in Healthcare Evidence-based Synthesis Program
Additional Unintended Consequences
KIs also felt that incentivized wait time indicators not only encourage gaming, but are also harmful the provider-patient relationship. In the UK, patients must be seen within 48 hours, which translates in practice to many patients seeing providers other than their primary care provider for visits that are not routine and scheduled far in advance. Relatedly, KIs voiced concern that the degree of documentation required in P4P programs shifts attention away from patient care. Another area of concern for KIs was the potential for overtreatment, and in particular, environments in which measure attainment is the primary focus, so much so that local reminders and targets may be set incrementally lower or higher to avoid missing a target. Finally, a number of KIs mentioned the QOF implementation of the use of the Patient Health Questionnaire-9 (PHQ-9) to screen for depression severity. Providers felt that the use of the PHQ-9 was akin to “check-boxing” and limited their autonomy/clinical judgment, and stated that it was not uncommon for providers to code patients based on symptomology, rather than diagnose and code them as depressed. The PHQ-9 has recently been retired as an indicator.
109

Pay for Performance Programs in Healthcare Evidence-based Synthesis Program
SUMMARY AND DISCUSSION We reviewed 1,363 titles and abstracts from the electronic search. 509 articles met inclusion criteria. Upon full text review, we excluded 416 articles, for a total of 94 included studies. We identified 47 primary studies for Key Question 1, 41 primary studies meeting inclusion criteria for Key Question 2, and 42 primary studies addressing Key Question 3. Thirty-two studies met criteria for more than one key question.
SUMMARY OF EVIDENCE BY KEY QUESTION Key Question 1: What are the effects of financial incentive programs on patient outcomes and processes of care?
Overall, there is low to moderate evidence that P4P programs in ambulatory settings can improve the proportion of patients receiving the care process targeted by an intervention, though these effects are typically modest and not sustained over the long term, and findings vary according to study design and health system. Studies evaluating processes of care in the UK’s QOF consistently report modest improvements in the first one to 2 years of the program, followed by either a plateau or slowing in improvement rates. In other ambulatory settings, a handful of studies, particularly those evaluating Taiwan’s diabetes mellitus P4P program, report moderate improvements in processes of care associated with P4P, and findings from short-term and cross-sectional studies report generally positive associations between P4P and screenings and preventive care. However, findings from longer-term studies examining processes of care often report a slowing of improvement or little to no association.
There is no clear evidence of the QOF’s effect on patient outcomes, with variation by indicator, disease condition, and study period. For some indicators, similar to findings reported for processes for care, the QOF had an immediate positive effect, with a plateauing of improvement over time. For others, such as HbA1c, post QOF trends were significantly below those predicted before the intervention. In other countries and in the United States, there is little good-quality evidence that directly examines the effects of P4P on health outcomes, with most studies reporting little to no effect.
In hospital settings, studies evaluating the Premier Hospital Quality Incentive Demonstration (HQID) and the Hospital Value-Based Purchasing (HVBP) programs in the United States report a limited effect on both processes of care and patient outcomes. However, a study evaluating the effect of P4P in the VHA on processes of care found significant and sustained improvement on 6 of the 7 measures examined. Internationally, studies evaluating hospital P4P programs report generally positive effects, with a slowing of improvements or a plateau over time.
Key Question 2: What are the implementation factors that modify the effectiveness of pay for performance?
a. What implementation factors are associated with changes in processes of care or patient outcomes?
We found 28 studies examining factors associated with processes of care or patient outcomes. We provide a more detailed summary of study and relevant key informant interview findings organized according to subcategories of the implementation framework in Table 15.
110

Pay for Performance Programs in Healthcare Evidence-based Synthesis Program
b. What implementation factors are associated with changes in provider cognitive and/or behavioral responses?
We included 14 studies examining factors associated with changes in provider cognitive and/or behavioral outcomes. Studies reported that perceptions of program effectiveness were related to measure alignment with goals, and that providers placing a higher degree of importance on goals and quality targets performed better than those who did not. In addition, measures focused on patient care experience or clinical quality improved staff communication and care coordination, while those focused on productivity or efficiency were associated with poor staff communication. One study found that provider participation in P4P programs relates to both the potential for rewards as well as perceived ethical risk, and another found differences in performance by underlying payment structure and concluded that higher incentives may be necessary when the degree of cost sharing is lower. Finally, the results of 2 small studies that surveyed providers on attitudes and values found a negative relationship between performance and placing a high value on autonomy.
KI discussions in this area centered on the balance between intrinsic and extrinsic motivation for providers and the organizational culture and support to align the two, including provider buy-in, and supportive and encouraging communication and feedback on provider performance. In addition, KIs stressed the importance of implementation processes, for programs in general and also for the introduction of newly incentivized measures. Implementation processes should be transparent and provide resources to encourage and enable provider buy-in through information that allows them to link the measure to clinical quality and provides guidance on how to achieve success. To further achieve buy-in, KIs urged the engagement of stakeholders of all levels at each stage, and recommended a “bottom-up” approach to program development. They stressed that P4P programs should include a combination of measures addressing processes of care and patient outcome, and that while measures should cover a broad range, too many measures increase the likelihood of negative unintended consequences. KIs also agreed that measures should reflect organizational priorities, be realistically attainable, evidence-based, clear, simple, and linked to clinically significant rather than data-driven outcomes, with systems in place for evaluation and modification as needed. In addition, improvements should be incentivized, incentives should be large enough to provide motivation but not so large as to encourage gaming, penalties may be more effective than rewards, and team-based incentives were suggested to increase the buy-in and professionalism of both clinical and non-clinical staff. Similarly, the timing of payments should be frequent enough to reinforce the link between measure achievement and the reward; however, this must be balanced with payment size, as the reward must be substantial enough to reinforce behavior.
111

Pay for Performance Programs in Healthcare Evidence-based Synthesis Program
Table 15. KQ2 Evidence and Policy Implications by Implementation Framework Category
Implementation Framework Category
Study Evidence Themes from KI Interviews Policy Implications
Program design features
Thirteen studies2-14 examined program design features and found: · Measures linked to quality and patient
care were positively related to improvements in quality and greater provider confidence in the ability to provide quality care, with measures tied to efficiency were negatively associated.
· Perceptions of program effectiveness were related to the perception that measures aligned with organizational goals, and perceived financial salience related to measure adherence, as did perceptions of target achievability.
· Different payment models result in differences in both bonuses/payments and performance.
· More statistically stringent methods of creating composite quality scores was more reliable than raw sum scores
· The cost effectiveness of P4P varies widely by measure.
· Programs should include a combination of process of care and patient outcome measures.
· Process of care measures should be evidence-based, clear and simple, linked to specific actions rather than complex processes, and clearly connected to a desired outcome.
· Measure targets should be grounded in clinical significance rather than data improvement.
· Disseminate the evidence behind and rationale for incentivized measures.
· Measures should reflect the priorities of the organization, its providers, and its patients.
· Incentives should be designed to stimulate different actions depending on the level of the organization at which they are targeted.
· Incentives must be large enough to motivate, and not so large as to encourage gaming - with hypotheses ranging from 5-15%.
· Incentives should be based on improvements, and all program participants should have the ability to earn incentives.
· Magnitude of the incentive attached to a specific measure should be relative to organizational priorities.
· Programs that emphasize measures that target process of care or clinical outcomes that are transparently evidence-based and viewed as clinically important may inspire more positive change than programs that use measures targeted to efficiency or productivity, or do not explicitly engage providers from the outset.
· The incentive structure needs to carefully consider several factors including incentive size, frequency, and target.
Implementation Processes
Eight studies15-22examined changes in implementation, with 7 specifically related to updating or retiring measures, and found: · Under both the QOF and in the VHA,
removing an incentive from a measure had little impact on performance once high level performance had been achieved.
· Increasing maximum thresholds resulted in greater increases by poorer-performing practices.
· Stakeholder involvement and provider buy-in are critical.
· Bottom-up approach. · Reliable data/feedback to providers in a non-
judgmental fashion. · Consider distributing incentives to clinical and
non-clinical staff.
· P4P programs should target areas of poor performance and consider de-emphasizing areas that have achieved high performance.
112

Pay for Performance Programs in Healthcare Evidence-based Synthesis Program
Implementation Framework Category
Study Evidence Themes from KI Interviews Policy Implications
Outer Setting Seven studies10,23-28 examined implementation factors related to the outer setting. · There is no clear evidence that setting
(eg, region, urban vs rural) or patient population predict P4P program success in the long term.
· Measures should be realistic within the patient population and health system in which they are used.
· Programs should be flexible to allow organizations to meet the needs of their patient populations.
· P4P programs should have the capacity to change over time in response to ongoing measurement of data and provider input.
Inner Setting Eighteen studies7,24,26-41 examined implementation factors related to the inner setting. Studies found: · For providers, being a contractor
rather than being employed by a practice was associated with greater efficiency and higher quality.
· Under the QOF, practices improved regardless of list size, with larger practices performing better in the short term.
· Under the QOF there is limited evidence that group practice and training status was associated with a higher quality of care.
· Findings were less clear in the US and elsewhere with regard to practice size and training status.
· Resources must be devoted to implementation, particularly when new measures are introduced.
· Provide support at the local level including designating a local champion.
· Incentives are just one piece of an overall quality improvement program. Other important factors may include a strong infrastructure, organizational culture, allocation of resources, and public reporting.
· Public reporting is a strong motivator and future research should work to untangle public reporting from P4P.
· Programs that emphasize measures that target process of care or clinical outcomes that are transparently evidence-based and viewed as clinically important may inspire more positive change than programs that use measures targeted to efficiency or productivity, or do not explicitly engage providers from the outset.
· P4P programs should have the capacity to change over time in response to ongoing measurement of data and provider input.
Provider characteristics
Four studies5,23,39,42 examined characteristics of the individuals involved, and provided no strong evidence that provider characteristics such as gender, experience, or specialty play a role in P4P program success.
Note: Categories are not mutually exclusive.
113

Pay for Performance Programs in Healthcare Evidence-based Synthesis Program
Key Question 3: What are the positive and negative unintended consequences, including any effect on health disparities, associated with pay for performance?
Forty studies examining unintended consequences associated with P4P met inclusion criteria for Key Question 3, of which 33 evaluated the QOF. Among these studies, 28 of the 40 evaluated the effect of P4P on health disparities in populations of low socio-economic status or racial/ethnic minorities, or examined disparities associated with other characteristics such as age, and multiple conditions. Nineteen studies report findings related to other unintended consequences, such as, gaming, positive and negative effects on unincentivized areas of care, and cherry picking/risk selection.
Health Disparities
Most of the studies examining differential effects of P4P by race/ethnicity, socioeconomic, or other demographic characteristics came from the UK’s QOF program. In general, there was no strong consistent evidence that P4P had different effects on different patient subgroups, though there were some exceptions as detailed in the main report. Groups with lower baseline care quality tended to experience greater absolute levels of improvement over the short term.
Key informants in the UK noted that, in the first 2 years after its introduction, the QOF successfully decreased health disparities. This was due to the larger magnitude of improvements seen among practices in areas of high deprivation which tended to have lower baseline levels of performance. However, key informants also noted that, once practices were performing near the upper thresholds, the costs associated with eliminating the remaining gaps were higher in areas with higher deprivation, and that providers in more affluent areas were more likely to receive incentives.
In the United States, the relationship between P4P and health disparities has not been well-studied. A number of KIs stressed the lack of formal evaluation of health disparities in US programs, the importance of the collection of cultural variables to allow for an accurate assessment, and the need for consistency across measures to allow for formal evaluation.
Other Unintended Consequences
Gaming
We found very few studies which directly examined the issue of gaming. Two studies examined preferential recording of values within the QOF, with one study reporting an increase of values just below a newly introduced target, and another study reporting no evidence of gaming. Key informants stressed that gaming is likely to occur and that P4P programs should be designed with this assumption. In general, KIs felt that, to reduce the likelihood of gaming, P4P programs must have stakeholder input and buy-in, and should be based on precise, simple, evidence-based, and realistic measures.
Risk selection
A number of studies examined risk selection associated with the QOF. One study found a positive relationship between the rate of exception reporting and total QOF score, and another study found significantly higher levels of quality in patients who were not excluded as compared with all patients, particularly for more complex processes and treatment related indicators.
114

Pay for Performance Programs in Healthcare Evidence-based Synthesis Program
Studies report higher rates of exception reporting for non-white, low-income patients, and patients with more co-morbid disorders, with one study reporting a higher percentage of excluded patients in larger practices. However, another concluded that higher rates of exception reporting were due to better documentation associated with the QOF. In Taiwan, non-enrolled patients were older, had more co-morbid conditions, and had higher diabetes risk scores. Key informants in the UK felt that exception reporting was not being abused. In the United States, key informants expressed concern that higher-risk patients can now be easily identified using algorithms, and a common theme among KIs was that incentive payments should be risk-adjusted to account for higher-risk patients.
Spillover effects
We found evidence of both positive and negative impacts of P4P on unincentivized measures as well as to unincentivized populations. One QOF study found that, over 3 years, the rate of improvement in areas or populations not associated with incentives declined. However, other studies in both the UK and the US reported positive effects on unincentivized care. For example, one study reported a positive spillover of a 10.9% increase in the recording of unincentivized indicators for patients with targeted disease conditions in the QOF. Key informants agreed that spillover effects likely occur, and suggested that the lack of significant findings associated with Centers for Medicare and Medicaid Services’ (CMS) Hospital Value-Based Purchasing (HVBP) program was due to improvements in quality spilling over to control hospitals.
Study Characteristics and Quality
We used a best evidence approach to guide study selection, and the Newcastle Ottawa Scale to rate study quality. All of the studies examining processes of care or patient outcomes (KQ1) had either sample sizes of 10,000 patients or more, or were longitudinal with 3 or more time points to allow for a trend. The studies examining larger P4P programs were most often retrospective cohort or cross-sectional studies with large sample sizes using simple pre-post designs or stronger methods such as difference in difference or interrupted time series. For studies that did involve comparison groups, not all utilized matched samples, and the inherent heterogeneity precludes strong conclusions. For key question 2, we included studies with less rigorous designs and smaller samples to allow us to better capture the breadth of research examining factors relate to the implementation of P4P programs. We included similar studies for key question 3 to allow for studies examining smaller subpopulations.
Publication Bias
Given that this review topic focuses on health systems rather than clinical interventions, no studies reported registered protocols, nor did studies report a priori primary aims or analyses. We did conduct a search for grey literature; however, we were unable to formally assess for publication bias.
Heterogeneity
Studies included in this review represent a wide range of P4P programs in a variety of settings, with vast differences in program characteristics and implementation features. Heterogeneity precluded us from combining studies quantitatively. Instead, study detail is provided in evidence tables and we provide a qualitative synthesis of study findings.
115

Pay for Performance Programs in Healthcare Evidence-based Synthesis Program
DISCUSSION We found 94 studies conducted in the United States and other countries that could inform practice in the VHA. The studies we examined across all 3 Key Questions differed widely by health system and patient population, and evaluated a range of P4P programs that varied substantially in both measures prioritized and incentive structure. Despite numerous examples of P4P programs, the heterogeneity inherent to each health system and organization, and the challenges related to the evaluation of complex interventions such as P4P, preclude us from drawing strong conclusions that can be broadly applied.
While the literature does not provide strong evidence to definitively guide the implementation of P4P programs, there are several themes from KI interviews that were consistent with evidence from the published literature. First, programs that emphasize measures that target process of care or clinical outcomes that are transparently evidence-based and viewed as clinically important may inspire more positive change than programs that use measures targeted to efficiency or productivity, or that do not explicitly engage providers from the outset. Findings from both the literature examining physician perceptions and KI interviews support the use of evidence-based measures that are congruent with providers expectations for clinical quality, and there was a strong agreement among KIs that provider buy-in is crucial.
Second, the incentive structure needs to carefully consider several factors including incentive size, frequency, and target. In general, the QOF, with its larger incentives, has been more successful than programs in the US Key informants attribute this to incentives that are large enough to motivate behavior, but also caution that larger incentives may not be cost-effective and may result in gaming. KIs also stressed the importance of the attribution of the incentive to provider behavior, that incentivized measures should be congruent with institutional priorities, should address the needs of the institution at the local level, and should be designed to best serve the local patient population.
Third, P4P programs should have the capacity to change over time in response to ongoing measurement of data and provider input. Key informants strongly agreed that P4P programs should be flexible and evaluated on an ongoing and regular basis. They pointed to the QOF, which is evaluated annually, and which has undergone numerous adjustments since its inception, such as the measures incentivized and the thresholds associated with payments.
Finally and relatedly, P4P programs should target areas of poor performance and consider de-emphasizing areas that have achieved high performance. Findings from studies of both the QOF and the VHA and our KI interviews support that improvements associated with measures achieving high performance can be sustained after the measure has been de-incentivized. Consistent evaluation of the performance of, and adjustments to incentivized measures will allow institutions to shift focus and attention to the areas of greatest need for improvement.
Recommendations for Future Research
Despite numerous P4P programs in the United States, the United Kingdom, and elsewhere, there is a need for higher-quality evidence to better understand whether these programs are effective in improving the quality of healthcare and patient health, and whether they result in negative unintended consequences. Studies examining P4P have been largely observational and primarily
116

Pay for Performance Programs in Healthcare Evidence-based Synthesis Program
retrospective; thus, despite large sample sizes, the nature of these study designs prevents the forming of strong conclusions that can be broadly applied. In addition, comparative studies that do exist often lack good matched comparison groups, with program sponsors reluctant to engage in random assignment or delay implementation to create a comparison group of providers. One of the fundamental challenges in evaluating complex multi-component interventions such as P4P is disentangling the individual effect of each intervention. In the case of P4P, the challenge is even greater, as contextual and implementation factors must also be strongly considered, as programs differ widely in their measures and incentive structures, as do the overarching health systems and organizations to which they are applied, and the patient populations for which they are designed to serve. Based on our review of the literature, insight provided by our key informants, and including future research needs salient to the VHA that were explicitly expressed by our KIs, we highlight the following:
· What is the effect of P4P without the influence of public reporting, and is this even important? Are there certain circumstances in which public reporting has a stronger or weaker influence (eg, is public reporting more influential at the hospital/administrative level, thus leading to greater structural changes vs behavior change at the individual provider level)?
· Are there an optimal number of measures needed to improve quality across a broad range of care, yet not encourage unintended consequences?
· Is there an incentive size and structure (rewards vs penalties, frequency, etc) that optimizes motivation for providing high-quality care, while balancing intrinsic and extrinsic motivation?
· What is the influence of the underlying payment structure on the effectiveness of P4P and the avoidance or mitigation of unintended consequences? Are there types of measures or incentive structures that are better for some, but not all payment structures?
· Are provider-level P4P incentives that target individual providers or teams more effective at improving the overall quality of care?
· Does P4P differentially affect subpopulations of patients (eg, low income, racial/ethnic minorities, patients with multiple co-morbidities)? If so, what can be done to mitigate health disparities and to avoid unintended consequences such as gaming and risk selection?
· Future research should examine the role of provider cultural sensitivity and the potential response bias on patient surveys/questionnaires related to differences in language and culture, and how these factors may influence performance and outcomes.
· Mixed-methods research should be conducted with a variety of stakeholders to provide a deeper understanding of factors related to implementation and unintended consequences.
· Future research should explicitly examine negative unintended consequences associated with pay for performance, including but not limited to gaming (including denominator gaming) and risk selection.
· Future research should report detail regarding the context and setting as well as incentive and implementation factors associated with the P4P program.
117

Pay for Performance Programs in Healthcare Evidence-based Synthesis Program
· Future research should examine the role and utility of stakeholders and all levels in the development of pay for performance programs and subsequent effect on patient health outcomes.
· Finally, KIs stressed the belief that the VHA as a system is in a unique position from which to conduct much-needed rigorous and methodologically strong P4P research, examining not only P4P’s effectiveness on processes of care and patient outcomes, but also examining implementation characteristics and unintended consequences.
Limitations
Our review has a number of limitations. Due to the recent report on pay for performance programs published by the RAND Corporation and commissioned by CMS, which focused largely on programs in the United States, and our inclusion of studies examining the UK’s Quality and Outcomes Framework, our review and subsequent conclusions are weighted heavily towards programs targeting ambulatory care. In addition, given the heterogeneity in P4P programs, and our goal of not only evaluating the effectiveness of P4P on the quality of care and patient health, but also of better understanding the important factors related to implementation and unintended consequences (particularly for Key Questions 2 and 3), we included studies that utilized less-rigorous methodology, some of which had small samples. The breadth of topics and outcomes related to implementation characteristics made it difficult to restrict our criteria by study design. Due to these factors, along with studies examining primarily observational data, we did not formally assess strength of evidence. To better inform an understanding of implementation factors important to the success of P4P programs, we interviewed 14 key informants. As our goal was not to conduct primary research, our key informants were experienced P4P researchers in the United States and the United Kingdom. While their knowledge and experience provided us with insight into implementation processes and unintended consequences, and they were particularly well positioned to speak to future research needs, we recognize that that conversations with other stakeholders, such as policymakers, program officials, hospital administrators and managers, providers and other clinical and non-clinical staff, and patients, are necessary to more fully understand the issues related to P4P.
Conclusions
Despite a large number of studies examining the effect of P4P on processes of care and patient outcomes, it is difficult to identify strong, broadly applicable conclusions about the effects of P4P programs. In part, this is because of the wide variation in health systems, patient populations, incentive structures, and underlying payment mechanisms represented across studies. In addition, studies were largely retrospective and observational in nature, or lacked adequate matched comparison groups. In general, P4P programs appear to have the potential to improve process of care outcomes over the short term, especially in ambulatory settings. There is insufficient evidence that P4P programs have beneficial effects on care processes over the long term, or on patient outcomes over any time period. Incentive programs tend to have the greatest absolute effect on care processes over the short term in settings with lower baseline levels of performance. In the United States in particular, the effects of P4P on health disparities are unclear, largely due to the lack of patient cultural variables collected and recorded. There is limited evidence in the VHA that initial improvements may sustain even after removal of the incentive. The value of incentive programs to stimulate incremental performance gains once initial improvements have been achieved is unclear. Also unclear is the influence of P4P above
118

Pay for Performance Programs in Healthcare Evidence-based Synthesis Program
and beyond other quality initiatives often accompanying financial incentives, such as public reporting and information technology. Findings from experts in the field are congruent with previous qualitative work133 – that the potential negative unintended consequences of P4P may outweigh benefits in these circumstances, though there is relatively little good-quality evidence examining the rates of harms from P4P.
119

Pay for Performance Programs in Healthcare Evidence-based Synthesis Program
REFERENCES 1. Damberg C, Sorbero M, Lovejoy S, Martsolf G, Raaen L, Mandel D. Measuring Success
in Health Care: Value-Based Purchasing Programs. Findings from an Environmental Scan, Literature Review, and Expert Panel Discussions. Santa Monica, California2014.
2. Walker S, Mason AR, Claxton K, et al. Value for money and the Quality and Outcomes Framework in primary care in the UK NHS. The British journal of general practice : the journal of the Royal College of General Practitioners. May 2010;60(574):e213-220.
3. Chen T-T, Lai M-S, Lin IC, Chung K-P. Exploring and Comparing the Characteristics of Nonlatent and Latent Composite Scores: Implications for Pay-for-Performance Incentive Design. Medical Decision Making. 2012;32(1):132-144.
4. Kantarevic J, Kralj B. Link between pay for performance incentives and physician payment mechanisms: evidence from the diabetes management incentive in Ontario. Health economics. Dec 2013;22(12):1417-1439.
5. Waddimba AC, Meterko M, Beckman HB, Young GJ, Burgess JF, Jr. Provider attitudes associated with adherence to evidence-based clinical guidelines in a managed care setting. Medical Care Research & Review. 2010;67(1):93-116.
6. Baek JD, Xirasagar S, Stoskopf CH, Seidman RL. Physician-targeted financial incentives and primary care physicians' self-reported ability to provide high-quality primary care. Journal of primary care & community health. Jul 1 2013;4(3):182-188.
7. Helm C, Holladay CL, Tortorella FR. The performance management system: applying and evaluating a pay-for-performance initiative... including commentary by Candio C. Journal of Healthcare Management. 2007 Jan-Feb 2007;52(1):49-63.
8. de Brantes FS, D'Andrea BG. Physicians respond to pay-for-performance incentives: larger incentives yield greater participation. American Journal of Managed Care. 2009;15(5):305-310.
9. Hadley J, Landon BE, Reschovsky JD. Effects of compensation methods and physician group structure on physicians' perceived incentives to alter services to patients. Health Services Research. Vol 412006:1200+.
10. Hearld LR, Alexander JA, Shi Y, Casalino LP. Pay-for-Performance and Public Reporting Program Participation and Administrative Challenges Among Small- and Medium-Sized Physician Practices. Medical care research and review : MCRR. Jun 2014;71(3):299-312.
11. Rodriguez HP, von Glahn T, Elliott MN, Rogers WH, Safran DG. The effect of performance-based financial incentives on improving patient care experiences: a statewide evaluation. Journal of general internal medicine. Dec 2009;24(12):1281-1288.
12. Torchiana DF, Colton DG, Rao SK, Lenz SK, Meyer GS, Ferris TG. Massachusetts General Physicians Organization's Quality Incentive Program Produces Encouraging Results. Health Affairs. 2013;32(10):1748-1756.
13. Young GJ, Beckman H, Baker E. Financial incentives, professional values and performance: A study of pay-for-performance in a professional organization. Journal of Organizational Behavior. 2012;33(7):964-983.
120

Pay for Performance Programs in Healthcare Evidence-based Synthesis Program
14. Werner RM, Dudley RA. Making the ‘pay’matter in pay-for-performance: implicationsfor payment strategies. Health Affairs. 2009;28(5):1498-1508.
15. Andriole KP, Prevedello LM, Dufault A, et al. Augmenting the impact of technologyadoption with financial incentive to improve radiology report signature times. Journal ofthe American College of Radiology. 2010;7(3):198-204.
16. Benzer JK, Young GJ, Burgess JF, Jr., et al. Sustainability of quality improvementfollowing removal of pay-for-performance incentives. Journal of general internalmedicine. Jan 2013;29(1):127-132.
17. Hysong SJ, Khan MM, Petersen LA. Passive monitoring versus active assessment ofclinical performance: impact on measured quality of care. Medical care.2011;49(10):883-890.
18. Caley M, Burn S, Marshall T, Rouse A. Increasing the QOF upper payment threshold ingeneral practices in England: impact of implementing government proposals. The Britishjournal of general practice : the journal of the Royal College of General Practitioners.Jan 2014;64(618):e54-59.
19. Shih T, Nicholas LH, Thumma JR, Birkmeyer JD, Dimick JB. Does pay-for-performanceimprove surgical outcomes? An evaluation of phase 2 of the Premier Hospital QualityIncentive Demonstration. Annals of surgery. Apr 2014;259(4):677-681.
20. Feng Y, Ma A, Farrar S, Sutton M. THE TOUGHER THE BETTER: AN ECONOMICANALYSIS OF INCREASED PAYMENT THRESHOLDS ON THE PERFORMANCEOF GENERAL PRACTICES. Health economics. Jan 5 2014.
21. Kontopantelis E, Doran T, Gravelle H, Goudie R, Siciliani L, Sutton M. Family DoctorResponses to Changes in Incentives for Influenza Immunization under the U.K. Qualityand Outcomes Framework Pay-for-Performance Scheme. Health services research.2012;47(3 Pt 1):1117-1136.
22. Kontopantelis E, Springate D, Reeves D, Ashcroft DM, Valderas JM, Doran T.Withdrawing performance indicators: retrospective analysis of general practiceperformance under UK Quality and Outcomes Framework. BMJ (Clinical research ed.).2014;348:g330.
23. Arrowsmith ME, Majeed A, Lee JT, Saxena S. Impact of pay for performance onprescribing of long-acting reversible contraception in primary care: an interrupted timeseries study. PloS one. 2014;9(4):e92205.
24. Bhattacharyya T, Mehta P, Freiberg AA. Hospital characteristics associated with successin a pay-for-performance program in orthopaedic surgery. Journal of Bone & JointSurgery, American Volume. 2008;90A(6):1240-1243.
25. Greene J. An examination of pay-for-performance in general practice in Australia. Healthservices research. Aug 2013;48(4):1415-1432.
26. Kirschner K, Braspenning J, Akkermans RP, Jacobs JE, Grol R. Assessment of a pay-for-performance program in primary care designed by target users. Family practice. Apr2013;30(2):161-171.
121

Pay for Performance Programs in Healthcare Evidence-based Synthesis Program
27. Ashworth M, Armstrong D. The relationship between general practice characteristics andquality of care: a national survey of quality indicators used in the UK Quality andOutcomes Framework, 2004-5. BMC family practice. 2006;7:68.
28. Ashworth M, Schofield P, Seed P, Durbaba S, Kordowicz M, Jones R. Identifying poorlyperforming general practices in England: a longitudinal study using data from the qualityand outcomes framework. Journal of health services research & policy. Jan2011;16(1):21-27.
29. Walker N, Bankart J, Brunskill N, Baker R. Which factors are associated with higherrates of chronic kidney disease recording in primary care? A cross-sectional survey of GPpractices. The British journal of general practice : the journal of the Royal College ofGeneral Practitioners. Mar 2011;61(584):203-205.
30. Wang Y, O'Donnell CA, Mackay DF, Watt GC. Practice size and quality attainmentunder the new GMS contract: a cross-sectional analysis. The British journal of generalpractice : the journal of the Royal College of General Practitioners. Nov2006;56(532):830-835.
31. Miller SC, Looze J, Shield R, et al. Culture change practice in U.S. nursing homes:prevalence and variation by state medicaid reimbursement policies. The Gerontologist.Jun 2014;54(3):434-445.
32. Doran T, Campbell S, Fullwood C, Kontopantelis E, Roland M. Performance of smallgeneral practices under the UK's Quality and Outcomes Framework. British Journal ofGeneral Practice. 2010;60(578):335-344.
33. Morgan CL, Beerstecher HJ. Primary care funding, contract status, and outcomes: anobservational study. The British journal of general practice : the journal of the RoyalCollege of General Practitioners. Nov 2006;56(532):825-829.
34. Tahrani AA, McCarthy M, Godson J, et al. Impact of practice size on delivery of diabetescare before and after the Quality and Outcomes Framework implementation. The Britishjournal of general practice : the journal of the Royal College of General Practitioners.Aug 2008;58(553):576-579.
35. Gemmell I, Campbell S, Hann M, Sibbald B. Assessing workload in general practice inEngland before and after the introduction of the pay-for-performance contract. Journal ofAdvanced Nursing. 2009;65(3):509-515.
36. Begum R, Smith Ryan M, Winther CH, et al. Small practices' experience with EHR,quality measurement, and incentives. The American journal of managed care. Nov2013;19(10 Spec No):eSP12-18.
37. Dalton ARH, Alshamsan R, Majeed A, Millett C. Exclusion of patients from qualitymeasurement of diabetes care in the UK pay-for-performance programme. DiabeticMedicine. 2011;28(5):525-531.
38. Kruse GR, Chang Y, Kelley JH, Linder JA, Einbinder JS, Rigotti NA. Healthcare systemeffects of pay-for-performance for smoking status documentation. The American journalof managed care. Jul 2013;19(7):554-561.
39. Li J, Hurley J, Decicca P, Buckley G. PHYSICIAN RESPONSE TO PAY-FOR-PERFORMANCE: EVIDENCE FROM A NATURAL EXPERIMENT. Healtheconomics. Jul 17 2013.
122

Pay for Performance Programs in Healthcare Evidence-based Synthesis Program
40. Norbury M, Fawkes N, Guthrie B. Impact of the GP contract on inequalities associatedwith influenza immunisation: a retrospective population-database analysis. The Britishjournal of general practice : the journal of the Royal College of General Practitioners.Jul 2011;61(588):e379-385.
41. Vamos EP, Pape UJ, Bottle A, et al. Association of practice size and pay-for-performanceincentives with the quality of diabetes management in primary care. CMAJ: CanadianMedical Association Journal. 2011;183(12):E809-816.
42. Saint-Lary O, Bernard E, Sicsic J, Plu I, Francois-Purssell I, Franc C. Why did mostFrench GPs choose not to join the voluntary national pay-for-performance program? PloSone. 2013;8(9):e72684.
43. Campbell S, Reeves D, Kontopantelis E, Middleton E, Sibbald B, Roland M. Quality ofprimary care in England with the introduction of pay for performance. New EnglandJournal of Medicine. 2007;357(2):181-190.
44. Lindenauer PK, Remus D, Roman S, et al. Public reporting and pay for performance inhospital quality improvement. New England Journal of Medicine. 2007;356(5):486-496.
45. United States Government Accountability Office. VA Health Care. Actions needed toimprove administration of the provider performance pay and award systems: Report tocongressional requesters; 2013.
46. Kizer KW, Kirsh SR. The double edged sword of performance measurement. Journal ofgeneral internal medicine. 2012;27(4):395-397.
47. Petersen LA, Woodard LD, Urech T, Daw C, Sookanan S. Does pay-for-performanceimprove the quality of health care? Annals of internal medicine. 2006;145(4):265-272.
48. Dudley R, Frolich A, Robinowitz D, Talavera J, Broadhead P, Luft H. Strategies tosupport quality-based purchasing: A review of the evidence: Prepared by the Stanford-University of California San Francisco Evidence-based Practice Center under ContractNo. 290-02-0017. AHRQ Publication No. 04-0057. Rockville, MD: Agency forHealthcare Research and Quality;2004.
49. Damschroder L, Aron D, Keith R, Kirsh S, Alexander J, Lowery J. Fosteringimplementation of health services research findings into practice: a consolidatedframework for advancing implementation science. Implementation science : IS.2009;4(50).
50. Pritchard R, Weaver S, Ashwood E. Evidence-based productivity improvement: Apractical guide to the Productivity Measurement and Enhancement System (ProMES).New York: Routledge 2011.
51. Pritchard R, Harrell M, DiazGranados D, Guzman M. The productivity measurement andenhancement system: a meta-analysis. J Appl Psychol. 2008;93(3):540-567.
52. Damberg CL, Sorbero ME, Mehrotra A, Teleki S, Lovejoy S, Bradley L. Anenvironmental scan of pay for performance in the hospital setting: final report.Washington, DC: Office of the Assistant Secretary for Planning and Evaluation (ASPE).2007.
53. Treadwell JR, Singh S, Talati R, McPheeters ML, Reston JT. A Framework for" BestEvidence" Approaches in Systematic Reviews. 2011.
123

Pay for Performance Programs in Healthcare Evidence-based Synthesis Program
54. Chou R, Helfand M. Challenges in systematic reviews that assess treatment harms.Annals of internal medicine. 2005;142(12_Part_2):1090-1099.
55. Wells G, Shea B, O'Connell D, et al. The Newcastle-Ottawa Scale (NOS) for assessingthe quality of nonrandomised studies in meta-analyses.http://www.ohri.ca/programs/clinical_epidemiology/oxford.asp. Accessed Dec 22, 2014.
56. Mullen KJ, Frank RG, Rosenthal MB. Can you get what you pay for? Pay-for-performance and the quality of healthcare providers. Rand J Econ. 2010;41(1):64-91.
57. Fagan PJ, Schuster AB, Boyd C, et al. Chronic care improvement in primary care:evaluation of an integrated pay-for-performance and practice-based care coordinationprogram among elderly patients with diabetes. Health services research. 2010;45(6 Pt1):1763-1782.
58. Chien AT, Li Z, Rosenthal MB. Improving timely childhood immunizations through payfor performance in Medicaid-managed care. Health services research. 2010;45(6 Pt2):1934-1947.
59. Chien AT, Eastman D, Li Z, Rosenthal MB. Impact of a pay for performance program toimprove diabetes care in the safety net. Preventive medicine. 2012;55:S80-85.
60. Pearson SD, Schneider EC, Kleinman KP, Coltin KL, Singer JA. The impact of pay-for-performance on health care quality in Massachusetts, 2001-2003. Health Aff.2008;27(4):1167-1176.
61. Levin-Scherz J, DeVita N, Timbie J. Impact of pay-for-performance contracts andnetwork registry on diabetes and asthma HEDIS measures in an integrated deliverynetwork. Medical care research and review : MCRR. 2006;63(1 Suppl):14S-28S.
62. Rosenthal MB, de Brantes FS, Sinaiko AD, Frankel M, Robbins RD, Young S. Bridgesto Excellence--recognizing high-quality care: analysis of physician quality and resourceuse. The American journal of managed care. 2008;14(10):670-677.
63. Doran T, Kontopantelis E, Valderas JM, et al. Effect of financial incentives onincentivised and non-incentivised clinical activities: longitudinal analysis of data from theUK Quality and Outcomes Framework. BMJ (Clinical research ed.). 2011;342:d3590.
64. Kontopantelis E, Reeves D, Valderas JM, Campbell S, Doran T. Recorded quality ofprimary care for patients with diabetes in England before and after the introduction of afinancial incentive scheme: a longitudinal observational study. BMJ quality & safety. Jan2013;22(1):53-64.
65. Simpson CR, Hannaford PC, Ritchie LD, Sheikh A, Williams D. Impact of the pay-for-performance contract and the management of hypertension in Scottish primary care: a 6-year population-based repeated cross-sectional study. British Journal of GeneralPractice. 2011;61(588):443-451.
66. Szatkowski L, McNeill A, Lewis S, Coleman T. A comparison of patient recall ofsmoking cessation advice with advice recorded in electronic medical records. BMCpublic health. 2011;11:291.
67. Calvert M, Shankar A, McManus RJ, Lester H, Freemantle N. Effect of the quality andoutcomes framework on diabetes care in the United Kingdom: retrospective cohort study.BMJ (Clinical research ed.). 2009;338:b1870.
124

Pay for Performance Programs in Healthcare Evidence-based Synthesis Program
68. Karunaratne K, Stevens P, Irving J, et al. The impact of pay for performance on thecontrol of blood pressure in people with chronic kidney disease stage 3-5. Nephrology,dialysis, transplantation : official publication of the European Dialysis and TransplantAssociation - European Renal Association. Aug 2013;28(8):2107-2116.
69. Richards MR, Sindelar JL. Rewarding healthy food choices in SNAP: behavioraleconomic applications. The Milbank quarterly. Jun 2013;91(2):395-412.
70. MacBride-Stewart SP, Elton R, Walley T. Do quality incentives change prescribingpatterns in primary care? An observational study in Scotland. Family practice. Feb2008;25(1):27-32.
71. Millett C, Gray J, Saxena S, Netuveli G, Majeed A. Impact of a pay-for-performanceincentive on support for smoking cessation and on smoking prevalence among peoplewith diabetes. CMAJ: Canadian Medical Association Journal. 2007;176(12):1705-1710.
72. Millett C, Bottle A, Ng A, et al. Pay for perfomance and the quality of diabetesmanagement in individuals with and without co-morbid medical conditions. Journal ofthe Royal Society of Medicine. 2009;102(9):369-377.
73. Murray J, Saxena S, Millett C, Curcin V, de Lusignan S, Majeed A. Reductions in riskfactors for secondary prevention of coronary heart disease by ethnic group in south-westLondon: 10-year longitudinal study (1998-2007). Family practice. Aug 2010;27(4):430-438.
74. Smith CJ, Gribbin J, Challen KB, Hubbard RB. The impact of the 2004 NICE guidelineand 2003 General Medical Services contract on COPD in primary care in the UK. QJM :monthly journal of the Association of Physicians. Feb 2008;101(2):145-153.
75. Sutton M, Elder R, Guthrie B, Watt G. Record rewards: the effects of targeted qualityincentives on the recording of risk factors by primary care providers. Health economics.Jan 2010;19(1):1-13.
76. Taggar JS, Coleman T, Lewis S, Szatkowski L. The impact of the Quality and OutcomesFramework (QOF) on the recording of smoking targets in primary care medical records:cross-sectional analyses from The Health Improvement Network (THIN) database. BMCpublic health. 2012;12:329.
77. Tahrani AA, McCarthy M, Godson J, et al. Diabetes care and the new GMS contract: theevidence for a whole county. The British journal of general practice : the journal of theRoyal College of General Practitioners. Jun 2007;57(539):483-485.
78. Cheng SH, Lee TT, Chen CC. A Longitudinal Examination of a Pay-for-PerformanceProgram for Diabetes Care: Evidence From a Natural Experiment. Medical care.2012;50(2):109-116.
79. Lai CL, Hou YH. The association of clinical guideline adherence and pay-for-performance among patients with diabetes. Journal of the Chinese Medical Association :JCMA. Feb 2013;76(2):102-107.
80. Lee T, Cheng S, Chen C, Lai M. A pay-for-performance program for diabetes care inTaiwan: a preliminary assessment. American Journal of Managed Care. 2010;16(1):65-69.
125

Pay for Performance Programs in Healthcare Evidence-based Synthesis Program
81. Tan EC, Pwu RF, Chen DR, Yang MC. Is a diabetes pay-for-performance program cost-effective under the National Health Insurance in Taiwan? Quality of life research : an international journal of quality of life aspects of treatment, care and rehabilitation. Mar 2014;23(2):687-696.
82. Chang R-E, Lin S-P, Aron DC. A Pay-For-Performance Program In Taiwan Improved Care For Some Diabetes Patients, But Doctors May Have Excluded Sicker Ones. Health Affairs. 2012;31(1):93-102.
83. Martens JD, Werkhoven MJ, Severens JL, Winkens RAG. Effects of a behaviour independent financial incentive on prescribing behaviour of general practitioners. Journal of Evaluation in Clinical Practice. 2007;13(3):369-373.
84. Rat C, Penhouet G, Gaultier A, et al. Did the new French pay-for-performance system modify benzodiazepine prescribing practices? BMC health services research. 2014:301.
85. Bhalla R, Schechter CB, Strelnick AH, Deb N, Meissner P, Currie BP. Pay for performance improves quality across demographic groups. Quality management in health care. Jul-Sep 2013;22(3):199-209.
86. Esse T, Serna O, Chitnis A, Johnson M, Fernandez N. Quality compensation programs: are they worth all the hype? A comparison of outcomes within a Medicare advantage heart failure population. Journal of managed care pharmacy : JMCP. May 2013;19(4):317-324.
87. Friedberg MW, Schneider EC, Rosenthal MB, Volpp KG, Werner RM. Association between participation in a multipayer medical home intervention and changes in quality, utilization, and costs of care. JAMA : the journal of the American Medical Association. Feb 26 2014;311(8):815-825.
88. Pechlivanoglou P, Wieringa JE, de Jager T, Postma MJ. THE EFFECT OF FINANCIAL AND EDUCATIONAL INCENTIVES ON RATIONAL PRESCRIBING. A STATE-SPACE APPROACH. Health economics. Feb 11 2014.
89. Kalwij S, French S, Mugezi R, Baraitser P. Using educational outreach and a financial incentive to increase general practices' contribution to chlamydia screening in South-East London 2003-2011. BMC public health. 2012;12:802-802.
90. Glickman SW, Ou F, DeLong ER, et al. Pay for performance, quality of care, and outcomes in acute myocardial infarction. JAMA: Journal of the American Medical Association. 2007;297(21):2373-2380.
91. Werner RM, Kolstad JT, Stuart EA, Polsky D. The Effect Of Pay-For-Performance In Hospitals: Lessons For Quality Improvement. Health Affairs. 2011;30(4):690-698.
92. Ryan AM, Blustein J, Doran T, Michelow MD, Casalino LP. The effect of Phase 2 of the Premier Hospital Quality Incentive Demonstration on incentive payments to hospitals caring for disadvantaged patients. Health services research. 2012;47(4):1418-1436.
93. Ryan AM, Blustein J. The effect of the MassHealth hospital pay-for-performance program on quality. Health services research. 2011;46(3):712-728.
94. Ryan A, Sutton M, Doran T. Does winning a pay-for-performance bonus improve subsequent quality performance? Evidence from the Hospital Quality Incentive Demonstration. Health services research. Apr 2014;49(2):568-587.
126

Pay for Performance Programs in Healthcare Evidence-based Synthesis Program
95. Ryan AM, Burgess JF, Pesko MF, Borden WB, Dimick JB. The early effects ofmedicare's mandatory hospital pay-for-performance program. Health services research.2014.
96. Colais P, Pinnarelli L, Fusco D, Davoli M, Braga M, Perucci CA. The impact of a pay-for-performance system on timing to hip fracture surgery: experience from the LazioRegion (Italy). BMC health services research. 2013;13:393.
97. Kuo RNC, Kuo-Piao C, Mei-Shu L. Effect of the Pay-for-Performance Program forBreast Cancer Care in Taiwan. Journal of Oncology Practice. 2011:e8s-e15s.
98. Li YH, Tsai WC, Khan M, et al. The effects of pay-for-performance on tuberculosistreatment in Taiwan. Health Policy & Planning. 2010;25(4):334-341.
99. Kanwar M, Brar N, Khatib R, Fakih M. Misdiagnosis of community-acquired pneumoniaand inappropriate utilization of antibiotics: side effects of the 4-h antibioticadministration rule. Chest. 2007;131(6):1865-1869.
100. Kristensen SR, Meacock R, Turner AJ, et al. Long-Term Effect of Hospital Pay for Performance on Mortality in England. The New England journal of medicine. August 7, 2014 2014;371:540-548.
101. Sidorenkov G, Haaijer-Ruskamp FM, de Zeeuw D, Bilo H, Denig P. Review: relation between quality-of-care indicators for diabetes and patient outcomes: a systematic literature review. Medical care research and review : MCRR. 2011;68(3):263-289.
102. Rosenthal MB, Li Z, Robertson AD, Milstein A. Impact of financial incentives for prenatal care on birth outcomes and spending. Health services research. 2009;44(5 Pt 1):1465-1479.
103. Ryan AM, Doran T. The Effect of Improving Processes of Care on Patient Outcomes: Evidence From the United Kingdom's Quality and Outcomes Framework. Medical care. 2012;50(3):191-199.
104. Alshamsan R, Lee JT, Majeed A, Netuveli G, Millett C. Effect of a UK Pay-for-Performance Program on Ethnic Disparities in Diabetes Outcomes: Interrupted Time Series Analysis. Annals of family medicine. 2012;10(3):228-234.
105. Vaghela P, Ashworth M, Schofield P, Gulliford MC. Population Intermediate Outcomes of Diabetes Under Pay-for-Performance Incentives in England From 2004 to 2008. Diabetes Care. 2009;32(3):427-429.
106. Share DA, Mason MH. Michigan's Physician Group Incentive Program Offers A Regional Model For Incremental Tee For Value' Payment Reform. Health Affairs. 2012;31(9):1993-2001.
107. Chen CS, Liu TC, Chen B, Lin CL. The failure of financial incentive? The seemingly inexorable rise of cesarean section. Social science & medicine (1982). Jan 2014;101:47-51.
108. Krumholz HM, Lin Z, Keenan PS, et al. Relationship between hospital readmission and mortality rates for patients hospitalized with acute myocardial infarction, heart failure, or pneumonia. JAMA : the journal of the American Medical Association. 2013;309(6):587-593.
127

Pay for Performance Programs in Healthcare Evidence-based Synthesis Program
109. Nicholas LH, Osborne NH, Birkmeyer JD, Dimick JB. Hospital process compliance and surgical outcomes in medicare beneficiaries. Arch Surg. 2010;145(10):999-1004.
110. Werner RM, Bradlow ET. Relationship between Medicare's hospital compare performance measures and mortality rates. JAMA : the journal of the American Medical Association. 2006;296(22):2694-2702.
111. Ryan A. Effects of the Premier Hospital Quality Incentive Demonstration on Medicare patient mortality and cost. Health services research. 2009;44(3):821–842.
112. Sutton M, Nikolova S, Boaden R, Lester H, McDonald R, Roland M. Reduced mortality with hospital pay for performance in England. New England Journal of Medicine. 2012;367(19):1821-1828.
113. Ryan RM, Deci EL. Self-determination theory and the facilitation of intrinsic motivation, social development, and well-being. American Psychologist. 2000;55:68-78.
114. Kerr EA, Lucatorto MA, Holleman R, Hogan MM, Klamerus ML, Hofer TP. Monitoring performance for blood pressure management among patients with diabetes mellitus: too much of a good thing? Arch Intern Med. 2012;172(12):938-945.
115. Doran T, Fullwood C, Kontopantelis E, Reeves D. Effect of financial incentives on inequalities in the delivery of primary clinical care in England: analysis of clinical activity indicators for the quality and outcomes framework. Lancet. Aug 30 2008;372(9640):728-736.
116. Chien AT, Wroblewski K, Damberg C, et al. Do physician organizations located in lower socioeconomic status areas score lower on pay-for-performance measures? JGIM: Journal of General Internal Medicine. 2012;27(5):548-554.
117. Lee JT, Netuveli G, Majeed A, Millett C. The effects of pay for performance on disparities in stroke, hypertension, and coronary heart disease management: interrupted time series study. PloS one. 2011;6(12):e27236.
118. Schofield P, Saka O, Ashworth M. Ethnic differences in blood pressure monitoring and control in south east London. The British journal of general practice : the journal of the Royal College of General Practitioners. Apr 2011;61(585):190-196.
119. Millett C, Netuveli G, Saxena S, Majeed A. Impact of pay for performance on ethnic disparities in intermediate outcomes for diabetes: a longitudinal study. Diabetes Care. 2009;32(3):404-409.
120. Hamilton FL, Laverty AA, Vamos EP, Majeed A, Millett C. Effect of financial incentives on ethnic disparities in smoking cessation interventions in primary care: cross-sectional study. Journal of public health (Oxford, England). Mar 2013;35(1):75-84.
121. Addink RW, Bankart MJ, Murtagh GM, Baker R. Limited impact on patient experience of access of a pay for performance scheme in England in the first year. European Journal of General Practice. 2011;17(2):81-86.
122. Ashworth M, Medina J, Morgan M. Effect of social deprivation on blood pressure monitoring and control in England: a survey of data from the quality and outcomes framework. BMJ (Clinical research ed.). 2008;337:a2030.
128

Pay for Performance Programs in Healthcare Evidence-based Synthesis Program
123. Crawley D, Ng A, Mainous AG, III, Majeed A, Millett C. Impact of pay for performance on quality of chronic disease management by social class group in England. Journal of the Royal Society of Medicine. 2009;102(3):103-107.
124. Dixon A, Khachatryan A, Gilmour S. Does general practice reduce health inequalities? Analysis of quality and outcomes framework data. European journal of public health. Feb 2012;22(1):9-13.
125. Hamilton FL, Bottle A, Vamos EP, et al. Impact of a pay-for-performance incentive scheme on age, sex, and socioeconomic disparities in diabetes management in UK primary care. Journal of Ambulatory Care Management. 2010;33(4):336-349.
126. McLean G, Sutton M, Guthrie B. Deprivation and quality of primary care services: evidence for persistence of the inverse care law from the UK Quality and Outcomes Framework. Journal of epidemiology and community health. Nov 2006;60(11):917-922.
127. Downing A, Rudge G, Cheng Y, Tu YK, Keen J, Gilthorpe MS. Do the UK government's new Quality and Outcomes Framework (QOF) scores adequately measure primary care performance? A cross-sectional survey of routine healthcare data. BMC health services research. 2007;7:166.
128. Chen TT, Chung KP, Lin IC, Lai MS. The unintended consequence of diabetes mellitus pay-for-performance (P4P) program in Taiwan: are patients with more comorbidities or more severe conditions likely to be excluded from the P4P program? Health services research. 2011;46(1 Pt 1):47-60.
129. Carey IM, Nightingale CM, DeWilde S, Harris T, Whincup PH, Cook DG. Blood pressure recording bias during a period when the Quality and Outcomes Framework was introduced. Journal of human hypertension. Nov 2009;23(11):764-770.
130. Hardy B, Szatkowski L, Tata LJ, Coleman T, Dhalwani NN. Smoking cessation advice recorded during pregnancy in United Kingdom primary care. BMC family practice. 2014;15:21.
131. Dhalwani NN, Tata LJ, Coleman T, Fleming KM, Szatkowski L. Completeness of maternal smoking status recording during pregnancy in United Kingdom primary care data. PloS one. 2013;8(9):e72218.
132. Fernandez Urrusuno R, Perez Perez P, Montero Balosa MC, Marquez Calzada C, Pascual de la Pisa B. Compliance with quality prescribing indicators linked to financial incentives: what about not incentivized indicators?: an observational study. European journal of clinical pharmacology. Mar 2014;70(3):303-311.
133. Chien AT, Chin MH, Davis AM, Casalino LP. Pay for performance, public reporting, and racial disparities in health care: how are programs being designed? Medical Care Research & Review. 2007;64(5):283S-304.
129