Understanding the Ecology of Lesser Prairie-Chickens in ...
128
Understanding the Ecology of Lesser Prairie-Chickens in Conservation Reserve Program-Dominated Landscapes, With Implications Towards Lesser Prairie-Chicken Management in Texas by Samuel W.H. Harryman, B.S. A Thesis In Wildlife, Aquatic, and Wildlands Science and Management Submitted to the Graduate Faculty of Texas Tech University in Partial Fulfillment of the Requirements for the Degree of MASTER OF SCIENCE Dr. Blake A. Grisham Committee Chair Dr. Clint W. Boal Dr. Samantha S. Kahl Dr. Mark Sheridan Dean of the Graduate School December, 2017
Transcript of Understanding the Ecology of Lesser Prairie-Chickens in ...

Understanding the Ecology of Lesser Prairie-Chickens in Conservation Reserve
Program-Dominated Landscapes, With Implications Towards Lesser Prairie-Chicken
Management in Texas
by
Samuel W.H. Harryman, B.S.
A Thesis
In
Wildlife, Aquatic, and Wildlands Science and Management
Submitted to the Graduate Faculty
of Texas Tech University in
Partial Fulfillment of
the Requirements for
the Degree of
MASTER OF SCIENCE
Dr. Blake A. Grisham
Committee Chair
Dr. Clint W. Boal
Dr. Samantha S. Kahl
Dr. Mark Sheridan
Dean of the Graduate School
December, 2017

Copyright 2017, Samuel W.H. Harryman

Texas Tech University, Samuel W.H. Harryman, December 2017
ii
ACKNOWLEDGMENTS
There are so many individuals to thank for helping make the completion of this
study possible. I thank my advisors Dr. Blake Grisham and Dr. Clint Boal for their
guidance and support. I will always be grateful to ya’ll for giving me this opportunity. I
thank all of my technicians for their excellent work during the course of this project.
They include T. Lane, D. Pullen, T. Whitmer, C. Gulick, C. Wilson, N. Schlachter, S.
Kielius, M. Chicherio, G. Detweiler, S. Hamilton, M. Vinyard, and L. Schilder. I also
thank A. Godar, C. Griffin, C. Conring, S. Fritts, D. Raleigh, K. Linner, T. Gicklhorn, N.
Mitchell, O. Kost, C. Bowlin, S. Rimer, M. Hartman, R. Martin, S. Soto, and K.
Brautigam for volunteering to help trap chickens. Many thanks go to Dan Greene for
statistical help and for teaching me data management. I thank Jude Smith and Duane
Lucia for helping me find leks for trapping and helping secure land access.
I thank the Texas Parks and Wildlife Department and the USDA Natural Resource
Conservation Service for making this project possible financially. I thank the Houston
Safari Club, Permian Basin Area Foundation, and the Oddie Jones family for monetary
support to help pay for classes. A HUGE thank you goes to the staff at the Muleshoe
National Wildlife Refuge for giving my field crews and me a place to stay and for
providing us with field equipment. Thank you Miss Glenda, Jude, Roy, and Dylan – ya’ll
are awesome. I also thank all of the private landowners who allowed me access to their
property. This project would not have been possible without your generosity and
cooperation.
Finally, I thank my family and friends for all of their support during my time in
graduate school. Thank you Mama and Dad for always being there for me and for

Texas Tech University, Samuel W.H. Harryman, December 2017
iii
instilling in me a love for the outdoors. Thank you Callie and Mary for all your support,
and thanks Callie for helping me make transmitter harnesses. Ya’ll are the world’s best
sisters! A big thanks goes out to my friends at the Sunset Church for your support and for
all the good times. Finally, I thank my wife Natalie for all of her love and support. I am
so happy to have you by my side, and I cannot wait to see where life takes us. I love you.

Texas Tech University, Samuel W.H. Harryman, December 2017
iv
TABLE OF CONTENTS
Acknowledgments…………………………………………………………………….ii
Abstract…...…………………………………………………………………………..vi
List of Tables…….…………………………………………………………………...ix
List of Figures…….………………………………………………………………….xi
I. Introduction…….……………………………………………………………………..1
Literature Review………………………………………………………….……..........1
Thesis Formatting……...………………………………………………………………8
Literature Cited………………………………………………………………………...9
II. Multiscale Habitat Selection of Lesser Prairie-Chickens in an Agriculture/
Conservation Reserve Program Land Matrix…………………………………….15
Abstract……………………………………………………………………………….15
Introduction……..……………………………………………………………………16
Study Area…...……………………………………………………………………….19
Methods….…………………………………………………………………………...20
Results….…………………………………………………………………………….24
Discussion….………………………………………………………………………...26
Management Implications……………………………………………………………32
Literature Cited……………………………………………………………………….32
III. Nesting Ecology of Lesser Prairie-Chickens in Conservation Reserve Program
Lands in the Southern High Plains of Texas……………………………………...42
Abstract……………………………………………………………………………….42
Introduction……..……………………………………………………………………43
Study Area…...……………………………………………………………………….45

Texas Tech University, Samuel W.H. Harryman, December 2017
v
Methods….…………………………………………………………………………...47
Results….…………………………………………………………………………….50
Discussion….………………………………………………………………………....53
Management Implications………….…………………………………………………56
Literature Cited……………………………………………………………………….57
IV. Causes of Mortality and Survival of Lesser Prairie-Chickens in Conservation
Reserve Program Lands in the Southern High Plains of Texas…………………66
Abstract………………………………………………………………………………..66
Introduction……..…………………………………………………………………….67
Study Area…...……………………………………………………………………….69
Methods….…………………………………………………………………………...71
Results….……………………………………………………….………………….....75
Discussion….………………………………………………….……………………...78
Management Implications………….…………………………………………………84
Literature Cited…………………………………………………………………….....84
Appendix………………………………………………………………………………...97
Tables….……………………………………………………………………………...97
Figures….……………………………………………………………………………100

Texas Tech University, Samuel W.H. Harryman, December 2017
vi
ABSTRACT
Lesser prairie-chickens (Tympanuchus pallidicinctus) occur in mixed-grass
prairies in the Southern Great Plains of North America. Conversion of native prairie to
agriculture, energy development, unmanaged grazing, and recurrent drought have
substantively reduced the lesser prairie chicken’s geographic range and abundance, and
the species has become a significant conservation priority in recent years. Grasslands
enrolled in the federal Conservation Reserve Program (CRP) provide cover for lesser
prairie-chickens during the nesting and brood-rearing seasons in the Shortgrass
Prairie/CRP ecoregion of their range, which has led to population increases. Lesser
prairie-chicken males are known to boom and display in CRP fields in the High Plains of
Texas, but little is known about the species’ ecology within CRP in the Sand Shinnery
Oak Prairie ecoregion of its range. I investigated lesser prairie-chicken habitat selection,
nest survival and ecology, and male and female survival in order to assess the
effectiveness of CRP as a tool for prairie-chicken conservation in Texas. I captured 19
male and 6 female lesser prairie-chickens within CRP fields in Bailey and Cochran
Counties, Texas during the years 2015-2017. I equipped each individual with a GPS
platform transmitter terminal (PTT), which recorded 4 GPS locations per day at ± 18 m
accuracy. I used selection ratios to assess lesser prairie-chicken selection between
different CRP enrollments, native grassland, and agricultural fields for the breeding and
non-breeding seasons, at the second and third orders of selection. At the second order of
selection, lesser prairie-chickens selected Conservation Reserve Program fields seeded in
non-native grasses (wi = 4.16, 95% CI=1.92 – 6.39) and native grasses and forbs (wi =
3.57, 95% CI=2.41 – 4.73) year-round. Cropland (wi = 0.17, 95% CI=0.07 – 0.27) and

Texas Tech University, Samuel W.H. Harryman, December 2017
vii
native grassland (wi = 0.27, 95% CI=0.05 – 0.49) were avoided, and native grass
Conservation Reserve Program fields were used in proportion to their availability (wi =
1.24, 95% CI=0.80 – 1.68) year-round. Only Conservation Reserve Program fields
seeded in native grasses and forbs were selected at the third order of selection (wi = 1.33,
95% CI=1.18 – 1.49). I monitored 8 lesser prairie-chicken nests during the course of the
study, and all but one were located within CRP fields. I used the nest survival model
within Program MARK to estimate nest survival within my study area. Apparent nest
success was 50%, and the probability of a nest surviving the incubation period was 0.49
(95% CI = 0.16-0.77). I recorded 16 mortalities during the course of my study, and the
majority were attributed to mammalian depredation (63%). Most mortality events (63%)
occurred during the second half of the breeding season (June – August). I used known-
fate models within Program MARK to estimate lesser prairie-chicken survival for the
breeding and non-breeding seasons. The probability of a lesser prairie-chicken surviving
the breeding season was 0.61 (SE = 0.08, 95% CI = 0.44-0.78), and the probability of an
individual surviving the non-breeding season was 0.82 (SE = 0.11, 95% CI = 0.50-0.95).
Survival increased as the proportion of native grass and forb CRP within the home range
increased. Based on my results, CRP fields benefit lesser prairie-chickens in the High
Plains of Texas. Lesser prairie-chicken home ranges included CRP fields, and my
estimates of nest survival and adult survival are consistent with previous studies. Despite
the benefits of CRP fields, lesser prairie-chicken abundance within CRP in Texas is
currently low. Populations are still recovering from the severe drought of 2011. Also,
CRP fields constitute approximately 17% of the study area, and they are often isolated
and too small to individually support prairie-chickens. Adding new CRP fields adjacent

Texas Tech University, Samuel W.H. Harryman, December 2017
viii
to existing fields and targeting large agricultural fields for enrollment will increase CRP
patch size and serve to connect the lesser prairie-chicken population across the High
Plains of Texas. Based on my results, an aggregation of CRP fields totaling 2,500 ha will
support multiple LEPC leks. Also, maintaining CRP fields in grasses after contract
expiration and actively managing expired fields for prairie-chickens will benefit the
species in the distant future.

Texas Tech University, Samuel W.H. Harryman, December 2017
ix
LIST OF TABLES
2.1. Landscape composition and configuration results for Bailey and Cochran
Counties, Texas. Results were obtained using the program FRAGSTATS………...38
2.2. Summary of design II, second order habitat selection for lesser prairie-
chickens (Tympanuchus pallidicinctus) during the breeding and non-
breeding seasons in Bailey and Cochran Counties, Texas, 2015-2017……………..39
2.3. Summary of design III, third order habitat selection for lesser prairie-
chickens (Tympanuchus pallidicinctus) during the breeding and non-
breeding seasons in Bailey and Cochran Counties, Texas, 2015-2017……………..40
3.1. Female lesser prairie-chicken (Tympanuchus pallidicinctus) capture results in
Bailey and Cochran Counties, Texas, 2015-2017……….…………….…………….61
3.2. Nesting statistics for female lesser prairie-chickens (Tympanuchus
pallidicinctus) in Bailey and Cochran Counties, Texas, 2015-2017….…………….61
3.3. Habitat characteristics at lesser prairie-chicken (Tympanuchus pallidicinctus)
nest sites and random points in Bailey and Cochran Counties, Texas for the
years 2015-2017…..…………………...…………………………………………….62
3.4. Habitat characteristics at lesser prairie-chicken (Tympanuchus pallidicinctus)
Nest areas and random areas in Bailey and Cochran Counties, Texas for the
years 2015-2017……………………………..……………………………………....62
3.5. Average temperature, standard error, and direction of nest temperature relative
to external temperature within lesser prairie-chicken (Tympanuchus
pallidicinctus) nests in Bailey and Cochran Counties, Texas, 2015-2017……...…..63
3.6. Average relative humidity, standard error, and direction of nest relative
humidity compared to external relative humidity within lesser prairie-chicken
(Tympanuchus pallidicinctus) nests in Bailey and Cochran Counties, Texas,
2015-2017.…………………………………………………………………..………63
4.1. Lesser prairie-chicken (Tympanuchus pallidicinctus) capture results for the
spring 2015-2017 trapping seasons. Individuals were captured in Conservation
Reserve Program fields in Bailey and Cochran Counties, Texas………………...…89
4.2. Output from five a priori models used to assess the effects of time, age, and
sex on lesser prairie-chicken (Tympanuchus pallidicinctus) breeding season
survival in Bailey and Cochran Counties, Texas, 2015 to 2017…….……………...90
4.3. Survival estimates, standard errors, and 95% confidence intervals for the top
model, SEL, in the a priori model set used to assess breeding season survival of

Texas Tech University, Samuel W.H. Harryman, December 2017
x
lesser prairie-chickens (Tympanuchus pallidicinctus) in Bailey and Cochran
Counties, Texas, 2015-2017……………………………..…………………….........90
4.4. Definitions of FRAGSTATS metrics used to assess effects of landscape
configuration on lesser prairie-chicken (Tympanuchus pallidicinctus) breeding
season survival in Bailey and Cochran Counties, Texas, 2015-2017…………........91
4.5. Output from eighteen models used to assess the effects of landscape
composition within the home range on lesser prairie-chicken (Tympanuchus
pallidicinctus) breeding season survival in Bailey and Cochran Counties,
Texas, 2015-2017………………………………………………………………….....92
4.6. Output from twelve models used to assess the effects of landscape
configuration within the home range on lesser prairie-chicken (Tympanuchus
pallidicinctus) breeding season survival in Bailey and Cochran Counties,
Texas, 2015-2017…………………………………………………………….....……93
4.7. Output from nine models used to assess the effects of landscape composition
and configuration within the home range on lesser prairie-chicken
(Tympanuchus pallidicinctus) breeding season survival in Bailey and Cochran
Counties, Texas, 2015-2017………………………………...………………………94
A.1. Average 50% core area and 95% home range size of lesser prairie-chickens
(Tympanuchus pallidicinctus) for six sub-seasons of the breeding season and
for the cumulative breeding and non-breeding seasons. Home ranges were
calculated using the Brownian Bridge Movement Model. Individuals were
captured in Bailey and Cochran Counties, Texas from March to May 2015-
2017……………………………………………………………….……………..…..97
A.2. Average 95% home range size of lesser prairie-chickens (Tympanuchus
pallidicinctus) for the six months of the non-breeding season. Home ranges
were calculated using the Brownian Bridge Movement Model. Individuals
were captured in Bailey and Cochran Counties, Texas from March to May
2015-2017……………………………………………………………………....…..98
A.3. Average daily movement distances of lesser prairie-chickens (Tympanuchus
pallidicinctus), summarized by six biological periods of the breeding season
and the cumulative non-breeding season. Individuals were captured in Bailey
and Cochran Counties, Texas from March to May 2015-2017……………………..99

Texas Tech University, Samuel W.H. Harryman, December 2017
xi
LIST OF FIGURES
2.1. Bailey and Cochran County, Texas study areas in the Sand Shinnery Oak
Prairie ecoregion of the lesser prairie-chicken (Tympanuchus pallidicinctus)
range……………………………………………………………………………...….41
3.1. Bailey and Cochran County, Texas study areas in the Sand Shinnery Oak
Prairie ecoregion of the lesser prairie-chicken (Tympanuchus pallidicinctus)
range…………………………………………………………………………...…….64
3.2. Visual obstruction reading averages at lesser prairie-chicken (Tympanuchus
pallidicinctus) nest sites and random points in Bailey and Cochran Counties,
Texas, 2015-2017………………………………….………………………………...65
4.1. Bailey and Cochran County, Texas study areas in the Sand Shinnery Oak
Prairie ecoregion of the lesser prairie-chicken (Tympanuchus pallidicinctus)
range…..…………………………………………………………………….…….....95
4.2. Distribution of lesser prairie-chicken (Tympanuchus pallidicinctus) mortalities
over the course of a year in Bailey and Cochran Counties, Texas from 2015-
2017……………………………………………………………………………….....96
A.1. Breeding and non-breeding season 95% home ranges for a male lesser prairie-
chicken (Tympanuchus pallidicinctus) in Bailey County, Texas. Home ranges
were estimated using the Brownian Bridge Movement Model……...……………100
A.2. Female long-distance movement from the Cochran County, Texas study area
south into Yoakum County. The long-distance movement was undertaken by
a single female on 31 May 2016 after total brood loss…........................................101
A.3. Distance from nearest lek (km) for all male lesser prairie-chicken
(Tympanuchus pallidicinctus) GPS locations. Distances are divided into the
lekking season (1 March – 31 May), summer season (1 June – 31 August), and
the non-breeding season (1 September – 28 February). Data were collected in
Bailey and Cochran Counties, Texas, 2015-2017…………………........................102
A.4. Distance from nearest lek (km) for all female lesser prairie-chicken
(Tympanuchus pallidicinctus) GPS locations. Distances are divided into the
the pre-nesting, nesting, brooding, and post-breeding periods of the breeding
season. Data were collected in Bailey and Cochran Counties, Texas, 2015-
2017………………………………………………………………………………..103
A.5. Beta-estimates and 95% confidence intervals for the effects of native grass
and for CRP (NGFCRP), native grass CRP (NGCRP), non-native grass CRP
(NNGCRP), native grassland, and agriculture within the home range on lesser
prairie-chicken (Tympanuchus pallidicinctus) breeding season survival. Data

Texas Tech University, Samuel W.H. Harryman, December 2017
xii
were collected in Bailey and Cochran Counties, Texas from 2015-2017………..…104
A.6. Beta-estimates and 95% confidence intervals for the effects of contagion
index, interspersion and juxtaposition index (IJI), average patch area, and
total area within the home range on lesser prairie-chicken (Tympanuchus
pallidicinctus) breeding season survival. Data were collected in Bailey and
Cochran Counties, Texas from 2015-2017………………………………………..105
A.7. Predictive plot showing survival rates of lesser prairie-chickens (Tympanuchus
pallidicinctus) based on the percentage of native grass CRP within the home
range. Data were collected in Bailey and Cochran Counties, Texas from 2015-
2017………………………………………………………………………………..106
A.8. Predictive plot showing survival rates of lesser prairie-chickens (Tympanuchus
pallidicinctus) based on the percentage of native grass and forb CRP within the
home range. Data were collected in Bailey and Cochran Counties, Texas from
2015-2017..………………………………………………………………………...107
A.9. Predictive plot showing survival rates of lesser prairie-chickens (Tympanuchus
pallidicinctus) based on the percentage of non-native grass CRP within the
home range. Data were collected in Bailey and Cochran Counties, Texas from
2015-2017…..……………………………………………………………………..108
A.10. Predictive plot showing survival rates of lesser prairie-chickens (Tympanuchus
pallidicinctus) based on the percentage of other grassland within the home
range. Data were collected in Bailey and Cochran Counties, Texas from 2015-
2017……………………………………………………………………………....109
A.11. Predictive plot showing survival rates of lesser prairie-chickens (Tympanuchus
pallidicinctus) based on the percentage of agriculture within the home range.
Data were collected in Bailey and Cochran Counties, Texas from 2015-
2017……………………………………………………………………………....110
A.12. Predictive plot showing survival rates of lesser prairie-chickens (Tympanuchus
pallidicinctus) based on the contagion estimate (%) within the home range.
Data were collected in Bailey and Cochran Counties, Texas from 2015-
2017……………………………………………………………………………....111
A.13. Predictive plot showing survival rates of lesser prairie-chickens (Tympanuchus
pallidicinctus) based on the interspersion and juxtaposition index (%) estimate
of the home range. Data were collected in Bailey and Cochran Counties,
Texas from 2015-2017………………………………………………........……...112
A.14. Predictive plot showing survival rates of lesser prairie-chickens (Tympanuchus
pallidicinctus) based on the average patch size (ha) of all cover classes within
the home range. Data were collected in Bailey and Cochran Counties, Texas
from 2015-2017………...…………………………………………………..……113

Texas Tech University, Samuel W.H. Harryman, December 2017
xiii
A.15. Predictive plot showing survival rates of lesser prairie-chickens (Tympanuchus
pallidicinctus) based on the total area (ha) of the home range. Data were
collected in Bailey and Cochran Counties, Texas from 2015-2017……………..114

Texas Tech University, Samuel Harryman, December 2017
1
CHAPTER I
INTRODUCTION
LITERATURE REVIEW
Geographic Distribution
The lesser prairie-chicken (Tympanuchus pallidicinctus, hereafter LEPC) is a
lekking prairie grouse of the southern Great Plains of North America. The species’
geographic range has been significantly reduced over the last century, and it now inhabits
portions of Colorado, Kansas, Oklahoma, Texas, and New Mexico (Crawford 1980,
Bailey and Williams 2000, Sullivan et al. 2000, Van Pelt et al. 2013). The reduction in
LEPC range has been attributed primarily to habitat loss and fragmentation through
conversion of native prairie to agriculture, unmanaged grazing, recurrent drought, woody
plant encroachment, and energy development (Henika 1940, Woodward et al. 2001,
Hagen and Giesen 2005). The current LEPC occupied range is approximately 80,000 km2
in area (Van Pelt et al. 2013).
Lesser prairie-chickens inhabit four habitat ecoregions throughout their
geographic range (Van Pelt et al. 2013, McDonald et al. 2016). The different ecoregions
include: 1) sand shinnery oak (Quercus havardii) prairie in eastern New Mexico and the
Southern High Plains of Texas, 2) sand sagebrush (Artemisia filifolia) prairie in
southeastern Colorado, southwestern Kansas, and the western Panhandle of Oklahoma, 3)
mixed-grass prairie in south central Kansas, northwest Oklahoma, and northeast Texas,
and 4) shortgrass prairie/Conservation Reserve Program (CRP) mosaic in northwestern
Kansas. Individuals in the shinnery oak prairie ecoregion have been found to be both
geographically and genetically isolated from individuals in the other three ecoregions
(Hagen et al. 2010).

Texas Tech University, Samuel W.H. Harryman, December 2017
2
Habitat
Lesser prairie-chicken habitat is characterized by prairies composed of mid- and
tall grass species and short statured shrubs. Often these prairies are found in areas with
sandy soils, which support taller and more structured vegetation compared to shortgrass
prairie (Haukos and Zavaleta 2016). The sand shinnery oak prairie ecoregion constitutes
the southwest portion of the LEPC range. The plant community within shinnery oak
prairie is comprised of sand shinnery oak and sand sagebrush, as well as various mid- to
tall grasses. Common grass species include sand and big bluestem (Andropogon hallii, A.
gerardii), little bluestem (Schizachyrium scoparium), dropseeds (Sporobolus spp.), and
purple three-awn (Aristida pururea, Grisham et al. 2016). The sand sagebrush prairie
ecoregion constitutes the northwestern portion of the LEPC range, and the plant
community is comprised of sand sagebrush, as well as sand and little bluestem,
switchgrass (Panicum virgatum), and prairie sandreed (Calamovilfa longifolia, Haukos et
al. 2016). Shrubs are more important in LEPC ecology in the western portion of the
species’ range, due to reduced amount and reliability of precipitation progressing east to
west across the Great Plains (Haukos and Zavaleta 2016).
The mixed-grass prairie and shortgrass prairie/CRP ecoregions constitute the
northeastern portion of the LEPC range. The mixed-grass prairie is comprised mainly of
perennial grasses with mixed sand sagebrush, shinnery oak, sand plum (Prunus spp.),
sumac (Rhus spp.), and yucca (Yucca spp., Hagen et al. 2004). Native prairie within the
shortgrass/CRP ecoregion is comprised of buffalo-grass (Buchloe dactyloides), blue
grama (Bouteloua gracilis), sideoats grama (B. curtipendula), little bluestem, sand
dropseed (Sporobolus cryptandrus), and western wheatgrass (Pascopyrum smithii,

Texas Tech University, Samuel W.H. Harryman, December 2017
3
Dahlgren et al. 2016). Conservation Reserve Program fields in this region and throughout
Kansas are comprised of native grass species such as big and little bluestem, Indian grass
(Sorghastrum nutans, switchgrass, and sideoats grama, as well as numerous native forbs
(Dahlgren et al. 2016). Fields enrolled in CRP provide necessary nesting habitat within
the shortgrass/CRP ecoregion, while native rangeland is used more for brood-rearing
(Fields 2004).
Much of the current LEPC occupied range is fragmented and composed of a
matrix of native rangeland, cropland, and land enrolled in CRP. Several studies have
examined LEPC habitat selection within landscapes with various land uses and
vegetation cover types (Jamison 2000, Fields 2004, Toole 2005, Kukal 2010, Pirius et al.
2013, Borsdorf 2013). Male LEPCs showed selection for native sand sagebrush prairie
and selection against cropland, CRP land, and native grassland in southwestern Kansas
(Jamison 2000). Wintering LEPCs in northeastern Texas selected grasslands with less
than 15% canopy cover of shrubs (Kukal 2010). Toole (2005), also working in northeast
Texas, found that LEPCs selected native rangeland over cropland and CRP land, with
over 85% of the area used by LEPCs being rangeland.
Population Status
Lesser prairie-chicken populations have declined significantly over the last 100
years due to habitat loss and recurrent drought. One estimate of the population decline is
97% range-wide since the late 1800s (Crawford 1980). Within Texas, past estimates of
LEPC abundance include up to two million individuals before 1900, 12,000 in 1937, and
between 11,000 – 18,000 in 1979 (Litton 1978, Texas Game, Fish, and Oyster
Commission 1945, and Crawford 1980 respectively). However, Timmer et al. (2013)

Texas Tech University, Samuel W.H. Harryman, December 2017
4
calculated a population estimate of 1,822 LEPCs throughout Texas, with a density of
only 0.12 birds/ha. The 19th century estimate of two million LEPCs throughout Texas is
improbable, but it still shows the marked decline of LEPCs across the state (Davis et al.
2008).
Based on aerial surveys, the range-wide LEPC population dropped to
approximately 19,000 individuals in 2013 after two years of drought across the southern
Great Plains and increased to approximately 26,000 individuals in 2016 (McDonald et al.
2016). Due to significant range and population declines, LEPCs were listed as threatened
under the U.S. Endangered Species Act (U.S. Fish and Wildlife Service 2014) in May of
2014. However, the listing ruling was vacated by judicial decision in September of 2015,
and the species was removed from the Endangered Species List in July of 2016.
Movements and Home Ranges
Daily movement distances and space use of LEPCs differ seasonally and by
ecoregion. Varying space use is attributed to behavioral activities (e.g. nest searching vs.
incubation, Riley et al. 1994) and resource variability within seasons (Sell 1979). Home
range size and daily movements are also influenced by drought conditions, with larger
home ranges and longer daily movements occurring during drought periods (Merchant
1982). In Kansas and Colorado, Plumb (2015) recorded LEPC females moved on average
2074 m/day during the nest searching period and only 780 m/day during brooding. For
the cumulative breeding season, females moved on average 1352 m/day and had an
average home range size of 340 ha. In the Southern High Plains of Texas, LEPC females
had an average home range size of 671 ha for the cumulative breeding season, almost
double the estimate from the northeast portion of the LEPC range (Borsdorf 2013).

Texas Tech University, Samuel W.H. Harryman, December 2017
5
Male LEPCs generally have smaller home ranges and move less than females
during the breeding season. More space use by females is attributed to nest site searching
and dispersal after failed nest attempts (Borsdorf 2013). In southwest Kansas, male LEPC
daily movements were longest during March (range between 435 and 786 m/day) and
shortest during May through September (range between 140 and 365 m/day). Male home
range size ranged from 12 to 140 ha during April and May, when males were displaying
on leks, and remained small throughout the summer, with a range of 77-144 ha (Jamison
2000). Average breeding season home range size was 306 ha for LEPC males in the
Southern High Plains of Texas (Borsdorf 2013).
Space use by LEPCs increases during the non-breeding season and is often similar
between sexes. Male home ranges increased to 229-409 ha during the winter in southwest
Kansas (Jamison 2000). Average home range size was 503.5 ha for females and 489.1 ha
for males during the non-breeding season in Sand Shinnery Oak Prairie in Texas (Pirius
et al. 2013). In Kansas, Colorado, and New Mexico, female home ranges averaged 986 ha
for the non-breeding season, and male home ranges averaged 904 ha (Robinson 2015).
Nest Ecology and Survival
The persistence of LEPC populations is influenced directly by nest survival
(Pitman et al. 2006, Hagen et al. 2009). Nests are usually located near leks (Giesen 1994,
Applegate and Riley 1998, Hagen et al. 2004) and are placed in areas with moderate
visual obstruction averaging 2-3 dm (Lautenbach 2015). Residual grasses often
characterize nest sites (Riley et al. 1992, Giesen 1994, Fields 2004, Davis 2009, Lyons et
al. 2011). Within native prairies, grasses such as purple three-awn (Aristida purpurea),
bluestems (Schizachyrium scoparium and Andropogon spp.) and dropseeds (Sporobolus

Texas Tech University, Samuel W.H. Harryman, December 2017
6
spp.) are most often used for nest substrates (Suminski 1977, Haukos and Smith 1989,
Riley et al. 1992, Fields 2004, Jones 2009). Shrubs are also utilized when grass cover is
reduced due to unmanaged grazing, fire suppression, and drought (Giesen 1994, Johnson
et al. 2004, Davis 2009, Grisham et al. 2014). Although the type of nest substrate is
important, vegetation structure is likely the most important predictor of nest site selection
(Hagen et al. 2013). A lack of visual obstruction in prairies dominated by sand shinnery
oak has been attributed to limiting nest survival in the Southern High Plains of Texas
(Grisham et al. 2014). However, light herbicide applications that reduce shinnery oak
cover and promote native grass growth negate the limitation of visual obstruction on nest
survival (Fritts et al. 2016).
Overall grass cover is greatest at nests in native prairie with interspersed CRP
(Hagen et al. 2013). Fields (2004) found that nests placed in CRP fields had a higher
grass percentage than nests placed in native rangeland. Nests within CRP also had taller
vegetation than surrounding native rangeland. Overall, both grass and grass/forb CRP
fields had a greater abundance of bunchgrasses than native rangeland and cropland, and
these two cover types were the only types used in greater proportion to their availability
for nesting (Fields 2004).
Adult and Sub-adult Survival
Lesser prairie-chicken adult and sub-adult survival is generally lower during the
breeding season compared to the non-breeding season (Hagen et al. 2007, Wolfe et al.
2007, Jones 2009, Lyons et al. 2009). Increased male mortality during the breeding
season is attributed to conspicuousness on the lek and increased energy costs associated
with breeding (Hagen et al. 2005, Wolfe et al. 2007). Male survival was found to be

Texas Tech University, Samuel W.H. Harryman, December 2017
7
lower during the latter part of the breeding season in the Texas Southern High Plains
(Grisham and Boal 2015). Lower survival in the later months of the breeding season was
a result of intense breeding activities as well as drought (Grisham and Boal 2015). Higher
female mortality during the breeding season is associated with searching for suitable nest
sites, incubation, and brooding chicks (Haukos et al. 1988, Hagen et al. 2007, Wolfe et al.
2007, Grisham 2012).
Conservation Reserve Program
Due to substantial range and population declines, much effort has been put into
finding conservation practices that will increase both habitat quantity and quality for
LEPCs. One such practice is CRP, which was initiated under the Federal Food Security
Act of 1985 and resulted in 14 million ha of marginal croplands being seeded to grasses
and other permanent vegetation (Rodgers and Hoffman 2005). Although the main goal of
the program was to prevent soil erosion, many wildlife species have benefitted from the
conversion of cropland back to grasses.
The implementation of CRP had varying effects on LEPC populations. In Kansas,
there was a strong population increase and range expansion after CRP was implemented
(Rodgers 1999, Rodgers and Hoffman 2005). Grassland area within the LEPC range in
Kansas increased by 11.9% from 1985 to present, and Kansas grasslands are now more
connected and less fragmented due to CRP (Spencer et al. 2017). Initial fields in Kansas
were planted in native, warm season grasses and later interseeded with native forbs,
which differed from CRP fields in many other areas of the LEPC range (Fields 2004,
Rodgers and Hoffman 2005, Davis et al. 2008, Ripper et al. 2008). Early CRP fields in
Colorado were also seeded in native grasses, but sideoats grama (Bouteloua curtipendula)

Texas Tech University, Samuel W.H. Harryman, December 2017
8
eventually dominated the stands, creating a monoculture (Rodgers and Hoffman 2005,
Davis et al. 2008).
Most of the early CRP fields in New Mexico, Oklahoma, and Texas were planted
in monocultures of non-native grasses such as weeping lovegrass (Eragrostis curvala),
Caucasian bluestem (Bothriochloa bladhii), yellow bluestem (B. ischaemum), and
klinegrass (Panicum coloratum) (Sullivan et al. 2000, Rodgers and Hoffman 2005, Davis
et al 2008). LEPCs in general did not experience population growth or range expansion
as a result of initial CRP plantings in New Mexico, Oklahoma, and Texas (Rodgers and
Hoffman 2005, Davis et al. 2008). Only until recently, almost 30 years after the
implementation of CRP, have LEPCs been believed to utilize CRP lands in the Southern
High Plains of Texas. This is likely a result of CRP fields aging and becoming more
populated with native species, as well as new fields being initially seeded in native
grasses and forbs (Applegate and Riley 1998, Sullivan et al. 2000, Davis et al. 2008).
Lesser prairie-chicken leks have been documented within CRP fields in Bailey
County and the northern portion of Cochran County in the High Plains of Texas.
However, nothing is known about LEPC space use, nesting ecology, survival, and
selection between different CRP types in this portion of the species’ range. The goal of
my study was to fill in knowledge gaps regarding LEPC ecology in CRP in Texas and to
assess how CRP can complement management efforts within sand shinnery oak prairie in
Texas.
THESIS FORMATTING
Each chapter in this thesis is an independent manuscript and meant to facilitate
future publication of results. Chapters contain redundancies in introduction, study area,

Texas Tech University, Samuel W.H. Harryman, December 2017
9
and methods since they are meant to be stand-alone documents. The chapters are
formatted to meet the guidelines for The Journal of Wildlife Management. All methods
were approved under Texas Tech University Animal Care and Use protocol #14073-10.
LITERATURE CITED
Applegate, R.D. and T.Z. Riley. 1998. Lesser prairie-chicken management. Rangelands
20:13-15.
Bailey, J.A. and S.O. Williams III. 2000. Status of the lesser prairie-chicken in New
Mexico, 1999. Prairie Naturalist 32:157-168.
Borsdorf, P.K. 2013. Lesser prairie-chicken habitat selection across varying land use
practices in eastern New Mexico and west Texas. Thesis, Texas Tech University,
Lubbock, Texas, USA.
Crawford, J.A. 1980. Status, problems, and research needs of the lesser prairie chicken.
Pages 1-7 in Proceedings of the Prairie Grouse Symposium, Stillwater,
Oklahoma, USA.
Dahlgren, D.K., R.D. Rodgers, R.D. Elmore, and M.R. Bain. 2016. Grasslands of western
Kansas, north of the Arkansas River. Pp. 259-279 in D.A. Haukos and C.W. Boal
(editors), Ecology and Conservation of Lesser Prairie-Chickens. Studies in Avian
Biology (no.48), CRC Press, Boca Raton, Fl.
Davis, D.M., R.E. Horton, E.A. Odell, R.D. Rodgers, and H.A. Whitlaw. 2008. Lesser
prairie-chicken conservation initiative. Lesser Prairie Chicken Interstate Working
Group. Unpublished Report. Colorado Division of Wildlfie, Fort Collins, CO.
USA.
Davis, D.M. 2009. Nesting ecology and reproductive success of lesser prairie-chickens in
shinnery oak-dominated rangelands. Wilson Journal of Ornithology 121:322-327.
Fields, T.L. 2004. Breeding season habitat use of Conservation Reserve Program (CRP)
land by lesser prairie-chickens in west central Kansas. Thesis, Colorado State
University, Fort Collins, Colorado, USA.
Fritts, S.R., B.A. Grisham, D.A. Haukos, C.W. Boal, M.A. Patten, D.H. Wolfe, C.E.
Dixon, R.D. Cox, and W.R. Heck. 2016. Long-term lesser prairie-chicken nest
ecology in response to grassland management. Journal of Wildlife Management
80:527-539.
Giesen, K.M. 1994. Movements and nesting habitat of lesser prairie-chicken hens in
Colorado. Southwestern Naturalist 39:96-98.

Texas Tech University, Samuel W.H. Harryman, December 2017
10
Grisham, B.A. 2012. The ecology of lesser prairie-chickens in shinnery oak-grassland
communities in New Mexico and Texas with implications toward habitat
management and future climate change. Dissertation, Texas Tech University,
Lubbock, TX, USA.
Grisham, B.A., P.K. Borsdorf, K.K. Boydston, and C.W. Boal. 2014. Nesting ecology
and nest survival of lesser prairie-chickens on the Southern High Plains of Texas.
Journal of Wildlife Management 78:857-866.
Grisham, B.A. and C.W. Boal. 2015. Causes of mortality and temporal patterns in
breeding season survival of Lesser Prairie-Chickens in shinnery oak prairies.
Wildlife Society Bulletin 39:536-542.
Grisham, B.A., J.C. Zavaleta, A.C. Behny, P.K. Borsdorf, D.R. Lucia, C.W. Boal, and
D.A. Haukos. 2016. Ecology and conservation of lesser prairie-chickens in sand
shinnery oak prairie. Pp. 315-344 in D.A. Haukos and C.W. Boal (editors),
Ecology and Conservation of Lesser Prairie-Chickens. Studies in Avian Biology
(no.48), CRC Press, Boca Raton, Fl.
Hagen, C.A., B.E. Jamison, K.M. Giesen, and T.Z. Riley. 2004. Guidelines for managing
lesser prairie-chicken populations and their habitats. Wildlife Society Bulletin
32:69-82.
Hagen, C.A. and K.M. Giesen. 2005. Lesser prairie-chicken (Tympanuchus
pallidicinctus). Account 364 in A. Poole, editor. The birds of North America.
Cornell Lab of Ornithology, Ithaca, New York, USA.
Hagen, C.A., J.C. Pitman, B.K. Sandercock, R.J. Robel, and R.D. Applegate. 2005.
Age- specific variation in apparent survival rates of male lesser prairie-chickens.
Condor 107:78-86.
Hagen, C.A., J.C. Pitman, B.K. Sandercock, R.J. Robel, and R.D. Applegate. 2007.
Age-specific survival and probable causes of mortality in female lesser prairie-
chickens. Journal of Wildlife Management 71:518-525.
Hagen, C.A, B.K. Sandercock, J.C. Pitman, R.J. Robel, and R.D. Applegate. 2009.
Spatial variation in lesser prairie-chicken demography: a sensitivity analysis of
population dynamics and management activities. Journal of Wildlife Management
73:1325-1332.
Hagen, C.A., J.C. Pitman, B.K. Sandercock, D.H. Wolfe, R.J. Robel, R.D. Applegate,
and S.J. Oyler-McCance. 2010. Regional variation in Mtdna of the lesser prairie-
chicken. Condor 112:29-37.
Texas Tech University, Samuel W.H. Harryman, December 2017
11
Hagen, C.A., B.A. Grisham, C.W. Boal, and D.A. Haukos. 2013. A meta-analysis of
lesser prairie-chicken nesting and brood-rearing habitats: implications for habitat
management. Wildlife Society Bulletin 37:750-758.
Haukos, D.A., L.M. Smith, and G.S. Broda. 1988. The use of radio-telemetry to estimate
lesser prairie-chicken nest success and hen survival. Proceedings of the Tenth
International Symposium on Biotelemetry. Fayetteville, AR, USA.
Haukos, D.A. and L.M. Smith. 1989. Lesser prairie-chicken nest site selection and
vegetation characteristics in tebuthiuron-treated and untreated sand shinnery oak
in Texas. Great Basin Naturalist 49:624-626.
Haukos, D.A. and J.C. Zavaleta. 2016. Habitat. Pp. 99-132 in D.A. Haukos and C.W.
Boal (editors), Ecology and Conservation of Lesser Prairie-Chickens. Studies in
Avian Biology (no.48), CRC Press, Boca Raton, Fl.
Haukos, D.A., A.A. Flanders, C.A. Hagen, and J.C. Pitman. 2016. Lesser prairie-
chickens of the sand sagebrush prairie. Pp. 281-298 in D.A. Haukos and C.W.
Boal (editors), Ecology and Conservation of Lesser Prairie-Chickens. Studies in
Avian Biology (no.48), CRC Press, Boca Raton, Fl.
Henika, F.S. 1940. Present status and future management of the prairie chicken in Region
5. Special Report: Texas Game, Fish, and Oyster Commission, Division of
Wildlife Restoration, Project 1-R.
Jamison, B.E. 2000. Lesser prairie-chicken chick survival, adult survival, and habitat
selection and movements of males in fragmented rangelands of southwestern
Kansas. Thesis, Kansas State University, Manhattan, Kansas, USA.
Johnson, K., B.H. Smith, G. Sadoti, T.B. Neville, and P. Neville. 2004. Habitat use and
nest site selection by nesting lesser prairie-chickens in southeastern New Mexico.
Southwestern Naturalist 49:334-343.
Jones, R.S. 2009. Seasonal survival, reproduction, and use of wildfire areas by lesser
prairie-chickens in the northeastern Texas Panhandle. Thesis, Texas A&M
University, College Station, Texas, USA.
Lautenbach, J.M. 2015. Lesser prairie-chicken reproductive success, habitat selection,
and response to trees. Thesis, Kansas State University, Manhattan, Kansas, USA.
Litton, G.W. 1978. The lesser prairie-chicken and its management in Texas. Texas Parks
and Wildlife Booklet 7000-7025.
Lyons, E.K., B.A. Collier, N.J. Silvy, R.R. Lopez, B.E. Toole, R.S. Jones, and S.J.
DeMaso. 2009. Breeding and non-breeding survival of lesser prairie-chickens
Tympanuchus pallidicinctus in Texas, USA. Wildlife Biology 15:89-96.

Texas Tech University, Samuel W.H. Harryman, December 2017
12
Lyons, E.K. R.S. Jones, J.P. Leonard, B.E. Toole, R.A. McCleery, R.R. Lopez, M.J.
Peterson, S.J. Demaso, and N.J. Silvy. 2011. Regional variation in nesting success
of lesser prairie-chicken. Studies in Avian Biology 39:223-231.
Merchant, S.S. 1982. Habitat use, reproductive success, and survival of female lesser
prairie chickens in two years of contrasting weather. Thesis, New Mexico State
University, Las Cruces, New Mexico, USA.
McDonald, L., K. Nasman, T. Rintz, F. Hornsby, and G. Gardner. 2016. Range-wide
population size of the lesser prairie-chicken: 2012, 2013, 2014, 2015, and 2016.
Report prepared for the Western Association of Fish and Wildlife Agencies. 42
pages.
Olawsky, C.D. and L.M. Smith. 1991. Lesser prairie-chicken densities on tebuthiuron-
treated and untreated sand shinnery oak rangelands. Journal of Range
Management 44:364-368.
Pirius, N.E., C.W. Boal, D.A. Haukos, and M.C. Wallace. 2013. Winter habitat use and
survival of lesser prairie-chickens in west Texas. Wildlife Society Bulletin
37:759-765.
Pitman, J.C., C.A. Hagen, B.E. Jamison, R.J. Robel, T.M. Loughin, and R.D. Applegate.
2006. Nesting ecology of lesser prairie-chickens in sand sagebrush prairie of
southwestern Kansas. Wilson Journal of Ornithology 118:23-35.
Plumb, R.T. 2015. Lesser prairie-chicken movement, space use, survival, and response to
Anthropogenic structures in Kansas and Colorado. M.S. thesis, Kansas State
University, Manhattan, KS, USA.
Riley, T.Z., C.A. Davis, M. Ortiz, and M.J. Wisdom. 1992. Vegetative characteristics of
successful and unsuccessful nests of lesser prairie-chickens. Journal of Wildlife
Management 56:383-387.
Riley, T.Z., C.A. Davis, M.A. Candelaria, and H.R. Suminski. 1994. Lesser prairie-
chicken movements and home ranges in New Mexico. Prairie Naturalist 26:183-
186.
Ripper, D., M. McLachlan, T. Toombs, and T. VerCauteren. 2008. Assessment of
Conservation Reserve Program fields within the current distribution of lesser
prairie-chicken. Great Plains Research 18:205-218.
Robinson, S.G. 2015. Landscape ecology, survival and space use of lesser prairie-
chickens. M.S. thesis, Kansas State University, Manhattan, KS, USA.
Rodgers, R.D. 1999. Recent expansion of lesser prairie-chickens to the northern margin
of their historic range. Proceedings of the Prairie Grouse Technical Council
23:18-19 (Abstract).

Texas Tech University, Samuel W.H. Harryman, December 2017
13
Rodgers, R.D. and R.W. Hoffman. 2005. Prairie grouse population response to
conservation reserve grasslands: an overview. Pgs. 120-128 in A.W. Allen and
M.W. Vandever, eds.The Conservation Reserve Program-Planting for the Future:
Proceeding of a National Conference, Fort Collins, Colorado, June 6-9, 2004.
Sell, D.L. 1979. Spring and summer movements and habitat use by lesser prairie chicken
females in Yoakum County, Texas. Thesis, Texas Tech University, Lubbock,
Texas, USA.
Spencer, D., D. Haukos, C. Hagen, M. Danield, and D. Goodwin. 2017. Conservation
Reserve Program mitigates grassland loss in the lesser prairie-chicken range of
Kansas. Global Ecology and Conservation 9:21-38.
Sullivan, R.M., J.P. Hughes, and J.E. Lionberger. 2000. Review of the historical and
present status of the lesser prairie-chicken (Tympanuchus pallidicinctus) in Texas.
Prairie Naturalist 32:176-187.
Suminski, H.R. 1977. Habitat evaluation for lesser prairie-chickens in eastern Chaves
County, New Mexico. Thesis, New Mexico State University, Las Cruces, New
Mexico, USA.
Texas Game, Fish, and Oyster Commision. 1945. Principal game birds and mammals of
Texas: their distribution and management. Von Boeckmann-Jones Co. Press,
Austin, Texas, USA.
Timmer, J.M., M.J. Butler, W.B. Ballard, C.W. Boal, and H.A. Whitlaw. 2013.
Abundance and density of lesser prairie-chickens and leks in Texas.
Wildlife Society Bulletin 37:741-749.
Toole, B.E. 2005. Survival, seasonal movements, and cover use by lesser prairie-chickens
in the Texas panhandle. Thesis, Texas A&M University, College Station, Texas,
USA.
United States Fish and Wildlife Service. 2014. Endangered and Threatened Wildlife and
Plants; Determination of Threatened Status for the lesser prairie-chicken; Final
Rule. Federal Registrar 79: 10 April 2014 <http://www.gpo.gov/fdsys/pkg/FR-
2014-04-10/pdf/2014-07302.pdf>. Accessed 6 November 2014.
Van Pelt, W.E., S. Kyle, J. Pitman, D. Klute, G. Beauprez, D. Schoeling, A. Janus,
and J. Haufler. 2013. The lesser prairie-chicken range-wide conservation plan.
Western Association of Fish and Wildlife Agencies. Cheyenne, Wyoming, pp.
367.
Wolfe, D.H., M.A. Patten, E. Shochat, C.L. Pruett, and S.K. Sherrod. 2007. Causes and
patterns of mortality in lesser prairie-chickens Tympanuchus pallidicinctus and
implications for management. Wildlife Biology 13:95-104.

Texas Tech University, Samuel W.H. Harryman, December 2017
14
Woodward, A.J.W, S.D. Fuhlendorf, D.M. Leslie, JR., and J. Shackford. 2001. Influence
of landscape compostion and change on lesser prairie-chicken (Tympanuchus
pallidicinctus) populations. American Midland Naturalist 145:261-274.

Texas Tech University, Samuel W.H. Harryman, December 2017
15
CHAPTER II
MULTISCALE HABITAT SELECTION OF LESSER PRAIRIE-CHICKENS IN
AN AGRICULTURE/CONSERVATION RESERVE PROGRAM LAND MATRIX
ABSTRACT The lesser prairie-chicken (Tympanuchus pallidicinctus) has received
considerable attention in recent years, due to population declines and the uncertainty of
its status on the U.S. Endangered Species Act. Substantial effort is being put into
studying the life history of the species and the effects of management practices on its
ecology. However, there is still a lack of information addressing 1) if lesser prairie-
chickens select Conservation Reserve Program fields for their daily activities and 2) how
the species selects these areas considering their availability on the landscape. The goal of
this chapter was to assess if Conservation Reserve Program lands are lesser prairie-
chicken habitat via habitat selection analyses, and if so, guide future management to
create and/or connect these areas for the species’ benefit. I assessed habitat selection of
lesser prairie-chickens within Conservation Reserve Program fields in Texas using
selection ratios after quantifying the amount and arrangement of different cover types
(including Conservation Reserve Program fields) across the study area. I assessed habitat
selection using a Type II design at the second order of selection and a Type III design at
the third order. My landscape analysis found Conservation Reserve Program fields
constituted 17% of the study area and all fields enrolled in the program were smaller than
the species’ traditional suggested minimum patch size requirement (4,900 ha). At the
second order of selection, lesser prairie-chickens selected Conservation Reserve Program
fields seeded in non-native grasses (wi = 4.16, 95% CI=1.92 – 6.39) and native grasses
and forbs (wi = 3.57, 95% CI=2.41 – 4.73) year-round. Cropland (wi = 0.17, 95%
CI=0.07 – 0.27) and native grassland (wi = 0.27, 95% CI=0.05 – 0.49) were avoided, and

Texas Tech University, Samuel W.H. Harryman, December 2017
16
native grass Conservation Reserve Program fields were used in proportion to their
availability (wi = 1.24, 95% CI=0.80 – 1.68) year-round. Only Conservation Reserve
Program fields seeded in native grasses and forbs were selected at the third order of
selection (wi = 1.33, 95% CI=1.18 – 1.49). Based on my results, Conservation Reserve
Program fields smaller than the recommended 4,900 ha patch size requirement were
habitat for lesser prairie-chickens, and as such, may be beneficial to the species on the
High Plains of Texas.
KEY WORDS Conservation Reserve Program, habitat selection, lesser prairie-chicken,
Texas, Tympanuchus pallidicinctus
The lesser prairie-chicken (Tympanuchus pallidicinctus, hereafter LEPC)
occupies portions of Colorado, Kansas, New Mexico, Oklahoma, and Texas, in the
southern Great Plains of North America. The species’ occupied range has declined by an
estimated 90% since 1900, due to substantial habitat loss and degradation (Hagen et al.
2004). The factors contributing to habitat loss include conversion of native prairie to
agriculture, energy development, woody plant encroachment, and unmanaged grazing
(Woodward et al. 2001, Hagen and Giesen 2005). Much of the habitat converted to
agriculture was lost prior to the 1950s, but the development of center pivot irrigation in
the 1960s allowed for the conversion of areas previously unsuitable for crop production
(Spencer et al. 2017). Lesser prairie-chickens are now found in 2 geographically isolated
populations in 4 habitat ecoregions. One population is located within the shinnery oak
(Quercus havardii) prairie ecoregion on the Southern High Plains of New Mexico and
Texas. The other population is located in the sand sagebrush (Artemesia filifolia) prairie
ecoregion in southeastern Colorado, southwestern Kansas, and the western Panhandle of

Texas Tech University, Samuel W.H. Harryman, December 2017
17
Oklahoma, the mixed-grass prairie ecoregion in south central Kansas, northwest
Oklahoma, and northeast Texas, and shortgrass prairie/Conservation Reserve Program
ecoregion in northwestern Kansas (Van Pelt et al. 2013).
Loss of habitat and recurrent drought have resulted in significant LEPC
population declines (Hagen and Giesen 2005). Prominent droughts across the southern
Great Plains occurred during the 1930s, ‘50s, and early ‘90s, and all contributed to LEPC
declines (Sullivan et al. 2000). More recently, the drought of 2011 had significant effects
on LEPC populations, particularly in the shinnery oak prairie ecoregion (McDonald et al.
2014). Less than 2,000 LEPCs were estimated to remain within both portions of the
species’ range in Texas (Timmer et al. 2013). Range-wide, the estimated LEPC
population was approximately 26,000 individuals in 2016, with the majority of
individuals occurring in the shortgrass prairie/CRP ecoregion in Kansas (McDonald et al.
2016). Due to significant range and population declines, LEPCs were listed as threatened
under the U.S. Endangered Species Act (U.S. Fish and Wildlife Service 2014) in May of
2014, but the listing ruling was vacated by judicial decision in September of 2015.
Lesser prairie-chickens are found in prairies characterized by tall and mid-grasses
and small shrubs, which are often supported by sandy soils (Haukos and Zavaleta 2016).
The traditional thought is LEPCs require large, unfragmented patches of prairie (4,900 –
20,236 ha) to sustain a population, mostly due to seasonal habitat needs (Applegate and
Riley 1998, Davis 2005). Habitat requirements for LEPCs include open areas for male
display, areas with a mixture of tall grasses and shrubs for nesting, grass and forb-
dominated areas with overhead cover for brood rearing, and grass and shrub-dominated
areas close to grain fields for fall and winter (Taylor and Guthery 1980, Applegate and

Texas Tech University, Samuel W.H. Harryman, December 2017
18
Riley 1998, Hagen et al. 2004). Much of the current LEPC occupied range is fragmented
and composed of intensive agriculture, native grasslands, and lands enrolled in CRP
(Rodgers 2016).
The CRP was initiated under the Federal Food Security Act of 1985, in an effort
to reduce soil erosion. Numerous wildlife species, including LEPCs, have benefitted from
the conversion of marginal croplands back to grasslands through CRP. The LEPC range
within Kansas has expanded north of the Arkansas River due to the implementation of
CRP (Rodgers and Hoffman 2005), and CRP fields in northwest Kansas provide nesting
habitat in a matrix of shortgrass prairie and cropland (Fields 2004). Lesser prairie-
chicken use of CRP is typically greater during drought years and in the drier, western
portions of the species’ range (Fields 2004, Sullins 2017).
Lesser prairie-chickens are known to inhabit CRP fields in the shinnery oak
prairie ecoregion of the LEPC range and are part of a genetic metapopulation of LEPCs
across the Southern High Plains of Texas and eastern New Mexico (Oyler-McCance et al.
2016). However, few studies have examined how lesser prairie-chickens select CRP
fields in context of their availability on the landscape in this ecoregion. The objectives of
my study were to 1) calculate the proportion of agricultural land, CRP land, and native
grassland across the study area, 2) quantify average CRP field size, and 3) examine LEPC
selection among agricultural land, native grassland, and different CRP enrollment types. I
hypothesized that intensive agriculture would comprise the majority of the landscape and
that most CRP fields would be smaller than the recommended patch size requirement for
LEPCs (4,900 – 20,236 ha; Haukos and Zavaleta 2016). I also hypothesized LEPCs

Texas Tech University, Samuel W.H. Harryman, December 2017
19
would select CRP fields seeded in native grasses and forbs over CRP fields seeded in
non-native grasses and agricultural fields (Fields 2004, Rodgers and Hoffman 2005).
STUDY AREA
This study took place on private lands in Bailey and Cochran Counties within the
Southern High Plains of Texas (33o52’N, 102o58’W; Figure 2.1). The landscape within
the study area was highly fragmented due to extensive conversion of native prairie to
intensive agriculture. Cotton (Gossypium spp.) and grain sorghum (Sorghum bicolor)
were the primary crops produced, and both center pivot irrigation and dryland farming
techniques were common. Beef cattle production was also present in the area but to a
lesser extent than crop production. Native prairie within the study area was characterized
by shrub/shortgrass vegetation communities that were bisected by shinnery oak prairie.
Mesquite (Prosopis glandulosa), buffalo grass (Bouteloua dactyloides), blue grama
(Bouteloua gracilis), sideoats grama (Bouteloua curtipendula), sand dropseed
(Sporobolus cryptandrus), narrow-leaf yucca (Yucca glauca), western ragweed
(Ambrosia psilostchya), and broom snakeweed (Gutierrezia sarothrae) were common
plant species within shortgrass prairie. Peterson and Boyd (1998) detail the vegetation
found within shinnery oak prairie.
Study efforts were focused within CRP fields, which were interspersed across the
landscape. The CRP fields were comprised of 4 common contract types: 1) fields planted
in introduced grasses, particularly weeping lovegrass (Eragrostis curvala) and old world
bluestems (Bothriochloa spp.) (CP1), 2) fields planted in native grass species such as
yellow indiangrass (Sorghastrum nutans), little bluestem (Schizachyrium scoparium),
switchgrass (Panicum virgatum), green sprangletop (Leptochloa dubia), sideoats grama,

Texas Tech University, Samuel W.H. Harryman, December 2017
20
and blue grama (CP2), 3) fields that were first seeded in non-native grasses and then later
seeded in natives (CP10), and 4) fields enrolled in the United States Department of
Agriculture State Acres for Wildlife Enhancement Program (SAFE). In addition to native
grasses, forbs such as alfalfa (Medicago spp.), Maximillian sunflower (Helianthus
maximiliani), Illinois bundleflower (Desmanthus illinoensis), and other natives were
seeded in strips across fields enrolled in SAFE (M. Samaniego, USDA Farm Service
Agency, personal communication).
The soils on the study area were primarily Amarillo and Arvana series (Girdner
1963). The soils within the Amarillo series are deep, medium- to coarse-textured, and
have a reddish-brown subsoil. The Arvana series consists of shallow to moderately deep
soils that are reddish-brown in color and moderately coarse textured. Arvana soils differ
from Amarillo soils in having rock-like caliche within 91.4 cm of the soil surface
(Girdner 1963). The Southern High Plains are characterized by a very warm and dry
climate. See Grisham et al. (2016) for a detailed description of weather patterns in the
shinnery oak prairie ecoregion of the LEPC range.
METHODS
Capture and Relocation
I captured LEPCs on 7 leks during the spring breeding season in 2015, 2016, and
2017. I used walk-in funnel traps (Toepfer et al. 1988), magnetic drop nets (Wildlife
Capture Services, Flagstaff, AZ, USA), tension drop nets (Silvy et al. 1990), and rocket
nets (Davis et al. 1980a) for capture. I took standard morphological measurements on all
individuals captured, including weight (g), tarsus length (mm), wing cord length (mm),
and pinnae length (mm). I assessed sex by presence of eye comb and pinnae length,

Texas Tech University, Samuel W.H. Harryman, December 2017
21
where males had a bright yellow eye comb and noticeably longer pinnae than females
(Copelin 1963). I used plumage characteristics to assess age. Individuals with white spots
within 2.54 cm of the tips of the outer 2 primary feathers were recorded as juveniles, and
individuals lacking these spots were recorded as adults (Copelin 1963). Each bird was
banded with a Texas Parks and Wildlife aluminum leg band. The main goal of my
research was to assess female reproductive ecology, so I equipped every female with a 22
gram Satellite Platform Transmitting Terminal GPS transmitter (PTT, Microwave
Telemetry, Columbia, MD, USA). I attached the PTTs using the figure-8 rump method
(Bedrosian and Craighead 2007). I deployed PTTs on males only after peak female
attendance at leks during mid-April. Satellite PTT data consisted of 4 GPS locations per
day, with fixes taking place at 0100, 0700, 1300, and 1700 hrs Central Standard Time. I
downloaded GPS data from the ARGOS website weekly. All methods were approved
under Texas Tech University Animal Care and Use Protocol #14073-10.
Landscape Analysis
I developed a land cover layer for my study area by using ArcGIS 10.2
(Environmental Systems Research Institute, Redlands, CA, USA) to merge a Cropscape
land cover layer (National Agricultural Statistics Service, U.S. Department of
Agriculture) with a 2014 CRP layer representing all properties enrolled in CRP across the
LEPC’s range. I clipped the resulting layer to Bailey and Cochran Counties and grouped
land cover classes into 5 groups for the landscape analysis. I chose to classify all of
Bailey and Cochran Counties in order to assess landscape composition and CRP patch
size to compare with results from Spencer et al. (2017) in Kansas. The final classes for
the analysis were 1) native grass and forb CRP, 2) native grass CRP, 3) non-native CRP,

Texas Tech University, Samuel W.H. Harryman, December 2017
22
4) agriculture, and 5) native grassland. The native grassland category was characterized
mostly by shrub/shortgrass vegetation communities and shinnery oak prairie. I used the
program FRAGSTATS (McGarigal et al. 2012; University of Massachusetts, Amherst,
MA, USA) to calculate area and interspersion metrics for the 5 cover classes across the
study area. The metrics calculated for each class included percentage of landscape
(PLAND), number of patches (NP), mean patch size (MN), area-weighted mean patch
size (AM), and interspersion and juxtaposition index (IJI). I also calculated the contagion
index (CONTAG) for the study area. The PLAND metric is the percentage of the
landscape each cover class occupies. The NP metric is the number of individual patches
for each cover class within the landscape. The MN metric is the average patch size in
hectares for each class, and each patch is equally represented. The AM metric is the
average patch size, where patches are weighted based on their size. The IJI, as a percent,
gives the magnitude of interspersion of different patch types and their juxtaposition to
each other. The IJI equals 100 when the corresponding patch type is equally adjacent to
all other patch types. The CONTAG, also a percent, gives the degree of clumping of
patches across the landscape. The index equals 100 when the landscape is one single
patch (McGarigal et al. 2012).
Habitat Selection
I used selection ratios (Manly et al. 2002) to assess LEPC breeding season (March
– August) habitat selection for the years 2015 – 2017 and non-breeding season
(September – February) habitat selection for 2015 and 2016. I assessed habitat selection
at the second order using a Type II design and at the third order using a Type III design
(Johnson 1980, Erickson et al. 2001).

Texas Tech University, Samuel W.H. Harryman, December 2017
23
To quantify available habitat at the second order of selection, I generated a 4.8 km
buffer around each lek and clipped the land cover layer from the landscape analysis to
each buffer. Although I conducted the landscape analysis as though all of Bailey and
Cochran Counties were available, I chose a 4.8 km buffer for available habitat because
LEPCs in general spend the majority of their lives within this distance from a lek
(Haukos and Zavaleta 2016). To quantify used habitat at the second order, I estimated
breeding and non-breeding season utilization distributions for each PTT-marked bird
using the Brownian Bridge Movement Model (BBMM, Horne et al. 2007). The BBMM
takes into account starting and ending locations and the time elapsed between them, as
well as the speed or mobility of the animal (Horne et al. 2007). The model is well suited
for situations where there are large quantities of relocations that may be autocorrelated
spatially and temporally and not independent (Walter et al. 2011). I calculated utilization
distributions using the adehabitatHR package (Calenge 2006) in Program R (R Version
3.1.2, www.r-project.org, accessed 29 Jan 2015). I generated the 95% isopleth for each
BBMM utilization distribution in R and imported it into ArcGIS as a shapefile (See
Appendix) for the habitat selection analysis. I also considered the proportion of land
cover classes within each BBMM home range as available habitat at the third order. To
quantify selection at the third order of selection, I overlaid each individual’s PTT
locations over the land cover layer and determined the proportion of locations within
each class.
I calculated a mean selection ratio, standard error, and 95% confidence interval
for each land cover class using the adehabitatHS package (Calenge 2011) in R. I also
calculated a standardized selection ratio for each cover class by dividing the mean
Texas Tech University, Samuel W.H. Harryman, December 2017
24
selection ratio by the sum of all mean selection ratios. If the confidence interval around a
selection ratio overlapped one, then the associated land cover class was considered to be
used in proportion to its availability. If the upper value of the confidence interval was less
than one, then the cover class was considered to be avoided. If the lower value of the
confidence interval was greater than one, then the cover class was considered to be
selected for by LEPCs. I acknowledge that not every land cover type was used, even if it
was considered available based on spatial scales and design within the 2 counties. Within
the guidelines of traditional habitat terminology, land cover that was not used, regardless
of availability, was not considered LEPC habitat (Hall et al. 1997). Therefore I defined
habitat as land cover types that were selected for in proportion or in greater proportion to
their availability for each spatial scale and design levels.
RESULTS
Capture
I captured 35 LEPCs and deployed PTTs on 25 individuals from 2015 to 2017.
Nineteen PTTs were deployed on males, and 6 were deployed on females. Eleven of the
PTT-marked males were adults, and 8 were sub-adults. Five of the PTT-marked females
were sub-adults, and one female was an adult.
Landscape Analysis
Conservation Reserve Program fields constituted 17% (71,720 ha) of the study
area, in 694 separate patches. Native grass CRP constituted 15.5% (64,350 ha) of the
landscape in 575 patches, making it the most abundant enrollment type in the study area.
Native grass and forb CRP constituted 1% (5,427 ha) of the total landscape in 84 patches,
and non-native grass CRP constituted 0.5% (1,943 ha) in 35 patches. Agricultural fields

Texas Tech University, Samuel W.H. Harryman, December 2017
25
constituted 44% (183,463 ha) of the study area in 10,740 patches, and native grassland
constituted 39% (159,947 ha) in 14,661 patches.
Average CRP field size was 65 ha (SE=13.0) for native grass and forb CRP, 112
ha (SE=16.5) for native grass CRP, and 56 ha (SE=26.5) for non-native grass CRP (Table
2.1). The average size of CRP fields with known active leks was 289 ha (SE=200, Range
= 123 –1,324 ha). Average patch size for agriculture and native grassland were 17 ha
(SE=15.3) and 11 ha (SE=2.9), respectively. Area-weighted mean patch size was 285 ha
for native grass and forb CRP, 1,504 ha for native grass CRP, and 499 ha for non-native
grass CRP. Area-weighted mean patch size was 147,923 ha for agriculture and 11,272 ha
for native grassland. Interspersion and Juxtaposition Index estimates were 71.5% for
native grass and forb CRP, 58.5% for native grass CRP, and 87.7% for non-native grass
CRP. The Contagion Index estimate was 57.5% for the entire study area.
Habitat Selection
Second Order.— All but 3 LEPCs remained within 4.8 km of their lek of capture
for the duration of the study. One female moved 55 km from her lek of capture into
central Yoakum County, Texas after brood loss (See Supplemental Information). A
second female captured in Cochran County moved 6 km to nest in Shinnery Oak Prairie
in eastern New Mexico. A third female moved 7 km from her lek of capture in Bailey
County after brood loss. These 3 individuals were censored from the habitat selection
analysis.
There was evidence of selection for non-native grass CRP and native grass and
forb CRP at the second order of selection during the breeding season. The mean selection
ratio for non-native CRP was 4.16 (95% CI=1.92 – 6.39), and the mean selection ratio for

Texas Tech University, Samuel W.H. Harryman, December 2017
26
native grass and forb CRP was 3.57 (95% CI=2.41 – 4.73). There was also selection for
these CRP types during the non-breeding season. The mean selection ratio for non-native
CRP was 5.58 (95% CI=3.51 – 7.66), and the mean ratio for native grass and forb CRP
was 2.86 (95% CI=1.88 – 3.83). Agriculture and native grassland were avoided during
the breeding and non-breeding seasons, and native grass CRP was used in proportion to
its availability (Table 2.2).
Third Order.—There was evidence of selection for native grass and forb CRP at
the third order of selection for both the breeding and non-breeding seasons. The mean
selection ratios were 1.33 (95% CI=1.18 – 1.49) during the breeding season and 1.35
(95% CI=1.11 – 1.59) during the non-breeding season. Native grass CRP was avoided
during both seasons, with mean selection ratios of 0.83 (95% CI=0.69 – 0.97) and 0.81
(SE=0.07, 95% CI=0.64 – 0.98) during the breeding and non-breeding seasons,
respectively. Non-native CRP, agriculture, and native grassland were used in proportion
to their availability during both seasons at the third order of selection (Table 2.3).
DISCUSSION
The major finding of this chapter was that CRP was selected habitat by LEPCs,
despite the fact that the study area was considerably more fragmented than other portions
of the species range. Contagion values from 4 LEPC study sites in Kansas and Colorado
ranged from 60% - 80% (Plumb 2015), which is 20% greater than the contagion estimate
for my study area. Based on imagery from 2013, the mean grassland patch size was 24 ha
(SE=3.8), and the area-weighted mean patch size was 49,100 ha throughout the LEPC’s
range in Kansas (Spencer et al. 2017). Fragmentation on my study site was primarily due
to extensive agriculture throughout the area. The high IJI values for the 3 CRP types

Texas Tech University, Samuel W.H. Harryman, December 2017
27
suggest CRP fields are currently widely interspersed throughout the study area and serve
as islands of habitat within a matrix of agriculture and shortgrass prairie. An interesting
note is LEPC leks and subsequent home ranges occurred within CRP while there was
native shinnery oak prairie as close as 6 km. Aside from the 2 movements I observed into
shinnery oak prairie, movements between this study area and the shinnery oak prairie
study area in Grisham (2012) were minimal, despite numerous leks occurring in both
habitat types. I speculate a large swath of energy development extended east to west
across the entirety of southern Cochran County may be inhibiting regular movements
between the 2 habitat types.
The traditional scientific consensus is LEPC populations need large patches of
grassland for long term persistence (Haufler et al. 2012, Van Pelt et al. 2013). Estimates
of minimum grassland patch size for LEPCs range from 4,900 ha for a single lek to
20,236 ha for a local population (Haukos and Zavaleta 2016). Both my average (Range =
56 – 112 ha) and area-weighted average (Range = 285 – 1,504 ha) estimates for CRP
patch size fall far short of that range. However, I captured and tracked LEPCs in CRP
patches ranging from 2,282 ha to 4,992 ha, due to the juxtaposition of individual CRP
fields. My results suggest the majority of CRP fields in the study area are too small to
individually support LEPCs, but an aggregation of CRP fields totaling 2,500 ha may
support multiple leks. In addition, Hagen et al. (2016) suggested LEPC occupancy would
increase when the percentage of CRP land within 7.5 x 7.5 km grids exceeded 20%.
However, my results suggest caution is warranted before considering non-native CRP as
LEPC habitat.

Texas Tech University, Samuel W.H. Harryman, December 2017
28
The selection for non-native CRP in the study area at the second order of selection
is contradictory to my hypothesis that LEPCs would not select non-native grass CRP.
Monocultures of non-native grasses constituted the main type of CRP planted during the
first 10 years of CRP (1985 – 1995) in Texas. There was no documentation of range
expansion or population increases for LEPCs in Texas after the seeding of these initial
CRP fields (Rodgers and Hoffman 2005). The one non-native CRP fields where my study
efforts took place was 532 ha and bordered by large expanses of cotton and sorghum
fields to the north and south. I hypothesize that LEPCs selected the field because it was
the only available, large tract of grassland within a landscape consisting mainly of
cultivated crops and smaller CRP fields. My results suggest non-native CRP was LEPC
habitat year-round, but interestingly, the probability of adult survival decreased as the
proportion of non-native CRP within the home range increased (Chapter IV). Combined,
these results indicate non-native CRP fields may constitute an ecological trap for LEPCs
due to their perceived value for day-to-day activities but ultimately lack the necessary
vegetative structure and cover (see Hagen et al. 2013) to protect from predators and the
elements.
Lesser prairie-chickens in my study area selected native grass and forb CRP fields
at 2 scales of selection during the course of a year, which is consistent with my
hypothesis. I observed selection by both sexes, and the probable driver for the selection
of this CRP type was structural heterogeneity and abundant food resources, both resulting
from diverse seeding mixes (Hagen et al. 2004, Hagen et al. 2013). Lesser prairie-chicken
diets vary over the course of a year, ranging from mainly plant material in spring to
invertebrates and plant material in summer to seeds and shinnery oak acorns in the fall

Texas Tech University, Samuel W.H. Harryman, December 2017
29
and winter (Jones 1964, Davis et al. 1980b, Doerr and Guthery 1983). Based on field
observations, invertebrates were more abundant during the late spring and summer
months in the native grass and forb field compared to the native grass field. These
observations are consistent with the findings of Fields (2004), who concluded that
interseeding forbs in CRP fields in Kansas increased invertebrate biomass and diversity.
Native grass and forb CRP fields were selected by LEPCs year-round, and breeding
season survival increased as the proportion of native grass and forb CRP within the home
range increased (Chapter IV). However, this CRP enrollment type currently comprises
only a minute portion of the landscape (1%), and LEPCs may benefit from increasing the
amount of native grass and forb CRP on the landscape in this region.
While native grass and forb CRP fields were selected over native grass fields
throughout the course of a year, native grass CRP fields still have benefits for LEPCs. I
found 5 leks on the tract of property that had both native grass and forb and native grass
CRP fields present. Three of the 5 leks were located in the native grass field, and one of
the leks within the native grass and forb field was only active for one year. In addition, 3
of 4 nests monitored on the property were located within the native grass field. Lesser
prairie-chicken nest sites generally have more grass cover and less bare ground compared
to random points (Hagen et al. 2013, Haukos and Zavaleta 2016). For example, average
grass cover at 36 nests in Texas was 21.7%, compared to 3.5% at random points, and
average percent bare ground was 7.3% at nests and 27.8% at random points (Grisham et
al. 2014). The native grass and forb CRP field had been planted 2 years prior to the study
with a seed drill and had significant bare ground between rows of vegetation. The native
grass field, on the other hand, had patches of dense grasses that provided adequate cover

Texas Tech University, Samuel W.H. Harryman, December 2017
30
for nesting (Hagen et al. 2013). Fields (2004) recommended seeding CRP fields in
alternating strips of native grasses and native forbs, thereby providing habitat for nesting
and brood rearing. Planting CRP fields in this manner, and implementing mid-contract
management practices within the native forb strips, may provide a mosaic of habitat at
finer spatial scales (i.e. within the core area) that combines the current benefits of native
grass and native grass and forb CRP fields in Texas.
Lesser prairie-chickens in my study area used agricultural fields and
shrub/shortgrass vegetation communities in proportion to their availability at the third
order of selection. I acknowledge that LEPCs used these cover types for the duration of
the study, but my results do not suggest adding more of them to the landscape would
benefit LEPCs. Lesser prairie-chickens used agriculture and shortgrass prairie in
proportion to its availability only on an individual basis (Type III design). My PTT data
suggest that most relocations within crop fields were foraging events, and there were
generally only 1 – 2 locations per day within cropland, with the rest located within CRP
fields. At the second order of selection (i.e. Type II design, population level) LEPCs
avoided agriculture and shrub/shortgrass prairie and placed their home ranges within
CRP. I also documented no leks within shrub/shortgrass prairie. In addition, neither the
proportion of cropland nor native grassland within the home range positively influenced
LEPC survival during the study (Chapter IV).
Lesser prairie-chickens typically spend the majority of their lives within 4.8 km of
a single lek or lek complex (Applegate and Riley 1998, Borsdorf 2013, see Appendix).
However, long distance movements outside this 4.8 km threshold are a recently
discovered component of the species’ ecology, due to the use of PTTs. Dispersal

Texas Tech University, Samuel W.H. Harryman, December 2017
31
movements up to 71 km in length have been recorded by LEPCs in Kansas (Earl et al.
2016). Habitat loss and fragmentation are a major concern for the species, due to
subsequent population declines and reduced gene flow. However, long range movements
suggest the potential for greater connectivity between populations than previously
thought (Earl et al. 2016). The long distance movements I recorded suggest connectivity
exists for LEPCs in my study area and individuals in shinnery oak prairie in southern
Cochran County and Yoakum County and eastern New Mexico. Due to movement of
LEPCs out of CRP into shinnery oak prairie, and the genetic evidence presented in
Corman (2011), the 2 groups constitute one population of LEPCs across the Southern
High Plains of Texas and eastern New Mexico. Therefore, CRP fields may provide
habitat for LEPCs throughout the shinnery oak prairie ecoregion and not just on the study
area in Bailey and Cochran Counties.
I realize the limitation of a small sample size in this study. However, LEPC
abundance within the shinnery oak prairie ecoregion is lower compared to the mixed-
grass prairie and shortgrass prairie/CRP ecoregions in the northeastern portion of the
species’ range. The estimated 2016 population was 3,255 individuals in shinnery oak
prairie, compared to 6,891 individuals in mixed-grass prairie and 14,025 individuals in
shortgrass prairie/CRP (McDonald et al. 2016). Also, I hypothesize that LEPCs in my
study area constitute a small portion of the shinnery oak prairie population due to the
limited space available within CRP fields. The costs associated with satellite PTTs also
limits the number of units that can be deployed on individual LEPCs. Despite a small
sample size, my results show CRP fields seeded in native vegetation provide habitat for
LEPCs year-round and that CRP fields smaller than the recommended patch size

Texas Tech University, Samuel W.H. Harryman, December 2017
32
requirement of 4,900 ha (Applegate and Riley 1998) are still beneficial for LEPCs. My
results also suggest that LEPCs incur greater risk of mortality when occupying CRP
fields seeded in non-native vegetation.
MANAGEMENT IMPLICATIONS
Grasslands enrolled in CRP are a tool that can be used to increase the amount of
LEPC habitat throughout the shinnery oak prairie ecoregion in Texas. However, the vast
majority of CRP fields are too small to individually support LEPC leks and are scattered
throughout a cropland-dominated landscape. Strategically placing new CRP tracts
adjacent to fields already occupied by LEPCs and targeting large agricultural fields for
enrollment will increase grassland patch size. Based on my results, an aggregation of
CRP fields 2,500 ha in size will support a lek complex. Benefits from new CRP tracts
may be maximized if fields are seeded in alternating strips of native grasses and native
forbs. New CRP tracts may also reduce landscape fragmentation and serve to connect
LEPCs in my study area to individuals within surrounding shinnery oak prairie. Finally,
either re-enrolling or keeping CRP fields in grasses after contract expiration will help to
ensure long term conservation benefits for LEPCs.
LITERATURE CITED
Applegate, R.D. and T.Z. Riley. 1998. Lesser prairie-chicken management. Rangelands
20:13-15.
Bates, D., M. Maechler, B. Bolker, and S. Walker. 2015. Fitting linear mixed-effects
models using lme4. Journal of Statistical Software 67:1-48.
Bedrosian, B. and D. Craighead. 2007. Evaluation of techniques for attaching transmitters
to common raven nestlings. Northwestern Naturalist 88:1-6.
Beyer, H.L. 2012. Geospatial Modelling Environment (Version 0.7.2.0). (software).
URL: http://www.spatialecology.com.
Texas Tech University, Samuel W.H. Harryman, December 2017
33
Borsdorf, P.K. 2013. Lesser prairie-chicken habitat selection across varying land use
practices in eastern New Mexico and west Texas. Thesis, Texas Tech University,
Lubbock, Texas, USA.
Calenge, C. 2006. The package adehabitat for the R software: a tool for the analysis of
space and habitat use by animals. Ecological Modelling 197:516-519.
Copelin, F.F. 1963. The lesser prairie-chicken in Oklahoma. Oklahoma Department of
Wildlife Technical Bulletin 6. Oklahoma City, Oklahoma, USA.
Corman, K.S. 2011. Conservation and landscape genetics of Texas lesser prairie-chicken:
population structure and differentiation, genetic variability, and effective size.
M.S. thesis, Texas A&M University, Kingsville, Kingsville, Texas, USA.
Davis, C.A., T.Z. Riley, J.F. Schwarz, H.R. Suminski, and M.J. Wisdom. 1980a.
Live trapping prairie-chickens on spring leks. Pages 64-67 in P.A. Vohs, Jr. and
F.L. Knopf (editors), Proceedings of Prairie Grouse Symposium. Oklahoma State
University, Stillwater, Oklahoma, USA, 89 pp.
Davis, C.A., T.Z. Riley, J.F. Schwarz, H.R. Suminski, and M.J. Wisdom. 1980b. Spring-
summer foods of lesser prairie-chickens in New Mexico. Pages 75-80 in P.A.
Vohs, Jr. and F.L. Knopf (editors), Proceedings of Prairie Grouse Symposium.
Oklahoma State University, Stillwater, Oklahoma, USA, 89 pp.
Davis, D.M. 2005. Status of the lesser prairie-chicken in New Mexico: recommendation
to not list the species as threatened under the New Mexico Wildlife Conservation
Act. Final Investigation Report, New Mexico Department of Game and Fish,
Santa Fe, NM.
Doerr, T.B. and F.S. Guthery. 1983. Effect of tebuthiuron on lesser prairie-chicken
habitat and foods. Journal of Wildlife Management 47:1138-1142.
Earl, J.E., S.D. Fuhlendorf, D. Haukos, A.M. Tanner, D. Elmore, and S.A. Carleton.
2016. Characteristics of lesser prairie-chicken (Tympanuchus pallidicinctus) long-
distance movements across their distribution. Ecosphere 7(8):e01441. 10.1002/
ecs2.1441.
Erickson, W.P., T.L. McDonald, K.G. Gerow, S. Howlin, and J.W. Kern. 2001. Statistical
issues in resource selection studies with radio-marked animals. Pages 209-242 in
J.J. Millspaugh and J.M. Marzluff, editors. Radio tracking and animal
Populations. Academic Press, San Diego, California, USA.
Fields, T.L. 2004. Breeding season habitat use of Conservation Reserve Program (CRP)
land by lesser prairie-chickens in west central Kansas. Thesis, Colorado State
University, Fort Collins, Colorado, USA.

Texas Tech University, Samuel W.H. Harryman, December 2017
34
Girdner, C.L. Jr. 1963. Soil survey of Bailey County, Texas. Washington DC: U.S.
Department of Agriculture, Soil Conservation Service. 71 pages.
Grisham, B.A. 2012. The ecology of lesser prairie-chickens in shinnery oak-grassland
communities in New Mexico and Texas with implications toward habitat
management and future climate change. Dissertation, Texas Tech University,
Lubbock, TX, USA.
Grisham, B.A., P.K. Borsdorf, K.K. Boydston, and C.W. Boal. 2014. Nesting ecology
and nest survival of lesser prairie-chickens on the Southern High Plains of Texas.
Journal of Wildlife Management 78:857-866.
Grisham, B.A., J.C. Zavaleta, A.C. Behny, P.K. Borsdorf, D.R. Lucia, C.W. Boal, and
D.A. Haukos. 2016. Ecology and conservation of lesser prairie-chickens in sand
shinnery oak prairie. Pp. 315-344 in D.A. Haukos and C.W. Boal (editors),
Ecology and Conservation of Lesser Prairie-Chickens. Studies in Avian Biology
(no.48), CRC Press, Boca Raton, Fl.
Hagen, C.A., B.E. Jamison, K.M. Giesen, and T.Z. Riley. 2004. Guidelines for managing
lesser prairie-chicken populations and their habitats. Wildlife Society Bulletin
32:69-82.
Hagen, C.A. and K.M. Giesen. 2005. Lesser prairie-chicken (Tympanuchus
pallidicinctus).Account 364 in A. Poole, editor. The birds of North America.
Cornell Lab of Ornithology, Ithaca, New York, USA.
Hagen, C.A., B.A. Grisham, C.W. Boal, and D.A. Haukos. 2013. A meta-analysis of
lesser prairie-chicken nesting and brood-rearing habitats: implications for habitat
management. Wildlife Society Bulletin. 37:750-758.
Hagen, C.A., D.C. Pavlacky, K. Adachi, F.E. Hornsby, T.L. Rintz, and L.L. McDonald.
2016. Multiscale occupancy modeling provides insights into range-wide
conservation needs of lesser prairie-chicken (Tympanuchus pallidicinctus).
Condor 118:597-612.
Hall, L.S., P.R. Krausman, and M.L. Morrison. 1997. The habitat concept and a plea for
standard terminology. Wildlife Society Bulletin 25:173-182.
Haufler, J., D. Davis, and J. Caulfield. 2012. Oklahoma lesser prairie-chicken
conservation plan: a strategy for species conservation. Ecosystem Management
Research Institute, Seeley Lake, MT.
http://www.emri.org/PDF%20Docs/Adobe%20files/Final_OK_LEPC_Mgmt_Pla
n_23Oct2012.pdf> (10 August 2014).
Haukos, D.A. and J.C. Zavaleta. 2016. Habitat. Pp. 99-132 in D.A. Haukos and C.W.

Texas Tech University, Samuel W.H. Harryman, December 2017
35
Boal (editors), Ecology and Conservation of Lesser Prairie-Chickens. Studies in
Avian Biology (no.48), CRC Press, Boca Raton, Fl.
Horne, J.S., E.O. Garton, S.M. Krone, and J.S. Lewis. 2007. Analyzing animal
movements using Brownian bridges. Ecology 88:2354-2363.
Jamison, B.E. 2000. Lesser prairie-chicken chick survival, adult survival, and habitat
selection and movements of males in fragmented rangelands of southwestern
Kansas. Thesis, Kansas State University, Manhattan, Kansas, USA.
Johnson, D.H. 1980. The comparison of usage and availability measurements for
evaluating resource preference. Ecology 61: 65-71.
Jones, R.E. 1964. Habitat used by lesser prairie-chickens for feeding related to seasonal
behavior of plants in Beaver County, Oklahoma. Southwestern Naturalist 9:111-
117.
Kukal, C.A. 2010. The over-winter ecology of lesser prairie-chickens (Tympahuchus
pallidicinctus) in the northeast Texas panhandle. M.S. thesis, Texas Tech
University, Lubbock, Texas, USA.
Leonard, J.P. 2008. The effects of shinnery oak removal on lesser prairie-chicken
survival, movement, and reproduction. M.S. thesis, Texas A&M Univeristy,
College Station, Texas, USA.
Manly, B.F.J., L.L. McDonald, D.L. Thomas, T.L. McDonald, and W.P. Erikson. 2002.
Resource Selection by Animals. Second edition. Kluwer Academic Publishers,
Dordrecht, The Netherlands.
McDonald, L., K. Adachi, T. Rintz, G. Gardner, and F. Hornsby. 2014. Range-wide
population size of the lesser prairie-chicken: 2012, 2013 and 2014. Report
prepared for the Western Association of Fish and Wildlife Agencies, 27 pages.
McDonald, L., K. Nasman, T. Rintz, F. Hornsby, and G. Gardner. 2016. Range-wide
population size of the lesser prairie-chicken: 2012, 2013, 2014, 2015, and 2016.
Report prepared for the Western Association of Fish and Wildlife Agencies. 42
pages.
McGarigal, K., S. A Cushman, and E. Ene. 2012. FRAGSTATS v4: Spatial Pattern
Analysis Program for Categorical and Continuous Maps. Computer software
program produced by the authors at the University of Massachusetts, Amherst.
http://www.umass.edu/landeco/research/fragstats/fragstats.html
Merchant, S.S. 1982. Habitat use, reproductive success, and survival of female lesser
prairie chickens in two years of contrasting weather. Thesis, New Mexico State
University, Las Cruces, New Mexico, USA.

Texas Tech University, Samuel W.H. Harryman, December 2017
36
Moser, B.K. and G.R. Stevens. 1992. Homogeneity of variance in the two-sample means
test. The American Statistician 46:19-21.
Oyler-McCance, S.J., R.W. DeYoung, J.A. Fike, C.A. Hagen, J.A. Johnson, L.C.
Larsson, and M.A. Patten. 2016. Rangewide genetic analysis of lesser prairie-
chicken reveals population structure, range expansion, and possible introgression.
Conservation Genetics 17:643-660.
Peterson, R.S. and C.S. Boyd. 1998. Ecology and management of sand shinnery
communities: a literature review. United States Forest Service, Rocky Mountain
Research Station, General Technical Report RMRS-GTR-16:71-87, Fort Collins,
Colorado, USA.
Pirius, N.E., C.W. Boal, D.A. Haukos, and M.C. Wallace. 2013. Winter habitat use and
survival of lesser prairie-chickens in west Texas. Wildlife Society Bulletin
37:759-765.
Pitman, J.C., B.E. Jamison, C.A. Hagen, R.J. Robel, and R.D. Applegate. 2006. Brood
Break-up and juvenile dispersal of lesser prairie-chicken in Kansas. Prairie
Naturalist 38:85-99.
Plumb, R.T. 2015. Lesser prairie-chicken movement, space use, survival, and response to
anthropogenic structures in Kansas and Colorado. M.S. thesis, Kansas State
University, Manhattan, KS, USA.
Riley, T.Z., C.A. Davis, M.A. Candelaria, and H.R. Suminski. 1994. Lesser prairie-
chicken movements and home ranges in New Mexico. Prairie Naturalist 26:183-
186.
Robinson, S.G. 2015. Landscape ecology, survival and space use of lesser prairie-
chickens. M.S. thesis, Kansas State University, Manhattan, KS, USA.
Rodgers, R.D. and R.W. Hoffman. 2005. Prairie grouse population response to
conservation reserve grasslands: an overview. Pgs. 120-128 in A.W. Allen and
M.W. Vandever, eds.The Conservation Reserve Program-Planting for the Future:
Proceeding of a National Conference, Fort Collins, Colorado, June 6-9, 2004.
Rodgers, R.D. 2016. A history of lesser prairie-chickens. Pp. 15-38 in D.A. Haukos and
C.W. Boal (editors), Ecology and Conservation of Lesser Prairie-Chickens.
Studies in Avian Biology (no.48), CRC Press, Boca Raton, Fl.
Silvy, N.J., M.E. Morrow, E. Shanley, and R.D. Slack. 1990. An improved drop net
for capturing wildlife. Proceedings of the Annual Conference of the Southeastern
Association of Fish and Wildlife Agencies. 44:374-378.
Spencer, D., D. Haukos, C. Hagen, M. Daniels, and D. Goodin. 2017. Conservation

Texas Tech University, Samuel W.H. Harryman, December 2017
37
Reserve Program migigates grassland loss in the lesser prairie-chicken range
of Kansas. Global Ecology and Conservation 9:21-38.
Sullins, D.S. 2017. Regional variation in demography, distribution, foraging, and
strategic conservation of lesser prairie-chickens in Kansas and Colorado.
Dissertation, Kansas State University, Manhattan, KS, USA.
Sullivan, R.M., J.P. Hughes, and J.E. Lionberger. 2000. Review of the historical and
present status of the lesser prairie-chicken (Tympanuchus pallidicinctus) in Texas.
Prairie Naturalist 32: 176-187.
Taylor, M.A. and F.S. Guthery. 1980. Status, ecology, and management of the lesser
prairie chicken. USDA Forest Service General Technical Report RM-77, Rocky
Mountain Forest and Range Experimental Station, Fort Collins, Colorado, USA.
Timmer, J.M., M.J. Butler, W.B. Ballard, C.W. Boal, and H.A. Whitlaw. 2013.
Abundance and density of lesser prairie-chickens and leks in Texas.
Wildlife Society Bulletin 37:741-749.
Toepfer, J.E., J.A. Newell, and J. Monarch. 1988. A method for trapping prairie grouse
hens on display grounds. Pp. 21-23 in A.J. Bjugstad, Tech. Coord. Prairie
chickens on the Sheyenne National Grasslands. U.S. Department of Agriculture
Gen. Tech. Rep. RM-159.
United States Fish and Wildlife Service. 2014. Endangered and Threatened Wildlife and
Plants; Determination of Threatened Status for the lesser prairie-chicken; Final
Rule. Federal Registrar 79: 10 April 2014 <http://www.gpo.gov/fdsys/pkg/FR-
2014-04-10/pdf/2014-07302.pdf>. Accessed 6 November 2014.
Van Pelt, W.E., S. Kyle, J. Pitman, D. Klute, G. Beauprez, D. Schoeling, A. Janus,
and J. Haufler. 2013. The lesser prairie-chicken range-wide conservation
plan.Western Association of Fish and Wildlife Agencies. Cheyenne, Wyoming,
pp. 367.
Walter, W.D., J.W. Fischer, S. Baruch-Mordo, and K.C. VerCauteren. 2011. What is the
proper method to delineate home range of an animal using today’s advanced GPS
telemetry systems: the initial step. USDA National Research Center-Staff
Publications. Paper 1375.
Woodward, A.J.W, S.D. Fuhlendorf, D.M. Leslie, JR., and J. Shackford. 2001. Influence
of landscape compostion and change on lesser prairie-chicken (Tympanuchus
pallidicinctus) populations. American Midland Naturalist 145:261-274.

Texas Tech University, Samuel W.H. Harryman, December 2017
38
Table 2.1. Landscape composition and configuration results for Bailey and Cochran
Counties, Texas, 2015-2017. Results were obtained using the program FRAGSTATS.
Cover Classa PLANDb NP MN SE AM IJI CONTAG
(%) (ha) (ha) (%) (%)
GFCRP 1.3 84 64.6 13.0 284.9 71.5
GCRP 15.5 575 111.9 16.5 1,503.8 58.5
NNCRP 0.5 35 55.5 26.5 499.0 87.6 57.5
Agriculture 44.2 10,740 17.1 15.3 147,923.00 29.1
Native
Grassland
38.5 14,661 10.9 2.9 11,272.49 20.7
a. GFCRP = native grass and forb CRP, GCRP = native grass CRP, NNCRP = non-
native grass CRP
b. PLAND = percentage of landscape, NP = number of patches, MN = mean patch
size, AM = area-weighted mean patch size, IJI = interspersion and jutaposition
index, CONTAG = contagion index

Texas Tech University, Samuel W.H. Harryman, December 2017
39
Table 2.2. Summary of design II, second order habitat selection for lesser prairie-
chickens (Tympanuchus pallidicinctus) during the breeding and non-breeding seasons in
Bailey and Cochran Counties, Texas, 2015-2017.
95% CI
Season Habitat wi a Lower Upper Bi b
Breeding
Agriculture 0.17 0.07 0.27 0.02
Native Grassland 0.28 0.05 0.49 0.03
Non-native CRP 4.16 1.92 6.39 0.44
Native Grass CRP 1.24 0.80 1.68 0.13
Grass and Forb CRP 3.57 2.41 4.73 0.38
Non-
Breeding
Agriculture 0.25 0.03 0.47 0.02
Native Grassland 0.34 0.00 0.69 0.03
Non-native CRP 5.58 3.51 7.66 0.55
Native Grass CRP 1.10 0.77 1.43 0.11
Grass and Forb CRP 2.86 1.87 3.83 0.28
a. Average selection ratio
b. Weighted selection ratio

Texas Tech University, Samuel W.H. Harryman, December 2017
40
Table 2.3. Summary of design III, third order habitat selection for lesser prairie-chickens
(Tympanuchus pallidicinctus) during the breeding and non-breeding seasons in Bailey
and Cochran Counties, Texas, 2015-2017.
95% CI
Season Habitat wi a Lower Upper Bi b
Breeding
Agriculture 0.89 0.50 1.29 0.18
Native Grassland 0.86 0.20 1.52 0.17
Non-native CRP 1.03 0.93 1.14 0.21
Native Grass CRP 0.83 0.69 0.97 0.17
Grass and Forb CRP 1.33 1.18 1.49 0.27
Non-
Breeding
Agriculture 0.85 0.31 1.38 0.17
Native Grassland 0.87 0.58 1.17 0.17
Non-native CRP 1.12 0.69 1.55 0.22
Native Grass CRP 0.81 0.64 0.97 0.16
Grass and Forb CRP 1.35 1.11 1.59 0.27
a. Average selection ratio
b. Weighted selection ratio
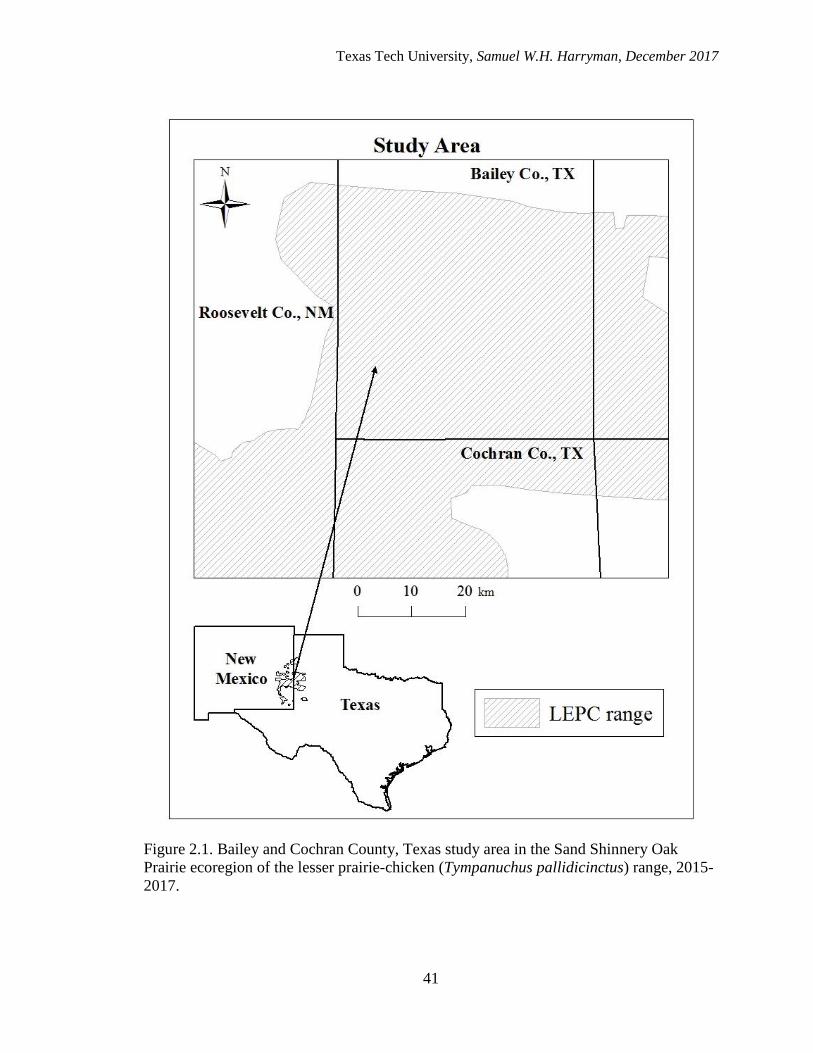
Texas Tech University, Samuel W.H. Harryman, December 2017
41
Figure 2.1. Bailey and Cochran County, Texas study area in the Sand Shinnery Oak
Prairie ecoregion of the lesser prairie-chicken (Tympanuchus pallidicinctus) range, 2015-
2017.

Texas Tech University, Samuel W.H. Harryman, December 2017
42
CHAPTER III
NESTING ECOLOGY OF LESSER PRAIRIE-CHICKENS IN CONSERVATION
RESERVE PROGRAM LANDS IN THE SOUTHERN HIGH PLAINS OF TEXAS
ABSTRACT Due to significant range and population declines and the uncertainty of its
status on the U.S. Endangered Species Act, the lesser prairie-chicken (Tympanuchus
pallidicinctus) has received much attention in recent years. Considerable effort has been
put into studying the life history of the species and the effects of management practices
on its ecology, in an effort to guide conservation efforts and reduce population declines.
One practice that has benefitted lesser prairie-chickens within their range in Kansas is the
Conservation Reserve Program. In this federal program, producers are paid to take
marginal croplands out of production and seed them in grasses and other permanent
vegetation. Lesser prairie-chicken leks have been documented within Conservation
Reserve Program fields in the Southern High Plains of Texas, but information is lacking
regarding nest ecology and survival within these fields. I assessed lesser prairie-chicken
nest survival within Conservation Reserve Program fields in Texas using the nest survival
model in Program MARK. I also examined vegetation composition and structure at nest
sites. I captured 6 females and outfitted each with a GPS Platform Transmitting Terminal.
I located and monitored 8 nests and determined the fate of each nest. Four of the 8 nests
hatched, and 4 were depredated. Average visual obstruction at nests was 3.62 dm (SE =
0.22) and was significantly greater than visual obstruction at random points. Grass cover
at nests was 62% (SE = 9.5) on average, and no shrubs were documented at nest sites.
The probability of a nest surviving the 28 day incubation period was 0.49 (95% CI =
0.16-0.77). Based on my results, Conservation Reserve Program fields provide suitable
nesting habitat for lesser prairie-chickens in the High Plains of Texas.

Texas Tech University, Samuel W.H. Harryman, December 2017
43
KEY WORDS Conservation Reserve Program, lesser prairie-chicken, nest ecology,
Texas, Tympanuchus pallidicinctus
The lesser prairie-chicken (Tympanuchus pallidicinctus, hereafter LEPC)
occupies portions of Texas, New Mexico, Oklahoma, Kansas, and Colorado, in the
southern Great Plains of North America. The species’ occupied range has declined by an
estimated 90% since 1900, due to substantial habitat loss and degradation (Hagen et al.
2004). The factors contributing to habitat loss include conversion of native prairie to
agriculture, energy development, woody plant encroachment, and unmanaged grazing
(Woodward et al. 2001, Hagen and Giesen 2005). Lesser prairie-chickens are now found
in 2 geographically isolated populations in 4 habitat ecoregions. One population is
located within the sand shinnery oak (Quercus havardii) prairie ecoregion of eastern New
Mexico and western Texas. The other population is located in the sand sagebrush
(Artemesia filifolia) prairie ecoregion in southeastern Colorado, southwestern Kansas,
and the western Panhandle of Oklahoma, the mixed-grass prairie ecoregion in south
central Kansas, northwest Oklahoma, and northeast Texas, and the shortgrass
prairie/Conservation Reserve Program (CRP) ecoregion in northwestern Kansas (Van
Pelt et al. 2013).
Loss of habitat and recurrent drought have resulted in significant LEPC
population declines (Hagen and Giesen 2005). Prominent droughts across the southern
Great Plains occurred during the 1930s, ‘50s, and early ‘90s and all contributed to LEPC
declines (Sullivan et al. 2000). More recently, the drought of 2011 had significant effects
on LEPC populations, particularly in the shinnery oak prairie ecoregion (Grisham et al.
2016b). Less than 2,000 LEPCs were estimated to remain within both portions of the

Texas Tech University, Samuel W.H. Harryman, December 2017
44
species’ range in Texas (Timmer et al. 2013). Range-wide, the estimated LEPC
population was approximately 26,000 individuals in 2016, with the majority of
individuals occurring in the short-grass prairie/CRP ecoregion (McDonald et al. 2016).
Due to significant range and population declines, LEPCs were listed as threatened under
the U.S. Endangered Species Act (U.S. Fish and Wildlife Service 2014) in May of 2014,
but the listing ruling was vacated by judicial decision in September of 2015.
Nest survival greatly influences LEPC population persistence (Pitman et al.
2006a, Hagen et al. 2009). Therefore, a thorough knowledge of LEPC nesting ecology is
essential for establishing effective conservation practices. Lesser prairie-chickens exhibit
a “boom or bust” reproductive cycle. During years with poor rainfall and decreased
habitat quality, nests are not as successful and recruitment is low. However, recruitment
is much greater during years with improved habitat quality, which offsets the lack of
production in “bust” years (Haukos and Zavaleta 2016). Nesting ecology differs across
the LEPC range, as well as across years. Within shinnery oak prairie in Texas, LEPC
females expend more energy towards individual survival compared to reproductive
output. Females have smaller clutches, rarely attempt a renest, and have higher annual
survival in the southwest portion of the LEPC range (Grisham et al. 2014).
Lesser prairie-chicken nests are usually located within 1.6 km of a lek, in areas
that provide concealment and thermoregulation (Haukos and Zavaleta 2016). Nests are
usually found in tall, residual grasses that provide visual obstruction (Riley et al. 1992,
Davis 2009, Grisham et al. 2014). Shrubs such as sand shinnery oak (Quercus havardii)
and sand sagebrush (Artemesia filifolia) are also used for nesting, often in response to
heavy grazing pressure (Haukos and Smith 1989). Nest sites in general have greater

Texas Tech University, Samuel W.H. Harryman, December 2017
45
visual obstruction, horizontal cover, and litter cover and less bare ground than available
at random (Haukos and Zavaleta 2016).
Lesser prairie-chickens are known to occupy CRP fields in the shinnery oak
prairie ecoregion of the LEPC range and are part of a genetic metapopulation of LEPCs
across the Southern High Plains of Texas and eastern New Mexico (Corman 2011,
Chapter II). Many studies have examined LEPC nest survival in native shinnery oak
prairie (Haukos 1988, Riley et al. 1992, Davis 2009, Grisham et al. 2014). However, no
studies have examined nest ecology and survival within CRP fields in the High Plains of
Texas. The objectives of my study were to 1) assess basic nesting ecology for LEPCs in
CRP fields, 2) assess vegetative and microclimate characteristics at LEPC nest sites and
compare to random points, 3) assess nest placement in relation to leks, and 4) estimate
apparent nest success and nest survival within CRP lands. I had 4 specific hypotheses.
First, nesting parameters and nest survival within CRP fields would be similar to that in
Shinnery Oak Prairie (S = 0.43, SE = 0.006, 95% CI = 0.23-0.56; Grisham et al. 2014).
Second, grass cover would be greater at nests compared to random points and to grass
cover at nests within native prairie (Fields 2004, Grisham et al. 2014). Third, temperature
and relative humidity would be greater at nest sites compared to the surrounding area
(Grisham 2012). Fourth, the majority of nests would be within 1 km of a known lek
(Davis 2009, Grisham 2012).
STUDY AREA
This study took place on private lands in Bailey and Cochran Counties in the
Southern High Plains of Texas (Figure 3.1). The landscape within the study area was
highly fragmented due to extensive conversion of native prairie to intensive agriculture.

Texas Tech University, Samuel W.H. Harryman, December 2017
46
Cotton (Gossypium spp.) and grain sorghum (Sorghum bicolor) were the primary crops
produced, and both center pivot irrigation and dryland farming techniques were common.
Beef cattle production was also present in the area but to a lesser extent than crop
production. Native prairie within the study area was characterized by shrub/shortgrass
vegetation communities that were bisected by shinnery oak prairie. Mesquite (Prosopis
glandulosa), buffalo grass (Bouteloua dactyloides), blue grama (Bouteloua gracilis),
sideoats grama (Bouteloua curtipendula), sand dropseed (Sporobolus cryptandrus),
narrow-leaf yucca (Yucca glauca), western ragweed (Ambrosia psilostchya), and broom
snakeweed (Gutierrezia sarothrae) were common plant species within shortgrass prairie.
Peterson and Boyd (1998) detail the vegetation found within shinnery oak prairie.
Study efforts were focused in CRP fields, which were interspersed across the
landscape. The CRP fields were comprised of 4 common contract types: 1) fields planted
in introduced grasses, particularly weeping lovegrass (Eragrostis curvala) and old world
bluestems (CP1), 2) fields planted in native grass species such as yellow indiangrass
(Sorghastrum nutans), little bluestem (Schizachyrium scoparium), switchgrass (Panicum
virgatum), sideoats grama, and blue grama (CP2), 3) fields that were first seeded in non-
native grasses and then later seeded in natives (CP10), and 4) fields enrolled in the USDA
State Acres for Wildlife Enhancement Program (SAFE). In addition to native grasses,
forbs such as alfalfa (Medicago spp.), Maximillian sunflower (Helianthus maximiliani),
Illinois bundleflower (Desmanthus illinoensis), and other natives were seeded in strips
across fields enrolled in SAFE (Miguel Samaniego, USDA Farm Service Agency,
personal communication).

Texas Tech University, Samuel W.H. Harryman, December 2017
47
The Amarillo and Arvana soil series were the most extensive in the area (Girdner
1963). The soils within the Amarillo series are deep, medium- to coarse-textured, and
have a reddish-brown subsoil. The Arvana series consists of shallow to moderately deep
soils that are reddish-brown in color and moderately coarse textured. Arvana soils differ
from Amarillo soils in having rock-like caliche within 91.44 cm of the soil surface
(Girdner 1963). The Southern High Plains are characterized by a very warm and dry
climate. See Grisham et al. (2016b) for a detailed description of weather patterns in the
shinnery oak prairie ecoregion of the LEPC range.
METHODS
Capture and Relocation
I captured LEPC females on 4 leks during the spring breeding seasons in 2015,
2016, and 2017. I used walk-in funnel traps (Toepfer et al. 1988), magnetic drop nets
(Wildlife Capture Services, Flagstaff, AZ, USA), and tension drop nets (Silvy et al. 1990)
for capture. I took standard morphological measurements on all individuals, including
weight (g), tarsus length (mm), wing cord length (mm), and pinnae length (mm). I used
plumage characteristics to assess age, where individuals with white spots within 2.54 cm
of the tips of the outer 2 primary feathers were recorded as juveniles, while individuals
lacking these spots were recorded as adults (Copelin 1963). Each bird was banded with a
Texas Parks and Wildlife aluminum leg band.
I equipped each captured female with a 22 gram Satellite Platform Transmitting
Terminal GPS transmitter (PTT, Microwave Telemetry, Columbia, MD, USA). I attached
the PTTs using the figure-8 rump method (Bedrosian and Craighead 2007). Satellite PTT
data consisted of 4 GPS locations per day, with fixes taking place at 0100, 0700, 1300,

Texas Tech University, Samuel W.H. Harryman, December 2017
48
and 1700 hrs Central Standard Time. I downloaded GPS data from the ARGOS website
weekly. In addition to taking GPS fixes, each PTT transmitter was equipped with a
Ground Track option. Each transmitter emitted a UHF signal from 1200 to 1700 hrs
every day from 15 March to 15 July. I used the Ground Track signal to monitor females
on nests and flush broods.
Nest Location and Ecology
Nest locations were determined from the GPS data. A female was considered to
be incubating if GPS locations repeated themselves over the course of 3 days. I flushed
each female off her nest once to determine clutch size (Grisham 2012) and then
monitored the nest daily using the Ground Track UHF signals. If a female was found to
be off her nest, I visited the nest site again to determine fate. Each nest was categorized
as either successful (≥ 1 egg hatched) or unsuccessful (depredated or abandoned). If a
nest was depredated, I identified the cause of depredation by examining the surrounding
area for eggshell fragments, scat, or tracks (Grisham 2012). I also measured the distance
from each nest to the female’s lek of capture and to the nearest lek.
I determined nest initiation date, incubation start date, and hatch date (if
applicable) for each nest. I determined incubation start date by examining the GPS data
and considered the female to be incubating when GPS locations began repeating over the
course of an entire day. Female lesser prairie-chickens generally lay one egg a day before
starting incubation. Therefore, nest initiation date was determined by taking the
incubation start date and back tracking one day for each egg in the nest. I also calculated
apparent nest success, percent females attempting a nest, and percent females attempting
a renest. I defined apparent nest success as the number of successful nests divided by the

Texas Tech University, Samuel W.H. Harryman, December 2017
49
total number of initiated nests (Davis 2009), and the percent females attempting a renest
as the number of females making a second nest attempt divided by the number of females
that had a failed first nest (Pitman et al. 2006a).
Nest Vegetation
I quantified nest vegetation structure within 3 days of nest failure or success for
all nest sites and for paired random locations following the methodology described in
Grisham (2012). I centered 2 perpendicular, 8 m transects in a north-south and east-west
orientation over the nest bowl and noted the dominant plant the nest bowl was located in.
I determined percent canopy cover of shrubs, grasses, forbs, bare ground, and litter at the
nest bowl (hereafter “nest site”) and at 4 m intervals north, south, east, and west of the
nest (hereafter “nest area”) using a 60 x 60 cm Daubenmire frame (Daubenmire 1959). I
recorded a visual obstruction reading (VOR) from a distance of 4 m and a height of 1 m
at the nest bowl (Robel et al. 1970). I also recorded litter depth from the center of the nest
bowl out to 4 m north, south, east, and west of the nest bowl at 0.5 m intervals. I
compared vegetation measurements between nest sites and random points and nest areas
and random areas using Student’s t-tests within Program R (R Version 3.1.2, www.r-
project.org, accessed 29 Jan 2017).
Nest Microclimate
I placed one Maxim Integrated Semiconductor data logger (Maxim Integrated
Products, Sunnyville, California, USA; hereafter “ibutton”) inside each nest after I
flushed the female to determine clutch size. I also placed an ibutton outside the nest in the
same substrate the nest was located in (e.g. bunchgrass, forb, shrub). Each ibutton
recorded air temperature and relative humidity at 10-min intervals. Temperature was

Texas Tech University, Samuel W.H. Harryman, December 2017
50
recorded in oC, and relative humidity was defined as the ratio of water vapor mass per
kilogram of dry air (Grisham 2012). I retrieved both ibuttons after the nesting attempt
was over and fate was determined.
I calculated minimum, maximum, and average values for temperature and relative
humidity both inside and outside each nest. I then compared temperature and relative
humidity inside and outside the nest using a t test within R. I also divided the ibutton data
into six different periods over the course of a day and compared temperature and
humidity inside and outside the nest (Grisham 2012). The periods were morning (0601 –
0900), mid-morning (0901 – 1200), mid-day (1201 – 1500), afternoon (1501 – 1800),
evening (1801 – 2100), and night (2101 – 0600).
Nest Survival
I estimated LEPC nest survival using the nest survival model within Program
MARK (White and Burnham 1999). The nest survival model uses the day the nest was
found, the last date the nest was checked alive, the last day the nest was checked, and the
fate of the nest to calculate daily survival rate (DSR; Dinsmore et al. 2002). I then
estimated the probability of a nest surviving the entire incubation period by using the
formula S = DSR28, where 28 corresponds to the incubation period length in days
(Grisham et al. 2014). Due to a very small sample size, I estimated nest survival using
only a model that assumed constant survival across the incubation period.
RESULTS
Nest Location and Ecology
I captured 6 females during the three seasons of trapping (one in 2015, 4 in 2016,
and one in 2017; Table 3.1). Due to a small sample size, I pooled all results across years.

Texas Tech University, Samuel W.H. Harryman, December 2017
51
A total of 8 nests were initiated. Percent females attempting a nest was 100%, and
percent females attempting a renest was 33%. Average clutch size was 8 eggs (SE = 1),
with a range of 5-10 eggs. Mean nest initiation date was Julian day 120 (30 April), and
mean incubation start date was Julian day 129 (9 May). Mean hatch date was Julian day
158 (7 June). The average distances from nests to the nearest lek and the female’s lek of
capture were 1,044 m (SE = 154.5) and 1,810 m (SE = 739.9).
Seven nests were located within CRP fields. Two of the 7 nests were located in
non-native grass CRP fields. Four nests were located in native grass CRP fields, and one
nest was located in a native grass and forb CRP field. The eighth nest was located within
native shinnery oak prairie. Four of the 8 nests hatched, and the other 4 were depredated.
Two of the unsuccessful nests failed due to mammalian depredation. The source of
depredation was not confirmed for the other 2 unsuccessful nests, although depredation
by a snake was suspected for one of those 2 nests. One of 2 nests in non-native CRP
hatched, and the brood was lost within 4 days of hatching. Two of 4 nests within native
grass CRP hatched, and the one nest within native grass and forb CRP hatched. Two of
the broods hatched in native CRP fields made it past the first 14 days post-hatch. The one
nest within shinnery oak prairie was unsuccessful.
Nest Vegetation
I was not able to measure vegetation at 2 nests, due to lack of landowner
permission. I measured vegetation at 6 nests, which included both first and second nest
attempts. Of the nests examined, 4 had nest bowls located in grass, one within a forb, and
one within a combination of forbs and grasses. No shrubs were recorded within
Daubenmire frames at nest sites. Average visual obstruction at nests was 3.43 dm (SE =

Texas Tech University, Samuel W.H. Harryman, December 2017
52
0.27) and was significantly greater compared to random points (t10 = 2.46, P = 0.02,
Figure 3.2). Grass constituted 62% of cover at nests, on average, but grass cover was not
significantly greater at nests compared to random points (t10 = 1.75, P = 0.05). There was
no significant difference between forb, litter, and bare ground cover between nests and
random points (Table 3.3).
I detected no significant differences between vegetation composition at nest areas
and random areas (Table 3.4). Grass cover was 35% greater at nest sites compared to nest
areas, on average. Grass cover was comparable between random sites (41%, SE = 7.09)
and random areas (49%, SE = 9.87). Two perennial broomweed (Gutierrezia sarothraez)
plants at a nest area were the only shrubs recorded within Daubenmire frames for the
duration of the study.
Nest Microclimate
I obtained 12,392 temperature and relative humidity recordings from nests and
12,393 recordings from ibuttons placed outside nests. Nest temperatures averaged
28.63oC, with an average range of 22.79 to 31.86oC. Outside temperatures averaged
22.01oC, with an average range of 18.04 to 26.05oC. Nest temperatures were significantly
greater than outside temperatures (t24,782 = 61.41, P < 0.001). Nest relative humidity
averaged 67.91%, with an average range of 58.36 to 73.89%. Outside relative humidity
averaged 63.27%, with an average range of 35.55 to 75.92%. Nest relative humidity was
significantly greater than outside relative humidity (t24,782 = 15.08, P < 0.001). Nests
temperatures were warmer than outside temperatures during the course of a day, except
during mid-day and afternoon hours (Table 3.5). Nest relative humidity was greater than
outside humidity except during morning and night hours (Table 3.6).

Texas Tech University, Samuel W.H. Harryman, December 2017
53
Nest Survival
Females incubated nests from Julian Day 116 (26 April) to Julian Day 171 (20
June), which resulted in 56 estimates of daily nest survival. Daily survival rate was 0.975
(SE = 0.01, 95% CI = 0.936-0.991). The probability of a nest surviving the incubation
period was 0.49 (95% CI = 0.16-0.77).
DISCUSSION
My findings indicate CRP fields play an important role in LEPC nesting ecology
in the shinnery oak prairie ecoregion of the LEPC range. Lesser prairie-chicken
movements between CRP fields and native shinnery oak prairie have been documented
(Chapter II), which indicates there is connectivity between individuals in my study area
and other LEPCs across the Southern High Plains of Texas and eastern New Mexico.
Because there is connectivity between LEPCs across the Southern High Plains, CRP
fields can likely provide suitable grassland for nesting across a broad landscape. In
addition, my estimate of nest survival is consistent with previous studies. Nest survival in
shinnery oak prairie from 2008 to 2011 was 0.43 (95% CI = 0.23 – 0.56; Grisham et al.
2014), and survival in the mixed-grass prairie and shortgrass prairie/CRP ecoregions
from 2013 to 2014 was 0.39 (95% CI = 0.34 – 0.43, Lautenbach 2015).
I did not assess differences in nest survival or brood survival between different
CRP enrollments due to sample size limitations. However, apparent nest success and
brood success differed between the different CRP types. A greater proportion of nests
hatched within native CRP fields compared to non-native CRP fields, and the only broods
that survived to 14 days were hatched in close proximity to native grass and forb CRP.
Non-native CRP fields do provide available grassland space in the High Plains of Texas,

Texas Tech University, Samuel W.H. Harryman, December 2017
54
and LEPCs will place their home ranges within large non-native tracts (Chapter II).
However, non-native CRP fields do not appear to provide as good of structure for nesting
and food resources for broods compared to CRP fields seeded in native vegetation.
Visual obstruction is an important predictor of LEPC nest site selection (Haukos
and Smith 1989, Riley et al. 1992, Lautenbach 2015). Visual obstruction readings were 1
dm greater at nests compared to random points on average, and average VOR at nests fell
within the recommendations given by Grisham et al. (2014) and Lautenbach (2015).
Also, grass constituted the majority of cover at nest sites. Grass cover was 21% greater at
nest sites compared to random points, but there was no significant difference between the
2 locations. The lack of significance is likely due to the CRP field seeding mixes. Grasses
are the main component of CRP seeding mixes, and fields are usually planted uniformly
with a seed drill, making grass cover highly available.
Vegetation at LEPC nests in my study area differed from vegetation at nest sites
found from 2008-2011 in shinnery oak prairie in Texas (Grisham et al. 2014). Every nest
I monitored was located within grasses or a mixture of grasses and forbs. Conversely, 25
of 36 nests (71%) located in shinnery oak prairie were located within sand sagebrush. No
shrubs were recorded at nest sites within CRP, and average grass cover at nests within
CRP (62%) was almost 3 times the grass cover at nests within shinnery oak prairie
(21.7%). Lesser prairie-chicken nest survival throughout much of the shinnery oak prairie
in Texas was limited by visual obstruction at nest sites, due to years of unmanaged
grazing resulting in greater shrub cover and less grasses (Grisham et al. 2014). However,
light herbicide applications applied to shinnery oak grasslands promote native grass
growth and remove visual obstruction as a limiting factor for nest survival (Fritts et al.

Texas Tech University, Samuel W.H. Harryman, December 2017
55
2016). This evidence, along with my vegetation data from LEPC nests, suggests CRP
fields seeded in native mid-grasses provide suitable visual obstruction for nesting during
years of average rainfall. The lack of shrubs within CRP fields could be problematic
during times of drought because shrubs may provide essential cover for nesting if grass
production is decreased due to drought.
The majority of LEPC females in my study area nested approximately 1 km from
a lek. Female movements were greatest during the pre-nesting period of the breeding
season, and movements up to 3 km from a lek were documented during this period (S.
Harryman, unpublished data). However, 7 of the 8 nests monitored were located either in
the CRP field the female was captured in or an adjacent field. The tendency of females to
nest in close proximity to leks in my study area is consistent with previous studies that
have assessed LEPC nesting ecology (Pitman et al. 2006a, Davis 2009, Grisham 2012).
Management efforts taken to improve nesting habitat can be maximized if they are
focused within CRP fields that contain active leks and fields directly adjacent.
Lesser prairie-chicken females nesting in the shinnery oak prairie ecoregion
experience warmer and drier conditions compared to individuals in the 3 ecoregions
within the northeast portion of the LEPC range. Temperature and relative humidity is 7oC
greater and 7% less, on average, on the High Plains of Texas compared to the northern
portion of the LEPC range in Kansas during the nesting season (Grisham et al. 2013).
Temperatures greater than 34oC have been identified as a threshold at which daily nest
survival decreases despite adequate visual obstruction at the nest site (Grisham et al.
2016a). Nest temperatures averaged 27.81oC in my study, and the highest average
temperature at a nest was 31.86 oC. This suggests that native mid-grass species seeded in

Texas Tech University, Samuel W.H. Harryman, December 2017
56
CRP fields provide adequate microclimate conditions for nesting during years of average
temperatures.
Lesser prairie-chicken females in eastern New Mexico were documented nesting
in reverted cropland and fields seeded in weeping lovegrass during a drought year, while
shinnery oak grasslands were used little (Merchant 1982). Reduced use of shinnery oak
grasslands for nesting was attributed to the combined effects of heavy grazing and
drought conditions. Similarly, native rangeland within the shortgrass prairie/CRP
ecoregion in Kansas was used little by LEPC females for nesting, save during years of
adequate rainfall when cover was increased in native prairie (Fields 2004). It was
concluded that CRP fields allowed LEPC populations to persist during drought years by
providing an ungrazed refuge for nesting (Fields 2004). I hypothesize that CRP fields in
the Southern High Plains of Texas can likewise contribute to LEPC population
persistence within the shinnery oak prairie ecoregion by providing nesting habitat during
times of drought. However, the USDA Farm Service Agency currently permits grazing
and haying of CRP fields during drought years (USDA Farm Service Agency,
Conservation Fact Sheet, August 2016). Future research is warranted to examine LEPC
nesting ecology within CRP fields during drought years.
MANAGEMENT IMPLICATIONS
Conservation Reserve Program fields seeded in native mid-grasses provide
quality nesting habitat for LEPCs in the Southern High Plains of Texas. Maintaining
visual obstruction between 2-4 dm within CRP fields will ensure adequate structure for
nesting (Grisham et al. 2014). Seeding strips of native grass species across large non-
native CRP tracts or re-seeding entire fields will provide better structure and food

Texas Tech University, Samuel W.H. Harryman, December 2017
57
resources for nesting females and broods. There is currently little oil and wind power
energy production across the study area, and limiting additional anthropogenic features
will benefit CRP fields as nesting habitat. Limiting emergency haying and grazing within
1 km of active leks will provide nesting cover for LEPCs during periods of drought.
LITERATURE CITED
Bedrosian, B. and D. Craighead. 2007. Evaluation of techniques for attaching transmitters
to common raven nestlings. Northwestern Naturalist 88:1-6.
Copelin, F.F. 1963. The lesser prairie-chicken in Oklahoma. Oklahoma Department of
Wildlife Technical Bulletin 6. Oklahoma City, Oklahoma, USA.
Corman, K.S. 2011. Conservation and landscape genetics of Texas lesser prairie-chicken:
population structure and differentiation, genetic variability, and effective size.
M.S. thesis, Texas A&M University, Kingsville, Kingsville, Texas, USA.
Daubenmire, R. 1959. A canopy-coverage method of vegetational analysis. Northwest
Science 33:43-64.
Davis, D.M. 2009. Nesting ecology and reproductive success of lesser prairie-chickens in
shinnery oak-dominated rangelands. Wilson Journal of Ornithology 121:322-327.
Dinsmore, S.J., G.C. White, and F.L. Knopf. 2002. Advanced techniques for modeling
avian nest survival. Ecology 83:3476-3488.
Elmore, R.D. and D.K. Dahlgren. 2016. Public and private land conservation dichotomy.
Pp. 187-203 in D.A. Haukos and C.W. Boal (editors), Ecology and Conservation
of Lesser Prairie-Chickens. Studies in Avian Biology (no.48), CRC Press, Boca
Raton, Fl.
Fritts, S.R., B.A. Grisham, D.A. Haukos, C.W. Boal, M.A. Patten, D.H. Wolfe, C.E.
Dixon, R.D. Cox, and W.R. Heck. 2016. Long-term lesser prairie-chicken nest
ecology in response to grassland management. Journal of Wildlife Management
80:527-539.
Girdner, C.L. Jr. 1963. Soil survey of Bailey County, Texas. Washington DC: U.S.
Department of Agriculture, Soil Conservation Service. 71 pages.
Grisham, B.A. 2012. The ecology of lesser prairie-chickens in shinnery oak-grassland
communities in New Mexico and Texas with implications toward habitat
management and future climate change. Dissertation, Texas Tech University,
Lubbock, TX, USA.

Texas Tech University, Samuel W.H. Harryman, December 2017
58
Grisham, B.A., C.W. Boal, D.A. Haukos, D.M. Davis, K.K. Boydston, C. Dixon, and W.
Heck. 2013. The predicted influence of climate change on lesser prairie-chicken
reproductive parameters. PLoS ONE 8(7): e68225.
doi:10.1371/journal.pone.0068225.
Grisham, B.A., P.K. Borsdorf, K.K. Boydston, and C.W. Boal. 2014. Nesting ecology
and nest survival of lesser prairie-chickens on the Southern High Plains of Texas.
Journal of Wildlife Management 78:857-866.
Grisham, B.A., A.J. Godar, C.W. Boal, and D.A. Haukos. 2016a. Interactive effects
between nest microclimate and nest vegetation structure confirm microclimate
thresholds for lesser prairie-chicken nest survival. Condor 118:728-746.
Grisham, B.A., J.C. Zavaleta, A.C. Behny, P.K. Borsdorf, D.R. Lucia, C.W. Boal, and
D.A. Haukos. 2016b. Ecology and conservation of lesser prairie-chickens in sand
shinnery oak prairie. Pp. 315-344 in D.A. Haukos and C.W. Boal (editors),
Ecology and Conservation of Lesser Prairie-Chickens. Studies in Avian Biology
(no.48), CRC Press, Boca Raton, Fl.
Hagen, C.A., B.E. Jamison, K.M. Giesen, and T.Z. Riley. 2004. Guidelines for managing
lesser prairie-chicken populations and their habitats. Wildlife Society Bulletin
32:69-82.
Hagen, C.A. and K.M. Giesen. 2005. Lesser prairie-chicken (Tympanuchus
pallidicinctus). Account 364 in A. Poole, editor. The birds of North America.
Cornell Lab of Ornithology, Ithaca, New York, USA.
Hagen, C.A, B.K. Sandercock, J.C. Pitman, R.J. Robel, and R.D. Applegate. 2009.
Spatial variation in lesser prairie-chicken demography: a sensitivity analysis of
population dynamics and management activities. Journal of Wildlife Management
73:1325-1332.
Haukos, D.A. 1988. Reproductive ecology of lesser prairie-chickens in West Texas.
M.S. thesis, Texas Tech University, Lubbock, TX, USA.
Haukos, D.A. and L.M. Smith. 1989. Lesser prairie-chicken nest site selection and
vegetation characteristics in tebuthiuron-treated and untreated sand shinnery oak
in Texas. Great Basin Naturalist 49:624-626.
Haukos, D.A. and J.C. Zavaleta. 2016. Habitat. Pp. 99-132 in D.A. Haukos and C.W.
Boal (editors), Ecology and Conservation of Lesser Prairie-Chickens. Studies in
Avian Biology (no.48), CRC Press, Boca Raton, Fl.
Lautenbach, J.M. 2015. Lesser prairie-chicken reproductive success, habitat selection,
and response to trees. Thesis, Kansas State University, Manhattan, Kansas, USA.

Texas Tech University, Samuel W.H. Harryman, December 2017
59
McDonald, L., K. Nasman, T. Rintz, F. Hornsby, and G. Gardner. 2016. Range-wide
population size of the lesser prairie-chicken: 2012, 2013, 2014, 2015, and 2016.
Report prepared for the Western Association of Fish and Wildlife Agencies. 42
pages.
Peterson, R.S. and C.S. Boyd. 1998. Ecology and management of sand shinnery
communities: a literature review. United States Forest Service, Rocky Mountain
Research Station, General Technical Report RMRS-GTR-16:71-87, Fort Collins,
Colorado, USA.
Pitman, J.C., C.A. Hagen, B.E. Jamison, R.J. Robel, T.M. Loughin, and R.D. Applegate.
2006a. Nesting ecology of lesser prairie-chickens in sand sagebrush prairie of
southwestern Kansas. Wilson Journal of Ornithology 118:23-35.
Pitman. J.C., C.A. Hagen, B.E. Jamison, R.J. Robel, T.M. Loughin, and R.D. Applegate.
2006b. Survival of juvenile lesser prairie-chickens in Kansas. Wildlife Society
Bulletin 34:675-681.
Riley, T.Z., C.A. Davis, M. Ortiz, and M.J. Wisdom. 1992. Vegetative characteristics of
successful and unsuccessful nests of lesser prairie-chickens. Journal of Wildlife
Management 56:383-387.
Robel, R.J., J.N. Briggs, A.D. Dayton, and L.C. Hulbert. 1970. Relationships between
visual obstruction measurements and weight of grassland vegetation. Journal of
Range Management 23:295-297.
Silvy, N.J., M.E. Morrow, E. Shanley, and R.D. Slack. 1990. An improved drop net
for capturing wildlife. Proceedings of the Annual Conference of the Southeastern
Association of Fish and Wildlife Agencies. 44:374-378.
Sullivan, R.M., J.P. Hughes, and J.E. Lionberger. 2000. Review of the historical and
present status of the lesser prairie-chicken (Tympanuchus pallidicinctus) in Texas.
Prairie Naturalist 32: 176-187.
Timmer, J.M., M.J. Butler, W.B. Ballard, C.W. Boal, and H.A. Whitlaw. 2013.
Abundance and density of lesser prairie-chickens and leks in Texas.
Wildlife Society Bulletin 37:741-749.
Toepfer, J.E., J.A. Newell, and J. Monarch. 1988. A method for trapping prairie grouse
hens on display grounds. Pp. 21-23 in A.J. Bjugstad, Tech. Coord. Prairie
chickens on the Sheyenne National Grasslands. U.S. Department of Agriculture
Gen. Tech. Rep. RM-159.
United States Fish and Wildlife Service. 2014. Endangered and Threatened Wildlife and

Texas Tech University, Samuel W.H. Harryman, December 2017
60
Plants; Determination of Threatened Status for the lesser prairie-chicken; Final
Rule. Federal Registrar 79: 10 April 2014 <http://www.gpo.gov/fdsys/pkg/FR-
2014-04-10/pdf/2014-07302.pdf>. Accessed 6 November 2014.
Van Pelt, W.E., S. Kyle, J. Pitman, D. Klute, G. Beauprez, D. Schoeling, A. Janus,
and J. Haufler. 2013. The lesser prairie-chicken range-wide conservation plan.
Western Association of Fish and Wildlife Agencies. Cheyenne, Wyoming, pp.
367.
White, G.C. and K.P. Burnham. 1999. Program MARK: survival estimation from
populations of marked animals. Bird Study 46:S120-S130.
Woodward, A.J.W, S.D. Fuhlendorf, D.M. Leslie, JR., and J. Shackford. 2001. Influence
of landscape compostion and change on lesser prairie-chicken (Tympanuchus
pallidicinctus) populations. American Midland Naturalist 145:261-274.

Texas Tech University, Samuel W.H. Harryman, December 2017
61
Table 3.1. Female lesser prairie-chicken (Tympanuchus pallidicinctus)
capture results in Bailey and Cochran Counties, Texas, 2015-2017.
Year Age # PTTa
2015 Adult 0
Sub-adult 1
2016 Adult 1
Sub-adult 3
2017 Adult 0
Sub-adult 1
Total 6
a. Number of individuals fitted with a Platform
Transmitting Terminal
Table 3.2. Nesting statistics for female lesser prairie-chickens
(Tympanuchus pallidicinctus) in Bailey and Cochran Counties,
Texas, 2015-2017.
Variable n 2015-2017
% Hens Nesting 6 100
% Hens Renesting 2 50
% Nest Success 8 50
Mean Clutch Size 6 8
Mean Nest Initiation Date 8 30 April
Mean Incubation Start Date 8 9 May
Mean Hatch Date 8 7 June
Nearest Lek (m) 8 1,044

Texas Tech University, Samuel W.H. Harryman, December 2017
62
Table 3.3. Habitat characteristics at lesser prairie-chicken (Tympanuchus pallidicinctus)
nest sites and random points in Bailey and Cochran Counties, Texas for the years 2015-
2017.
Variable Nest Site Random Point t value P
Mean SE Mean SE
VOR (dm) 3.43 0.27 2.17 0.44 2.46 0.02
% Grass 62.17 9.52 41.33 7.09 1.76 0.05
% Shrub 0.00 0.00 0.00 0.00 NA NA
% Forb 15.00 6.61 15.67 6.28 -0.07 0.94
% Litter 14.00 3.91 27.00 6.44 -1.72 0.12
% Bare Ground 8.83 1.90 16.00 4.53 -1.46 0.18
Table 3.4. Habitat characteristics at lesser prairie-chicken (Tympanuchus pallidicinctus)
nest areas and random areas in Bailey and Cochran Counties, Texas for the years 2015-
2017.
Variable Nest Area Random Area t value P
Mean SE Mean SE
Litter Depth (cm) 1.73 0.18 2.14 0.19 -0.90 0.39
% Grass 26.90 6.89 49.15 9.87 -1.85 0.95
% Shrub 1.00 1.00 0.00 0.00 NA NA
% Forb 13.60 3.00 11.10 5.61 0.39 0.70
% Litter 16.80 4.65 13.30 2.67 0.65 0.53
% Bare Ground 41.70 6.36 26.45 4.77 1.92 0.09

Texas Tech University, Samuel W.H. Harryman, December 2017
63
Table 3.5. Average temperature, standard error, and direction of nest temperature relative
to external temperature within lesser prairie-chicken (Tympanuchus pallidicinctus) nests
in Bailey and Cochran Counties, Texas, 2015-2017.
Time Nest External Nest Temp.
Mean SE Mean SE Morning 25.1 0.23 16.6 0.12 +
Mid-Morning 26.8 0.20 24.6 0.23 +
Mid-Day 30.8 0.23 35.8 0.41 -
Afternoon 32.2 0.23 33.9 0.33 -
Evening 29.0 0.19 24.2 0.18 +
Night 26.2 0.13 17.0 0.07 +
Full Day 27.8 0.08 23.2 0.11 +
Table 3.6. Average relative humidity, standard error, and direction of nest relative
humidity compared to external relative humidity within lesser prairie-chicken
(Tympanuchus pallidicinctus) nests in Bailey and Cochran Counties, Texas, 2015-2017.
Time Nest External Nest RH
Mean SE Mean SE Morning 72.8 0.63 86.3 0.65 -
Mid-Morning 70.6 0.62 66.7 0.91 +
Afternoon 57.6 0.57 38.8 0.82 +
Mid-Day 62.0 0.59 42.0 0.88 +
Evening 63.6 0.57 55.0 0.89 +
Night 72.9 0.33 79.0 0.41 -
Full Day 68.2 0.22 65.8 0.33 +

Texas Tech University, Samuel W.H. Harryman, December 2017
64
Figure 3.1. Bailey and Cochran County, Texas study area in the Sand Shinnery Oak
Prairie ecoregion of the lesser prairie-chicken (Tympanuchus pallidicinctus) range.

Texas Tech University, Samuel W.H. Harryman, December 2017
65
Figure 3.2. Visual obstruction reading averages at lesser prairie-chicken (Tympanuchus
pallidicinctus) nest sites and random points in Bailey and Cochran Counties, Texas,
2015-2017.
0.0
1.0
2.0
3.0
4.0
5.0
6.0
7.0
VOR_100 VOR_75 VOR_50 VOR_25 VOR_0
(dm
)
Nest
Random

Texas Tech University, Samuel W.H. Harryman, December 2017
66
CHAPTER IV
CAUSES OF MORTALITY AND SURVIVAL OF LESSER PRAIRIE-CHICKENS
IN CONSERVATION RESERVE PROGRAM LANDS IN THE SOUTHERN
HIGH PLAINS OF TEXAS
ABSTRACT The lesser prairie-chicken (Tympanuchus pallidicinctus) has received
considerable attention in recent years due to population declines and the uncertainty of its
status on the U.S. Endangered Species Act. Substantial effort is being put into studying
the life history of the species and the effects of management practices on the species’
ecology. Lesser prairie-chicken leks have been documented within Conservation Reserve
Program fields in the Southern High Plains of Texas. However, information is lacking
regarding the causes and timing of mortality and survival rates of individuals throughout
the course of a year. I assessed lesser prairie-chicken breeding and non-breeding season
survival within Conservation Reserve Program fields in Texas using the Known Fate
model in Program MARK. I also assessed the effects of habitat composition and
configuration within the home range on breeding season survival. Mammalian predators
were the main source of mortality for lesser prairie-chickens in my study area, and the
majority of mortalities took place during the late breeding season (June – August). The
probability of a lesser prairie-chicken surviving the breeding season was 0.61 ± 0.08, and
the probability of survival for the non-breeding season was 0.82 ± 0.11. Breeding season
survival increased as the percentage of native grass and forb CRP within the home range
increased, and survival decreased as the clumping of patches within the home range
increased. Survival rates in my study area were similar to previous estimates from native
Shinnery Oak Prairie, suggesting Conservation Reserve Program fields provide cover
from predators and the elements during important life history stages such as lekking,
nesting, brood-rearing, and the fall/winter months.

Texas Tech University, Samuel W.H. Harryman, December 2017
67
KEY WORDS Conservation Reserve Program, lesser prairie-chicken, survival, Texas,
Tympanuchus pallidicinctus
The lesser prairie-chicken (Tympanuchus pallidicinctus, hereafter LEPC) inhabits
portions of Texas, New Mexico, Oklahoma, Kansas, and Colorado, in the southern Great
Plains of North America. The species’ occupied range has declined by an estimated 90%
since 1900, due to substantial habitat loss and degradation (Hagen et al. 2004). The
factors contributing to habitat loss include conversion of native prairie to agriculture,
energy development, woody plant encroachment, and unmanaged grazing (Woodward et
al. 2001, Hagen and Giesen 2005). Lesser prairie-chickens are now found in 2
geographically isolated populations in 4 habitat ecoregions. One population is located
within the sand shinnery oak (Quercus havardii) prairie of eastern New Mexico and
western Texas. The other population is located in the sand sagebrush (Artemesia filifolia)
prairie in southeastern Colorado, southwestern Kansas, and the western Panhandle of
Oklahoma, the mixed-grass prairie in south central Kansas, northwest Oklahoma, and
northeast Texas, and the shortgrass prairie/Conservation Reserve Program (CRP)
ecoregion in northwestern Kansas (Van Pelt et al. 2013).
Loss of habitat and recurrent drought have resulted in significant LEPC
population declines (Hagen and Giesen 2005). Prominent droughts across the southern
Great Plains occurred during the 1930s, ‘50s, and early ‘90s and all contributed to LEPC
declines (Sullivan et al. 2000). More recently, the drought of 2011 had significant effects
on LEPC populations, particularly in the shinnery oak prairie ecoregion (Grisham et al.
2016). Less than 2,000 LEPCs were estimated to remain within both portions of the
species’ range in Texas (Timmer et al. 2013). Range-wide, the estimated LEPC
Texas Tech University, Samuel W.H. Harryman, December 2017
68
population was approximately 26,000 individuals in 2016, with the majority of
individuals occurring in the shortgrass prairie/CRP ecoregion (McDonald et al. 2016).
Due to significant range and population declines, LEPCs were listed as threatened under
the U.S. Endangered Species Act (U.S. Fish and Wildlife Service 2014) in May of 2014,
but the listing ruling was vacated by judicial decision in September of 2015.
Lesser prairie-chickens are a source of prey for multiple mammalian and avian
predators (Hagen and Giesen 2005). However, adult and sub-adult survival does not
influence LEPC population persistence to the extent of nest success and brood survival
(Hagen et al. 2009). Adult survival is lower during the breeding season (S=0.610,
SE=0.097; Leonard 2008) compared to the fall and winter months (S=0.721, SE=0.076;
Pirius et al. 2013). Male mortality is thought to increase during the breeding season due
to conspicuousness on open lek sites as well as decreased fitness resulting from intense
breeding behavior (Hagen et al. 2005, Wolfe et al. 2007). Female mortality is greater
during the breeding season due to nest site searching and vulnerability while incubating
and raising chicks (Haukos et al. 1988, Hagen et al. 2007, Wolfe et al. 2007, Grisham and
Boal 2015). Female breeding season survival has been found to be higher in the shinnery
oak prairie ecoregion. This portion of the LEPC range is warmer and dryer on average
than the sand sagebrush, mixed-grass, and shortgrass/CRP ecoregions, and during years
of drought and high temperatures, many females forgo nesting and focus on individual
fitness (Grisham et al. 2013).
Lesser prairie-chickens are known to inhabit CRP fields in the shinnery oak
prairie ecoregion of the LEPC range and are part of a genetic metapopulation of LEPCs
across the Southern High Plains of Texas and eastern New Mexico (Corman 2011,

Texas Tech University, Samuel W.H. Harryman, December 2017
69
Chapter II). Many studies have examined breeding and non-breeding season survival of
LEPCs in native shinnery oak prairie (Haukos et al. 1988, Leonard 2008, Jones 2009,
Pirius et al. 2013, Grisham 2012, Holt 2012), but there are currently no estimates of
LEPC survival in CRP lands in Texas. The objectives of my study were to 1) assess the
causes and timing of LEPC mortalities in CRP fields in Texas, 2) estimate LEPC adult
and sub-adult survival in CRP fields for both the breeding (March-August) and non-
breeding (September-February) seasons and compare to estimates from shinnery oak
prairie, 3) assess differences in survival between age classes and sex, and 4) assess the
effects of landscape composition and configuration on LEPC survival. I had 4 specific
hypotheses. First, mammalian predators would be the major of source of LEPC mortality
in the study area, and most mortality events would take place during the breeding season
(Hagen et al. 2007, Grisham and Boal 2015). Second, breeding and non-breeding season
survival would be similar to estimates in shinnery oak prairie. Third, survival rates would
be similar between sexes and age classes (Grisham and Boal 2015). Finally, survival rates
would be lower for individuals who placed their home ranges within CRP fields seeded in
non-native grasses, compared to individuals occupying CRP fields seeded in native
vegetation (Rodgers and Hoffman 2005).
STUDY AREA
This study took place on private lands in Bailey and Cochran Counties in the
Southern High Plains of Texas (Figure 2.1). The landscape within the study area was
highly fragmented due to extensive conversion of native prairie to intensive agriculture.
Cotton (Gossypium spp.) and grain sorghum (Sorghum bicolor) were the primary crops
produced, and both center pivot irrigation and dryland farming techniques were common.
Texas Tech University, Samuel W.H. Harryman, December 2017
70
Beef cattle production was also present in the area but to a lesser extent than crop
production. Native prairie within the study area was characterized by shrub/shortgrass
vegetation communities that were bisected by shinnery oak prairie. Mesquite (Prosopis
glandulosa), buffalo grass (Bouteloua dactyloides), blue grama (Bouteloua gracilis),
sideoats grama (Bouteloua curtipendula), sand dropseed (Sporobolus cryptandrus),
narrow-leaf yucca (Yucca glauca), western ragweed (Ambrosia psilostchya), and broom
snakeweed (Gutierrezia sarothrae) were common plant species in shortgrass prairie.
Peterson and Boyd (1998) detail the vegetation found within shinnery oak prairie.
Study efforts were focused in CRP fields, which were interspersed across the
landscape. The CRP fields were comprised of four common contract types: 1) fields
planted in non-native grasses, particularly weeping lovegrass (Eragrostis curvala) and
old world bluestems (CP1), 2) fields planted in native grass species such as yellow
indiangrass (Sorghastrum nutans), little bluestem (Schizachyrium scoparium),
switchgrass (Panicum virgatum), sideoats grama, and blue grama (CP2), 3) fields that
were first seeded in non-native grasses and then later seeded in natives (CP10), and 4)
fields enrolled in the USDA State Acres for Wildlife Enhancement Program (SAFE). In
addition to native grasses, forbs such as alfalfa (Medicago spp.), Maximillian sunflower
(Helianthus maximiliani), Illinois bundleflower (Desmanthus illinoensis), and other
natives were seeded in strips across fields enrolled in SAFE (Miguel Samaniego, USDA
Farm Service Agency, personal communication).
The Amarillo and Arvana soil series were the most extensive in the area (Girdner
1963). The soils within the Amarillo series are deep, medium- to coarse-textured, and
have a reddish-brown subsoil. The Arvana series consists of shallow to moderately deep

Texas Tech University, Samuel W.H. Harryman, December 2017
71
soils that are reddish-brown in color and moderately coarse textured. Arvana soils differ
from Amarillo soils in having rock-like caliche within 91.44 cm of the soil surface
(Girdner 1963). The Southern High Plains are characterized by a very warm and dry
climate. See Grisham et al. (2016) for a detailed description of weather patterns in the
shinnery oak prairie ecoregion of the LEPC range.
METHODS
Capture and Relocation
I captured LEPCs on 7 leks during the spring breeding seasons in 2015, 2016, and
2017. I used walk-in funnel traps (Toepfer et al. 1988), magnetic drop nets (Wildlife
Capture Services, Flagstaff, AZ, USA), tension drop nets (Silvy et al. 1990), and rocket
nets (Davis et al. 1980) for capture. I took standard morphological measurements on all
individuals, including weight (g), tarsus length (mm), wing cord length (mm), and pinnae
length (mm). I assessed sex by presence of eye comb and pinnae length, where males had
a bright yellow eye comb and noticeably longer pinnae than females (Copelin 1963). I
used plumage characteristics to assess age, where individuals with white spots within
2.54 cm of the tips of the outer 2 primary feathers were recorded as juveniles, while
individuals lacking these spots were recorded as adults (Copelin 1963). I banded each
bird with a Texas Parks and Wildlife aluminum leg band, and males were equipped with
a unique set of color bands.
The main goal of my research was to assess female reproductive ecology, so I
equipped every female with a 22 gram Satellite Platform Transmitting Terminal GPS
transmitter (PTT, Microwave Telemetry, Columbia, MD, USA). I attached the PTTs
using the figure-8 rump method (Bedrosian and Craighead 2007). I deployed PTTs on
Texas Tech University, Samuel W.H. Harryman, December 2017
72
males only after peak female attendance at leks during mid-April. Satellite PTT data
consisted of 4 GPS locations per day, with fixes taking place at 0100, 0700, 1300, and
1700 hrs Central Standard Time. I downloaded GPS data from the ARGOS website
weekly. In addition to taking GPS fixes, each PTT transmitter was equipped with a
Ground Track option. Each transmitter emitted a UHF signal from 1200 to 1700 hrs
every day from 15 March to 15 July. I used the Ground Track signal to find depredated
birds via a mortality signal.
I also fit opportunistically captured males with a 9 gram necklace style VHF
transmitter (American Wildlife Enterprises, Monticello, FL, USA). I located individuals
equipped with a VHF transmitter 3-5 times a week during the breeding season using
triangulation. I used an Advanced Telemetry Systems R2000 receiver (Advanced
Telemetry Systems, Isanti, MN, USA) and a hand-held 3 element Yagi antenna to obtain
bearings. I then used the LOAS 4.0 software program (Location of a Signal, Ecological
Software Solutions LLC, Florida, USA) to obtain UTM location estimates.
Probable Causes of Mortality
I visited each lesser prairie-chicken recovery site, if granted landowner
permission, to determine the cause of mortality. Repeated GPS locations over the course
of two days signaled a mortality event. I visited the last recorded location and thoroughly
searched the surrounding area until I found the kill site. After examining carcass and
transmitter condition and the area surrounding the kill site, I attributed the cause of
mortality to either mammal or avian predation or unknown cause. I used the guidelines
given by Grisham and Boal (2015) to determine probable cause of mortality. I considered
the kill to be by a mammalian predator if feathers were heavily damaged, with quills

Texas Tech University, Samuel W.H. Harryman, December 2017
73
chewed through, and if there was significant bite marks on the transmitter. I attributed the
kill to an avian predator if feathers appeared to be plucked and there was little transmitter
damage. Whitewash around the kill site also signaled an avian predator. If I could not
attribute the cause of mortality to an avian or mammalian predator, I considered the cause
of mortality as unknown. I attributed mortalities occurring within 48 hours after capture
as capture myopathy.
Survival
I used known-fate models in Program MARK (White and Burnham 1999) to
estimate breeding and non-breeding season survival of lesser prairie-chickens in my
study area. I considered 1 March – 31 August as the breeding season and 1 September –
28 February as the non-breeding season (Behny et al. 2012a, Pirius et al. 2013). Due to a
low sample size, I grouped individuals marked with PTTs and VHF transmitters. Two
studies in the northeastern portion of the lesser prairie-chicken range found that survival
did not differ between birds marked with PTTs and traditional necklace transmitters
(Plumb 2015, Robinson 2015). Encounter histories were by month, and I coded each
individual as either live (10), dead (11), or censored (00) each month. I developed model
sets based on field observations and previous investigations of LEPC survival.
I developed 4 model sets to assess breeding season survival. For the first set, I
modeled survival as a function of month (March-August), early-late breeding season
(March-May, June-August), age, sex, and constant survival (Grisham and Boal 2015).
The other 3 model sets were based off habitat composition and configuration within each
individual’s breeding season home range. I modeled non-breeding season survival as a
function of constant survival across the entire non-breeding period. Lesser prairie-

Texas Tech University, Samuel W.H. Harryman, December 2017
74
chicken survival is high during the non-breeding season in nearby shinnery oak prairie
(Pirius et al. 2013), and I simply wanted to obtain a survival estimate for comparison. I
lumped encounter histories for both the breeding and non-breeding seasons across years,
due to sample size limitations.
I assessed the effects of habitat composition and configuration on LEPC breeding
season survival based off the framework of Robinson (2015), who studied the effects of
landscape characteristics on LEPC survival in Kansas. I developed a land cover layer by
merging a Cropscape layer (National Agricultural Statistics Service, U.S. Department of
Agriculture) with a 2014 CRP layer representing all properties enrolled in CRP across the
lesser prairie-chicken’s range. I then grouped land cover classes into 5 groups, which
included native grass and forb CRP (GFCRP), native grass CRP (GCRP), non-native
grass CRP (NNCRP), agriculture (AG), and native grassland (Grassland). Native
grassland was characterized primarily by shrub/shortgrass vegetation communities. I
calculated a breeding season Minimum Convex Polygon (MCP) for each individual and
calculated the proportion of all 5 cover types within each home range using ArcGIS 10.2
(Environmental Systems Research Institute, Redlands, CA, USA). I then used the
program FRAGSTATS (McGarigal et al. 2012) to calculate landscape metrics within
each MCP home range. These metrics included Total Area, Mean Patch Size, Contagion
Index, and Interspersion/Juxtaposition Index (Table 4.4).
My assessment of survival based off landscape characteristics was exploratory,
and the models within the 3 candidate sets were not a priori. For the landscape
composition model set, I included one model for each cover class (n = 5), a global model
with all 5 cover classes, an additive model with all 3 CRP types, additive models with all

Texas Tech University, Samuel W.H. Harryman, December 2017
75
pairwise comparisons of cover types (n = 10), and a constant model. I included a model
for each landscape metric (n = 4), a global model with all 4 metrics, additive models with
all pairwise comparisons of landscape metrics (n = 6), and a constant model for the
landscape configuration model set. I then developed a final model set with the landscape
variables that received support in the previous analyses to assess the combined effects of
habitat composition and configuration on LEPC survival.
I used Akaike’s information criterion for small sample sizes (AICc), delta AICc
values (ΔAICc), and Akaike weights (AICw) to select the best approximating model
within each model set (Anderson 2008). Models with ΔAICc values ≤ 2 were considered
competing models. I assumed model selection uncertainty if the top model had less than
90% of the Akaike weight. If model selection uncertainty occurred, I model averaged
estimates of survival across all models in the model set (Anderson 2008).
RESULTS
Probable Causes of Mortality
I captured 35 lesser prairie-chickens during the 2015-2017 trapping seasons
(Table 4.1). I deployed 10 PTTs in 2015, 5 PTTs in 2016, and 10 PTTs in 2017. Nineteen
PTTs were deployed on males, and 6 were deployed on females. I also deployed VHF
transmitters on 2 males during the 2016 season and on one male during the 2017 season. I
recorded 16 mortalities over the course of the study. Four mortalities were recorded in
2015, 6 in 2016, and 6 in 2017. Eleven of the mortalities were males and 5 were females.
Ten mortalities (63%) were attributed to mammalian predation, and 2 mortalities
(13%) were attributed to avian predators. Two mortalities (13%) were from an unknown
cause due to lack of land access for examining the mortality site. Two mortalities (13%)

Texas Tech University, Samuel W.H. Harryman, December 2017
76
were attributed to capture myopathy. Three male mortalities (27%) occurred during the
early breeding season (March – May). An additional 7 males (64%) were depredated
during the late breeding season, and the final male mortality occurred during the early
non-breeding season (September). Three female mortalities occurred during the post-
breeding period, after a failed nest attempt. The fourth female mortality occurred during
the non-breeding season (Figure 4.1).
Survival
Season, Age, and Sex.— I eliminated 3 males from survival analysis due to death
within 2 weeks of initial capture. Thus, I used 19 males and 6 females to assess breeding
season survival. I detected model selection uncertainty in my a priori model set that
examined the effects of age, sex, and temporal trends on breeding season survival (Table
4.2). The top model SEL, which modeled survival as a function of early/late breeding
season, received 72% of the AICc weight. According to this model, survival was higher
during the early breeding season (0.97, SE = 0.02, 95% CI = 0.89-0.99) compared to the
late breeding season (0.87, SE = 0.04, 95% CI = 0.78-0.93). The top model, SEL, was the
only model with ΔAICc values ≤ 2, indicating that LEPC age and sex did not influence
survival to the extent of temporal patterns within the breeding season. I obtained a model
averaged survival estimate due to the model selection uncertainty, and the probability of a
LEPC surviving the breeding season was 0.61 (SE = 0.08, 95% CI = 0.44-0.78). I used
encounter histories for 7 males and 2 females to assess non-breeding season survival.
Three males were tracked during both non-breeding seasons, which resulted in 12
encounter histories used in the analysis. Based on the one model, SCONSTANT, the

Texas Tech University, Samuel W.H. Harryman, December 2017
77
probability of a LEPC surviving the non-breeding season was 0.82 (SE = 0.11, 95% CI =
0.50-0.95).
Habitat Composition.— There was model selection uncertainty in the habitat
composition model set (Table 4.5). Four of the 18 models had ΔAICc values ≤ 2. Those
models included SGFCRP (ΔAICc = 0.00, AICc weight = 0.16), SCONSTANT (ΔAICc = 0.67,
AICc weight = 0.12), SGFCRP+AG (ΔAICc = 1.18, AICc weight = 0.09), and SNNCRP
(ΔAICc = 1.26, AICc weight = 0.09). Native grass and forb CRP appeared to have the
largest impact on survival out of all cover types, because AICc weights from all models
including the parameter accounted for 43% of the variation in the data set. Native grass
and forb CRP had a positive effect on survival (βGFCRP = 0.01, SE = 0.02, 95% CI = -
0.03-0.05), while non-native grass CRP had a negative effect (βNNCRP = -0.003, SE =
0.01, 95% CI = -0.02-0.02). The model averaged estimate of survival across the 4 top
models was 0.56 (SE = 0.11, 95% CI = 0.36-0.77).
Habitat Configuration.— I also detected model selection uncertainty in the
habitat configuration model set (Table 4.6). Three of the 12 models were considered
competing (ΔAICc < 2). Those models included SCONSTANT (ΔAICc = 0.00, AICc weight
= 0.25), SCONTAGION (ΔAICc = 0.80, AICc weight = 0.17), and SPATCH AREA (ΔAICc =
1.82, AICc weight = 0.10). Contagion within the home range had a negative effect on
survival (βCONTAGION = -0.008, SE = 0.01, 95% CI = -0.03-0.02), and patch area had a
slight positive effect (βPATCH AREA = 0.001, SE = 0.005, 95% CI = -0.01-0.01); however,
all 95% confidence intervals overlapped zero. The model averaged estimated of survival
across the top 3 models was 0.54 (SE = 0.22, 95% CI = 0.11-0.97).
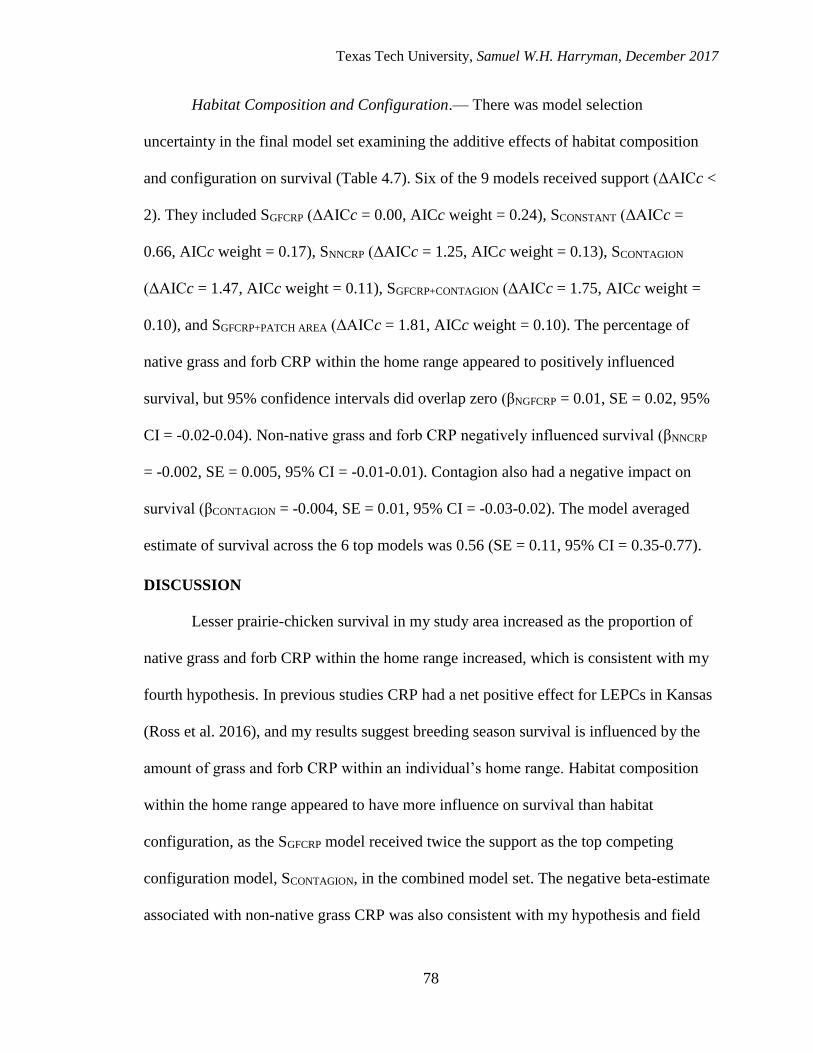
Texas Tech University, Samuel W.H. Harryman, December 2017
78
Habitat Composition and Configuration.— There was model selection
uncertainty in the final model set examining the additive effects of habitat composition
and configuration on survival (Table 4.7). Six of the 9 models received support (ΔAICc <
2). They included SGFCRP (ΔAICc = 0.00, AICc weight = 0.24), SCONSTANT (ΔAICc =
0.66, AICc weight = 0.17), SNNCRP (ΔAICc = 1.25, AICc weight = 0.13), SCONTAGION
(ΔAICc = 1.47, AICc weight = 0.11), SGFCRP+CONTAGION (ΔAICc = 1.75, AICc weight =
0.10), and SGFCRP+PATCH AREA (ΔAICc = 1.81, AICc weight = 0.10). The percentage of
native grass and forb CRP within the home range appeared to positively influenced
survival, but 95% confidence intervals did overlap zero (βNGFCRP = 0.01, SE = 0.02, 95%
CI = -0.02-0.04). Non-native grass and forb CRP negatively influenced survival (βNNCRP
= -0.002, SE = 0.005, 95% CI = -0.01-0.01). Contagion also had a negative impact on
survival (βCONTAGION = -0.004, SE = 0.01, 95% CI = -0.03-0.02). The model averaged
estimate of survival across the 6 top models was 0.56 (SE = 0.11, 95% CI = 0.35-0.77).
DISCUSSION
Lesser prairie-chicken survival in my study area increased as the proportion of
native grass and forb CRP within the home range increased, which is consistent with my
fourth hypothesis. In previous studies CRP had a net positive effect for LEPCs in Kansas
(Ross et al. 2016), and my results suggest breeding season survival is influenced by the
amount of grass and forb CRP within an individual’s home range. Habitat composition
within the home range appeared to have more influence on survival than habitat
configuration, as the SGFCRP model received twice the support as the top competing
configuration model, SCONTAGION, in the combined model set. The negative beta-estimate
associated with non-native grass CRP was also consistent with my hypothesis and field

Texas Tech University, Samuel W.H. Harryman, December 2017
79
observations. During the first field season of this assessment, all 4 mortalities occurred
within a CRP field that was mostly composed of weeping lovegrass, an introduced grass
to Texas. Despite these findings, the beta-estimates for both native grass and forb and
non-native CRP did overlap zero (See Appendix). However, due to the support received
by models incorporating native grass and forb CRP, this analysis provided evidence that
CRP fields seeded in native vegetation provided better resources for nesting and adult
survival (Chapter III).
Habitat configuration did not influence survival to the extent of composition, but
the model incorporating the Contagion Index received support in the final landscape
model set. The Contagion Index is a measure of the clumping of patches across the
landscape, and a value of 100% means there is a single patch present. The negative beta-
estimate for Contagion suggests that LEPC survival decreases as patch clumping
increases. This is similar to the findings of Robinson (2015), who found that LEPC
survival in Kansas increased as the number of patch types increased within the home
range. Lesser prairie-chickens have different habitat requirements throughout different
life stages (Haukos and Zavaleta 2016). The presence of multiple CRP enrollments
within the home range may provide a gradient of vegetation structure that provides
habitat for lekking, foraging, roosting, and nesting. Therefore, my results support
previous studies that suggest increasing habitat heterogeneity at multiple spatial scales is
positive for LEPC populations (Fuhlendorf and Engle 2001, Robinson 2015, Grisham et
al. 2016).
My results on the causes of LEPC mortalities are consistent with the findings of
Grisham and Boal (2015), who examined LEPC breeding season survival in Shinnery

Texas Tech University, Samuel W.H. Harryman, December 2017
80
Oak Prairie in Texas. The majority of mortalities (40%) were attributed to mammalian
predators. Coyotes (Canis latrans) were the most numerous potential mammalian
predator throughout the study site, and I also observed signs of American badger
(Taxidea taxus). I never observed a predation attempt by an avian predator while LEPCs
were present on a lek site, but northern harriers (Circus cyaneus) frequently flushed birds
off the lek while flying overhead. Other avian predators observed on the study site
included red-tailed hawks (Buteo jamaicensis), ferruginous hawks (B. regalis), rough-
legged hawks (B. lagopus), and prairie falcons (Falco mexicanus), but these species
typically leave the study area during the lekking period (Behny et al 2012b). Swainson’s
hawks (B. swainsoni) arrived on the study area approximately half way through the
lekking period and were the most numerous potential avian predator for the majority of
the breeding season (Behny et al 2012b). Raptor abundance and diversity is greatest on
the Southern High Plains during the fall and winter months (Behny et al. 2012b), but I
observed few mortalities during that portion of the year. Therefore, I concluded that
mammals were the main source of adult LEPC predation in my study area during the
course of a year.
The temporal patterns I observed for male LEPC mortalities are consistent with
findings in nearby shinnery oak prairie (Grisham and Boal 2015). Of 25 male LEPC
mortalities documented in Texas, 17 (68%) occurred during the late breeding season
months of June through August (Grisham and Boal 2015). Likewise, 64% of male
mortalities in my study occurred during the late summer months (Figure 4.2). Increased
male mortality during the latter portion of the breeding season was attributed to reduced
fitness after the intense lekking period as well as drought effects (Grisham and Boal

Texas Tech University, Samuel W.H. Harryman, December 2017
81
2015). My study area experienced average to above average rainfall during the years of
my study (𝑥=57 cm; West Texas Mesonet, http://www.mesonet.ttu.edu/), which suggests male
survival in the Sand Shinnery Oak ecoregion is most likely a function of breeding
activities, regardless of environmental conditions. It is interesting to note that peak male
mortality occurred in April and May in both Kansas and Oklahoma (Jamison 2000, Wolfe
et al. 2007). Additional research is warranted to assess the causes of increased male
mortality during late summer in Shinnery Oak Prairie.
Only one female was depredated while incubating a nest during the three years of
this assessment. This finding is contrary to previous studies that found female survival
decreased significantly during nesting and brood-rearing (Hagen et al. 2007, Wolfe et al.
2007, Plumb 2015). Avian predators have been identified as a main source of mortality
for females nesting in open grasslands similar to my study area (Wolfe et al. 2007, Plumb
2015). However, the relatively low abundance and diversity of raptors in my study area
following spring migration (Behny et al. 2012, Boal 2016) partially explains the lack of
female mortalities during nesting. Mammalian predators were still a potential source of
depredation during nesting, but my estimates of visual obstruction at nests fell within the
range recommended by previous studies to increase nest and female survival (Hagen et
al. 2007, Grisham 2012, Lautenbach 2015, Plumb 2015, Chapter III). Also, I surmise the
absence of overhead shrub cover at nests in my study area allowed for quick escape in the
event of a mammalian predation attempt.
Female LEPC survival was found to be constant across the breeding season in
shinnery oak prairie, and the constant survival rate was attributed to multiple females
deferring nesting attempts during drought periods (Grisham and Boal 2015). My results

Texas Tech University, Samuel W.H. Harryman, December 2017
82
are similar in that survival did not decrease during the nesting period, but I did observe an
increase in female mortalities post-breeding (Figure 4.2). Two females made long-
distance dispersal movements after brood loss and both were depredated. Ruffed grouse
(Bonasa umbellus) survival in Ohio decreased when individuals occupied unfamiliar
space due to dispersal movements (Yoder et al. 2004). My results suggest LEPC survival
also decreases after dispersal movements, due to lack of knowledge regarding food
resources and escape cover. A third female was depredated after a failed nest attempt, and
I hypothesize that similar to males, female fitness decreased after nest searching, egg
laying, incubation, and in some cases dispersal, which made females more susceptible to
depredation post-breeding. The use of modern PTTs allowed me to assess female
survival, as well as long-distance movements after individuals left the study area.
Individuals marked with traditional VHF transmitters were censored from survival
analyses after dispersal movements to remove bias (Grisham and Boal 2015), plus the
authors could not relocate the lost individuals after nest failure due to limitations of the
VHF transmitters (B. Grisham, personal communication). The use of PTTs in this
assessment revealed interesting movement patterns post-breeding and allowed for the
estimation of breeding season survival without censoring lost individuals. The use of
PTTs in future studies will allow for numerous new discoveries into mortality and
survival for this species in shinnery oak prairie.
Based on my results, adult breeding and non-breeding survival does not limit
LEPC abundance in my study area. My estimate of the probability of a LEPC surviving
the breeding season is consistent with previous studies. Previous estimates of LEPC
breeding season survival with sexes pooled range from 0.42 ± 0.163 to 0.71 ± 0.110

Texas Tech University, Samuel W.H. Harryman, December 2017
83
(Toole 2005, Leonard 2008, Jones 2009). It is recommended that separate estimates of
survival be obtained for male and female LEPCs (Grisham 2012), but my sample size did
not warrant separate analyses. I recorded only 2 mortalities during the fall and winter
periods of my study, but there was no consistent patterns or causes of mortality (Figure
4.2). This finding is consistent with Robinson (2015), who concluded that female LEPC
mortalities occurred at random during the non-breeding period in Kansas. In addition, my
estimate of LEPC non-breeding season survival was greater than survival in shinnery oak
prairie. Lesser prairie-chicken non-breeding season survival was 0.72 ± 0.076 from 2008-
2011 and ranged from 0.57 – 0.85 between years (Pirius et al. 2013). The higher survival
estimate may be due to the grass cover provided by CRP during the fall and winter
months. Much of the shinnery oak prairie in Texas is a monoculture of shrubs due to
years of unmanaged grazing and fire suppression (Grisham et al. 2014), and sand
shinnery oak defoliates during the winter months (Peterson and Boyd 1998). Thus, it
appears that one unanticipated, yet positive benefit of CRP in Texas is reliable cover for
LEPCs during the non-breeding season.
Adult survival has been identified as an indicator of LEPC habitat quality
(Haukos and Zavaleta 2016). Individuals occurring in habitat that is lacking key food and
cover components will have lower survival than individuals occurring in areas with better
or more resources. My results suggest CRP fields in the High Plains of Texas provide
necessary resources that facilitate average LEPC survival during years of normal or
surplus rainfall. Additional research will be needed to address the effects of drought on
LEPC survival within CRP fields in Texas, particularly because CRP fields are
traditionally hayed during drought years on the Southern High Plains (D. Lucia, U.S. Fish

Texas Tech University, Samuel W.H. Harryman, December 2017
84
and Wildlife Service, personal communication). Survival was positively influenced by
the percentage of native grass and forb CRP within the home range. I acknowledge that
the confidence interval around the beta-estimate for native grass and forb CRP overlaps
zero, and I attribute this to a small sample size. Previous investigations into LEPC
survival used sample sizes ranging from 113 to 311 individuals (Hagen et al. 2005,
Hagen et al. 2007, Grisham and Boal 2015). Recent drought years across the Southern
High Plains and the limited availability of CRP land across the study area (Chapter II)
make obtaining sufficient sample sizes difficult for LEPC studies in my study area.
MANAGEMENT IMPLICATIONS
Lesser prairie-chicken adult survival in my study area was consistent with other
survival estimates from across the species’ range and appears to not contribute to
population declines. Lesser prairie-chicken populations within my study area may benefit
most if management actions within CRP fields are targeted at improving nesting and
brood-rearing habitat. However, high adult survival may be best maintained if CRP tracts
≥2500 ha are kept in grasses after contract expiration and if a mixture of grasses and
forbs is included in future CRP seeding mixes. Also, strategically placing new CRP fields
in corridors between habitat patches will facilitate higher survival for individuals making
long distance movements between patches, and subsequently increase habitat
heterogeneity on the landscape for the species.
LITERATURE CITED
Anderson, D.R. 2008. Model based inference in the life sciences. Springer Science &
Business Media, New York, NY.
Bedrosian, B. and D. Craighead. 2007. Evaluation of techniques for attaching transmitters
to common raven nestlings. Northwestern Naturalist 88:1-6.

Texas Tech University, Samuel W.H. Harryman, December 2017
85
Behny, A.C., B.A. Grisham, C.W. Boal, H.A. Whitlaw, and D.A. Haukos. 2012a. Sexual
selection and mating chronology of lesser prairie-chickens. Wilson Journal of
Ornithology 124:96-105.
Behny, A.C., C.W. Boal, H.A. Whitlaw, and D.R. Lucia. 2012b. Raptor community
composition in the Texas southern high plains lesser prairie-chicken range.
Wildlife Society Bulletin 36:291-296.
Boal, C.W. 2016. Predation of lesser prairie-chickens. Pp. 145-158 in D.A. Haukos and
C.W. Boal (editors), Ecology and Conservation of Lesser Prairie-Chickens.
Studies in Avian Biology (no.48), CRC Press, Boca Raton, Fl.
Copelin, F.F. 1963. The lesser prairie-chicken in Oklahoma. Oklahoma Department of
Wildlife Technical Bulletin 6. Oklahoma City, Oklahoma, USA.
Corman, K.S. 2011. Conservation and landscape genetics of Texas lesser prairie-chicken:
population structure and differentiation, genetic variability, and effective size.
M.S. thesis, Texas A&M University, Kingsville, Kingsville, Texas, USA.
Davis, C.A., T.Z. Riley, J.F. Schwarz, H.R. Suminski, and M.J. Wisdom. 1980.
Livetrapping prairie-chickens on spring leks. Pages 64-67 in P.A. Vohs, Jr. and
F.L. Knopf (editors), Proceedings of Prairie Grouse Symposium. Oklahoma State
University, Stillwater, Oklahoma, USA, 89 pp.
Fuhlendorf, S.D. and D.M. Engle. 2001. Restoring heterogeneity on rangelands:
ecosystem management based on evolutionary grazing patterns. BioScience
51:625-632.
Girdner, C.L. Jr. 1963. Soil survey of Bailey County, Texas. Washington DC: U.S.
Department of Agriculture, Soil Conservation Service. 71 pages.
Grisham, B.A. 2012. The ecology of lesser prairie-chickens in shinnery oak-grassland
communities in New Mexico and Texas with implications toward habitat
management and future climate change. Dissertation, Texas Tech University,
Lubbock, TX, USA.
Grisham, B.A., C.W. Boal, D.A. Haukos, D.M. Davis, K.K. Boydston, C. Dixon, and W.
Heck. 2013. The predicted influence of climate change on lesser prairie-chicken
reproductive parameters. PLoS ONE 8(7): e68225.
doi:10.1371/journal.pone.0068225.
Grisham, B.A., P.K. Borsdorf, K.K. Boydston, and C.W. Boal. 2014. Nesting ecology
and nest survival of lesser prairie-chickens on the Southern High Plains of Texas.
Journal of Wildlife Management 78:857-866.
Grisham, B.A. and C.W. Boal. 2015. Causes of mortality and temporal patterns in

Texas Tech University, Samuel W.H. Harryman, December 2017
86
breeding season survival of lesser prairie-chickens in shinnery oak prairies.
Wildlife Society Bulletin 39:536-542.
Grisham, B.A., J.C. Zavaleta, A.C. Behny, P.K. Borsdorf, D.R. Lucia, C.W. Boal, and
D.A. Haukos. 2016. Ecology and conservation of lesser prairie-chickens in sand
shinnery oak prairie. Pp. 315-344 in D.A. Haukos and C.W. Boal (editors),
Ecology and Conservation of Lesser Prairie-Chickens. Studies in Avian Biology
(no.48), CRC Press, Boca Raton, Fl.
Hagen, C.A., B.E. Jamison, K.M. Giesen, and T.Z. Riley. 2004. Guidelines for managing
lesser prairie-chicken populations and their habitats. Wildlife Society Bulletin
32:69-82.
Hagen, C.A. and K.M. Giesen. 2005. Lesser prairie-chicken (Tympanuchus
pallidicinctus). Account 364 in A. Poole, editor. The birds of North America.
Cornell Lab of Ornithology, Ithaca, New York, USA.
Hagen, C.A., J.C. Pitman, B.K. Sandercock, R.J. Robel, and R.D. Applegate. 2005.
Age-specific variation in apparent survival rates of male lesser prairie-chickens.
Condor 107:78-86.
Hagen, C.A., J.C. Pitman, B.K. Sandercock, R.J. Robel, and R.D. Applegate. 2007. Age-
specific survival and probable causes of mortality in female lesser prairie-
chickens. Journal of Wildlife Management 71:518-525.
Hagen, C.A, B.K. Sandercock, J.C. Pitman, R.J. Robel, and R.D. Applegate. 2009.
Spatial variation in lesser prairie-chicken demography: a sensitivity analysis of
population dynamics and management activities. Journal of Wildlife Management
73:1325-1332.
Haukos, D.A., L.M. Smith, and G.S. Broda. 1988. The use of radio-telemetry to estimate
lesser prairie-chicken nest success and hen survival. Proceedings of the Tenth
International Symposium on Biotelemetry. Fayetteville, AR, USA.
Haukos, D.A. and J.C. Zavaleta. 2016. Habitat. Pp. 99-132 in D.A. Haukos and C.W.
Boal (editors), Ecology and Conservation of Lesser Prairie-Chickens. Studies in
Avian Biology (no.48), CRC Press, Boca Raton, Fl.
Holt, R.D. 2012. Breeding season demographics of a lesser prairie-chicken
(Tympanuchus pallidicinctus) population in the northeastern Texas Panhandle.
Dissertation, Texas Tech University, Lubbock, Texas, USA.
Jamison, B.E. 2000. Lesser prairie-chicken chick survival, adult survival, and habitat
selection and movements of males in fragmented rangelands of southwestern
Kansas. Thesis, Kansas State University, Manhattan, Kansas, USA.

Texas Tech University, Samuel W.H. Harryman, December 2017
87
Jones, R.S. 2009. Seasonal survival, reproduction, and use of wildfire areas by lesser
prairie-chickens in the northeastern Texas Panhandle. Thesis, Texas A&M
University, College Station, Texas, USA.
Lautenbach, J.M. 2015. Lesser prairie-chicken reproductive success, habitat selection,
and response to trees. Thesis, Kansas State University, Manhattan, Kansas, USA.
Leonard, J.P. 2008. The effects of shinnery oak removal on lesser prairie-chicken
survival, movement, and reproduction. M.S. thesis, Texas A&M University,
College Station, TX, USA.
McDonald, L., K. Nasman, T. Rintz, F. Hornsby, and G. Gardner. 2016. Range-wide
population size of the lesser prairie-chicken: 2012, 2013, 2014, 2015, and 2016.
Report prepared for the Western Association of Fish and Wildlife Agencies. 42
pages.
McGarigal, K., S. A Cushman, and E. Ene. 2012. FRAGSTATS v4: Spatial Pattern
Analysis Program for Categorical and Continuous Maps. Computer software
program produced by the authors at the University of Massachusetts, Amherst.
http://www.umass.edu/landeco/research/fragstats/fragstats.html
Peterson, R.S. and C.S. Boyd. 1998. Ecology and management of sand shinnery
communities: a literature review. United States Forest Service, Rocky Mountain
Research Station, General Technical Report RMRS-GTR-16:71-87, Fort Collins,
Colorado, USA.
Pirius, N.E., C.W. Boal, D.A. Haukos, and M.C. Wallace. 2013. Winter habitat use and
survival of lesser prairie-chickens in west Texas. Wildlife Society Bulletin
37:759-765.
Plumb, R.T. 2015. Lesser prairie-chicken movement, space use, survival, and response to
anthropogenic structures in Kansas and Colorado. M.S. thesis, Kansas State
University, Manhattan, KS, USA.
Robinson, S.G. 2015. Landscape ecology, survival and space use of lesser prairie-
chickens. M.S. thesis, Kansas State University, Manhattan, KS, USA.
Rodgers, R.D. and R.W. Hoffman. 2005. Prairie grouse population response to
conservation reserve grasslands: an overview. Pgs. 120-128 in A.W. Allen and
M.W. Vandever, eds. The Conservation Reserve Program-Planting for the Future:
Proceeding of a National Conference, Fort Collins, Colorado, June 6-9, 2004.
Ross, B.E., D.A. Haukos, C.A. Hagen, and J.C. Pitman. 2016. Landscape composition
creates a threshold influencing lesser prairie-chicken population resilience to
extreme drought. Global Ecology and Conservation 6:179-188.

Texas Tech University, Samuel W.H. Harryman, December 2017
88
Silvy, N.J., M.E. Morrow, E. Shanley, and R.D. Slack. 1990. An improved drop net
for capturing wildlife. Proceedings of the Annual Conference of the Southeastern
Association of Fish and Wildlife Agencies. 44:374-378.
Sullivan, R.M., J.P. Hughes, and J.E. Lionberger. 2000. Review of the historical and
present status of the lesser prairie-chicken (Tympanuchus pallidicinctus) in Texas.
Prairie Naturalist 32: 176-187.
Timmer, J.M., M.J. Butler, W.B. Ballard, C.W. Boal, and H.A. Whitlaw. 2013.
Abundance and density of lesser prairie-chickens and leks in Texas.
Wildlife Society Bulletin 37:741-749.
Toepfer, J.E., J.A. Newell, and J. Monarch. 1988. A method for trapping prairie grouse
hens on display grounds. Pp. 21-23 in A.J. Bjugstad, Tech. Coord. Prairie
chickens on the Sheyenne National Grasslands. U.S. Department of Agriculture
Gen. Tech. Rep. RM-159.
Toole, B.E. 2005. Survival, seasonal movements, and cover use by lesser prairie-chickens
in the Texas panhandle. Thesis, Texas A&M University, College Station, Texas,
USA.
United States Fish and Wildlife Service. 2014. Endangered and Threatened Wildlife and
Plants; Determination of Threatened Status for the lesser prairie-chicken; Final
Rule. Federal Registrar 79: 10 April 2014 <http://www.gpo.gov/fdsys/pkg/FR-
2014-04-10/pdf/2014-07302.pdf>. Accessed 6 November 2014.
Van Pelt, W.E., S. Kyle, J. Pitman, D. Klute, G. Beauprez, D. Schoeling, A. Janus,
and J. Haufler. 2013. The lesser prairie-chicken range-wide conservation plan.
Western Association of Fish and Wildlife Agencies. Cheyenne, Wyoming, pp.
367.
White, G.C. and K.P. Burnham. 1999. Program MARK: survival estimation from
populations of marked animals. Bird Study 46:S120-S130.
Wolfe, D.H., M.A. Patten, E. Shochat, C.L. Pruett, and S.K. Sherrod. 2007. Causes and
patterns of mortality in lesser prairie-chickens Tympanuchus pallidicinctus and
implications for management. Wildlife Biology 13:95-104.
Woodward, A.J.W, S.D. Fuhlendorf, D.M. Leslie, JR., and J. Shackford. 2001. Influence
of landscape compostion and change on lesser prairie-chicken (Tympanuchus
pallidicinctus) populations. American Midland Naturalist 145:261-274.
Yoder, J.M., E.A. Marschall, and D.A. Swanson. 2004. The cost of dispersal: predation
as a function of movement and site familiarity in ruffed grouse. Behavioral
Ecology 15:469-476.

Texas Tech University, Samuel W.H. Harryman, December 2017
89
Table 4.1. Lesser prairie-chicken (Tympanuchus pallidicinctus) capture results for the
spring 2015-2017 trapping seasons. Individuals were captured in Conservation Reserve
Program fields in Bailey and Cochran Counties, Texas.
Year Sex Age Total #a # PTT # VHF
2015 Male Adult 7 4 0
Sub-adult 6 5 0
Female Adult 0 0 0
Sub-adult 1 1 0
2016 Male Adult 5 1 1
Sub-adult 2 0 1
Female Adult 1 1 0
Sub-adult 3 3 0
2017 Male Adult 5 6 1
Sub-adult 4 3 0
Female Adult 0 0 0
Sub-adult 1 1 0
Total 35 25 3
a. Total # = number of individuals captured, # PTT = number of individuals fitted
with Platform Transmitting Terminal, # VHF = number of individuals fitted with
Very High Frequency transmitter

Texas Tech University, Samuel W.H. Harryman, December 2017
90
Table 4.2. Output from five a priori models used to assess the effects of time, age, and
sex on lesser prairie-chicken (Tympanuchus pallidicinctus) breeding season survival in
Bailey and Cochran Counties, Texas, 2015-2017.
Modela AICcb ΔAICc AICc wt Model K Deviance
Likelihood
SEL 82.27 0.00 0.72 1.00 2 78.19
S. 86.15 3.88 0.10 0.14 1 84.13
SMONTH 86.92 4.66 0.07 0.09 5 76.52
SSEX 87.11 4.85 0.06 0.09 2 83.03
SAGE 88.15 5.89 0.04 0.05 2 84.07
a. SEL – Survival is a function of the early (March-May) or late (June-August)
breeding season, SMONTH – Survival is a function of the month of the breeding
season (March – August), S. – Survival is constant across the breeding season,
SAGE – Survival is a function of age (Juvenile/Adult), SSEX – Survival is a function
of sex (Male/Female)
b. AICc = Akaike’s Information Criterion for small sample sizes, ΔAICc =
differences in AICc, AICc wt = Akaike weights, K = number of parameters
Table 4.3. Survival estimates, standard errors, and 95% confidence intervals for the top
model, SEL, in the a priori model set used to assess breeding season survival of lesser
prairie-chickens (Tympanuchus pallidicinctus) in Bailey and Cochran Counties, Texas,
2015-2017.
Parameter Estimate SE 95% CI
Lower Upper
Early 0.97 0.02 0.90 0.99
Late 0.87 0.04 0.78 0.93
Cumulative 0.61 0.08 0.44 0.78

Texas Tech University, Samuel W.H. Harryman, December 2017
91
Table 4.4. Definitions of FRAGSTATS metrics used to assess effects of landscape
configuration on lesser prairie-chicken (Tympanuchus pallidicinctus) breeding season
survival in Bailey and Cochran Counties, Texas, 2015-2017.
FRAGSTATS Metric Definition
Total Area Total area of the landscape. Reported in hectares.
Mean Patch Size Total area of the landscape divided by the number
of individual patches. Reported in hectares.
Contagion Index Degree of clumping of patches on the landscape,
based on cell adjacencies. Expressed as a percent.
Interspersion/Juxtaposition Index Degree to which patches are intermixed, based on
patch adjacencies. Expressed as a percent.

Texas Tech University, Samuel W.H. Harryman, December 2017
92
Table 4.5. Output from eighteen models used to assess the effects of landscape
composition within the home range on lesser prairie-chicken (Tympanuchus
pallidicinctus) breeding season survival in Bailey and Cochran Counties, Texas, 2015-
2017.
Modela AICcb Δ AICc AICc wt Model K Deviance
Likelihood
{GFCRP} 73.30 0.00 0.16 1.00 2 69.19
{Constant} 73.97 0.66 0.11 0.71 1 71.93
{GFCRP+AG} 74.48 1.17 0.09 0.55 3 68.25
{NNCRP} 74.56 1.25 0.08 0.53 2 70.45
{GFCRP+NNCRP} 75.32 2.01 0.06 0.36 3 69.09
{GFCRP+GCRP} 75.39 2.09 0.05 0.35 3 69.17
{GFCRP+Grassland} 75.40 2.10 0.05 0.34 3 69.18
{GCRP} 75.63 2.32 0.05 0.31 2 71.52
{Grassland} 75.63 2.33 0.05 0.31 2 71.52
{NNCRP+Grassland} 75.64 2.34 0.05 0.30 3 69.42
{Agriculture} 76.02 2.71 0.04 0.25 2 71.91
{GCRP+NNCRP} 76.02 2.72 0.04 0.25 3 69.80
{NNCRP+AG} 76.55 3.25 0.03 0.19 3 70.33
{All CRP} 77.00 3.70 0.02 0.15 4 68.63
{GCRP+Grassland} 77.22 3.91 0.02 0.14 3 70.99
{GCRP+AG} 77.48 4.18 0.02 0.12 3 71.26
{Grassland+AG} 77.68 4.37 0.01 0.11 3 71.45
{Global} 81.02 7.72 0.003 0.02 6 68.22
a. GCRP = Native Grass CRP, GFCRP = Native Grass and Forb CRP, NNCRP =
Non-native Grass CRP, AG = Agriculture, Grassland = Native Grassland
b. AICc = Akaike’s Information Criterion for small sample sizes, ΔAICc =
differences in AICc, AICc wt = Akaike weights, K = number of parameters

Texas Tech University, Samuel W.H. Harryman, December 2017
93
Table 4.6. Output from twelve models used to assess the effects of landscape
configuration within the home range on lesser prairie-chicken (Tympanuchus
pallidicinctus) breeding season survival in Bailey and Cochran Counties, Texas, 2015-
2017.
Modela AICcb Δ AICc AICc wt Model K Deviance
Likelihood
{Constant} 73.97 0.00 0.25 1.00 1 71.94
{Contagion} 74.77 0.80 0.17 0.67 2 70.66
{Patch Area} 75.79 1.82 0.10 0.40 2 71.68
{IJI} 76.00 2.03 0.09 0.36 2 71.89
{Total Area} 76.03 2.06 0.09 0.36 2 71.92
{Contagion+Patch Area} 76.58 2.60 0.07 0.27 3 70.35
{Contagion+IJI} 76.66 2.69 0.06 0.26 3 70.44
{Contagion+Total Area} 76.81 2.84 0.06 0.24 3 70.59
{Patch Area+Total Area} 77.80 3.83 0.04 0.15 3 71.58
{IJI+Patch Area} 77.84 3.87 0.04 0.14 3 71.62
{IJI+Total Area} 78.11 4.14 0.03 0.13 3 71.89
{Global} 80.49 6.52 0.01 0.04 5 69.93
a. Contagion = Contagion Index, Patch Area = Mean Patch Area, IJI = Interspersion
and Juxtaposition Index
b. AICc = Akaike’s Information Criterion for small sample sizes, ΔAICc =
differences in AICc, AICc wt = Akaike weights, K = number of parameters

Texas Tech University, Samuel W.H. Harryman, December 2017
94
Table 4.7. Output from nine models used to assess the effects of landscape composition
and configuration within the home range on lesser prairie-chicken (Tympanuchus
pallidicinctus) breeding season survival in Bailey and Cochran Counties, Texas, 2015-
2017.
Modela AICcb Δ AICc AICc wt Model K Deviance
Likelihood
{GFCRP} 73.30 0.00 0.24 1.00 2 69.19
{Constant} 73.97 0.67 0.17 0.72 1 71.94
{NNCRP} 74.56 1.26 0.13 0.53 2 70.45
{Contagion} 74.77 1.47 0.11 0.48 2 70.66
{GFCRP+Contagion} 75.06 1.75 0.10 0.42 3 68.83
{GFCRP+Patch Area} 75.11 1.81 0.10 0.40 3 68.89
{Patch Area} 75.79 2.48 0.07 0.29 2 71.68
{NNCRP+Patch Area} 76.57 3.26 0.05 0.20 3 70.35
{NNCRP+Contagion} 76.58 3.28 0.05 0.19 3 70.36
a. GFCRP = Native Grass and Forb CRP, NNCRP = Non-native Grass CRP,
Contagion = Contagion Index, Patch Area = Mean Patch Area
b. AICc = Akaike’s Information Criterion for small sample sizes, ΔAICc =
differences in AICc, AICc wt = Akaike weights, K = number of parameters
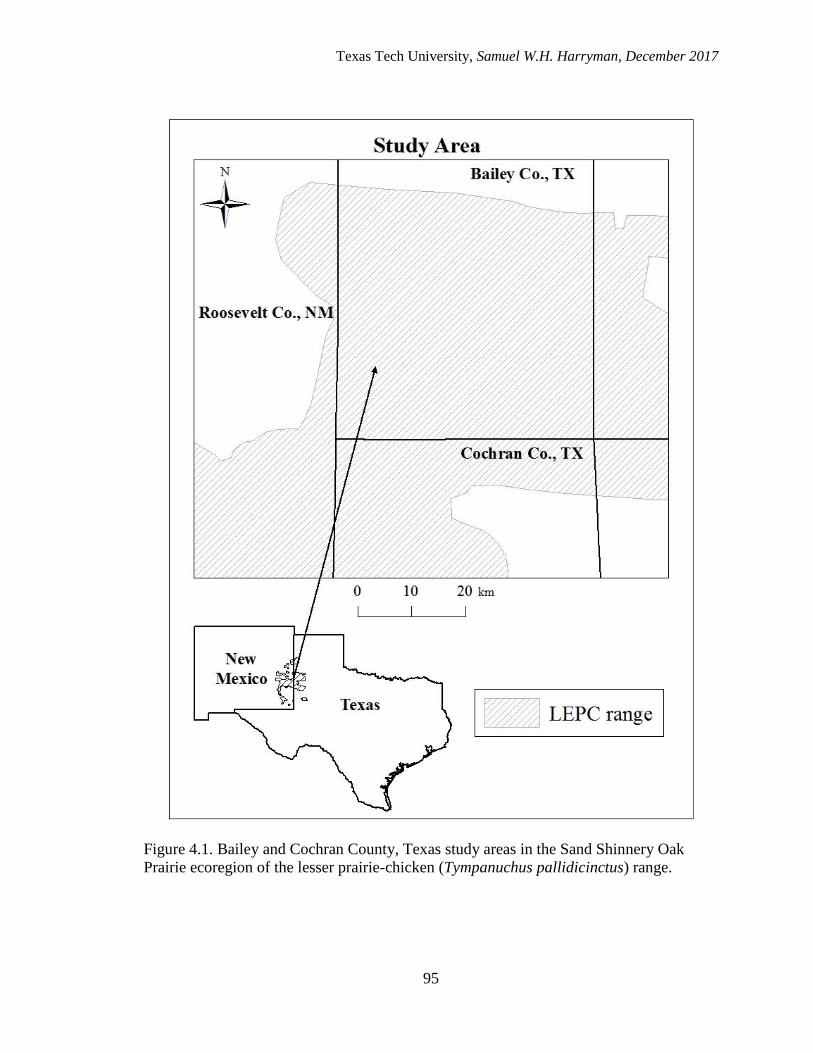
Texas Tech University, Samuel W.H. Harryman, December 2017
95
Figure 4.1. Bailey and Cochran County, Texas study areas in the Sand Shinnery Oak
Prairie ecoregion of the lesser prairie-chicken (Tympanuchus pallidicinctus) range.

Texas Tech University, Samuel W.H. Harryman, December 2017
96
Figure 4.2. Distribution of lesser prairie-chicken (Tympanuchus pallidicinctus)
mortalities over the course of a year in Bailey and Cochran Counties, Texas, 2015-2017.
0
1
2
3
4
Nu
mb
er o
f M
ort
alit
ies
Month
Male
Female

Texas Tech University, Samuel W.H. Harryman, December 2017
97
APPENDIX
TABLES
Table A.1. Average 50% core area and 95% home range size of lesser prairie-chickens
(Tympanuchus pallidicinctus) for six sub-seasons of the breeding season and for the
cumulative breeding and non-breeding seasons. Home ranges were calculated using the
Brownian Bridge Movement Model. Individuals were captured in Bailey and Cochran
Counties, Texas from March to May 2015-2017.
Sex Season N Core Area SE Home Range SE
(ha) (ha)
Male Lekking 23 35 4.7 203 25.0
Summer 21 30 3.1 188 15.9
Cumulative Breeding 22 44 4.2 254 25.0
Non-Breeding 9 95 9.4 678 81.4
Female Pre-Nesting 8 51 10.8 285 50.9
Nesting 8 20 10.6 112 36.4
Brooding 2 11 0.7 55 1.8
Post-Breeding 5 12 1.8 147 45.2
Cumulative Breeding 7 25 6.0 239 36.1
Non-Breeding 2 44 9.5 429 94.3

Texas Tech University, Samuel W.H. Harryman, December 2017
98
Table A.2. Average 95% home range size of lesser prairie-chickens (Tympanuchus
pallidicinctus) for the six months of the non-breeding season. Home ranges were
calculated using the Brownian Bridge Movement Model. Individuals were captured in
Bailey and Cochran Counties, Texas from March to May 2015-2017.
Month N Home Range SE Range
(ha) (ha)
September 12 254 38.5 64-514
October 11 491 38.1 320-702
November 11 571 130.7 265-1729
December 10 431 110.9 67-1327
January 10 535 107.2 31-1055
February 9 350 66.4 141-668

Texas Tech University, Samuel W.H. Harryman, December 2017
99
Table A.3. Average daily movement distances of lesser prairie-chickens (Tympanuchus
pallidicinctus), summarized by six biological periods of the breeding season and the
cumulative non-breeding season. Individuals were captured in Bailey and Cochran
Counties, Texas from March to May 2015-2017.
Sex Season N Daily Movement SE
(m)
Male Lekking 1122 1623.1 28.5
Summer 1037 1217.0 21.7
Non-Breeding 1532 1866.8 25.6
Female Pre-Nesting 126 1485.7 65.6
Nesting 217 656.2 57.5
Brooding 63 647.8 35.3
Post-Breeding 266 1046.1 103.1
Non-Breeding 329 833.2 30.4

Texas Tech University, Samuel W.H. Harryman, December 2017
100
FIGURES
Figure A.1. Breeding and non-breeding season 95% home ranges for a male lesser
prairie-chicken (Tympanuchus pallidicinctus) in Bailey County, Texas. Home ranges
were estimated using the Brownian Bridge Movement Model.
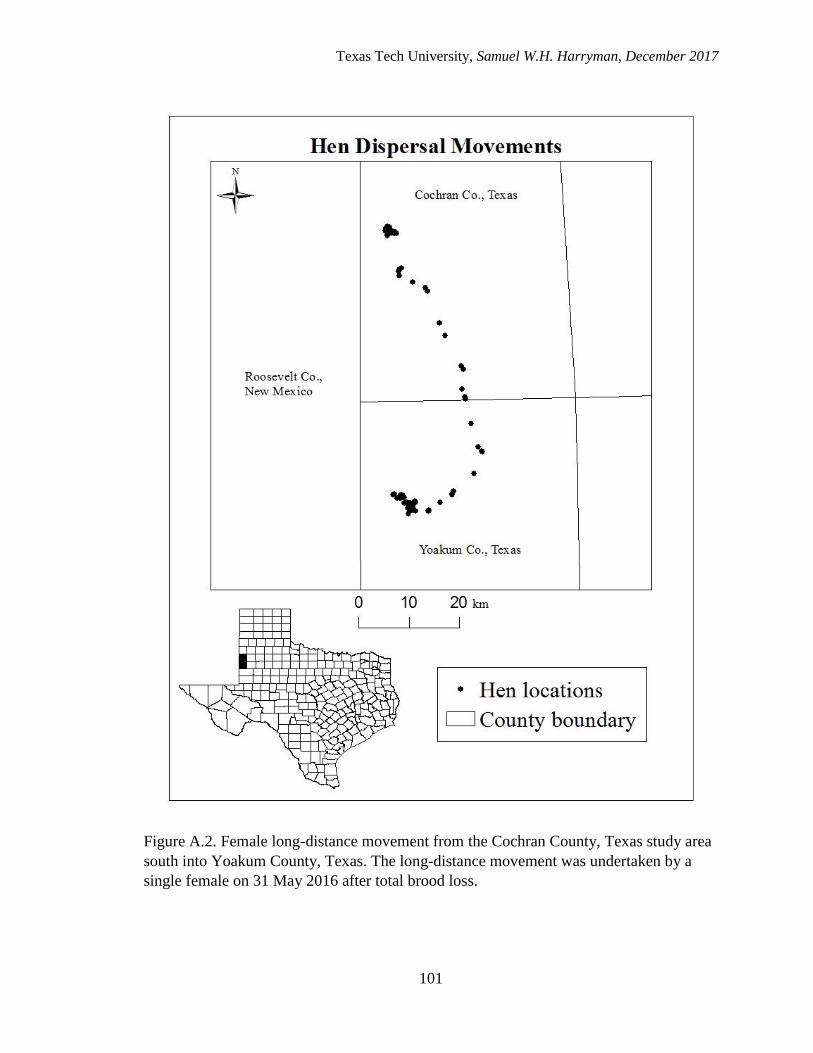
Texas Tech University, Samuel W.H. Harryman, December 2017
101
Figure A.2. Female long-distance movement from the Cochran County, Texas study area
south into Yoakum County, Texas. The long-distance movement was undertaken by a
single female on 31 May 2016 after total brood loss.

Texas Tech University, Samuel W.H. Harryman, December 2017
102
Figure A.3. Distance from nearest lek (km) for all male lesser prairie-chicken
(Tympanuchus pallidicinctus) GPS locations. Distances are divided into the lekking
season (1 March – 31 May), summer season (1 June – 31 August), and the non-breeding
season (1 September – 28 February). Data were collected in Bailey and Cochran
Counties, Texas, 2015-2017.
0
0.1
0.2
0.3
0.4
0.5
0.6
0.7
0.8
0.9
<0.8 0.8-1.7 1.7-3.2 3.2-4.8 >4.8
Pro
port
ion o
f P
oin
ts
Distance (km)
Lekking
Summer
Non-Breeding

Texas Tech University, Samuel W.H. Harryman, December 2017
103
Figure A.4. Distance from nearest lek (km) for all female lesser prairie-chicken
(Tympanuchus pallidicinctus) GPS locations. Distances are divided into the the pre-
nesting, nesting, brooding, and post-breeding periods of the breeding season. Data were
collected in Bailey and Cochran Counties, Texas, 2015-2017.
0
0.1
0.2
0.3
0.4
0.5
0.6
0.7
0.8
<0.8 0.8-1.7 1.7-3.2 3.2-4.8
Pro
port
ion o
f P
oin
ts
Distance (km)
Pre-Nesting
Nesting
Brooding
Post-Breeding

Texas Tech University, Samuel W.H. Harryman, December 2017
104
Figure A.5. Beta-estimates and 95% confidence intervals for the effects of native grass
and forb CRP (GFCRP), native grass CRP (GCRP), non-native grass CRP (NNCRP),
native grassland, and agriculture within the home range on lesser prairie-chicken
(Tympanuchus pallidicinctus) breeding season survival. Data were collected in Bailey
and Cochran Counties, Texas from 2015-2017.
GFCRP GCRP NNCRP Grassland Agriculture-0.05
-0.04
-0.03
-0.02
-0.01
0
0.01
0.02
0.03
0.04
0.05
0.06
Bet
a-es
tim
ate

Texas Tech University, Samuel W.H. Harryman, December 2017
105
Figure A.6. Beta-estimates and 95% confidence intervals for the effects of contagion
index, interspersion and juxtaposition index (IJI), average patch area, and total area
within the home range on lesser prairie-chicken (Tympanuchus pallidicinctus) breeding
season survival. Data were collected in Bailey and Cochran Counties, Texas from 2015-
2017.
Contagion IJI Patch Area Total Area-0.05
-0.03
-0.01
0.01
0.03
0.05B
eta-
esti
mat
e

Texas Tech University, Samuel W.H. Harryman, December 2017
106
Figure A.7. Predictive plot showing survival rates of lesser prairie-chickens
(Tympanuchus pallidicinctus) based on the percentage of native grass CRP within the
home range. Data were collected in Bailey and Cochran Counties, Texas from 2015-
2017.

Texas Tech University, Samuel W.H. Harryman, December 2017
107
Figure A.8. Predictive plot showing survival rates of lesser prairie-chickens
(Tympanuchus pallidicinctus) based on the percentage of native grass and forb CRP
within the home range. Data were collected in Bailey and Cochran Counties, Texas from
2015-2017.

Texas Tech University, Samuel W.H. Harryman, December 2017
108
Figure A.9. Predictive plot showing survival rates of lesser prairie-chickens
(Tympanuchus pallidicinctus) based on the percentage of non-native grass CRP within
the home range. Data were collected in Bailey and Cochran Counties, Texas from 2015-
2017.
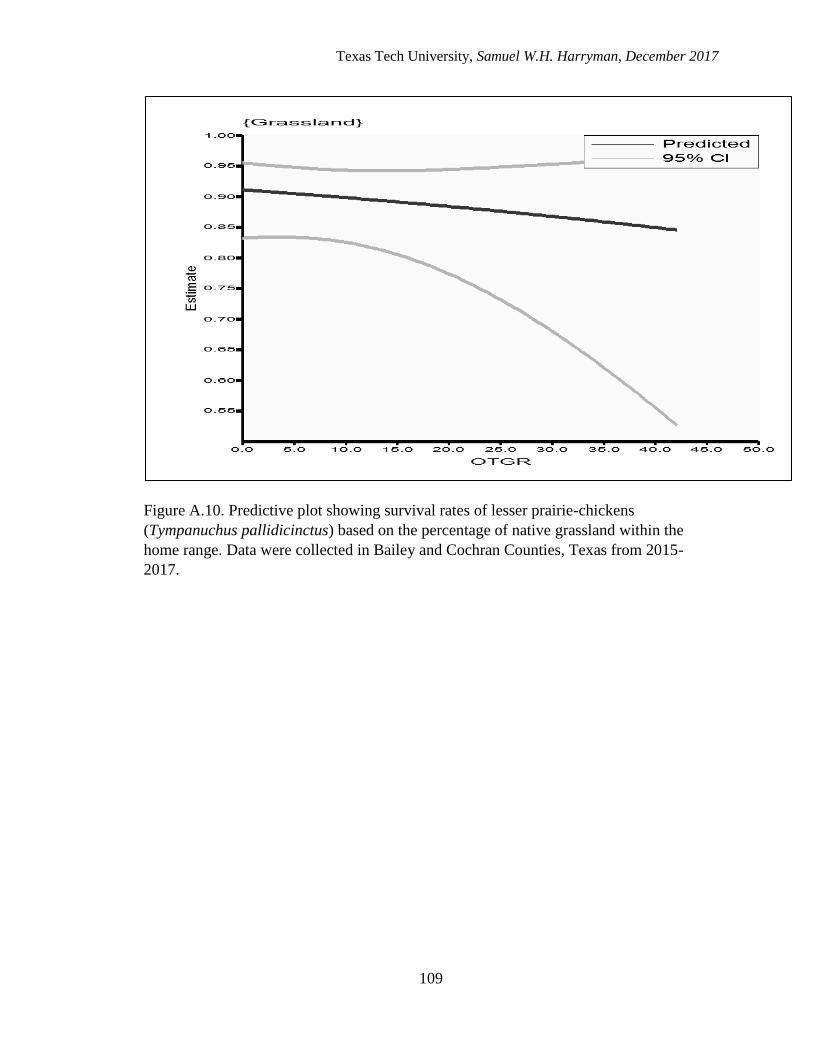
Texas Tech University, Samuel W.H. Harryman, December 2017
109
Figure A.10. Predictive plot showing survival rates of lesser prairie-chickens
(Tympanuchus pallidicinctus) based on the percentage of native grassland within the
home range. Data were collected in Bailey and Cochran Counties, Texas from 2015-
2017.

Texas Tech University, Samuel W.H. Harryman, December 2017
110
Figure A.11. Predictive plot showing survival rates of lesser prairie-chickens
(Tympanuchus pallidicinctus) based on the percentage of agriculture within the home
range. Data were collected in Bailey and Cochran Counties, Texas from 2015-2017.

Texas Tech University, Samuel W.H. Harryman, December 2017
111
Figure A.12. Predictive plot showing survival rates of lesser prairie-chickens
(Tympanuchus pallidicinctus) based on the contagion estimate (%) within the home
range. Data were collected in Bailey and Cochran Counties, Texas from 2015-2017.
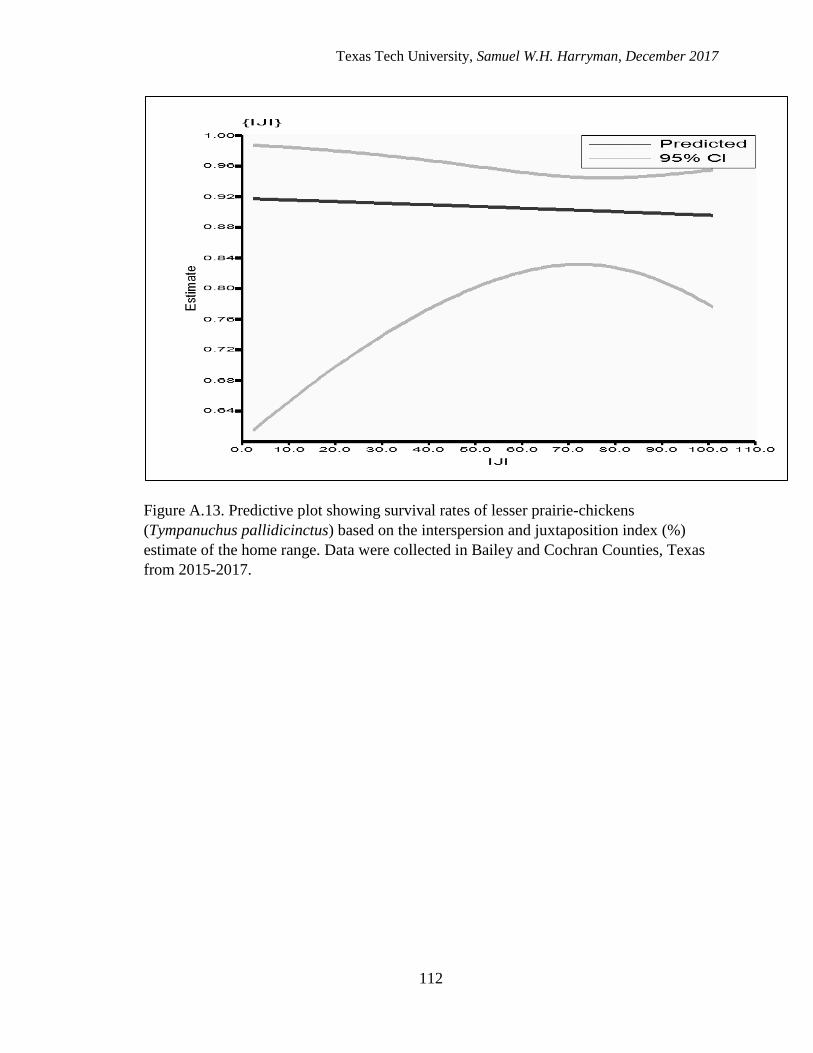
Texas Tech University, Samuel W.H. Harryman, December 2017
112
Figure A.13. Predictive plot showing survival rates of lesser prairie-chickens
(Tympanuchus pallidicinctus) based on the interspersion and juxtaposition index (%)
estimate of the home range. Data were collected in Bailey and Cochran Counties, Texas
from 2015-2017.

Texas Tech University, Samuel W.H. Harryman, December 2017
113
Figure A.14. Predictive plot showing survival rates of lesser prairie-chickens
(Tympanuchus pallidicinctus) based on the average patch size (ha) of all cover classes
within the home range. Data were collected in Bailey and Cochran Counties, Texas from
2015-2017.

Texas Tech University, Samuel W.H. Harryman, December 2017
114
Figure A.15. Predictive plot showing survival rates of lesser prairie-chickens
(Tympanuchus pallidicinctus) based on the total area (ha) of the home range. Data were
collected in Bailey and Cochran Counties, Texas from 2015-2017.