Understanding reflective learning experiences in museums · Based on these factors they regulate...
48
Understanding reflective learning experiences in museums Team members: Eduardo Oliveira Jonathan Shearer Paula De Barba Cam Hocking Gregor Kennedy Damien Payler Ben Cleveland Kate Chmiel Kristine Elliott Tracii Ryan Tingzuan Zhang Li Li Roz Mountain Hyejeong Kim Ethel Villafranca
Transcript of Understanding reflective learning experiences in museums · Based on these factors they regulate...
Understanding reflective learning
experiences in museums
Team members: Eduardo Oliveira Jonathan Shearer
Paula De Barba Cam Hocking
Gregor Kennedy Damien Payler
Ben Cleveland Kate Chmiel
Kristine Elliott
Tracii Ryan
Tingzuan Zhang
Li Li
Roz Mountain
Hyejeong Kim
Ethel Villafranca
ii
Contents 1. Introduction .......................................................................................................................... 8
1.1. Rationale and background ............................................................................................. 8
1.2. Research questions ........................................................................................................ 9
2. Project approach ................................................................................................................. 11
2.1. Participants .................................................................................................................. 11
2.2. Materials and Procedure .............................................................................................. 12
3. Project findings.................................................................................................................... 19
3.1. Motivations .................................................................................................................. 19
3.2. Behaviour ..................................................................................................................... 20
3.3. Critical reflection, learning strategies, perceived learning, interest development, and
emotions ...................................................................................................................... 27
3.4. Relationships ................................................................................................................ 32
4. Conclusions ......................................................................................................................... 45
References ............................................................................................................................... 48
iii
Figures
Figure 1. Demographic and museum experience information for the total sample ............... 11
Figure 2. Project approach ....................................................................................................... 12
Figure 3. Estimote beacons ...................................................................................................... 13
Figure 4. Map of The Mind exhibition showing the positioning of beacons ........................... 16
Figure 5. Distribution of scores for visitors’ initial interest in the exhibition content ............ 19
Figure 6. Visitors’ mean scores for the four learning goals ..................................................... 20
Figure 7. Percentage breakdown of overall time spent near beacons in the exhibition ........ 21
Figure 8. Heat map of median time spent by visitors per beacon .......................................... 22
Figure 9. Percentage breakdown for the number of individual beacons visited .................... 23
Figure 10. Heat map of unique individual visits per beacon ................................................... 23
Figure 11. Combination of heat maps (frequency and time) .................................................. 24
Figure 12. Sequence of visits (per visitor) across the exhibition ............................................. 26
Figure 13. Most frequent beacon transitions made by visitors............................................... 26
Figure 14. Most frequent patterns of backtracks made by visitors ........................................ 27
Figure 15. Distribution of scores for visitors’ critical reflection about the exhibition content
.................................................................................................................................................. 28
Figure 16. Distribution of scores for visitors' use of surface learning strategies in the
exhibition ................................................................................................................................. 28
Figure 17. Distribution of scores for visitors' use of deep learning strategies in the exhibition
.................................................................................................................................................. 29
Figure 18. Distribution of scores for visitors’ perceived learning for the overall exhibition ... 30
Figure 19. Visitors’ mean scores for perceived learning of content from the five key exhibits
.................................................................................................................................................. 30
Figure 20. Distribution of scores for visitors’ interest development in the exhibition content
.................................................................................................................................................. 31
Figure 21. Visitors' emotional responses to key exhibits and the overall exhibition .............. 32
Figure 22. Mean scores on motivation variables for high and low engagement visitors ....... 33
Figure 23. Demographic information for high and low engagement visitors ......................... 33
Figure 24. Mean number of visits to beacons for high and low engagement visitors ............ 34
Figure 25. Sequence of visits (per visitor) by high and low engagement visitors across the
exhibition ................................................................................................................................. 35
Figure 26. Similar sequences of beacon visitation by high and low engagement visitors ...... 36
Figure 27. Most frequent sequence of beacon visitation by high and low engagement visitors
.................................................................................................................................................. 37
Figure 28. Mean scores for critical reflection about exhibition content for high and low
engagement visitors ................................................................................................................. 38
Figure 29. Mean scores for the use of surface learning strategies in the exhibition by high
and low engagement visitors ................................................................................................... 38
Figure 30. Mean scores for the use of deep learning strategies in the exhibition by high and
low engagement visitors .......................................................................................................... 39
iv
Figure 31. Mean scores for high and low engagement visitors on perceived learning for the
overall exhibition and five key exhibits ................................................................................... 40
Figure 32. Mean interest development scores for high and low engagement visitors ........... 41
Figure 33. Percentage of emotional responses to the overall exhibition for high and low
engagement visitors ................................................................................................................. 41
Figure 34. Percentage of emotional responses to the Kew Isolation Cells exhibit for high and
low engagement visitors .......................................................................................................... 42
Figure 35. Percentage of emotional responses to the Mood Pods exhibit for high and low
engagement visitors ................................................................................................................. 42
Figure 36. Percentage of emotional responses to the Illusions exhibit for high and low
engagement visitors ................................................................................................................. 43
Figure 37. Percentage of emotional responses to the Dream Dioramas exhibit for high and
low engagement visitors .......................................................................................................... 43
Figure 38. Percentage of emotional responses to the Being Pods exhibit for high and low
engagement visitors ................................................................................................................. 44

v
Tables
Table 1. Log file designed and adopted in this project ............................................................ 14
Table 2. Median time spent at each beacon ........................................................................... 21
Table 3. Percentage breakdown of visitation to individual beacons ....................................... 25
vi
Executive summary
Project context
Museums are challenged to provide learning opportunities to a diverse audience. Visitors
come to museums with varied backgrounds, motivations, interests, and prior knowledge.
Based on these factors they regulate their learning experience, choosing what, where, and
when to engage and learn.
This pilot study was designed to investigate how learning occurs within museum exhibition
spaces. The study took place in The Mind exhibition at Melbourne Museum. This exhibition
focuses on topics relating to human psychology, and is organized into five themes:
Introduction, Feeling, Knowing, Thinking, and Being.
Aim
The aim of this pilot study was to better understand the nature of learning that takes place
in museums, through the lens of self-regulated learning theories.
Approach
Data were obtained from visitors to The Mind exhibition at three points in time. Prior to
entering, visitors provided self-report questionnaire data relating to their motivations for
attending the exhibition. Behavioural data, in the form of trajectory and pause patterns, were
then collected using Bluetooth technologies as visitors moved through the exhibition. Finally,
visitors provided self-report questionnaire data about their reflections, learning strategies,
perceived learning, interest development, and emotions upon leaving the exhibition.
Key Findings
Visitors to The Mind exhibition were primarily motivated to attend due to a desire to learn
and to have fun.
Most visitors spent between 1 and 10 minutes in the exhibition in total, and the median time
spent near each beacon was 28 seconds. The Damaged Brains, Synaesthesia Demonstration,
and Sound Memory Test exhibits had the highest median visitation time (66 seconds), while
the Mood Pods had the lowest median time (19 seconds).
None of the visitors paused to spend time near all thirteen beacons, although most visitors
visited between five and nine beacons at least once. The Knowing: Memory and Perception
area of the exhibition had the highest proportion of visitors compared to the other areas,
while the Mood Pods had the lowest percentage of visits overall.
Every visitor had a unique sequence of beacon visitation through the overall exhibition;
however it was possible to identify common sequences of beacon transitions in certain
vii
sections of the exhibition, such as the Thinking: Cognition and Consciousness content area. It
was also possible to identify areas where visitors backtracked and revisited particular areas
of the exhibition.
Two types of visitors were identified: a high engagement group and a low engagement group.
These two groups came to the exhibition with different goals and levels of interest, showed
different patterns of visitation, and experienced different outcomes. In particular, the high
engagement group visited more individual beacons, showed backtrack transitions, were more
likely to adopt deep learning strategies, and had higher levels of perceived learning and
interest development than the low engagement group.
Overall, The Mind exhibition provoked visitors to develop interest in the topics covered. They
also predominantly experienced positive emotional responses, such as curiosity and
excitement. However, visitors were less inclined to report that the exhibition had changed
the way they thought about the content of the exhibition, indicating that they hadn’t been
provoked to critically reflect on matters concerning the brain and psychology to the extent
that might alter, or challenge, their understandings of the topics.
Implications
A significant achievement of this pilot study was the successful mapping of exhibition visitors’
time spent, trajectories, and pause rates using Bluetooth technology. Automating the
collection of such data may have benefits to the museum into the future, especially when
compared with the labour intensive and expensive strategies that have been previously
employed.
If performed repeatedly across multiple exhibitions, studies of this type could help identify
quantitative patterns that are indicative of certain behaviours in different types of exhibits.
Such detailed data may be useful in providing feedback to exhibition curators about the
‘relative success’ of different features of their exhibitions.
8
1. Introduction
1.1. Rationale and background
Museums are designed to provide learning opportunities to a wide audience, and visitors
come with varied backgrounds, motivations, interests, and prior knowledge. Based on these
factors, visitors regulate their learning experience; choosing what, where, and when to
engage and learn. A key challenge for museums is to connect exhibitions and visitors in ways
that promote reflection and learning.
Recently self-regulated learning theories have been used to better understand learning in
informal settings, such as museums (Zhou & Urhahne, 2016). Self-regulated learning theory
provides a foundation for understanding situations where learners are autonomous about
their learning (Pintrich, 2000). For example, self-regulated learners take an active role in
their learning, in which they plan, monitor, control and reflect on their cognition, motivation
and behaviour during their learning experience. The activation of all these skills is known to
promote learning. This research focused particularly on the planning and reflection phases
of self-regulation.
Two important aspects of planning are the motivational constructs of interest and goals.
These constructs have been found to drive behaviour and learning in different settings,
including museums. Interest is an affective and cognitive connection between individuals
and a certain topic that may or may not develop across time (Harackiewicz et al., 2008). In
this research we focus on visitors’ initial interest, that is, their level of interest on the topic
of the exhibition at the outset of their visit. Goals are related to the intentions or the
different ways in which individuals can approach different situations. Four types of goals
relevant to learning in museums were examined in this research (Zhou & Urhahne, 2016):
Mastery goals: wanting to learn more about specific topics;
Performance goals: wanting to learn more than others;
Hedonic goals: seeking fun or passive enjoyment;
Social goals: wanting to communicate and share their experience with others.
In addition to goals, a range of other constructs were considered in this investigation:
Critical reflection: a deep level of reflection leading to a change of perspective in
relation to certain topic (Kember et al., 2000).
Learning strategies: includes surface and deep learning approaches (Zhou &
Urhahne, 2016). Deep learners try to comprehensively understand material, while
surface learners tend to rely on memorisation rather than deep reflection.
9
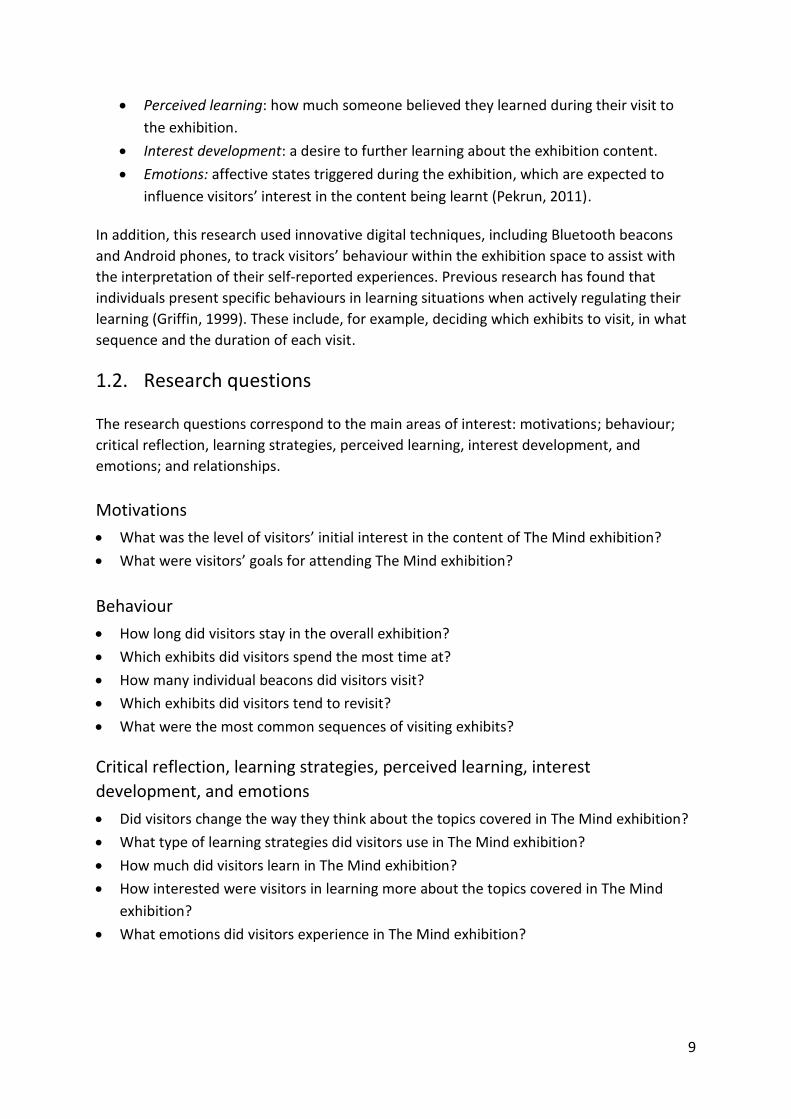
Perceived learning: how much someone believed they learned during their visit to
the exhibition.
Interest development: a desire to further learning about the exhibition content.
Emotions: affective states triggered during the exhibition, which are expected to
influence visitors’ interest in the content being learnt (Pekrun, 2011).
In addition, this research used innovative digital techniques, including Bluetooth beacons
and Android phones, to track visitors’ behaviour within the exhibition space to assist with
the interpretation of their self-reported experiences. Previous research has found that
individuals present specific behaviours in learning situations when actively regulating their
learning (Griffin, 1999). These include, for example, deciding which exhibits to visit, in what
sequence and the duration of each visit.
1.2. Research questions
The research questions correspond to the main areas of interest: motivations; behaviour;
critical reflection, learning strategies, perceived learning, interest development, and
emotions; and relationships.
Motivations
What was the level of visitors’ initial interest in the content of The Mind exhibition?
What were visitors’ goals for attending The Mind exhibition?
Behaviour
How long did visitors stay in the overall exhibition?
Which exhibits did visitors spend the most time at?
How many individual beacons did visitors visit?
Which exhibits did visitors tend to revisit?
What were the most common sequences of visiting exhibits?
Critical reflection, learning strategies, perceived learning, interest
development, and emotions
Did visitors change the way they think about the topics covered in The Mind exhibition?
What type of learning strategies did visitors use in The Mind exhibition?
How much did visitors learn in The Mind exhibition?
How interested were visitors in learning more about the topics covered in The Mind
exhibition?
What emotions did visitors experience in The Mind exhibition?

10
Relationships
Were there different types of visitors, based on their motivations for visiting?
o If so, did they behave differently while in the exhibition?
o If so, what were their most common sequences of visiting exhibits?
o If so, did they have different levels of critical reflection, learning strategies,
perceived learning, and emotions after leaving the exhibition?
11
2. Project approach
This section provides information about the study participants, along with the materials and
procedure used to collect data.
2.1. Participants
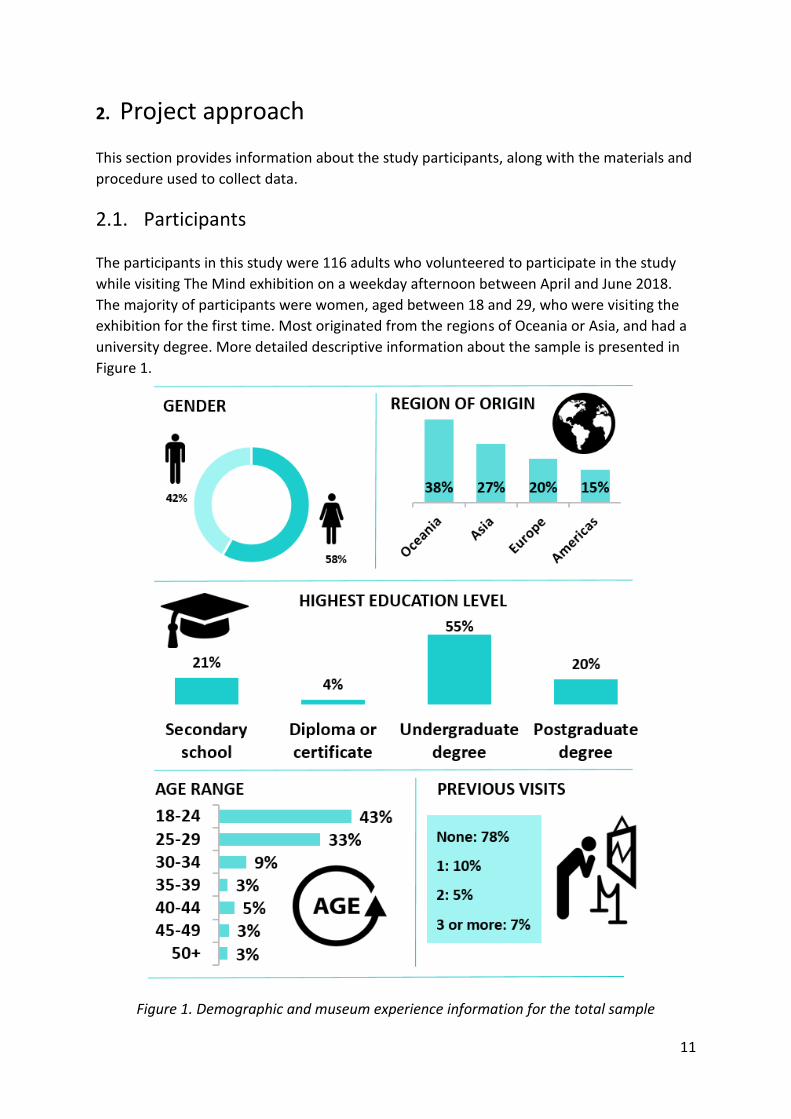
The participants in this study were 116 adults who volunteered to participate in the study
while visiting The Mind exhibition on a weekday afternoon between April and June 2018.
The majority of participants were women, aged between 18 and 29, who were visiting the
exhibition for the first time. Most originated from the regions of Oceania or Asia, and had a
university degree. More detailed descriptive information about the sample is presented in
Figure 1.
Figure 1. Demographic and museum experience information for the total sample
12
2.2. Materials and Procedure
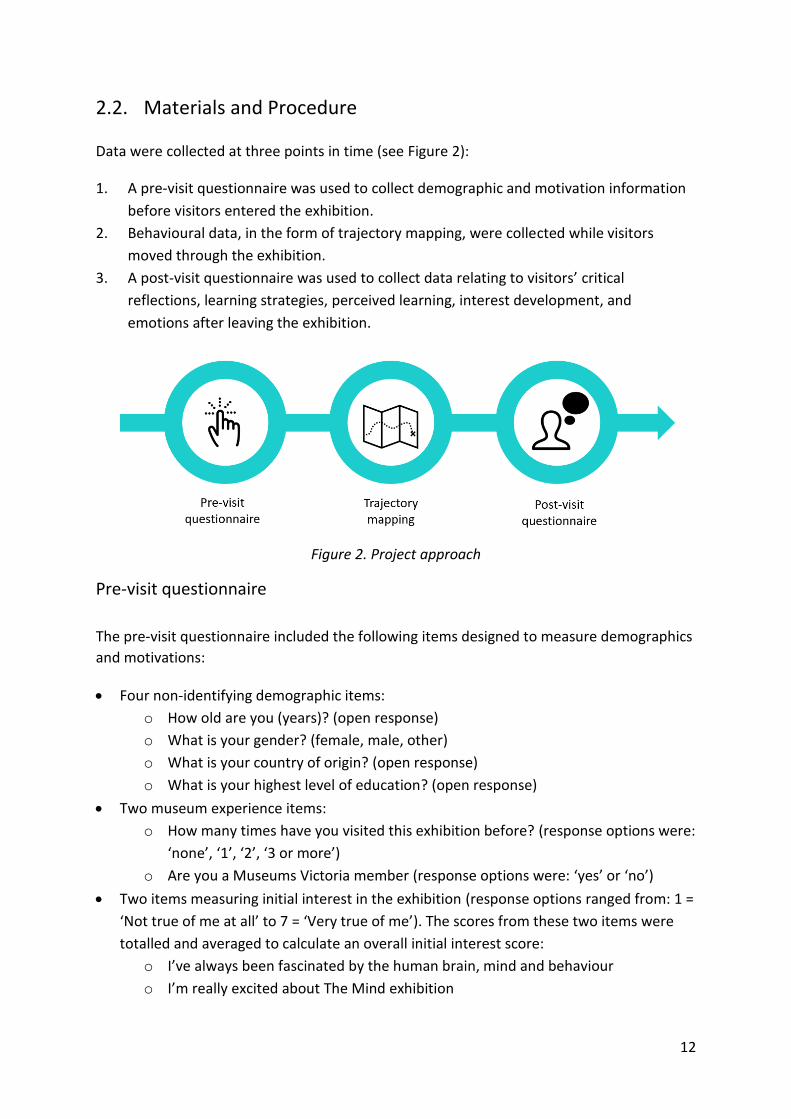
Data were collected at three points in time (see Figure 2):
1. A pre-visit questionnaire was used to collect demographic and motivation information
before visitors entered the exhibition.
2. Behavioural data, in the form of trajectory mapping, were collected while visitors
moved through the exhibition.
3. A post-visit questionnaire was used to collect data relating to visitors’ critical
reflections, learning strategies, perceived learning, interest development, and
emotions after leaving the exhibition.
Figure 2. Project approach
Pre-visit questionnaire
The pre-visit questionnaire included the following items designed to measure demographics
and motivations:
Four non-identifying demographic items:
o How old are you (years)? (open response)
o What is your gender? (female, male, other)
o What is your country of origin? (open response)
o What is your highest level of education? (open response)
Two museum experience items:
o How many times have you visited this exhibition before? (response options were:
‘none’, ‘1’, ‘2’, ‘3 or more’)
o Are you a Museums Victoria member (response options were: ‘yes’ or ‘no’)
Two items measuring initial interest in the exhibition (response options ranged from: 1 =
‘Not true of me at all’ to 7 = ‘Very true of me’). The scores from these two items were
totalled and averaged to calculate an overall initial interest score:
o I’ve always been fascinated by the human brain, mind and behaviour
o I’m really excited about The Mind exhibition
13
Four items measuring learning goals (response options ranged from: 1 = ‘Not true of me
at all’ to 7 = ‘Very true of me’):
o My aim is to learn as much as I can from this exhibition [mastery goals]
o My aim is to learn more than other the topics in this exhibition than other people
[performance goals]
o My aim is to have fun in this exhibition [hedonic goals]
o My aim is to spend some time with my family, friends and others [social goals]
Trajectory mapping
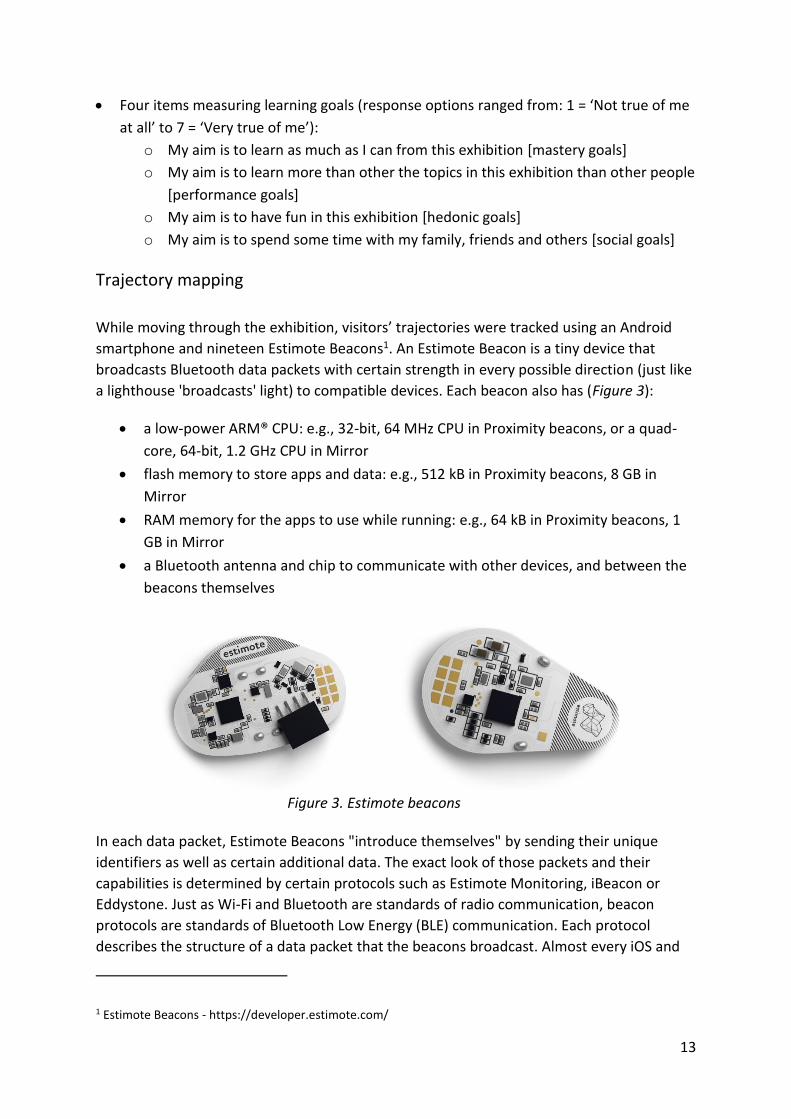
While moving through the exhibition, visitors’ trajectories were tracked using an Android
smartphone and nineteen Estimote Beacons1. An Estimote Beacon is a tiny device that
broadcasts Bluetooth data packets with certain strength in every possible direction (just like
a lighthouse 'broadcasts' light) to compatible devices. Each beacon also has (Figure 3):
a low-power ARM® CPU: e.g., 32-bit, 64 MHz CPU in Proximity beacons, or a quad-
core, 64-bit, 1.2 GHz CPU in Mirror
flash memory to store apps and data: e.g., 512 kB in Proximity beacons, 8 GB in
Mirror
RAM memory for the apps to use while running: e.g., 64 kB in Proximity beacons, 1
GB in Mirror
a Bluetooth antenna and chip to communicate with other devices, and between the
beacons themselves
Figure 3. Estimote beacons
In each data packet, Estimote Beacons "introduce themselves" by sending their unique
identifiers as well as certain additional data. The exact look of those packets and their
capabilities is determined by certain protocols such as Estimote Monitoring, iBeacon or
Eddystone. Just as Wi-Fi and Bluetooth are standards of radio communication, beacon
protocols are standards of Bluetooth Low Energy (BLE) communication. Each protocol
describes the structure of a data packet that the beacons broadcast. Almost every iOS and
1 Estimote Beacons - https://developer.estimote.com/
14
Android Bluetooth-enabled device is compatible with each of these protocols, and they do
not need to be paired to communicate.
In this project, we adopted the Estimote Monitoring protocol and had to develop an
Android mobile app in order to understand the data packets broadcasted by the beacons on
that protocol2. The moment a packet arrives to the corresponding app, the app logs
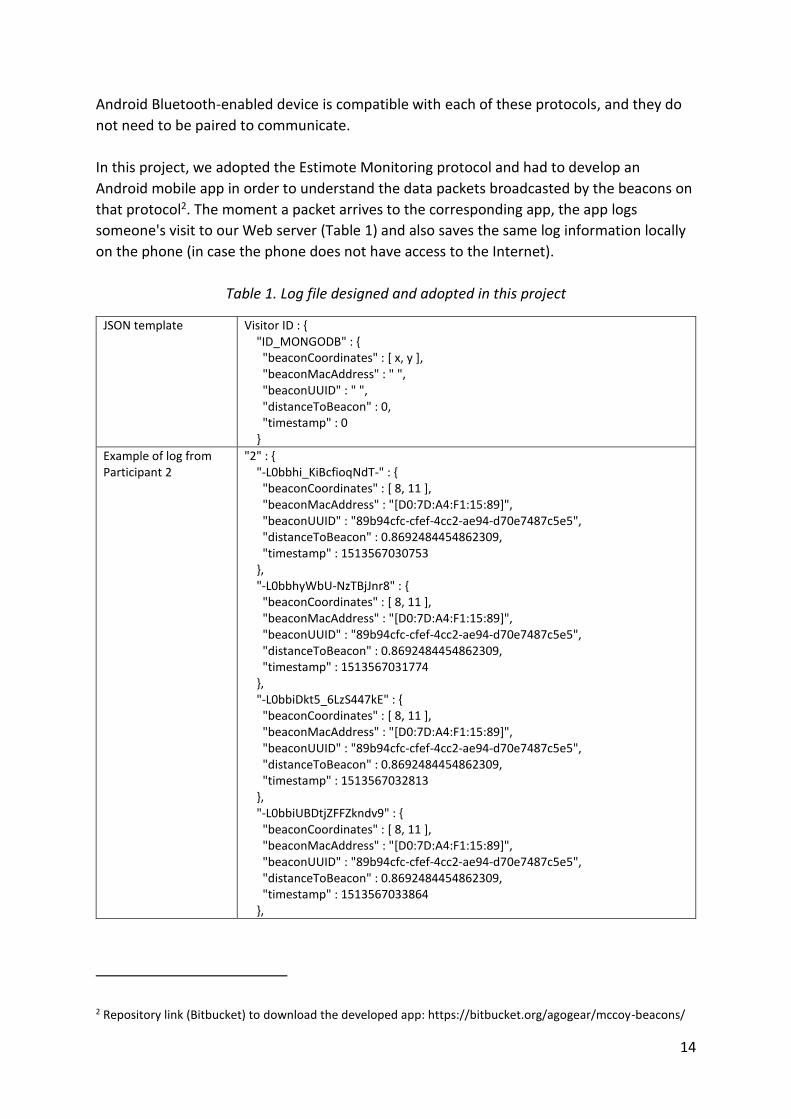
someone's visit to our Web server (Table 1) and also saves the same log information locally
on the phone (in case the phone does not have access to the Internet).
Table 1. Log file designed and adopted in this project
JSON template Visitor ID : { "ID_MONGODB" : { "beaconCoordinates" : [ x, y ], "beaconMacAddress" : " ", "beaconUUID" : " ", "distanceToBeacon" : 0, "timestamp" : 0 }
Example of log from Participant 2
"2" : { "-L0bbhi_KiBcfioqNdT-" : { "beaconCoordinates" : [ 8, 11 ], "beaconMacAddress" : "[D0:7D:A4:F1:15:89]", "beaconUUID" : "89b94cfc-cfef-4cc2-ae94-d70e7487c5e5", "distanceToBeacon" : 0.8692484454862309, "timestamp" : 1513567030753 }, "-L0bbhyWbU-NzTBjJnr8" : { "beaconCoordinates" : [ 8, 11 ], "beaconMacAddress" : "[D0:7D:A4:F1:15:89]", "beaconUUID" : "89b94cfc-cfef-4cc2-ae94-d70e7487c5e5", "distanceToBeacon" : 0.8692484454862309, "timestamp" : 1513567031774 }, "-L0bbiDkt5_6LzS447kE" : { "beaconCoordinates" : [ 8, 11 ], "beaconMacAddress" : "[D0:7D:A4:F1:15:89]", "beaconUUID" : "89b94cfc-cfef-4cc2-ae94-d70e7487c5e5", "distanceToBeacon" : 0.8692484454862309, "timestamp" : 1513567032813 }, "-L0bbiUBDtjZFFZkndv9" : { "beaconCoordinates" : [ 8, 11 ], "beaconMacAddress" : "[D0:7D:A4:F1:15:89]", "beaconUUID" : "89b94cfc-cfef-4cc2-ae94-d70e7487c5e5", "distanceToBeacon" : 0.8692484454862309, "timestamp" : 1513567033864 },
2 Repository link (Bitbucket) to download the developed app: https://bitbucket.org/agogear/mccoy-beacons/
15
Although this might seem like many steps to perform a simple action, all of them are
undertaken almost instantly. In addition to the Internet connection and the local persistency
of data on the phones, Bluetooth needs to be enabled on the user's device in order to
receive the data packets in the first place.
Trajectory data in this report focuses on time spent near a beacon, number of visits to a
beacon, and the sequence of beacon visitation. Time spent near a beacon was calculated by
aggregating the total amount of time visitors spent within a 1 metre range of a beacon. The
range could vary from a few centimetres to 200 meters (650 feet). Before defining our range
as 1 metre, several tests were performed at The Mind exhibition in order to manage the
beacons’ signal overlaps and to guarantee we were covering the whole exhibition space.
The beacons were also set up to send data packets every 100ms. A visit to a beacon
represents a period of time in which a visitor spent more than 5 seconds within the beacon
range, without moving to another beacon range. Sequence represents the order of
visitation for all beacons in the exhibition.
After developing the Android App that would communicate to the beacons, the Bluetooth
devices were attached to The Mind exhibition walls, positioned at key points throughout the
exhibition (see Figure 4). The beacons were powered using a single replaceable lithium
primary cell battery (CR2477 – 3.0V) that lasts from 5 to 7 years.
Due to the lack of Internet during our first trials, the trajectory data from 35 participants
could not be synchronized to our server and were lost. After that, our Android App was
updated to keep a copy of the log files on the phones, so we could store the data from the
remaining 81 participants with no errors.
16
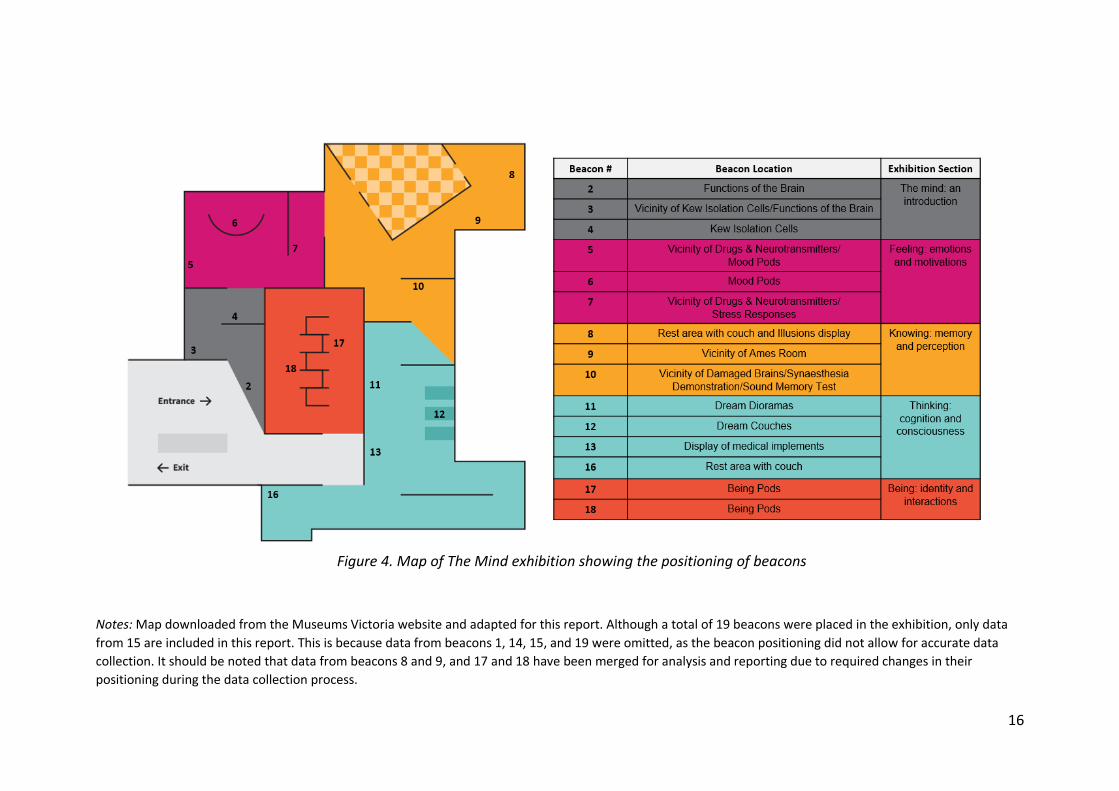
Figure 4. Map of The Mind exhibition showing the positioning of beacons
Notes: Map downloaded from the Museums Victoria website and adapted for this report. Although a total of 19 beacons were placed in the exhibition, only data
from 15 are included in this report. This is because data from beacons 1, 14, 15, and 19 were omitted, as the beacon positioning did not allow for accurate data
collection. It should be noted that data from beacons 8 and 9, and 17 and 18 have been merged for analysis and reporting due to required changes in their
positioning during the data collection process.
17
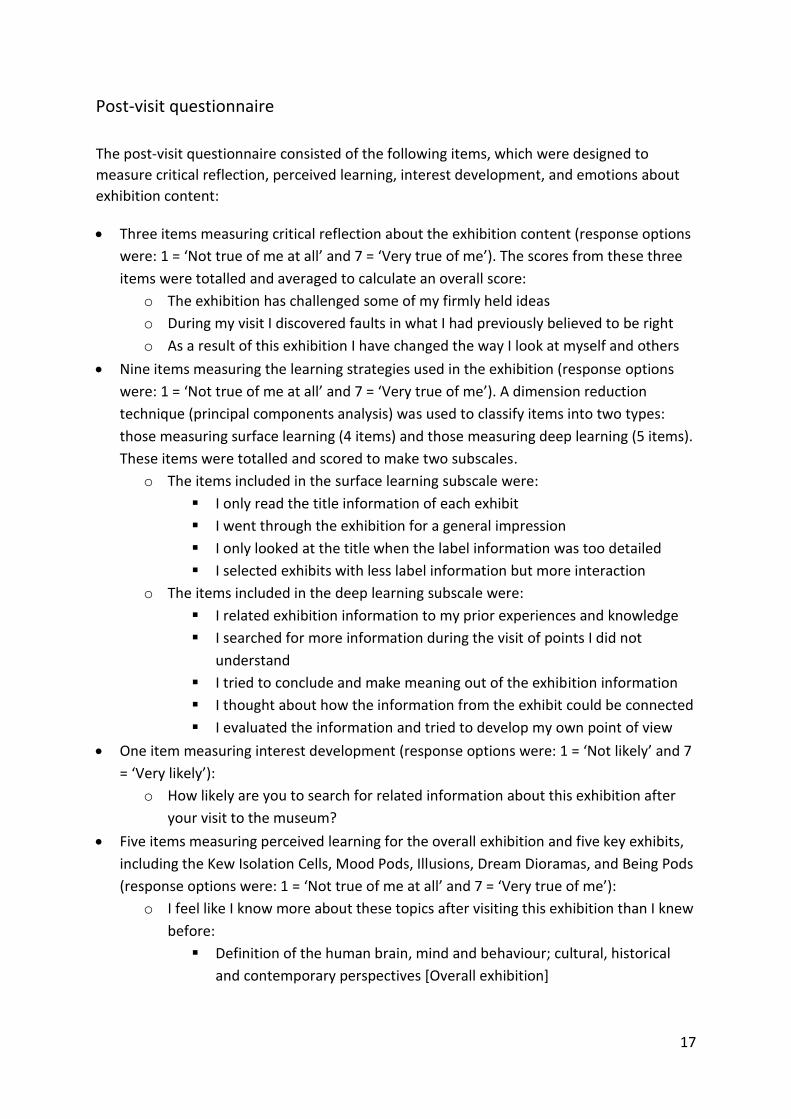
Post-visit questionnaire
The post-visit questionnaire consisted of the following items, which were designed to
measure critical reflection, perceived learning, interest development, and emotions about
exhibition content:
Three items measuring critical reflection about the exhibition content (response options
were: 1 = ‘Not true of me at all’ and 7 = ‘Very true of me’). The scores from these three
items were totalled and averaged to calculate an overall score:
o The exhibition has challenged some of my firmly held ideas
o During my visit I discovered faults in what I had previously believed to be right
o As a result of this exhibition I have changed the way I look at myself and others
Nine items measuring the learning strategies used in the exhibition (response options
were: 1 = ‘Not true of me at all’ and 7 = ‘Very true of me’). A dimension reduction
technique (principal components analysis) was used to classify items into two types:
those measuring surface learning (4 items) and those measuring deep learning (5 items).
These items were totalled and scored to make two subscales.
o The items included in the surface learning subscale were:
I only read the title information of each exhibit
I went through the exhibition for a general impression
I only looked at the title when the label information was too detailed
I selected exhibits with less label information but more interaction
o The items included in the deep learning subscale were:
I related exhibition information to my prior experiences and knowledge
I searched for more information during the visit of points I did not
understand
I tried to conclude and make meaning out of the exhibition information
I thought about how the information from the exhibit could be connected
I evaluated the information and tried to develop my own point of view
One item measuring interest development (response options were: 1 = ‘Not likely’ and 7
= ‘Very likely’):
o How likely are you to search for related information about this exhibition after
your visit to the museum?
Five items measuring perceived learning for the overall exhibition and five key exhibits,
including the Kew Isolation Cells, Mood Pods, Illusions, Dream Dioramas, and Being Pods
(response options were: 1 = ‘Not true of me at all’ and 7 = ‘Very true of me’):
o I feel like I know more about these topics after visiting this exhibition than I knew
before:
Definition of the human brain, mind and behaviour; cultural, historical
and contemporary perspectives [Overall exhibition]
18
Perceptions of reality, normal behaviour, sanity and insanity, institutions,
eugenics and issues of the past and present [Kew Isolation Cells]
Effects of the environment on emotions [Mood Pods]
Perception: visual, auditory, constructing a reality [Illusions]
States of consciousness: sleep, dreams, pain, hypnosis, meditation
[Dream Dioramas]
“Being” disorders: autism, personality disorders, antisocial behaviour
[Being pods]
Six items measuring emotional responses for the overall exhibition and the five key
exhibits (Kew Isolation Cells, Mood Pods, Illusions, Dream Dioramas, Being Pods):
o How did specific exhibits make you feel? Select as many as apply. Leave blank if
exhibit was not visited (response options were: ‘excited’, ‘curious’, ‘concerned’,
‘safe’, and ‘uncomfortable’)
19
3. Project findings
3.1. Motivations
The results presented in this section come from the pre-visit questionnaire, and are based
on the full sample of 116 visitors.
What was the level of visitors’ initial interest in the content of The Mind
exhibition?
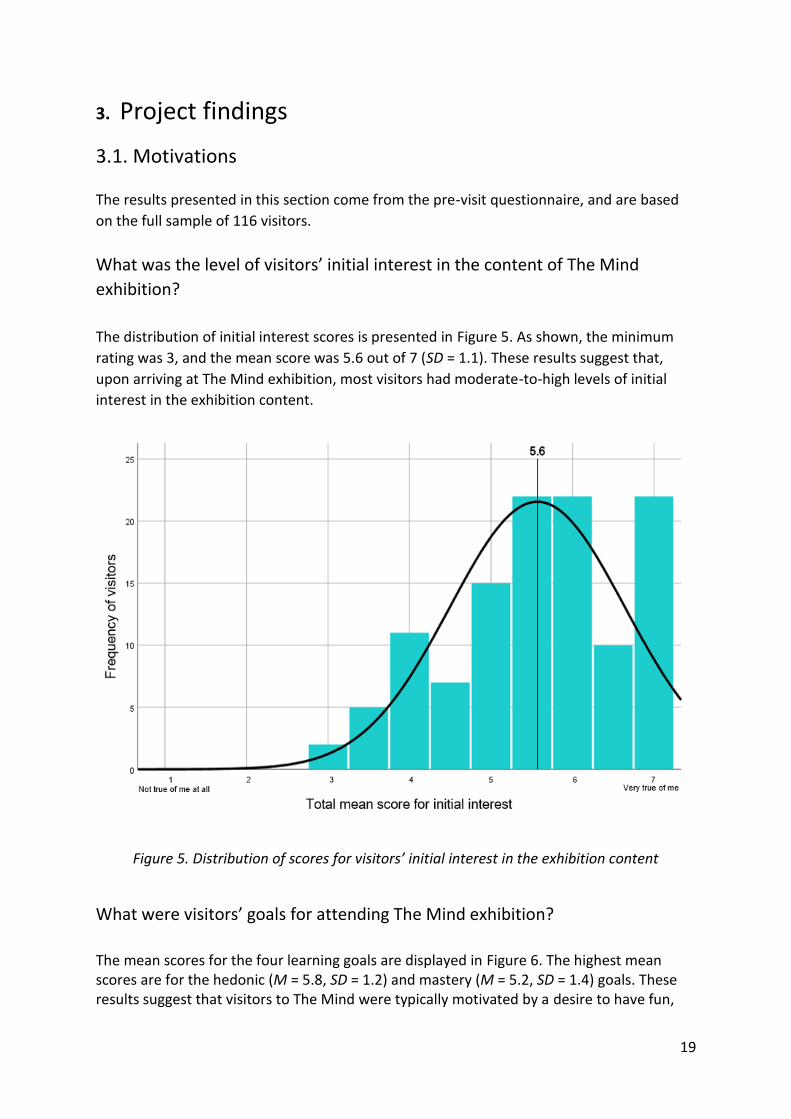
The distribution of initial interest scores is presented in Figure 5. As shown, the minimum
rating was 3, and the mean score was 5.6 out of 7 (SD = 1.1). These results suggest that,
upon arriving at The Mind exhibition, most visitors had moderate-to-high levels of initial
interest in the exhibition content.
Figure 5. Distribution of scores for visitors’ initial interest in the exhibition content
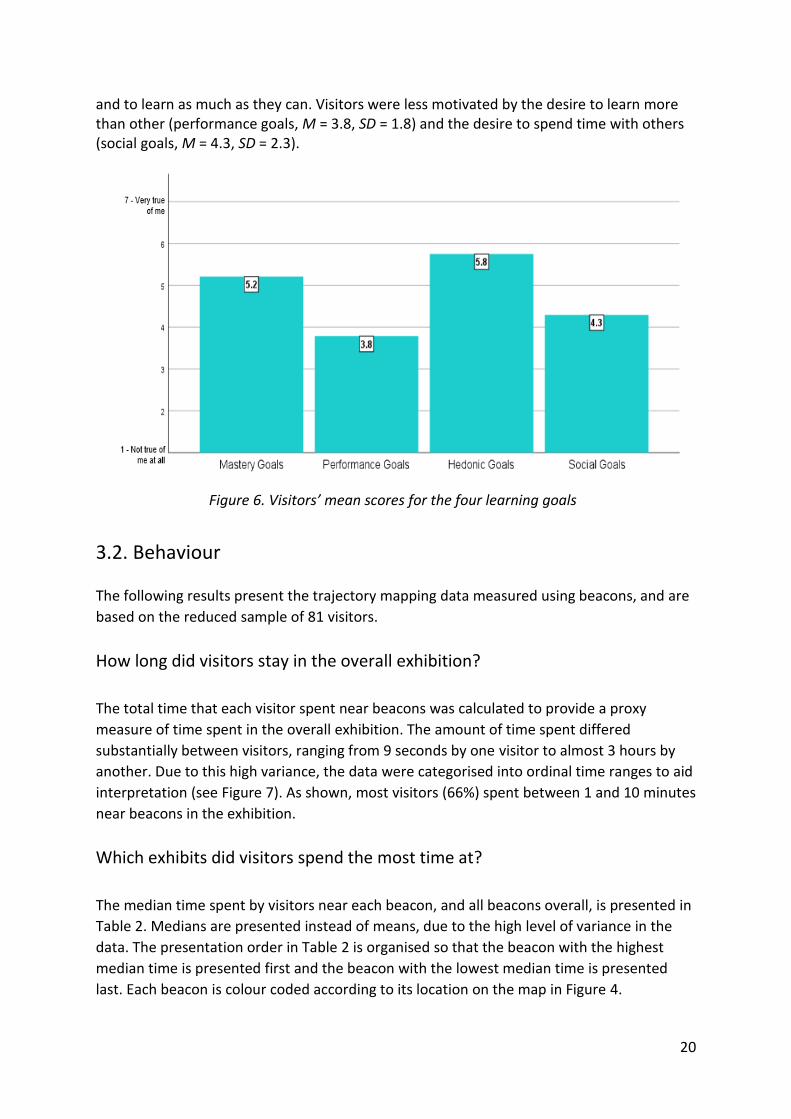
What were visitors’ goals for attending The Mind exhibition?
The mean scores for the four learning goals are displayed in Figure 6. The highest mean scores are for the hedonic (M = 5.8, SD = 1.2) and mastery (M = 5.2, SD = 1.4) goals. These results suggest that visitors to The Mind were typically motivated by a desire to have fun,
20
and to learn as much as they can. Visitors were less motivated by the desire to learn more than other (performance goals, M = 3.8, SD = 1.8) and the desire to spend time with others (social goals, M = 4.3, SD = 2.3).
3.2. Behaviour
The following results present the trajectory mapping data measured using beacons, and are
based on the reduced sample of 81 visitors.
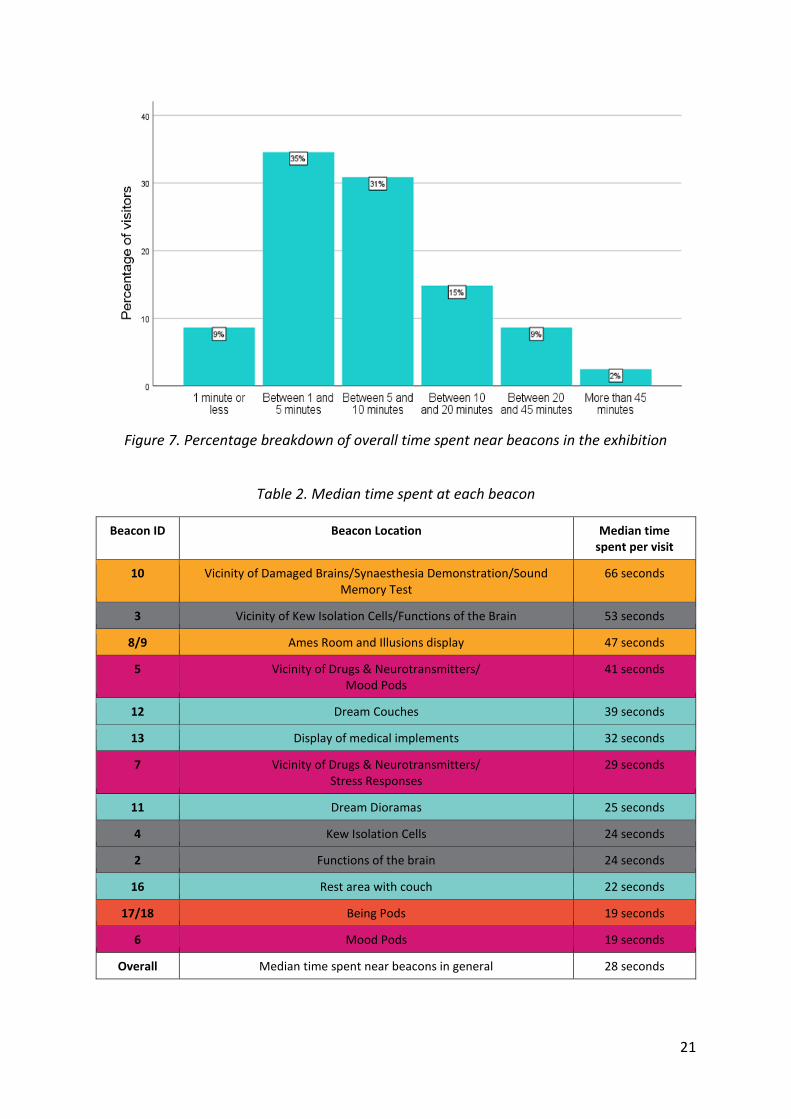
How long did visitors stay in the overall exhibition?
The total time that each visitor spent near beacons was calculated to provide a proxy
measure of time spent in the overall exhibition. The amount of time spent differed
substantially between visitors, ranging from 9 seconds by one visitor to almost 3 hours by
another. Due to this high variance, the data were categorised into ordinal time ranges to aid
interpretation (see Figure 7). As shown, most visitors (66%) spent between 1 and 10 minutes
near beacons in the exhibition.
Which exhibits did visitors spend the most time at?
The median time spent by visitors near each beacon, and all beacons overall, is presented in
Table 2. Medians are presented instead of means, due to the high level of variance in the
data. The presentation order in Table 2 is organised so that the beacon with the highest
median time is presented first and the beacon with the lowest median time is presented
last. Each beacon is colour coded according to its location on the map in Figure 4.
Figure 6. Visitors’ mean scores for the four learning goals
21
Figure 7. Percentage breakdown of overall time spent near beacons in the exhibition
Table 2. Median time spent at each beacon
Beacon ID Beacon Location Median time spent per visit
10 Vicinity of Damaged Brains/Synaesthesia Demonstration/Sound Memory Test
66 seconds
3 Vicinity of Kew Isolation Cells/Functions of the Brain 53 seconds
8/9 Ames Room and Illusions display 47 seconds
5 Vicinity of Drugs & Neurotransmitters/ Mood Pods
41 seconds
12 Dream Couches 39 seconds
13 Display of medical implements 32 seconds
7 Vicinity of Drugs & Neurotransmitters/ Stress Responses
29 seconds
11 Dream Dioramas 25 seconds
4 Kew Isolation Cells 24 seconds
2 Functions of the brain 24 seconds
16 Rest area with couch 22 seconds
17/18 Being Pods 19 seconds
6 Mood Pods 19 seconds
Overall Median time spent near beacons in general 28 seconds
22
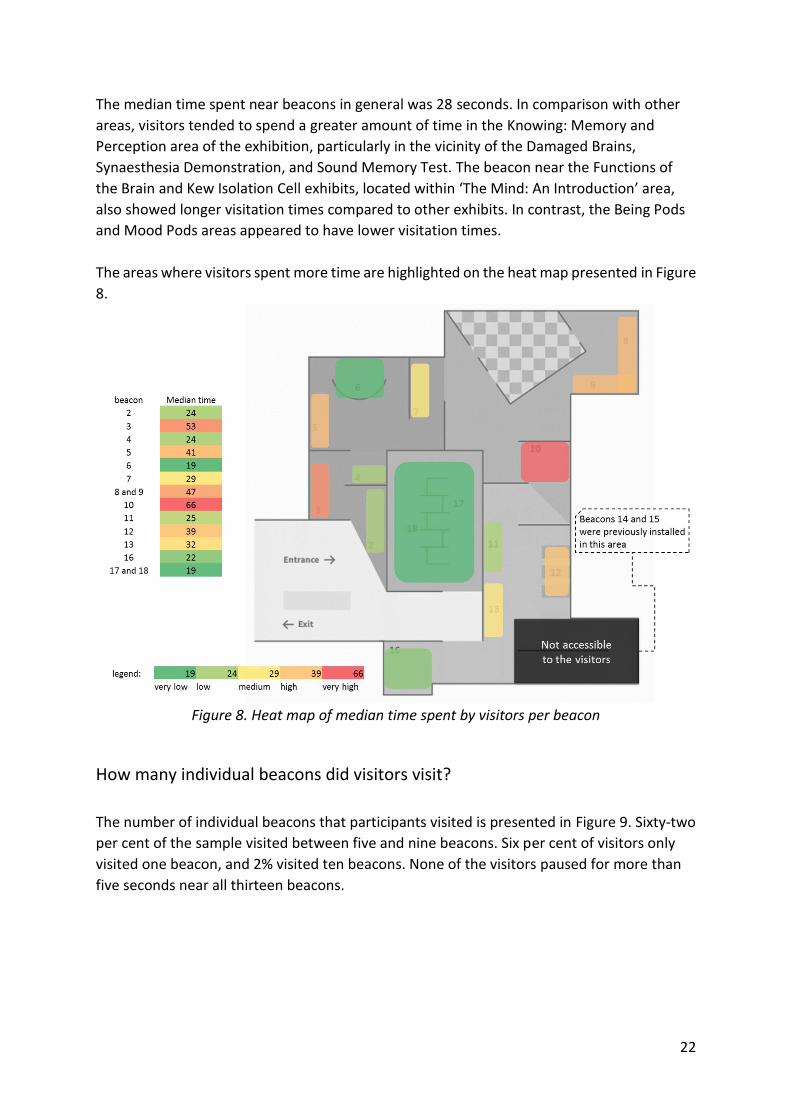
The median time spent near beacons in general was 28 seconds. In comparison with other
areas, visitors tended to spend a greater amount of time in the Knowing: Memory and
Perception area of the exhibition, particularly in the vicinity of the Damaged Brains,
Synaesthesia Demonstration, and Sound Memory Test. The beacon near the Functions of
the Brain and Kew Isolation Cell exhibits, located within ‘The Mind: An Introduction’ area,
also showed longer visitation times compared to other exhibits. In contrast, the Being Pods
and Mood Pods areas appeared to have lower visitation times.
The areas where visitors spent more time are highlighted on the heat map presented in Figure
8.
Figure 8. Heat map of median time spent by visitors per beacon
How many individual beacons did visitors visit?
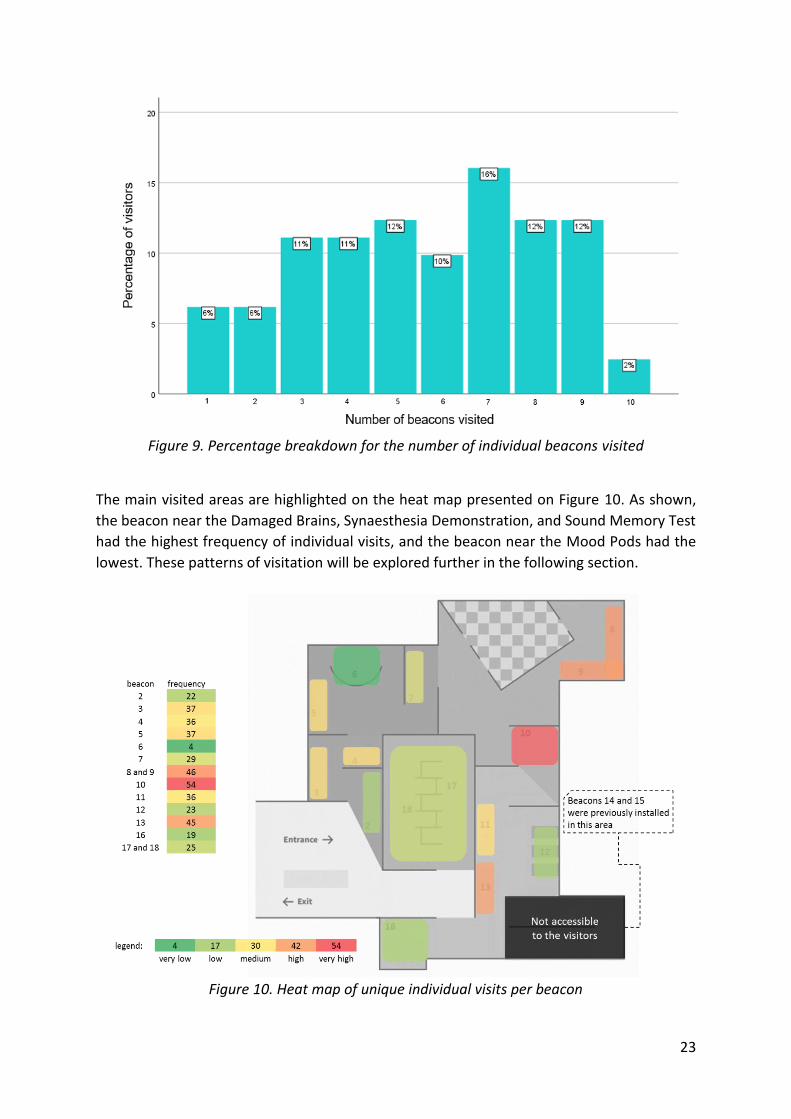
The number of individual beacons that participants visited is presented in Figure 9. Sixty-two
per cent of the sample visited between five and nine beacons. Six per cent of visitors only
visited one beacon, and 2% visited ten beacons. None of the visitors paused for more than
five seconds near all thirteen beacons.
23
Figure 9. Percentage breakdown for the number of individual beacons visited
The main visited areas are highlighted on the heat map presented on Figure 10. As shown,
the beacon near the Damaged Brains, Synaesthesia Demonstration, and Sound Memory Test
had the highest frequency of individual visits, and the beacon near the Mood Pods had the
lowest. These patterns of visitation will be explored further in the following section.
Figure 10. Heat map of unique individual visits per beacon
24
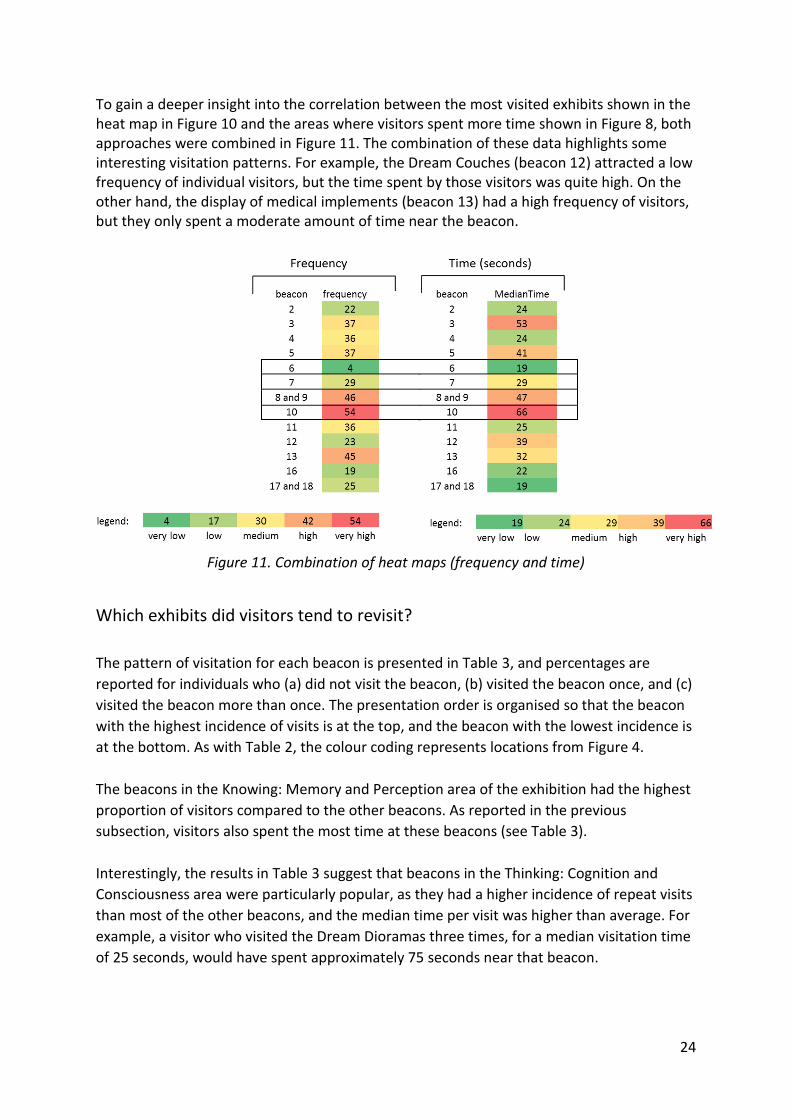
To gain a deeper insight into the correlation between the most visited exhibits shown in the heat map in Figure 10 and the areas where visitors spent more time shown in Figure 8, both approaches were combined in Figure 11. The combination of these data highlights some interesting visitation patterns. For example, the Dream Couches (beacon 12) attracted a low frequency of individual visitors, but the time spent by those visitors was quite high. On the other hand, the display of medical implements (beacon 13) had a high frequency of visitors, but they only spent a moderate amount of time near the beacon.
Figure 11. Combination of heat maps (frequency and time)
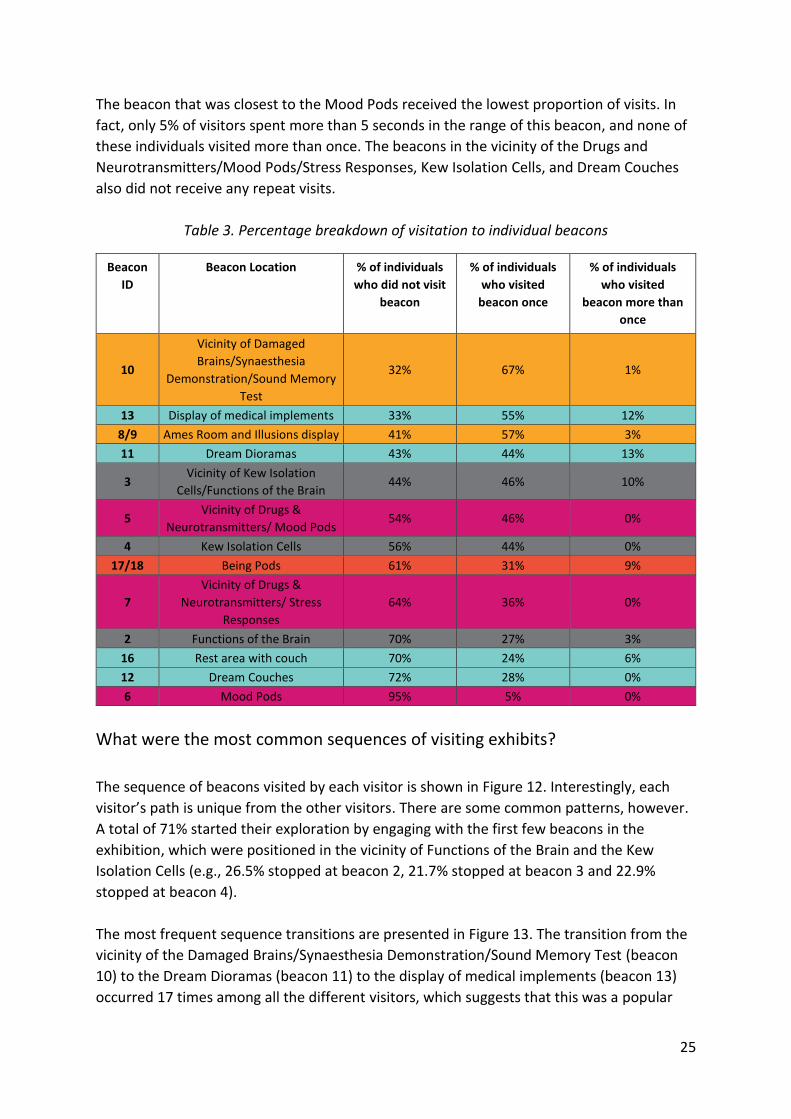
Which exhibits did visitors tend to revisit?
The pattern of visitation for each beacon is presented in Table 3, and percentages are
reported for individuals who (a) did not visit the beacon, (b) visited the beacon once, and (c)
visited the beacon more than once. The presentation order is organised so that the beacon
with the highest incidence of visits is at the top, and the beacon with the lowest incidence is
at the bottom. As with Table 2, the colour coding represents locations from Figure 4.
The beacons in the Knowing: Memory and Perception area of the exhibition had the highest
proportion of visitors compared to the other beacons. As reported in the previous
subsection, visitors also spent the most time at these beacons (see Table 3).
Interestingly, the results in Table 3 suggest that beacons in the Thinking: Cognition and
Consciousness area were particularly popular, as they had a higher incidence of repeat visits
than most of the other beacons, and the median time per visit was higher than average. For
example, a visitor who visited the Dream Dioramas three times, for a median visitation time
of 25 seconds, would have spent approximately 75 seconds near that beacon.
25
The beacon that was closest to the Mood Pods received the lowest proportion of visits. In
fact, only 5% of visitors spent more than 5 seconds in the range of this beacon, and none of
these individuals visited more than once. The beacons in the vicinity of the Drugs and
Neurotransmitters/Mood Pods/Stress Responses, Kew Isolation Cells, and Dream Couches
also did not receive any repeat visits.
Table 3. Percentage breakdown of visitation to individual beacons
Beacon
ID
Beacon Location % of individuals
who did not visit
beacon
% of individuals
who visited
beacon once
% of individuals
who visited
beacon more than
once
10
Vicinity of Damaged
Brains/Synaesthesia
Demonstration/Sound Memory
Test
32% 67% 1%
13 Display of medical implements 33% 55% 12%
8/9 Ames Room and Illusions display 41% 57% 3%
11 Dream Dioramas 43% 44% 13%
3 Vicinity of Kew Isolation
Cells/Functions of the Brain 44% 46% 10%
5 Vicinity of Drugs &
Neurotransmitters/ Mood Pods 54% 46% 0%
4 Kew Isolation Cells 56% 44% 0%
17/18 Being Pods 61% 31% 9%
7
Vicinity of Drugs &
Neurotransmitters/ Stress
Responses
64% 36% 0%
2 Functions of the Brain 70% 27% 3%
16 Rest area with couch 70% 24% 6%
12 Dream Couches 72% 28% 0%
6 Mood Pods 95% 5% 0%
What were the most common sequences of visiting exhibits?
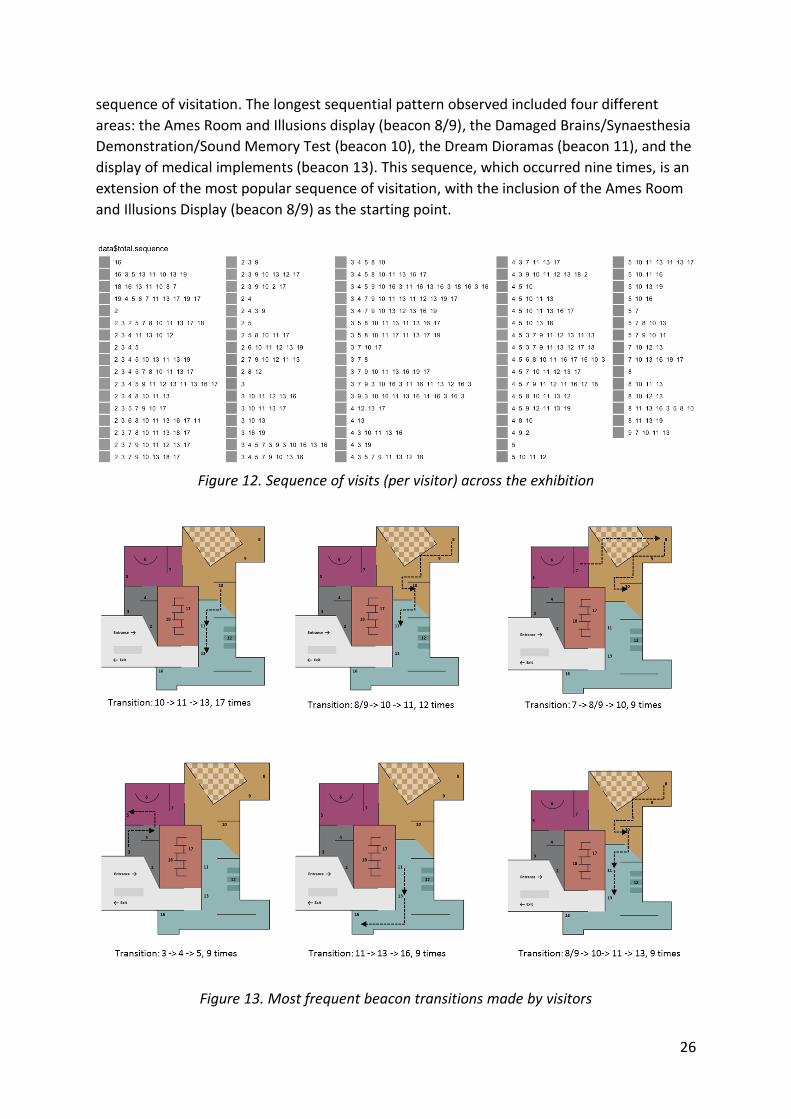
The sequence of beacons visited by each visitor is shown in Figure 12. Interestingly, each
visitor’s path is unique from the other visitors. There are some common patterns, however.
A total of 71% started their exploration by engaging with the first few beacons in the
exhibition, which were positioned in the vicinity of Functions of the Brain and the Kew
Isolation Cells (e.g., 26.5% stopped at beacon 2, 21.7% stopped at beacon 3 and 22.9%
stopped at beacon 4).
The most frequent sequence transitions are presented in Figure 13. The transition from the
vicinity of the Damaged Brains/Synaesthesia Demonstration/Sound Memory Test (beacon
10) to the Dream Dioramas (beacon 11) to the display of medical implements (beacon 13)
occurred 17 times among all the different visitors, which suggests that this was a popular
26
sequence of visitation. The longest sequential pattern observed included four different
areas: the Ames Room and Illusions display (beacon 8/9), the Damaged Brains/Synaesthesia
Demonstration/Sound Memory Test (beacon 10), the Dream Dioramas (beacon 11), and the
display of medical implements (beacon 13). This sequence, which occurred nine times, is an
extension of the most popular sequence of visitation, with the inclusion of the Ames Room
and Illusions Display (beacon 8/9) as the starting point.
Figure 12. Sequence of visits (per visitor) across the exhibition
Figure 13. Most frequent beacon transitions made by visitors
27
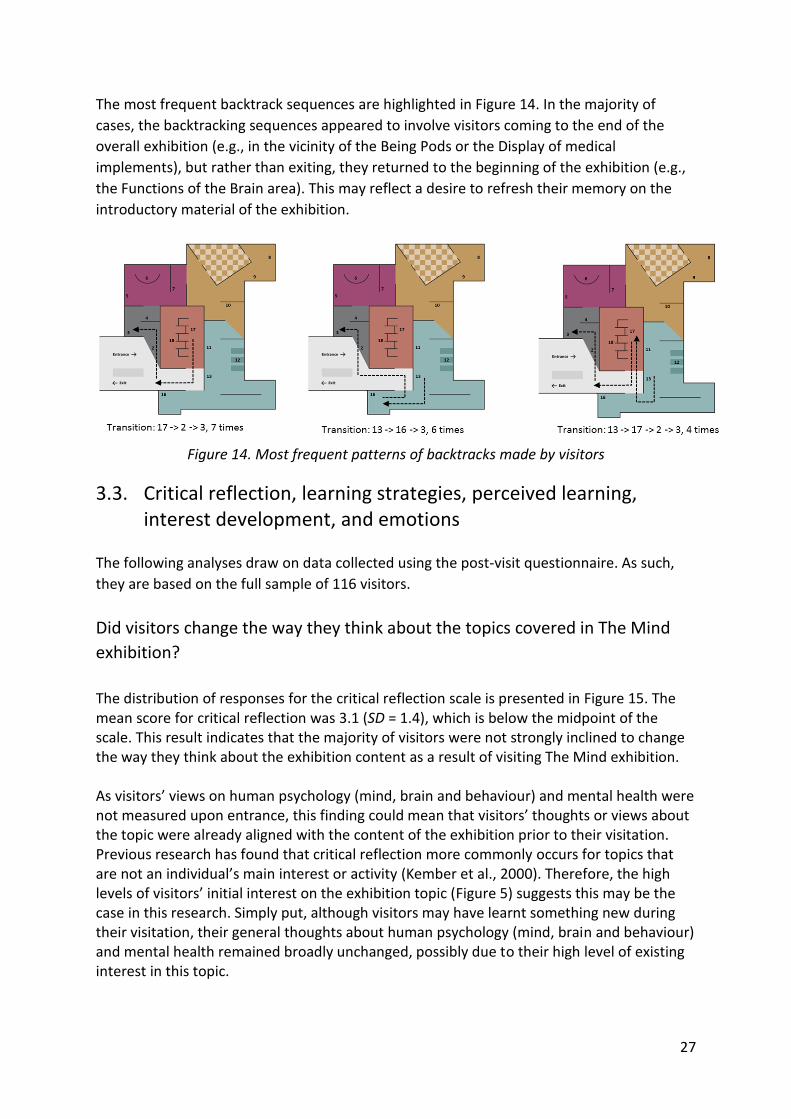
The most frequent backtrack sequences are highlighted in Figure 14. In the majority of
cases, the backtracking sequences appeared to involve visitors coming to the end of the
overall exhibition (e.g., in the vicinity of the Being Pods or the Display of medical
implements), but rather than exiting, they returned to the beginning of the exhibition (e.g.,
the Functions of the Brain area). This may reflect a desire to refresh their memory on the
introductory material of the exhibition.
Figure 14. Most frequent patterns of backtracks made by visitors
3.3. Critical reflection, learning strategies, perceived learning, interest development, and emotions
The following analyses draw on data collected using the post-visit questionnaire. As such,
they are based on the full sample of 116 visitors.
Did visitors change the way they think about the topics covered in The Mind
exhibition?
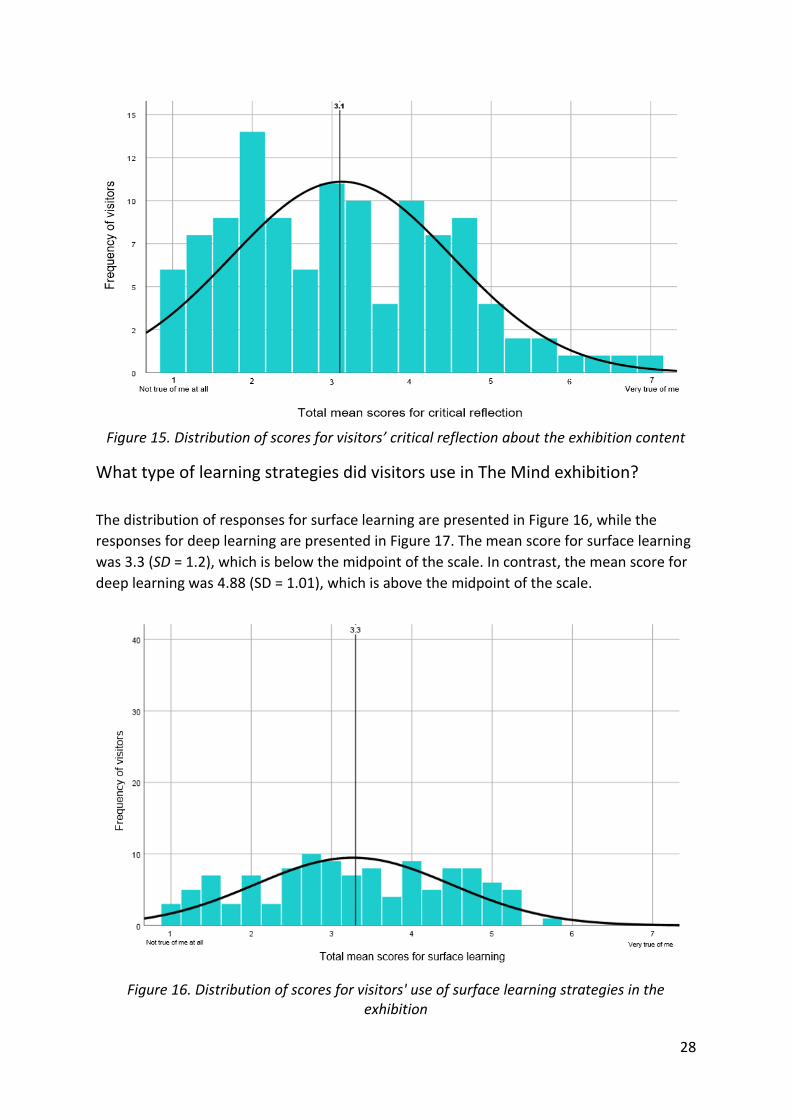
The distribution of responses for the critical reflection scale is presented in Figure 15. The mean score for critical reflection was 3.1 (SD = 1.4), which is below the midpoint of the scale. This result indicates that the majority of visitors were not strongly inclined to change the way they think about the exhibition content as a result of visiting The Mind exhibition. As visitors’ views on human psychology (mind, brain and behaviour) and mental health were not measured upon entrance, this finding could mean that visitors’ thoughts or views about the topic were already aligned with the content of the exhibition prior to their visitation. Previous research has found that critical reflection more commonly occurs for topics that are not an individual’s main interest or activity (Kember et al., 2000). Therefore, the high levels of visitors’ initial interest on the exhibition topic (Figure 5) suggests this may be the case in this research. Simply put, although visitors may have learnt something new during their visitation, their general thoughts about human psychology (mind, brain and behaviour) and mental health remained broadly unchanged, possibly due to their high level of existing interest in this topic.
28
Figure 15. Distribution of scores for visitors’ critical reflection about the exhibition content
What type of learning strategies did visitors use in The Mind exhibition?
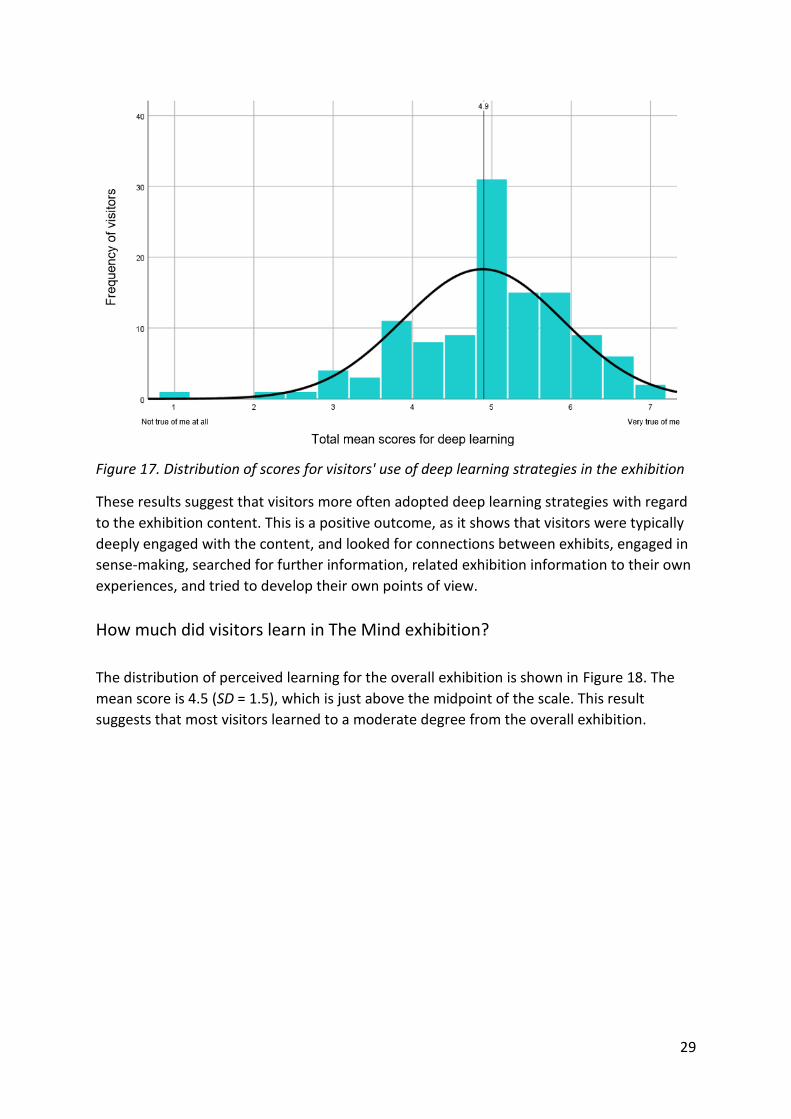
The distribution of responses for surface learning are presented in Figure 16, while the
responses for deep learning are presented in Figure 17. The mean score for surface learning
was 3.3 (SD = 1.2), which is below the midpoint of the scale. In contrast, the mean score for
deep learning was 4.88 (SD = 1.01), which is above the midpoint of the scale.
Figure 16. Distribution of scores for visitors' use of surface learning strategies in the
exhibition
29
Figure 17. Distribution of scores for visitors' use of deep learning strategies in the exhibition
These results suggest that visitors more often adopted deep learning strategies with regard
to the exhibition content. This is a positive outcome, as it shows that visitors were typically
deeply engaged with the content, and looked for connections between exhibits, engaged in
sense-making, searched for further information, related exhibition information to their own
experiences, and tried to develop their own points of view.
How much did visitors learn in The Mind exhibition?
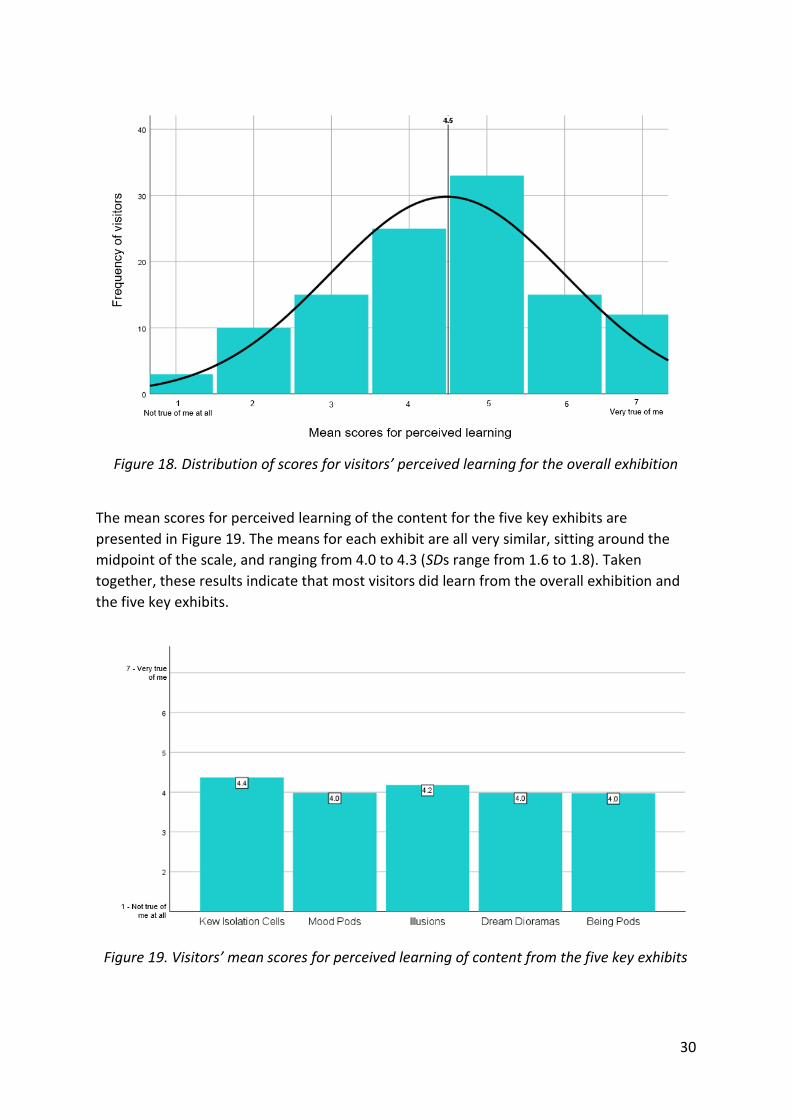
The distribution of perceived learning for the overall exhibition is shown in Figure 18. The
mean score is 4.5 (SD = 1.5), which is just above the midpoint of the scale. This result
suggests that most visitors learned to a moderate degree from the overall exhibition.
30
Figure 18. Distribution of scores for visitors’ perceived learning for the overall exhibition
The mean scores for perceived learning of the content for the five key exhibits are
presented in Figure 19. The means for each exhibit are all very similar, sitting around the
midpoint of the scale, and ranging from 4.0 to 4.3 (SDs range from 1.6 to 1.8). Taken
together, these results indicate that most visitors did learn from the overall exhibition and
the five key exhibits.
Figure 19. Visitors’ mean scores for perceived learning of content from the five key exhibits
31
How interested were visitors in learning more about the topics covered in The
Mind exhibition?
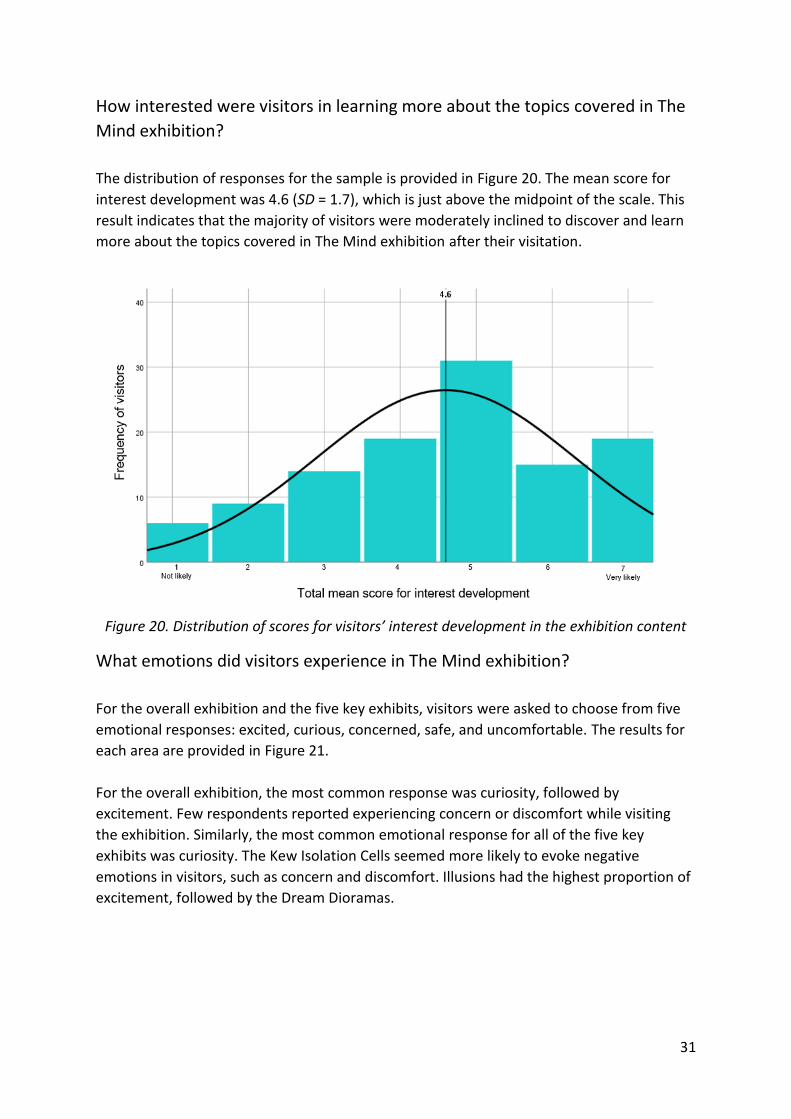
The distribution of responses for the sample is provided in Figure 20. The mean score for
interest development was 4.6 (SD = 1.7), which is just above the midpoint of the scale. This
result indicates that the majority of visitors were moderately inclined to discover and learn
more about the topics covered in The Mind exhibition after their visitation.
Figure 20. Distribution of scores for visitors’ interest development in the exhibition content
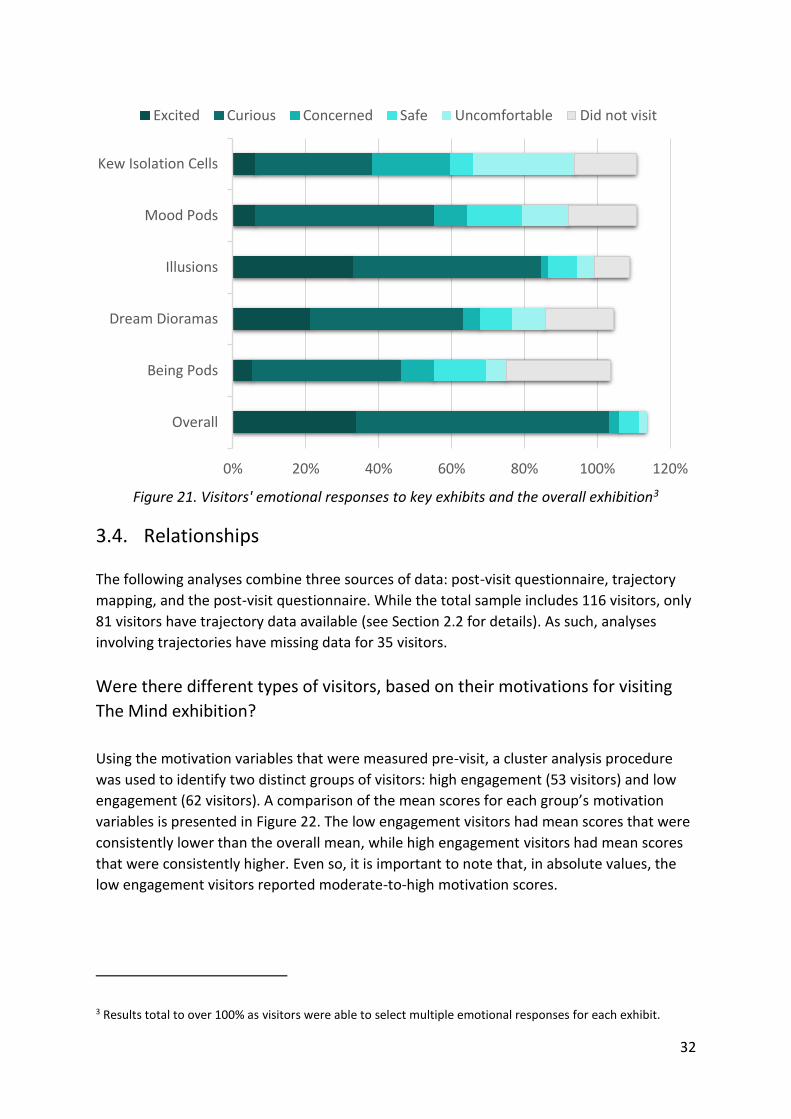
What emotions did visitors experience in The Mind exhibition?
For the overall exhibition and the five key exhibits, visitors were asked to choose from five
emotional responses: excited, curious, concerned, safe, and uncomfortable. The results for
each area are provided in Figure 21.
For the overall exhibition, the most common response was curiosity, followed by
excitement. Few respondents reported experiencing concern or discomfort while visiting
the exhibition. Similarly, the most common emotional response for all of the five key
exhibits was curiosity. The Kew Isolation Cells seemed more likely to evoke negative
emotions in visitors, such as concern and discomfort. Illusions had the highest proportion of
excitement, followed by the Dream Dioramas.
32
Figure 21. Visitors' emotional responses to key exhibits and the overall exhibition3
3.4. Relationships
The following analyses combine three sources of data: post-visit questionnaire, trajectory
mapping, and the post-visit questionnaire. While the total sample includes 116 visitors, only
81 visitors have trajectory data available (see Section 2.2 for details). As such, analyses
involving trajectories have missing data for 35 visitors.
Were there different types of visitors, based on their motivations for visiting
The Mind exhibition?
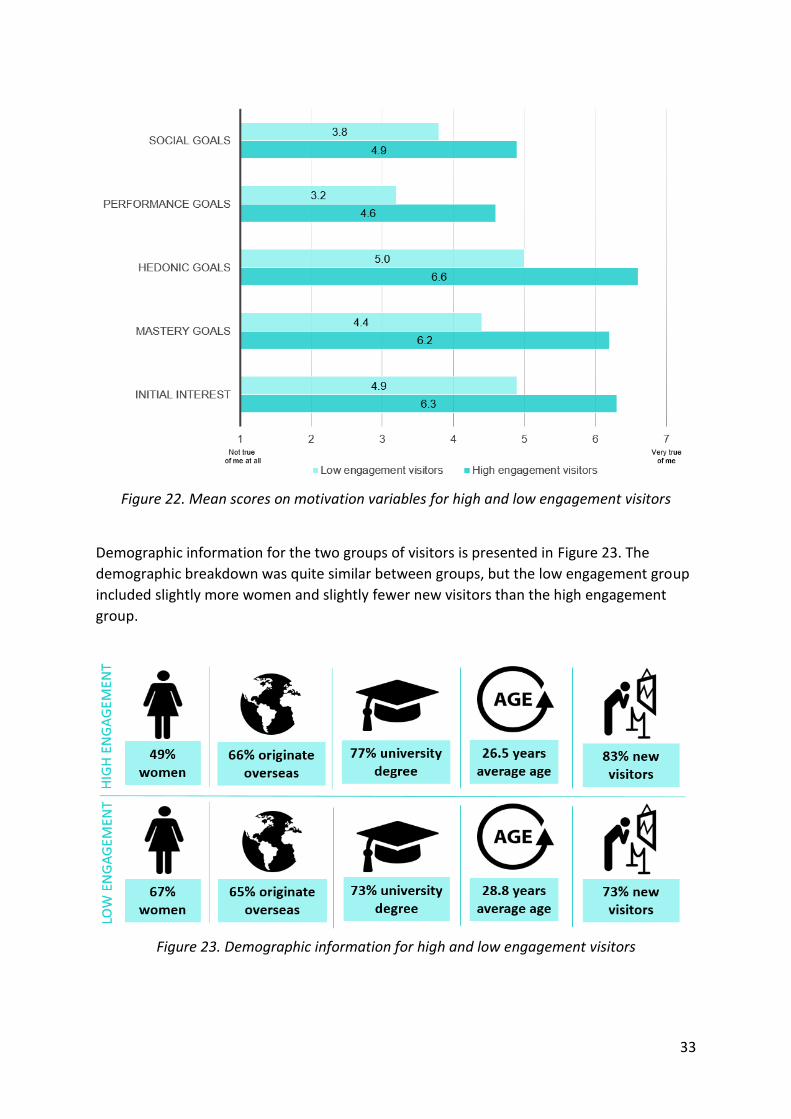
Using the motivation variables that were measured pre-visit, a cluster analysis procedure
was used to identify two distinct groups of visitors: high engagement (53 visitors) and low
engagement (62 visitors). A comparison of the mean scores for each group’s motivation
variables is presented in Figure 22. The low engagement visitors had mean scores that were
consistently lower than the overall mean, while high engagement visitors had mean scores
that were consistently higher. Even so, it is important to note that, in absolute values, the
low engagement visitors reported moderate-to-high motivation scores.
3 Results total to over 100% as visitors were able to select multiple emotional responses for each exhibit.
0% 20% 40% 60% 80% 100% 120%
Overall
Being Pods
Dream Dioramas
Illusions
Mood Pods
Kew Isolation Cells
Excited Curious Concerned Safe Uncomfortable Did not visit
33
Figure 22. Mean scores on motivation variables for high and low engagement visitors
Demographic information for the two groups of visitors is presented in Figure 23. The
demographic breakdown was quite similar between groups, but the low engagement group
included slightly more women and slightly fewer new visitors than the high engagement
group.
Figure 23. Demographic information for high and low engagement visitors
34
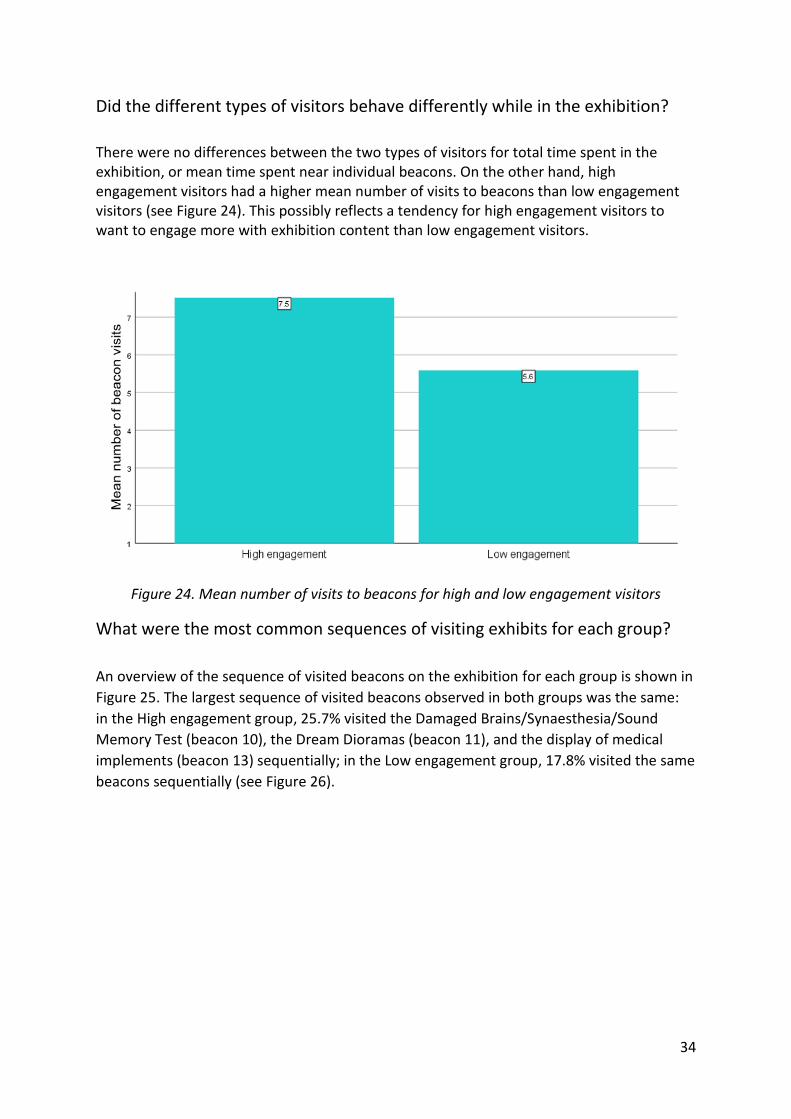
Did the different types of visitors behave differently while in the exhibition?
There were no differences between the two types of visitors for total time spent in the exhibition, or mean time spent near individual beacons. On the other hand, high engagement visitors had a higher mean number of visits to beacons than low engagement visitors (see Figure 24). This possibly reflects a tendency for high engagement visitors to want to engage more with exhibition content than low engagement visitors.
Figure 24. Mean number of visits to beacons for high and low engagement visitors
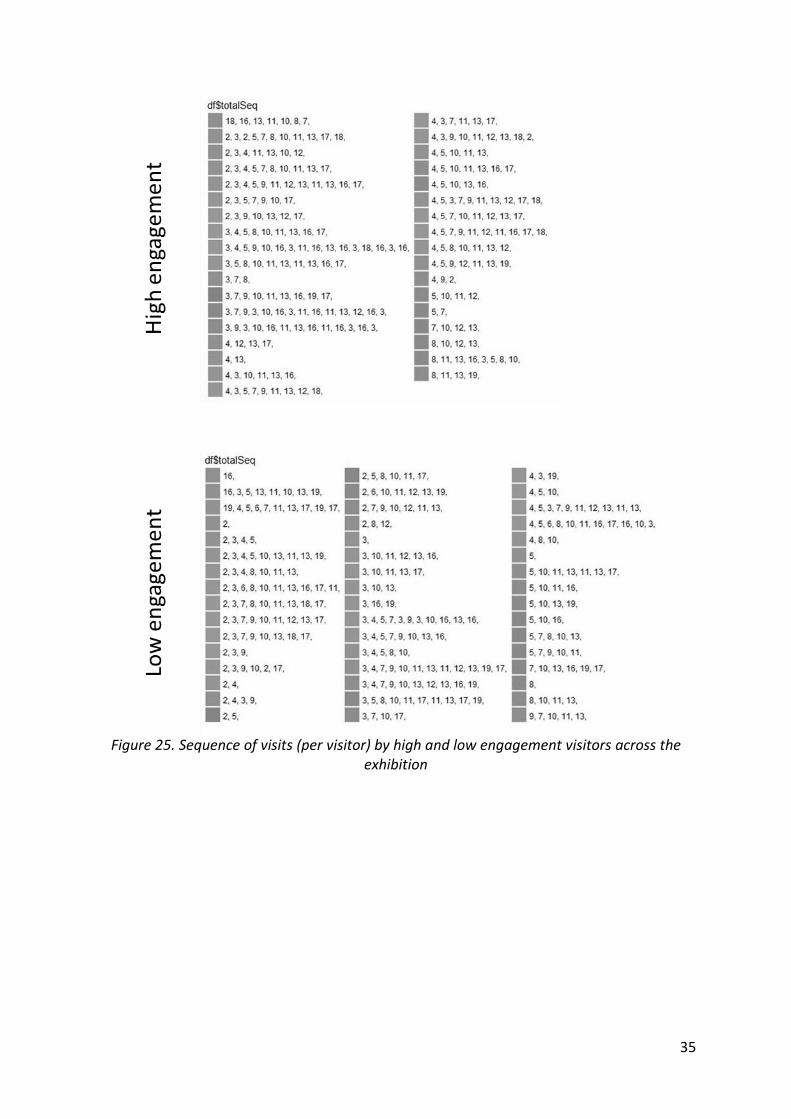
What were the most common sequences of visiting exhibits for each group?
An overview of the sequence of visited beacons on the exhibition for each group is shown in
Figure 25. The largest sequence of visited beacons observed in both groups was the same:
in the High engagement group, 25.7% visited the Damaged Brains/Synaesthesia/Sound
Memory Test (beacon 10), the Dream Dioramas (beacon 11), and the display of medical
implements (beacon 13) sequentially; in the Low engagement group, 17.8% visited the same
beacons sequentially (see Figure 26).
35
Figure 25. Sequence of visits (per visitor) by high and low engagement visitors across the
exhibition
36
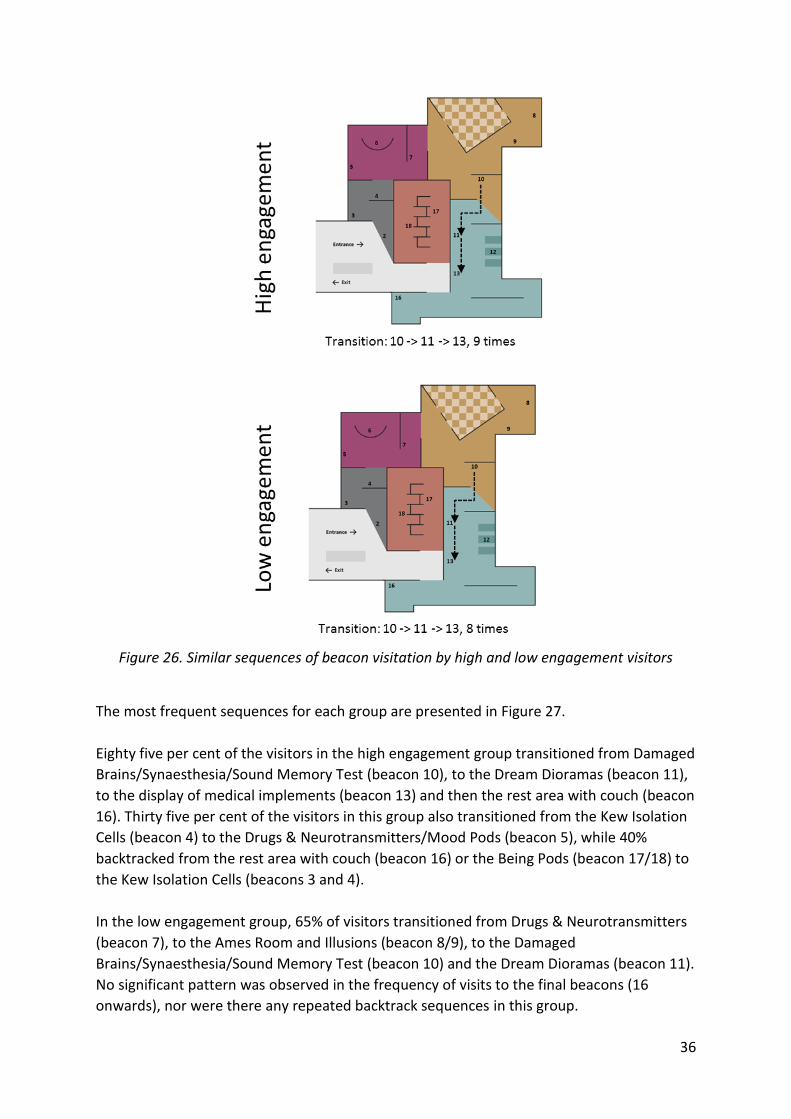
Figure 26. Similar sequences of beacon visitation by high and low engagement visitors
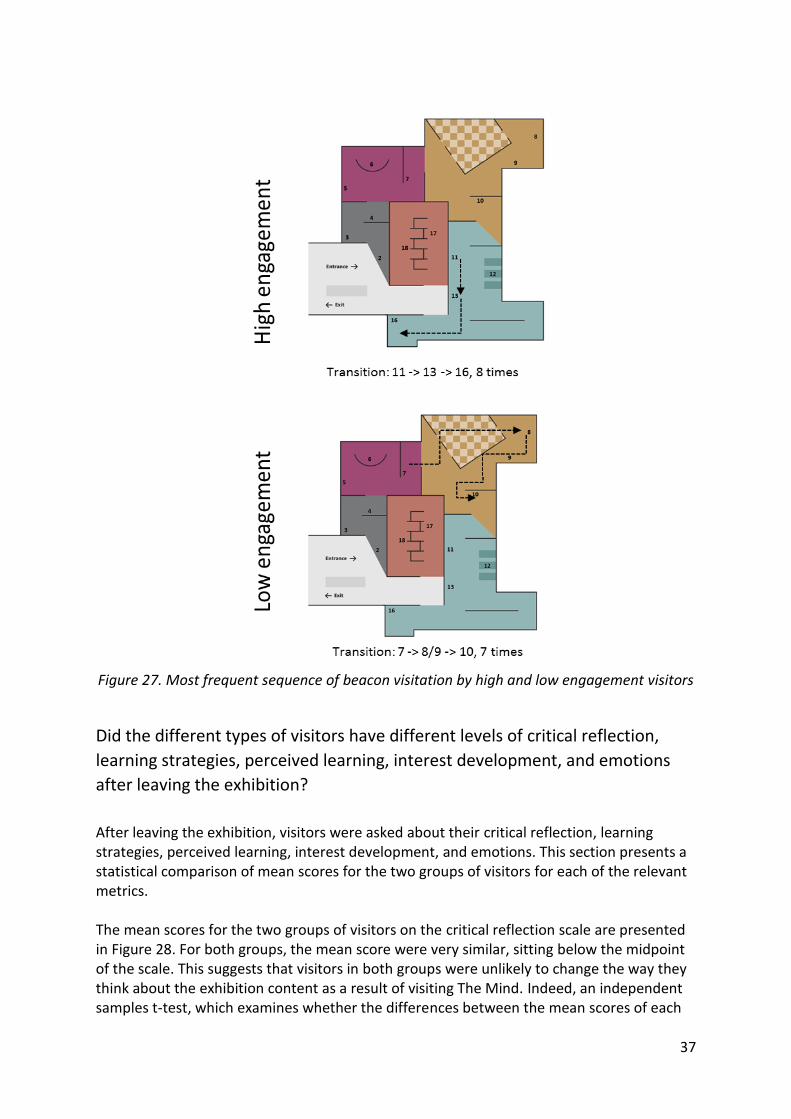
The most frequent sequences for each group are presented in Figure 27.
Eighty five per cent of the visitors in the high engagement group transitioned from Damaged
Brains/Synaesthesia/Sound Memory Test (beacon 10), to the Dream Dioramas (beacon 11),
to the display of medical implements (beacon 13) and then the rest area with couch (beacon
16). Thirty five per cent of the visitors in this group also transitioned from the Kew Isolation
Cells (beacon 4) to the Drugs & Neurotransmitters/Mood Pods (beacon 5), while 40%
backtracked from the rest area with couch (beacon 16) or the Being Pods (beacon 17/18) to
the Kew Isolation Cells (beacons 3 and 4).
In the low engagement group, 65% of visitors transitioned from Drugs & Neurotransmitters
(beacon 7), to the Ames Room and Illusions (beacon 8/9), to the Damaged
Brains/Synaesthesia/Sound Memory Test (beacon 10) and the Dream Dioramas (beacon 11).
No significant pattern was observed in the frequency of visits to the final beacons (16
onwards), nor were there any repeated backtrack sequences in this group.
37
Figure 27. Most frequent sequence of beacon visitation by high and low engagement visitors
Did the different types of visitors have different levels of critical reflection,
learning strategies, perceived learning, interest development, and emotions
after leaving the exhibition?
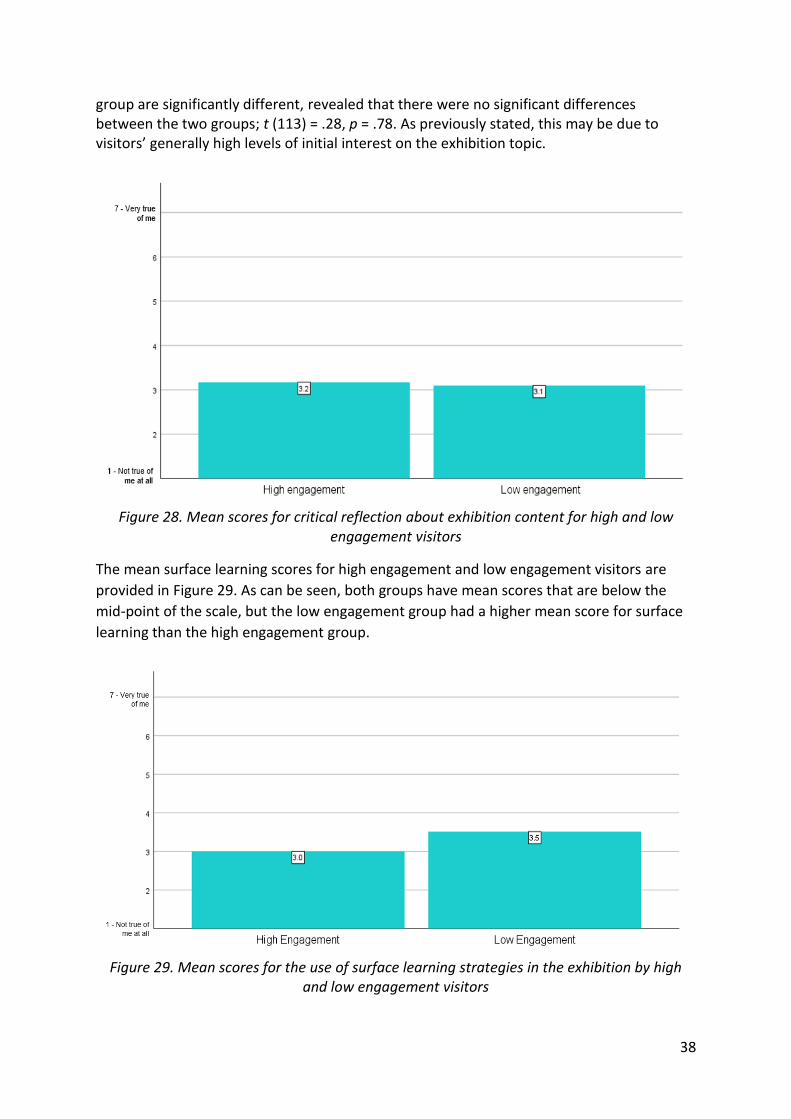
After leaving the exhibition, visitors were asked about their critical reflection, learning strategies, perceived learning, interest development, and emotions. This section presents a statistical comparison of mean scores for the two groups of visitors for each of the relevant metrics. The mean scores for the two groups of visitors on the critical reflection scale are presented in Figure 28. For both groups, the mean score were very similar, sitting below the midpoint of the scale. This suggests that visitors in both groups were unlikely to change the way they think about the exhibition content as a result of visiting The Mind. Indeed, an independent samples t-test, which examines whether the differences between the mean scores of each
38
group are significantly different, revealed that there were no significant differences between the two groups; t (113) = .28, p = .78. As previously stated, this may be due to visitors’ generally high levels of initial interest on the exhibition topic.
Figure 28. Mean scores for critical reflection about exhibition content for high and low
engagement visitors
The mean surface learning scores for high engagement and low engagement visitors are
provided in Figure 29. As can be seen, both groups have mean scores that are below the
mid-point of the scale, but the low engagement group had a higher mean score for surface
learning than the high engagement group.
Figure 29. Mean scores for the use of surface learning strategies in the exhibition by high
and low engagement visitors
39
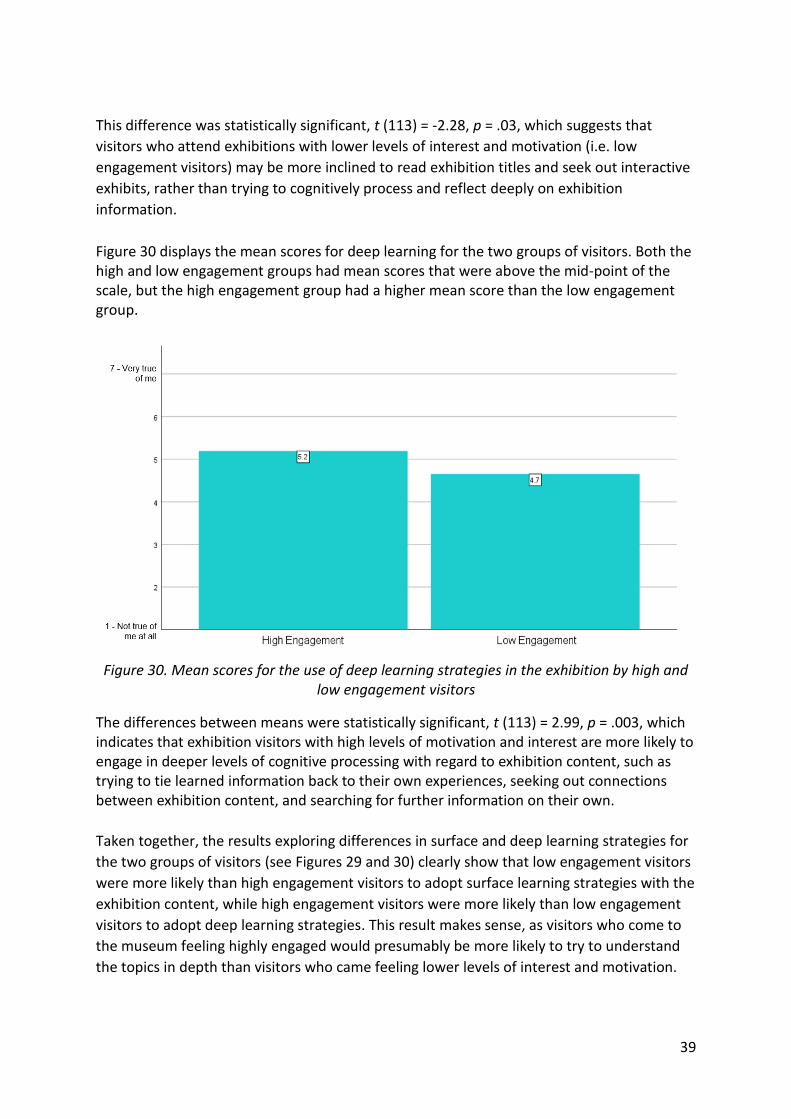
This difference was statistically significant, t (113) = -2.28, p = .03, which suggests that
visitors who attend exhibitions with lower levels of interest and motivation (i.e. low
engagement visitors) may be more inclined to read exhibition titles and seek out interactive
exhibits, rather than trying to cognitively process and reflect deeply on exhibition
information.
Figure 30 displays the mean scores for deep learning for the two groups of visitors. Both the high and low engagement groups had mean scores that were above the mid-point of the scale, but the high engagement group had a higher mean score than the low engagement group.
Figure 30. Mean scores for the use of deep learning strategies in the exhibition by high and
low engagement visitors
The differences between means were statistically significant, t (113) = 2.99, p = .003, which indicates that exhibition visitors with high levels of motivation and interest are more likely to engage in deeper levels of cognitive processing with regard to exhibition content, such as trying to tie learned information back to their own experiences, seeking out connections between exhibition content, and searching for further information on their own.
Taken together, the results exploring differences in surface and deep learning strategies for
the two groups of visitors (see Figures 29 and 30) clearly show that low engagement visitors
were more likely than high engagement visitors to adopt surface learning strategies with the
exhibition content, while high engagement visitors were more likely than low engagement
visitors to adopt deep learning strategies. This result makes sense, as visitors who come to
the museum feeling highly engaged would presumably be more likely to try to understand
the topics in depth than visitors who came feeling lower levels of interest and motivation.
40
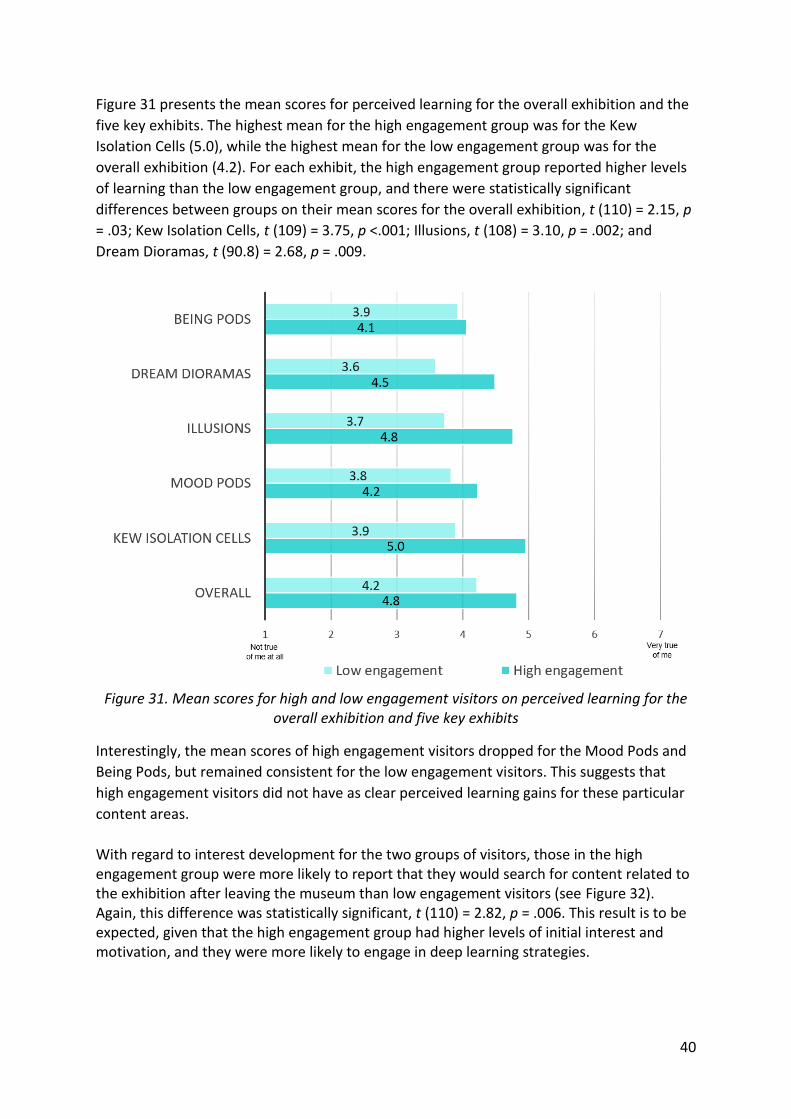
Figure 31 presents the mean scores for perceived learning for the overall exhibition and the
five key exhibits. The highest mean for the high engagement group was for the Kew
Isolation Cells (5.0), while the highest mean for the low engagement group was for the
overall exhibition (4.2). For each exhibit, the high engagement group reported higher levels
of learning than the low engagement group, and there were statistically significant
differences between groups on their mean scores for the overall exhibition, t (110) = 2.15, p
= .03; Kew Isolation Cells, t (109) = 3.75, p <.001; Illusions, t (108) = 3.10, p = .002; and
Dream Dioramas, t (90.8) = 2.68, p = .009.
Figure 31. Mean scores for high and low engagement visitors on perceived learning for the
overall exhibition and five key exhibits
Interestingly, the mean scores of high engagement visitors dropped for the Mood Pods and
Being Pods, but remained consistent for the low engagement visitors. This suggests that
high engagement visitors did not have as clear perceived learning gains for these particular
content areas.
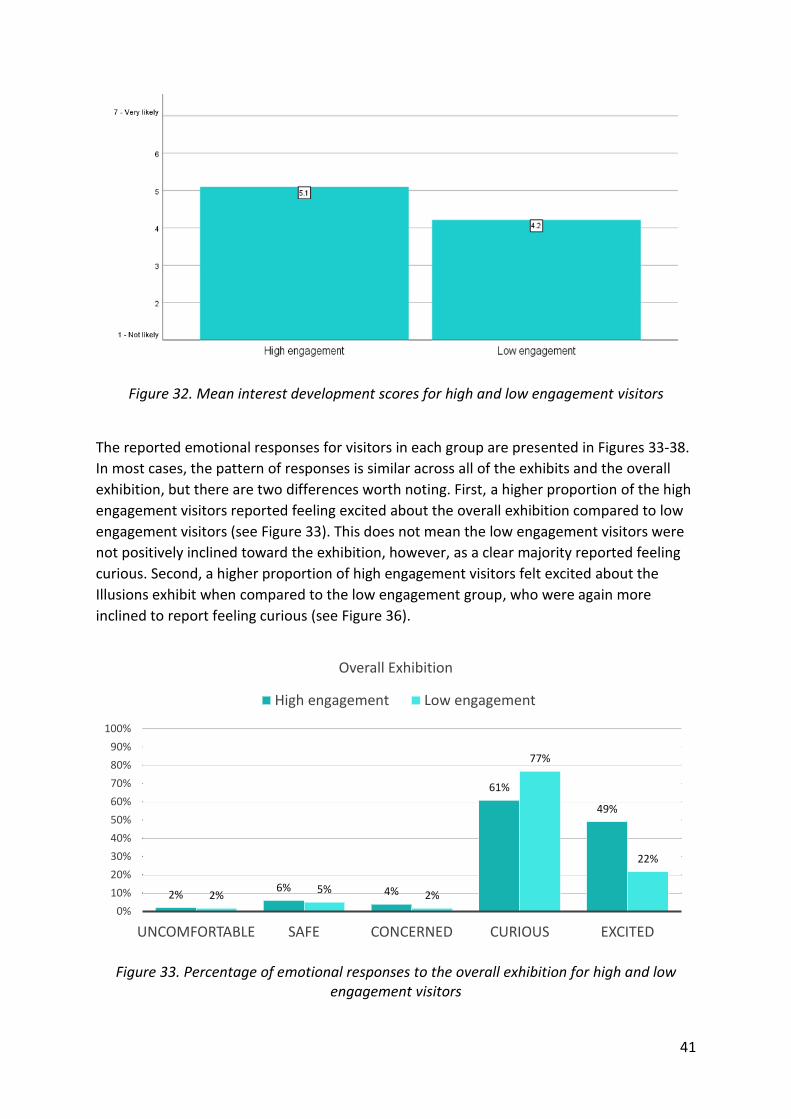
With regard to interest development for the two groups of visitors, those in the high engagement group were more likely to report that they would search for content related to the exhibition after leaving the museum than low engagement visitors (see Figure 32). Again, this difference was statistically significant, t (110) = 2.82, p = .006. This result is to be expected, given that the high engagement group had higher levels of initial interest and motivation, and they were more likely to engage in deep learning strategies.
41
Figure 32. Mean interest development scores for high and low engagement visitors
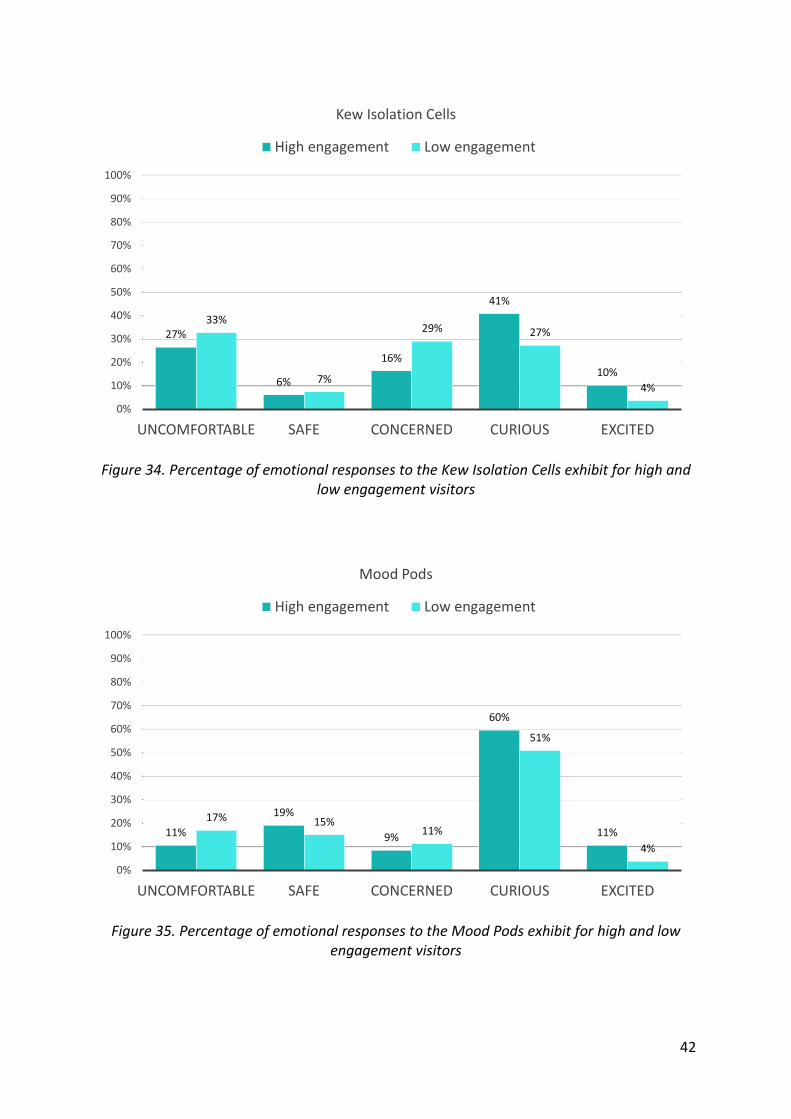
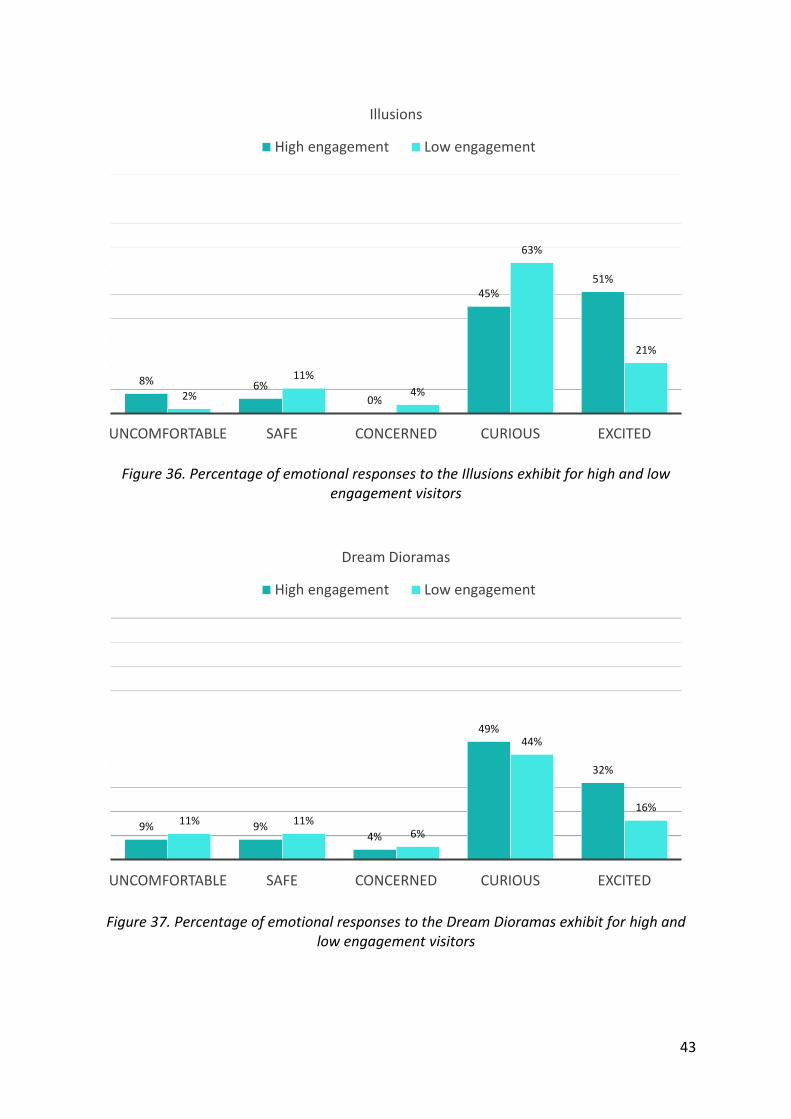
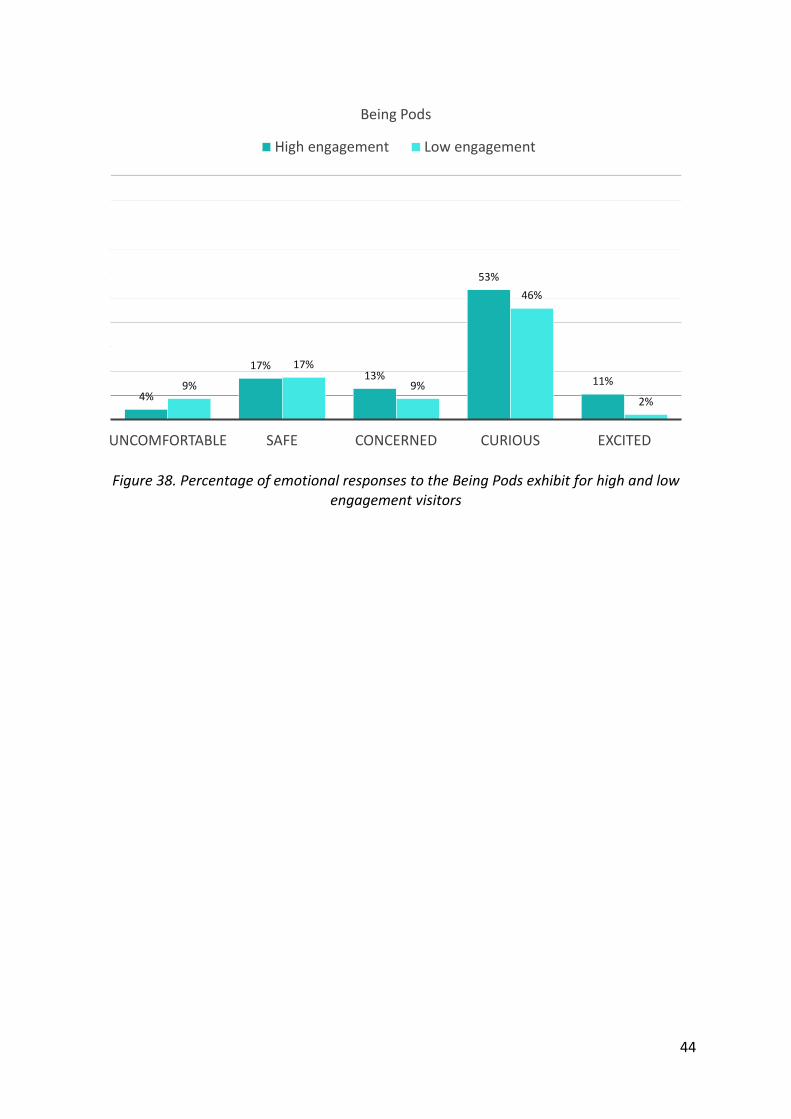
The reported emotional responses for visitors in each group are presented in Figures 33-38.
In most cases, the pattern of responses is similar across all of the exhibits and the overall
exhibition, but there are two differences worth noting. First, a higher proportion of the high
engagement visitors reported feeling excited about the overall exhibition compared to low
engagement visitors (see Figure 33). This does not mean the low engagement visitors were
not positively inclined toward the exhibition, however, as a clear majority reported feeling
curious. Second, a higher proportion of high engagement visitors felt excited about the
Illusions exhibit when compared to the low engagement group, who were again more
inclined to report feeling curious (see Figure 36).
Figure 33. Percentage of emotional responses to the overall exhibition for high and low engagement visitors
2%6% 4%
61%
49%
2%5%
2%
77%
22%
0%
10%
20%
30%
40%
50%
60%
70%
80%
90%
100%
UNCOMFORTABLE SAFE CONCERNED CURIOUS EXCITED
Overall Exhibition
High engagement Low engagement
42
Figure 34. Percentage of emotional responses to the Kew Isolation Cells exhibit for high and low engagement visitors
Figure 35. Percentage of emotional responses to the Mood Pods exhibit for high and low engagement visitors
27%
6%
16%
41%
10%
33%
7%
29% 27%
4%
0%
10%
20%
30%
40%
50%
60%
70%
80%
90%
100%
UNCOMFORTABLE SAFE CONCERNED CURIOUS EXCITED
Kew Isolation Cells
High engagement Low engagement
11%
19%
9%
60%
11%
17% 15%11%
51%
4%
0%
10%
20%
30%
40%
50%
60%
70%
80%
90%
100%
UNCOMFORTABLE SAFE CONCERNED CURIOUS EXCITED
Mood Pods
High engagement Low engagement
43
Figure 36. Percentage of emotional responses to the Illusions exhibit for high and low engagement visitors
Figure 37. Percentage of emotional responses to the Dream Dioramas exhibit for high and low engagement visitors
8% 6%0%
45%51%
2%
11%
4%
63%
21%
UNCOMFORTABLE SAFE CONCERNED CURIOUS EXCITED
Illusions
High engagement Low engagement
9% 9%4%
49%
32%
11% 11%6%
44%
16%
UNCOMFORTABLE SAFE CONCERNED CURIOUS EXCITED
Dream Dioramas
High engagement Low engagement
44
Figure 38. Percentage of emotional responses to the Being Pods exhibit for high and low engagement visitors
4%
17%13%
53%
11%9%
17%
9%
46%
2%
UNCOMFORTABLE SAFE CONCERNED CURIOUS EXCITED
Being Pods
High engagement Low engagement
45
4. Conclusions
The main objective of this pilot project was to examine the relationship between visitors’
self-reported motivations before attending an exhibition, their actual behaviour within the
exhibition, and their self-reported reflections and learning after attending the exhibition.
This project involved collection of a large amount of data; however, the present report only
includes a subset of the planned analyses. Further analyses are ongoing, and will be
reported in scholarly journal articles. Below, we outline some of the key findings from this
report, and present some of the potential implications and future directions.
The Mind exhibition: motivations, behaviour, and reflections
Before entering The Mind exhibition, visitors generally reported a high degree of interest in
the topics of the exhibition. Most were attending due to a hedonic desire to have fun. Many
were also motivated by mastery goals of wanting to learn more about topics related to the
brain and psychology.
Across the sample, most exhibition visitors spent between 1 and 10 minutes in the exhibition,
and spent a median time of 28 seconds near each beacon. None of the visitors paused to
spend time near all thirteen beacons, although most visitors visited between five and nine
beacons at least once.
The beacons in the Knowing: Memory and Perception area of the exhibition had the highest
proportion of visits compared to the other beacons, while the beacon closest to the Mood
Pods had the lowest percentage of visits overall. The beacon positioned closest to the
Damaged Brains, Synaesthesia Demonstration, and Sound Memory Test exhibits had the
highest median visitation time (66 seconds), while the beacon near the Mood Pods had the
lowest median time (19 seconds).
Every visitor had a unique sequence of beacon visitation through the overall exhibition;
however it was possible to identify common sequences of beacon transitions in certain
sections of the exhibition, such as the Thinking: Cognition and Consciousness content area. It
was also possible to identify areas where visitors backtracked and revisited particular areas
of the exhibition.
After leaving the exhibition, most visitors indicated that they had used deep learning
strategies while in the exhibition, and that they had generally achieved the key learning
outcomes. They also predominantly experienced positive emotional responses, such as
curiosity and excitement, in relation to the exhibition overall and in connection to the five key
exhibits (Kew Isolation Cells, Mood Pods, Illusions, Dream Dioramas, and Being Pods).
Overall, The Mind exhibition provoked visitors to learn and develop interest in the topics
covered. However, visitors were less inclined to report that the exhibition had changed the
46
way they thought about the content of the exhibition, indicating that they hadn’t been
provoked to critically reflect on matters concerning the brain and psychology to the extent
that might alter, or challenge, their understandings of the topics.
Identifying different visitor profiles
Based on data collected using the pre-visit questionnaire, two groups of visitors were
identified via cluster analysis: a high engagement group and a low engagement group. These
two groups came to the exhibition with different goals and levels of interest in the exhibition
content, and they showed different patterns of results with regard to their visitation and
outcome variables.
Compared to low engagement visitors, the high engagement group visited more individual
beacons, showed backtrack transitions, were more likely to adopt deep learning strategies,
and had higher levels of perceived learning and interest development. In contrast, the low
engagement group were more likely to use surface learning strategies.
In addition, the high engagement group reported being more excited about what they had
experienced across the overall exhibition (49%) than the low engagement group (22%), yet
the low engagement group reported higher levels of curiosity (77%) than the high
engagement group (61%). These results indicate that visitors entering the exhibition with
lower levels of initial engagement were indeed engaged by the exhibition content, although
not to the same levels as the high engagement group.
The identification of these two groups of visitors, and their differential patterns of learning
and behaviour within the exhibition, could possibly inform future research studies. For
example, it may be possible to design intervention studies which aim at improving learning
outcomes for visitors who come to museums with lower levels of engagement.
Time spent, trajectory, and pause rate mapping using Bluetooth technology
Developing an effective method of mapping exhibition visitor’s time spent, trajectories and
pause rates using Bluetooth technology was a significant achievement of this project. Much
trial and error was involved in devising an approach that successfully produced both accurate
and meaningful data. Further efforts were required to effectively manage, analyse and
represent the data in tabulated and graphic forms, to effectively communicate the findings in
comprehendible ways.
Automating the collection of data related to exhibition visitor’s time spent, trajectories and
pause rates may have significant benefits to the museum into the future, especially when
compared with the labour intensive and expensive strategies employed previously that
involved staff following visitors and manually documenting their paths and behaviours.
47
The ultimately successful use of beacon technologies to map visitor’s behaviours – along with
aligned data management, analysis, and representation techniques – may provide a relatively
efficient and cost-effective data collection strategy that can be leveraged to collect data
within other exhibitions, or potentially across the entire museum. New beacon technologies
support personalised content delivery to people while visiting venues, and are also able to
collect additional sensor data such as temperature and vibrations based on telemetry
protocols, all in real-time. If beacons were optimised for reliable entry and exit events, this
would allow the museum to authenticate presence, send contextual notifications, display
proximity-based content, or create software automations. Such ‘feedback’ on visitor
experience may be useful in the context of future exhibition planning and design.
Relationships between self-regulated learning and mapping exhibition experience/behaviour
The relationships explored in this pilot study, between self-regulated learning and the
behaviour of people in the exhibition space (time spent, trajectories and pause rates), show
promise for future correlational studies. While it appears obvious that time spent in an
exhibition and visitors’ levels of engagement would be related, the findings of this study
highlighted that different exhibits within an overall exhibition can draw and hold people’s
attention for varying periods of time.
Such detailed data may be useful in providing feedback to exhibition curators about the
‘relative success’ of different features of their exhibitions. If performed repeatedly across
multiple exhibitions, studies of this type could produce quantitative patterns indicative of
certain behaviours relative to different types of exhibits, highlighting which are more or less
engaging to self-regulated, or autonomous, learners. These kinds of studies may also be
applicable in other learning environments where self-regulated learning is being promoted,
such as galleries, memorials, cultural institutions and some early learning, school and higher
education settings.
48
References Griffin, J. (1999). Finding evidence of learning in museum settings. In E. Scanlon, E. Whitelegg
& S. Yates (Eds.), Communicating Science: Contexts and Channels (pp. 110-119).
London and New York: Routledge in association with The Open University.
Harackiewicz, J. M., Durik, A. M., Barron, K. E., Linnenbrink-Garcia, L., & Tauer, J. M. (2008).
The role of achievement goals in the development of interest: Reciprocal relations
between achievement goals, interest, and performance. Journal of Educational
Psychology, 100(1), 105.
Kember, D., Leung, D. Y., Jones, A., Loke, A. Y., McKay, J., Sinclair, K., ... & Yeung, E. (2000).
Development of a questionnaire to measure the level of reflective thinking.
Assessment & Evaluation in Higher Education, 25(4), 381-395
Pintrich, P. R. (2000). The Role of Goal Orientation in Self-Regulated Learning. In M. Boekaerts,
M. Zeidner & P. R. Pintrich (Eds.), Handbook of Self-Regulation (pp. 451-501). San
Diego, CA: Academic Press.
Pekrun, R. (2011). Emotions as drivers of learning and cognitive development. New
Perspectives on Affect and Learning Technologies (pp. 23-39). New York, NY: Springer.
Schmitz, B., & Perels, F. (2011). Self-monitoring of self-regulation during math homework
behaviour using standardized diaries. Metacognition and Learning, 6(3), 255–273.
Zhou, J., & Urhahne, D. (2016). Self-regulated learning in the museum: understanding the
relationship of visitor's goals, learning strategies, and appraisals. Scandinavian
Journal of Educational Research, 61(4). 394-410.