Understanding raspberry using ‘Omics’ technologies · Moving targets . Progress with marker ......
21
Understanding raspberry using ‘Omics’ technologies Julie Graham
Transcript of Understanding raspberry using ‘Omics’ technologies · Moving targets . Progress with marker ......
Understanding raspberry using ‘Omics’ technologies
Julie Graham

Assisting the raspberry breeding process
Breeding is a slow process (highly heterozygous, juvenile)
Difficult to achieve a lot of objectives
Personal preferences
Environment/weather
Reduced actives
New challenges
Moving targets
Progress with marker assisted breeding eg. root rot

Some progress understanding phenotype – Mapping raspberry root rot resistance/tolerance
Linkage map development
QTL Mapping LG3&6
Identified marker
Validation in germplasm
Marker deployment
Rub118b for breeding
10
80
70
4
60
50
2
40
30
20
10
3 50
Numb
er of
plants
Disease score (1-5 scale)
10
0 5
20
031
70
60
50
2 4
40
30
Numb
er of
plants
Disease score (1-5 scale)
Resistant susceptible
Graham et al., 2011 TAG
E41M60-1840.0
P13M39-177R6.2P13M40-3357.3P14M39-978.3P13M39-195R9.7P14M61-12110.6RUB22a11.5FRUITE812.3ERUB27113.9RootP18R14.9ERubLRSQ01_FG23Pgl15.9RUB279a16.326S_prot16.8RiSnf117.0RootE1003617.6RubnebH1518.9ERubLRSQ13.2_C12IPPI19.4ERubLRSQ12.4_A04DMMQT20.7ERubLRSQ4.2_A08LTP22.0P13M58-11225.4P12M121-12727.0P13M55-11228.1P13M55-9831.1RUB20a31.4P13M95-125R34.5P12M121-18638.4P13M60-474R39.6P13M95-137R43.6RUB160a47.8P12M31-15549.9E40M43-37052.5Rub242a53.2P14M61-9254.8Ri4CL1SNP55.5P12M61-13155.7E41M31-15356.0E41M31-14757.0P13M55-251 E40M55-17558.2RiM01558.3Rub177a158.6ERubLRSQ07.4_D0560.8RUB19a61.5Rub2a162.9RUB2a263.5P13M40-13364.8P12M61-19965.5P13M60-223R67.1E40M60-93 P13M60-221R68.1RUB233a68.5E41M31-16069.4P13M95-214R70.4ERubLR_cont74RRP71.0P14M61-12472.0E41M31-16772.9E40M43-12874.6Ri9022_BRX76.5Ri9022_RZnf76.6E41M61-25977.0Ri9022_GTPbindp77.8Bac9022SSR0178.1RiMYB78.2E40M43-9580.0Ri9022_AP2_prot82.1E41M58-17184.0E41M40-13684.5P14M39-30187.1P14M39-14588.6RUB228a93.8P14M60-13196.6ERubLath2_cont2498.4ERubLath2_cont2198.8ERubLRSQ12.2_C05Acon104.3P14M60-129107.7ERubLRSQ10.2_E02SAM112.0E41M39-138116.3P13M40-203121.3Rub120a124.0RUB223a126.2P14M39-92129.9
Rub238h133.1
Rub259b138.9
RR
_05 L
OD
4.7
RR
_06 L
OD
7.2
PC
O1 L
OD
6.7
Ht_
05_C
l LO
D 5
.2
Ht_
06_C
l LO
D 4
.6
Den_05_C
l LO
D 1
5.8
Den_06_C
l LO
D 7
.9
Den_05_In
f LO
D 6
.4
Den_06_In
f LO
D 7
.6
Dia
m_05_C
l LO
D 7
.6
Dia
m_06_C
l LO
D 5
.6
Dia
m_06_In
f LO
D 8
.5
3

Deployment of markers for resistance to Phytophthora root rot
Markers identified in 2008 (Hortlink 0169)
Parents with root rot resistance marker identified for
crossing in 2009 (25 families)
Currently >40 selections identified with the marker
10 selections fruiting in 5-plant plots in 2013
•Exceptional root vigour, Two selections with good fruit
size, quality and yield
•Resistance holding in infestation plot
•Better understanding of phenotype
0946/12
0957/18
Phytophthora resistance
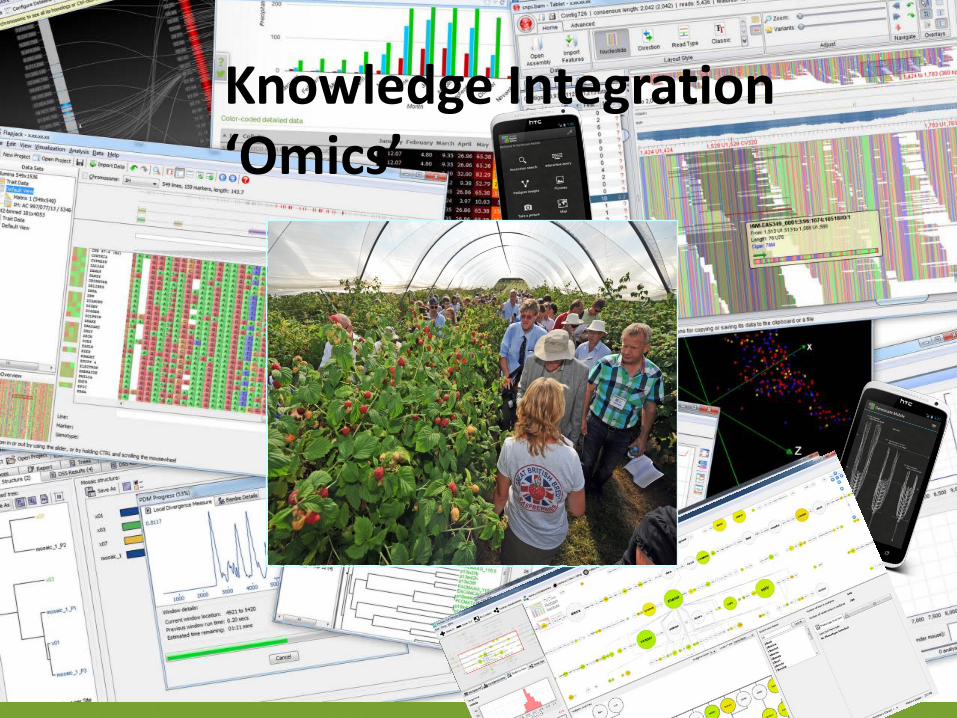
Knowledge Integration ‘Omics’

Development, integration and use of “omics” technologies in raspberry breeding Genomics
Genome assembly and annotation – DNA sequence - information
Transcriptomics
Genes: mRNA transcriptome, alternative splicing, miRNA transcriptome - active part
Metabolomics
Compounds: sugars, acids, volatiles etc – flavour, colour etc
Phenomics
Response of plant traits to environment/stresses and use of high throughput imaging systems – physical plant traits

Genomics Genomics - sequencing and analysis of the genome.
Actual DNA sequence

Raspberry Glen Moy genome sequence
Allows us to make a physical map of the actual sequence and link to the genetic map and to search regions of genetic map for genes related to traits
Genetic map
Physical map
Loci Rub124a
P14M60 - 83 0.0 25D10SSR04 4.6 25D10_end 6.7 RUB210a 11.6 RUB257a 13.9 RUB137a 21.3 RUB124a 27.9 Rubpara_SQ008_D04 31.5 E40M43 - 93 42.2 E40M60 - 106 47.9 E40M60 - 125 58.8 P13M58 - 86 63.4 P13M60 - 117 66.0 Rubnebp4c8b 67.4 E40M43 - 116 68.4 P13M40 - 131 70.4 ERubLR_SQ07_3_C07 75.2 E40M43 - 268 E41M42 - 148 79.6 RUB47a 88.2 P14M39 - 402 90.4 P12M95 - 95 92.9 P12M31 - 171 96.6 E41M60 - 315 97.5 P14M39 - 196 100.8 E41M39 - 125 101.0 RUB262b 103.2 RUB256e 107.2 bHLH 109.3 RUB243a RUB119a 111.4 Rub232b 116.0 RUB166b 119.2
LG 1
07 P
T 07
OF
06 O
F
C3S**
07 P
T 07
OF
06 O
F
C3GR**
07 P
T 07
OF
06 O
F
C3G**
07 P
T 07
OF
06 O
F
C3R**
QTL Peak 5 > LOD > 20
P3S* P3G* P3R*
06 O
F
07 P
T 07
OF
07 P
T
06 O
F 07
OF
P3GR*
06 O
F 07
PT
07 O
F
07 P
T
06 O
F 07
OF
P14M60 - 83 0.0 25D10SSR04 4.6 25D10_end 6.7 RUB210a 11.6 RUB257a 13.9 RUB137a 21.3 RUB124a 27.9 Rubpara_SQ008_D04 31.5 E40M43 - 93 42.2 E40M60 - 106 47.9 E40M60 - 125 58.8 P13M58 - 86 63.4 P13M60 - 117 66.0 Rubnebp4c8b 67.4 E40M43 - 116 68.4 P13M40 - 131 70.4 ERubLR_SQ07_3_C07 75.2 E40M43 - 268 E41M42 - 148 79.6 RUB47a 88.2 P14M39 - 402 90.4 P12M95 - 95 92.9 P12M31 - 171 96.6 E41M60 - 315 97.5 P14M39 - 196 100.8 E41M39 - 125 101.0 RUB262b 103.2 RUB256e 107.2 bHLH 109.3 RUB243a RUB119a 111.4 Rub232b 116.0 RUB166b 119.2
P14M60 - 83 0.0 25D10SSR04 4.6 25D10_end 6.7 RUB210a 11.6 RUB257a 13.9 RUB137a 21.3 RUB124a 27.9 Rubpara_SQ008_D04 31.5 E40M43 - 93 42.2 E40M60 - 106 47.9 E40M60 - 125 58.8 P13M58 - 86 63.4 P13M60 - 117 66.0 Rubnebp4c8b 67.4 E40M43 - 116 68.4 P13M40 - 131 70.4 ERubLR_SQ07_3_C07 75.2 E40M43 - 268 E41M42 - 148 79.6 RUB47a 88.2 P14M39 - 402 90.4 P12M95 - 95 92.9 P12M31 - 171 96.6 E41M60 - 315 97.5 P14M39 - 196 100.8 E41M39 - 125 101.0 RUB262b 103.2 RUB256e 107.2 bHLH 109.3 RUB243a RUB119a 111.4 Rub232b 116.0 RUB166b 119.2
LG 1
07 P
T 07
OF
06 O
F
C3S**
07 P
T 07
OF
06 O
F
C3GR**
07 P
T 07
OF
06 O
F
C3GR**
07 P
T 07
OF
06 O
F
C3G**
07 P
T 07
OF
06 O
F
C3G**
07 P
T 07
OF
06 O
F
C3R**
07 P
T 07
OF
06 O
F
C3R**
QTL Peak 5 > LOD > 20
P3S* P3G* P3R*
06 O
F
07 P
T 07
OF
06 O
F
07 P
T 07
OF
06 O
F
07 P
T 07
OF
07 P
T
06 O
F 07
OF
07 P
T
06 O
F 07
OF
06 O
F 07
OF
P3GR*
06 O
F 07
PT
07 O
F 06
OF
07 P
T 07
OF
07 P
T
06 O
F 07
OF

Transcriptomics Transcriptomics —RNA transcripts that are produced by
the genome, under specific circumstances or in a specific cell

00.10.20.30.40.50.60.70.80.9
SAMDC
*
* *
Gene expression and shelf life/softening E41M60-184 0.0 ERubLR_SQ4.2_A08LTP 7.6 ERUB271PR 9.6 ERubLR_SQ1_G23Pgl 11.7 ERubLR_SQ01_P18 13.0 26S_prot 14.3 Risnf4 15.4 ERubLR_SQ071_E10TF 16.6 ERubLR_SQ13.2C12IPPI 18.4 RubnebH15 19.2 ERubLR_SQ12.4A04DMQ 19.8 FRUITE8OMT 21.2 P13M58-112 26.3 P12M121-186 35.5 ERubLR_SQ13.2E09Exp 41.1 454C8568_ISPH 454C6570_ISPH 45.6 454CL8848C1_ZFP8 48.6 Rub242a 50.9 454C1803_PGIP2 53.0 E40M55-175 55.0 RiM015 55.4 RiCTR1 55.9 E41M31-153 57.9 E41M31-147 59.0 RUB19a 60.9 454C0016_Maldehy 61.1 ERubLRcont74PMEI 66.4 P13M95-214R 68.1 P14M61-124 RißGal1 69.2 Ri9022_ORF6 71.1 Ri9O22_ORF3 71.6 Ri9022SSR01 74.4 E40M43-95 75.3 RiMYB 76.1 Ri9022_ORF7 77.5 Ri9022_ORF15 78.8 454C3991_PME 80.8 Ri4CL1SNP 82.7 E41M40-136 82.8 ERubLath2_c24 91.9 ERubLath2_C21 92.6 454C2985_PSY 93.8 P14M60-131 95.8 ERubLR_SQ12.2C05Acon 99.6 P14M60-129 102.9 ERubLRSQ10.2E02SAMDC 107.0 ERubLR_SQ05.3_D11AOC 107.7 E41M39-138 112.1 Rub120a 118.3

Gene expression - microarray 60, 000 genes available on a microarray for gene
expression studies
Allows us to determine which genes are switched on at a particular location/time/event
Yellow: active in A
Green: active in B
Orange: active in both

Fruit development
Glen Moy Latham

Metabolomics Metabolites in a biological cell, tissue, organ or organism,
which are the end products of cellular processes.
Metabolic profiling can give an instantaneous snapshot of the physiology of that cell.
RT: 0.00 - 70.00
0 5 10 15 20 25 30 35 40 45 50 55 60 65Time (min)
0
10
20
30
40
50
60
70
80
90
100
Relati
ve Ab
unda
nce
0
10
20
30
40
50
60
70
80
90
100
Relati
ve Ab
unda
nce
26.51
26.3122.18 52.49
56.45
45.82
48.0123.61 40.19 51.8126.89 42.774.10 53.7421.50
27.96 34.26 59.8336.5619.5314.934.51 8.55 14.47 68.3065.6360.2022.10
21.62
21.44 23.50
52.54
21.25
25.36 60.7547.99 56.4868.3940.21 44.334.08 68.2456.6342.87 53.7827.87 49.6933.51
12.04 34.25 62.79 63.6330.046.05 60.2118.2914.938.793.84
NL:4.36E4Base Peak F: ITMS - c ESI Full ms [100.00-2000.00] MS RLF100
NL:1.13E5Base Peak F: ITMS + c ESI Full ms [100.00-2000.00] MS rlf100

Composition
Season Field 2006 Field 2007 Polytunnel 2007 Sample Progeny Progeny Progeny
Volatile Mean± SEM Min-Max Mean ±
SEM
Min-Max Mean ± SEM Min-Max
b-damascenone
72.29 ± 4.02 0 – 463.8 87.10 ± 6.82 0 – 872.10 64.88 ± 4.71 3.17 - 368.8
b-ionone 13.65 ± 0.53* 0.46 – 47.88 9.83 ± 0.44 0.61 – 44.33 6.43 ± 0.36* 0.25 - 33.02 a-ionone 7.31 ± 0.19* 1.65 – 17.16 3.86 ± 0.14 0.79 – 13.82 5.16 ± 0.24* 0.22 - 21.61
a-ionol 2.24 ± 0.09* 0.16 – 7.28 1.83 ± 0.09 0.24 – 11.68 5.96 ± 0.30* 0.16 - 29.97 Linalool 4.72 ± 0.32* 0.67 – 22.26 2.90 ± 0.17 0.33 – 14.52 4.39 ± 0.20* 0.90 - 29.28
Geraniol 2.64 ± 0.08* 0.68 – 8.87 1.82 ± 0.07 0.44 – 10.74 3.68 ± 0.14* 0.11 - 15.46 (Z)-3-hexenol 22.35 ± 0.34* 0.71 – 28.15 9.06 ± 0.29 0.63 – 28.18 16.70 ± 0.67* 0.07 - 54.03
Acetic acid 1.39 ± 0.06* 0.06 – 8.26 0.64 ± 0.05 0.01 – 4.05 0.72 ± 0.03 0.01 - 3.54 Hexanoic acid 6.54 ± 0.35* 0.89 – 41.68 7.97 ± 0.30 1.71 – 22.88 7.04 ± 0.34 0.28 - 30.84
Acetoin 1.02 ± 0.05 0.09 – 4.74 1.03 ± 0.04 0.10 – 4.79 0.80 ± 0.05* 0.02 – 4.95 Benzyl alcohol 0.59 ± 0.03* 0.15 – 2.18 1.07 ± 0.04 0.09 – 3.16 2.67 ± 0.11* 0 - 9.94
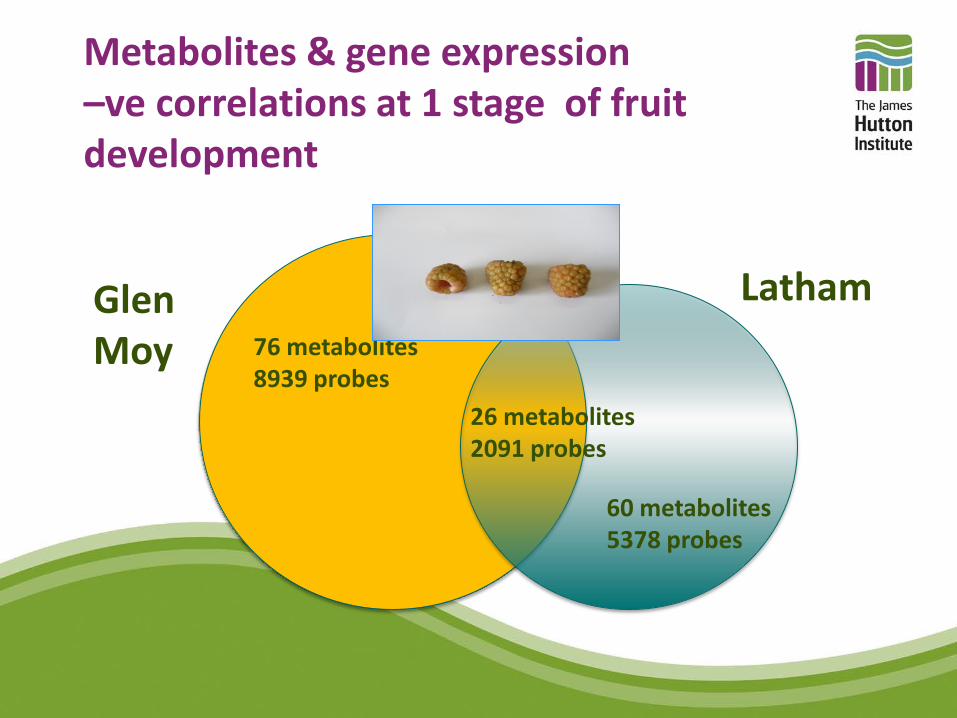
Metabolites & gene expression –ve correlations at 1 stage of fruit development
Glen Moy
Latham 76 metabolites 8939 probes
60 metabolites 5378 probes
26 metabolites 2091 probes

Phenomics Plant physical and biochemical traits as they change in
response to genetic mutation and/or environmental influences
Need a way to identify changes induced by stresses – imaging technologies

Vine weevil damage to raspberry
Vine weevil (Otiorhynchus sulcatus) is an intractable pest
• Difficult to detect (root-feeding larvae) • Difficult to treat • Leads to yield loss • Economically-damaging

Block-Standard R1
Block-Drought R2
R184 R248 R234 R104 R254
R184 R248 R234 R104
A.
B.
•Infrared thermography detects notable differences to water stress in raspberry plants
•R234 has greater water requirement than R254 Using imaging technology to identify water stress +/- pest and disease pressures – data points
Water stress
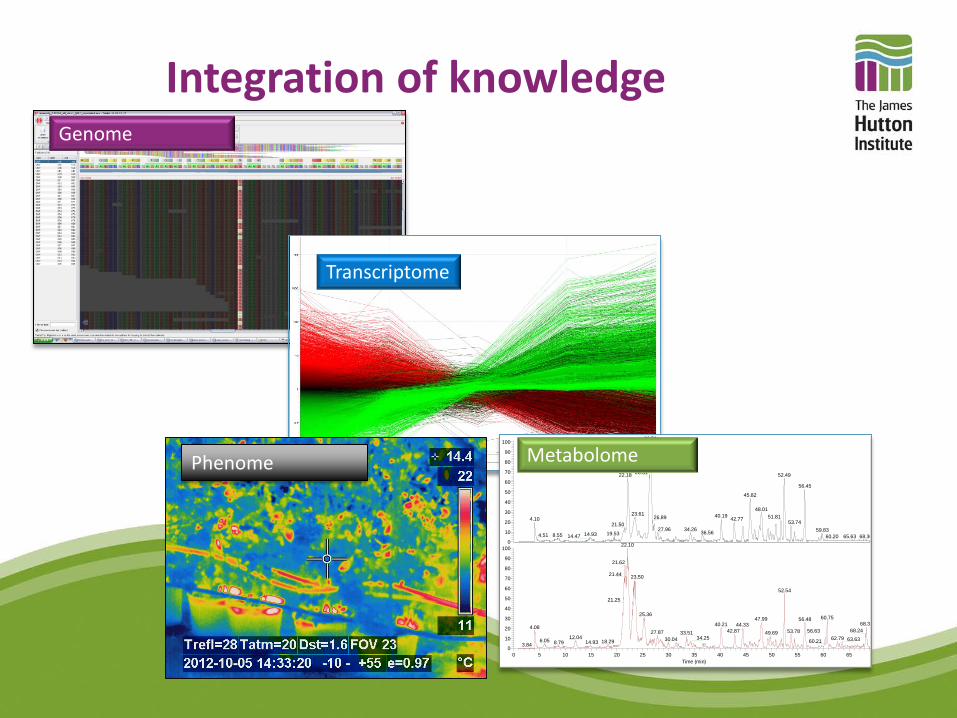
Integration of knowledge Genome
Transcriptome
0 00 0 00
0 5 10 15 20 25 30 35 40 45 50 55 60 65Time (min)
0
10
20
30
40
50
60
70
80
90
100
eat
e bu
dace
0
10
20
30
40
50
60
70
80
90
100
eat
e bu
dace
26.51
26.3122.18 52.49
56.45
45.82
48.0123.61 40.19 51.8126.89 42.774.10 53.7421.50
27.96 34.26 59.8336.5619.5314.934.51 8.55 14.47 68.3065.6360.2022.10
21.62
21.44 23.50
52.54
21.25
25.36 60.7547.99 56.4868.3940.21 44.334.08 68.2456.6342.87 53.7827.87 49.6933.51
12.04 34.25 62.79 63.6330.046.05 60.2118.2914.938.793.84
Metabolome Phenome

Gene expression-metabolite networks

Knowledge and tools for breeding
Kay Smith Susan McCallum Chris Hackett Rob Hancock Ankush Prashar Ali Karley Craig Simpson Linda Milne Pete Hedley Runxuan Zhang Nikki Jennings Dominic Williams Avril Britten Carolyn Mitchell
Innovate UK Scottish Government Industry Consortia