Understanding Population Pyramids In a Metropolitan Area.
53
Understanding Population Pyramids In a Metropolitan Area
-
Upload
elfreda-dickerson -
Category
Documents
-
view
224 -
download
1
Transcript of Understanding Population Pyramids In a Metropolitan Area.
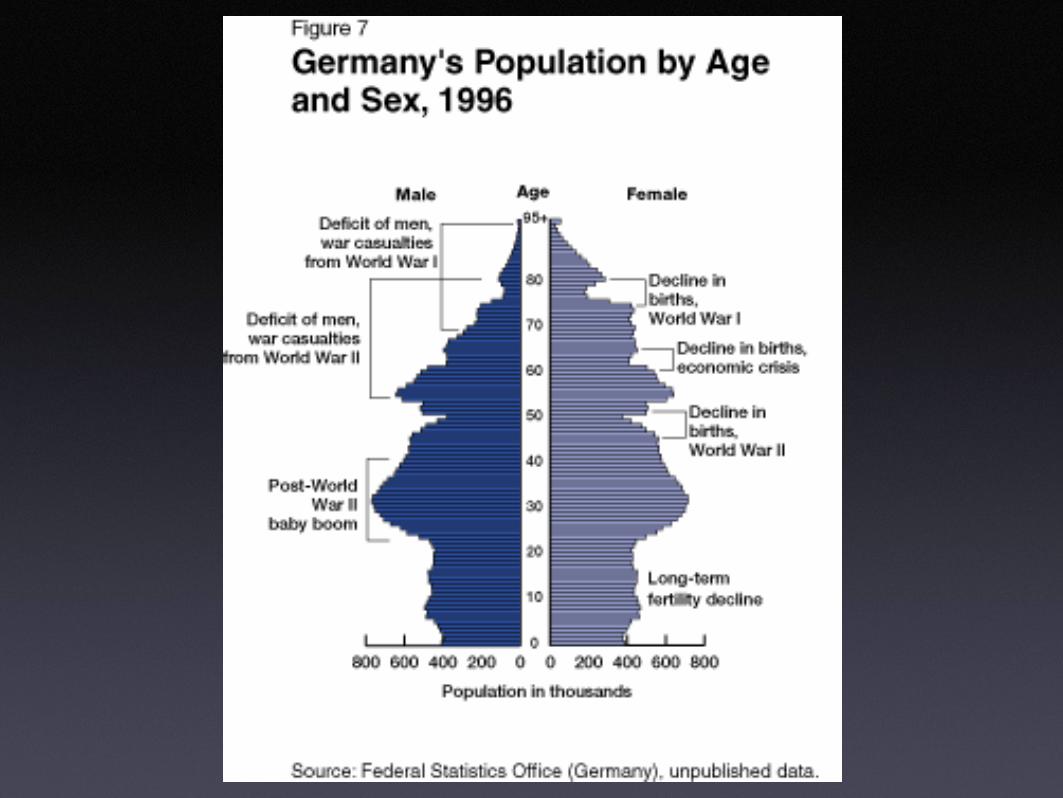
Understanding Population Pyramids
In a Metropolitan Area

Day 1Reading and Constructing Population
Pyramids
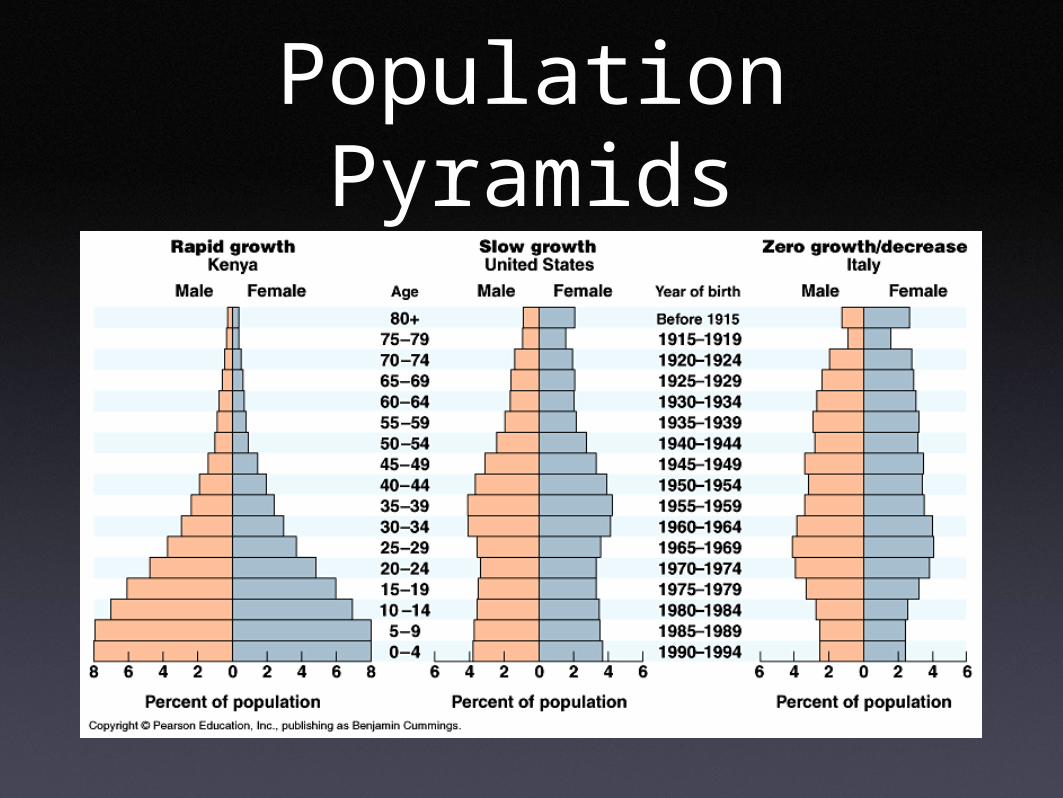
Population Pyramids
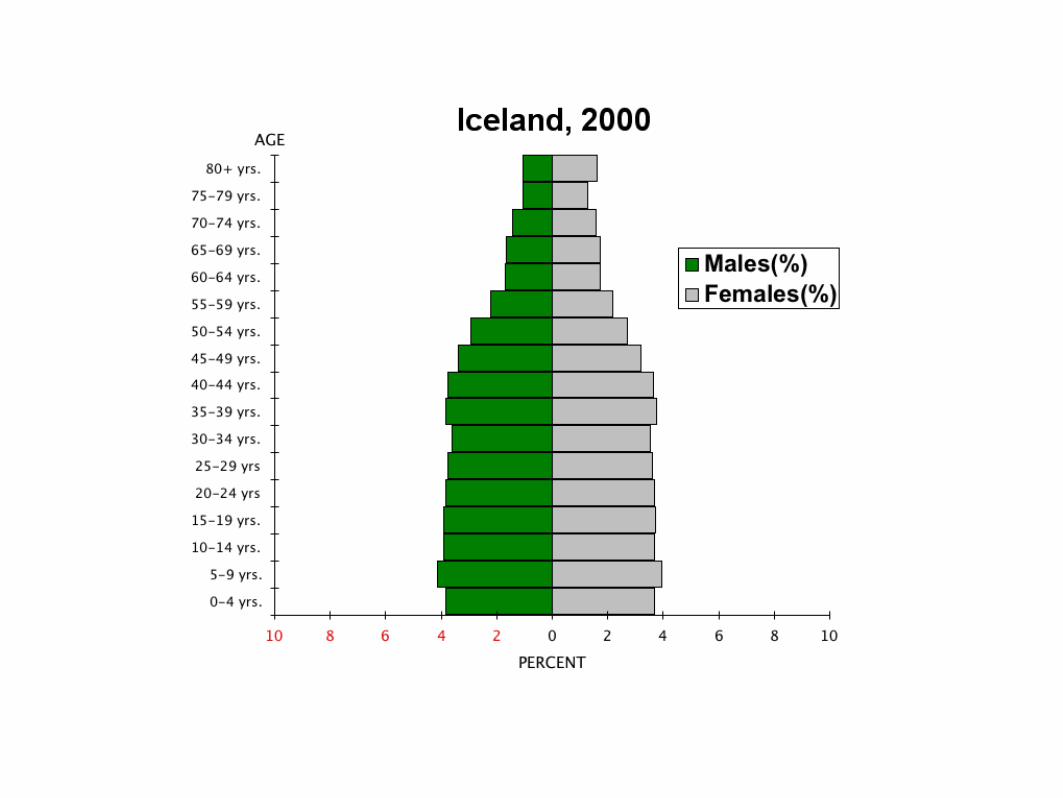
10 8 6 4 2 0 2 4 6 8 10
0-4 yrs.
5-9 yrs.
10-14 yrs.
15-19 yrs.
20-24 yrs
25-29 yrs
30-34 yrs.
35-39 yrs.
40-44 yrs.
45-49 yrs.
50-54 yrs.
55-59 yrs.
60-64 yrs.
65-69 yrs.
70-74 yrs.
75-79 yrs.
80+ yrs.
AGE
PERCENT
Males(%)Females(%)
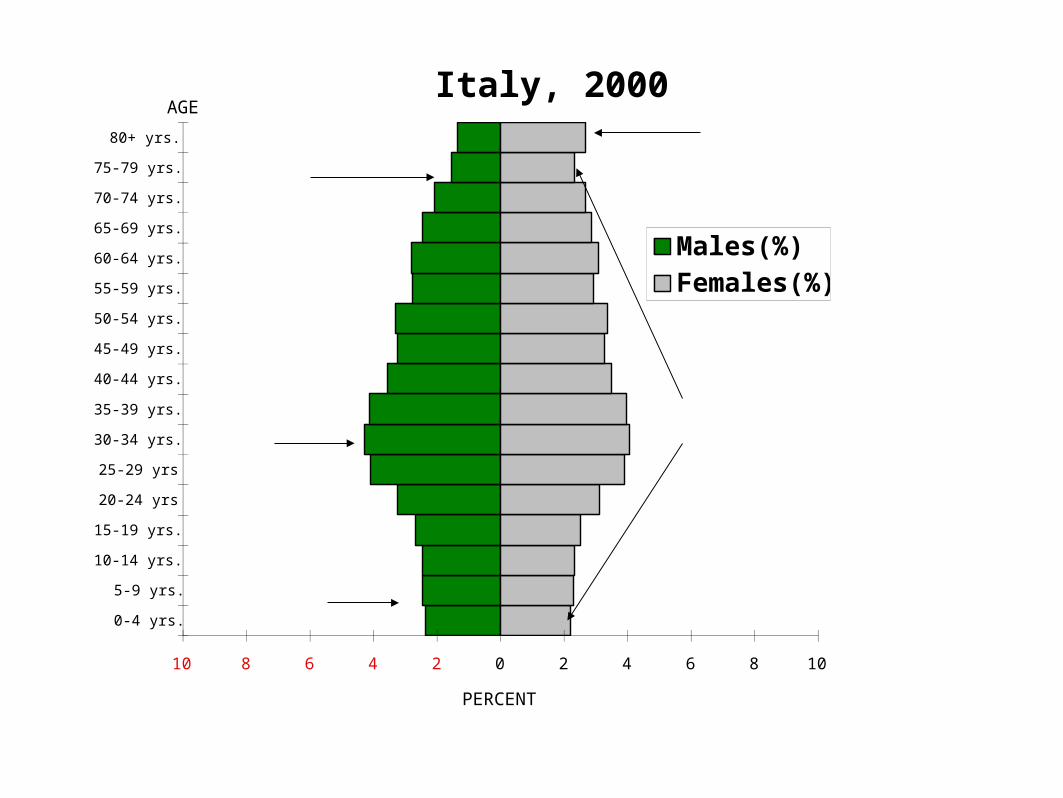
Italy, 2000
1
2
34
5

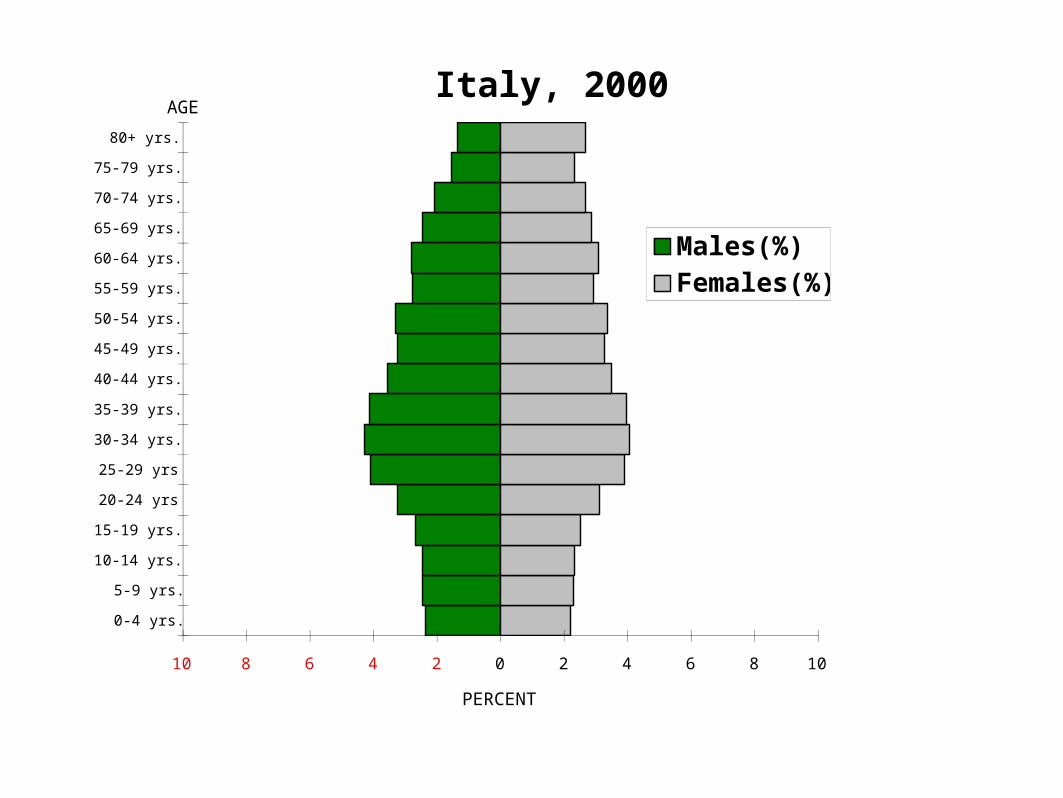
Analysis of the Italy’s Pyramid
•1. Decline in Birth Rate
•2. Baby Boom
•3. Low Death Rate with increasing number of elderly.
•4. More women due to: a. longer life expectancy and World Wars (I and II)
•5. More 75-79 yrs than 0-4 yrs. Signs of a future worker shortage and an overall declining population.
10 8 6 4 2 0 2 4 6 8 10
0-4 yrs.
5-9 yrs.
10-14 yrs.
15-19 yrs.
20-24 yrs
25-29 yrs
30-34 yrs.
35-39 yrs.
40-44 yrs.
45-49 yrs.
50-54 yrs.
55-59 yrs.
60-64 yrs.
65-69 yrs.
70-74 yrs.
75-79 yrs.
80+ yrs.
AGE
PERCENT
Males(%)Females(%)
Italy, 2000
10 8 6 4 2 0 2 4 6 8 10
0-4 yrs.
5-9 yrs.
10-14 yrs.
15-19 yrs.
20-24 yrs
25-29 yrs
30-34 yrs.
35-39 yrs.
40-44 yrs.
45-49 yrs.
50-54 yrs.
55-59 yrs.
60-64 yrs.
65-69 yrs.
70-74 yrs.
75-79 yrs.
80+ yrs.
AGE
PERCENT
Males(%)Females(%)
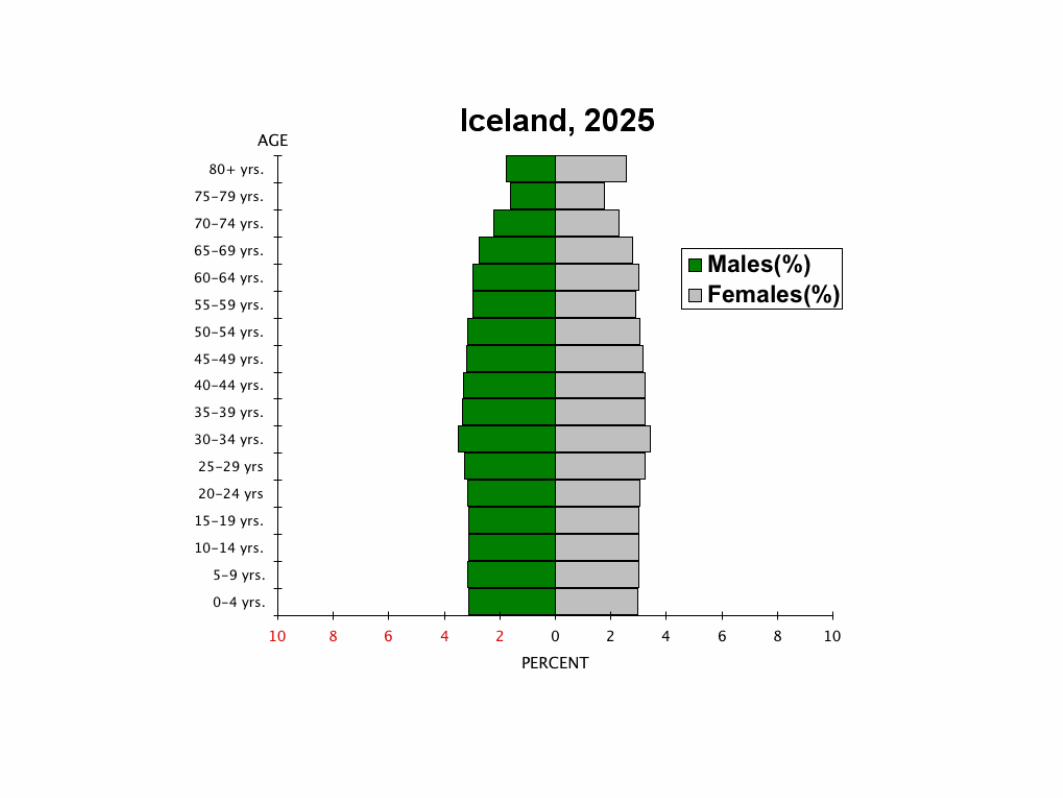
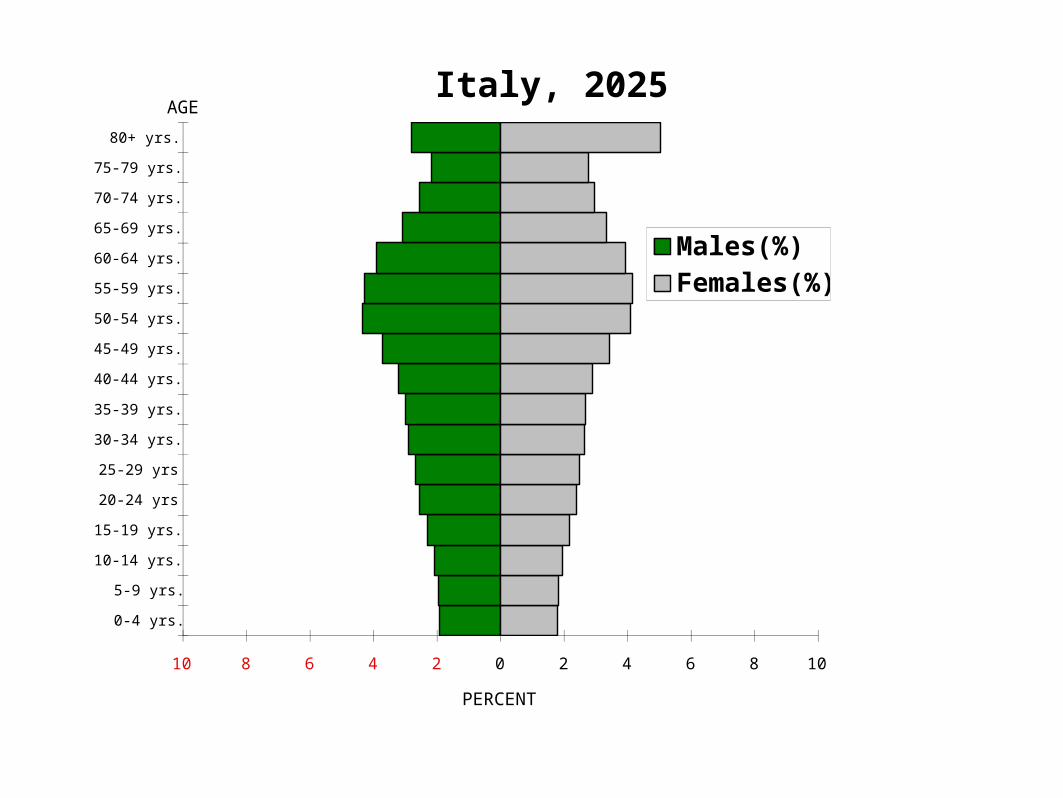
Italy, 2025
10 8 6 4 2 0 2 4 6 8 10
0-4 yrs.
5-9 yrs.
10-14 yrs.
15-19 yrs.
20-24 yrs
25-29 yrs
30-34 yrs.
35-39 yrs.
40-44 yrs.
45-49 yrs.
50-54 yrs.
55-59 yrs.
60-64 yrs.
65-69 yrs.
70-74 yrs.
75-79 yrs.
80+ yrs.
AGE
PERCENT
Males(%)Females(%)
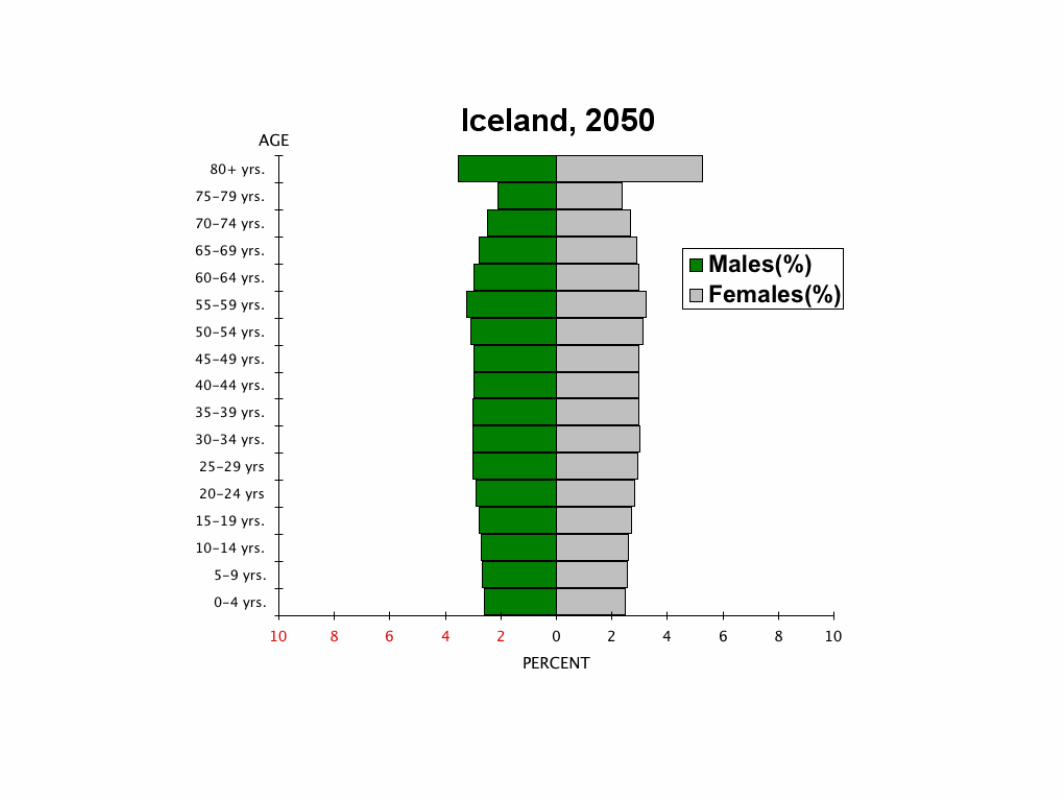
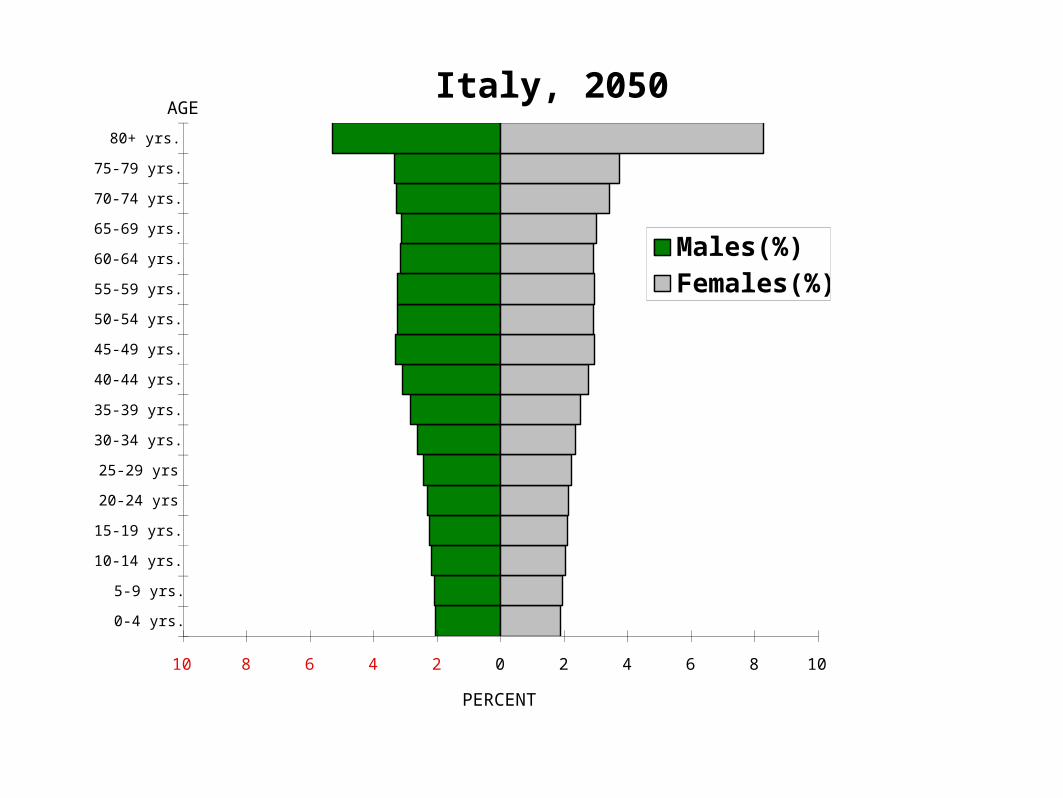
Italy, 2050
How is this population pyramid different from Italy’s?
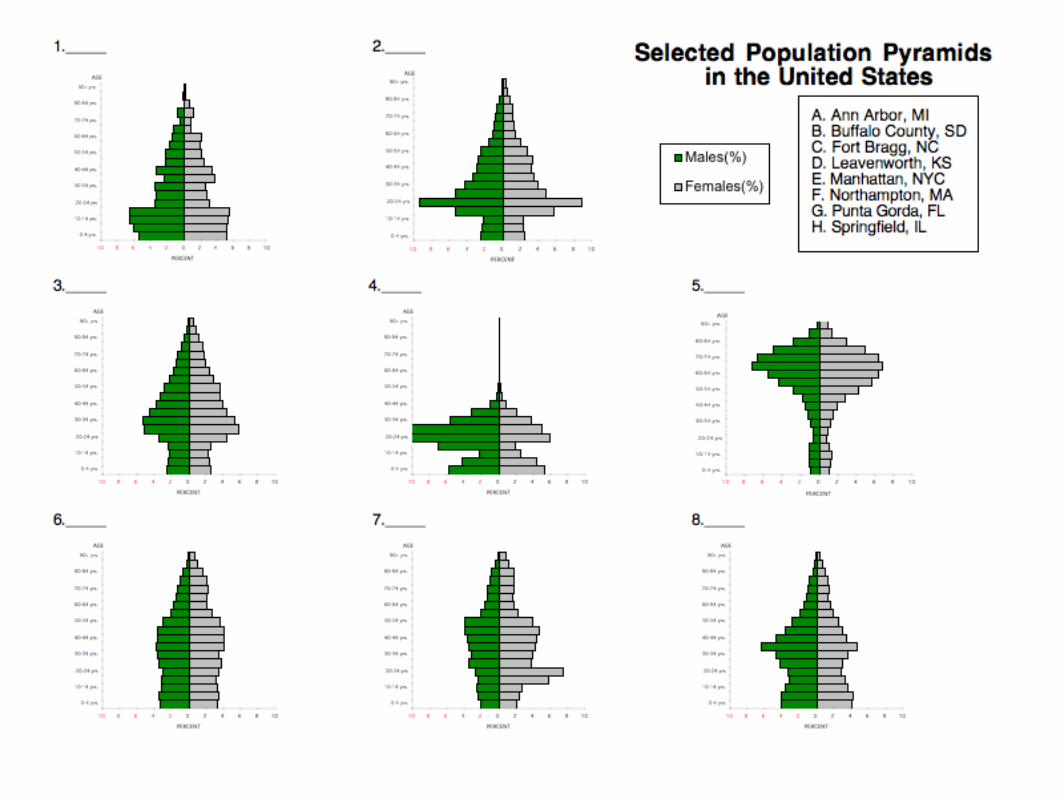

Answers
•1. B
•2. A
•3. E
•4. C
•5. G
•6. H
•7. F
•8. D


Day 2Finding Age-Sex Statistics and Constructing
Population Pyramids in Microsoft Excel
Directions for finding
Age and Sex Statistics
go to: www.census.gov
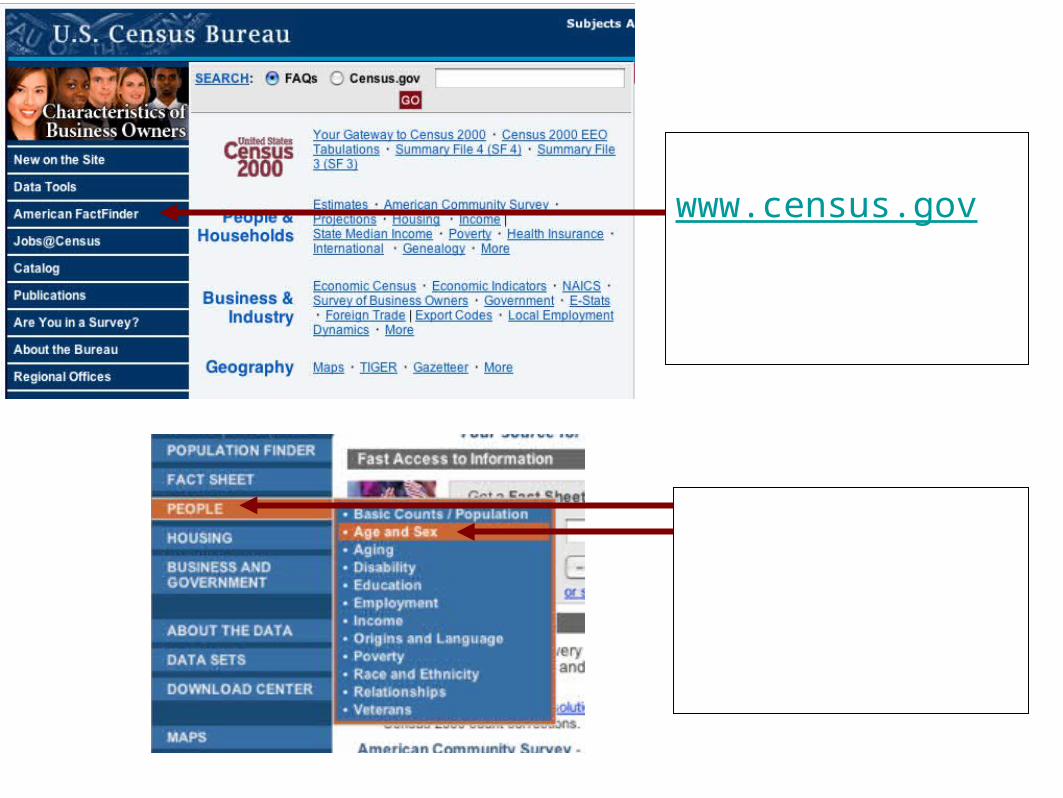
Go to www.census.gov and click on “American FactFinder”
Click on “PEOPLE” and select “Age and Sex”
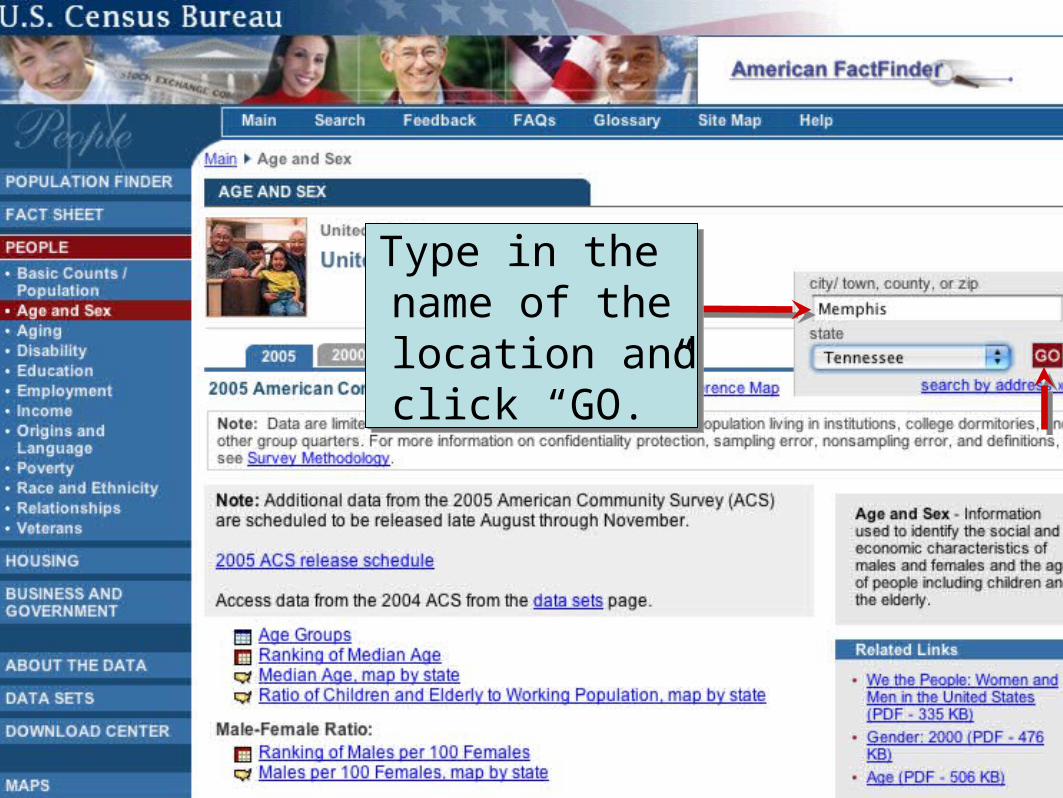
Type in the name of the location andclick “GO.”
Type in the name of the location andclick “GO.”
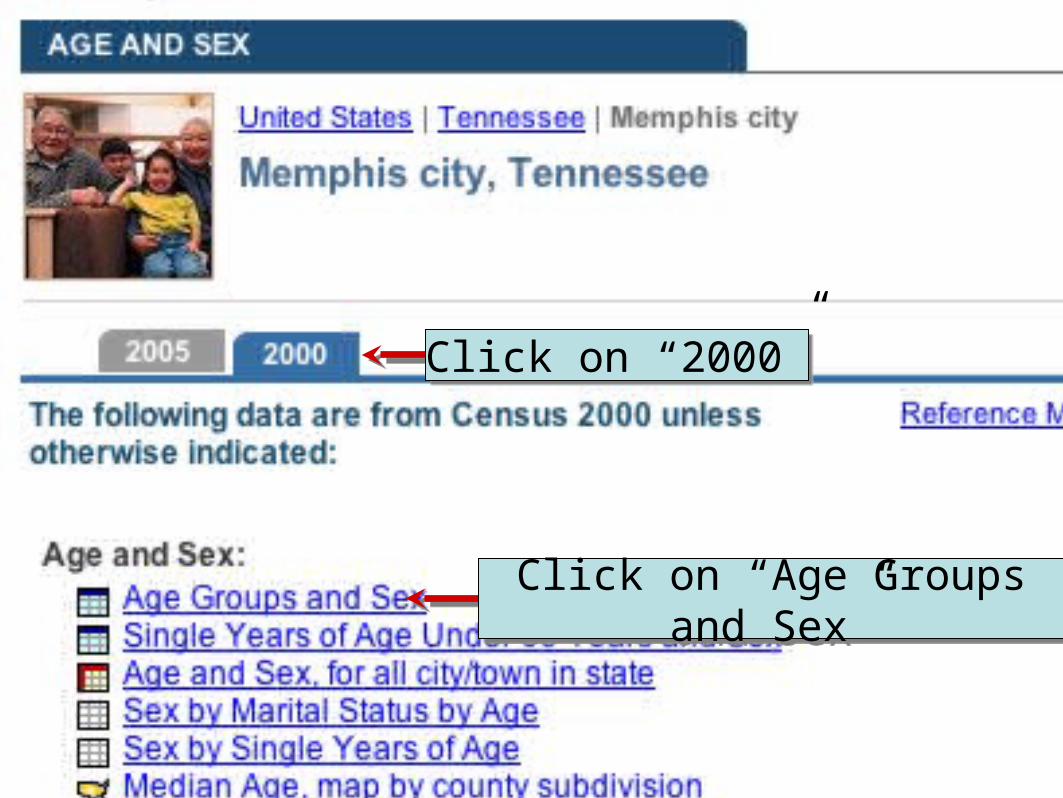
Click on “2000”Click on “2000”
Click on “Age Groups and Sex”
Click on “Age Groups and Sex”
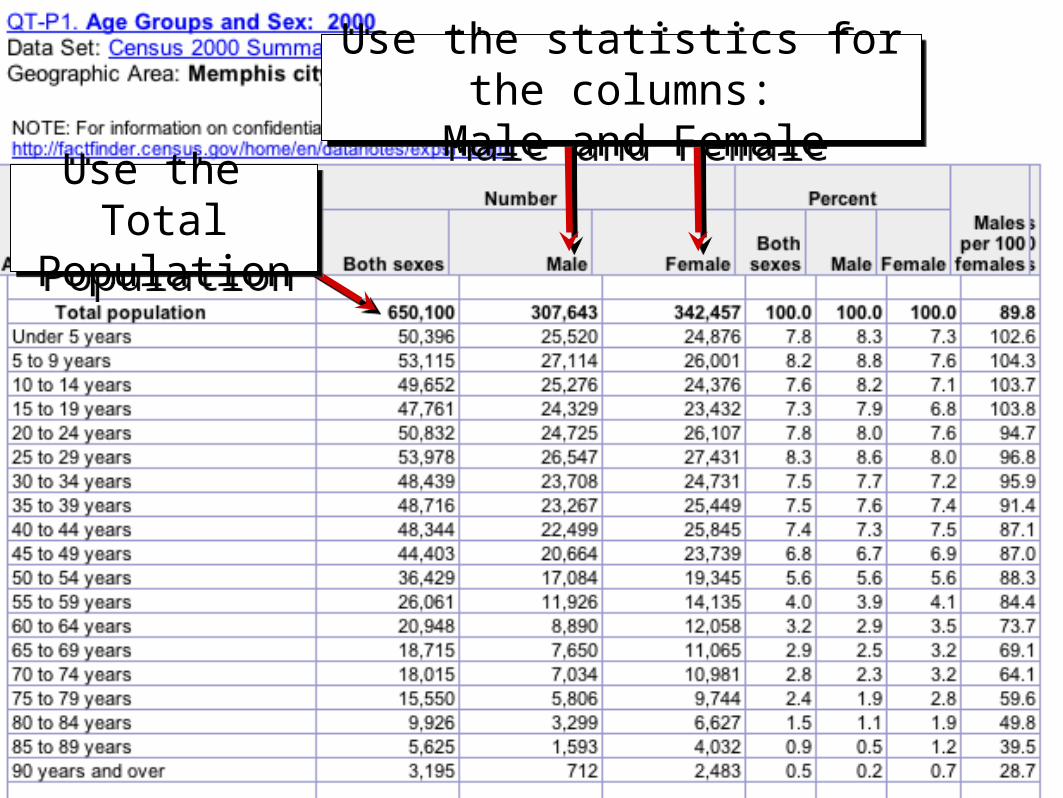
Use the statistics for the columns:
Male and Female
Use the statistics for the columns:
Male and FemaleUse the
Total Population
Use the Total
Population

Age and Sex Statistics for Countries
Around the Worldgo to: http://www.census.gov/ipc/www/idbpyr.html
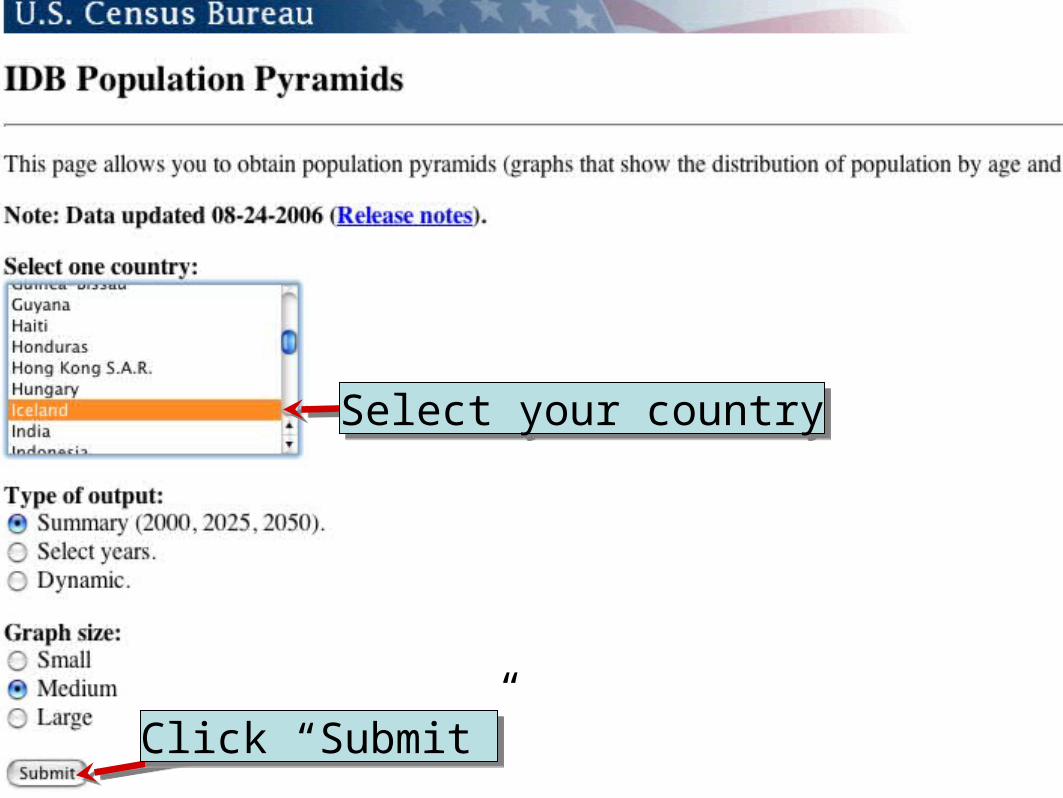
Select your countrySelect your country
Click “Submit”Click “Submit”
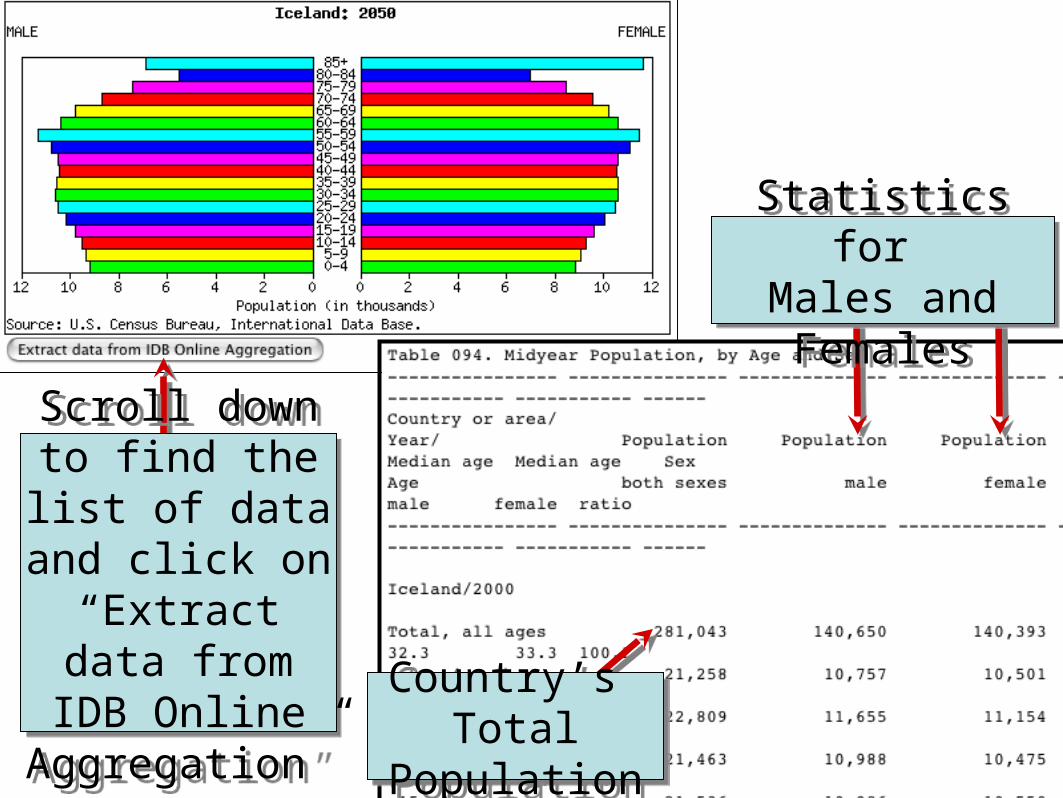
Scroll down to find the list of data and click
on “Extract data from IDB
Online Aggregation”
Scroll down to find the list of data and click
on “Extract data from IDB
Online Aggregation”
Country’s Total
Population
Country’s Total
Population
Statistics for Males and Females
Statistics for Males and Females

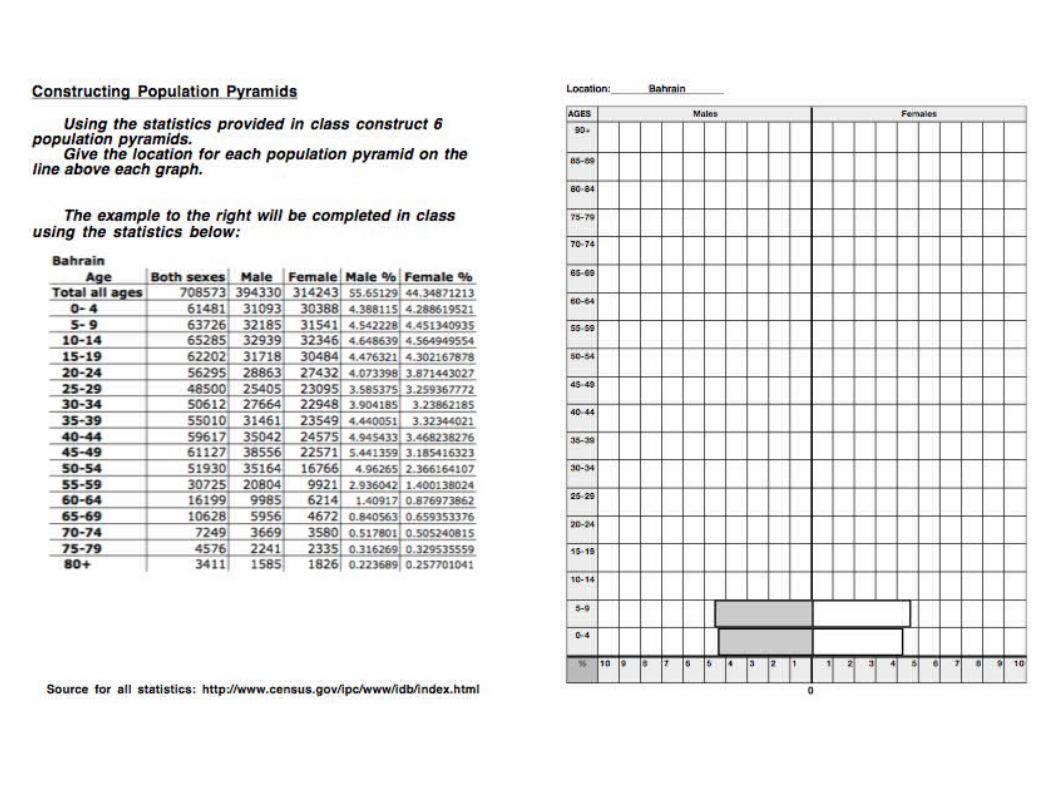
%10987654321123456789100-45-910-1415-1920-2425-2930-3435-3940-4445-4950-5455-5960-6465-6970-7475-7980-8485-8990+ FemalesMalesAGES
Directions for Constructing
Population Pyramids in
Microsoft Excel go to: www.prb.org
Population Pyramids in Excel
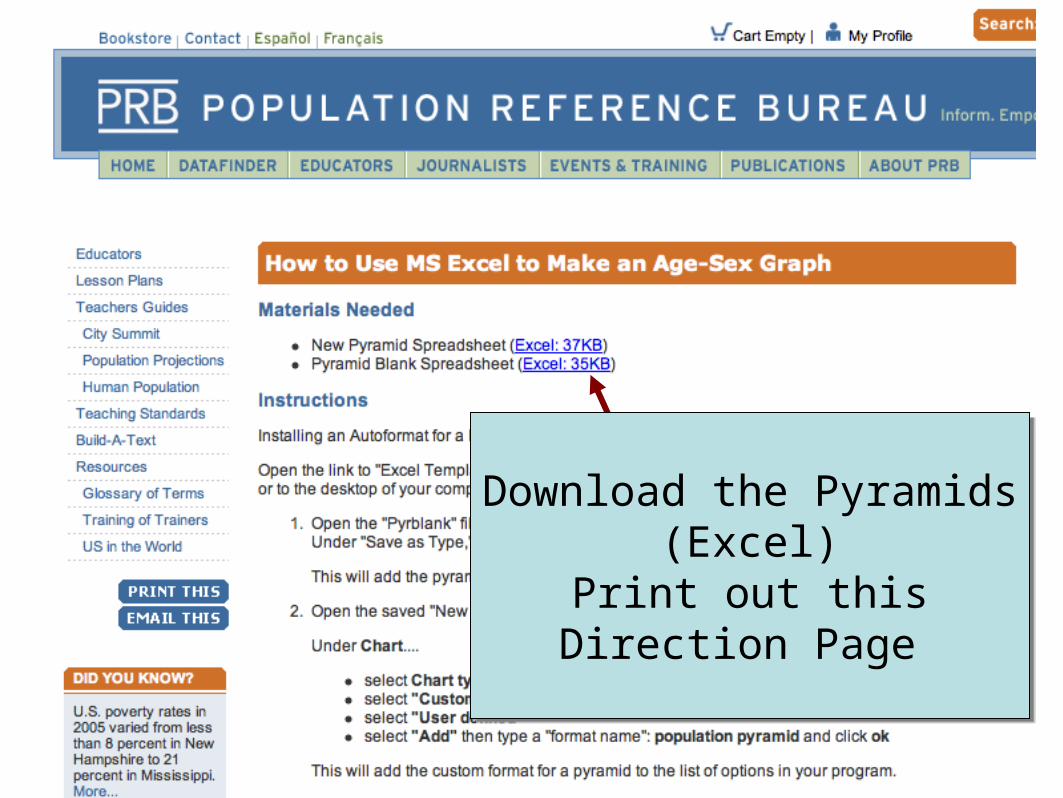
Download the Pyramids (Excel)
Print out this Direction Page
Download the Pyramids (Excel)
Print out this Direction Page
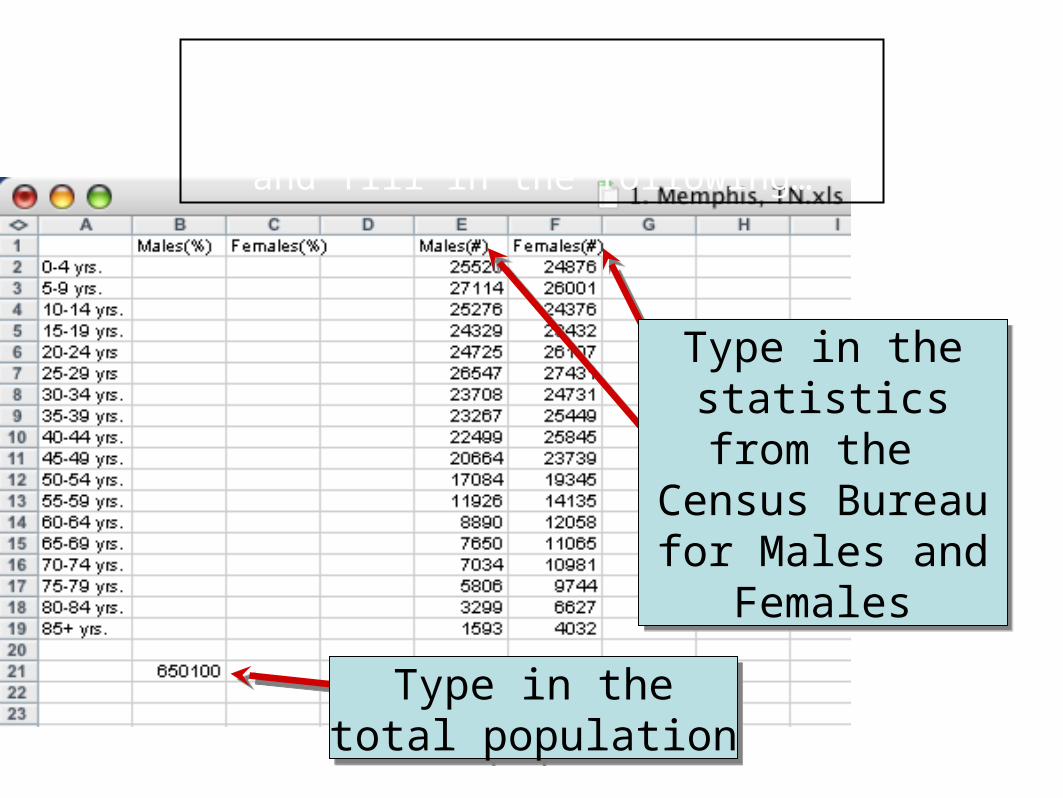
Type in the statistics from
the Census Bureaufor Males and
Females
Type in the statistics from
the Census Bureaufor Males and
Females
Type in thetotal population
Type in thetotal population
Open up a Microsoft Excel Workbook
and fill in the following…
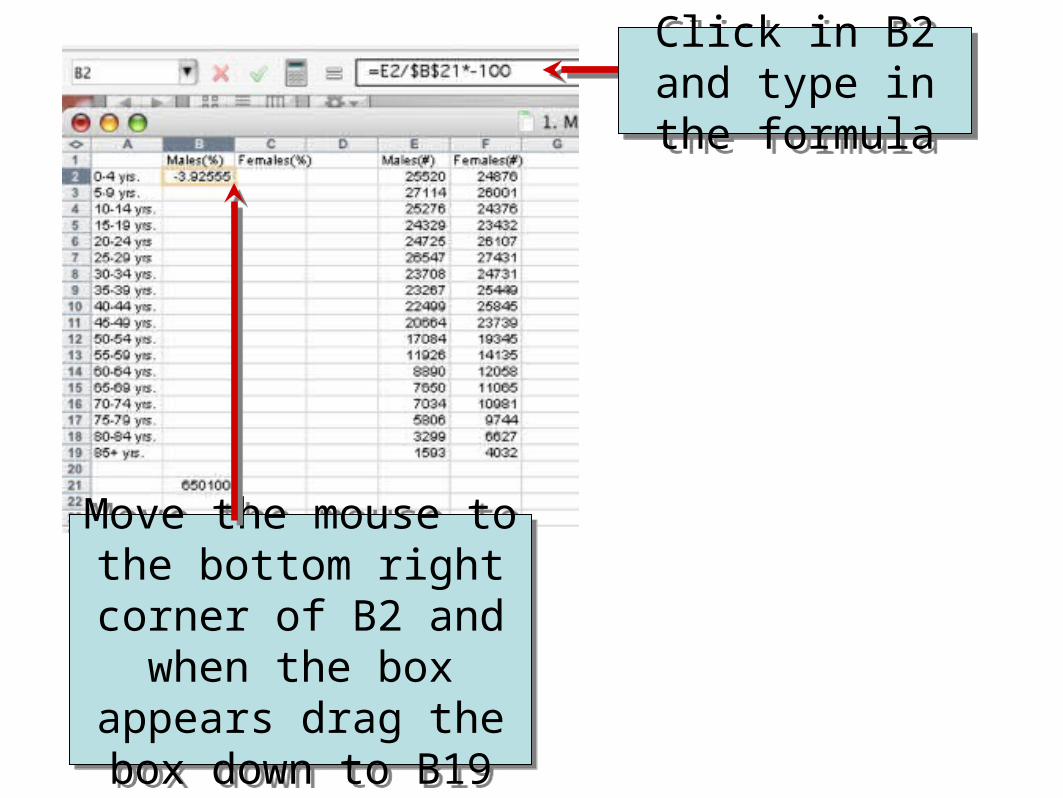
Click in B2 and type in the
formula
Click in B2 and type in the
formula
Move the mouse to the bottom right corner of B2 and
when the box appears drag the box
down to B19
Move the mouse to the bottom right corner of B2 and
when the box appears drag the box
down to B19
***The statistics for Males will all be negative numbers.
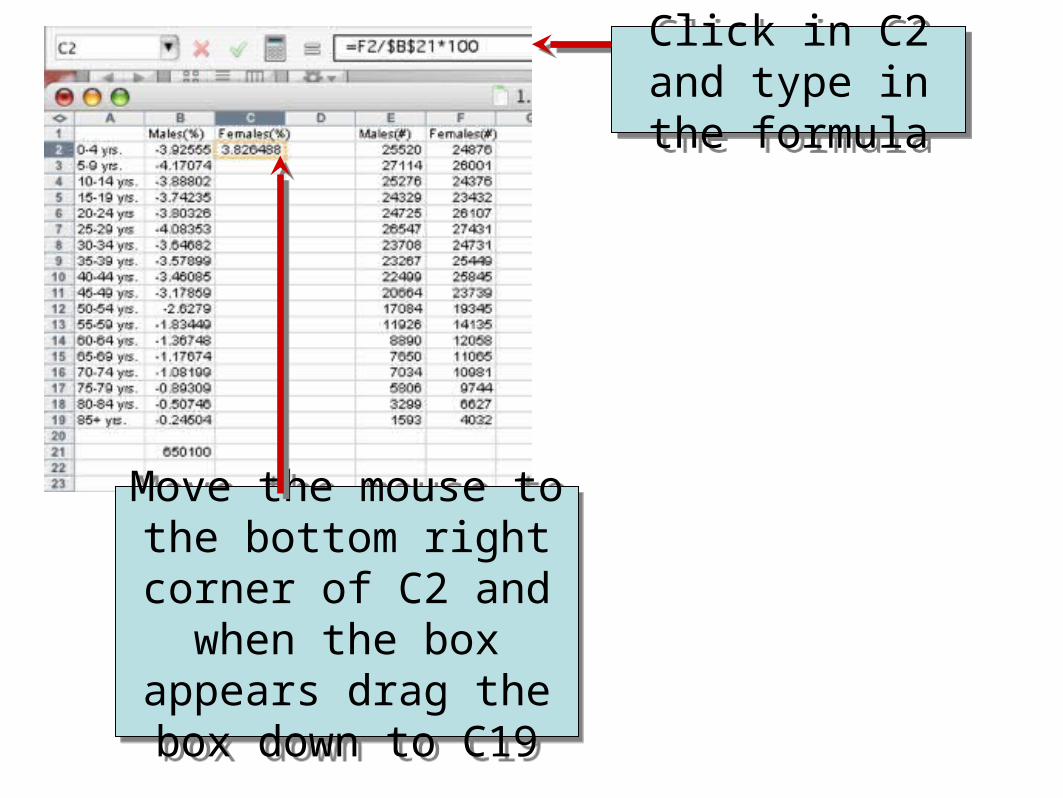
Click in C2 and type in the
formula
Click in C2 and type in the
formula
Move the mouse to the bottom right corner of C2 and
when the box appears drag the box
down to C19
Move the mouse to the bottom right corner of C2 and
when the box appears drag the box
down to C19
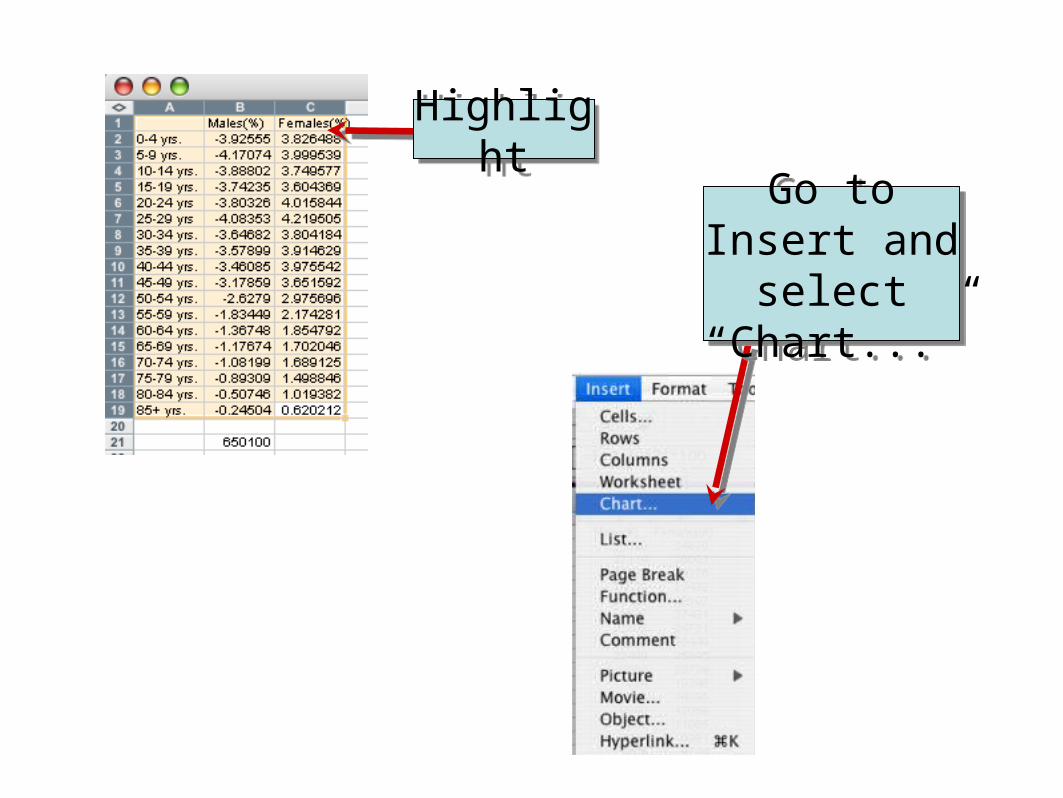
Highlight
Highlight
Go to Insert and select “Chart...”
Go to Insert and select “Chart...”
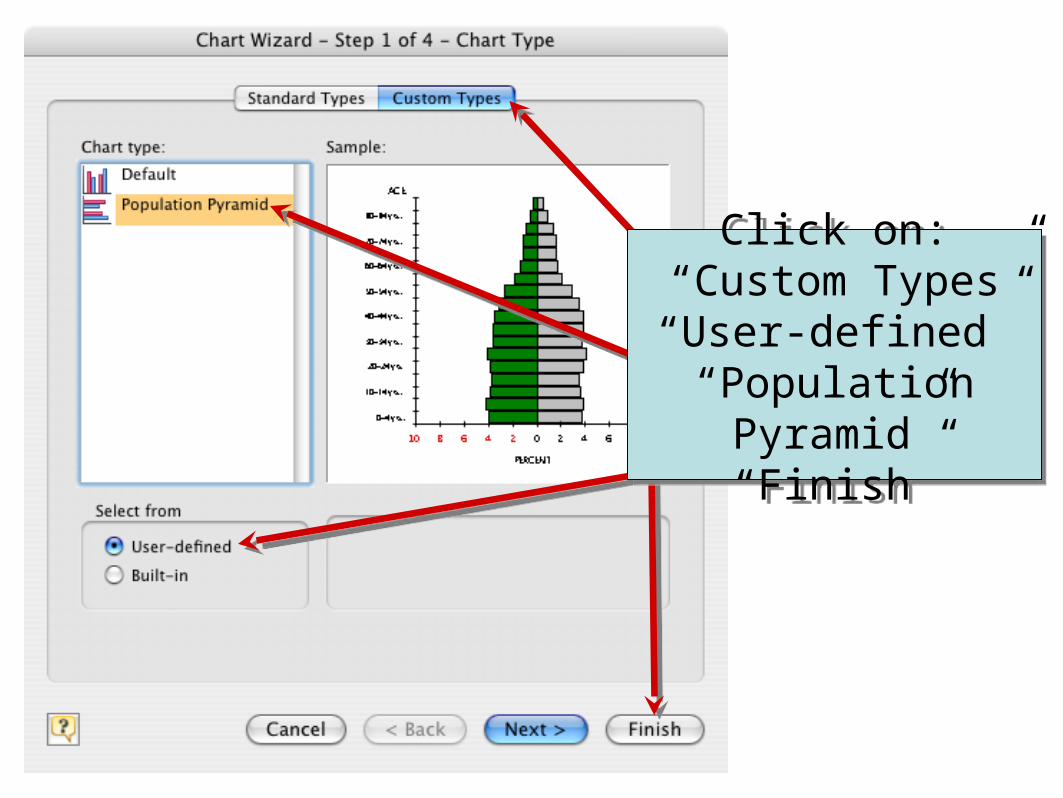
Click on: “Custom Types” “User-defined”
“Population Pyramid”“Finish”
Click on: “Custom Types” “User-defined”
“Population Pyramid”“Finish”
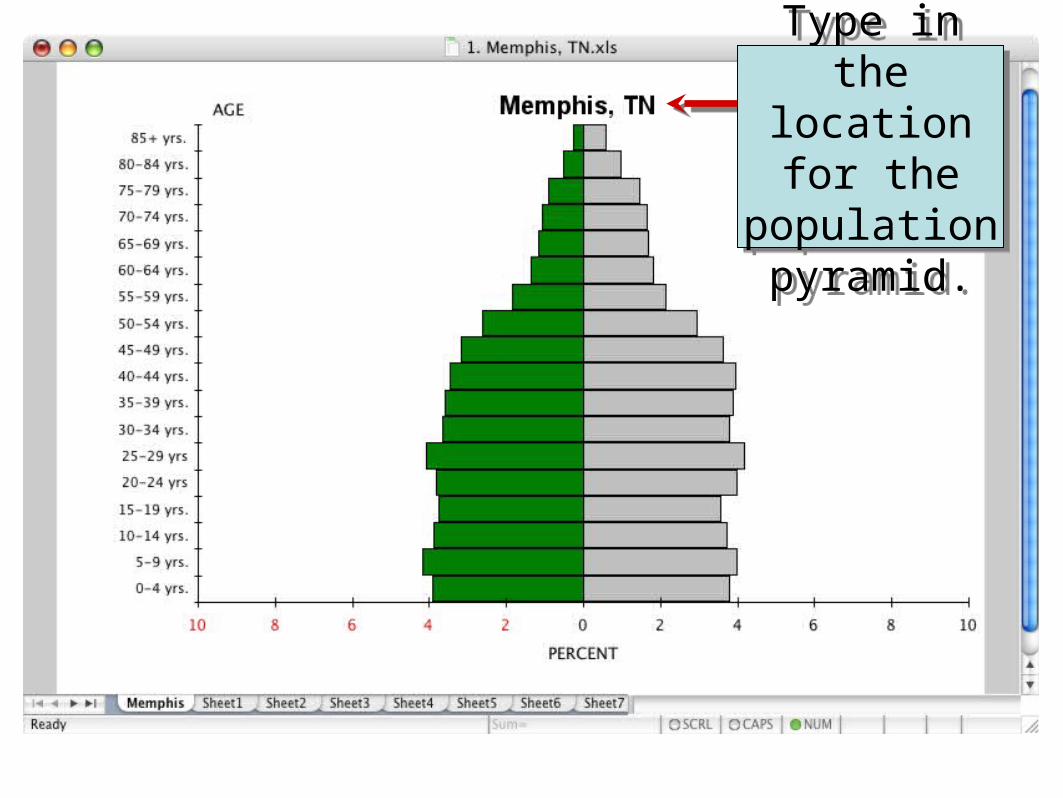
Type in the location for
the population pyramid.
Type in the location for
the population pyramid.
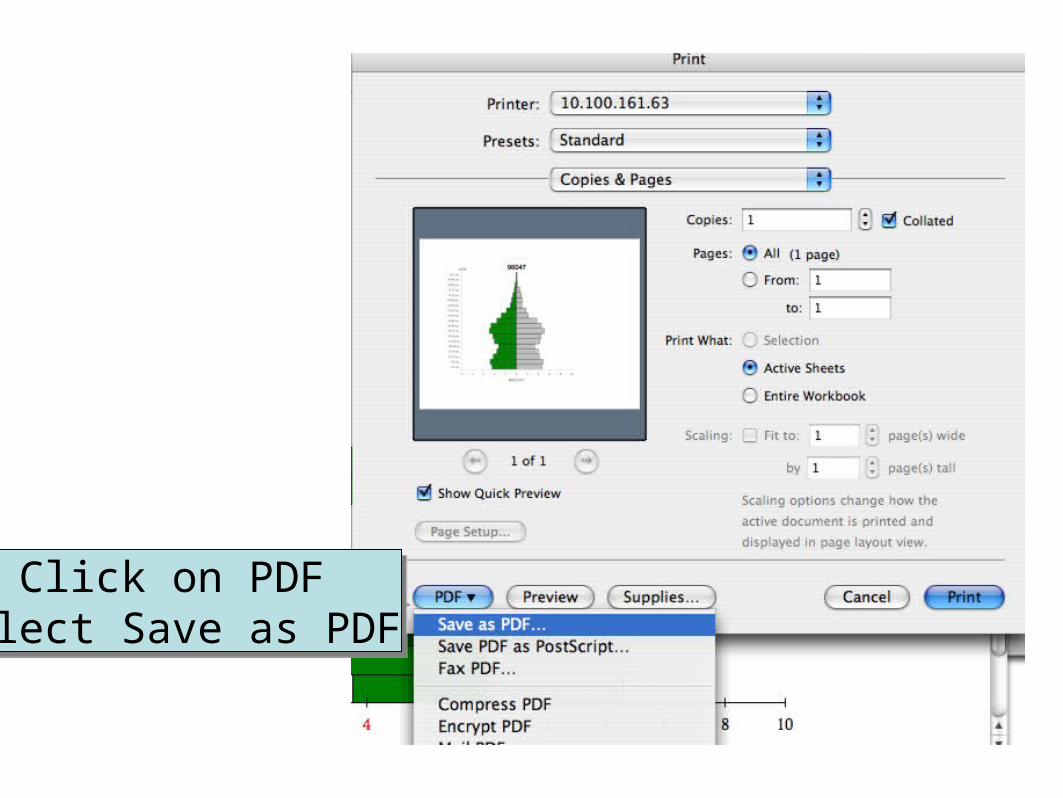
Click on PDFSelect Save as PDF
Click on PDFSelect Save as PDF

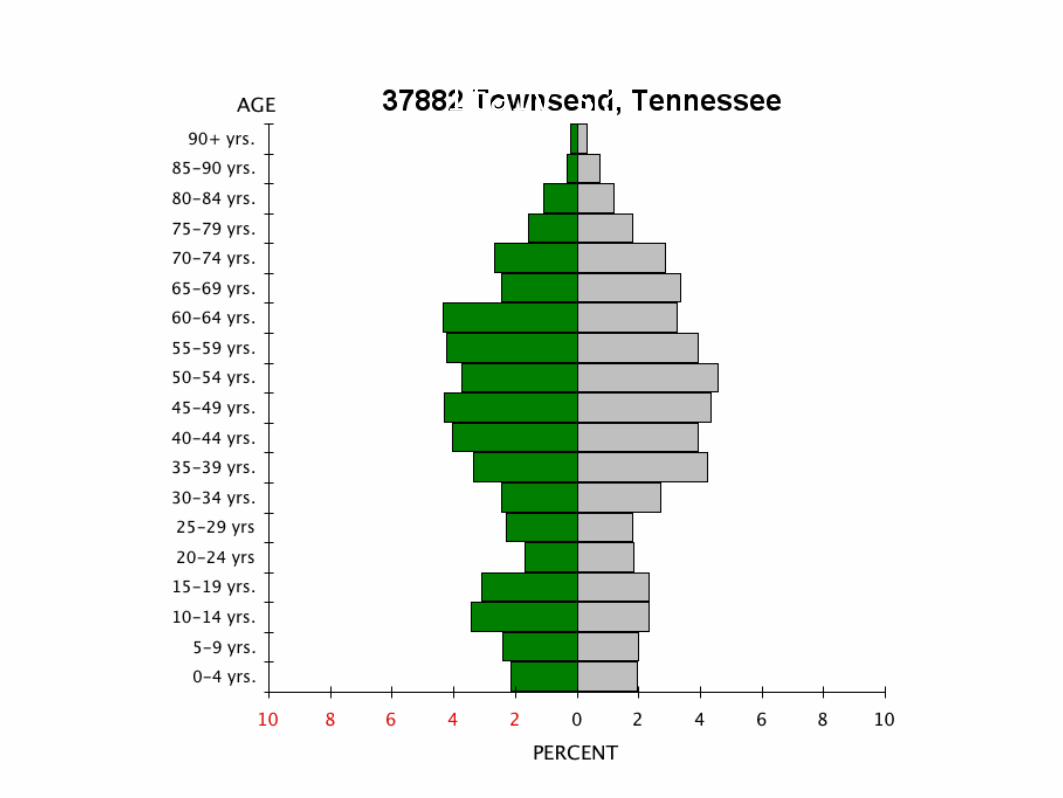
Day 3Researching a Population Pyramid Zip Code and Creating a PowerPoint Analyzing the Zip Code
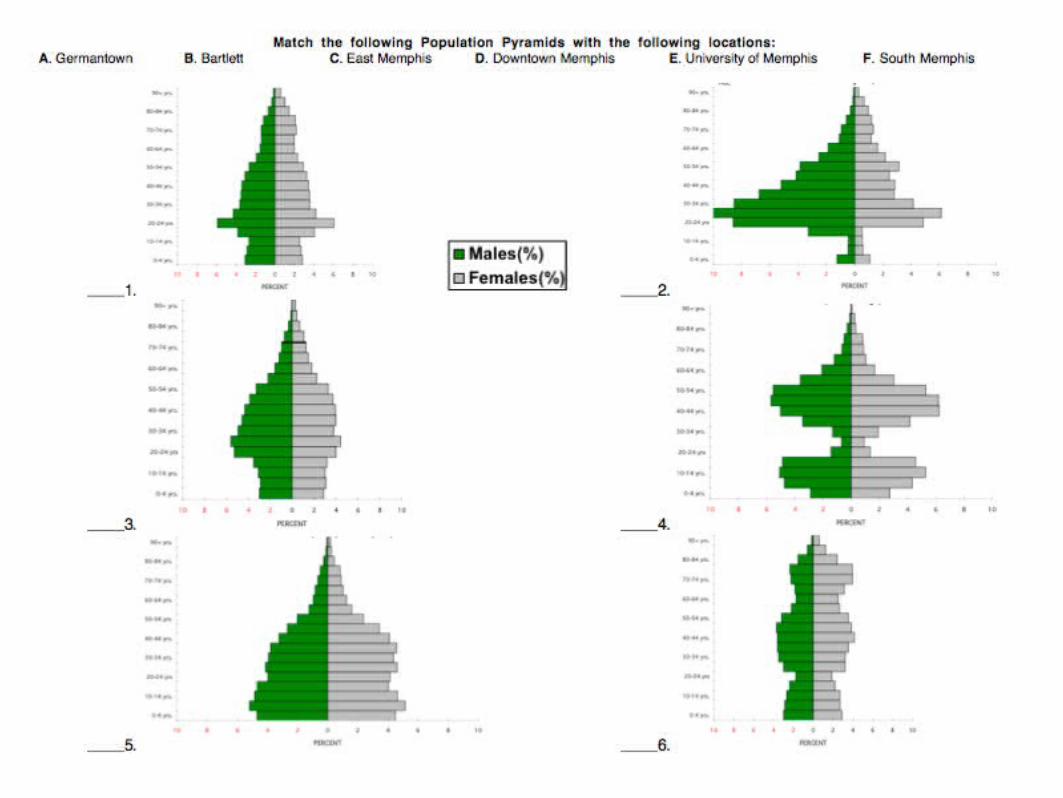

Answers
•1. E
•2. D
•3. B
•4. A
•5. F
•6. C
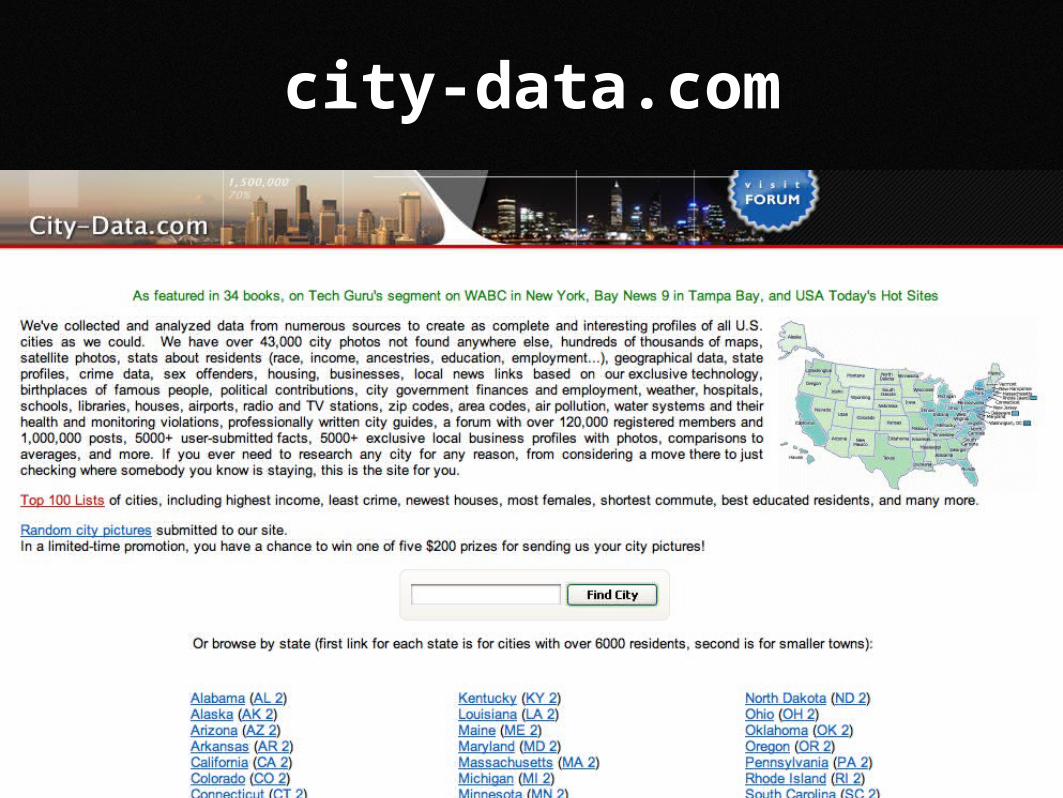
city-data.com
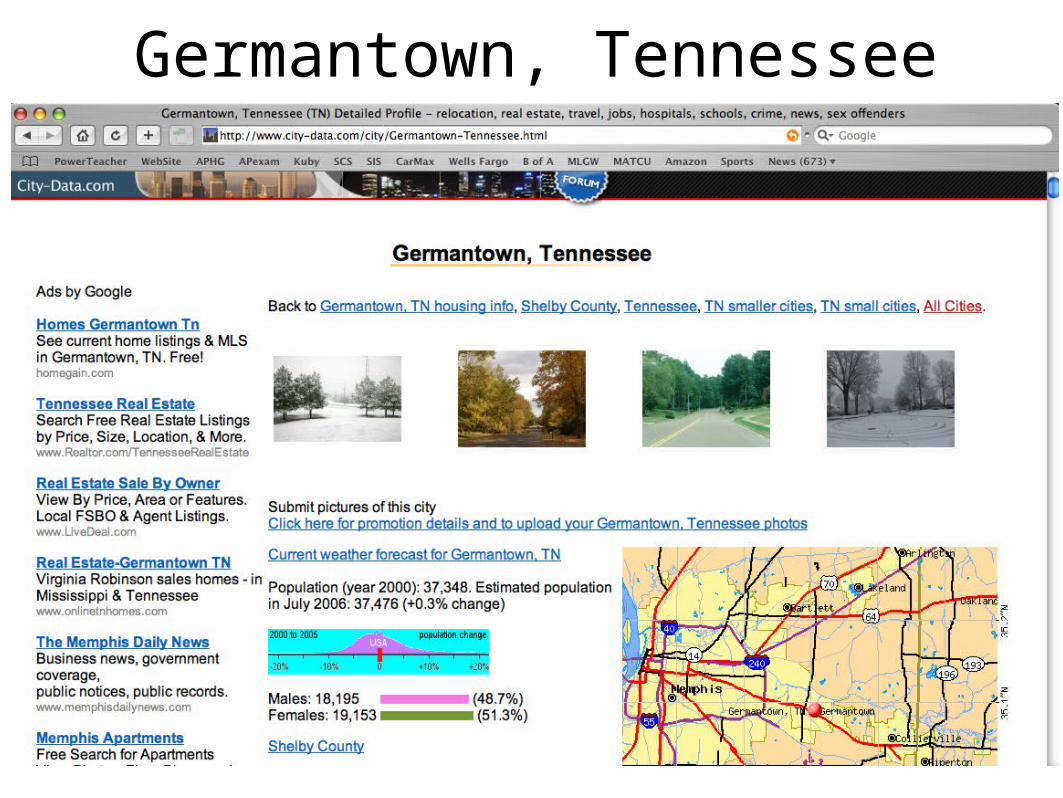
Germantown, Tennessee
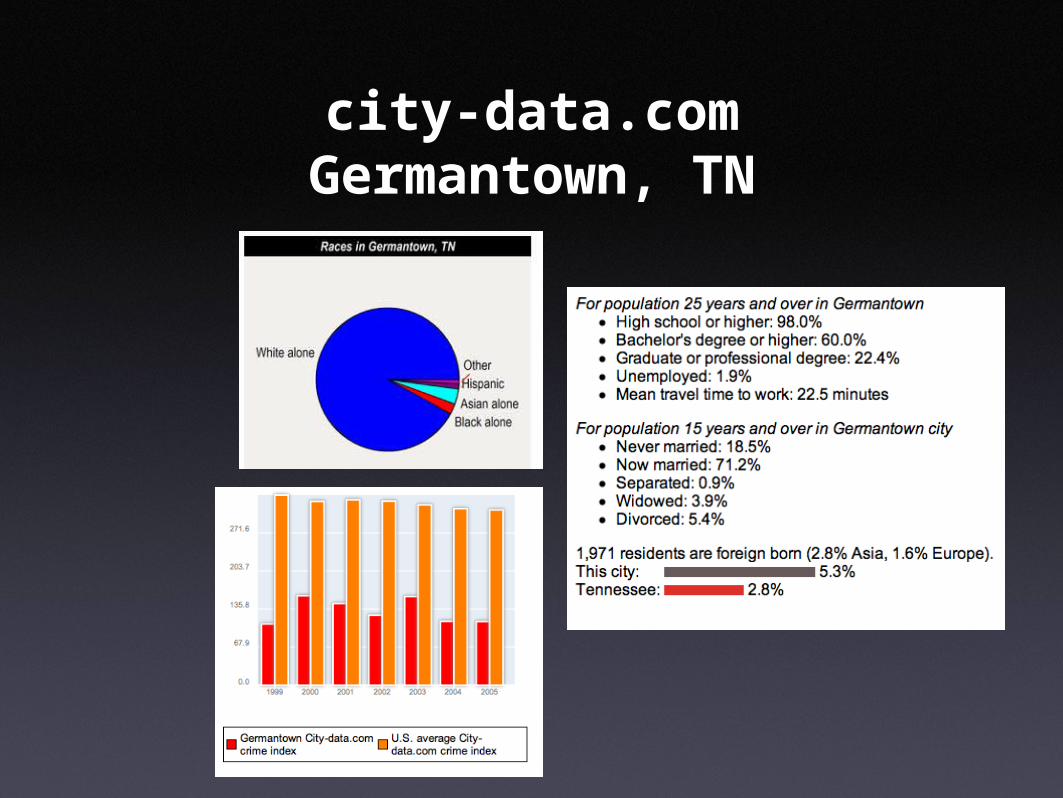
city-data.comGermantown, TN
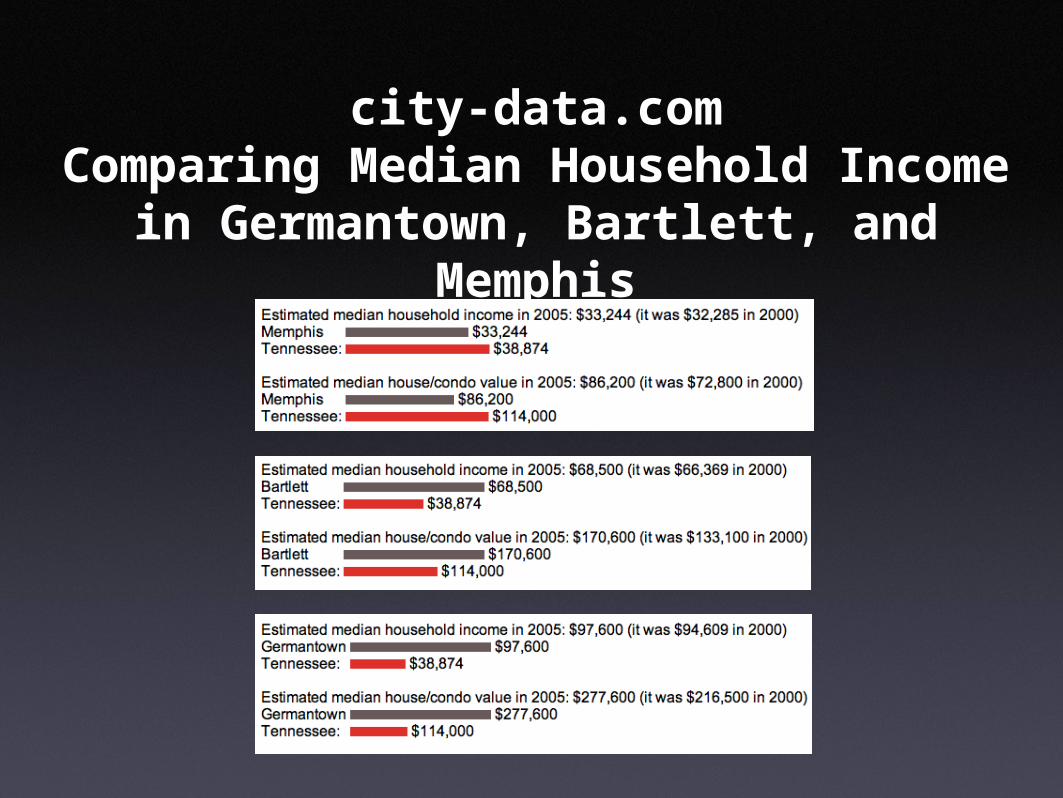
city-data.comComparing Median Household
Income in Germantown, Bartlett, and Memphis
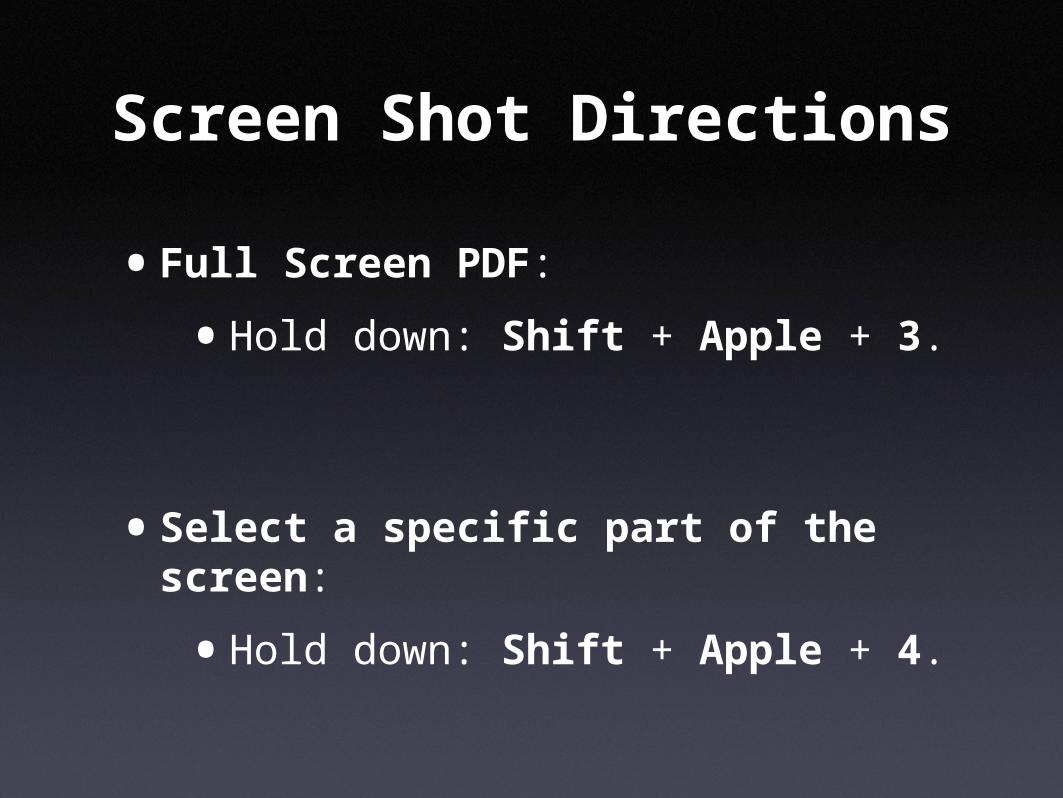
Screen Shot Directions
•Full Screen PDF:
•Hold down: Shift + Apple + 3.
•Select a specific part of the screen:
•Hold down: Shift + Apple + 4.
Yahoo or Google Maps
Find the location your wish to take a screen shot in Yahoo or Google maps.
The screen shot will be saved as Picture1.pdf on the desktop.
When you are ready to insert the pdf into your PowerPoint, drag the pdf from the desktop to your powerpoint document.
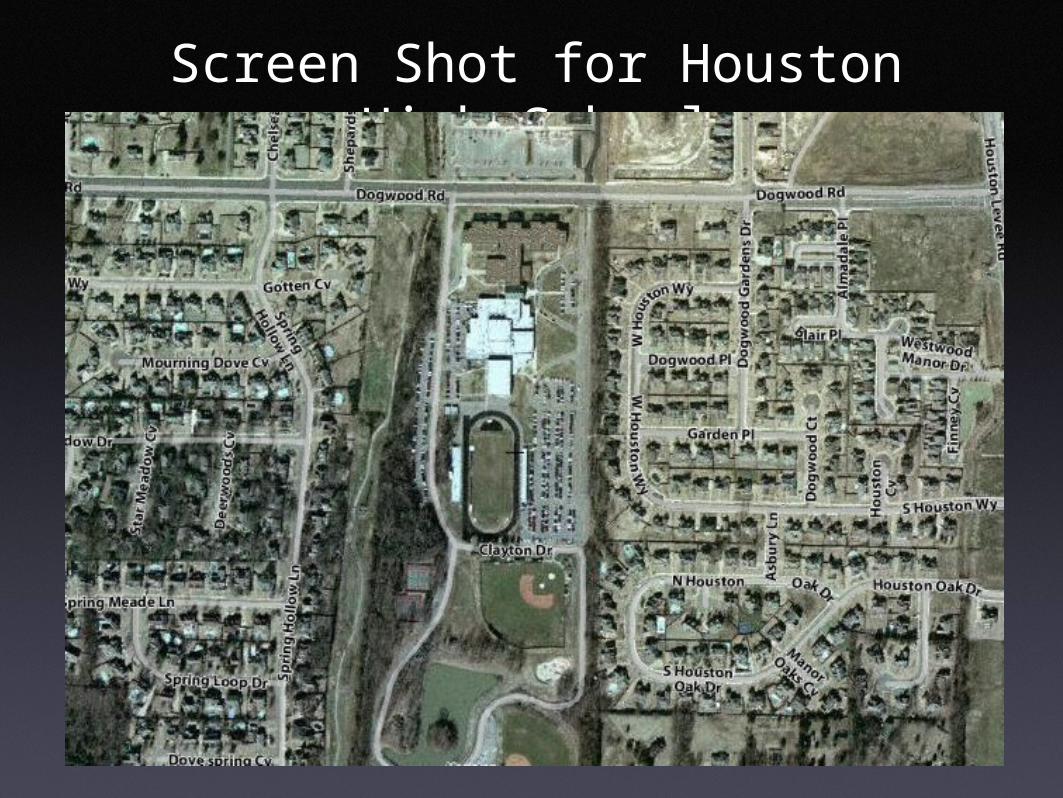
Screen Shot for Houston High School
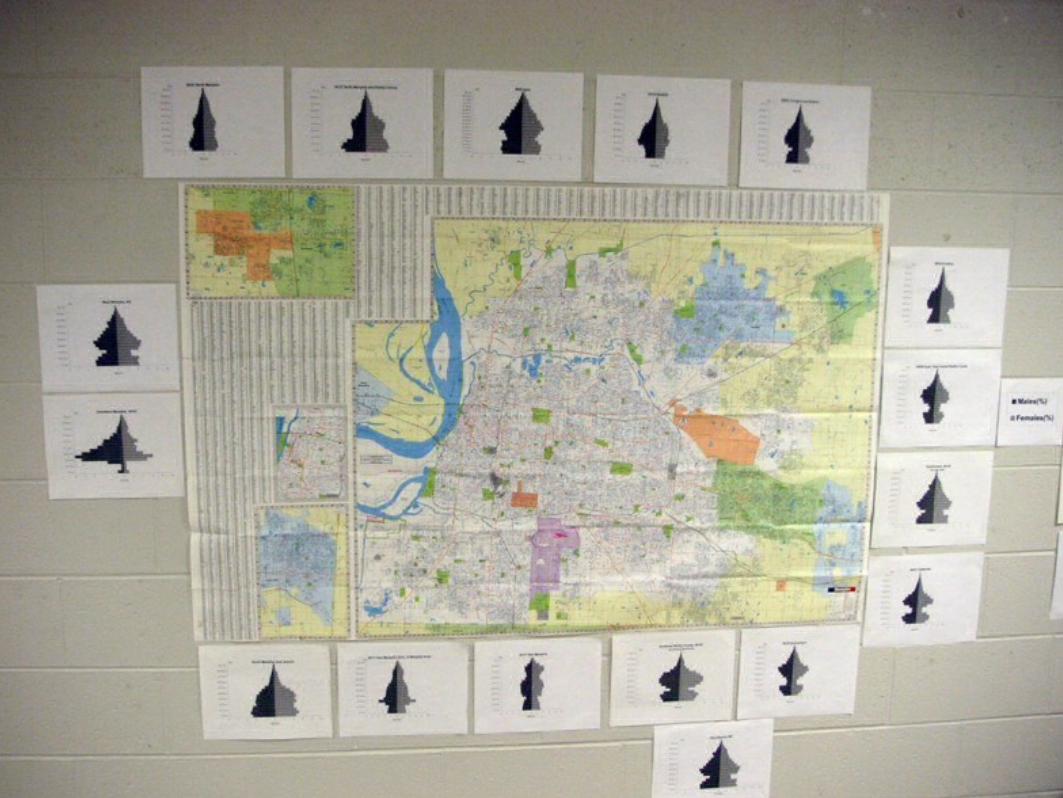
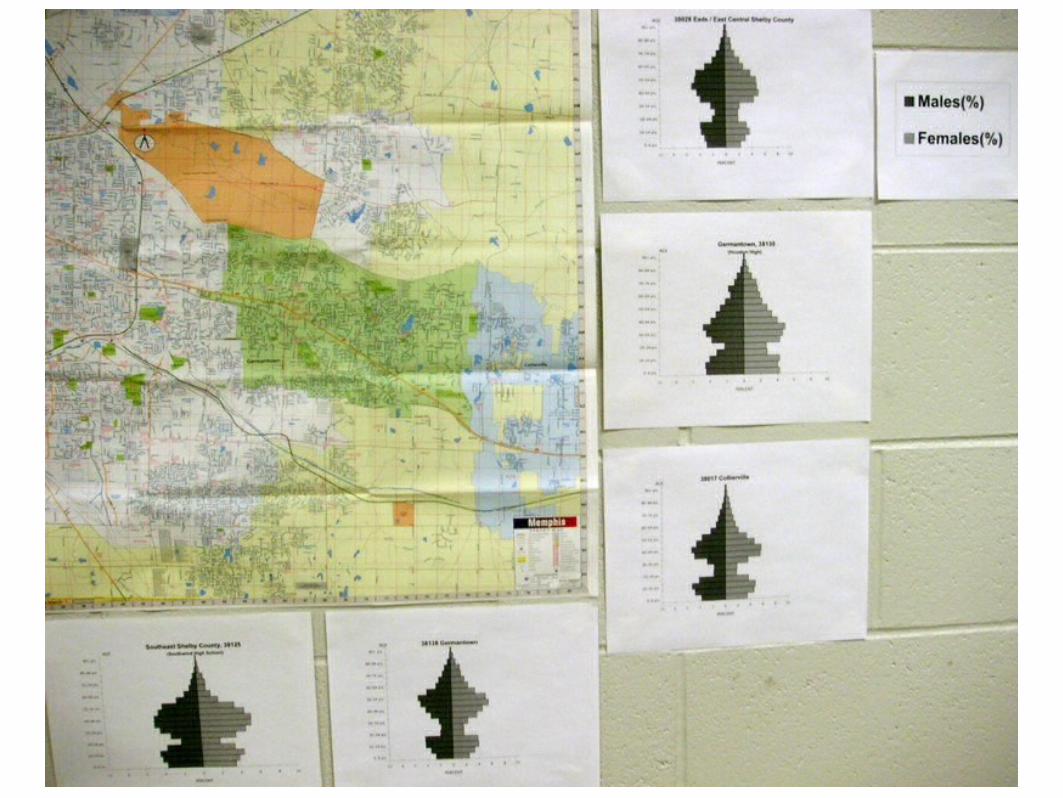
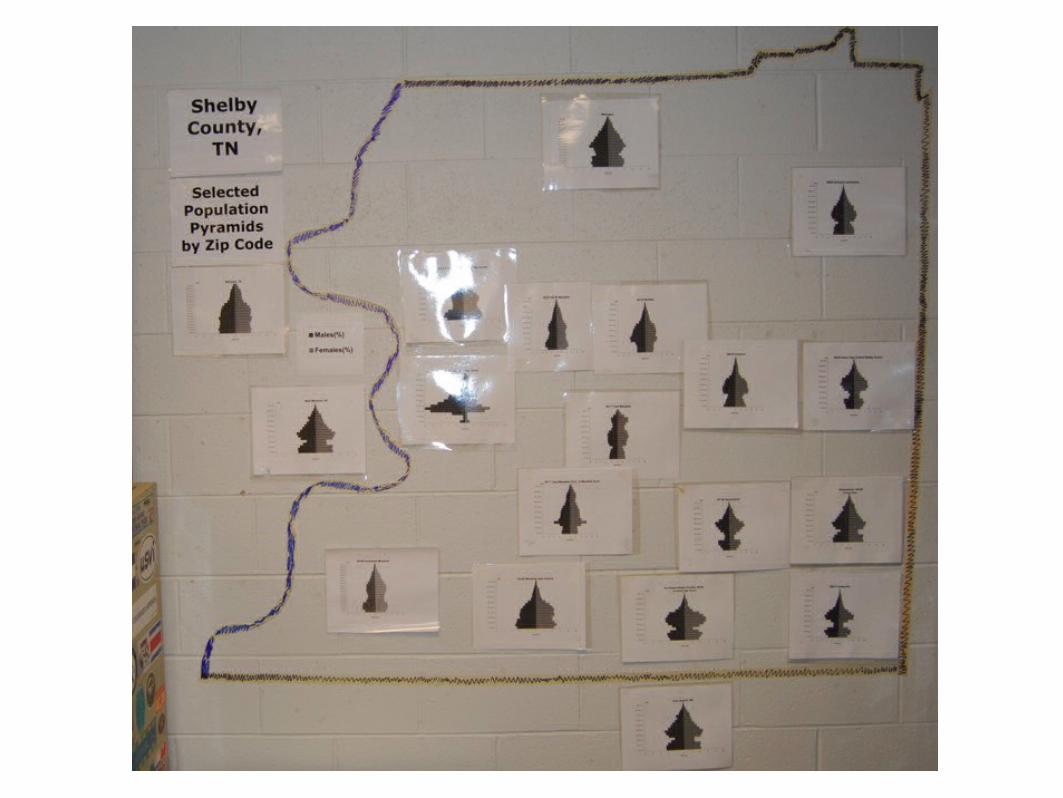
Analysis and Evaluation• With the population pyramids displayed on
the wall discuss the differences between the population pyramids in different areas of the county.
• Why are there differences?
• Where in the county is it wealthy? Poor?
• Where in the county is the population the youngest? Oldest?
• How do the suburbs differ from the inner city?