Understanding Plant Superintendents Health Products · Understanding Plant ... Pigments Increase...
20
1/26/2015 1 Understanding Plant Health & Products Bill Kreuser http://turf.unl.edu/ Characteristics of a Healthy Turf • Superintendents Perspective? • My View… 1. Efficient Energy Capture/Conversion/Utilization 2. Perceive and Adapt to Abiotic or Biotic Stress Normal “Healthy” Plant Metabolism H 2 O + CO 2 Sugar + Water Other Nutrients (N,P,K) CO 2 +H 2 O Sugar + O 2 Plant Growth Sugar Storage Seed Production Secondary Metabolites Light Energy Controlled Flow of Energy Normal/Healthy Energy Release
-
Upload
truongnhan -
Category
Documents
-
view
223 -
download
9
Transcript of Understanding Plant Superintendents Health Products · Understanding Plant ... Pigments Increase...

1/26/2015
1
Understanding Plant Health & Products
Bill Kreuser
http://turf.unl.edu/
Characteristics of a Healthy Turf
• Superintendents Perspective?
• My View…
1. Efficient Energy Capture/Conversion/Utilization
2. Perceive and Adapt to Abiotic or Biotic Stress
Normal “Healthy” Plant Metabolism
H2O + CO2 Sugar + Water
Other Nutrients (N,P,K)
CO2 + H2O Sugar + O2
Plant GrowthSugar StorageSeed ProductionSecondary Metabolites
Light Energy
Controlled Flow of Energy
Normal/Healthy Energy Release

1/26/2015
2
Potential for Problems
• Systems substrate limited
– Not enough CO2, O2, N, or light energy
– Stomata close, roots saturated, shaded environment
• Systems hindered by environmental conditions
– Pathways not working to potential
– Nutrient deficiency, temperature, water status
Consequences of Substrate Limitation
• Light Limited
– No energy to drive photosynthesis
– Photosynthesis < Respiration = Slow Death
• CO2 Limited
– Stomata closed
– High temperature in cool‐season turf
• O2 Limitation
– Anaerobic respiration is inefficient
– Burns more stored sugars and produces toxic products
Inefficiencies Increase Oxidative Stress
Absorbed electrons have to go somewhere
Free electrons forms damaging reactive oxygen species (ROS)
Different sources of stress generate damaging reactive oxygen species
Drought
Salinity
Pathogen
Stomata Close
Heavy Metals in
Soil
Production of ROS
Sub‐optimal Temps
UV & High Light
Too Much Light Energy
Plants Evolved Mechanisms to Control Reactive Oxygen Species
Production of ROS always occurs
Antioxidants
Vitamins
Pigments
Proteins
1/26/2015
3
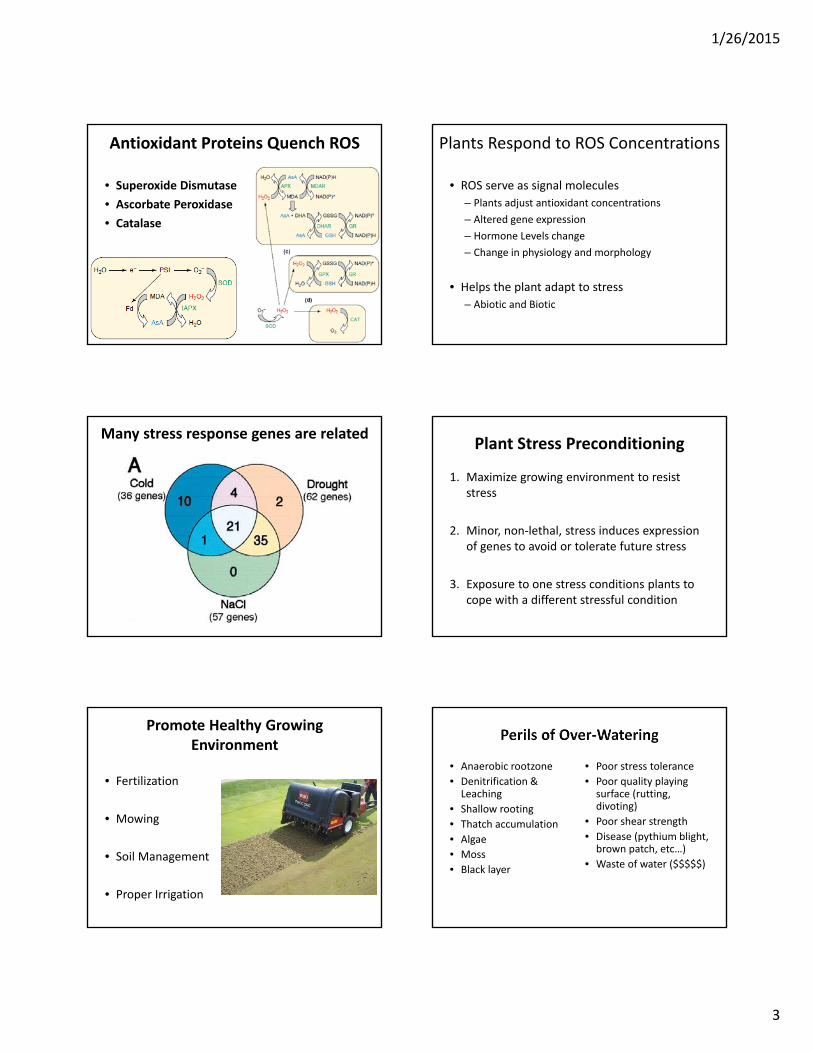
Antioxidant Proteins Quench ROS
• Superoxide Dismutase
• Ascorbate Peroxidase
• Catalase
Plants Respond to ROS Concentrations
• ROS serve as signal molecules
– Plants adjust antioxidant concentrations
– Altered gene expression
– Hormone Levels change
– Change in physiology and morphology
• Helps the plant adapt to stress
– Abiotic and Biotic
Many stress response genes are relatedPlant Stress Preconditioning
1. Maximize growing environment to resist stress
2. Minor, non‐lethal, stress induces expression of genes to avoid or tolerate future stress
3. Exposure to one stress conditions plants to cope with a different stressful condition
Promote Healthy Growing Environment
• Fertilization
• Mowing
• Soil Management
• Proper Irrigation
• Anaerobic rootzone
• Denitrification & Leaching
• Shallow rooting
• Thatch accumulation
• Algae
• Moss
• Black layer
• Poor stress tolerance
• Poor quality playing surface (rutting, divoting)
• Poor shear strength
• Disease (pythium blight, brown patch, etc…)
• Waste of water ($$$$$)

1/26/2015
4
Deficit Irrigation Preconditions Plants to Stress
• Theory:
Water Stress → Oxida ve Stress → Plant Preps
• Common Adaptations
– Deeper Rooting
– Increased Antioxidant Production
– Reduced Respiration/Increased Carb. Storage
• Result:
– Increased Stress Tolerance
Irrigation Frequency AffectsTurfgrass Roots
0
10
20
30
40
50
60
70
80
June July August September
TNC in turfgrass roots
(mg g
‐1)
Light & frequent
Deep & infrequent
Fu, J., and P. H. Dernoeden. 2008. Carbohydrate metabolism in creeping bentgrass as influenced by two summer irrigation practices. J. Am. Soc. Hortic. Sci. 133(5):p. 678-683.
Water Stress Increases Temperature Tolerance
• Drought Preconditioned Turf Increased Heat Tolerance– Wehner and Watschke,
1981; Jiang and Huang, 2000
Jiang, Y., and B. Huang. 2001
Trinexapac‐ethyl and Stress Tolerance• Increased Water Use Efficiency
– Slightly Lower ET (King et al., 1997: Marcum and Jiang, 1998; Ervin and Koski, 2001)
– Increase Salinity Tolerance and Improved Dry Down
• (Jiang and Fry, 1998; Pessarakli et al., 2006)
• Improved Heat Stress Tolerance
– More Stress Hormones and Antioxidants (Ervin and Zhang, 2003)
– Increase Sod Storage Life in Heat (Heckman et al., 2001 & 2002)
• Increased Non‐structural Carbohydrates
– During Suppression Phase Only (Han et al., 1998 & 2004; Richie 2001; and Ervin and Zhang, 2007)
Trinexapac‐ethyl Increases Cytokinins
Species TE App 2 WAIT 4 WAIT 6 WAIT 8 WAIT
‐‐‐‐‐‐‐‐‐‐‐‐‐‐‐‐‐ ng g‐1 fwt ‐‐‐‐‐‐‐‐‐‐‐‐‐‐‐‐
Bentgrass + 35.1a 50.2a 42.8a 47.0a
‐ 34.7a 43.5b 36.4b 32.6b
Kentucky bluegrass + 43.0a 44.2a 32.3a 58.3a
‐ 48.0a 32.0b 29.9a 54.1b
Bermudagrass + 86.4a 85.3a 81.6a 88.9a
‐ 89.9a 72.1b 70.5b 74.0b
Ervin and Zhang, 2008
PGR Metabolism
• Decreased Efficacy During Summer– Lickfelt el al. (2005)
– Beasley and Branham (2007)
– Kreuser and Soldat (2011)
• TE Metabolism Directly Related to Air Temperature (Beasley and Branham, 2005)
– 6.4 Day Half Life at 64°F (18°C)
– 3.1 Day Half Life at 86°F (30°C)
Doubling Temperature (°C) Doubles TE Breakdown

1/26/2015
5
GDD Can Predict These TE Growing Degree Days System• Air Temperature Predicts TE Re‐application Intervals
• Calculating GDD
– By Hand: • Get Yesterday’s Average Temperature
• Convert to Celsius
• Add Temperatures
– Use Weather.com
– Excel Spreadsheet– http://www.hort.cornell.edu/turf/
Poa annua Response
Four Week TE Applications
200 GDD TE Applications
Primo Maxx Re‐Applied Once GDD = 200 GDDModel Then Reset to Zero
Verified for Five Years In WI & NY
1x Primo (0.125 oz/M)
2x Primo (0.250 oz/M)

1/26/2015
6
What About Application Rate?
Primo Maxx Re‐applied Every Four Weeks
1x Primo (0.125 oz/M)
2x Primo (0.250 oz/M)
200 GDD TE At 1x and 2x Rates
1x Primo (0.125 oz/M)
2x Primo (0.250 oz/M)
Why Doesn’t App Rate Matter?
Loss of Efficacy
GA Synthesis PathwayInactiveGA19
↓Inactive GA20
↓Plant Active GA1
↓Inactive GA8
Causes fluctuations in suppression
TE Blocks
Plant Makes More
Plant Makes Less
Proteins
Prohexadione Ca (Anuew) lasts longer than trinexapac‐ethyl
40%
70%
100%
130%
160%
0 200 400 600 800 1000
Relative Clip
ping Yield (% Control)
Trimmit (11 oz/A)
Anuew
Primo Maxx
The Mowing Height Effect
Actual Clipping Yield Relative Clipping Yield
Primo Maxx Application Rate Primo Maxx Application Rate
Collar Height Grass Grows 50% Slower Than Greens Height Grass
More Relative Yield Suppression on Collar Height
Grass Than Greens
Collar Height 0.250” Greens Height 0.125”
Seasonal Variation in Cold Hardiness

1/26/2015
7
Cold Hardiness Inversely Related to Crown Moisture Content
Cold Temperature Stress Management
• Fall Fertilization
• Raise Mowing Heights
• Soil Management
• Irrigation?
CarbohydratesProline & Soluble
Protein
Avoiding Light Stress
• Healthy Growing Conditions
– Sufficient Nitrogen
– Air flow and irrigation
– Pigments
Pigments Increase Visual Quality & Alleviate Light Stress
Non‐Treated Turf Pigment

1/26/2015
8
Evaluation of Plant Colorants
Turfgrass Colorants:
– Dyes, pigments, paints
– Alter light quality
– Pigments aggressively marketed during the past 5 years
• Claims:– Cool turf, oxidative stress prevention, kill pathogens, early spring green‐up, less N
0%
10%
20%
30%
40%
50%
60%
70%
80%
90%
100%
200 300 400 500 600 700 800 900 1000
Norm
alized
Absorban
ce
Wavelength (nm)
Turfscreen
Harmonizer
UVB
UVA
UVC
Pigment Absorption Spectra
UV Damage Region
VA Tech researchers found Green Lawngercolorant increased UVB tolerance
Higher Quality Too
Avoid High Rates of Colorants in Shade
Pigments Field Evaluations
Harmonizer ControlCivitas
Harmonizerw/ Civitas
Pigments Improved Turf Quality
Visual Turfgrass Quality (1‐9 Scale; >6 Acceptable)
Treatment CI
Civ+2xHarmonizer
8.2a
Civ+Harmonizer 7.7b
Harmonizer 7.5c
Turf Screen 7.4c
Control 7.1d
Civitas Alone 5.0e

1/26/2015
9
Surface Temperature Increased 1‐6°F
Treatment °C
Civ+Harmonizer
30.3a
Civ+2xHarmonizer
30.3a
Civitas Alone 30.1b
Harmonizer 29.8c
Control 29.4d
Largest Temperature Increase Immediately After App
Pigment Field Conclusions
• Pigments Mask Turfgrass Decline
• Alleviates UV and High Light Stress
• Temperatures Increased with all Treatments
–Green Color
–Potential to Reduced Transpiration (Implications???)
The Role of Fungicides and Plant Health
Primary Role of Fungicides is Biotic Stress Avoidance
Secondary Benefits of Strobilurins• Growth Chamber Wheat:
– Increased Roots
– Increased Antioxidants
– Increased Cytokinins(Grossman and Retzlaff, 1999)
• Growth Chamber Creeping Bentgrass:
– No Differences in Visual Quality
– Occasionally Increased Root Architecture with Pyraclostrobin
Brosnan et al. (2010)
Field Evaluations of Strobilurins
University of Tennessee Research
Quality: Strobilurin > Other Fungicides Only During Disease Breakthrough
Rooting: No Difference Between Products
Strobilurins are Very Effective Fungicides
Plants Can Sense Pathogens

1/26/2015
10
Adapted from Cortes‐Barco, 2010
Civitas Primes Plant Defense (JA) Pathway
DefenseProteins
Building Blocks
AlmostJA
ActiveJA
How Does Civitas Work?
Two Potential Mechanism
1. Directly Elicits a Response (PAMP)
2. Preconditions Plants
• Civitas is Slightly Inhibiting Gas Exchange
• Mild Photoinhibition
• Oxidative Stress
• Triggers Plant Defense
Harmonizer™ Pigment Important Component of Civitas
• Limits Absorbed Light and Oxidative Stress
Civitas Reduces CO2 ExchangeRate Amax
0 A
1.3 A
2.5 B
5.1 B
10.2 C
Respiration & QuantumYield Not Affected By Civitas
Light x TMT: p<0.001
Reduced Transpiration Rate
TMT: p<0.001
15.25
15.50
15.75
16.00
16.25
0 1.3 2.5 5.1 10.2
Tran
spir
atio
n (
mo
l H
2O m
-2s-1
)
Civitas Application Rate (ml m-2)
0
1.3
2.5
5.1
10.2
A
A
C
AB
BC
Another Sign of Decreased Gas Exchange
Civitas Alters Cuticle Structure
Control 48 Hrs.
48 Hrs. 2nd App
Sign of Oil Persistence
Strive to Promote Good Agronomics First

1/26/2015
11
How to Increase Plant Health
• Reduce Environmental Stress ‐Avoidance
–Abiotic Stress
–Biotic Stress
• Increase Plant Stress Tolerance
–Precondition Plants For Stress
–Alter Plant Physiology
The Big Three!
CULTIVATION AND MOWING
Sharpness is a Good Thing!
Sharp Dull
Effect of reel/bedknife contact and sharpness on mm of shredded leaf tips
*
**

1/26/2015
12
Frequency of Clip
FOC Formula
Ground speed(inches per minute)Reel RPM
number of Reel Blades.
Preliminary Data 2005
* *
Bedknife position at various aggressiveness settings relative to center line of reel
Effect of bedknife position on basal rot anthracnose
% p
lot i
nfec
ted
NonAg
Neutral
VeryAg
NonAg
Neutral
VeryAg
NonAg
Neutral
VeryAg
0.105 0.115 0.135

1/26/2015
13
Mowing Summary
• Mower Setup Crucial to Plant Health– Mower Sharpness
– Frequency of Clip
– Aggressiveness of Cut
– Design of Mower
• Aggressive Mowing Practices Promote Disease and Annual Weeds
Irrigation Basics
• Irrigation is a primary cultural practice– Required to maintain high quality turf
• Replace rootzone water lost through evaporation and transpiration– Affected by temperature, solar radiation,
humidity, wind speed, and rooting depth
Irrigation Basics
• Amount and frequency change throughout the growing season
Under-Irrigation
Wilt
Insufficient Rootzone Moisture(under-watering)
• Slow growth (recuperative potential)
• Wilt
• Hard surface
• Susceptible to insect pests
Brown patch
Thatch accumulation
Excessive Irrigation

1/26/2015
14
Excessive Irrigation
Algae / moss
Poa annua
Excessive Irrigation
Frequent irrigation maintains soil water content at levels most prone to compaction!
• Leaching
• Anerobic rootzone
• Shallow rooting
• Denitrification
• Thatch accumulation
• Algae
• Moss
• Black layer
• Poor stress tolerance
• Poor quality playing surface (rutting, divoting)
• Poor shear strength
• Disease (pythium blight, brown patch, etc…)
• Waste of water ($$$$$)
Deficit Irrigation Preconditions Plants to Stress
• Theory:
Water Stress → Oxidative Stress → Plant Preps
• Common Adaptations– Deeper Rooting
– Increased Antioxidant Production
– Reduced Respiration/Increased Carb. Storage
• Result:
– Increased Stress Tolerance (Healthier?)
Irrigation Frequency AffectsTurfgrass Roots
0
10
20
30
40
50
60
70
80
June July August September
TNC in
turfgrass roots
(mg g‐
1)
Light & frequent
Deep & infrequent
Fu, J., and P. H. Dernoeden. 2008. Carbohydrate metabolism in creeping bentgrass as influenced by two summer irrigation practices. J. Am. Soc. Hortic. Sci. 133(5):p. 678-683.
Water Stress Increases Temperature Tolerance
• Drought Preconditioned Turf Increased Heat Tolerance
– Wehner and Watschke, 1981; Jiang and Huang, 2000
• Increased Low Temperature Tolerance
– Lindsey Hoffman, Michelle DaCosta, Jeffrey Ebdon, and Jiuzhou Zhao, 2009
Jiang, Y., and B. Huang. 2001
1/26/2015
15
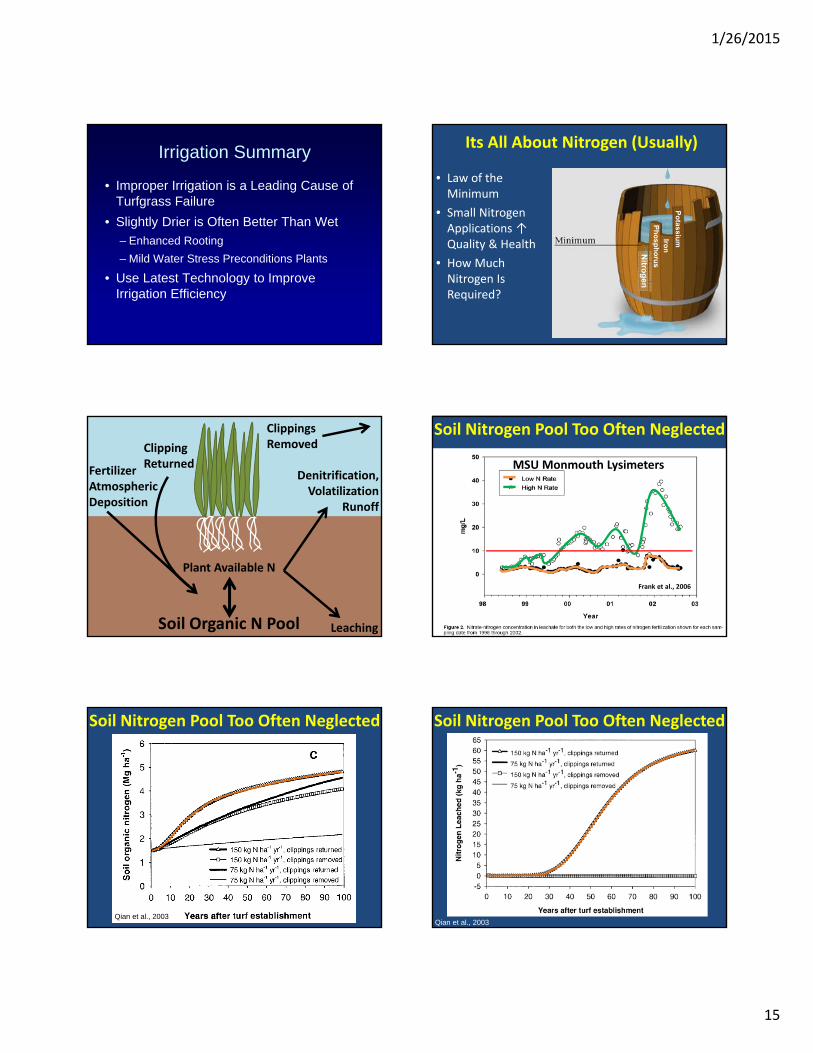
Irrigation Summary
• Improper Irrigation is a Leading Cause of Turfgrass Failure
• Slightly Drier is Often Better Than Wet
– Enhanced Rooting
– Mild Water Stress Preconditions Plants
• Use Latest Technology to Improve Irrigation Efficiency
Its All About Nitrogen (Usually)
• Law of the Minimum
• Small Nitrogen Applications ↑ Quality & Health
• How Much Nitrogen Is Required?
Nitro
gen
Po
tassium
Ph
osp
ho
rus
Iron
FertilizerAtmospheric Deposition
Clipping Returned
Denitrification,Volatilization
Runoff
Leaching
Plant Available N
Soil Organic N Pool
Clippings Removed
Soil Nitrogen Pool Too Often Neglected
Frank et al., 2006
MSU Monmouth Lysimeters
Soil Nitrogen Pool Too Often Neglected
Qian et al., 2003
Soil Nitrogen Pool Too Often Neglected
Qian et al., 2003

1/26/2015
16
Checkbook Method of N Management
Nitrogen Additions = Nitrogen Removal/Loss
Annual Nitrogen Surplus• Increasing Soil N• Excessive Growth/Thatch• Nitrogen Leaching
Annual Nitrogen Deficit• Slow Depletion of Soil N• Steady Decline in Quality• Eventual Stand Collapse
Checkbook Method of N ManagementEasier Said Than Done!
DON’T COMMIT TO AN ANNUAL NITROGEN RATE!
Goldilocks Method
Strategies to Increase Efficiency1. Light Frequent Soluble N2. Flexibility in Application Rate3. Return Clippings & Use PGRs
to reduce N Removal 4. Monitor Changes Over Years
Real Nitrogen Fertility Example
• ‘Memorial’ Bentgrass Putting Green
• 3 Biweekly N Rates– 0.1, 0.2, 0.4 lbs N/M
• +/‐ Trinexapac‐ethyl
• Measured Quality, Clipping Yield, Color Biweekly
• Other Nutrients Sufficient
Clipping Yield Response to Nitrogen Rate
0.1 lb N/M0.2 lb N/M0.4 lb N/M
Doubling N Rate Increased Clipping Yield 0‐40%
What About Clipping Yield and Ball Roll?
No Correlation of Yield and Ball Roll
Fertilize to Maintain Acceptable Quality, Not to Increase Green Speed
Average Turfgrass Quality and Color Index

1/26/2015
17
0.2 lbs N/M With Primo
0.4 lbs N/m No Primo
The Proof is in the Pictures
TE Reduces N Requirements
0.1 0.2 0.3 0.4 0.50.0
(lbs N/M)
No TETE (0.25 oz/M, 200 GDD)
Nitrogen Requirements for THIS PUTTING GREEN
Desired QualityRating
Nitrogen Needed to Achieve Desired Quality Nitrogen Reductions with
Primo MaxxWithout TE With TE
1-9 Scale lbs N/M/month % lbs N/M/Season
7.0 0.3 0.4 25% -0.6
7.5 0.4 0.6 33% -1.2
8.0 0.5 1.0 50% -3.0
•TE applied every 200 GDD at 0.25 oz/M
•Assuming 6 Month Growing Season •May to October
Sometimes N Isn’t the Problem
Other Nutrient Deficiencies
Phosphorus Deficient Turfgrass
• Resembles LDS• Non‐responsive to N Fertilization
• High pH Root Zones at Risk
• Reliable Soil Test Interpretations Available

1/26/2015
18
Befo
re P Fe
rtilization
Week A
fter P
Fertilizatio
n
Make Small Test Applications to Verify Soil Tests
K, Ca, Mg, S, & Micronutrient Soil Test Results are Particularly Problematic
Pop Quiz: Why is this plot greener than the
control?
K Fertilization of Turf
-Can range from 0-800 kg ha-1 year -1
(mean ~ 200 kg ha-1 year -1 ).
-Why so high?-Taken from corn?-Early on, N rates of ~400 kg ha-1 year -1
-Helps drought, traffic, heat tolerance?-Prevents snow mold damage?
Microdochium nivalePink Snow Mold (PSM)
Typhula incarnataGrey Snow Mold (GSM)
Potassium affects snow mold susceptibility?
0 kg ha-1 year -1
200 kg ha-1 year -1
800 kg ha-1 year -1
Dr. Micah Woods
0 kg ha-1 year -1
200 kg ha-1 year -1
800 kg ha-1 year -1
Why would K affect snowmold susceptibility?
-An osmotic affect?
-Gene expression, plant defense?-JA Pathway or others?
-By modifying carbon metabolism?- Non-structural carbohydrates- Carbon skeletons from the TCA cycle

1/26/2015
19
Pink Snow Mold Pink Snow Mold
Kaplan- Meier Survival Analysis of LI50
Pr > χ2 = 0.2777
Day
s to
50%
Nec
rosi
s (L
I 50)
Grey Snow Mold Grey Snow Mold Kaplan- Meier Survival Analysis of Day50
Pr > χ2 = 0.0071
Day
s to
50%
Nec
rosi
s (L
I 50)
Grey Snow Mold Regression of Day50 by Tissue K Content
Day
s to
50%
Nec
rosi
s (L
I 50)
Grey Snow Mold Regression of Day50 by Tissue K Content
Day
s to
50%
Nec
rosi
s (L
I 50)
Ca ?Mg ?Metabolites ?Others ?

1/26/2015
20
Calcium
-Correlated with both diseases on multiple sample dates.
-Cell wall composition?
-Cellular messaging?
Disease Summary
-K Fertilization affects snow mold severity.-Particularly for GSM.
-Differences between pathogens? -A function of pathogen aggressiveness?
-Subtle effects of K?
-What about Ca?
Metabolites?
Sure Fire Ways to Boost Plant Health
1. Maintain a Healthy Growing Environment
2. Be More Flexible with N Applications
3. Setup Mowing Equipment to Minimize Plant Stress
4. Maintain Growth Suppression with PGRs to Realize Secondary Benefits
5. Experiment with New Products Slowly– Great Potential Requiring More Research


![Uncertainty in the response of transpiration to CO2 and ... · Download details: IP Address: ... and plant transpiration [1]. ... transpiration, to increase. Note, that the scaling](https://static.fdocuments.net/doc/165x107/5b4a6b6b7f8b9a403d8c3170/uncertainty-in-the-response-of-transpiration-to-co2-and-download-details.jpg)