UNDERSTANDING NETWORK PICTURE COMPLEXITY: AN … · UNDERSTANDING NETWORK PICTURE COMPLEXITY: AN...
33
1 UNDERSTANDING NETWORK PICTURE COMPLEXITY: AN EMPIRICAL ANALYSIS OF CONTEXTUAL FACTORS Carla Ramos*, Stephan C. Henneberg, Peter Naudé mIMP Research Group Manchester Business School University of Manchester Booth Street West Manchester (United Kingdom) Submitted to the 26 th IMP Conference, Budapest, Hungary September 2010 Abstract There has recently been increasing interest in the relationship between managers’ perceptions of their surroundings and their interactions with other actors. This sense-making issue is linked to the development of the concept of network pictures. Our paper investigates a hitherto neglected aspect of network pictures: their complexity. In several bodies of literature complexity has been found to affect firms’ action and performance. We theoretically derive a model of complexity, which is then used to analyse forty-seven network pictures collected in seventeen companies from two distinct networks. Complexity is assessed on a number of dimensions at the individual, organizational and network levels, and we show the relationship between complexity and an individual manager’s characteristics (number of years in a company, as well as experience in internally or externally oriented functions). We also provide evidence for a relationship between cognitive complexity and the number of years a company has been established in business, the complexity of companies’ internal structures, and the nature of the business network. In doing so, this article contributes to a better understanding of the contextual factors that drive sense-making in business networks. Keywords Business Networks, Cognitive Complexity, Contextual Factors, Network Picture, Sense-making * Corresponding Author, Tel.: +44 7796124630, E-mail address: [email protected]
Transcript of UNDERSTANDING NETWORK PICTURE COMPLEXITY: AN … · UNDERSTANDING NETWORK PICTURE COMPLEXITY: AN...

1
UNDERSTANDING NETWORK PICTURE COMPLEXITY:
AN EMPIRICAL ANALYSIS OF CONTEXTUAL FACTORS
Carla Ramos*, Stephan C. Henneberg, Peter Naudé
mIMP Research Group
Manchester Business School
University of Manchester
Booth Street West
Manchester (United Kingdom)
Submitted to the 26th IMP Conference, Budapest, Hungary
September 2010
Abstract
There has recently been increasing interest in the relationship between managers’ perceptions of
their surroundings and their interactions with other actors. This sense-making issue is linked to the development of the concept of network pictures. Our paper investigates a hitherto neglected aspect of network pictures: their complexity. In several bodies of literature complexity has been found to affect firms’ action and performance. We theoretically derive a model of complexity, which is then used to analyse forty-seven network pictures collected in seventeen companies from two distinct networks. Complexity is assessed on a number of dimensions at the individual, organizational and network levels, and we show the relationship between complexity and an individual manager’s characteristics (number of years in a company, as well as experience in internally or externally oriented functions). We also provide evidence for a relationship between cognitive complexity and the number of years a company has been established in business, the complexity of companies’ internal structures, and the nature of the business network. In doing so, this article contributes to a better understanding of the contextual factors that drive sense-making in business networks. Keywords
Business Networks, Cognitive Complexity, Contextual Factors, Network Picture, Sense-making
* Corresponding Author, Tel.: +44 7796124630, E-mail address: [email protected]

2
Making Sense of Network Pictures:
An Empirical Analysis of Complexity
1 Introduction
Companies are embedded in complex networks of interconnected relationships, with most research on industrial systems based on this dictum (Axelsson and Easton, 1992; Håkansson and Snehota, 1989; Håkansson and Johanson, 1992; Knight, 2002). Within these relationships, it is through networking that a company can access the resources that are required to develop and sustain business activity (Pfeffer and Salancik, 1978). Networking is defined as all interactions of an actor in a business network, comprising all activities concerning the management of the existing relationships, the management of the position occupied in the surrounding network and the strategies of how to network (Ford et al., 2002; Håkansson and Ford, 2002).
Such activities within the network are grounded on the underlying beliefs about the network by relevant actors. Based on principles of organizational cognitive science, an organizational actor’s actions can be understood as being conditioned by their perceptions of the world around them (Weick, 1979). In business networks, this can be translated into how actors’ cognitive schemata, i.e. views of their surroundings, condition their networking activities, either by restricting or expanding their available options (Anderson et al., 1994; Ford et al., 2002; Gadde et al., 2003; Ritter, 1999). Recently, there has been growing interest in this relationship between actors’ perceptions of their surroundings and their networking activities (Henneberg et al., 2010; Ramos, 2008; Welch and Wilkinson, 2002). Specifically, the concept of network pictures was developed to capture an organizational actor’s beliefs about his/her network (Colville and Pye, 2010; Mouzas et al., 2008; Öberg et al., 2007; Rohrmus and Henneberg, 2006).
Our article contributes to understanding aspects of sense-making, especially network pictures. Specifically, we focus on understanding one characteristic of network pictures that has been shown to influence networking activities and consequently firms’ performance: their underlying complexity. The aim is to develop a multi-dimensional construct of complexity that can be used to assess the cognitive conditions of actors’ views regarding their surrounding network. Additionally, the article seeks to explore the relationship between certain contextual factors and network picture complexity. This is done by applying the developed multi-dimensional complexity construct to the network pictures of forty-seven managers in seventeen companies from two distinct networks. Degrees of network picture complexity are subsequently associated with different independent factors, for example managers’ personal features, companies’ characteristics, and the systemic characteristics of the network or the context in which business activity takes place. This analysis will allow us to contribute to the literature on sense-making in business networks, which can then be used to further understand networking activities in business relationships (Brown et al., 2008; Henneberg et al., 2010).
The paper is structured as follows: stressing the key role that actors’ perceptions of the network play in bringing about networking activities, we begin by providing an overview of research on strategizing in business networks. We then explore the meaning of complexity by uncovering its twofold perspective: the objective and subjective definition of complexity. This is complemented by a review of research specifically on complexity of business networks. From this we derive a definition of network
picture complexity as an analytical concept, and we develop a multi-dimensional construct to capture the degree of complexity in an actor’s network pictures. This leads to an empirical analysis based on several hypotheses regarding the relationship between network picture complexity and contextual factors. We outline our analyses and empirical findings, and conclude by discussing contributions, implications, and suggest further avenues of research.

3
2 Relationship between Network Pictures and Strategizing Activities in Business Networks
The network metaphor has been commonly used by researchers over the past two decades to
describe and analyse the characteristics and organisation of complex industrial systems, such as stability and change, and the creation of value (Håkansson and Johanson, 1992; Möller and Svahn, 2006). Actors with heterogeneous resources, challenges, and goals, interact with other actors in the development of their business activity (Ford and Håkansson, 2006b; Pfeffer and Salancik, 1978). Business actors are not able to use all the information available to them through their scanning activities. Actors’ cognitive frameworks play a key role in helping them to select what information to process and how to interpret it (Gioia and Chittipeddi, 1991; Weick, 1979). Each actor therefore holds a subjective perception or network picture of his/her surroundings based upon previous experiences and memories, as well as beliefs about the future (Ford and Håkansson, 2006a; Mattsson, 1985, 1987). Distinct network pictures can be expected to co-exist in the same company and throughout the network (Ford and Ramos, 2006; Henneberg et al., 2006).
The processes of interaction between actors in business networks are guided by network pictures (Ford, 2002; Ford and Håkansson, 2006a; Mattsson, 1987). This relationship between network pictures and business networks (i.e. networking) is associated with basic principles from information processing and strategic management theories: actors’ actions and reactions are guided by the output of their interpretations of the information they choose to select (Daft and Weick, 1984; Gioia and Chittipeddi, 1991). There is therefore a recognised need to better understand individuals’ network pictures, so that in the future it can be possible to understand the relationship between actors’ sense-making, in this case their network pictures and their networking activities (Ford et al., 2002). Before this interdependence between network pictures and networking is discussed in further detail (more specifically how the complexity of actors’ cognitive structures affects actors’ decisions and performance), the multi-faceted nature of network pictures is discussed, as several complementary concepts can be found in the literature (Ford et al., 2002; Ford and Ramos, 2006; Henneberg et al., 2006).
2.1 Network Pictures
The concept of network pictures was first introduced in the business network literature by Ford et al. (2002) and since then, it has been defined or interpreted in different ways (Geiger and Finch, 2010; Ramos and Ford, 2009). Network pictures can be understood as an organizational actor’s subjectively perceived network (i.e. actors’ picturing of the network; Henneberg et al., 2010): managers make choices about what they believe is important in characterising the network and its actors, activities, and resources. On a different level, network pictures can be understood as a research tool: on one hand they reflect researchers’ efforts to make sense of managers’ sense-making of the network (i.e. researchers’ picturing
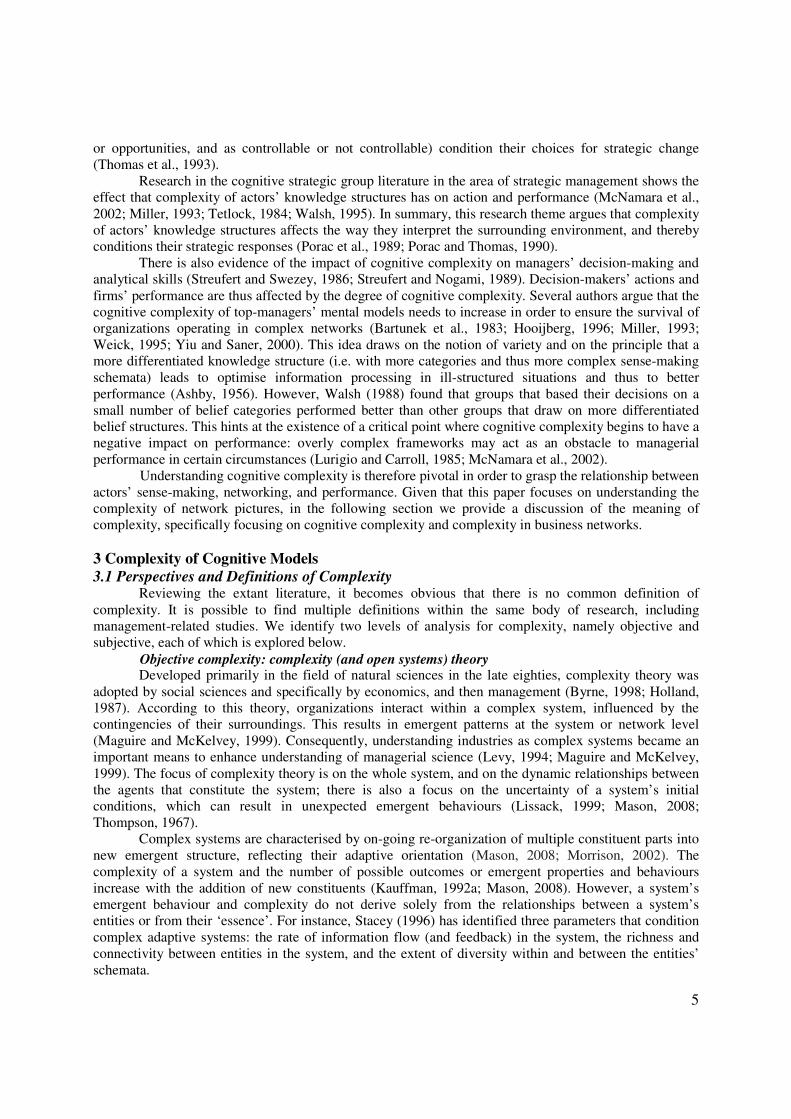
of actors’ network pictures or what Geiger and Finch (2010) define as ‘mentalist network pictures’) and on the other hand, they are associated with researchers’ needs to have an independent and objectified perspective on business network characteristics (i.e. a researchers’ own network picturing which corresponds to Geiger and Finch’s notion of ‘representationalist network pictures’). These two forms of network picturing are contrasting in the sense that whilst the former refers to researchers’ attempt to understand the cognitive characteristics of network pictures of individual managers; the latter relates to the capturing of the objectified characteristics of the network (Henneberg et al., 2010). The different levels of network pictures/picturing described provide a kaleidoscopic view of networks, capturing different aspects of the overall constructs, and relating to each other in what we call an ‘epistemological dialogue’. This dialogue is represented in figure 1.

4
Figure 1 The triadic epistemological dialogue of network pictures
NETWORK
MANAGER RESEARCHER
Researchers’ picturing of actors’ network pictures
Act
ors’
pict
uring
of th
e ne
twor
k Researchers ’ ow
n network picturing
Research always involves ‘picturing’ of some nature; there cannot be empirical research on actors’ network pictures without the researcher’s exercise of picturing in order to capture those pictures. Most studies conducted on network pictures are related to a particular level of network picturing. Henneberg et al (2006), Ford et al. (2006), and Ramos (2008) have all developed research tools that can be used by researchers to grasp business actors’ understanding of their surroundings, and other researchers have used these tools to look into specific business network-related phenomena (Abrahamsen et al., 2009; Henneberg et al., 2009; Holmen et al., 2008; Kragh and Andersen, 2008; Leek and Mason, 2008). However, there exists at least one article on the third level of network pictures/picturing: Ford and Redwood (2005) use their own picturing of a single business and surrounding network over a period of one century to grasp the dynamics of that business as well as the development of the overall network.
For the purpose of this article we focus on ‘mentalist network pictures’, i.e. we use a research tool to capture the idiosyncratic network pictures of individual managers.
2.2 Network Pictures and Networking Activities
Researchers are interested in how different managers perceive their surrounding network, and how the perceptual differences affect their actions. While these issues have recently been emphasized by several researchers from the business network area (Henneberg et al., 2010; Welch and Wilkinson, 2002), to date, there exists only limited empirical research. Other areas of management research have also identified similar issues as important, namely the cognitive strategic group literature in the area of strategic management (Walsh et al., 1988; Jackson and Dutton, 1988). Moreover, there is clear evidence of the importance of cognitive models for strategic decision-making and actions in this other area of management (Brown et al., 2008), evidence that can be transferred to the relationship between network pictures and strategic networking. For example, the way managers perceive and label issues (i.e. as threats
5
or opportunities, and as controllable or not controllable) condition their choices for strategic change (Thomas et al., 1993).
Research in the cognitive strategic group literature in the area of strategic management shows the effect that complexity of actors’ knowledge structures has on action and performance (McNamara et al., 2002; Miller, 1993; Tetlock, 1984; Walsh, 1995). In summary, this research theme argues that complexity of actors’ knowledge structures affects the way they interpret the surrounding environment, and thereby conditions their strategic responses (Porac et al., 1989; Porac and Thomas, 1990).
There is also evidence of the impact of cognitive complexity on managers’ decision-making and analytical skills (Streufert and Swezey, 1986; Streufert and Nogami, 1989). Decision-makers’ actions and firms’ performance are thus affected by the degree of cognitive complexity. Several authors argue that the cognitive complexity of top-managers’ mental models needs to increase in order to ensure the survival of organizations operating in complex networks (Bartunek et al., 1983; Hooijberg, 1996; Miller, 1993; Weick, 1995; Yiu and Saner, 2000). This idea draws on the notion of variety and on the principle that a more differentiated knowledge structure (i.e. with more categories and thus more complex sense-making schemata) leads to optimise information processing in ill-structured situations and thus to better performance (Ashby, 1956). However, Walsh (1988) found that groups that based their decisions on a small number of belief categories performed better than other groups that draw on more differentiated belief structures. This hints at the existence of a critical point where cognitive complexity begins to have a negative impact on performance: overly complex frameworks may act as an obstacle to managerial performance in certain circumstances (Lurigio and Carroll, 1985; McNamara et al., 2002).
Understanding cognitive complexity is therefore pivotal in order to grasp the relationship between actors’ sense-making, networking, and performance. Given that this paper focuses on understanding the complexity of network pictures, in the following section we provide a discussion of the meaning of complexity, specifically focusing on cognitive complexity and complexity in business networks.
3 Complexity of Cognitive Models
3.1 Perspectives and Definitions of Complexity Reviewing the extant literature, it becomes obvious that there is no common definition of
complexity. It is possible to find multiple definitions within the same body of research, including management-related studies. We identify two levels of analysis for complexity, namely objective and subjective, each of which is explored below.
Objective complexity: complexity (and open systems) theory Developed primarily in the field of natural sciences in the late eighties, complexity theory was
adopted by social sciences and specifically by economics, and then management (Byrne, 1998; Holland, 1987). According to this theory, organizations interact within a complex system, influenced by the contingencies of their surroundings. This results in emergent patterns at the system or network level (Maguire and McKelvey, 1999). Consequently, understanding industries as complex systems became an important means to enhance understanding of managerial science (Levy, 1994; Maguire and McKelvey, 1999). The focus of complexity theory is on the whole system, and on the dynamic relationships between the agents that constitute the system; there is also a focus on the uncertainty of a system’s initial conditions, which can result in unexpected emergent behaviours (Lissack, 1999; Mason, 2008; Thompson, 1967).
Complex systems are characterised by on-going re-organization of multiple constituent parts into new emergent structure, reflecting their adaptive orientation (Mason, 2008; Morrison, 2002). The complexity of a system and the number of possible outcomes or emergent properties and behaviours increase with the addition of new constituents (Kauffman, 1992a; Mason, 2008). However, a system’s emergent behaviour and complexity do not derive solely from the relationships between a system’s entities or from their ‘essence’. For instance, Stacey (1996) has identified three parameters that condition complex adaptive systems: the rate of information flow (and feedback) in the system, the richness and connectivity between entities in the system, and the extent of diversity within and between the entities’ schemata.

6
In terms of structural features, complexity is dependent on the organization’s size and number of sub-systems such as R&D, manufacturing and sales (Lawrence and Lorsch, 1967). It also depends on the nature of the relationships that exist between organizational units (Thompson, 1967). Some researchers identify the complexity of an organization with the number of organizational parts or structural components (e.g. occupational specialities or specialized subunits) into which organizations and their employees can be categorized (Jablin, 1987). On the other hand, in terms of organizational behaviour, complexity can be seen as “intricate aggregate patterns emerging from the interaction of the constituent
parts of an organization that themselves followed relatively simple behavioural rules” (Fioretti and Visser, 2004, p. 12). These two objective approaches to complexity have some common grounds: both make reference to the number of parts (i.e. numerosity), and the linkages between them (i.e. connectedness) (Eden and Ackermann, 1992; Fioretti and Visser, 2004). Subjective complexity: a cognitive interpretation of complexity
A different notion of complexity is that of ‘second-order’ complexity (Tsoukas and Hatch, 2001). This refers to complexity that is not an intrinsic or objective property of a system, instead being dependent on the modes of thinking that individuals use to make conjectures about it (Fioretti and Visser, 2004). Complexity in this case is therefore observer-dependent (Casti, 1994). Drawing on the recognized lack of consensus on when a system should be considered as complex (Casti, 1994; Waddington, 1977), Tsoukas and Hatch (2001) claim that “it is better to explore complex thought processes (second-order
complexity) in relation to an assumed objective world (first-order complexity)” (p. 981). Thus, authors on ‘second-order’ complexity undertake a narrative perspective of reality, according to which the vocabulary used by the observer reflects the extent of complexity that he/she believes exists in a system, therefore not reflecting an objective property of that system. A system’s complexity is thus dependent on the complexity of the language or representation that is used by the observer to describe it (Brown et al., 2008; Casti, 1994; Rescher, 1998; Simon, 1999), being dependent on the observer’s perception. The narrative approach to complexity is congruent with the social constructionist approach undertaken by Weick (1979) to define organizations. Subjective complexity itself is mediated by the complexity of the cognitive structure of individuals’ cognitive systems; this notion evolves from Kelly’s (1955) theory of personality, and results in differences in the way individuals perceive their social environment (Carraher and Buckley, 1996).
From the different perspectives on complexity described, the subjective or ‘second-order’ complexity is the one that is closer to our aim of developing an understanding of network picture complexity. Nevertheless, objective complexity definitions can also inform the development of a model in that they provide observers with a vocabulary that they may choose to use in their description and interpretation of complexity. With this in mind, the next section looks into definitions of objective complexity specifically in the business-to-business network area of literature.
3.2 Complexity in Business Networks – the Industrial Network Approach
The notion of complexity is closely associated with the industrial network approach (Axelsson and Easton, 1992; Håkansson and Snehota, 1989). References to a business network’s complexity are common in this body of literature, e.g. “we can regard the global industrial system as one giant and
extremely complex network since there exist always some path of relationships that connect any two
firms” (Mattsson 1988, p. 313). Networks of companies are perceived by Ritter et al. (2004) as complex adaptive systems, where companies take part in a self-organizing emergent process that results from multiple micro-interactions between them (Easton et al., 1997; Wilkinson and Young, 2002). References such as this are associated with the logico-scientific or objective definition of complexity (i.e. first-order complexity).
However, the notion of subjective complexity (i.e. ‘second-order’ complexity) can also be found in the industrial network approach body of literature. Lowe, Ellis and Purchase (2008) draw on a narrative approach to highlight how the adoption of a new language amongst business researchers, one that draws on a discourse analysis of practitioners’ speech, would result in a new and probably better understanding of the complexities of business networks. This is in line with the idea that ‘second-order’ complexity and

7
a narrative approach are essential for the definition of system complexity (Brown et al., 2008; Tsoukas and Hatch, 2001). There have been several calls for further research on subjective complexity and sense-making in business systems, so far largely unheeded (Ford and Håkansson, 2006b; Mattsson, 2005). The notion of subjective complexity of business networks is closely associated with the idea of complexity of network pictures as developed in this paper.
As in other fields of research, there is no agreement on how to define business network complexity. For example, Halinen and Tornroos (2005) posit that complexity is a multi-dimensional construct in terms of structure and embeddedness. Networks are structurally complex because they involve multiple actors and multiple links of diverse nature between them, such as weak and strong, indirect and direct, and loosely or tightly coupled ones. In terms of embeddedness, complexity derives from the difficulty in defining a business network’s boundaries, as well as the informal nature of some agreements that link actors, and it also results from networks being embedded in different spatial, social, political, and technological structures. Therefore, business networks are unique and context specific. Complexity is also seen as a result of networks dynamics, being strongly dependent on actors’ positioning (Håkansson 1982). This is in line with Easton (1995) who argues that it is connectedness and dynamism that confer complexity on networks. Baraldi and Nadin (2006) posit that complexity derives from the several entwined and concurrent types of exchanges (i.e. social and economic) between actors. Each actor’s sets of bonds, resource ties and activity links are embedded in a web of actors, resource constellations and activity patterns, the result of their involvement in multiple business relationships with other actors. Complexity is also conditioned by the diversity of roles played by each actor. A relationship’s content, substance and strength, and underlying (intensive) flows of information, also account for business network complexity. Baraldi and Nadin (2006) posit that increasing the number of involved relationships in an already complex network leads to greater complexity. On the other hand, Johnston, Peters and Gassenheimer’s (2006) definition of complexity focuses mainly on the communication flows between companies, the ‘glue’ that connects relationships (Mohr and Nevin, 1990; Samli and Bahn, 1992). Complexity is perceived by these authors as being dependent upon the number of network interactions and the number and diversity of levels of communication through which actors connect with each other. Another approach to complexity is that of Johnston, Lewin and Spekman (1999) who relate complexity to the different nature of the actors that interact in the network (e.g. firms, governmental entities and multinationals/multi-firms).
The different conceptualisations of complexity in business networks discussed in this section have common grounds, and to a certain extent can be said to be complementary to each other. The differences between them are mostly a result of the emphasis that the authors place on different aspects of complexity. In the following section, we synthesise the existing literature and identify and operationalize a set of dimensions that define network picture complexity.
4 Defining and Capturing Network Picture Complexity
4.1 Definition of network picture complexity A business network is not objectively given; it is subjective and varying, dependent on what
actors believe it to be, or dependent on their network pictures (Ford et al., 2002; Håkansson and Snehota, 1995). A ‘second-order’ approach to complexity is therefore appropriate for analysing network picture complexity (Ford and Håkansson, 2006b; Lowe et al., 2008; Mattsson, 2005). By analysing the representations (the pictorial/spatial understanding of the network) and the language (the textual description of the network) that individuals use to describe their surroundings, researchers can evaluate the degree of complexity of an actor’s network picture. However, objective complexity also plays a role in the definition of a model of network picture complexity: it provides actors (i.e. the observers) with an idea of what elements can be used for defining a system’s complexity. We therefore use a tool for picturing of actors’ network pictures, a ‘double-hermeneutical’ logic is involved in this process which is based on capturing and interpreting a respondent’s interpretation of a social phenomenon.
Drawing on the definition of subjective complexity and on the theoretically identified dimensions of network picture complexity introduced above, we put forward the following definition of network
8
picture complexity: Network picture complexity is defined by the language and representational
dimensions that actors use to describe their surrounding business network, specifically the number and
nature of actors, number and nature of relationships, and dynamism and flexibility. These dimensions are
dependent on actors’ sense-making and interpretation of that network.
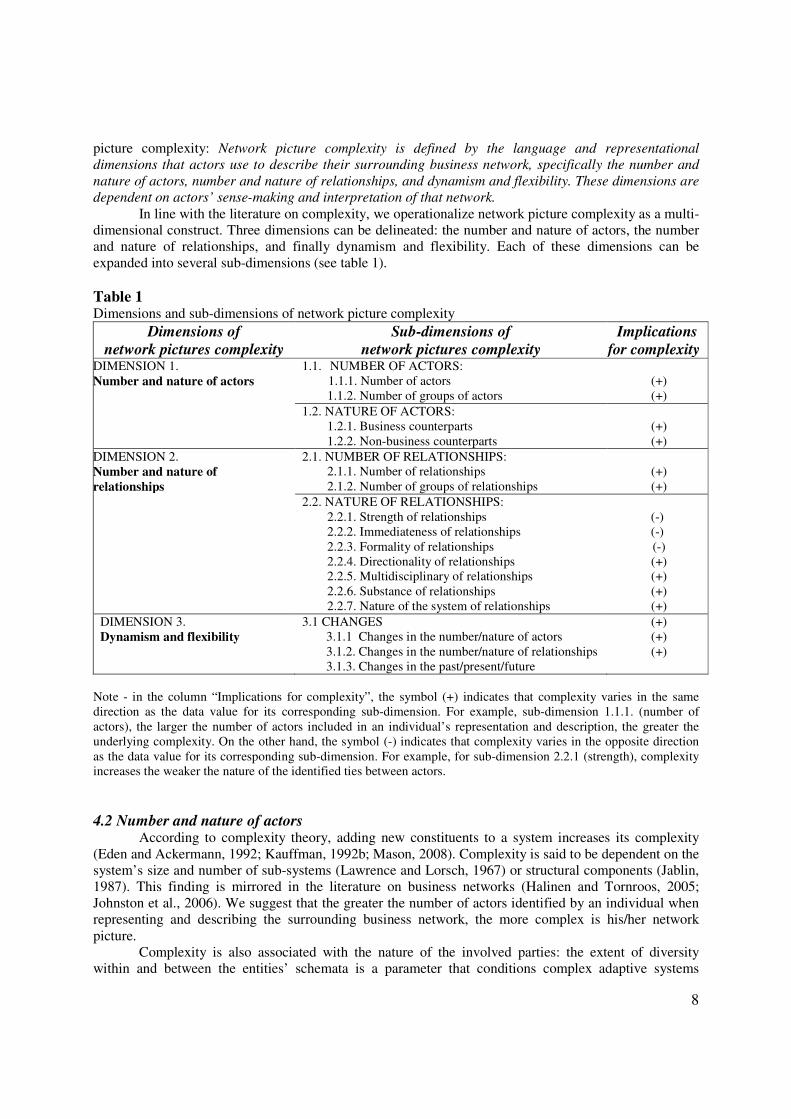
In line with the literature on complexity, we operationalize network picture complexity as a multi-dimensional construct. Three dimensions can be delineated: the number and nature of actors, the number and nature of relationships, and finally dynamism and flexibility. Each of these dimensions can be expanded into several sub-dimensions (see table 1).
Table 1 Dimensions and sub-dimensions of network picture complexity
Dimensions of
network pictures complexity
Sub-dimensions of
network pictures complexity
Implications
for complexity DIMENSION 1. Number and nature of actors
1.1. NUMBER OF ACTORS: 1.1.1. Number of actors
1.1.2. Number of groups of actors
(+) (+)
1.2. NATURE OF ACTORS: 1.2.1. Business counterparts 1.2.2. Non-business counterparts
(+) (+)
DIMENSION 2. Number and nature of
relationships
2.1. NUMBER OF RELATIONSHIPS: 2.1.1. Number of relationships 2.1.2. Number of groups of relationships
(+) (+)
2.2. NATURE OF RELATIONSHIPS: 2.2.1. Strength of relationships 2.2.2. Immediateness of relationships 2.2.3. Formality of relationships 2.2.4. Directionality of relationships 2.2.5. Multidisciplinary of relationships 2.2.6. Substance of relationships 2.2.7. Nature of the system of relationships
(-) (-) (-) (+) (+) (+) (+)
DIMENSION 3. Dynamism and flexibility
3.1 CHANGES 3.1.1 Changes in the number/nature of actors 3.1.2. Changes in the number/nature of relationships 3.1.3. Changes in the past/present/future
(+) (+) (+)
Note - in the column “Implications for complexity”, the symbol (+) indicates that complexity varies in the same direction as the data value for its corresponding sub-dimension. For example, sub-dimension 1.1.1. (number of actors), the larger the number of actors included in an individual’s representation and description, the greater the underlying complexity. On the other hand, the symbol (-) indicates that complexity varies in the opposite direction as the data value for its corresponding sub-dimension. For example, for sub-dimension 2.2.1 (strength), complexity increases the weaker the nature of the identified ties between actors.
4.2 Number and nature of actors According to complexity theory, adding new constituents to a system increases its complexity
(Eden and Ackermann, 1992; Kauffman, 1992b; Mason, 2008). Complexity is said to be dependent on the system’s size and number of sub-systems (Lawrence and Lorsch, 1967) or structural components (Jablin, 1987). This finding is mirrored in the literature on business networks (Halinen and Tornroos, 2005; Johnston et al., 2006). We suggest that the greater the number of actors identified by an individual when representing and describing the surrounding business network, the more complex is his/her network picture.
Complexity is also associated with the nature of the involved parties: the extent of diversity within and between the entities’ schemata is a parameter that conditions complex adaptive systems

9
(Stacey, 1996). This idea is reinforced in the business network literature, with business network complexity being linked with different qualities of actors that interact in the network (Johnston et al., 1999). We therefore expect that complexity also increases when an individual identifies more diverse types of actors.
4.3 Number and nature of relationships
One basic principle underlying complexity theory is that if the number of potential connections and interactions increases, so too does the complexity of the system (Eden and Ackermann, 1992; Kauffman, 1992b; Mason, 2008). The number of relationships therefore conditions the complexity of a system. This idea can also be traced in the business network literature (Halinen and Tornroos, 2005; Johnston et al., 2006). Increasing the number of relationships involved in a business network leads to greater complexity (Baraldi and Nadin, 2006; Samli and Bahn, 1992). We therefore suggest that the complexity of an individual’s network picture increases with the number of relationships included in his/her representation and description of the surrounding business network.
Moreover, the nature of the relationships included also affects complexity. Complexity depends on the nature of relationships that exist between organizational units (Thompson, 1967), being associated with the adaptive behaviour that results from multiple parts of a complex system (Fioretti and Visser, 2004; Stacey, 1996). One of the reasons why business networks are said to be complex is that they are embedded in multidisciplinary structures, which makes them unique and context specific (Easton, 1995; Halinen and Tornroos, 2005). Relationships’ content, substance and strength, and underlying flows of information, all influence complexity (Baraldi and Nadin, 2006). Business networks complexity is also said to be dependent upon the diversity of levels of communication through which they can connect with each other (Johnston et al., 2006). We therefore conceive that a network picture is more or less complex depending on the nature of relationships that are included in that picture.
4.4 Dynamism and flexibility
A system’s complexity is associated with its underlying dynamism and flexibility. In complex systems, the focus is on the dynamic relationships between the agents that constitute the whole. An on-going organisation and re-organization of a system’s multiple constituents into new emergent structures takes place in these complex systems, reflecting these systems’ adaptive orientation (Mason, 2008). Unexpected emergent behaviours created by networking activity are expected to affect a system’s initial conditions (Lissack, 1999; Mason, 2008; Thompson, 1967), with the system exhibiting emergent new structural patterns (Maguire and McKelvey, 1999). Business networks complexity is also associated with networks being flexible, meaning that change is one of their intrinsic features; there is therefore a temporal dimension of complexity (Halinen and Tornroos, 2005). Easton (1995) adds to this idea by claiming that complexity is a result of the dynamism that characterises networks. We suggest that the complexity of an individual’s network picture will vary according to the extent of changes he/she perceives and identifies.
5 Propositions Regarding Contextual Factors of Network Picture Complexity
Previous research shows that the complexity of managers’ mental models is conditioned by specific contextual factors such as individuals’ domain of expertise (Carraher and Buckley, 1996; Hershey et al., 1990; Lurigio and Carroll, 1985; Vandenberg and Scarpello, 1990). Considering that individuals’ “interpretations and response choices are not made independent of decision makers’
contextual perspectives” (Ford and Bacus, 1987, p. 373), we posit several propositions on the relationship between network picture complexity (i.e. our construct capturing mental models) and different factors relating context, namely individual manager characteristics, company characteristics, and network characteristics.

10
5.1 Network picture complexity and characteristics of managers Variations in the experiences of individuals result in differences in the content of individual knowledge structures (Fiske et al., 1983; Larkin et al., 1980; Wagner, 1987). Lurigio and Carroll (1985) show that more experienced individuals use fewer but more detailed cognitive schemata than others with less experience. When entering a new business or company, a manager can be expected initially to be more committed to learning in unfamiliar surroundings, being more sensitive to manifold phenomena. As the individual becomes more experienced and familiar with the situation, he/she may be expected to become less sensitive to certain issues but at the same time to be able to identify new phenomena, and to fit them into their understanding of the surroundings (Starbuck and Milliken, 1988). Thus, whilst at the beginning of a learning experience, managers’ cognitive structures have more schema categories, they have fewer information units within each of those categories, compared to later stages of that learning experience (Lurigio and Carroll, 1985; Rentch et al., 1994). According to Starbuck and Milliken (1988), with experience and success, managers generalise more by capitalising on their familiarity with several domains of expertise and on their access to rich and filtered sources of information. There is a learning process associated with managers’ experience, and the reinforcement of perceptions results in managers developing strong views with regard to what works, what does not work, and how things ought to work in business networks (Levitt and March, 1988; Reger and Palmer, 1996). We therefore posit that the relationship between network picture complexity and individual experience has the shape of an inverted-U: early in their working life, managers hold very simplistic views of their organisation’s network. As they deal with ever increasing numbers of actors, relationships, and changes, perceptions become increasingly granulated and complex. Thus, initially network picture complexity increases with experience. After a certain point, i.e. with more experience, mental pictures then become more abstract and therefore less granulated (i.e. less differentiated), and thus less complex (Elster, 2000). Proposition 1: There exists an inverted-U shape relationship between network picture complexity and the
number of years of an individual’s working experience
Different job roles require different levels of knowledge or insight regarding what is taking place in the firm’s environment. Hodgkinson and Johnson (1994) posit a relationship between a managers’ job role, and managers’ cognitive taxonomies of the environment. Their research found that the complexity of cognitive structures depends on the extent of knowledge that individuals require to fulfil their organizational role. Managers’ perceptions as well as sense-making structures can thus be expected to be conditioned by their functional areas (Dougherty, 1992; Hambrick and Mason, 1984; Lawrence and Lorsch, 1967).
However, Walsh’s (1988) study on selectivity and selective perception provided empirical evidence that managers with a strong functional-area orientation could also work successfully in a different area from that reflected in their perceptions. Managers were able to identify issues and use information from domains that were dissimilar to the functions they were currently involved in. One of the explanations provided by Walsh (1988) for this phenomenon was that managers’ belief structures could be conditioned by their previous experience in other functions. Poole et al. (1990) argue that this could be explained by individuals’ direct (repetitive) and indirect (stories, role models) experiences, given that both affect individuals’ knowledge structure development.
We therefore hypothesise that managers’ network pictures are conditioned by their overall experience in diverse functions, namely in mainly internally versus externally-oriented functions. To develop this hypothesis, we draw strongly on Walsh’s (1988) study that shows evidence of these expected differences in individuals’ belief structures: “managers with a marketing belief structure identified more
external management problems and requested more external management information than managers in
the human relations and generalists groups” (p. 888). It can therefore be expected that individuals who are more experienced in externally-oriented functions (e.g. marketing, sales, business development, supply-chain and procurement management) hold belief structures that are well informed regarding the company’s surroundings. The network pictures of these managers’ are therefore assumed to be more

11
complex than those of individuals with internally-oriented functions (e.g. production, finance, HRM) whose main interest and remit lie in operational issues within their own company. Proposition 2: Network pictures are more complex for individuals with more experience in externally-
oriented functions (e.g. marketing) than in internally-oriented ones (e.g. production)
5.2 Network picture complexity and company characteristics The organizational context of decision makers (i.e. strategy and strategic capabilities of a firm,
organizational structure, and culture) informs their interpretation of what is taking place in their surroundings (Ford and Bacus, 1987). This idea is reinforced by Isabella (1990) and by Öberg et al. (2007) who provided empirical evidence that change in a manager’s information environment (e.g. an acquisition, or company reorganization) results in changes in his/her frame of reference.
Through organisational memory, an organisation is able to preserve its past through its culture, structures, and changes, as well as in the minds and experiences of individuals (Levitt and March, 1988; Walsh and Ungson, 1991). Organizational success results in individuals relying on established institutionalised practices and engaging in a socialising process with the organizational culture (Ford and Bacus, 1987): beliefs become ossified through repeated successful actions in a specific social context (Argyris and Schon, 1978; Daft and Weick, 1984; Hedberg et al., 1976; Sandelands and Stablein, 1987).
Thus, the principle underlying proposition 1 on the individual level also applies at the organisational level: as a result of organizational experience and success or failure, shared understandings about what does or does not work in a network are developed and manifested at the organizational level (Stewart and Latham, 1980). We therefore posit that there exists an inverted-U shape relationship between an individual’s network picture complexity and the number of years his/her company has been operating in a specific network or sector. Individuals working in an organization which has been in a particular business sector only for a short time are expected to exhibit low network picture complexity; with increasing company tenure in a network this is expected to become gradually more granulated. Again, after time, individuals in the company will exhibit less granulated and thus more abstract and less complex network pictures due to ossifications of belief structures. Proposition 3: There exists an inverted-U shape relationship between an individual’s network picture
complexity and the number of years that his/her company has been in existence
It was argued above that internal organisational structure informs individuals’ sense-making frameworks (Ford and Bacus, 1987). Additionally, previous research on organisational change points to a reciprocal relationship between organisational structural and individual interpretative schemes (Bartunek, 1984; Bartunek and Franzak, 1988; Greenwood and Hinings, 1988). Thus, organisational structure affects and is also affected by individuals’ frameworks. According to Ranson, Hinings and Greenwood (1980), a structural change is more closely associated with changes in action than with changes in interpretative schemes. This principle reflects Giddens’ (1979) notion of a reciprocal relationship between organisational structure and individuals’ actions (and understanding). This is echoed by Bartunek (1984) who argues that “organisations’ structural properties both legitimize and constrain action. When
interpretative schemes and their expression in action change, then, structure will also undergo
modification, which in turn will legitimize and constrain later action and interpretative schemes” (p. 366). If the organisational context conditions how individuals think about their surroundings (Ford and Bacus, 1987; Isabella, 1990), then we posit that the more complex the organizational structure of a company, the more complex the mental frameworks of individuals that work in that company. Proposition 4: Network pictures are more complex for individuals in companies which have a complex
internal structure
5.3 Network picture complexity and networks’ characteristics The features of the business network in which companies are embedded also condition individual
interpretations of what is going on in the surroundings (Barr et al., 1992). Although Fahey and Narayanan (1989) did not find a relationship between changes in the objective features of companies’ macro environments on the one hand, and their employees’ frames of reference, Barr et al. (1992) provide

12
empirical evidence for the impact of environmental discontinuities on changes in managers’ belief systems. It is commonly accepted that there is a “shared knowledge-base that those socialized in an
industry take as familiar professional common sense” (Spender, 1989, p. 69), such as a strategic frame or industry recipe. Porac et al. (1989), and Stubbart and Ranaprasad (1988) are some of the authors whose work provides empirical evidence for the existence of shared mental representations within an industry or network.
One way of distinguishing different characteristics within networks relates to the business relationships, specially the dominant relational exchanges, which are fundamental to the business system. Lambe et al. (2000) provide a theoretical framework that differentiates between two forms of relational exchange: enduring relational exchange and interimistic relational exchange. The first corresponds to a traditional view of relational exchange (i.e. as opposed to a transactional exchange; Williamson, 1975), where there exists a long-term collaborative relationship between business actors that can be explained with the evolutionary model of business relationships (Dwyer et al., 1987; Ford, 1980; Håkansson, 1982; Morgan and Hunt, 1994). The second is associated with short-term relational exchange situations characterised by low expectations about the existence of possible future transactions. A project-based network is an example of such an interimistic relational exchange situation (Purchase and Olaru, 2004).
Two characteristics associated with a project environment provide an indication that managers’ network pictures are more complex for individuals in companies embedded in project-based networks than for individuals in non-project-based networks. Firstly, project expected particularity (Cova and Hoskins, 1997) refers to the fact that managers cannot capitalise extensively on their experiences from other projects. Secondly, actors involved in projects rely strongly on formalised and contractually agreed
explicit norms (Cova et al., 1994). Therefore, there is a high degree of codification associated with projects and their execution. These underlying contracts can be expected to be as comprehensive as possible and thus result in high levels of complexity being laid down explicitly in these written documents. Proposition 5: Network pictures are more complex for individuals in project-based networks than for
individuals in non-project-based networks
6 Research Method and Design
6.1 Empirical Grounding In line with the second-order approach to complexity, we used a social constructionist,
interpretative frame (Guba and Lincoln, 2000; Isabella, 1990; Schwandt, 2000); thus capturing individuals’ network pictures is not to “gather facts and measure how often certain patterns occur, but to
appreciate the different constructions and meanings that people place upon their experience” (Easterby-Smith et al., 2003, p. 30). Eden et al.’s (1979) approach to exploring individuals’ cognitive structures, one which draws on personal construct theory (Kelly, 1955), was identified as the most appropriate way to elicit and code individuals’ network pictures.
Individual network pictures are defined as the unit of analysis, and specific contextual factors are introduced within three levels of analysis: individual, company and network level. Two networks that were expected to exhibit distinct relational exchange features were selected: one of the networks corresponded to a long-term relational exchange environment (a non-project-based network) and the other to a short-term task-oriented network in the sense that where there is a pre-determined end to the established relationships (a project-based network) (Lambe et al., 2000). These two networks corresponded to two rich case studies (Yin, 1994). A total of forty-seven respondents from seventeen companies were included in the data collection: twenty-six respondents were interviewed in ten companies for the non-project network, and the remaining twenty-one respondents were selected from a total of seven companies for the project-based network. The companies included in the non-project based network were somehow associated with the practice of integrated outsourcing in the production and delivery of plastics containers (i.e. suppliers, producers, clients), whilst the companies selected for the project-based network were all involved in a project related to the transportation sector (i.e. the sole client, consortiums of companies and some of the companies that were involved in the conception,

13
construction and operation of a Metro system). All respondents played a key role in the decision making process of their companies (e.g. CEOs, company directors), and companies were chosen by adopting a snowball approach. The data collection process took place over four months in 2005 and 2006. All interviews took place in Portugal and were conducted in the native language. All interviews were transcribed verbatim into English, a consequence of there being researchers involved in the data analysis process who were not Portuguese native speakers.
Following Ramos et al. (2005) and Henneberg et al.’s (2006) procedure to collect data on actors’ perceptions of their surrounding network, a combination of visual and verbal data eliciting techniques to gather the data was used (Meyer, 1978; Tufte, 1983). Respondents were asked to represent on a blank A4 sheet what they ‘saw’ in their business surroundings. This was followed by a semi-structured interview during which respondents were asked to explain what they had represented, as well as to answer some questions that would help to understand how they perceived the network (i.e. questions regarding the scale and structure of the perceived network, as well as the processes between the identified actors and their positioning). This is in line with the approach of Eden et al. (1979) to eliciting of cognitive structures. Some questions regarding individual objective features, such as work experience, were also included in the interview. Secondary data was collected to identify each company’s features (e.g. number of years it had been in business), as well as the networks’ features (e.g. expected continuity of relationships).
6.2 Analysis
The data analysis encompassed two main stages. In the first, the complexity underlying each respondent’s network picture (i.e. visual and textual data) was assessed. For this, we used the three-dimensional construct of network picture complexity. To begin with, different complexity scales were developed for each of the sub-dimensions (for a summary, see Appendix 1). These complexity scales were developed for each sub-dimension (e.g. relating to the number of specific actors that were identified by the respondent, or whether the respondent perceived predominately unilateral or bilateral flows between actors). Classifying each respondent’s network picture complexity implied first of all scoring each sub-dimension on a corresponding complexity scale. After scoring all complexity scales by respondent, the complexity score for each of the three dimensions was assessed as the average of the corresponding sub-dimensions for each dimension. Based on this, the complexity of a given network picture was assessed, firstly, as a profile based on the scores for the three main complexity dimensions, and secondly as an averaged overall complexity score (i.e. the average of the three main complexity dimensions). Complexity could therefore vary between respondents overall, or depending on their profile relating to the three complexity dimensions.
The scores for each complexity sub-dimension resulted from rater interpretations. To assure inter-rater reliability, two further researchers were asked to classify independently the complexity for a subset of randomly selected network pictures. No significant differences between these three researchers’ interpretation was found, and this replicability provided a sufficient indicator for the reliability of the analysis (Krippendorff, 2004; Ritchie and Lewis, 2003).
A second stage of the data analysis specifically used the developed propositions and tested for associations between contextual factors (i.e. individual, company and network specific characteristics), and network picture complexity for the 47 respondents.
The research method and design specifically developed for this project can be classified as an ‘innovative practice’ in terms of the application of the case study method to the study of business networks (Piekkari et al., 2010). In line with requirements for ‘innovative practice’, we use ‘proposition-testing’, ‘non-traditional’ data gathering techniques (a combination of in-depth interviews combined with visual eliciting techniques), as well as a ‘population study’ (i.e. all significant players for each network were included) (Piekkari et al., 2010). Furthermore, both qualitative and quantitative approaches were applied by combining qualitative content analysis and quantitative pattern matching.

14
6.3 Dimensions of network picture complexity: operationalization
In this section, each of the sub-dimensions identified in Table 1 is operationalised and the relationships between overall complexity and each sub-dimension are explored. We also outline the rationale underlying the complexity scales adopted for assessing network picture complexity for each complexity sub-dimension. Appendix 1 provides an outline of each construct or complexity sub-dimension, as well as a summary of the complexity scales that were used for each construct. Number and nature of actors
In our dimensional model we posit that network picture complexity increases with the number of actors, either specific actors (sub-dimension 1.1.1) or groups of actors (sub-dimension 1.1.2). To score the sub-dimensions, the minimum value of the scale (i.e. 1) was given to the lowest number of actors identified in the forty-seven different network pictures. Consequently, the maximum value of the scale (i.e. 5), corresponds to the highest number of actors identified in the sample. In between these extreme points, the scale was used to score the remaining respondents, in effect providing a distribution of complexity on a scale of 1 to 5.
We also hypothesize that network picture complexity increases with the diversity in the nature of the actors that are identified. For this sub-dimension, we include business counterparts (sub-dimension 1.2.1) and non-business counterparts (sub-dimension 1.2.2). The scale, anchored in 1 (least complex) and 5 (most complex), was derived as above. Number and nature of relationships
Network picture complexity is hypothesised to increase with the number of relationships an actor includes in his/her network. This number represents specific relationships (sub-dimension 2.1.1), as well as groups of relationships, i.e. relationships between identified groups of actors (sub-dimension 2.1.2). Again, the scales for these two sub-dimensions are defined as above. Seven levels of analysis are used to assess the extent of complexity regarding the perceived nature of relationships outlined in table 1. A summary of the literature used in the development of these seven complexity sub-dimensions and the rationale underlying each adopted complexity scale is presented Appendix 1. All complexity scales are anchored in 1 (least complex) and 5 (most complex). Dynamism and flexibility
We hypothesize that an individual’s network picture is complex in terms of dynamism and flexibility if it includes network changes that have taken place, are taking place, or are going to take place in the future. Thus, we subsume a comparative static characteristic under dynamics. In our operationalization, sub-dimension 3.1.1 identifies all changes of the number or nature of actors, sub-dimension 3.1.2 measures all changes of the number or nature of relationships, and finally sub-dimension 3.1.3 identifies the periods of time over which changes have occurred. The 5-point complexity scales developed for these three sub-dimensions followed the same rule: the richer (i.e. more elements included) the representation and description of the surrounding business network is, the more complex is the respondent’s network picture (i.e. higher point in the complexity scale). For example, an individual that talks solely about changes that took place in the past is considered having a less complex network picture than one that besides those changes also mentions changes taking place in the present.
7 Understanding Network Picture Complexity
To understand network picture complexity (i.e. to assess how and if complexity varies with specific individual, organisational and network characteristics), we analyse the complexity scores that resulted from the first stage of the data analysis and test our propositions. We look for associations between the overall network picture complexity, and the individual, organisational and network objective features used in the proposition development. The suggested associations are also tested for the three main dimensions of network picture complexity. The analysis is carried out considering the average complexity values found for all respondents from both networks (i.e. for the 47 respondents), as well as for each network separately (i.e. for the non-project network or for the project-based network), for each

15
possible situation within each considered contextual factor. There is an exception: to test proposition 5 where we posit an association between the features of each network and complexity, we consider the average complexity values for each network separately. Table 2
Average values for overall and dimensional network picture complexity: Including respondents from both
networks (i.e. project-based network and non-project-based network)
1. Individual Characteristics
1.1. Experience in Company
Averages
Overall
complexity Dimension 1 Dimension 2 Dimension 3
1 – Limited Experience 2.22 1.97 2.31 2.37
2 – Intermediate Experience 2.15 1.69 2.30 2.46
3 - Vast Experience 2.54 2.15 2.58 2.89
1.2. Function Orientation
Averages
Overall
complexity Dimension 1 Dimension 2 Dimension 3
1 - Consistently Internally Oriented 2.09 1.59 2.21 2.47 2- Currently Internally / Previously externally Oriented 2.12 1.64 2.24 2.50
3- Consistently Externally Oriented 2.37 2.46 2.32 2.33 4- Currently Externally / Previously Internally Oriented 2.53 2.31 2.56 2.72 5- Simultaneously Internally and Externally Oriented 2.37 2.08 2.08 2.54
2. Company Characteristics
2.1. Number of years in Business
Averages
Overall
complexity Dimension 1 Dimension 2 Dimension 3
1 – Short Period of Time 2.24 1.97 2.31 2.46
2 – Intermediate Period of Time 2.42 2.00 2.37 2.89
3 – Long Period of Time 2.08 1.78 2.10 2.37
2.2. Complexity of the Internal
Structure
Averages
Overall
complexity Dimension 1 Dimension 2 Dimension 3
1 – Low Complexity 1.84 1.44 1.92 2.17
2 – Intermediate Complexity 2.17 1.88 2.39 2.25
3 – High Complexity 2.54 2.14 2.55 2.93
16
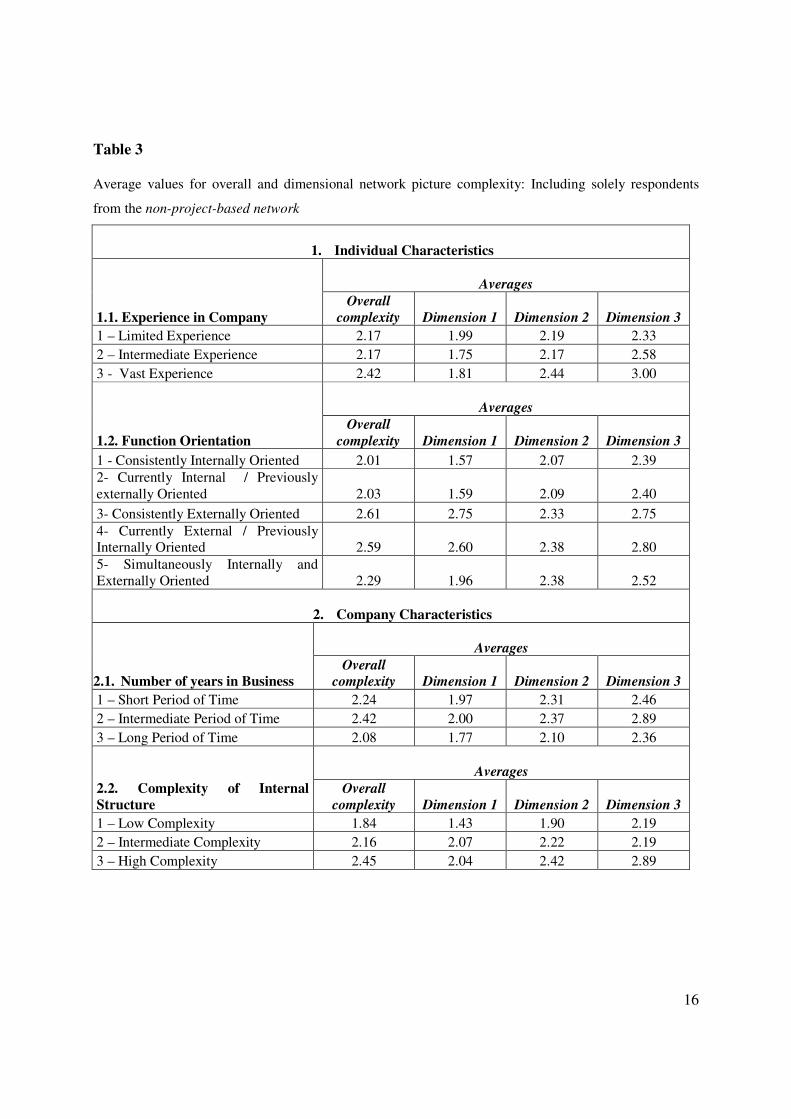
Table 3
Average values for overall and dimensional network picture complexity: Including solely respondents
from the non-project-based network
1. Individual Characteristics
1.1. Experience in Company
Averages
Overall
complexity Dimension 1 Dimension 2 Dimension 3
1 – Limited Experience 2.17 1.99 2.19 2.33
2 – Intermediate Experience 2.17 1.75 2.17 2.58
3 - Vast Experience 2.42 1.81 2.44 3.00
1.2. Function Orientation
Averages
Overall
complexity Dimension 1 Dimension 2 Dimension 3
1 - Consistently Internally Oriented 2.01 1.57 2.07 2.39 2- Currently Internal / Previously externally Oriented 2.03 1.59 2.09 2.40
3- Consistently Externally Oriented 2.61 2.75 2.33 2.75 4- Currently External / Previously Internally Oriented 2.59 2.60 2.38 2.80 5- Simultaneously Internally and Externally Oriented 2.29 1.96 2.38 2.52
2. Company Characteristics
2.1. Number of years in Business
Averages
Overall
complexity Dimension 1 Dimension 2 Dimension 3
1 – Short Period of Time 2.24 1.97 2.31 2.46
2 – Intermediate Period of Time 2.42 2.00 2.37 2.89
3 – Long Period of Time 2.08 1.77 2.10 2.36
2.2. Complexity of Internal
Structure
Averages
Overall
complexity Dimension 1 Dimension 2 Dimension 3
1 – Low Complexity 1.84 1.43 1.90 2.19
2 – Intermediate Complexity 2.16 2.07 2.22 2.19
3 – High Complexity 2.45 2.04 2.42 2.89

17
Table 4
Average values for overall and dimensional network picture complexity: Including solely respondents
from the project-based network
1. Individual Characteristics
1.1. Experience in Company
Averages
Overall
complexity Dimension 1 Dimension 2 Dimension 3
1 – Limited Experience 2.53 1.87 3.06 2.67
2 – Intermediate Experience 2.13 1.62 2.43 2.33
3 - Vast Experience 2.58 2.27 2.62 2.84
1.2. Function Orientation
Averages
Overall
complexity Dimension 1 Dimension 2 Dimension 3
1 - Consistently Internally Oriented 2.23 1.62 2.46 2.61 2- Currently Internal / Previously externally Oriented 2.29 1.72 2.49 2.67
3- Consistently Externally Oriented 1.88 1.87 2.28 1.50 4- Currently External / Previously Internally Oriented 2.48 2.10 2.68 2.67 5- Simultaneously Internally and Externally Oriented 2.46 2.21 2.21 2.56
2. Company Characteristics
2.2. Number of years in Business
Not measurable in this network
2.1. Complexity of Internal
Structure
Averages
Overall
complexity Dimension 1 Dimension 2 Dimension 3
1 – Low Complexity 1.83 1.50 2.00 2.00 2 – Intermediate Complexity 2.18 1.72 2.52 2.30
3 – High Complexity 2.64 2.25 2.70 2.97

18
Table 5
Average values for overall and dimensional network picture complexity for each network
Average Values
Non-Project based network
Project-based network
DIMENSION 1. Number and Nature of Actors 1.88 1.99 DIMENSION 2. Number and Nature of Relationships 2.23 2.59 DIMENSION 3. Dynamism and Flexibility 2.51 2.63
OVERALL COMPLEXITY 2.21 2.40
7.1 Analyses at the individual level Proposition 1 posits that there exists an inverted-U shaped relationship between network picture
complexity and the number of years of work experience. To assess respondents’ working experience, we considered the number of years respondents had been working in the company in the non-project based network. For respondents in the project based network, we considered solely the number of years they had been involved in the project (due to the assumption of project particularity; Cova and Hoskins, 1997).
The analysis of the individual network picture complexity scores indicates that, contrary to what was predicted, the data revealed a U-shaped relationship between work experience and complexity. This was valid when analysing both networks together and also separately (see tables 2, 3, and 4). For example, when analysing both networks together (table 2), the average overall network picture complexity of individuals with limited experience scored 2.22, decreasing to a score of 2.15 for individuals with intermediate experience, and increasing to a score of 2.54 for individuals with more experience. This was a somewhat counter-intuitive finding, reflecting an initially complex network picture which is reduced in time in terms of its complexity before it increases again with more managerial experience. This finding was found to be supported for the value score of the average overall network picture complexity for all respondents from both networks, as well as for the averages for each separate network. A similar pattern was observed for two of the individual dimensions of network picture complexity: number and nature of actors, and number and nature or relationships. Thus, proposition 1 was not supported.
Regarding respondents’ experience in different functions, several situations needed to be considered. For example, some respondents were currently working in internally-oriented functions and had in the past (i.e. in the same company or in previous companies) also held internally-oriented functions. However, some internally focussed respondents had held externally oriented functions in the past, and vice versa. Furthermore, some functions can be classified as being simultaneously internally and externally oriented (e.g. CEOs). Thus, five groups of respondents were considered: consistently internally oriented; consistently externally oriented; simultaneously internally and externally oriented; currently internally/previously externally; and currently externally/previously internal.
Considering both networks together, the average score of network picture complexity shows that consistently or currently internally oriented respondents hold less complex network pictures that those respondents that are consistently or currently externally oriented (means scores of 2.09 and 2.12 versus 2.37 and 2.53; see table 2). The complexity for simultaneously internally and externally respondents’ network pictures is high and similar to those of respondents within externally oriented functions (i.e. score of 2.37). These patterns were also found for the most individual dimensions of network picture complexity. However, for the dimension of flexibility and dynamism, there exists an exception: the average scores of complexity for this dimension indicate that consistently or currently internally oriented respondents hold more complex beliefs than respondents that are consistently externally oriented (means

19
scores of 2.47 and 2.50 versus 2.33; see table 2). . Thus, the data generally supports proposition 2: network pictures are more complex for individuals with more experience in externally-oriented functions (e.g. marketing) than in internally-oriented ones (e.g. production).
However, analysing both networks separately shows some differences: while the relationship between complexity and functional orientation within the non-project based network is as expected, the project-based networks shows a more specific pattern: the overall network picture complexity for individuals that currently or consistently held an internally oriented functions are higher than the complexity averages found for respondents that had always held externally oriented functions. This finding occurs because our research characterised respondents working for the organizational entity coordinating the overall project consortium as having externally-oriented functions. However, some of these respondents perceive themselves as internally-oriented. If one adopts this perspective, the hypothesised relationships are again supported.
7.2 Analysis on the company level All companies included in the project-based network had been involved in the project since its
inception. Thus, to analyse the relationship between network picture complexity and the number of years a respondents’ company had been in working in the industry, we only included those respondents from companies in the non-project based network, i.e. companies which varied regarding their time span in the industry. Most selected companies had been through processes of acquisitions, or mergers; thus, we considered for each company only the period after its last major restructuring.
Our analyses show that the average network picture complexity for respondents that worked in companies that had been in business for the shortest period of time (between 1 and 11 years) was lower than the average found for respondents in companies that had been in business for what we defined as an intermediate period of time (between 12 and 20 years) (see table 3 or 4, section 2.1. number of years in business). The average complexity score again increased for respondents in companies that had been in business for the longest period of time (i.e. between 21 and 30 years). The same consistent pattern was also observed for each individual dimension of network picture complexity. This finding supports proposition 3, that there exists an inverted-U shape relationship between network picture complexity and the number of years a managers’ company has been established in a sector, or network.
To assess the complexity of companies’ internal structure, we draw mostly on respondents’ descriptions. Thus, this contextual factor was based on content analysis whilst all other contextual factors that were considered in our analysis are objectively obtained through secondary research. We categorized all firms into three levels of complexity of companies’ internal structure: high complexity, intermediate complexity, and low complexity. Proposition 4 hypothesised that network pictures are more complex for individuals in companies which have a complex internal structure or organisation. The data from both networks, when taken together as well as separately, supports this proposition (see tables 3, 4 and 5). The same consistent relationships were also observed for each individual dimension of network picture complexity. Again, we replicated this analysis within each network, and the results were robust in both cases.
7.3 Analysis on the network level Overall network picture complexity in the non-project based network was very similar to that in
the project network, but overall the non-project based network showed lower complexity than the project based network (means scores of 2.21 versus 2.40; see table 5). Moreover, the averages for each dimension of network picture complexity were very similar between networks but also showed higher complexities for the project based network. Therefore, tentative support is provided for proposition 5, according to which network pictures are more complex for individuals in project-based networks than for individuals in non-project-based networks. Table 6 provides a summary of the outcome of the proposition testing: Out of the five propositions developed in section 5, only one was not supported.

20
Table 6 Summary table on the outcome of proposition testing
Propositions Outcome of
exploratory analysis
Proposition 1 There exists an inverted-U shape relationship between network picture
complexity and the number of years of an individual’s working experience
Not supported
Proposition 2 Network pictures are more complex for individuals with more experience in
externally-oriented functions (e.g. marketing) than in internally-oriented
ones (e.g. production)
Supported
Proposition 3 There exists an inverted-U shape relationship between individuals’ network
picture complexity and the number of years the companies they work at
have been in the sector
Supported
Proposition 4 Network pictures are more complex for individuals in companies which
have a complex internal structure
Supported
Proposition 5 Network pictures are more complex for individuals in project-based
networks than for individuals in non-project-based networks
Supported
8 Conclusions, Limitations, and Implications
In this study, we have investigated issues around sense-making in business systems, specifically one aspect of business actors’ network pictures that had not been addressed before in the literature: their complexity. Previous research on network pictures has mainly concentrated on identifying their dimensions, on analysing the contextual factors that condition their content, and on demonstrating how the concept could be used better to understand business network related phenomena such as network change. Introducing the construct of complexity to the study of network pictures provides additional understanding of network picture characteristics, and allows one to gauge their impact on actors’ strategic actions, i.e. their networking activities. We have developed a multi-dimensional construct of network picture complexity, based on existing complexity theory, thereby drawing on the extant literature on both sense-making cognitive models and business networks. Given that previous research shows that the complexity of managers’ cognitive models is conditioned by contextual factors, we focused on understanding how such factors related to complexity underlying business actors’ network pictures. We developed and tested several propositions about the associations between cognitive complexity on the one hand, and individual, organizational and network factors on the other. The empirical analysis showed that complexity is higher for individuals with more experience in internally-oriented functions than in externally-oriented ones, and that the more complex companies’ internal structures are, the more complex are the individuals’ network pictures. The data analysis also indicated that there is an inverted-U shaped relationship between network picture complexity and the number of years a company has been established in a business. Moreover, we were able to show that network pictures are more complex for individuals in project-based networks than for individuals in non-project based ones. Finally, and unexpectedly, we found a U-shaped relationship between network picture complexity and the number of years of an individual’s working experience. The latter finding contradicts expectations by literature in the area of strategic management (Levitt and March, 1988; Reger and Palmer, 1996). We found that when joining a company, managers acquired quickly complex views of their organisation’s network. This may be associated with the need they experience to become familiar

21
with their working environment, as fast and comprehensibly as possible. With managers’ growing experience, their views become more abstract and thus less complex (Lurigio and Carroll, 1985; Starbuck and Milliken, 1988); however, with even more experience in the company, the complexity of managers’ perception of their surrounding business network increased again. This reinforces the idea that is put forward by several authors such as Weick (1995) or Hooijberg (1996), who claim that for achieving greater effectiveness, there is a need for greater diversity or higher complexity. Further research is required to understand this unexpected finding. 8.1 Contributions and Managerial Implications
This paper reinforces the idea that the understanding of the relationship between actors’ beliefs (i.e. their network pictures) and actors’ behaviours (i.e. their networking activities) is crucial in order to understand network related phenomena. Moreover, the research borrows from other bodies of investigation the notion that the complexity of actors’ knowledge structures conditions how they perceive their surroundings, therefore conditioning actors’ strategic responses, decision making and analytical skills and firms’ actions and performance. We therefore argue that the complexity of actors’ network pictures is expected to condition networking activities and firms’ performance.
The development of a multi-dimensional construct of network pictures is also an important contribution to the extant literature on cognition in business networks. The analytical tool that is theoretically derived can be used to assess the complexity of network pictures. Furthermore, we have provided empirical evidence on the relationship between network picture complexity and several contextual factors. The extent to which managers understand their surrounding business network can thus be said to be dependent on diverse individual, organizational and network related factors.
Although there is no final agreement on how complex an actor’s cognitive structure should be to achieve better decision-making and firm performance (McNamara et al., 2002; Walsh, 1988; Weick, 1995), we believe that it is important for managers to be aware of the current levels of network picture complexity (their own, their top management team, as well as across the network in different companies). This may be used by managers to develop strategies for achieving a portfolio of different levels of network picture complexity with regard to their top decision-makers (at the company level) and/or counterparts (at the network level). Such a strategy would allow managers to avoid situations previously described in the literature as ‘collective ignorance’ (Weick, 1979), ‘cognitive oligopolies’ (Porac et al., 1989) or ‘common stereotyping’ (Ford et al., 2002; Halinen and Salmi, 1999; Henneberg et al., 2006), i.e. situations in which comprehensively shared collective mental maps result in decisions being made based on a restricted view of the surroundings. Moreover, it is also relevant for managers to understand how different levels of complexity are associated with specific contextual factors, as well as the relationship between network picture complexity and networking. This information may also be used by managers when developing the portfolio strategy described above.
8.2 Limitations and Implications for Future Research
The research design implied ‘quantifying’ qualitative data. When discussing some of the aspects of writing (‘good’) qualitative research, Pratt (2009) identifies this practice as a potentially dangerous path to follow. However, the development and usage of complexity scales to assess the sense-making of respondents has enabled us not only to integrate into the analysis multiple constructs but also to achieve a more precise idea of the differences and similarities that existed between respondents. Furthermore, it was never our intention to generalise the findings from the proposition-testing but instead, to provide rich insights about network pictures complexity specific to two specific networks.
One of the aims of this paper was to provide new insights that can help in understanding the relationship between actors’ network pictures and networking. We focus on a specific aspect of network pictures (i.e. their complexity) that is believed to condition networking. However, we do not provide any analyses on the relationships that are believed to exist between network pictures’ complexity and networking. This leads us to a discussion of future research. To begin with, further research should be conducted using the research methodology and design applied in this paper (including the developed

22
complexity scales) with respondents from other project and non-project based networks, as well as integrating companies and individuals with diverse features. The aim would be to verify if our findings on the association between network picture complexity and contextual factors were corroborated. Furthermore, given that a way to assess the complexity of actors’ network pictures has been developed and work has been done to grasp how complexity can be dependent on several factors, further research needs to link network picture complexity on the one hand, and strategic networking on the other. This can be done by conducting experiments which simulate different cognitive maps (e.g. by providing stimuli in the shape of network pictures which can be manipulated regarding the complexity they exhibit). This needs to be linked to decision situations and different strategic decision outcomes regarding network activities (Turnbull et al., 1996), e.g. the distinction between consolidating, conforming, and conceding relational activities, and creating, confronting, and coercing approaches (Ford et al., 2003). Alternative dependent constructs for strategic networking activities could also be developed from the resource-acquisition strategies postulated in Ivens et al. (2009) or Hoffmann’s (2007) discussion of shaping, adopting, and stabilizing strategies in alliance networks.

23
REFERENCES
Abrahamsen, M., Naudé, P., and Henneberg, S. [2009], 'Explaining Change in Networks Using Network Pictures: The Norwegian/Japanese Seafood Distribution System', 4th International Conference on
Business Market Management (Copenhagen, Denmark). Anderson, J., Håkansson, H., and Johanson, J. [1994], 'Dyadic Business Relationships Within a Business
Network Context.' Journal of Marketing (58: American Marketing Association), pp. 1-16. Argyris, C. and Schon, D. [1978], Organizational Learning: A Theory of Action Perspective (Reading,
Massachusetts: Addison-Wesley). Ashby, W. [1956], An Introduction to Cybernetics (London: Chapman and Hall). Axelsson, B. and Easton, G. [1992], Industrial Networks: A New View of Reality (New York and London:
Routledge). Baraldi, E. and Nadin, G. [2006], 'The Challenges in Digitalising Business Relationships. The
Construction of an IT Structure for a Textile-Related Business Network', Technovation, Vol. 26, pp. 1111-26.
Barr, P., Stimpert, J., and Huff, A. [1992], 'Cognitive Change, Strategic Action, and Organizational Renewal', Strategic Management Journal, Vol. 5, pp. 129-37.
Bartunek, J. [1984], 'Changing Interpretative Schemes and Organizational Restructuring: The Example of a Religious Order', Administrative Science Quarterly, Vol. 29, pp. 355-72.
Bartunek, J., Gordon, J., and Weathersby, R [1983], 'Developing 'Complicated' Understanding in Administrators', Academy of Management Review, Vol. 8, pp. 273-84.
Bartunek, J. and Franzak, F. [1988], 'The Effects of Organizational Restructuring on Frames of Reference and Cooperation', Journal of Management, Vol. 4, No. 579-592.
Brown, A., Stacey, P., and Nandhakumar, J. [2008], 'Making Sense of Sensemaking Narratives', Human
Relations, Vol. 61, No. 8, pp. 1035-62. Byrne, D. [1998], Complexity Theory and the Social Sciences (London and New York: Routledge). Carraher, S. and Buckley, M. [1996], 'Cognitive Complexity and the perceived Dimensionality of Pay
Satisfaction ', Journal of Applied Psychology, Vol. 81, No. 1, pp. 102-09. Casti, J. [1994], Complexification: Explaining a Paradoxal World through the Science of Surprise (New
York: Harper Perennial). Colville I. and Pye, A. [2010], 'A sensemaking perspective on network pictures' Industrial Marketing
Management, Vol 39/3, pp. tbc (DOI: 10.1016/j.indmarman.2009.03.012) Cova, B. and Hoskins, S. [1997], 'A Twin-Track Networking Approach to Project Marketing', European
Management Journal, Vol. 15, No. 5, pp. 546-56. Cova, B. and Salle, R. [2008], 'Creating Superior Value through Network Offerings', in A. Woodside, F.
Golfetton, and M. Gibbert (eds.), Creating and Managing Superior Customer Value (Advances in Business Marketing and Purchasing, 14; Bingley: JAI Press), 317–42.
Cova, B., Mazet, F., and Salle, R. [1994], 'From Competitive Tendering to Strategic Marketing: An Inductive Approach for Theory-Building', 2, Vol., No. 29-47.
Daft, R. and Weick, K. [1984], 'Toward a Model of Organizations as Interpretative Systems', Academy of
Management Review, Vol. 9, pp. 284-95. Dougherty, D. [1992], 'Interpretative Barriers to Successful Product Innovation in Large Firms',
Organization Science, Vol. 3, No. 2, pp. 179-202. Dwyer, R., Schurr, P., and Oh, S. [1987], 'Developing Buyer-Seller Relationships', Journal of Marketing,
Vol. 51, pp. 11-27. Easterby-Smith, M., Thorpe, R., and Lowe, A. [2003], Management Research (Second Edition edn.: Sage
Publications) 175. Easton, G. [1995], 'Methodology and Industrial Networks', in K. Moller and D. Wilson (eds.), Business
Marketing: An Interaction and Network Perspective (Massachusetts: Kluwer Academic Publishers), 411-92.

24
Easton, G. and Araujo, L. [1994], 'Market Exchange, Social Structures and Time', European Journal of
Marketing, Vol. 28, No. 3, pp. 72-84. Easton, G., Wilkinson, I., and Georgieva, K. [1997], 'On the Edge of Chaos: Towards Evolutionary
Models of Industrial Networks', in H. Gemunden, T. Ritter, and A. Walter (eds.), Relationship and
Networks in International Markets (Oxford: Elsevier/Pergamon), 273 - 93. Eden, C. and Ackermann, F. [1992], 'The Analysis of Cause Maps', Journal of Management Studies, Vol.
29, No. 3, pp. 309-24. Eden, C., Jones, S., and Sims, D. [1979], Thinking in Organizations (London: MacMillan). Elster, J. [2000], Ulysses Unbound (Cambridge: Cambridge University Press). Fahey, L. and Narayanan, V. [1989], 'Linking Changes in Revealed Causal Maps and Environmental
Change: an Empirical Study', Journal of Management Studies, Vol. 26, No. 4, pp. 361–78. Fioretti, G. and Visser, B. [2004], 'A Cognitive Interpretation of Organisational Complexity', E: CO, Vol.
6, No. 1-2 Fall, pp. 11-23. Fiske, S., Kinder, D., and Larter, W. [1983], 'The Novice and the Expert: Knowledge-Based Strategies in
Political Cognition', Journal of Experimental Social Psychology, Vol. 19, pp. 381-400. Ford, D. [1980], 'The Development of Buyer-Seller Relationships in Industrial Markets', in D. Ford (ed.),
Understanding Business Markets - Interaction, Relationships, Networks (First Edition edn., The Industrial Marketing and Purchasing Group: Academic Press), 339-54.
Ford, D. and Redwood, M. [2005], 'Making Sense of Network Dynamics through Network Pictures: A Longitudinal Case Study', Industrial Marketing Management, Vol. 34, pp. 648-57.
Ford, D. and Ramos, C. [2006], 'Network Pictures: Conceptual Development and Preliminary Findings', 22nd IMP Annual Conference, (Milan, Italy).
Ford, D. and Håkansson, H. [2006a], 'IMP - Some Things Achieved: much more to do', European Journal
of Marketing, Vol. 40, No. 3/4, pp. 248-58. Ford, D. and Håkansson, H. [2006b], 'The Idea of Interaction', The IMP Journal, Vol. 1, No. 1, pp. 4-27. Ford, D. [2002], Understanding Business Marketing and Purchasing (Third Edition edn.: Thomson
Learning) 488. Ford, D., Gadde L.-E., Håkansson H., Snehota I. [2002], 'Managing Networks', 18th IMP Conference
(Perth, Australia). Ford, D., Gadde L.-E., Håkansson H., Snehota I. [2003], Managing Business Relationships, (Second
Edition edn.: John Wiley & Sons Ltd). Ford, J. and Bacus, D. [1987], 'Organizational Adaptation to Performance Downturns', Academy of
Management Review, Vol. 12, No. 2, pp. 366-80. Gadde, L.-E., Huemer, L., and Håkansson, H. [2003], 'Strategizing in Industrial Networks', Industrial
Marketing Management, Vol. 32, pp. 337-54. Geiger, S. and Finch, J. [2010], 'Networks of Mind and Networks of Organizations: The Map Metaphor in
Business Network Research', Industrial Marketing Management, Vol. 39/3, pp. tbc (doi:10.1016/j.indmarman.2007.08.009)
Giddens, A. [1979], Central Problems in Social Theory (Berkeley, CA: University of California Press). Gioia, D. and Chittipeddi, K. [1991], 'Sensemaking and Sensegiving in Strategic Change Initiation',
Strategic Management Journal, Vol. 12, No. 6, pp. 433-48. Granovetter, M. [1985], 'Economic Action and Social Structure: The Problem of Embeddedness',
American Journal of Sociology, Vol., No. 91, pp. 481-510. Granovetter, M. [1992], 'Problems of Explanation in Economic Sociology', in N. Nhoria and R. Eccles
(eds.), Networks and Organizations: Structure, Form and Action (Boston: Harvard Business School Press).
Greenwood, R. and Hinings, C. [1988], 'Organizational Design Types, Tracks and the Dynamics of Strategic Change', Organization Studies, Vol. 9, pp. 293-316.
Guba, E. and Lincoln, Y. [2000], 'Competing Paradigms in Qualitative Research', in N. Denzin and Y. Lincoln (eds.), Handbook of Qualitative Research (Thousand Oaks: Sage), 105-17.

25
Gulati, R. [1995], 'Social Structure and Alliance Formation Patterns: A Longitudinal Analysis', Administrative Science Quarterly, Vol. 40, pp. 619-52.
Håkansson, H. [1982], International Marketing and Purchasing of Industrial Goods: An Interaction
Approach (IMP Project Group: John Wiley and Sons, Ltd.). Håkansson, H. and Snehota, I. [1989], 'No Business is an Island: The Network Concept of Business
Strategy', Scandinavian Journal of Management, Vol. 5, No. 3, pp. 187-200. Håkansson, H. and Johanson, J. [1992], 'A Model for Industrial Networks', in B. Axelsson and G. Easton
(eds.), Industrial Networks - A New View of Reality (London and New York: Routledge), 28-34. Håkansson, H. and Snehota, I. [1995], Developing Relationships in Business Networks (London and New
York: Routledge). Håkansson, H. and Ford, I. D. [2002], 'How Should Companies Interact in Business Networks?' Journal
of Business Research, Vol. 55, No. 2, pp. 133-39. Halinen, A. and Tornroos, J.-A. [1995], 'The Meaning of Time in the Study of Industrial Buyer-Seller
Relationships', in K. Moller and D. Wilson (eds.), Business Marketing: An Interaction and Network
Perspective (Boston, Dordrechst and London: Kluwer Academic Publishers). Halinen, A. and Salmi, A. [1999], 'From Dyadic Change to Changing Business Networks: An Analytical
Framework', Journal of Management Studies (36: Blackwell Publishing Limited), pp. 779-95. Halinen, A. and Salmi, A. [2001], 'Managing the Informal Side of Business Interaction: Personal Contacts
in the Critical Phases of Business Relationships', IMP Annual Conference (Oslo, Norway). Halinen, A. and Tornroos, J.-A. [2005], 'Using Case Methods in the Study of Contemporary Business
Networks', Journal of Business Research, Vol. 58, pp. 1285-97. Hambrick, D. and Mason, P. [1984], 'Upper Echelons: The Organisation as a Reflection of its Top
Managers', Academy of Management Review, Vol. 9, No. 2, pp. 193-206. Hedberg, B., Nystrom, P., and Starbuck, W. [1976], 'Camping on Seesaws: Prescriptions for a Self-
Designing Organization', Administrative Science Quarterly, Vol. 21, No. 1, pp. 41-65. Hedda, L. and Tornroos, J.-A. [2002], 'Towards a Theory of Timing: Kairology in Business Networks', in
R. Whipp, B. Adam, and I. Sabelis (eds.), Making Time: Time and Management in Modern
Organisations (Oxford: Oxford University Press). Henneberg, S., Mouzas, S., and Naudé, P. [2006], 'Network Pictures: Concepts and Representations',
European Journal of Marketing, Vol. 40, No. 3/4, pp. 408-429 Henneberg, S., Mouzas, S., and Naudé, P. [2009], 'Going Beyond Customers: A Business Segmentation
Approach Using Network Pictures to Identify Network Segments', Journal of Business Market
Management, 3/2, pp. 91-113. Henneberg, S., Mouzas, S., and Naudé, P. [2010], 'Sense-Making and Management in Business Networks
- Some Observations, Considerations, and a Research Agenda', Industrial Marketing Management, Vol. 39/3, pp. tbc (DOI: 10.1016/j.indmarman.2009.03.011)
Hershey, D., Walsh, D., Read, S., and Chulef, A. [1990], 'The Effects of Expertise on Financial Problem Solving: Evidence for Goal-Directed, Problem-Solving Scripts', Organizational Behavior and
Human Decision Processes, Vol. 46, pp. 77-101. Hodgkinson, G. and Johnson, G. [1994], 'Exploring the Mental Models of Competitive Strategists: The
Case for a Processual Approach', Journal of Management Studies, Vol. 31, No. 4, pp. 525-51. Hoffmann, W. [2007], ‘Strategies for Managing A Portfolio of Alliances’, Strategic Management
Journal, Vol. 28, pp. 827-856. Holland, J. [1987], 'The Global Economy as an Adaptive Process', in P. Anderson and D. Pines (eds.),
The Economy as an Evolving Complex System (5; Redwood City: Santa Fe Institute, Addison-Wesley).
Holmen, E., Aune, T., and Pederson, A.-C. [2008], 'Network Pictures and Network Potentials in Supply Management', 24th IMP Conference (Uppsala, Sweden).
Hooijberg, R. [1996], 'A Multidirectional Approach Towards Leadership: An Extension of the Concept of Behavioral Complexity', Human Relations, Vol. 49, No. 7, pp. 917-46.

26
Isabella, L. [1990], 'Evolving Interpretations as Change Unfolds: How Managers Construe Key Organizational Events', Academy of Management Journal, Vol. 33, pp. 7-41.
Ivens, B., Pardo, C., Salle, R., and Cova, B. [2009] ‘Relationship Keyness: The Underlying Concept for Different Forms of Key Relationship Management’, Industrial Marketing Management, Vol. 38, pp. 513-519.
Jablin, F. [1987], 'Formal organization structure ', in F. Jablin, Porter, L., Roberts, K. (eds.), Handbook of
Organizational Communication. An interdisciplinary perspective (Newbury Park: Sage Publications), 389-419.
Jack, S. [2005], 'The Role, Use and Activation of Strong and Weak Network Ties: A Qualitative Analysis', Journal of Management Studies, Vol. 42, No. 6, pp. 1233-59.
Jackson, S. and J. Dutton (1988), "Discerning Threats and Opportunities," Administrative Science Quarterly, 33, 370-87.
Johnston, W., Lewin, J., and Spekman, R. [1999], 'International Industrial Marketing Interactions: Dyadic and Network Perspectives ', Journal of Business Research, Vol. 46, pp. 259-71.
Johnston, W., Peters, L., and Gassenheimer, J. [2006], 'Questions about Network Dynamics: Characteristics, Structures and Interactions', Journal of Business Research, Vol. 59, pp. 945-54.
Kauffman, S [1992a], Origins of Order: Self-Organisation and Selection in Evolution (Oxford: Oxford University Press).
Kauffman, S. [1992b], Origins of Order: Self-organisation and Selection in Evolution (Oxford: Oxford University Press).
Kelly, G. (1955), The Psychology of Personal Constructs. New York: Norton. Knight, L. [2002], 'Network Learning: Exploring Learning by Interorganizational Networks', Human
Relations, Vol. 55, No. 4, pp. 427-54. Kragh, H. and Andersen, P. [2008], 'Picture this: Managed Change and Resistance in Business Network
Settings', 24th IMP Conference (Uppsala, Sweden). Krippendorff, K [2004], Content Analysis: An Introduction to its Methodology (Second Edition edn.;
California: Sage Publications). Lambe, C., Speckman, R., and Hunt, S. [2000], 'Interimistic Relational Exchange: Conceptualization and
Propositional Development', Journal of the Academy of Marketing Science, Vol. 28, No. 2, pp. 212-25.
Larkin, J., McDermott J., Simon D., Simon H. [1980], 'Expert and Novice Performance in Solving Physics Problems', Science, Vol. 208, pp. 1335-42.
Larson, A. [1992], 'Network Dyads in Entrepreneurial Settings: A Study of the Governance of Exchange Relationships', Administrative Science Quarterly, Vol. 37, pp. 76-104.
Lawrence, P. and Lorsch, J. [1967], 'Differentiation and Integration in Complex Organisations', Administrative Science Quarterly, Vol. 12, No. 1, pp. 1-47.
Leek, S. and Mason, K. [2008], 'Network Pictures: Building an Holistic Representation of a Dyadic Business-to-Business Relationship', 24th IMP Conference (Uppsala, Sweden).
Levitt, B. and March, J. [1988], 'Organizational Learning', Annual Review of Sociology, Vol. 14, pp. 319-40.
Levy [1994], 'Chaoes Theory and Strategy: Theory, Application and Managerial Implications', Strategic
Management Journal, Vol. 15, pp. 167-78. Lissack, M. [1999], 'Complexity: the Science, its Vocabulary and its Relation to Organizations',
Emergence, Vol. 1, No. 1, pp. 110-26. Lowe, S., Ellis, N., and Purchase, S. [2008], 'Rethinking Language in IMP Research: Networking
Processes in Other Words ', Scandinavian Journal of Management, Vol. 24, pp. 295-307. Lurigio, A. and Carroll, J. [1985], 'Probation Officers' Schemata of Offenders: Content, Development,
and Impact on Treatment Decisions', Journal of Personality and Social Psychology, Vol. 48, No. 5, pp. 1112-26.
Maguire, S. and McKelvey, B. [1999], 'Complexity and Management: Moving from Fad to Firm Foundations', Emergence, Vol. 1, No. 2, pp. 19-61.

27
Marschan, R., Welch, D., and Welch, L. [1996], 'Control in Less-Hierarchical Multinationals: the Role of Personal Networks and Informal Communication', International Business Review, Vol. 5, No. 2, pp. 137-50.
Mason, M. [2008], 'What is Complexity Theory and What are its Implications for Educational Change?' Educational Philosophy and Theory, Vol. 40, No. 1, pp. 35-49.
Mattsson, L-G. [1985], 'An Application of a Network Approach to Marketing: Defending and Changing Market Positions', in N. Dholakia and J. Arndt (eds.), Changing the Course of Marketing:
Alternative Paradigms for Widening Marketing Theory (Research in Marketing: a Research Annual, Supplement 2; London: Jay Press), 263-88.
Mattsson, L-G. [1987], 'Management of Strategic Change in a "Market-as-Networks" Perspective', in A. Pettigrew (ed.), The Management of Strategic Choice (Oxford: Basil Blackwell), 234-60.
Mattsson, L-G. [2005], 'Managing in Markets as Interacting with Market Theories and Market Practice', 1st IMP Journal Seminar Series (Oslo, Norway), pp. 1-18.
Mattsson, L.G. [1988], 'Interaction Strategies: A Network Approach', AMA Summer Marketing
Educators' Conference (San Francisco, California: AMA), pp. 310-15. McNamara, G., Luce, R., and Tompson, G. [2002], 'Examining the Effect of Complexity in Strategic
Groups on Firm Performance', Strategic Management Journal Vol. 23, pp. 153-70. Medlin, C. and Tornroos, J.-A. [2007], 'Inter-Firm Interaction from a Human Perspective', Finanza
Marketing and Produzione, Vol., pp. 41-56. Meyer, A. [1978], 'Management and Strategy', in R. Miles and C. Snow (eds.), Organizational Strategy
(New York: McGraw-Hill) Miller, D. [1993], 'The Architecture of Simplicity', Academy of Management Review, Vol. 18, pp. 116-38. Mohr, J. and Nevin, J. [1990], 'Communication Strategies in Marketing Channels: a Theoretical
Perspective', Journal of Marketing, Vol. 54, No. 4, pp. 36-52. Möller, K. and Svahn, S. [2006], 'Role of Knowledge in Value Creation in Business Nets', Journal of
Management Studies, Vol. 43, No. 5, pp. 985-1007. Morgan, M. and Hunt, S. [1994], 'The Commitment-Trust Theory of Relationship Marketing', Journal of
Marketing, Vol. 58, pp. 20-38. Morrison, K. [2002], School Leadership and Complexity Theory (London and New York:
Routledge/Falmer). Mouzas, S., Henneberg, S., and Naudé, P. [2008], 'Developing Network Insight', Industrial Marketing
Management, Vol. 37, No. 2, pp. 167-80. Öberg, C., Henneberg, S., and Mouzas, S. [2007], 'Changing Network Pictures: Evidence from Mergers
and Acquisitions', Industrial Marketing Management, Vol. 36, pp. 926-40. Perrow, C. [1984], Normal Accidents: Living with High-Risk Technologies (New Jersey: Princeton
University Press). Pfeffer, J. and Salancik, G. [1978], The External Control of Organizations: A Resource Dependence
Perspective (New York: Harper and Row, Publishers). Piekkari, R., Plakoyiannaki, E., and Welch, C. [2010], ''Good' Case Research in Industrial Marketing:
Insights from Research Practice', Industrial Marketing Management, Vol. 39, pp. 109-17. Poole, P., Gray, B., and Gioia, D. [1990], 'Organizational Script Development Through Interactive
Accommodation', Group and Organization Studies, Vol. 15, pp. 212-32. Porac, J. and Thomas, H. [1990], 'Taxonomic Mental Models in Competitor Definition', The Academy of
Management Review, Vol. 15, No. 224-240. Porac, J., Thomas, H., and Baden-Fuller, C. [1989], 'Competitive Groups as Cognitive Communities: The
Case of the Scottish Knitwear Manufacturers', Journal of Management Studies, Vol., No. 26, pp. 397-416.
Pratt, M. [2009], 'For the Lack of a Boilerplate: Tips on Writing Up (and Reviewing) Qualitative Research', Academy of Management Journal, Vol. 52, No. 5, pp. 856-62.
Purchase, S. and Olaru, D. [2004], 'Substance in Business-t-Business Relationships', Journal of Business-
to-Business Marketing, Vol. 11, No. 3, pp. 23-52.

28
Ramos, C. [2008], 'Developing Network Pictures As A Research Tool: Capturing The Output Of Individuals’ Sense-Making In Organisational Networks', (University of Bath).
Ramos, C. and Ford, D. [2009], 'Network Pictures as a Research Device: Developing a Tool to Capture Actors' Perceptions in Organizational Network', 25th IMP Annual Conference (Marseilles, France).
Ramos, C., Naudé, P., and Ford, D. [2005], 'Developing Network Pictures as a Conceptual Device', 1st
IMP Meeting of the IMP Journal (Oslo, Norway). Ranson, S., Hinings, B., and Greenwood, R. [1980], 'The Structuring of Organizational Structures',
Administrative Science Quarterly, Vol. 2, No. 5, pp. 1-17. Reger, R. and Palmer, T. [1996], 'Managerial Categorization of Competitors: Using Old Maps to Navigate
New Environments', Organization Science, Vol. 7, No. 1, pp. 22-39. Rentch, J., Heffner, T., and Duffy, L. [1994], 'What you Know is What You Get from Experience: Team
Experience Related to Teamwork Schemas', Group and Organization Management Vol. 19, pp. 450-74.
Rescher, N. [1998], Complexity: A Philosophical Overview (New Brunswick: N.J.: Transaction). Ritchie, J. and Lewis, J. [2003], Qualitative Research Practice: A Guide for Social Sciences Students and
Researchers (London: Sage Publications). Ritter, T. [1999], 'The Networking Company', Industrial Marketing Management, Vol. 28, pp. 467-79. Ritter, T., Wilkinson, I., and Johnston, W. [2004], 'Managing in Complex Business Networks', Industrial
Marketing Management, Vol. 33, pp. 175-83. Rohrmus, D. and Henneberg, S. [2006], 'Sense-Making and Cognition in Business Networks:
Conceptualisation and Propositional Development', Second IMP Journal Seminar (Chalmers University, Gothenburg, Sweden).
Samli, A. and Bahn, K. [1992], 'The Market Phenomenon: an Alternative Theory and Some Metatheoretical Research Considerations', Journal of the Academy of Marketing Science, Vol. 20, No. 2, pp. 143-53.
Sandelands, L. and Stablein, R. [1987], 'The Concept of Organizational Mind', in C. Bacharach and N. DiTomaso (eds.), Research in the Sociology of Organizations (4; Greenwich, Connecticut: JAI Press), 135-61.
Saner, R. and Yiu, L. [2005], 'Swiss Executives as Business Diplomats in the New Europe: Evidence from Swiss Pharmaceutical and Agro-Industrial Global Companies', Organizational Dynamics, Vol. 34, No. 3, pp. 298–312.
Schwandt, T. [2000], 'Constructivist, Interpretivist Approaches of Human Enquiry', in N. Denzin and Y. Lincoln (eds.), Handbook of Qualitative Research (Thousand Oaks: Sage), 118-37.
Simon, H. [1999], The Sciences of the Artificial (3rd Edition edn.; Cambridge: Mass.: The MIT Press). Spender, J.-C. [1989], Industry Recipes: An Enquiry into the Nature and Sources of Managerial
Judgement (Cambridge: MA: Basil-Blackwood, Inc). Stacey, R. [1996], Complexity and Creativity in Organizations (San Francisco: Berrett-Koehler
Publishers). Starbuck, W. and Milliken, F. [1988], 'Executives' Perceptual Filters: What they Notice and How They
Make Sense', in D. Hambrick (ed.), The Executive Effect: Concepts and Methods for Studying Top
Managers (Greenwish, Connecticut: JAI Press), 35-65. Stewart, D. and Latham, D. [1980], 'A Preference Mapping of Organizational Objectives of Sports
Franchise Executives', Journal of Applied Psychology, Vol. 65, pp. 610-15. Streufert, S. and Swezey, R. [1986], Complexity, Managers, and Organizations (London: Academic
Press). Streufert, S. and Nogami, G. [1989], 'Cognitive Style and Complexity: Implications for I/O Psychology',
in C. Cooper and I. Robinson (eds.), International Review of Industrial and Organizational
Psychology (London: Wiley), 93-143. Stubbart, C. and Ramaprasad, A. [1988], 'Probing Two Chief Executives' Beliefs about the Steel Industry
using Cognitive Maps', in R. Lamb (ed.), Advances in Strategic Management (7; Greenwich, Connecticut: JAI).

29
Tetlock, P. [1984], 'Cognitive Style and Political Belief Systems in the British House of Commons', Journal of Personality and Social Psychology, Vol. 48, pp. 1227-39.
Thomas, J., Clark, S., and Gioia, D. [1993], 'Strategic Sensemaking and Organizational Performance: Linkages among Scanning, Interpretation, Action, and Outcomes', Academy of Management
Journal, Vol. 36, pp. 239-70. Thompson, J. [1967], Organizations in Action (Social Science Bases of Administrative Theory: McGraw-
Hill Book Company). Tsoukas, H. and Hatch, J. [2001], 'Complex Thinking, Complex Practice: The Case for a Narrative
Approach to Organizational Complexity', Human Relations, Vol. 54, No. 8, pp. 979-1013. Tufte, E.R. [1983], The Visual Display of Quantitative Information (Cheshire, Ct.: Graphics Press). Turnbull, P., Ford, D., and Cunningham. M. [1996], ‘Interaction, Relationships and Networks in Business
Markets: An Evolving Perspective’, Journal of Business & Industrial Marketing, Vol. 11, No 3/4, pp. 44-62.
Vandenberg, R. and Scarpello, V. [1990], 'The Matching Model: An Examination of the Processes Underlying Realistic Job Previews', Journal of Applied Psychology, Vol. 75, pp. 60-67.
Waddington, C. [1977], Tools for Thought: How to Understand and Apply the Latest Scientific
Techniques of Problem Solving. (New York: Basic Books). Wagner, R. [1987], 'Tacit Knowledge in Everyday Intelligent Behavior ', Journal of Personality and
Social Psychology, Vol. 52, pp. 1236-47. Walsh, J. [1988], 'Selectivity and Selective Perception: An Investigation of Managers' Belief Structures
and Information Processing', Academy of Management Journal, Vol. 31, No. 4, pp. 873-96. Walsh, J. [1995], 'Managerial and Organizational Cognition: Notes from a Trip Down Memory Lane',
Organization Science, Vol. 6, No. 3, pp. 280-321. Walsh, J. and Ungson, G. [1991], 'Organizational Memory', Academy of Management Review, Vol. 16,
pp. 57-91. Walsh, J., Henderson, C., and Deighton, J. [1988], 'Negotiated Belief Structures and Decision
Performance: an Empirical Investigation', Organizational Behavior and Human Decision
Processes, Vol. 42, pp. 194-216. Weick, K. [1979], The Social Psychology of Organizations (Second Edition edn.: Random House, Inc.). Weick, K. [1995], Sensemaking in Organizations, ed. University of Illinois David Whetten (Foundations
dor Organizational Science: Sage Publications, Inc.). Welch, C. and Wilkinson, I. [2002], 'Idea Logics and Network Theory in Business Marketing', Journal of
Business-to-Business Marketing, Vol. 9, No. 3, pp. 27-48. Wilkinson, I. and Young, L. [2002], 'On Cooperating Firms, Relations and Networks', Journal of
Business Research (55), pp. 123-32. Williamson, O. [1975], Markets and Hierarchies (New York: The Free Press). Yin, R. [1994], Case Study Research: Design and Methods (Second Edition edn., Applied Social
Research Methods Series, 5: Sage Publications). Yiu, L. and Saner, R. [2000], 'Determining the impact of cognitive styles on the effectiveness of global
managers: Propositions for further research', Human Resource Development Quarterly, Vol. 11, No. 2, pp. 319-24.

30
Appendix 1
Construct Description and complexity scales underlying the sub-dimensions of network picture complexity
SUB-DIMENSIONS Construct Description Complexity Scales (5-point)
Sub-Dimension 1.1
Number of Actors
Sub-dimension 1.1.1
Number of actors
Nature: Large or small number of specific actors • Value 1 (minimum complexity) when the lowest number of actors / nature of actors / number of relationships is identified in the sample
• Value 5 (maximum complexity) when the highest number of actors / nature of actors / number of relationships is identified in the sample
• Values 2, 3 and 4
(intermediate complexity) for situations in-between the two described above, with the score increasing with complexity.
Definition: Specific actors are those that are identified by a respondent by their names (e.g. name of a person, of a company, of an association) (Cova and Salle 2008). Rationale: The greater the number of specific actors identified, the more complex is the respondent’s network picture.
Sub-dimension 1.1.2
Number of groups
of actors
Nature: Large or small number of groups of actors
Definition: Groups of actors are those that are described by a respondent as a category of actors (e.g. clients, suppliers, competitors, business sectors) (Cova and Salle 2008). Rationale: The greater the number of groups of actors identified, the more complex is the respondent’s network picture.
Sub-Dimension 1.2
Nature of Actors
Sub-dimension 1.2.1
Business Counterparts
Nature: Large or small number of business counterparts
Definition: Business counterparts are all entities with which a respondent has business relations with (e.g. clients, suppliers) (Medlin and Tornroos 2007). Rationale: The greater the number of business counterparts identified, the more complex is the respondent’s network picture.
Sub-dimension 1.2.2
Non-Business
Counterparts
Nature: Large or small number of non-business counterparts
Definition: Non-business counterparts are all entities that somehow affect or are affected by a respondent’s business activity, despite the nonexistence of business relationships (e.g. government, local or global community, competitors, industry associations) (Saner and Yiu 2005). Rationale: The greater the number of non-business counterparts identified, the more complex is the respondent’s network picture.
Sub-Dimension 2.1
Number of Relationships

31
Sub-dimension 2.1.1
Number of relationships
Nature: Large or small number of relationships between specific actors
Definition: Relationships between specific actors are all relationships between actors that are identified by a respondent by their names (Cova and Salle 2008). Rationale: The greater the number of relationships between specific actors identified, the more complex is the respondent’s network picture.
Sub-dimension 2.1.2
Number of groups of
relationships
Nature: Large or small number of relationships between groups of actors
Definition: Relationships between groups of actors are all relationships between actors that are identified by a respondent as a category or group (Cova and Salle 2008). Rationale: The greater the number of relationships between groups of actors identified, the more complex is the respondent’s network picture.
Sub-Dimension 2.2
Nature of Relationships
Sub-dimension 2.2.1
Strength of relationships
Nature: Strong and/or weak ties. • Value 1 (minimum complexity) when only one aspect, e.g. strong, direct, formal, or unidirectional ties, are identified by respondents, respectively for each sub-dimension;
• Value 5 (maximum complexity) when, respectively for each sub-dimension, both strong and weak, direct and indirect, formal and informal, and unidirectional and bidirectional ties are comprehensively perceived by respondents;
• Values 2, 3 and 4 (intermediate complexity) for situations in-between the two described above, with the score increasing
Definitions: Weak ties are nodes in a wider social network that can be used to provide resources, generate business and enhance reputations; Strong ties are ties that are developed to serve a certain function, that are useful and that provide trustworthy information (Jack 2005). Rationale: The larger the number of weak ties identified, the more complex is the respondent’s network picture.
Sub-dimension 2.2.2
Immediateness of
relationships
Nature: Direct and/or indirect ties. Definitions: Direct ties are the personal relationships between a decision maker and the party about whom the decision is being made; Indirect ties are relationships between two individuals, who are not directly connected but through whom a connection can be made through the social network of each party’s direct ties (Granovetter 1992; Gulati 1995; Larson 1992). Rationale: The larger the number of indirect ties identified, the more complex is the respondent’s network picture.
Sub-dimension 2.2.3
Formality of relationships
Nature: Formal and/or informal ties.
Definitions: Formal ties are ties that are legally established or defined by some hierarchy; Informal ties are mostly social, person-centred and not organization-centred, not contractually defined (Easton and Araujo 1994; Granovetter 1985; Halinen and Salmi 2001; Marschan et al. 1996). Rationale: The larger the number of informal ties identified, the more complex is the respondent’s network picture.

32
Sub-dimension 2.2.4
Directionality of
relationships
Nature: Unidirectional and/or bidirectional ties. with complexity. Definitions: Unidirectional ties are associated with flows and influence activities between actors with one sole direction; Bidirectional ties are about reciprocal flows and influences between actors (Ford and Håkansson 2006b; Henneberg et al. 2006), Rationale: The larger the number of bidirectional ties identified, the more complex is the respondent’s network picture.
Sub-dimension 2.2.5
Multidisciplinary of
relationships
Nature: Social and/or economic and/or technological ties. • Value 1 (minimum complexity) when none of the possible aspects of relationships included in these sub-dimensions are mentioned;
• Value 5 (maximum complexity) when all of the possible aspects of relationships included in these sub-dimensions are mentioned extensively;
• Values 2, 3 and 4 (intermediate complexity) for situations in-between the two described above, with the score increasing with complexity.
Definitions: Social ties regard the atmosphere of the relationship; Economic ties are related to the financial aspects of the relationship; Technological ties are about the industrial/technical aspects that bound actors in a relationship (Easton 1995; Halinen and Tornroos 2005). Rationale: The larger the number of multidisciplinary aspects identified, the more complex is the respondent’s network picture.
Sub-dimension 2.2.6
Substance of relationships
Nature: Actor bonds and/or resource ties and/or activity links.
Definitions: Actor bonds reflect the atmosphere of a relationship; Activity links correspond to the transfer or a transformation of resources between actors; Resource ties translate how resources can be transferred or transformed in the network (Håkansson and Johanson 1992). Rationale: A respondent’s network picture covering relational aspects in terms of actors bonds, resource ties, and activity links is assumed to be more complex than one that does not include these three aspects.
Sub-dimension 2.2.7
Nature of the system of
relationships
Nature: Tightly coupled and/or loosely coupled systems. • Value 1 (minimum complexity) when a purely tightly coupled system is described;
• Value 5 (maximum complexity) when a purely loosely coupled system is described.
• Values 2, 3 and 4 (intermediate complexity) for situations in-between the two described above,
Definitions: Tightly coupled systems are associated with linear systems, where the order of sequences is invariant therefore not being place for flexibility or unpredictability; Loosely coupled systems are associated with complex (chaotic) systems, where there is unpredictability of events and associated consequences, and the order of sequences may be changes without this affecting the system’s overall functioning (Perrow 1984). Rationale: A respondent’s network picture which can be described as resembling a loosely coupled system is considered more complex than one that is closer to a tightly coupled system.
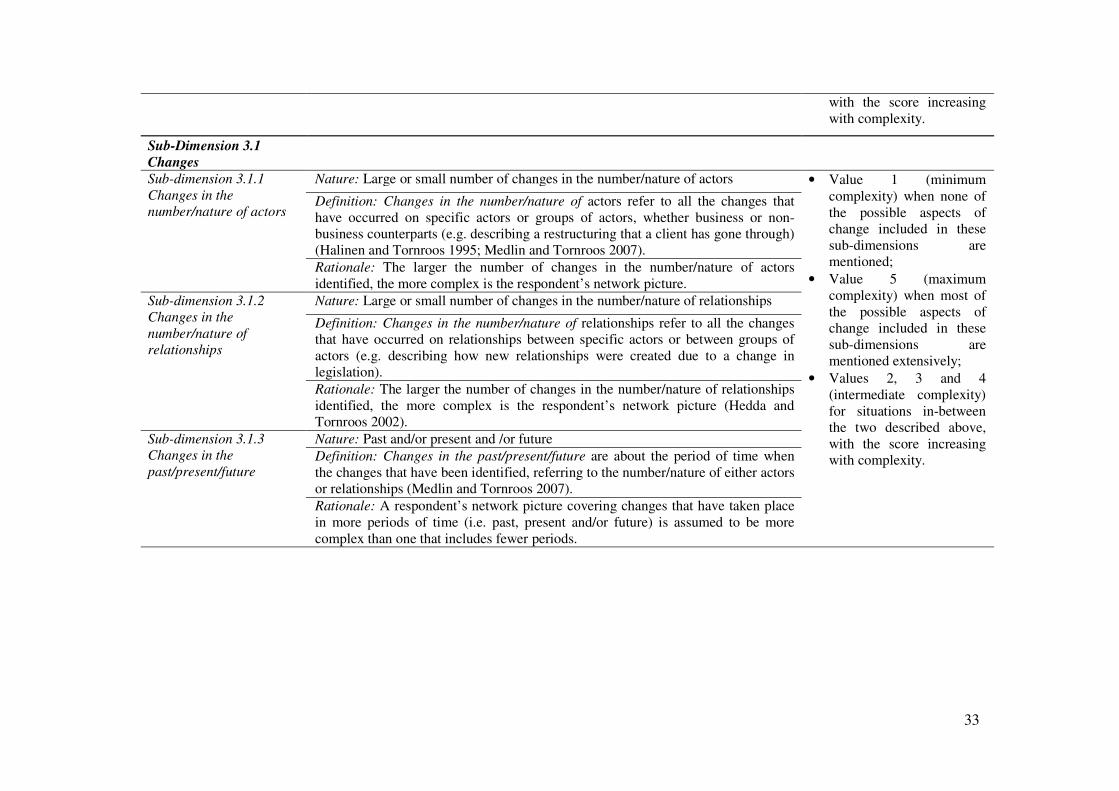
33
with the score increasing with complexity.
Sub-Dimension 3.1
Changes
Sub-dimension 3.1.1
Changes in the
number/nature of actors
Nature: Large or small number of changes in the number/nature of actors • Value 1 (minimum complexity) when none of the possible aspects of change included in these sub-dimensions are mentioned;
• Value 5 (maximum complexity) when most of the possible aspects of change included in these sub-dimensions are mentioned extensively;
• Values 2, 3 and 4 (intermediate complexity) for situations in-between the two described above, with the score increasing with complexity.
Definition: Changes in the number/nature of actors refer to all the changes that have occurred on specific actors or groups of actors, whether business or non-business counterparts (e.g. describing a restructuring that a client has gone through) (Halinen and Tornroos 1995; Medlin and Tornroos 2007). Rationale: The larger the number of changes in the number/nature of actors identified, the more complex is the respondent’s network picture.
Sub-dimension 3.1.2
Changes in the
number/nature of
relationships
Nature: Large or small number of changes in the number/nature of relationships
Definition: Changes in the number/nature of relationships refer to all the changes that have occurred on relationships between specific actors or between groups of actors (e.g. describing how new relationships were created due to a change in legislation). Rationale: The larger the number of changes in the number/nature of relationships identified, the more complex is the respondent’s network picture (Hedda and Tornroos 2002).
Sub-dimension 3.1.3
Changes in the
past/present/future
Nature: Past and/or present and /or future Definition: Changes in the past/present/future are about the period of time when the changes that have been identified, referring to the number/nature of either actors or relationships (Medlin and Tornroos 2007). Rationale: A respondent’s network picture covering changes that have taken place in more periods of time (i.e. past, present and/or future) is assumed to be more complex than one that includes fewer periods.