Understanding Monitoring and Evaluation: Concepts and ... · Understanding Monitoring and...
72
Understanding Monitoring and Evaluation: Concepts and Common Methods for Behaviour Change Communications Campaigns Facilitator’s Guide October 2012 USAID Communications Support for Health Project Lusaka, Zambia
Transcript of Understanding Monitoring and Evaluation: Concepts and ... · Understanding Monitoring and...
Understanding Monitoring and Evaluation:
Concepts and Common Methods for Behaviour Change
Communications Campaigns
Facilitator’s Guide
October 2012
USAID Communications Support for Health Project
Lusaka, Zambia

Contents
Agenda .......................................................................................................................................................... 1
Training Objectives ....................................................................................................................................... 4
Training Materials ......................................................................................................................................... 4
DAY ONE ........................................................................................................................................................ 5
Session 1: Workshop Introduction ............................................................................................................... 5
Session 2: What Is Monitoring? ................................................................................................................... 8
Energiser 1: Stranded on an Island ............................................................................................................ 11
Session 3: What Is Evaluation? .................................................................................................................. 12
Session 4: Foundations of an M&E Plan .................................................................................................... 16
Session 5: M&E Frameworks....................................................................................................................... 21
DAY TWO ..................................................................................................................................................... 25
Session 5: M&E Frameworks (continued) .................................................................................................. 25
Session 6: Indicators................................................................................................................................... 29
Energiser 2: How Much Paper? .................................................................................................................. 33
Session 6: Indicators (continued) ............................................................................................................... 33
Session 7: Data Sources and Collection ..................................................................................................... 41
DAY THREE .................................................................................................................................................. 47
Session 8: Evaluation Design ...................................................................................................................... 47
Session 9: Data Presentation ..................................................................................................................... 54
Energiser 3: Toss the Ball ........................................................................................................................... 60
Session 10: Data Interpretation ................................................................................................................. 61
Session 11: Closing ..................................................................................................................................... 65

Understanding Monitoring and Evaluation
1 Facilitator’s Guide
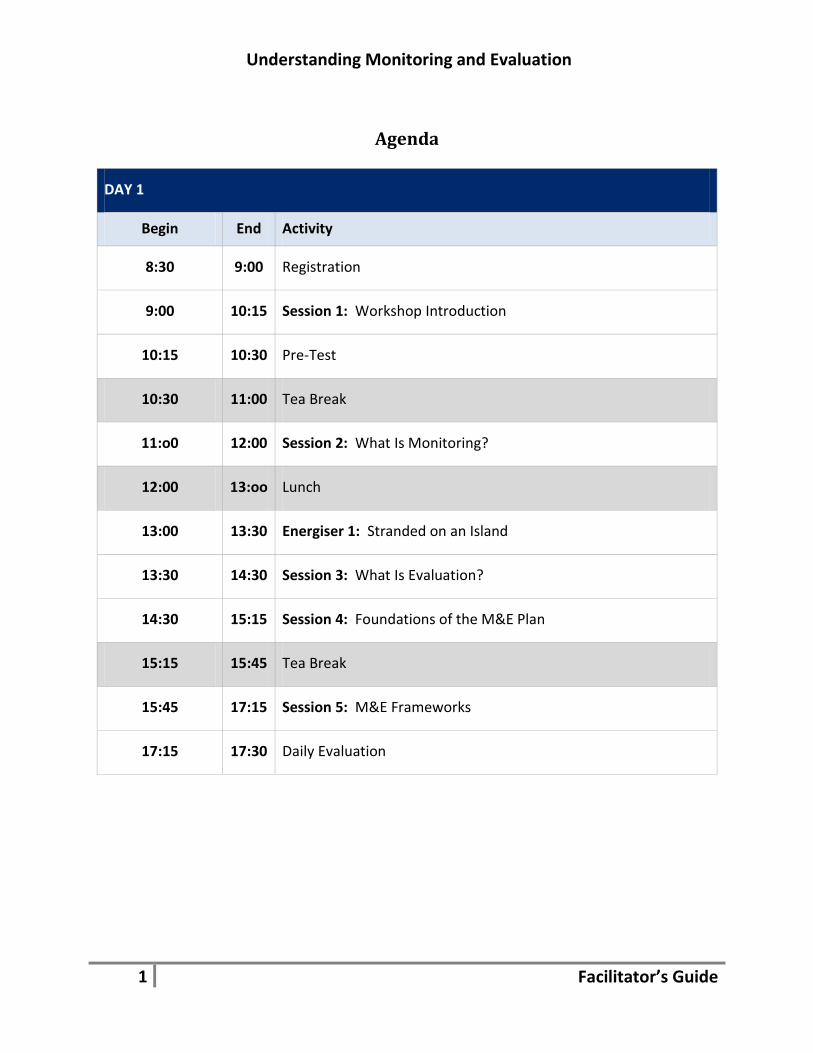
Agenda
DAY 1
Begin End Activity
8:30 9:00 Registration
9:00 10:15 Session 1: Workshop Introduction
10:15 10:30 Pre-Test
10:30 11:00 Tea Break
11:o0 12:00 Session 2: What Is Monitoring?
12:00 13:oo Lunch
13:00 13:30 Energiser 1: Stranded on an Island
13:30 14:30 Session 3: What Is Evaluation?
14:30 15:15 Session 4: Foundations of the M&E Plan
15:15 15:45 Tea Break
15:45 17:15 Session 5: M&E Frameworks
17:15 17:30 Daily Evaluation
Understanding Monitoring and Evaluation
2 Facilitator’s Guide
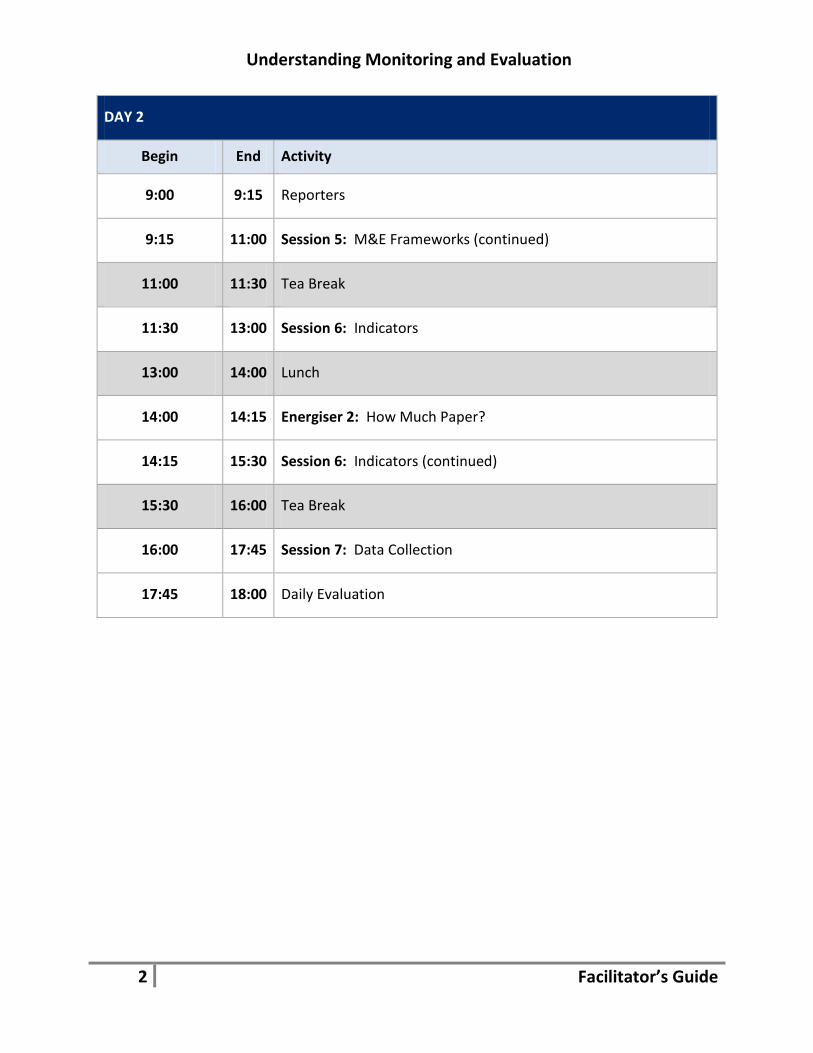
DAY 2
Begin End Activity
9:00 9:15 Reporters
9:15 11:00 Session 5: M&E Frameworks (continued)
11:00 11:30 Tea Break
11:30 13:00 Session 6: Indicators
13:00 14:00 Lunch
14:00 14:15 Energiser 2: How Much Paper?
14:15 15:30 Session 6: Indicators (continued)
15:30 16:00 Tea Break
16:00 17:45 Session 7: Data Collection
17:45 18:00 Daily Evaluation
Understanding Monitoring and Evaluation
3 Facilitator’s Guide
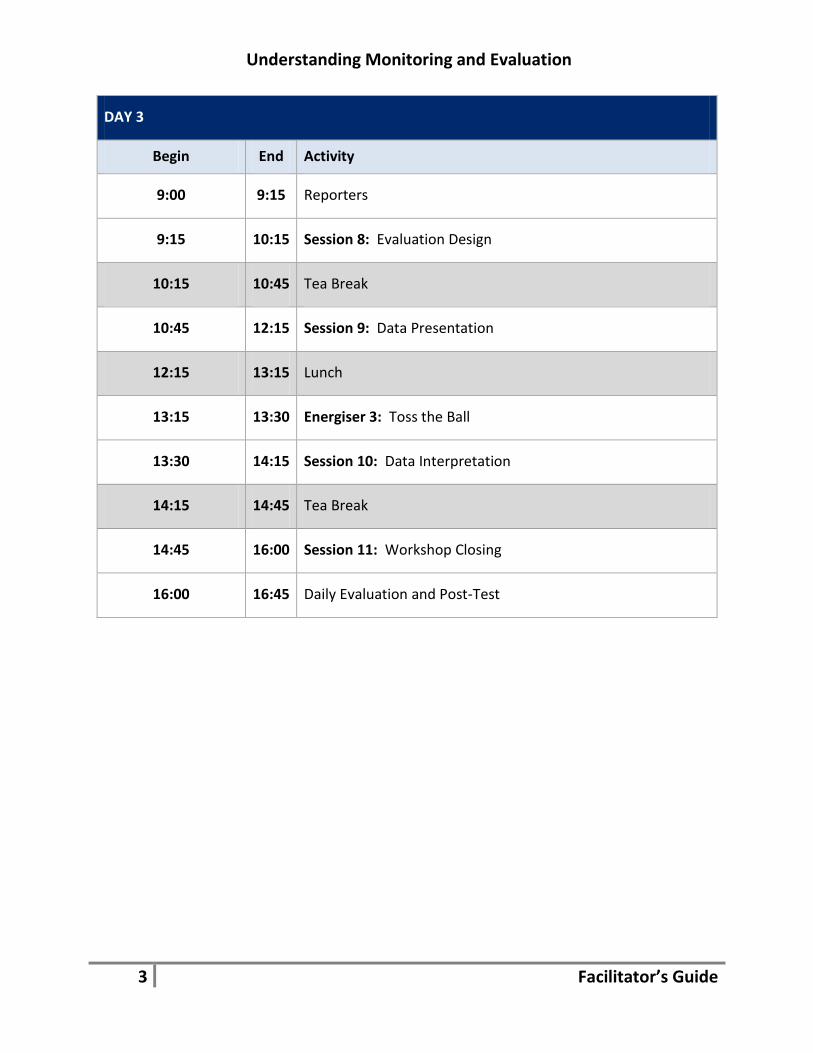
DAY 3
Begin End Activity
9:00 9:15 Reporters
9:15 10:15 Session 8: Evaluation Design
10:15 10:45 Tea Break
10:45 12:15 Session 9: Data Presentation
12:15 13:15 Lunch
13:15 13:30 Energiser 3: Toss the Ball
13:30 14:15 Session 10: Data Interpretation
14:15 14:45 Tea Break
14:45 16:00 Session 11: Workshop Closing
16:00 16:45 Daily Evaluation and Post-Test

4 Facilitator’s Guide
Training Objectives
After completing the training, participants should be able to
Explain the role of monitoring and evaluation (M&E) for behaviour change communications
(BCC) and how it is different from M&E for health service delivery;
Create M&E frameworks;
Choose M&E indicators;
Select an appropriate evaluation design, data sources, and collection methods;
Design M&E plan;
Identify effective presentation and interpretation practices; and
Make recommendations for campaign revisions.
Training Materials
Materials for participants and facilitators to use include
Participant guide containing copies of slides and handouts,
Flipchart paper,
Markers,
Soccer ball,
Markers,
Toilet paper,
Pre- and post-tests,
Daily evaluation forms,
Sign-in sheet,
Certificate of training completion,
Pens or pencils,
Tape,
Notecards or sticky notes,
Name tags, and
Exercise reference information
‒ Malaria campaign plan with comments on missing or incorrect information, and
‒ HIV/AIDS campaign scenario, including sample charts for data presentation, M&E plan,
conceptual framework, and logic model.

5 Facilitator’s Guide
DAY ONE
Registration
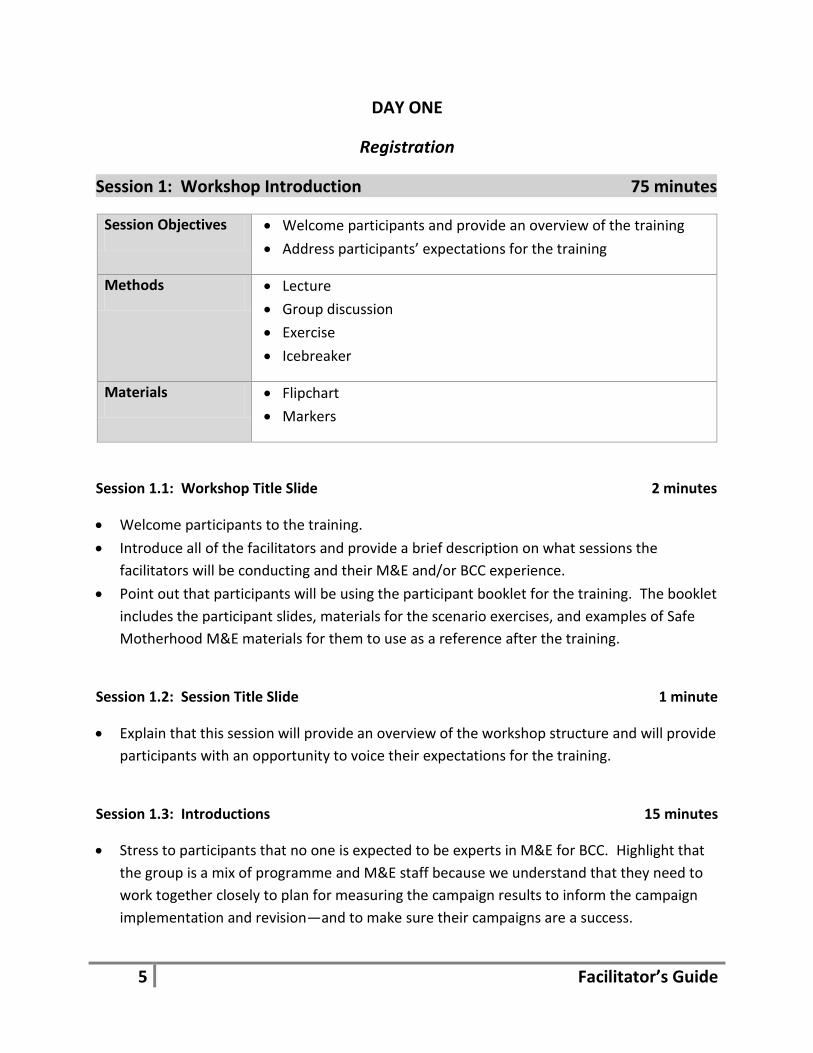
Session 1: Workshop Introduction 75 minutes
Session Objectives Welcome participants and provide an overview of the training
Address participants’ expectations for the training
Methods Lecture
Group discussion
Exercise
Icebreaker
Materials Flipchart
Markers
Session 1.1: Workshop Title Slide 2 minutes
Welcome participants to the training.
Introduce all of the facilitators and provide a brief description on what sessions the
facilitators will be conducting and their M&E and/or BCC experience.
Point out that participants will be using the participant booklet for the training. The booklet
includes the participant slides, materials for the scenario exercises, and examples of Safe
Motherhood M&E materials for them to use as a reference after the training.
Session 1.2: Session Title Slide 1 minute
Explain that this session will provide an overview of the workshop structure and will provide
participants with an opportunity to voice their expectations for the training.
Session 1.3: Introductions 15 minutes
Stress to participants that no one is expected to be experts in M&E for BCC. Highlight that
the group is a mix of programme and M&E staff because we understand that they need to
work together closely to plan for measuring the campaign results to inform the campaign
implementation and revision—and to make sure their campaigns are a success.
6 Facilitator’s Guide
Explain that the training will focus on discussing M&E methods and concepts that can be
used specifically for BCC campaigns and will not get into technical statistical work.
Explain that throughout the training, participants will be asked to offer their experiences
with M&E and BCC campaigns, and the training will promote learning from fellow training
participants.
Go around the room and ask each participant to tell the group his or her name,
organisation, and experience in M&E for BCC and/or in general.
Explain that this session will discuss their expectations for the workshop, the workshop
objectives, ground rules, agenda, and training methodology.
Session 1.4: Expectations 25 minutes
Ask the group to form small groups of three participants each to discuss the three questions
on the slide.
Hand out a piece of flipchart paper and markers for each small group. Allow five minutes
for each group to write its lists.
Allow 15 minutes for each group to present its lists and to respond to any questions or
concerns.
Session 1.5: Objectives 2 minutes
Read off the list of workshop objectives and make comparisons or connections to
participant expectations, hopes, and worries about the workshop.
Session 1.6: Agenda and Methodology 4 minutes
Explain that the training will consist of three different types of activities, including
‒ Sessions—These will be where we go through the materials included in the booklet and
have discussions about the content. We’ll do a lot of discussing and sharing of
experiences during this time.
‒ Tea breaks and lunch—Each day we’ll have a lunch break and a morning and afternoon
tea break.
‒ Energisers—These are fun little activities to get your energy up and ready for learning.
Explain that the sessions are where we will concentrate on content. Each of these sessions
will be broken up into the following:
‒ Lectures—This is where we as facilitators get to present content to you and ask
questions to get you thinking.
7 Facilitator’s Guide
‒ Group discussions and participatory exercises—This is when participants will really get
to share their experience and knowledge, and practise applying the content in the
lectures. Some exercises will involve using a scenario of an HIV/AIDS campaign to work
through developing portions of an M&E plan.
‒ Daily reporting—Each morning, a team will give an overview of the previous day’s
highlights.
Explain that each participant will also complete pre- and post-tests to see how his or her
thinking about M&E for BCC campaigns may have changed as a result of the workshop.
Explain that participants will also complete daily evaluations to provide feedback that will
help the team address any concerns or requests for the subsequent training days.
Session 1.7: Ground Rules 15 minutes
Explain that establishing ground rules together will help make sure the training goes
smoothly.
Ask participants:
‒ What ground rules would you like to have for this training session?
‒ What do you need to ensure a healthy learning environment?
Write the participant responses on a flipchart.
Consider adding the following rules, if not mentioned by the participants or if the
participants have trouble thinking of some rules:
‒ Don’t have side conversations during the sessions. Not only will we miss out on the
wonderful things you have to say, but side conversations make it difficult for others to
hear.
‒ Be respectful of others’ opinions and experience. Your experience or opinions may be
different, but that can be discussed respectfully.
‒ Try to stick to the times set in the agenda.
‒ Start on time.
‒ Participate.
‒ Turn off all mobile phones.
Session 1.8: Icebreaker 15 minutes
Explain that before moving onto the next session, the group will do an icebreaker to get to
know each other a little better.
Give everyone half a piece of flipchart paper and a marker.
Ask participants to take five minutes to draw a picture that conveys who they are without
writing any words or numbers.
8 Facilitator’s Guide
Collect the pictures and show them to the group one at a time. Have participants try to
guess who drew each picture.
Pre-Test and Tea Break
Session 2: What Is Monitoring? 60 minutes
Session Objectives Define monitoring
Explain what monitoring can measure
Explain what monitoring cannot measure
Discuss when monitoring takes place
Methods Lecture
Group discussion
Scenario exercise
Materials Flipchart
Markers
Session 2.1: Title Slide 1 minute
Explain that this session is about discussing the concept of monitoring for BCC campaigns.
Mention that some of these concepts might be familiar to some participants, but new to
other participants.
Session 2.2: Objectives 2 minutes
Read each of the objectives.
Ask participants:
‒ Does anyone have any questions before we begin with the session?
Session 2.3: Your Perspective 10 minutes
Ask participants:
‒ What is monitoring?
‒ What does it mean to monitor a BCC campaign?
‒ How is monitoring different for a BCC campaign than for a health services delivery
project?
9 Facilitator’s Guide
Explain that monitoring a BCC campaign can be much more complex than monitoring health
service delivery projects—and that this training will provide some guidance on how to
monitor a BCC campaign.
Session 2.4: What Is Monitoring? 1 minute
Explain that monitoring a campaign or intervention involves the collection of routine data
that measure the progress of campaign implementation. It is used to track changes in
campaign performance over time. The purpose of monitoring is to permit stakeholders to
make informed decisions about the effectiveness of campaigns and the efficient use of
resources.
Session 2.5: Monitoring 4 minutes
Explain that monitoring is a continuous, systematic process of collecting and analysing
information to determine if a campaign is being implemented according to plan and
whether it needs to be changed.
Explain that if monitoring is done well, you can use that information to refine the
campaign’s efforts and increase the chances of making measurable changes.
Explain that you want to avoid coming to the end of a campaign and then finding out that
your campaign did not work or was not implemented as planned.
Ask participants:
‒ Have you ever used the term “process evaluation”?
‒ How is it different from monitoring?
Session 2.6: Monitoring Looks at Process 3 minutes
Explain that monitoring focuses on the implementation process and that it asks the key
questions of
‒ How well has the programme been implemented?
‒ How much does implementation vary from site to site?
‒ Did the programme benefit the intended people? At what cost?
Ask participants:
‒ What does monitoring of BCC campaigns measure?
10 Facilitator’s Guide
Session 2.7: What Monitoring Measures 1 minute
Explain that monitoring measures effort and the direct outputs of campaigns—what and
how much was accomplished. It examines the campaign’s implementation and how the
activities involved are working. For example, how many people have been reached?
Session 2.8: What Monitoring Measures (continued) 3 minutes
Explain that monitoring helps you assess how well a campaign is being delivered through
tracking activities such as materials distribution or amount of media time bought or earned.
Ask participants:
‒ What does monitoring of BCC campaigns NOT measure?
Session 2.9: What Monitoring Doesn’t Measure 1 minute
Explain that in contrast to evaluation, monitoring does not capture campaign effects and is
not meaningful from an impact or causal point of view.
Explain that monitoring is good at summarising what has been done, but those numbers are
a very weak measure of the campaign’s effects. It measures effort, not impact or effect.
Session 2.10: Monitoring Tells a Story 1 minute
Explain that monitoring data can frequently help you better understand the results of your
campaign activities.
Explain that monitoring tells the story of what you have done and can help you identify
where to implement changes in the campaign.
Session 2.11: Scenario Exercise: Monitoring Brainstorm 30 minutes
Ask participants to look in their booklets for the example of an HIV/AIDS campaign plan. It
includes a summary of the campaign strategy and part of the implementation plan.
Explain that participants will use this scenario throughout the training to do some hands-on
work with the concepts presented in the training.
Explain that the first exercise will consist of the participant reading through the campaign
plan, and then the group will have a brainstorm on what they would monitor for this
campaign. Explain that the brainstorm will be the first step in thinking about what would
11 Facilitator’s Guide
need to be monitored—and that coming up with a more detailed plan of choosing
indicators and data collection methods and sources will happen later in the training.
Allow participants 20 minutes to read through the campaign plan.
Ask participants:
‒ Realising this is your first time reviewing the campaign plan, what do you think are some
factors that would be important to monitor for the multiple concurrent partnership
(MCP) component of the campaign? And for the mother-to-child transmission (MTCT)
component?
Write the participant responses on a flipchart. Summarise the responses at the end of the
brainstorm and add factors that the participants might have missed. Write those missing
factors on the flipchart.
Lunch
Energiser 1: Stranded on an Island 30 minutes
Ask participants to pretend they are stranded on an island.
Ask participants to work with their M&E team members to come up with a list of items they
would have brought with them to the island if they knew they were going to be stranded.
The number of items allowed should be less than the number of participants. For example,
a team of five members should come up with fouritems.
Allow 15 minutes for teams to come up with their list of items.
Allow 15 minutes for teams to report their list of items, and discuss any conflict they had in
agreeing on the items. Ask them how they addressed the conflict.
12 Facilitator’s Guide
Session 3: What Is Evaluation? 60 minutes
Session Objectives Define evaluation
Explain what evaluations can do
Compare and contrast outcome and impact evaluations
Explain why outcome, rather than impact, evaluations are used
for BCC
Methods Lecture
Group discussion
Scenario exercise
Materials Flipchart
Markers
Session 3.1: Title Slide 1 minute
Explain that this session is about discussing the concept of evaluation for BCC campaigns.
Mention that some of these concepts might be familiar to some participants, but new to
others.
Session 3.2: Objectives 2 minutes
Read each of the objectives.
Ask participants:
‒ Does anyone have any questions before we begin with the session?
Ask participants:
‒ How would you define evaluation?
Session 3.3: Definition 3 minutes
Explain that evaluation measures how well the campaign or programme activities have met
expected objectives.
Depending on the design campaign, planners can also measure the extent to which changes
in outcomes can be attributed to the campaign or intervention.
Ask participants:
‒ What are main types of evaluation?
13 Facilitator’s Guide
Session 3.4: Main Evaluation Types 3 minutes
Explain that BCC campaigns can use an outcome and/or impact evaluation.
Explain that outcome evaluations are used most frequently for BCC campaigns.
An outcome evaluation measures the effect of your campaign on outcomes of interest
(what you are trying to affect with your campaign or programme).
Explain that impact evaluations rarely, if ever, are used to evaluate BCC campaigns. They
measure the effect on health status (mortality or incidence rates).
Ask participants:
‒ What types of factors does an outcome evaluation measure?
Session 3.5: Outcome Evaluations 4 minutes
Explain that outcome evaluations involve measuring changes in the target population on
aspects the campaign was designed to affect.
Explain that common factors that evaluation would measure would include the target
population’s attitude and behaviour, or policy change.
Explain that outcome evaluation measures both intermediate and long term behavioural
results.
Ask participants:
‒ Does anyone have any examples of campaigns on a specific topic and what you would
want to measure for an outcome evaluation?
Session 3.6: Outcome Evaluation Example 2 minutes
Provide the example of a malaria campaign evaluation and the need to look at the change in
attitudes and knowledge around whether intermittent preventive treatment (IPT) is safe to
take during pregnancy.
Provide the example of an HIV campaign evaluation and the need to look at changes in the
proportion of people who have reduced the number of partners they have.
Session 3.7: Scenario Exercise: Outcome Evaluation Brainstorm 25 minutes
Explain to participants that this exercise will consist of them taking another look at the
campaign plan and brainstorming with the group what factors they would measure for an
outcome evaluation.
Allow five minutes for the participants to review the campaign plan again.
14 Facilitator’s Guide
Ask participants:
‒ What factors should you measure in an outcome evaluation for this HIV/AIDS campaign
for the MCP component? And for the MTCT component?
Write the participant responses on a flipchart. Summarise the responses at the end of the
brainstorm and add factors that the participants might have missed. Write those missing
factors on the flipchart.
Ask participants to think about what we just discussed about outcome and impact
evaluations and then discuss:
‒ What’s the difference between the two types of evaluation?
‒ What factors do each of the types of evaluation measure?
‒ What changes are you looking for in each evaluation?
Write responses on a flipchart. Create two columns to organise the responses—one for
outcome and one for impact.
Session 3.8: Outcome vs. Impact 5 minutes
Review the differences and compare this chart to the one created by the participants.
Session 3.9: Your Perspective 5 minutes
Ask participants:
‒ Have any of you worked on an evaluation for a BCC campaign?
‒ What are some of the factors you evaluated?
‒ Thinking of the latest BCC campaign you have worked on, what would you want to
evaluate?
‒ What type of planning or preparations did you do for your evaluation?
Session 3.10: Advance Planning Required 5 minutes
Explain that data collection at the start of a campaign (to provide a baseline) and again at
the end is frequently helpful.
Explain that advance planning is necessary to gain the baseline data you need to gather
before your campaign begins—this is unless you can find data from another source.
Explain that a control or comparison group can allow you to measure whether the changes
in outcomes can be attributed to the programme. Without advance planning, this would be
difficult to do.
15 Facilitator’s Guide
Stress that advance planning allows you to choose the best evaluation design for your
campaign.
Ask participants:
‒ What can the results of an evaluation of a BCC campaign help you to do?
Session 3.11: What Can Evaluations Do? 4 minutes
Explain that evaluations help to objectively assess the extent to which the campaign is
having or has had the desired outcomes, in what areas it is effective, and where corrections
need to be considered.
Explain that evaluations also help campaign managers meet organisational reporting and
other requirements, and convince donors that their investments have been worthwhile or
that alternative approaches should be considered.
Ask participants:
‒ When do evaluations normally happen during the life of a BCC campaign?
Session 3.12: When Does Evaluation Happen? 1 minute
Explain that evaluations usually happen at the end of a campaign or project.
Mention that, depending on the length of the campaign, funders may also want a mid-term
evaluation.
16 Facilitator’s Guide
Session 4: Foundations of an M&E Plan 45 minutes
Session Objectives Describe the functions of an M&E plan
Identify the main elements of an M&E plan
Methods Lecture
Group discussion
Materials Flipchart
Markers
Session 4.1: Title Slide 1 minute
Explain that this session will introduce the key components of an M&E plan and that the
subsequent sessions will go into more detail about each of the components.
Session 4.2: Objectives 1 minute
Read each of the objectives.
Ask participants:
‒ Does anyone have any questions before we begin with the session?
Session 4.3: The M&E Plan 4 minutes
Stress that every campaign should have an M&E plan and that it should be created during
the design phase of the campaign.
Stress that the M&E plan should be closely tied to the campaign plan, and that both M&E
staff and programme staff should be working together to make sure that the M&E plan
accurately reflects the campaign plan.
Ask participants:
‒ Why is an M&E plan helpful?
‒ What is the purpose of an M&E plan?
Session 4.4: What an M&E Plan Can Do 4 minutes
Explain that an M&E plan shows how a campaign will measure its achievements and
therefore provide accountability for campaign managers. The plan documents consensus
17 Facilitator’s Guide
on the campaign goals and objectives and provides transparency for the performance of the
campaign.
Explain that an M&E plan also guides the implementation of M&E activities in a
standardised and coordinated way and documents the campaign activities and decisions.
Ask participants:
‒ What type of information is normally included in an M&E plan?
Write the responses on a flipchart.
Session 4.5: What Information the Plan Includes 3 minutes
Review the list on this slide and compare to the participant responses to the previous
question.
Ask participants:
‒ What are the main sections of an M&E plan?
Write the responses on a flipchart.
Session 4.6: Sections of the Plan 3 minutes
Review the list on this slide and compare to the participant responses to the previous
question.
Ask participants:
‒ What type of information should be included in the introduction section?
Session 4.7: The Introduction 3 minutes
Explain that the introduction should include the purpose of the M&E plan and information
about the purpose of the campaign, the stakeholders, and the campaign context.
Ask participants:
‒ What type of information should be included in the campaign description?
Session 4.8: Campaign Description 4 minutes
Explain that the contents of this section should come from your campaign plan and should
always contain the problem statement; campaign goal and objectives; and the description
of the intervention, including timeframe, target audience, and way in which it would be
implemented.
18 Facilitator’s Guide
Explain that a conceptual framework is preferable but not necessary. The training will go
into more detail about this component and its benefit in the M&E Frameworks session.
Ask participants:
‒ How would you describe a problem statement?
Session 4.9: Campaign Description (continued) 1 minute
Explain that a problem statement identifies the specific problem to be addressed by the
campaign. It’s a summary of the specific health problem, affected populations, potential
cause of the problem, its magnitude, and impact on society or specific communities.
Session 4.10: Campaign Description (continued) 3 minutes
Read through the example problem statement and point out to the participants that this
statement incorporates all of the issues discussed in the previous slide.
Ask participants:
‒ How would you define campaign goals? And campaign objectives? What’s the
difference between the two?
Session 4.11: Campaign Description (continued) 2 minutes
Explain that campaign goal is a broad statement about the desired long-term outcome of
the programme. For example, improvement in the reproductive health of adolescents or a
reduction in unwanted pregnancies in X population would be goals.
Explain that campaign objectives are statements of desired specific and measurable
programme results. Examples of objectives would be to reduce the total fertility rate to 4.0
births by year X or to increase contraceptive prevalence over the life of the campaign.
Session 4.12: Campaign Description (continued) 3 minutes
Explain that a basic description of campaign interventions includes the length of the
campaign, areas in the country or province in which activities will be implemented, and
target audiences. It also includes some details on the intensity of the implementation—
meaning the different outreach channels, types of materials, and general frequency of the
outreach.
19 Facilitator’s Guide
Ask participants:
‒ What is a conceptual framework?
Session 4.13: Campaign Description (continued) 3 minutes
Remind participants that the training will go into much more detail on conceptual
frameworks in Session 5, but briefly explain that it is a visual model of the factors thought to
influence the problem of interest and how these factors relate to each other.
Ask participants:
o What is a logic model?
Session 4.14: Logic Model 3 minutes
Explain that a logic model inks the goals and objectives to the interventions.
Mention that the training will go into more detail on the logic model in Session 5.
Ask participants:
‒ What are the key pieces of information in a monitoring plan?
Session 4.15: Monitoring Plan 3 minutes
Explain that a monitoring plan should include
‒ Data collection plan
‒ Indicators
‒ Responsibilities
‒ Data collection tools needed
‒ Data quality assessment plan
‒ Data dissemination and use
Mention that the training will go into more detail on these pieces of information in a
number of different sessions.
Ask participants:
‒ What are the key pieces of information in an evaluation plan?
Session 4.16: Evaluation Plan 2 minutes
Explain that an evaluation plan should include
‒ Evaluation design
‒ Timing
20 Facilitator’s Guide
‒ Indicators
‒ Data collection plan
‒ Responsibilities
‒ Data quality assessment plan
Mention that the training will go into more detail on these pieces of information in a
number of different sessions.
Session 4.17: Other Considerations 2 minutes
Stress that, before you develop an M&E plan, there are several factors to consider that the
training will touch on throughout the sessions.
Explain that you need to consider your financial, human, and infrastructure resources and
determine whether you can implement and sustain your M&E activities.
Explain that you also want to consider how and when you update your M&E plan. Will it be
on an annual schedule and/or dependent on the campaign implementation activities?
Tea Break
21 Facilitator’s Guide
Session 5: M&E Frameworks 90 minutes
Session Objectives Explain the role of frameworks in an M&E plan
Distinguish between the benefits of a conceptual framework and a logic model
Create a conceptual framework
Create a logic model
Methods Lecture
Group discussion
Scenario exercise
Materials Flipchart
Markers
Session 5.1: Title Slide 1 minute
Explain that this session will review the purpose of M&E frameworks and discuss which
ones are most appropriate for BCC campaigns.
Session 5.2: Objectives 3 minutes
Read each of the objectives.
Ask participants:
‒ Does anyone have any questions before we begin with the session?
Ask participants:
‒ How would you define an M&E framework?
Session 5.3: What Are Frameworks? 2 minutes
Explain that frameworks show the components of a campaign or project and the sequence
of steps needed to achieve the desired outcomes or objectives.
Ask participants:
‒ Why are M&E frameworks important?
22 Facilitator’s Guide
Session 5.4: What Do Frameworks Do? 2 minutes
Explain that frameworks are crucial for understanding and analysing how a campaign is
supposed to work—and its goals and objectives.
Explain that frameworks define the relationships between factors key to implementation
and outline the internal and external elements that could affect its success.
Session 5.5: Your Perspective 5 minutes
Ask participants:
‒ What types of frameworks have you used?
‒ What are the advantages of using them?
‒ Which ones are best to use for BCC campaigns?
Session 5.6: Four Common Types of Frameworks 2 minutes
Explain that there is no one perfect framework and that no single framework is appropriate
for all situations, but there are two types that are used most commonly for BCC campaigns.
These include a conceptual framework and logic model.
Mention that results and logic frameworks are most commonly used in evaluations for
health delivery services but are not very useful or appropriate for BCC campaigns.
Ask participants:
‒ How would you define a conceptual framework?
Session 5.7: Conceptual Framework 2 minutes
Explain that a conceptual framework is sometimes called a “research framework.”
Explain that this framework is useful for identifying and illustrating the factors and
relationships that influence the outcome of a campaign or intervention.
Explain that this framework can either illustrate the problem itself OR the problem and how
your campaign addresses it.
Stress that this framework should include all relevant factors, but how those factors are
pictured can look very different.
23 Facilitator’s Guide
Session 5.8: Conceptual Framework: Malaria Burden 3 minutes
Explain that conceptual frameworks are typically shown as diagrams illustrating causal
linkages between the key components of a campaign and the outcomes of interest.
Explain that the boxes in light blue are contributing factors to malaria—such as the health
system. The boxes in dark blue are interventions. The boxes in red are the health impacts
of malaria. The arrows in between demonstrate the relationship between these
components.
Session 5.9: Safe Motherhood Conceptual Framework 3 minutes
Explain that this is a conceptual framework for a Safe Motherhood project. The boxes list
some of the social, knowledge, and health care system context factors that influence either
antenatal care (ANC) use or facility-based births, or both. ANC use and facility-based births
in turn affect maternal mortality.
Highlight that some of these boxes have text in green. We have included these factors in
the chart because they are an important part of the campaign context. However, these are
not factors that we will be addressing in our campaign.
Ask participants to take a look at the box in the lower right-hand corner. The first green
bullet states that “Knowledge of ANC is high.” This information tells us that because
knowledge of ANC is already high, we will not need to address that in this campaign.
Instead, we can see from these factors that we should be using our time to look at
promoting recognition of signs of labour, for example.
Session 5.10: Conceptual Framework (continued) 1 minute
Explain that by identifying the variables that factor into campaign performance and
depicting the ways that they interact, the results that can reasonably be expected from
campaign activities are outlined.
Explain that clarifying this process permits campaign designers to develop appropriate goals
and objectives.
Session 5.11: Conceptual Frameworks in M&E 1 minute
Explain that conceptual frameworks help to identify intermediate factors and are most
helpful in campaign evaluation.
Explain that these frameworks identify contextual factors and their causes and help
evaluators take appropriate factors into consideration when assessing a campaign.
24 Facilitator’s Guide
Session 5.12: Scenario Exercise: Conceptual Framework 65 minutes
Explain that for the rest of the training, participants will be working in small teams for the
exercises. Break the group into teams of about four people. Each team should be a mix of
M&E and programme staff members. Assign each team to focus on either the MCP or
MTCT component of the campaign.
Ask each team to come up with a name for themselves.
Hand out a piece of flipchart paper and markers to each M&E team.
Ask the teams to draw a conceptual framework for their component of HIV/AIDS (MCP or
MTCT) scenario. If possible, ask a programme staff member in each team to lead the
activity with the input of his or her fellow teammates.
Point out that there is a blank page in their booklets to draw their conceptual frameworks.
They can use this as a reference after the training.
Allow teams 30 minutes to draw their framework and 30 minutes for the teams to present
and the group to discuss.
End of Day One and Daily Evaluation
25 Facilitator’s Guide
DAY TWO
Reporters
Session 5: M&E Frameworks (continued) 105 minutes
Before continuing with the slides for Session 5, give a brief summary of the concepts that
were covered in the first part of Session 5.
Ask participants:
‒ How would you define a logic model?
Session 5.13: Logic Model 3 minutes
Explain that a logic model, sometimes called an “M&E framework,” provides a streamlined
linear interpretation of a project’s planned use of resources and its desired ends.
Ask participants:
‒ What are some of the essential components of a logic model?
Write the participant responses on a flipchart.
Session 5.14: Essential Components of Logic Models 4 minutes
Compare the list of components to the list that the participants came up with.
Ask participants:
‒ How would you define the health context?
‒ What are some examples for the health context?
Write the input examples on a flipchart.
Session 5.15: Logic Model: Context 3 minutes
Explain that another component frequently added to logic models is that of context.
Context refers to the underlying conditions of the campaign and may include information
about disease burden, society, economy, culture, communication, politics, and technology.
Ask participants:
‒ How would you define inputs?
‒ What are some examples of inputs?
Write the input examples on a flipchart.
26 Facilitator’s Guide
Session 5.16: Logic Model Inputs 3 minutes
Explain that inputs are the resources invested in a campaign to be dedicated or consumed.
Compare the list of input examples to the list that the participants came up with.
Ask participants:
‒ How would you define processes or activities?
‒ What are some examples of processes or activities?
Write the process/activity examples on a flipchart.
Session 5.17: Logic Model Processes 4 minutes
Explain that the processes/activities are the things that a campaign does, using inputs, to
fulfil its goals and objectives.
Compare the list of process/activity examples to the list that the participants came up with.
Ask participants:
‒ How would you define outputs?
‒ What are some examples of outputs?
Write the output examples on a flipchart.
Session 5.18: Logic Model Outputs 4 minutes
Explain that outputs are the immediate and direct products or consequences of campaign
activities.
Explain that outputs are often measured by the amount of work accomplished, time
consumed, funds spent, or people involved.
Compare the list of output examples to the list that the participants came up with.
Ask participants:
‒ How would you define outcomes?
‒ What are some examples of outcomes?
Write the outcome examples on a flipchart.
Session 5.19: Logic Model Outcomes 4 minutes
Explain that outcomes are the set of short-term, intermediate, or long-term results at the
population level that are achieved by the campaign through the execution of activities. The
degree of causal relationship is usually very difficult to determine, so outcomes are often
spoken of in terms of being related in different ways to campaign activities.
27 Facilitator’s Guide
Explain that outcomes include the multitude of benefits gained by the people, communities,
and organisations served by the campaign during or after participation.
Compare the list of outcome examples to the list that the participants came up with.
Ask participants:
‒ How would you define impacts?
‒ What are some examples of impacts?
Write the impact examples on a flipchart.
Session 5.20: Logic Model Impacts 3 minutes
Explain that impacts are the long-term effects, or end results, of the campaign.
Explain that measuring impact in this way is different than an impact evaluation, which
focuses on examining how much of an observed change in outcomes or “impact” can be
attributed to the campaign.
Compare the list of impact examples to the list that the participants came up with.
Session 5.21: Logic Model Example 2 minutes
Explain that inputs (or resources) are used in processes (or activities) that produce
immediate intermediate results (or outputs), ultimately leading to longer term or broader
results (or outcomes) and impacts.
Give the example of the input of a million bednets nationally distributed that produce a
number of nets distributed, leading to an increased percentage of households with
everyone sleeping under nets and ultimately the reduction in malaria incidence.
Session 5.22: Logic Model: Safe Motherhood 2 minutes
Walk through the logic model, reviewing each of the items under the columns.
Session 5.23: Scenario Exercise: Logic Model 65 minutes
Provide each team with a piece of flipchart paper to write out their logic models based on
the scenario.
Point out that there is a template for the logic model in their booklets. They can fill it in and
keep it as a reference for after the training.
28 Facilitator’s Guide
Allow 30 minutes for teams to draft their logic models for their components of the
campaign (MCP or MTCT).
Allow 30 minutes for all of the teams to present their logic models to the whole group.
Session 5.24: Frameworks Summary 2 minutes
Explain that using frameworks is one way to develop a clearer understanding of the goals
and objectives of a project, with an emphasis on identifying measurable objectives for both
the short-term and long-term.
Explain that frameworks help define the relationships between factors key to the
implementation and success of a project, both internal and external to the campaign
context. This design process deepens the understanding of managers, implementers, and
other partners in many practical ways, including serving as the foundation for selecting
appropriate, useful M&E indicators.
Session 5.25: Frameworks Summary (continued) 1 minute
Explain that the most important issue is to select a framework that best suits the needs of a
campaign and what the donor specifically requests.
Tea Break
29 Facilitator’s Guide
Session 6: Indicators 165 minutes
Session Objectives Define an indicator
Compare and contrast the five types of indicators
Create indicators for each of the five types
Explain the role of intermediate outcome indicators
Identify intermediate outcome indicators other than knowledge
Methods Lecture
Group discussion
Exercise
Scenario exercise
Materials Flipchart
Markers
Session 6.1: Title Slide 1 minute
Explain that this session will review the purpose of and types of indicators used in M&E for
BCC campaigns.
Session 6.2: Objectives 2 minutes
Read each of the objectives.
Ask participants:
‒ Does anyone have any questions before we begin with the session?
Ask participants:
‒ How would you define indicators?
Session 6.3: What Is an Indicator? 2 minutes
Explain that an indicator is a variable that measures one aspect of a campaign or project.
The purpose of indicators typically is to show that campaign activities are carried out as
planned or that a campaign activity has caused a change or difference in something else.
Therefore, an indicator of that change will be something that we reasonably expect to vary.
Its value will change from a given, or baseline, level at the time the campaign begins to
30 Facilitator’s Guide
another value after the campaign and its activities have had time to make their impact felt,
when the variable, or indicator, is calculated again.
Session 6.4: What Is an Indicator? (continued) 5 minutes
Explain that an indicator is a measurement. It measures the value of the change in
meaningful units for campaign management: a measurement that can be compared to past
and future units and values. A metric is the calculation or formula that the indicator is
based on. Calculation of the metric establishes the indicator’s objective value at a point in
time. Even if the factor itself is subjective, like the attitudes of a target population, the
indicator metric calculates its value objectively at a given time.
Explain that an indicator focuses on a single aspect of a campaign or project. It may be an
input, an output, or an overarching objective, but its related metric will be narrowly defined
in a way that captures that aspect as precisely as possible.
Explain that a full, complete, and appropriate set of indicators for a given project or
campaign in a given context, with given goals and objectives, will include at least one
indicator for each significant aspect of campaign activities. This translates into at least one
indicator for each element within the campaign’s M&E framework.
Ask participants:
‒ Who can name the types of indicators? What are they?
Write participant responses on a flipchart.
Session 6.5: Five Types of Indicators 3 minutes
Compare the list on this slide to the participant responses to the previous question.
Ask participants:
‒ What is the relationship between these indicators?
Session 6.6: Indicator Chain 3 minutes
Explain that each of the indicators feeds into each other and walk through the chain using
the ANC example.
Mention that the group will now discuss input indicators in greater depth.
Ask participants:
‒ How would you define an input indicator?
31 Facilitator’s Guide
Session 6.7: Input Indicators 3 minutes
Explain that input indicators report the amount of resources (human, financial, and
material) that have been used to develop and implement a campaign. Information on these
indicators usually comes from accounting and campaign management records. This allows
managers to monitor whether they are staying on budget as well as to assess the cost-
effectiveness of the project or campaign. If someone wants to replicate what they have
done with the campaign, he or she will be able to look at the inputs to see how much a
similar campaign may cost.
Ask participants:
‒ What are some examples of input indicators for a BCC campaign?
Write the participant responses on a flipchart.
Session 6.8: Examples of Input Indicators 2 minutes
Review the examples and compare them to the participant responses to the previous
question.
Session 6.9: Indicator Chain (continued) 2 minutes
Explain that you will now go into greater depth about process indicators.
Point out again that input indicators feed into process, and process feeds into output, as
shown in the ANC example.
Ask participants:
‒ How would you define process indicators?
‒ What are some examples of process indicators?
Write the participant responses on a flipchart.
Session 6.10: Process Indicators 2 minutes
Explain that process indicators show your campaign activities.
Review the examples and compare them to the participant responses to the previous
question.
32 Facilitator’s Guide
Session 6.11: Process Indicators (continued) 2 minutes
Explain that process indicators also demonstrate the quality of activities. One way to assess
quality is to look at how the campaign was designed.
Explain that process indicators help answer questions such as
‒ Was the plan reviewed by a technical working group?
‒ Were materials pilot tested?
‒ Did the campaign include formative research?
‒ Were the campaigns pilot tested before becoming finalised?
Session 6.12: Indicator Chain (continued) 2 minutes
Explain that you will now go into greater depth about output indicators.
Point out again that process indicators feed into output, and output feeds into outcome, as
shown in the ANC example.
Ask participants:
‒ How would you define output indicators?
‒ What are some examples of output indicators?
Write the participant responses on a flipchart.
Session 6.13: Output Indicators 2 minutes
Explain that output indicators show the results of your activities or process indicators.
Review the examples and compare them to the participant responses to the previous
question.
Session 6.14: Output Indicators (continued) 1 minute
Explain that output indicators also include reach of and exposure to the campaign. Go over
each of the examples.
Session 6.15: Output Indicators vs. Process Indicators 1 minute
Explain that process indicators show activities themselves, while output indicators show the
outputs of those activities.
Explain that process indicators track whether you are doing the activities you said you were
going to do, while outputs are the result of what you have done.
33 Facilitator’s Guide
Session 6.16: Scenario Exercise: Input, Process, and Output Indicators 40 minutes
Ask each team to spend 20 minutes identifying two each of the input, process, and output
indicators for one national and one community-level activity from their assigned
component (MCP or MTCT) of the HIV/AIDS campaign.
Hand out two pieces of flipchart paper to each team—one for the national activity and one
for the community-level activity. Tell participants to organise their indicators similar to the
indicator chain example and to leave room for the outcome and impact indicators that they
will fill in later.
Let participants know that their booklets also include two indicator chain templates where
they can also write their indicators, and they can refer back to them after the training.
Allow 20 minutes for the teams to present their indicators and for the group discussion.
Lunch
Energiser 2: How Much Paper? 15 minutes
Pass around to the group a roll of toilet paper and ask each participant to take as much as
they wish.
Tell the group, when they’re done, that they will go around the room and each person must
tell a fun fact or something about themselves for each square of toilet paper they took.
Session 6: Indicators (continued) 75 minutes
Session 6.17: Indicator Chain (continued) 2 minutes
Explain that you will now go into greater depth about outcome indicators.
Point out again that output indicators feed into outcome, and outcome feeds into impact,
as shown in the ANC example.
Ask participants:
‒ How would you define outcome indicators?
Session 6.18: Outcome Indicator 3 minutes
Explain that outcome indicators measure short-term and behavioural factors of a project or
campaign. Outcome indicators answer questions like:
‒ What do you want people to do as a result of your campaign?
‒ How would you like behaviours, attitudes, or knowledge to change?
34 Facilitator’s Guide
Ask participants:
‒ What are some examples of outcome indicators for a BCC campaign?
Session 6.19: Outcome Indicator Examples 3 minutes
Review the examples and compare them to the participant responses to the previous
question.
Remind the participants that whenever using proportions (such as a percentage) as
indicators, you must define both your numerator and denominator.
Ask participants:
‒ How would you define intermediate indicators?
‒ What are some examples of intermediate indicators?
Write the participant responses on a flipchart.
Session 6.20: Intermediate Outcome Indicators 2 minutes
Explain that outcome indicators also include what are known as intermediate or short-term
indicators. You may have other terms for them. While in the end your goal may be to
increase the number of people using condoms, your campaign might not be long enough to
move people that far along. So, another way to measure what your campaign has
accomplished is to look at these intermediate or short-term factors. Intermediate
indicators measure things that frequently need to change before the behaviour itself
changes.
Session 6.21: Identifying Intermediate Indicators 2 minutes
Explain that intermediate indicators should be identified in the initial communications plan.
It’s very important for the M&E staff and the programme staff to work together on
designing the intermediate indicators, as the indicators should be based on the objectives
and design of the campaign. You want to plan for things that can be measured and to
measure things that have been planned.
Highlight that, unfortunately, not everything is always in the communications plan. Or
maybe you need to explain some of these intermediate factors to a funder. It’s important
for you to understand intermediate factors in case one of these situations comes up.
35 Facilitator’s Guide
Session 6.22: Finding the Right Intermediate Indicators 3 minutes
Remind participants that intermediate indicators measure short-term factors that are either
necessary or helpful on the way to the desired behaviour. To understand how they fit into
project objectives and indicators, it can be helpful to ask yourself
‒ What attitudes need to change?
‒ Which skills need to be learned?
‒ Which behaviours must change before the target audience will be able to adopt the final
desired behaviour?
Ask participants:
‒ What are some common intermediate indicators?
Write the participant responses on a flipchart.
Session 6.23: Common Intermediate Factors 2 minutes
Review the examples and compare them to the participant responses to the previous
question.
Session 6.24: Knowledge 2 minutes
Explain that knowledge is one of the most frequently used intermediate indicators. It
measures whether people know certain information.
Go through each of the examples.
Session 6.25: Beyond Knowledge 2 minutes
Explain that, although intermediate indicators do include knowledge, it is important to go
beyond knowledge both when creating campaign objectives and when attempting to
document what your campaign has accomplished. There are a couple of reasons for this—
the first is that knowledge alone does not necessarily change behaviour. The second is that
it is entirely possible that your campaigns will be working in intervention areas where
knowledge is already quite high. In that case, you should be aiming for and measuring
change in other factors.
Ask participants:
‒ Beyond knowledge, what are some important intermediate factors for a BCC campaign?
Write the participant responses on a flipchart.
36 Facilitator’s Guide
Session 6.26: Saliency 1 minute
Point out whether this indicator was or wasn’t part of the participant responses to the
question on slide 6.25.
Explain that saliency refers to how important an issue is to an audience. It is possible that
for some topics there is high awareness of an issue (knowledge is high), but the topic may
not seem important to them, or people may not feel personally at risk.
Session 6.27: Skills 1 minute
Point out whether this indicator was or wasn’t part of the participant responses to the
question on slide 6.25.
Explain that skills refer to whether a person has the skills and abilities necessary to perform
the desired behaviour in different circumstances.
Explain that it may take some skill to perform a certain behaviour (such as wearing a
condom, negotiating condom use, or breastfeeding a baby). If a person does not think that
he or she could do it, that person most likely will not do it.
Session 6.28: Self-Efficacy 1 minute
Point out whether this indicator was or wasn’t part of the participant responses to the
question on slide 6.25.
Explain that self-efficacy measures how strongly a person believes he or she could do a
certain behaviour, such as a young adult feeling confident that he or she can talk about HIV
testing with a current partner.
Explain that, if a person does not think that he or she could do it, that person most likely will
not do it.
Session 6.29: Perceived Social Norms 1 minute
Point out whether this indicator was or wasn’t part of the participant responses to the
question on slide 6.25.
Explain that perceived social norms are the standards of acceptable attitudes and
behaviours among a person’s peer group or among those people important to that person.
For example, who would approve (or disapprove) if I do X? Do others think it’s a good or
bad thing if I do this?
37 Facilitator’s Guide
Session 6.30: Behavioural Intent 5 minutes
Point out whether this indicator was or wasn’t part of the participant responses to the
question on slide 6.25.
Explain that behavioural intent is a measure of the likelihood that a person will engage in a
specific behaviour. There is a strong predictive relationship between people’s intentions to
perform a behaviour and whether they actually perform it.
Ask participants:
‒ What are some examples of these types of intermediate indicators:
Knowledge?
Saliency?
Self-efficacy?
Skills?
Perceived social norms?
Behavioural intent?
Write the responses on a flipchart. Use three different sheets of flipchart paper and create
two columns on each sheet to organise the responses. For example, one sheet would have
a column for knowledge and another column for saliency.
Session 6.31: Intermediate Indicator Examples 1 minute
Review the examples and compare them to the participant responses to the previous
question.
Session 6.32: Intermediate Indicator Examples (continued) 1 minute
Review the examples and compare them to the participant responses to the previous
question.
Session 6.33: Exercise: Intermediate Indicators 3 minutes
Explain that for this exercise, participants will have three minutes to work by themselves—
not with their teams—to determine which type of indicator each example is (i.e.,
knowledge, saliency, self-efficacy, skills, perceived social norms, or behavioural intent).
38 Facilitator’s Guide
Session 6.34: Exercise: Intermediate Indicators (continued) 13 minutes
Give participants another three minutes to work by themselves, not with their teams, to
determine which type of indicator each example is (i.e., knowledge, saliency, self-efficacy,
skills, perceived social norms, or behavioural intent).
Allow 10 minutes to go over the answers from this slide and the previous one. Ask
participants to raise their hands to say the type of indicator they think each example is. For
each example, ask participants:
‒ Is this one knowledge?
‒ Saliency?
‒ Skills?
‒ Self-efficacy?
‒ Social norm?
‒ Behavioural intent?
After you go through each of the questions for an example, tell the group what type of
indicator the example is. Do NOT wait until you go through all of the examples to provide
the answers for each.
Session 6.35: Long-Term Outcome Indicators 1 minute
Explain that long-term indicators are sometimes called behavioural indicators. They
measure what proportion of the population is doing a certain behaviour.
Mention that some examples include the percentage of pregnant women receiving a full
course of IPTp) and the percentage of men reporting only one sexual partner in the past
month.
Session 6.36: Short or Long Term? 2 minutes
Explain that BCC project objectives (and therefore BCC outcome indicators) should include
both the intermediate and long-term outcomes because the intermediate ones are usually
affected first.
Explain that, if you can show changes in short-term objectives, you have evidence of some
impact, even if your long-term indicators do not yet show change.
Session 6.37: Indicator Chain (continued) 2 minutes
Explain that you will now go into greater depth about outcome indicators.
Point out again that outcome indicators feed into impact, as shown in the ANC example.
39 Facilitator’s Guide
Ask participants:
‒ How would you define impact indicators?
Write the participant responses on a flipchart.
Session 6.38: Impact Indicators 1 minute
Explain that impact indicators are related to impact on actual health status, such as HIV
prevalence or maternal mortality. Most projects and campaigns do not usually measure
this, since this type of evaluation requires special studies with wide coverage and large
budgets. Because of this, outcome measures are used as proxies for impact. If, however,
your campaign is timed to be able to take advantage of a large-scale study such as a
Demographic and Health Survey (DHS), that data can certainly be used.
Session 6.39: Outcome vs. Impact 1 minute
Go over each of the differences.
Session 6.40: Common Indicator Metrics 2 minutes
Explain that there are three categories of common indicator metrics.
Explain that counts are simple numbers, such as the number of providers trained or
insecticide-treated nets (ITNs) distributed.
Explain that calculations included percentages, rates, and ratios, such as the percentage of
facilities with trained providers or the mortality rate for children under five years of age .
Explain that the last category is used less frequently in BCC and includes index and
composite measures, such as the wealth index.
Session 6.41: How To Construct an Indicator (Percentages) 1 minute
Explain that it is important to clearly define how you will construct an indicator using
percentages. For percentages, you must ALWAYS specify a numerator and a denominator.
Explain that in this example, the numerator is the number of people reporting during a
survey that they have heard of the campaign, and the denominator is the total number of
people surveyed. By dividing the numerator by the denominator, we are able to calculate
the percentage of the audience who recalls hearing or seeing a specific campaign.
40 Facilitator’s Guide
Session 6.42: Scenario Exercise: Outcome and Impact Indicators 40 minutes
Ask each team to spend 20 minutes identifying the outcome and impact indicators for the
same national and community-level activities in their assigned component (MCP or MTCT)
of the HIV/AIDS campaign that they used for the last scenario exercise.
Encourage participants to identify intermediate indicators that address the other issues
beyond knowledge.
Remind participants that their booklets also include a handout on which they can write their
indicators, as a reference to use after the training.
Allow 20 minutes for the teams to present their indicators and for the group discussion.
Session 6.43: What Type of Indicator Is This? 3 minutes
Ask participants to raise their hands to say the type of indicator they think each example is.
For each example, ask participants:
‒ Input?
‒ Process?
‒ Output?
‒ Intermediate outcome?
‒ Behavioural outcome?
‒ Impact?
After you go through each of the questions for an example, tell the group what type of
indicator the example is. Do NOT wait until you go through all of the examples to provide
the answers for each.
Session 6.44: What Type of Indicator Is This? (continued) 3 minutes
Follow the same instructions as in the previous slide.
Tea Break
41 Facilitator’s Guide
Session 7: Data Sources and Collection 106 minutes
Session Objectives Identify potential methods and data collection tools for monitoring
BCC campaigns
Identify existing data sources for evaluating BCC campaigns
Create a data collection plan
Methods Lecture
Group discussion
Exercise
Scenario exercise
Materials Flipchart
Markers
Session 7.1: Title Slide 1 minute
Explain that this session will address data sources and collection for M&E of BCC campaigns.
Session 7.2: Objectives 1 minute
Read each of the objectives.
Ask participants:
‒ Does anyone have any questions before we begin with the session?
Session 7.3: Data Collection 2 minutes
Explain that data collection is the process of gathering data that are generated from the
various activities implemented by an organisation and relevant to an organisation’s M&E
framework.
Explain that you collect data from the original source and insert them into other tools to be
analysed.
Explain that data for BCC campaigns are commonly collected using questionnaires,
interviews, observation, and existing records.
42 Facilitator’s Guide
Session 7.4: Planning for Data 1 minute
Stress that planning for data collection and the sources needs to happen at the beginning of
a campaign. Any necessary budgets or tracking forms should be included in the M&E plan.
Session 7.5: Your Perspective 3 minutes
Ask participants:
‒ Where does data for M&E come from?
‒ For monitoring?
‒ For evaluation?
‒ For both?
Session 7.6: Routine Tracking for Monitoring 2 minutes
Explain that it is important to agree with campaign implementers from the beginning on
which implementation output indicators will be collected and tracked routinely and by
whom. Accordingly, tools for collecting and recording the information will need to be
developed. Updates on the indicators should be provided in frequent progress reports
(usually monthly) and can be stored in a tracking database and analysed. Descriptive
qualitative information about the implementation of the campaign, including reasons why it
may not have occurred as intended, should also be included in the reports.
Session 7.7: Activities Drive the Method 3 minutes
Explain that the type of activities you are implementing in your campaign will dictate how
you will collect your M&E data.
Explain that, when using mass media like radio or TV, you have a couple of different options
for collection methods and sources.
Explain that, for implementation data, such as the frequency in which an advertisement is
aired, you can either use a media monitoring company or a monitoring calendar that is
completed by community or project staff.
Explain that, to determine how many people have been reached or exposed to a mass
media product, you can use a media monitoring company. To determine just the number of
people exposed to the product, you can use a rapid household survey.
43 Facilitator’s Guide
Session 7.8: Monitoring Calendars 2 minutes
Explain that output indicators can be used to estimate the percentage of spots or drama
episodes that were implemented according to plan. To collect this information, a media
monitoring company could be contracted to track the broadcasts; however, this option may
be too expensive. An alternative approach is to engage members of the community to
monitor the broadcasts by providing them with a simple tool, such as a monitoring
calendar, to record the days and times when the programme is aired. It may be more
feasible to conduct random spot checks of the broadcasts.
Session 7.9: Media Monitoring Company 2 minutes
Explain that a professional media monitoring company monitors when campaign
productions are broadcast. These companies are ideal for programmes or public service
announcements (PSAs) that are on the air irregularly or on multiple channels.
Mention that these companies provide consistent quality of data and are normally reliable.
BUT they can be costly, especially when the programme or PSA occurs multiple times.
Ask participants:
‒ How have your experiences been with media monitoring companies? Do you agree with
these points?
Session 7.10: Community Monitoring 2 minutes
Explain that you can also ask community members to tune into broadcasts and mark on
their calendars when they heard the programme. This is ideal for programmes that
broadcast on a regular basis and are on a couple of channels.
Mention that this method increases community involvement BUT can be unreliable and
requires training and collection of the records.
Ask participants:
‒ How have your experiences been with community monitoring? Do you agree with these
points?
Session 7.11: Sample Monitoring Calendar 1 minute
Point out that this is an example of a radio monitoring calendar. It provides community
members with some directions at the bottom and the side but, again, they will need to be
trained on how to use this.
44 Facilitator’s Guide
Session 7.12: Activities Drive the Method (continued) 1 minute
Explain that, when using printed materials in your campaign, you can use a tracking sheet
for bills and records to monitor how much you’ve printed and distributed.
Explain that rapid household and facility-based surveys will provide reach and exposure
data.
Session 7.13: Activities Drive the Method (continued) 1 minute
Explain that, for outreach activities, you can use several methods for collecting data on
interpersonal activities, including tracking forms, exit interviews, and observations.
Explain that data on community events could be collected using tracking forms, sign-up
sheets, and a rapid household survey.
Session 7.14: Observations 1 minute
Explain that conducting observations during random visits or spot checks to the field can
verify that the activities are indeed being implemented as intended. A simple observation
checklist can be used to guide the visits and obtain the required information related to
implementation. The frequency and location of the visits will be determined based on each
particular campaign.
Session 7.15: Sample Observation Checklist 1 minute
Explain that this example shows common observation questions for community events,
including audience engagement and size.
Session 7.16: Observation Guide Exercise 30 minutes
Hand a piece of flipchart paper and markers to each M&E team.
Ask participants to pretend their project has decided to create an observation guide for a
nutrition campaign. They need to answer and write their responses to the following
questions:
‒ What will be on their guide?
‒ Who will use it?
‒ What will they do with the information?
45 Facilitator’s Guide
Allow participants to work on this exercise for 15 minutes.
Allow 15 minutes for each of the teams to present its answers and for the group to discuss
them.
Session 7.17: Things To Consider 3 minutes
Explain that, when planning for your data collection, you need to consider several factors,
including
‒ Cost of data collection methods and your M&E budget.
‒ Likely reliability of methods.
‒ Likely availability of certain methods. For example, would the community be available to
monitor your campaign activities during a specific time period?
‒ Breadth or how detailed the information is that you are looking for.
‒ Time that you and the campaign team will have and need to dedicate in coordinating
these collection methods.
Ask participants:
‒ What data sources could be used in the evaluation of a BCC campaign?
Session 7.18: Data Sources for Evaluation 1 minute
Explain that secondary data sources could be used, including existing large surveys such as
the DHS and Health Management Information System or other routine outcome databases.
Explain that primary data collection would depend on the evaluation design, but some
might include a representative household survey, facility-based survey, or qualitative
research.
Session 7.19: Data Quality 2 minutes
Mention that there won’t be enough time in the training to review the methods for
ensuring quality data, but that we’ll provide some key factors for data quality.
Explain that you want your data management system to reflect the real world. You should
think of data as the lens through which you see the real world. Stress that bad quality data
distorts the view, while good quality data gives a sharp, focused picture of reality/what’s
actually happening.
Stress that accountability of the collection of accurate data is very important to funders and
should be taken seriously.
46 Facilitator’s Guide
Session 7.20: Dimensions of Data Quality 5 minutes
Explain that there are three key data quality questions:
‒ Where do the numbers come from? (validity);
‒ What measurements were used? (reliability—comparability across sites); and
‒ What are we trying to measure (What is in the real world?)? (reliability—compare across
time).
Explain that other factors include
‒ Completeness—that everything that needs to be captured is captured;
‒ Precision—that is, do we need to know how old you are in number of years, months,
weeks, days, hours, minutes, seconds, etc.?;
‒ Timeliness—that data are up-to-date and are available on time; and
‒ Integrity—that we are not changing our data to fit a hypothesis.
Mention that a list of resources, including materials on data quality, is in their booklets for
their reference after the training.
Session 7.21: Scenario Exercise: Data Collection Plan 40 minutes
Ask each team to outline a data collection plan for the team’s activities for the MCP or
MTCT components of their HIV/AIDS campaign. Ask the teams to select half of their
members to work on national-level activities and the other half to work on activities at the
community level.
Hand two pieces of flipchart paper to each team—one for national and one for community-
level activities.
Tell participants that they can use the chart in their booklet to record their plans, as a
reference they can review after the training.
Allow 20 minutes for the teams to outline their plans.
Allow 20 minutes for the teams to report their plans to the group.
End of Day Two and Daily Evaluation
47 Facilitator’s Guide
DAY THREE
Reporters
Session 8: Evaluation Design 60 minutes
Session Objectives Discuss the three main categories of evaluation design
Identify three types of quasi-experimental designs
Select an appropriate evaluation design for a BCC campaign
Name three approaches to analysis that can be used in BCC
campaign evaluations
Methods Lecture
Group discussion
Scenario exercise
Materials Flipchart
Markers
Session 8.1: Title Slide 1 minute
Explain that the session will provide a basic review of the different types of evaluations for
BCC campaigns.
Session 8.2: Objectives 1 minute
Read each of the objectives.
Ask participants:
‒ Does anyone have any questions before we begin with the session?
Session 8.3: Your Perspective 3 minutes
Ask participants:
‒ How is the evaluation of BCC campaigns different from the evaluation of health delivery
services?
‒ What are some challenges you have come across with trying to evaluate the impact of a
BCC campaign?
48 Facilitator’s Guide
Session 8.4: Evaluation of BCC Campaigns 1 minute
Explain that the evaluation of BCC campaigns is notably different than evaluations of other
types of health programming. Sometimes this is because what you are monitoring and
evaluating is not as clear-cut as it can be with other interventions. Unfortunately, it’s not
always as easy as counting how many shots have been given …. although it can include that,
too!
Session 8.5: Challenges To Evaluating BCC 5 minutes
Explain that broadcast media is often used and implemented at the national level, making it
difficult to have a comparison group that has not been exposed to the campaign. Even
when a campaign is not implemented at a national level, finding an adequate comparison
group (similar to the intervention group except for exposure to the programme) is difficult.
Explain that multiple campaigns are implemented at the same time and often work
together to bring about change. It is, therefore, difficult to attribute change to a specific
programme.
Explain that it also can be difficult to measure exposure to a campaign and, therefore,
determine who was and who was not exposed. You need to have a specific set of questions
about the intervention to adequately measure exposure. Asking audience members if they
heard a specific campaign is not enough; exposure can be examined through, for example,
spontaneous recall of the programme, spontaneous knowledge of the campaign’s
messages, and spontaneous knowledge of the characters and specific events/characteristics
of programme.
Explain that a campaign needs to be implemented consistently for a long period of time—at
least 9–12 months—for changes to take place. Changes in intermediate outcomes (such as
knowledge, attitudes, and intentions) may occur more quickly, but changes in behaviour
may take longer (sometimes as long as two years of consistent campaign implementation).
Session 8.6: Evaluation Designs 2 minutes
Explain that evaluations are either experimental, quasi-experimental, or nonexperimental.
Ask participants:
‒ What is an experimental design?
49 Facilitator’s Guide
Session 8.7: Experimental Designs 3 minutes
Explain that experimental designs draw definitive conclusions about the effect of a
campaign, and they require random assignment of individuals to treatment and control
groups. It can be difficult to create a control group of individuals who have not been
reached in some way by the campaign—and, therefore, control groups are almost never
used in evaluating BCC campaigns.
Ask participants:
‒ What is a quasi-experimental design?
Session 8.8: Quasi-Experimental Designs 3 minutes
Explain that, compared to experimental design, quasi-experimental designs don’t require
random assignment but do require a comparison group. It can be difficult to draw
conclusions as to whether outcomes are the result of the campaign or would have occurred
without it.
Ask participants:
‒ How does a comparison group work?
‒ What questions does it answer?
‒ How challenging is it?
Session 8.9: Use of a Comparison Group 7 minutes
Explain that one way to more clearly show that changes are a result of a campaign is to have
a comparison to an outside group that has not been exposed to the intervention. Data are
collected from both the intervention communities and outside groups at different points in
time and later are analysed to examine differences between the two groups over time.
With this design, we can see if the programme contributed to changes within the
intervention community but not in the comparison community.
Mention that a slightly different design is to have a comparison group from within the same
intervention community, specifically those who have not been exposed to the intervention.
Remind participants that it is difficult to have a comparison group in the evaluation of
communication programmes because mass media is often used as well as implemented at
the national level, thus making it difficult to find people who have not been exposed. Even
when a campaign is not implemented at the national level, finding an adequate comparison
group (that is similar to the intervention group except for exposure to the programme) is
difficult.
50 Facilitator’s Guide
Ask participants:
‒ What is a pre- and post-test design?
Session 8.10: Pre- and Post-Test Designs 1 minute
Explain that pre- and post-test design is the most traditional approach. In most cases, you
do a baseline and periodic follow-up data collection. It is common in programme evaluation
to collect the same data at three points in time within the communities involved in the
intervention.
Session 8.11: Pre- and Post-Test Designs (continued) 3 minutes
Explain that this design allows campaign managers to determine the changes that have
taken place in their community during the time that they have been carrying out the
campaign. If there are clear changes in the outcomes over time that a campaign aimed to
change, then there is some evidence that the campaign may have been successful.
However, this design cannot clearly show that the changes observed over time are a result
of a specific campaign. Perhaps these changes would have occurred anyway over time.
Ask participants:
‒ What is a nonexperimental design?
‒ What are some examples of these designs?
Session 8.12: Nonexperimental Designs 2 minutes
Explain that many BCC campaigns use nonexperimental designs, including a time series
analysis, qualitative methods, and post-only designs.
Ask participants:
‒ What is a time series analysis?
Session 8.13: Time Series Analysis 2 minutes
Explain that a time series analysis is similar to pre- and post-tests but uses more data points.
It involves tracking the desired result at regular intervals over a period of time.
Highlight that the best data source is routinely collected data, such as the number of visits
to a facility. The evaluator collects data and compares results for a period prior to the
intervention to those obtained after the intervention, using an appropriate time interval.
51 Facilitator’s Guide
Session 8.14: Time Series Analysis (continued) 2 minutes
Explain that a time series analysis aims to test for significant changes in a desired result
(output or outcome) that occur immediately after the intervention. Time series involves the
tracking of a desired result at regular intervals over time.
Explain that, if you have a comparison group for which you are doing a parallel analysis, this
approach can be considered quasi-experimental.
Session 8.15: Qualitative Methods 2 minutes
Explain that qualitative methods should be used to complement and strengthen the
evaluation findings. They provide the “why” and the “how” to your findings.
Ask participants:
‒ What are some common qualitative methods that could be used in the evaluation of BCC
campaigns?
Write the participant responses on a flipchart.
Session 8.16: Qualitative Methods (continued) 2 minutes
Review and compare the list on this slide to the list of participant responses.
Session 8.17: Post-Only Designs 1 minute
Explain that post-only designs are those that do not include pre-tests or baseline data
collection and that collection happens only after the campaign has been implemented.
Stress that, although these designs are considered nonexperimental, they can be very
strong when combined with advanced statistical analysis.
Session 8.18: Analytical Approaches 2 minutes
Explain that evaluation of BCC campaigns commonly use analytical approaches, including
multivariate regression models, propensity score analysis, and dose response.
Explain that these types of analyses can be used in combination with many different
evaluations designs.
Ask participants:
‒ What is a multivariate regression model?
52 Facilitator’s Guide
Session 8.19: Multivariate Regression Models 2 minutes
Explain that this approach produces odds ratios, such as the exposure to the campaign
increased the odds (made it more likely) that a person would perform the desired
behaviour.
Highlight that this approach does not give you a measure of effect or the percentage point
difference in the outcome of interest between those exposed or unexposed.
Ask participants:
‒ What is a propensity score analysis?
Session 8.20: Propensity Score Analysis 1 minute
Explain that the propensity score analysis is a statistical analysis procedure that allows mass
media campaigns to be evaluated using a one group post-test-only design, but that
approximates a randomly controlled trial by creating a statistically equivalent “control
group.”
Explain that this procedure enables one to test for a significant difference in a desired
outcome between those exposed to the campaign and those not exposed but who have
similar sociodemographic characteristics and access to media.
Session 8.21: Propensity Score Analysis (continued) 2 minutes
Explain that propensity score analysis statistically matches the unexposed group to the
exposed group so that they are equivalent on average in terms of all the observed
characteristics used to construct the scores. This matching procedure means the two
groups are comparable because if they are not matched, then any significant difference in
the outcomes between the two groups may be a result of underlying differences, such as
age or frequency of TV watching, rather than a result of the campaign. A PSA also can be
used with dose effect analysis.
Ask participants:
‒ What is a dose effect analysis?
Session 8.22: Dose Effect Analysis 2 minutes
Explain that dose effect analysis (also known as dose response) uses only a post-survey and
tests the hypothesis that the higher the level of exposure to a given campaign, the more
likely is the desired outcome, controlling for sociodemographic factors and access to media.
53 Facilitator’s Guide
The detection of a dose-response relationship between the “dose” of exposure and the
desired outcome helps strengthen the claim that the campaign impacted the outcome.
Session 8.23: Scenario Exercise: Evaluation Design 35 minutes
Ask participants to work within their times to outline what evaluation designs and analysis
methods they would use for their component (MCP or MTCT) of the HIV/AIDS campaign.
Hand out a piece of flipchart paper to each time to write down their evaluation outlines.
Point out that there is blank page in their booklets to record their evaluation outlines and
review after the training.
Allow teams 20 minutes to work on their outlines and 15 minutes for each of the teams to
report on their outlines.
Session 8.24: Summary 2 minutes
Remind participants that BCC campaign evaluations are different than health services
delivery evaluations. One main difference is that BCC evaluations use a quasi-experimental
or nonexperimental design.
Stress that advance planning is necessary to make sure that the evaluations are done
effectively, especially with the use of comparison groups.
Tea Break
54 Facilitator’s Guide
Session 9: Data Presentation 90 minutes
Session Objectives Understand different ways of summarising data
Choose the right table or graph, depending on the intended
audience
Ensure that graphics are easy to read and understand
Methods Lecture
Group discussion
Scenario exercise
Materials Flipchart
Markers
Session 9.1: Title Slide 1 minute
Explain that this session will address best practices in presenting M&E data in a way that is
easy for others to understand.
Session 9.2: Learning Objectives 1 minute
Read each of the objectives.
Ask participants:
‒ Does anyone have any questions before we begin with the session?
Session 9.3: Do You Present Yourself Like This? 2 minute
Ask participants:
‒ Would you present yourself like this?
Explain that presenting yourself like this will likely mean that others won’t take you
seriously if you are in a meeting with your colleagues or client.
Session 9.4: So Why Present Data Like This? 3 minutes
Point out that if they wouldn’t present themselves like that cartoon, then they shouldn’t
present their data like this picture.
55 Facilitator’s Guide
Ask participants:
‒ Would most people be able to understand the data if they were presented in a STATA
output?
Point out that this method of presentation is too busy and too difficult for others to
interpret.
Session 9.5: Or This? 2 minutes
Ask participants:
‒ Would you present data like this?
‒ What are some of the problems with this chart?
Possible answers might include no title, no axis labels, and the dark colours are difficult to
distinguish.
Session 9.6: Effective Presentation 3 minutes
Explain that, regardless of the communication formats you use, the information should be
presented in a clear, concise way with key findings and recommendations that are
actionable.
Ask participants:
‒ What else makes a presentation of data effective?
Write the participant responses on a flipchart.
Session 9.7: Effective Presentation (continued) 4 minutes
Review the points on the slide and compare to the participant responses from the previous
question.
Explain that your audience and format determine how much information to provide. Policy
makers may do better with direct and concise summaries of key points, whereas the
scientific community will want more detail.
Suggest that, on a PowerPoint slide, participants should try to limit text to six lines with no
more than six words per line, balance text with graphics, and make sure that there are not
too many slides.
Mention that one way to ensure that you create consistent materials is to decide on a
template for the document, presentation, graph, or other product before you produce it.
You can then give these guidelines to the different people involved in the process, and then
only have to do minor formatting at the end.
56 Facilitator’s Guide
Ask participants:
‒ What are a couple of options to summarise and present data?
Session 9.8: Summarising the Data 3 minutes
Explain that the two main ways of summarising data are by using tables and charts or
graphs.
Explain that a table is the simplest way of summarising a set of observations. A table has
rows and columns containing data that can be in the form of absolute numbers or
percentages, or both.
Explain that graphs are pictorial representations of numerical data and should be designed
so that they convey, at a single look, the general patterns of the data. Generally, the data in
a table are in the form of percentages.
Session 9.9: Tables and Graphs 1 minute
Explain that graphs are easier to read than tables, but they provide less detail than tables.
However, the loss of detail may be replaced by a better understanding of the data.
Session 9.10: Points To Remember 3 minutes
Explain that you can make a graph as self-explanatory as possible by keeping in mind the
following tips:
‒ Every table or graph should have a title or heading.
‒ The x- and y-axes of a graph should be labelled, should include value labels such as a
percentage sign, and should include a legend.
‒ Cite the source of your data and put the date when the data were collected or published.
‒ Provide the sample size or the number of people to which the graph is referring.
‒ Include a footnote if the graphic isn’t self-explanatory.
Explain that these tips will help preempt questions and explain the data. The next several
slides will show examples of these tips in action.
Ask participants:
‒ In thinking about titles for tables and graphs, what should be included in the title?
Session 9.11: Choosing a Title 1 minute
Explain that a title should most of the time express who, what, when, and where.
57 Facilitator’s Guide
Session 9.12: Tables: Frequency Distribution 2 minutes
Explain that a frequency distribution is a set of classes or categories, along with numerical
counts that correspond to each one, such as number of cases in a given year.
Ask participants:
‒ What should be added to this table to provide the reader with more information?
Point out that the reader needs to know the type of cases.
Session 9.13: Use the Right Type of Graph 5 minutes
Review this list and compare to the participant responses to the previous questions.
Explain that bar charts are used to compare data across categories.
Explain that a histogram looks similar to a bar chart but is a statistical graph that represents
the frequency of values of a quantity by vertical rectangles of varying heights and widths.
The width of the rectangles is in proportion to the class interval under consideration, and
their areas represent the relative frequency of the phenomenon in question. A histogram is
a histogram not just because the bars touch. In the bar graph, bars in a bar graph can touch
if you want them to, but they don't have to. Touching bars in a bar graph doesn’t mean
anything. In a histogram, however, the bars must touch. This is because the data elements
we are recording are numbers that are grouped and form a continuous range from left to
right. There are no gaps in the numbers along the bottom axis; every possible fish mass can
be located in one of the classes. This is what makes a histogram.
Explain that line graphs display trends over time, continuous data (e.g., cases per month).
Explain that pie charts show percentages or the contribution of each value to a total. When
there are more than four categories it is best to go to a bar chart so that it is readable.
Session 9.14: Bar Chart 3 minutes
Explain that in this bar chart we’re comparing the categories of data, which are any net or
ITN.
Ask participants:
‒ What should be added to this chart to provide the reader with more information?
Explain that it needs a title and data labels. You could also add the source of the data, but it
isn’t necessary if all of your tables and graphs are derived from the same source or dataset.
58 Facilitator’s Guide
Session 9.15: Bar Chart (continued) 1 minute
Point out that this version of the chart has been improved. It now has a title, axis labels,
data labels, and a source.
Session 9.16: Stacked Bar Chart 1 minute
Explain that a stacked bar chart is often used to compare multiple values when the values
on the chart represent durations or portions of an incomplete whole, such as the
percentage of pregnant women intending to give birth at health facilities in different
provinces.
Session 9.17: Histogram 1 minute
Explain that this is a histogram. You can see here that it shows the frequency of
observations across continuous categories or bins. In this case, the bins are years.
Session 9.18: Line Graph 1 minute
Explain that a line graph should be used to display trends over time and is particularly useful
when there are many data points. In this case, we have four data points for each
newspaper running advertisements about an immunisation campaign.
Session 9.19: Pie Chart 2 minutes
Explain that a pie chart displays the contribution of each value to a total. In this chart, the
values always add up to 100.
Ask participants:
‒ What should be added to this chart to provide the reader with more information?
‒ What should be changed about this chart to make it more readable?
Session 9.20: Pie Chart (continued) 3 minutes
Explain that a pie chart displays the contribution of each value to a total. In this case, we
used the chart to show contribution of each quarter to the entire year. For example, the
first quarter contributed the largest percentage of enrolled patients.
59 Facilitator’s Guide
Explain that, to improve the understanding of the pie chart, we’ve added a more descriptive
title and added value labels. On the previous chart, we couldn’t tell if the values were
numbers or percentages. Adding the sample size lets us know the total number of
observations.
Explain that it is also important to have charts that are attractive, easy to look at, and easy
to read. The chart on the previous page was so colourful that it was distracting; the colours
were so bright that it was hard to look at the chart, let alone read it. While these colours
are not the most interesting, they let the reader focus on the chart.
Session 9.21: Exercise: How Should You Present? 5 minutes
Draw four columns on a flipchart for each of the questions.
Go around the room and ask each participant to tell which graph should be used for which
question. Write participant responses in the appropriate columns.
Review the participant responses and compare them to the following list of answers:
‒ Line graph
‒ Bar graph
‒ Pie graph
‒ Histogram
Session 9.22: Data Presentation Summary 2 minutes
Remind participants that they should present their data in a consistent format using the
right type of graph for the right data and right audience.
Remind participants that they should also label all components of their graphs and indicate
the data source and number of cases.
Remind participants to make sure that the colours and fonts are readable and not
distracting.
Session 9.23: Scenario Exercise: Data Presentation 40 minutes
Ask participants to turn to the data presentation exercise in their booklets. Assign each
team two of the four exercises to work on.
Hand out a piece of flipchart paper and some markers.
Allow teams 20 minutes to draw their graphs and 20 minutes for the teams to present their
graphs and for the group discussion.
60 Facilitator’s Guide
Session 9.24: Source of Session Information 1 minute
Mention that this session was adapted using some information from a MEASURE DHS
training.
Lunch
Energiser 3: Toss the Ball 15 minutes
Ask everyone to stand up and form a circle.
Kick a soccer ball to a participant and ask that person to tell the group what he or she
thought was the most important thing learned in the training so far.
Ask that person to kick the ball to someone else and ask him or her to tell the group what
the most important lesson learned was.
Continue this exercise until everyone has shared his or her lessons learned.
61 Facilitator’s Guide
Session 10: Data Interpretation 45 minutes
Session Objectives Describe the difference between analysis and interpretation
Interpret information presented in sample tables and graphs
Methods Lecture
Group discussion
Scenario exercise
Materials Flipchart
Markers
Session 10.1: Title Slide 1 minute
Explain that this session will address some basic concepts for interpreting data.
Session 10.2: Objectives 2 minutes
Read each of the objectives.
Ask participants:
‒ Does anyone have any questions before we begin with the session?
Ask participants:
‒ What is the difference between analysis and interpretation?
Session 10.3: Analysis vs. Interpretation 1 minute
Explain that analysis is summarising the data and turning it into information. Interpretation
is the process of making sense of the information.
Session 10.4: Has the Programme Met Its Goal? 3 minutes
Ask participants to pretend that they are managing a malaria programme and point out that
the programme target is to have 80 percent of surveyed pregnant women say that they
intend to sleep under a net or ITN every night.
Ask participants:
‒ Have we met our goal?
‒ How can you tell?
62 Facilitator’s Guide
Discuss that the goal has not been met. Province 2 is doing the best but has only reached a
little more than half of the goal for nets.
Session 10.5: Interpreting Data 1 minute
When interpreting data, we may ask these questions:
‒ Does the indicator meet the target?
‒ What is the programmatic relevance of the finding?
‒ What are the potential reasons for the finding?
‒ What other data should be reviewed to understand the finding (triangulation)?
‒ How does it compare (e.g., trends, group differences)?
‒ Do we need to conduct further analysis?
Session 10.6: Practical 1 minute
You are conducting a campaign to increase women’s uptake of IPT during antenatal visits.
In your monitoring plan, you are also looking at women’s intentions to receive IPTp, and
their attitudes and beliefs about the treatment.
Session 10.7: Has the Campaign Met Its Goal? 3 minutes
Ask participants:
‒ Has the campaign met its goal?
‒ How can you tell?
‒ What else can see you in this graph?
Session 10.8: Intent and Beliefs 3 minutes
Ask participants to take a look at this chart, which provides some information on
behavioural intent and beliefs.
Ask participants:
‒ How do you interpret this data?
‒ What could you say about trends or relationships?
63 Facilitator’s Guide
Session 10.9: Making Recommendations 3 minutes
Ask participants:
‒ What other data or information should you consider in providing recommendations or
guidance on how well the campaign is doing in promoting the use of IPTp?
‒ What happens to the recommendations?
Session 10.10: Cycle of Data Use 2 minutes
Explain that the use of M&E data is part of a larger campaign design and implementation
cycle. Beginning with the campaign design, which informs the M&E design which informs
how you would conduct your M&E. The findings from your M&E efforts will then inform
recommendations for campaign revision, which will then bring you back to campaign design
and continuing with the cycle of data use.
Mention that if M&E results include some interesting findings that might be useful for other
campaigns or BCC initiatives they should consider trying to disseminating the results to an
academic publication or media outlets or presenting the findings at conferences.
Session 10.11: Using Data in the Campaign 2 minutes
Explain that applying M&E data to the campaign revision is a process that would begin with
presenting trends in the data and having a discussion with the team about what these
trends may mean for the campaign. The next step would be for M&E and program staff to
work to together to develop strategic plan for campaign improvement. The M&E staff
would the update the M&E plan based on the changes to the campaign and begin collecting
the data for the updated plan.
Session 10.12: Scenario Exercise: Data Interpretation 30 minutes
Ask participants to look in their booklets for the sample graphs from the HIV/AIDS campaign
and pieces of flipchart paper. Assign each of the M&E teams with two of the four graphs to
interpret, and ask them to respond to the discussion questions in the booklet.
Allow teams 15 minutes to interpret their graphs and 15 minutes for the teams to present
their graphs and for the group discussion.
64 Facilitator’s Guide
Session 10.13: Source of Session Information 1 minute
Mention that this session was adapted using some information from a MEASURE DHS
training.
Tea Break
65 Facilitator’s Guide
Session 11: Closing 60 minutes
Session Objectives Reflect on the training as a group
Thank participants for their time and active participation
Methods Lecture
Group discussion
Exercise
Materials Flipchart
Markers
Session 11.1: Title Slide 1 minute
Explain that this is the last session and that participants will reflect on the training.
Session 11.2: Report Out 25 minutes
Spend some time asking each of the teams about its experiences with the scenario exercise
and putting the training concepts into practice.
Ask the participants:
‒ What components of developing an M&E plan for the scenario was the most difficult?
Easiest?
‒ What challenges did you face as a team and on an individual level in developing your
plan?
‒ How would you handle these challenges in the real world?
‒ What important lessons did you learn from the exercises, working with your team, or in
general from the training content?
66 Facilitator’s Guide
Session 11.3: Put Your Expertise to the Test 25 minutes
Explain that this is the last exercise for the training. In it, they will review a brief campaign
plan and use what they learned in training to assess how helpful this campaign plan will be
in informing an M&E plan. Ask participants to work on their own to identify what is missing
and/or what information is unclear. Ask participants to turn to and read the malaria
campaign plan in the booklet.
Highlight again that it’s important for programme staff to know what needs to go into a
campaign plan to help create an M&E plan AND it’s important for M&E staff to be able to
easily assess campaign plans for gaps and to ask programme staff for more information.
Allow participants 10 minutes to review the campaign.
Allow 15 minutes for an open group discussion.
Session 11.4: Wrap Up, Day 3 5 minutes
Explain that we would like to get participant feedback one last time.
Ask participants:
‒ What information did you find most useful?
‒ How do you plan to use this information?
‒ What do you wish you got out of the training, but didn’t?
Hand out the daily evaluation forms and ask participants to complete the forms at the end
of the session.
Session 11.5: Thank You 5 minutes
Thank everyone for their time and participation.
Explain that you are going to award participants with a certificate of training completion for
all of their hard work.
Call each participant up to the front of the room to collect a certificate.
Write down the contact information of the facilitator(s) and tell participants that they can
contact that person with any further questions or thoughts on M&E for BCC campaigns.