Understanding electric power_systems_0471446521
231
Jack Casazza Frank Delea UNDERSTANDING ELECTRIC POWER SYSTEMS An Overview of the Technology and the Marketplace A John Wiley & Sons, Inc., Publication
-
Upload
bavantha-udugama -
Category
Engineering
-
view
289 -
download
1
Transcript of Understanding electric power_systems_0471446521

Jack CasazzaFrank Delea
UNDERSTANDINGELECTRIC POWER
SYSTEMSAn Overview of the Technology
and the Marketplace
A John Wiley & Sons, Inc., Publication


UNDERSTANDING ELECTRIC POWER
SYSTEMS

IEEE Press445 Hoes Lane
Piscataway, NJ 08854
IEEE Press Editorial BoardStamatios V. Kartalopoulos, Editor in Chief
M. Akay M. E. El-Hawary M. PadgettJ. B. Anderson R. J. Herrick W. D. ReeveR. J. Baker D. Kirk S. TewksburyJ. E. Brewer R. Leonardi G. Zobrist
M. S. Newman
Kenneth Moore, Director of IEEE Press Catherine Faduska, Senior Acquisitions Editor
Tony VenGraitis, Project Editor
Technical ReviewerBruce F. Wollenberg, University of Minnesota
Books of Related Interest from the IEEE Press
Electric Power Systems: Analysis and ControlFabio Saccomanno2003 Hardcover 728pp 0-471-23439-7
Understanding Power Quality Problems: Voltage Sags and InterruptionsMath H. J. Bollen2000 Hardcover 576pp 0-7803-4713-7
Principles of Electric Machines with Power Electronic Applications,Second EditionM. E. El-Hawary2002 Hardcover 496pp 0-471-20812-4
Analysis of Electric Machinery and Drive Systems, Second EditionPaul C. Krause, Oleg Wasynczuk, and Scott D. Sudhoff2002 Hardcover 624pp 0-471-14326-X

Jack CasazzaFrank Delea
UNDERSTANDINGELECTRIC POWER
SYSTEMSAn Overview of the Technology
and the Marketplace
A John Wiley & Sons, Inc., Publication

Copyright © 2003 by The Institute of Electrical and Electronics Engineers. All rights reserved.
Published by John Wiley & Sons, Inc., Hoboken, New Jersey.Published simultaneously in Canada.
No part of this publication may be reproduced, stored in a retrieval system, or transmitted inany form or by any means, electronic, mechanical, photocopying, recording, scanning, orotherwise, except as permitted under Section 107 or 108 of the 1976 United States CopyrightAct, without either the prior written permission of the Publisher, or authorization throughpayment of the appropriate per-copy fee to the Copyright Clearance Center, Inc., 222Rosewood Drive, Danvers, MA 01923, 978-750-8400, fax 978-750-4470, or on the web at
Permissions Department, John Wiley & Sons, Inc., 111 River Street, Hoboken, NJ 07030,(201) 748-6011, fax (201) 748-6008, e-mail: [email protected].
Limit of Liability/Disclaimer of Warranty: While the publisher and author have used their bestefforts in preparing this book, they make no representations or warranties with respect to theaccuracy or completeness of the contents of this book and specifically disclaim any impliedwarranties of merchantability or fitness for a particular purpose. No warranty may be createdor extended by sales representatives or written sales materials. The advice and strategiescontained herein may not be suitable for your situation. You should consult with a professionalwhere appropriate. Neither the publisher nor author shall be liable for any loss of profit or anyother commercial damages, including but not limited to special, incidental, consequential, orother damages.
For general information on our other products and services please contact our Customer Care Department within the U.S. at 877-762-2974, outside the U.S. at 317-572-3993 or fax 317-572-4002.
Wiley also publishes its books in a variety of electronic formats. Some content that appears inprint, however, may not be available in electronic format.
Library of Congress Cataloging-in-Publication Data is available.
ISBN 0-471-44652-1
Printed in the United States of America.
10 9 8 7 6 5 4 3 2 1
www.copyright.com. Requests to the Publisher for permission should be addressed to the

Our thanks go to many who helped with this book but particularly ourwives, Madeline and Irene, who provided support and encouragement.
Jack CasazzaFrank Delea

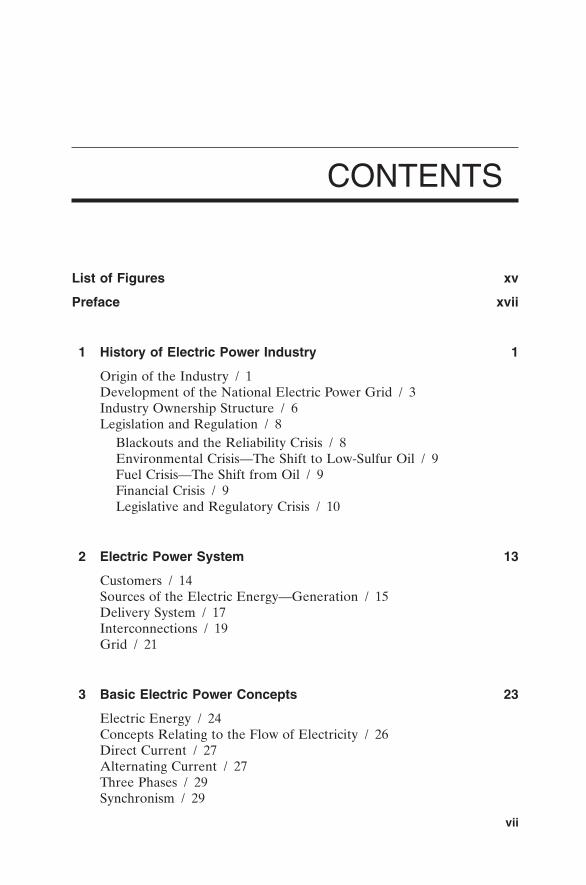
CONTENTS
List of Figures xv
Preface xvii
1 History of Electric Power Industry 1
Origin of the Industry / 1Development of the National Electric Power Grid / 3Industry Ownership Structure / 6Legislation and Regulation / 8
Blackouts and the Reliability Crisis / 8Environmental Crisis—The Shift to Low-Sulfur Oil / 9Fuel Crisis—The Shift from Oil / 9Financial Crisis / 9Legislative and Regulatory Crisis / 10
2 Electric Power System 13
Customers / 14Sources of the Electric Energy—Generation / 15Delivery System / 17Interconnections / 19Grid / 21
3 Basic Electric Power Concepts 23
Electric Energy / 24Concepts Relating to the Flow of Electricity / 26Direct Current / 27Alternating Current / 27Three Phases / 29Synchronism / 29
vii

viii CONTENTS
Characteristics of AC Systems / 29Resistance / 29Induction and Inductive Reactance / 30Inductive Reactance / 30Capacitance and Capacitive Reactance / 30Capacitive Reactance / 31Reactance / 31Impedance / 31Ohm’s Law for Alternating Current / 33
Power in Alternating Current Circuits / 33Real Power / 34Reactive Power / 34
Advantages of AC over DC Operation / 35Transformers / 36Power Flow / 37
Division of Power Flow Among Transmission Lines / 37Voltage Drop and Reactive Power Flow / 37Power Flow and Phase Angle Differences / 37
Stability / 38Results of Instability / 40
4 Electric Energy Consumption 41
End-Uses for Electricity / 41Customer Classes / 42Rate Classes / 43Demand and Energy / 44Energy / 44Effects of Load Diversity / 45System Load / 47Load Management / 48Reactive Power / 50Forecasts / 50Losses and Unaccounted-for Energy in the Delivery System / 52
5 Electric Power—Generation 55
Types of Generation / 56Steam Turbines / 56Combustion (Gas) Turbines / 57Hydro Turbines / 57Pumped Storage / 58Nuclear Units / 58Reciprocating Engines / 58

CONTENTS ix
Micro Turbines / 58Other Forms of Generation / 59
Characteristics of Generating Plants / 60Size / 62Efficiency / 64Availability / 65
Capital Cost of Generation / 66Type of Use / 66Life Extension / 67Synchronous Generators / 67Resource Procurement / 68
Fuel Measurements / 69Fuel Transportation / 70Fuel Used / 70Fuel Purchasing / 71Emission Rights / 71
6 Technology of the Electric Transmission System 73
Components / 73HVAC / 74
Overhead / 74Ratings / 74Cable / 75
Submarine Cables / 76Substations / 76
Substation Equipment / 77Substation Breaker Arrangements / 81
Transmission System Aging / 82HVDC / 82
Advantages of HVDC / 83Disadvantages of HVDC / 84
Knowledge Required of Transmission System / 84
7 Distribution 85
Primary Feeders / 86Radial Systems / 86Loop Systems / 87Primary Network Systems / 87
Distribution Transformers / 87Secondary Systems / 87Distribution Capacity / 89

x CONTENTS
Losses / 90Ratings / 90Metering / 90Control of Voltage / 91
Capacitors / 91Voltage Regulators / 92
Reliability / 92Quality of Service / 93
Design of Distribution Systems / 93Distributed Generation / 94Operation of Distribution Systems / 94
8 Functioning of the Electric Bulk Power System 97
Coordination / 97Operation / 99
Control Areas / 99Operating Reserves / 102Ancillary Services / 102Emergencies / 103Operating Emergencies / 104
Parallel Path Flow and Loop Flow / 105Power Transfer Limits / 105
Determination of Total Transfer Capability / 106Reduction of Power Transfers—Congestion Management / 107
Planning / 107Planning Standards / 108
Generation Planning / 108Least Cost Planning / 110Transmission Planning / 110
Load-Flow Studies / 112Stability Studies / 112Short-Circuit Duty Studies / 112
New Planning Environment / 113
9 Reliability 117
Costs of Power Outages / 119Ways to Measure Reliability / 120Planning and Operating a Reliable and Adequate Power System / 121
Transmission Security and Security Coordinators / 122Paying for Extra Reliability / 124Compliance / 124

CONTENTS xi
Generation / 125Transmission / 126
Transmission System Problems / 126Planning and Operating Standards / 127Voltage and Reactive Control / 128
Distribution / 129Summary / 129
10 Restructuring, Competition and Deregulation 131
Causes of Restructuring / 131Types of Restructuring / 132
Effects of Restructuring / 133Six Networks / 133Changing Customer Requirements / 135
11 Legislation and Regulation—The Regulatory Network 137
Pricing and Regulation / 137Federal Legislation / 138
Public Utility Holding Company Act of 1935 / 138Federal Power Act / 139Other Federal Laws / 140Environmental Laws / 140Department of Energy Organization Act / 141PURPA / 142Energy Policy Act (“EPACT”) of 1992 / 144
PUHCA Modifications / 144FPA Modifications / 144
Federal Regulatory Agencies / 145FERC / 145SEC / 146Environmental Protection Agency (EPA) / 146Department of Energy (DOE) / 147Federal Legislation Under Consideration / 147
State Regulatory Authority / 148Recent Federal Regulation Impacting the Electric Industry / 148
Orders 888 and 889 / 148Order 2000 / 150Tariff Basis / 151Transmission Rights / 151

xii CONTENTS
Physical Transmission Rights / 151Financial Transmission Rights / 152
Average System versus Incremental Costs / 152State Regulation / 153
Customer Choice / 153Metering / 154Distribution Rates / 154State and Local Environmental Requirements / 155
Overall Regulatory Problems / 155
12 The Business Network 157
Investment and Cost Recovery / 157Changing Industry Structure / 158
Utility Responses / 158Holding Company Formation / 158Unbundling / 159
New Structure / 160Power Producers / 160Power Plant Divestitures / 160Transmitters / 162
Development of Non-Regulated Power Market / 163Distributors / 163Marketers / 164Wheeling and Customer Choice / 164Contracts and Agreements / 165
13 ISOs, RTOs and ITPs 167
ISO Formation / 167Functions of ISOs / 168
Regional Operating Functions / 168Regional Planning Functions / 169
RTOs / 169
14 The Money Network 171
Allocation of Costs and Economic Benefits / 172Average Costs Versus Incremental Costs / 173
Market Versus Operational Control / 173Market Power Issues / 173
Price Caps / 173
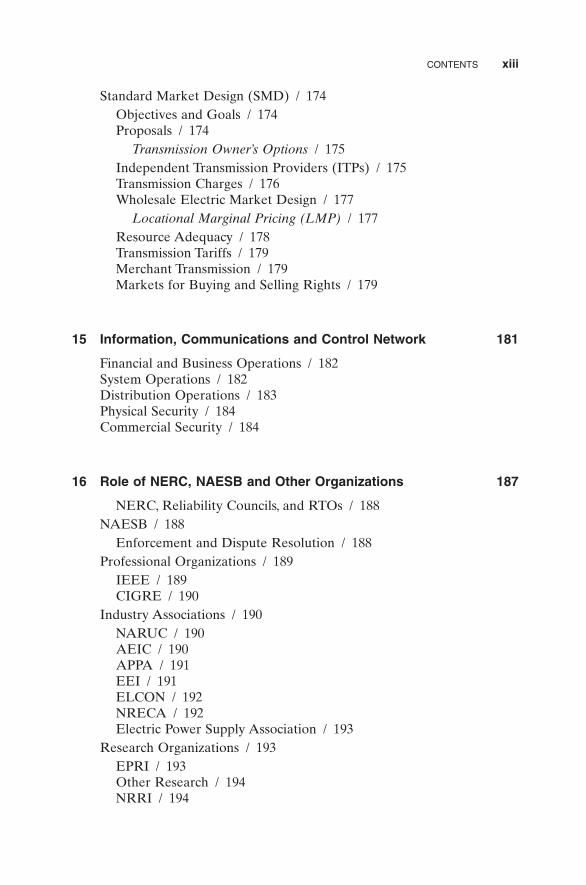
CONTENTS xiii
Standard Market Design (SMD) / 174Objectives and Goals / 174Proposals / 174
Transmission Owner’s Options / 175Independent Transmission Providers (ITPs) / 175Transmission Charges / 176Wholesale Electric Market Design / 177
Locational Marginal Pricing (LMP) / 177Resource Adequacy / 178Transmission Tariffs / 179Merchant Transmission / 179Markets for Buying and Selling Rights / 179
15 Information, Communications and Control Network 181
Financial and Business Operations / 182System Operations / 182Distribution Operations / 183Physical Security / 184Commercial Security / 184
16 Role of NERC, NAESB and Other Organizations 187
NERC, Reliability Councils, and RTOs / 188NAESB / 188
Enforcement and Dispute Resolution / 188Professional Organizations / 189
IEEE / 189CIGRE / 190
Industry Associations / 190NARUC / 190AEIC / 190APPA / 191EEI / 191ELCON / 192NRECA / 192Electric Power Supply Association / 193
Research Organizations / 193EPRI / 193Other Research / 194NRRI / 194

xiv CONTENTS
17 Where Restructuring Stands 195
Required Additional Analyses / 197Abandonment of Deregulation / 197Power Supply / 197
2002 / 197The Future / 197
Energy Trading / 198Reliability Concerns / 198
Transmission Problems / 198National Power Survey / 198Conclusions / 199
Index 201
About the Authors 211

LIST OF FIGURES
Figure 1.1 Progression of maximum generator size and highesttransmission voltage. / 4
Figure 1.2 Stages of transmission system development. / 5
Figure 1.3 The five synchronous systems of North America. / 5
Figure 1.4 Ownership profile of the U.S. electric utility industry, 2000. / 7
Figure 1.5 U.S. electric utility generating capacity. / 8
Figure 2.1 Energy sources of utility and non-utility generation, 2000. / 16
Figure 2.2 Classification of voltages in the United States. / 17
Figure 2.3 Transmission circuit miles. / 18
Figure 2.4 Conceptual sketch of an electric system. / 20
Figure 2.5 The three interconnected electric systems in the United Statesand Canada. / 21
Figure 3.1 Basic electric relationships. / 25
Figure 3.2 Sinusoidal shape of voltage or current. / 28
Figure 3.3 Current and voltage relationships for (a) a resistor, (b) aninductor and (c) a capacitor. / 32
Figure 3.4 Conceptual schematic of a simple transformer. / 36
Figure 4.1 Customer electrical consumption 2000. / 43
Figure 4.2 Daily pattern of summer weekday electricity use for New YorkState. / 45
Figure 4.3 Annual load duration curve. / 47
Figure 4.4 Possible classification of utility load management techniques. / 49
Figure 5.1 Comparison of small dispersed power production technologies. / 59
Figure 5.2 Schematic of conventional fossil steam power plant. / 61
Figure 5.3 Schematic of conventional hydro electric plant. / 61
xv

xvi LIST OF FIGURES
Figure 5.4 Generator capability curve. / 62
Figure 5.5 Typical fuel price ranges ($/MMBTU). / 69
Figure 6.1 Typical substation circuit breaker arrangements. / 81
Figure 7.1 Typical distribution transformer. / 88
Figure 7.2 Typical secondary distribution voltages in the United States. / 89
Figure 7.3 Automation of electric distribution systems. / 95
Figure 8.1 Control areas in NERC. / 100
Figure 9.1 Consumer reactions to interruptions. / 120
Figure 11.1 Major environmental laws. / 141
Figure 11.2 Status of state electric industry restructuring activity as ofFebruary 2003. / 154
Figure 12.1 Holding companies registered under PUHCA as of October 31, 2002. / 159
Figure 12.2 Fact sheet on NRC reactor license transfer. / 161
Figure 12.3 Net generation, 1991 through 2000 (Million Kilowatt-hours). / 163

PREFACE
xvii
As Joseph Swidler, former Chairman of the Federal Power Commission (pre-decessor of FERC) often stated, “There are many disagreements about thebest electric power policy for the USA, but there is no disagreement it is oftenbeing established without adequate analyses.” Government and business deci-sions on electricity supplies often fail to recognize how power systems workand the uncertainties involved. Those involved do not always mean the samething although they use identical words. Incorrect assumptions have beenmade about the operation of the electric system and continue to be madebased on the operation of telephone systems, gas systems, and other physicalsystems that are not applicable to electric power systems.
The purpose of this book is to help those in government, business, educa-tional institutions, and the general public have a better understanding of elec-tric power systems, institutions, and the electric power business. The first ninechapters focus on the technology of electric power; the last eight cover theinstitutions and business practices. Why must business practices be included in such a text? Because technical and institutional practices need to be co-ordinated to meet our needs. New technologies require new institutionalapproaches; new institutional mechanisms require new technology. Both mustbe understood.
The original text for this book was written in 1984. It was used for instruc-tional purposes in a number of courses for electrical engineers who were notpower systems engineers, for lawyers, accountants, economists, governmentofficials, and public interest groups. Since then some technological changes andmany institutional changes have occurred. With the advent of the internet,many new and valuable publications and information sources have becomeavailable and were used in its preparation. It includes ideas and informationfrom many segments of the industry and many knowledgeable people in theindustry, and is based on educational programs of the American EducationInstitute (AEI).
The book covers such subjects as electric power systems, their components(generation, transmission, distribution), electricity use, electric system opera-tion, control and planning, power system reliability, government regulation,utility rate making, and financial considerations. It describes the “six net-
xviii PREFACE
works”: (1) the physical network, (2) the fuel/energy network, (3) the moneynetwork, (4) the information, communication, and control network, (5) theregulatory network, and (6) the business network, which are interconnectedin the provision of electric power. It provides the reader with an understand-ing of the equipment involved in providing electric power, the functioning ofthe electric power system, the factors determining the reliability of service, thefactors involved in determining the costs of electric power, and many othertechnical subjects. It provides the engineer with background on the institutionsunder which power systems function. It can be used as a classroom text, aswell as a reference for consultation.While a book of this length cannot providein-depth discussions of many key factors, it is hoped it provides the broadunderstanding that is needed. Ample references are provided for those whowish to pursue important points further. The index facilitates the location ofbackground material as needed. The authors welcome comments, suggestions,additional information and corrections. They hope you, your company, and allconsumers benefit from it.
Jack [email protected]
Frank [email protected]
American Education Institutewww.ameredinst.org

1
1
ORIGIN OF THE INDUSTRY
The electric utility industry can trace its beginnings to the early 1880s. Duringthat period several companies were formed and installed water-power drivengeneration for the operation of arc lights for street lighting; the first real application for electricity in the United States. In 1882 Thomas Edison placed into operation the historic Pearl Street steam-electric plant and thepioneer direct current distribution system, by which electricity was suppliedto the business offices of downtown New York. By the end of 1882, Edison’scompany was serving 500 customers that were using more than 10,000 electriclamps.
Satisfied with the financial and technical results of the New York City oper-ation, licenses were issued by Edison to local businessmen in various com-munities to organize and operate electric lighting companies.1 By 1884 twentycompanies were scattered in communities in Massachusetts, Pennsylvania, andOhio; in 1885, 31; in 1886 48; and in 1887 62.These companies furnished energyfor lighting incandescent lamps, and all operated under Edison patents.
Two other achievements occurred in 1882: a water-wheel-driven generatorwas installed in Appleton, Wisconsin; the first transmission line was built inGermany to operate at 2400 volts direct current over a distance of 37 miles
HISTORY OF ELECTRICPOWER INDUSTRY
Understanding Electric Power Systems: An Overview of the Technology and the Marketplace, byJack Casazza and Frank DeleaISBN 0-471-44652-1 Copyright © 2003 The Institute of Electrical and Electronics Engineers
1 Homer M. Rustelbakke, 1983, Electric Utility Systems and Practices, Fourth Edition, Wiley,New York.

(59km).2 Motors were introduced and the use of incandescent lamps contin-ued to increase. By 1886, the dc systems were experiencing limitations becausethey could deliver energy only a short distance from their stations since theirvoltage could not be increased or decreased as necessary. In 1885 a commer-cially practical transformer was developed that allowed the development ofan ac system. A 4000 volt ac transmission line was installed between OregonCity and Portland, 13 miles away.A 112-mile, 12,000 volt three-phase line wentinto operation in 1891 in Germany. The first three-phase line in the UnitedStates (2300 volts and 7.5 miles) was installed in 1893 in California.3 In 1897,a 44,000-volt transmission line was built in Utah. In 1903, a 60,000-volt trans-mission line was energized in Mexico.4
In this early ac period, frequency had not been standardized. In 1891 thedesirability of a standard frequency was recognized and 60Hz (cycles persecond) was proposed. For many years 25, 50, and 60Hz were standard fre-quencies in the United States. Much of the 25Hz was railway electrificationand has been retired over the years. The City of Los Angeles Department ofWater and Power and the Southern California Edison Company both oper-ated at 50Hz, but converted to 60Hz at the time that Hoover Dam powerbecame available, with conversion completed in 1949. The Salt River Projectwas originally a 25Hz system, but most of it was converted to 60Hz by theend of 1954 and the balance by the end of 1973.5
Over the first 90 years of its existence, until about 1970, the utility industrydoubled about every ten years, a growth of about 7% per year. In the mid-1970s, due to increasing costs and serious national attention to energy con-servation, the growth in the use of electricity dropped to almost zero. Todaygrowth is forecasted at about 2% per year.
The growth in the utility industry has been related to technologicalimprovements that have permitted larger generating units and larger trans-mission facilities to be built. In 1900 the largest turbine was rated at 1.5MW.By 1930 the maximum size unit was 208MW. This remained the largest sizeduring the depression and war years. By 1958 a unit as large as 335 MW wasinstalled, and two years later in 1960, a unit of 450MW was installed. In 1963the maximum size unit was 650MW and in 1965, the first 1,000MW unit wasunder construction.
Improved manufacturing techniques, better engineering, and improvedmaterials allowed for an increase in transmission voltages in the United Statesto accompany the increases in generator size. The highest voltage operating in1900 was 60kV. In 1923 the first 220kV facilities were installed. The industrystarted the construction of facilities at 345kV in 1954, in 1964 500kV was intro-duced, and 765kV was put in operation in 1969. Larger generator stations
2 HISTORY OF ELECTRIC POWER INDUSTRY
2 Ibid.3 Ibid.4 Ibid.5 Ibid.

required higher transmission voltages; higher transmission voltages made pos-sible larger generators.
These technological improvements increased transmission and generationcapacity at decreasing unit costs, accelerating the high degree of use of elec-tricity in the United States.At the same time, the concentration of more capac-ity in single generating units, plants, and transmission lines had considerablyincreased the total investment required for such large projects, even thoughthe cost per unit of electricity had come down. Not all of the pioneering unitsat the next level of size and efficiency were successful. Sometimes modifica-tions had to be made after they were placed in operation; units had to be de-rated because the technology was not adequate to provide reliable service atthe level intended. Each of these steps involved a risk of considerable magni-tude to the utility first to install a facility of a new type or a larger size or ahigher transmission voltage. Creating the new technology required the invest-ment of considerable capital that in some cases ended up being a penalty tothe utility involved. To diversify these risks companies began to jointly ownpower plants and transmission lines so that each company would have asmaller share, and thus a smaller risk, in any one project. The sizes of genera-tors and transmission voltages evolved together as shown in Figure 1.1.6
The need for improved technology continues. New materials are beingsought in order that new facilities are more reliable and less costly. New tech-nologies are required in order to minimize land use, water use, and impact on the environment. The manufacturers of electrical equipment continue toexpend considerable sums to improve the quality and cost of their products.Unfortunately, funding for such research by electric utilities through the Electric Power Research Institute continues to decline.
DEVELOPMENT OF THE NATIONAL ELECTRIC POWER GRID7
Electric power must be produced at the instant it is used. Needed suppliescannot be produced in advance and stored for future use. At an early datethose providing electric power recognized that peak use for one system oftenoccurred at a different time from peak use in other systems. They also recog-nized that equipment failures occurred at different times in various systems.Analyses showed significant economic benefits from interconnecting systemsto provide mutual assistance. The investment required for generating capacitycould be reduced. Reliability could be improved. This lead to the develop-ment of local, then regional and subsequently three transmission grids whichcovered the United States. In addition, differences in the costs of producing
DEVELOPMENT OF THE NATIONAL ELECTRIC POWER GRID 3
6 J.A. Casazza, 1993, The Development of Electric Power Transmission—The Role Played by Tech-nology, Institutions, and People, IEEE Case Histories of Achievement in Science and Technology,Institute of Electrical and Electronic Engineers.7 Ibid.

electricity in the individual companies and regions often resulted in onecompany or geographic area producing some of the electric power sold byanother company in another area. In such cases the savings from the deliveryof this “economy energy” were usually split equally among the participants.Figure 1.2 shows the key stages of the evolution of this grid.8 Figure 1.3 showsthe five synchronous power supply areas currently existing in the United Statesand Canada.9
The development of these huge synchronous areas, in each of which all gen-eration is connected directly and indirectly by a network of transmission lines(the grid), presents some unique problems because of the special nature ofelectric power systems. Whatever any generator or transmitter in the syn-chronous region does or does not do affects all others in the synchronousregion, those close more significantly and those distant to a lesser degree. Theloss of a large generator in Chicago can affect systems in Florida, Louisiana,and North Dakota. Decisions on transmission additions can affect other
4 HISTORY OF ELECTRIC POWER INDUSTRY
Figure 1.1. Progression of maximum generator size and highest transmission voltage.
8 Ibid.9 Ibid.
1000
1100
900
800
700
600
500
400
300
200
1100
0
1200
1300
Meg
awat
ts
MaximumSize Units
MaximumTransmission
Voltages
Kilo
volts
800
750
700
650
600
550
500
450
400
350
300
250
200
150
100
50
01890 1900 1910 1920 1930 1940 1950 1960 1970 1980
Year

DEVELOPMENT OF THE NATIONAL ELECTRIC POWER GRID 5
Isolated Plant1885
Isolated System
1910
Regional
1935
Interregional
1960 1985
Figure 1.2. Stages of transmission system development.
WesternCanada Central
Canada Eastern Canada
Quebec
EasternSystem
WesternSystem
BajaMexico
Mexico
Texas
DC
DC
DC DC
Figure 1.3. The five synchronous systems of North America.
systems many hundreds of miles away. This has required the extensive co-ordination in planning and operation between participants in the past. Newprocedures will be needed in the future.
As stated by Thomas P. Hughes of the University of Pennsylvania in theSeptember, 1986 issue of CIGRE Electra:10 “Modern systems are of manykinds. There are social systems, institutional systems, technical systems, andsystems that combine components from these plus many more . . . An exampleof such a technological system . . . is an electric power system consisting not
10 Ibid.

only of power plants, transmission lines, and various loads, but also utility cor-porations, government agencies, and other institutions . . . problems cannot beneatly categorized as financial, technical, or managerial; instead they consti-tute a seamless web . . . engineering or technical improvements also requirefinancial assistance to fund these improvement(s) and managerial competenceto implement them.”
INDUSTRY OWNERSHIP STRUCTURE
At the turn of the century, the United States was dotted with approximately5,000 isolated electric plants, each servicing a small area. Entrepreneursbought these systems to form larger systems. It was easier to raise cash andsavings could be obtained by coordinating generation, transmission, and thedistribution system development over a wider region.
As shown a number of times in the electric power industry, because of itsspecial nature, practices that lead to additional economies often lead to oppor-tunities for additional abuses. The concentration of economic power in fewerand fewer organizations through highly leveraged purchases of companies ledto Congress passing the Public Utility Holding Company Act of 1935.
Over more than 100 years the ownership of generation plants, transmission,and distribution systems has evolved. As shown in Figure 1.4, generation
6 HISTORY OF ELECTRIC POWER INDUSTRY
Figure 1.4. Ownership of the U.S. electric industry, utility and non-utility, 2000.* EIA data for utility generation in 2000 indicates two values; 604,513 mW used in Figure 1.4and 602,377 mW.
Ownership Category Numberof Firms
CapacitygW
Percent of TotalIndustry Capacity
Investor OwnedIntegrated
Generate & TransmitTransmit & DistributeGenerate & Distribute
GenerateTransmit
DistributeOther
Total
14010625117346
239 415.7 51.2%Rural Electric Co-ops 912 31.8 3.9%
Public, Non-FederalMunicipal Utilities
Public Utility DistrictsIrrigation Districts
State and MutualTotal 2009 85.7 10.6%
Federally Owned 10 67.6 8.3%Other 1.6
Total Utility 602.4 74.2%Non-Utility Generators 209.2 25.8%INDUSTRY TOTAL 811.6 *

INDUSTRY OWNERSHIP STRUCTURE 7
is currently owned by investor-owned companies, rural electric cooperatives,various non-federal governments, such as municipals, states, irrigation districts,and so forth, the federal government, and non-utility companies. Transmissionsystems are similarly owned. Toward the end of the 20th century many newparticipants became involved in the electric power industry, including mer-chant plant owners and power marketers. The capacity and energy sources forgenerators currently in service are shown in Figure 1.5.
As DeTouqueville observed centuries ago, the American genius is theability to invent new organizations to meet our needs. The electric powerindustry formed trade organizations, for example, EEI, APPA, ELCON, andso forth, to lobby for various special interests; industry organizations such as NERC and reliability councils to insure reliability; EPRI and NYSERDAto do research; and professional organizations such as the IEEE, CIGRE,NARUC, and so on, to facilitate exchange of experience and new ideas amongthe professionals involved. (These are discussed in Chapter 16.)
Figure 1.5. U.S. electric utility generating capacity.‡† Plants sold or transferred to nonutilities are not included in these data.‡ Source EIA.
Fuel Type Number of Units Net SummerCapacity
mW
Average Unit SizemW
Coal 1,024 260,990 255Petroleum 3,007 41,017 14Gas 2,068 117,845 57Water – pumpedstorage
135 18,020 133
Water –conventionalhydroelectric
2,836 73,738 26
Nuclear 91 86,163 947Waste Heat 61 5,892 97Other Renewable 128 837 7Total Utility 604,502Total Non Utility 209,248
Installed at Year-End 2000†
Fuel Type Number of Units Net SummerCapacity
mW
Average Unit SizemW
CoalPetroleum 95 879 9Gas 280 40,652 145Water – pumpedstorageWater –conventionalhydroelectric
24 373 16
NuclearWaste Heat 13 1,425 110Other Renewable
Total Utility 458 44,726Planned Additions 2001-2005

LEGISLATION AND REGULATION
The golden age of electric utilities was the period from 1945 to 1965.11 Duringthis period there was exponential load growth accompanied by continual costreductions. New and larger plants were being installed at a continuously lowercost per kilowatt reflecting economics of scale. Improvements in efficiencywere being obtained through higher temperatures and pressures for the steamcycle, which was lowering the amount of fuel required to produce a kilowatthour of electric energy. New generating plants were being located at the minemouth, where coal was cheap, and power was transmitted to the load centers.This required new, higher-voltage transmission lines since it had been foundthat “coal by wire” was cheaper than the existing railroad rates.
The coordination of utilities was extensive. The leaders of the industryinvolved in planning the power systems saw the great advantage of inter-connecting utilities to reduce capital investments and fuel costs. Regional andinter-regional planning organizations were established. The utilities began tosee the advantage of sharing risk by having jointly owned units.
On the analytical side, improved tools were rapidly being developed.Greatly improved tools for technical analysis—such as computers—began toappear, first as analog computers and then as digital computers. At the sametime, the first corporate models were developed for analyzing future plans forpossible business arrangements for joint projects, of costs to the customers, forthe need for additional financing, and the impact on future rates.
All of these steps reduced capital and fuel costs which resulted in lowerrates. Everyone was happy. The customers were happy because the price ofelectricity was going down. The investors were happy because their returns oninvestments and the value of their stock were increasing.The system engineerswere happy because they were working on interesting and challenging prob-lems that were producing recognized benefits, and their value to the utilityorganizations was increasing. Finally, the business mangers were happy thatthey were running organizations that were functioning smoothly and wereselling their product to satisfied customers.
Blackouts and the Reliability Crisis
The first blow to this “golden age” was the blackout of New York City andmost of the Northeast, in 1965, which was caused by events taking place hundreds of miles away. The government reaction was immediate. Joseph C.Swidler was then Chairman of the Federal Power Commission. On orders fromPresident Johnson, he set up investigative teams to look into the preventionof future blackouts. As a result, they wrote an excellent report called “Pre-
8 HISTORY OF ELECTRIC POWER INDUSTRY
11 Ibid.

vention of Power Failures” which is a classic to this day.12 This report and anumber of subsequent blackouts led to increasing attention by Congress, theFERC,13 and the DOE to questions of reliability and increasing study. As analternate to additional legislation, the industry recognized the need to governitself and formed NERC and EPRI. Formal regional reliability criteria weredeveloped, reliability conditions monitored and major funds contributed todevelop new technology.
Environmental Crisis—The Shift to Low-Sulfur Oil
Starting shortly after the reliability crisis, and overlapping it considerably,was the environmental crisis. Both the public and the government became concerned about air quality, water quality, and the effect of electricity pro-duction on the environment. New environmental legislation was passed.These laws made the siting of new power plants very difficult. The powerindustry began installing nuclear units (which essentially had no exhaust);converting some of the existing coal-burning units to low-sulfur oil; providingelectrostatic precipitators to filter-out particulate emissions; installing scrub-bers to remove sulfur combustion products; and installing cooling towers so rivers would not heat up. All of these steps helped meet new governmentenvironmental requirements but significantly increased capital costs and fuelcosts.
Fuel Crisis—The Shift from Oil
While these changes and additions were still underway, the industry was over-taken by another crisis. In 1973 the OPEC organization stopped all deliveryof oil to the United States.This raised serious questions about plans to convertexisting units to oil. Plans were cancelled to convert generation to oil (at aconsiderable financial penalty). Huge increases in the price of fuel occurred.
Financial Crisis
At the same time, the country found itself in an inflationary spiral; the annualcost of money rose to double digits rates. All utility costs increased rapidly,requiring large rate increases. Because of the political impacts of such rateincreases, many state regulatory commissions rejected requests from the util-ities for needed rate increases, thus exacerbating the financial problems of util-ities. The depressed economy and rising costs of electricity dampened electric
LEGISLATION AND REGULATION 9
12 Federal Power Commission, Prevention of Power Failures, Volume I, Report to the Commis-sion, Washington, D.C., July 1967.13 FERC—The Federal Energy Regulatory Commission—is the successor to the Federal PowerCommission (FPC).

sales and load growth. The financial crisis resulted in a period of increasingcosts, declining revenue, the lack of load growth, and large amounts of gener-ating capacity under construction that would not be needed as soon as origi-nally projected. Utilities were forced to cancel construction of projects alreadyunderway, resulting in large cancellation payments. In 1979 a major accidentoccurred at the Three Mile Island nuclear plant in Pennsylvania. Massive overruns occurred in the cost of nuclear plants still under construction as theNuclear Regulatory Commission responded by requiring significant modifica-tion in designs. As a result, a large amount of planned nuclear generation wasnever built.
The service dates for other plants were delayed, in some cases for manyyears. This delay amplified the financial crisis even further because there wasan appreciable investment in these partially completed plants on which earn-ings were required, even though the plants were not operating and producingany electricity. Tenfold cost increases were experienced by many of theseplants.
Legislative and Regulatory Crisis
At about the same time, the Federal Government had become very chaoticand unpredictable in the regulations it issued. Some believed that paying toreduce peak power consumption was more economical than building new gen-erating and transmission capacity. This concept has been called “least-cost,”“demand-side,” or “integrated resource” planning.
The Public Utilities Regulatory Power Act (PURPA) legislation passed in 1978, prescribed the use of “avoided costs” for determining payments toindependently owned co-generators and qualifying facilities (QFs), such aslow-head hydro and garbage burners. These “avoided costs” were the alter-nate utility costs for producing electricity based on the alternates available to the utility system. They were based on estimates of future costs, made bystate regulators, which turned out to be much higher than the actual costs that occurred primarily because of the significant over-estimates of the futureprice of fuel. Unfortunately many utilities were required to sign long-term con-tracts for purchased energy reflecting these cost estimates. The avoided-costapproach led to excessive payments to some co-generators and other qualify-ing facilities. Subsequently, some utilities had to make very large payments tothe plant owners to cancel such contracts or to purchase the plants.
The next step by the various regulatory commissions was the proposal,and in some cases the adoption, of competitive bidding procedures for newgenerators. One of these procedures called for competitive bidding for the provision of the electricity needed each hour. It required all bidders whoseproposals were accepted to be paid the highest bid accepted for the hour, eventhough their proposal was lower. This approach caused huge additional costs.In many cases it is being replaced by negotiated contracts to buy specificamounts of power.
10 HISTORY OF ELECTRIC POWER INDUSTRY

The 1992 Energy Policy Act, FERC Orders 888 and 889, and various otherFERC orders and notices followed. Rapidly rising costs, declining reliability,developing procedures for manipulating electricity prices, have all increasedconcern and scrutiny of the electric power industry.
LEGISLATION AND REGULATION 11


2
13
This chapter gives an overview of the electric power system.The electric powerindustry delivers electric energy to its customers which they, in turn, use for avariety of purposes. While power and energy are related1, customers usuallypay for the energy they receive and not for the power.
An electric power system is comprised of the following parts:
• Customers2, who require the electric energy and the devices in which theyuse the electric energy—appliances, lights, motors, computers, industrialprocesses, and so on;
• Sources of the electric energy—electric power plants/electric generationof various types and sizes;
• Delivery system, by which the electric energy is moved from the genera-tors to the customers.
Taken together, all of the parts that are electrically connected or intertiedoperate in an electric balance. The technical term used to describe the balanceis that the generators operate in synchronism with one another. Later we will
ELECTRIC POWER SYSTEM
Understanding Electric Power Systems: An Overview of the Technology and the Marketplace, byJack Casazza and Frank DeleaISBN 0-471-44652-1 Copyright © 2003 The Institute of Electrical and Electronics Engineers
1 See Chapter 3 for explanation of power and energy.2 Some have questioned inclusion of customers as a part of the power system. The authors feelthat the magnitude, location, and electrical characteristics of customer load are as important asthose of generators. Additionally, demand side management and distributed generation alsoimpact both the electrical and commercial operation.

discuss how this concept of being in synchronism applies in the United Statesand Canada.
CUSTOMERS
Customer usage is typically referred to as customer load or “the load”. Thepeak usage, usually measured over an hour, a half-hour, or 15 minutes (peakdemand) is measured in either kilowatts or megawatts. The energy used by atypical residential or small commercial customer is measured in kilowatt-hoursand that used by larger customers in megawatt-hours.
Industry practice has been to group customers by common usage patterns.Typically these customer groups (or classes) are:
• Residential;• Commercial;• Industrial;• Governmental;• Traction/railroad.
A reason for delineating customer types is to recognize the costs that eachcustomer class causes in the provision of electric service since different cus-tomer classes have different usage patterns with differing impacts on thecapital and operating costs. In a regulated environment, where customers arecharged for their usage of electricity based on the cost of that supply, theseclassifications allow different menus of charges (rates) to be developed foreach customer class.
Analyzing different customer types also facilitates forecasting changes incustomer electric requirements. These forecasts are required for long-rangeplanning and short-range operating purposes.3
Individual customer requirements vary by customer type and by hourduring the day, by day during the week and by season. For example, a resi-dential customer’s peak hour electricity consumption will normally occur inthe evening during a hot summer day when the customer is using both air con-ditioning, lighting and perhaps a TV, computer or other appliances. A com-mercial customer’s peak hour consumption might also occur during the sameday but during afternoon hours, when workers are in their offices.
The time of day when a system, company or geographic area peak occursdepends on the residential, commercial and industrial customer mix in thearea.The aggregate customer annual peak demand usually occurs during a hot
14 ELECTRIC POWER SYSTEM
3 See Chapter 4, Electric Energy Consumption.

summer day or a cold winter day, depending on the geographic location of theregion and the degree of customer use of either air conditioning or electricheating. The electric system is built to meet the maximum aggregate systemand local area peak customer demand for each season.
Diversity refers to differences in the time when peak load occurs. Forexample, if one company’s area is heavily commercial and another’s is heavilyresidential, their peaks may occur at different times during the day or even indifferent seasons. This timing difference gives the supplying company theability to achieve savings by reducing the total amount of capacity required.
The types of electric devices customers use also have an important bearingon the performance of the electric system during times of normal operationand times when electrical disturbances occur such as lightning strikes, the mal-functioning and loss of generating resources or damage to parts of the deliv-ery system. Some types of customer equipment can require that devices beinstalled to provide extra support to maintain the power system’s voltage.
The electric system has metering equipment to measure and record indi-vidual customer electric usage (except for street lighting) and systems to billand collect appropriate revenues. For most customers, the meters measure anaggregate energy usage. For larger customers (usually commercial and indus-trial), meters also are used which record peak demand.
SOURCES OF THE ELECTRIC ENERGY—GENERATION
There are a number of ways to produce electricity, the most common com-mercial way being the use of a synchronous generator driven by a rotatingturbine. The combination is called a turbine-generator.
The most common types of turbine generators are those where a fossil fuelis burned in a boiler to produce heat to convert water to steam which drivesa turbine. The turbine is attached (coupled) to the rotating shaft (armature orrotor) of a synchronous generator where the rotational energy is transformedto electrical energy. In addition to the use of fossil fuels to produce the heatrequired to change the water to steam, there are turbine generators which relyon the fission of nuclear fuel to produce the heat. Other types of synchronousgenerators are those where the turbines are driven by moving water (hydroturbines) and gas turbines which are turned by the exhaust of a fuel burnedin a chamber containing compressed air.
For each type system, there are many variations incorporated in the powerplant in order to improve the efficiency of the process. Hybrid systems are alsoin use; an example is a combined cycle system where the exhaust heat from agas turbine is used to help provide heat for a steam driven turbine. Typically,more than one these generating facilities were built at the same site to takeadvantage of common infrastructure facilities, that is, fuel-delivery systems,water sources and convenient points to connect to the delivery system.
SOURCES OF THE ELECTRIC ENERGY—GENERATION 15

A small, but not insignificant, segment of the electric generation in thecountry includes technologies that are considered more environmentallybenign than traditional sources; that is, geothermal, wind, solar, biomass. Inmany of these technologies dc power is produced and use is made of invert-ers to change the dc to the alternating current (ac) needed for transmissionand use.
Figure 1.4 shows a total of 811,625 megawatts of utility and non-utility elec-tric generating capacity in the United States in 2000. Figure 2.1 shows thevarious energy sources used.
Generators are selected, sized and built to supply different parts of the dailycustomer load cycle. One type generator might be designed to operate con-tinuously at a fixed level for the entire day. This is a base loaded generator.Another generator might be designed to run for a short period at times ofpeak customer demand. This is a peaking generator. Others might be designedfor intermittent type service.
One important aspect of the selection of a particular generator is the tradeoff between its installed cost and its operating costs. Base loaded generatorshave much higher installed costs per unit of capacity than peaking generatorsbut much better efficiency and lower operating costs. Included in this decisionis the availability and projected cost of fuel.
Prior utility practice has been to have enough generation available to meetthe forecast customer seasonal peak demand plus an adequate reserve margin.Reserve margins were determined by conducting probability studies consid-ering, among other things, the reliability of the existing generation and poten-tial future loads. Systems that were mainly hydro generation based had lowerreserve margins (~12%) than systems that had nuclear, coal, or oil fired gen-eration (~16–24%). The availability of aid from neighboring systems duringshortages also had a large impact on the required reserve.
16 ELECTRIC POWER SYSTEM
EnergySource
UtilitiesMillion -mWhrs
NonUtilitiesMillionmWhrs
TotalmWhrs
% ofGRAND
TOTAL
Coal 1,696.6 271.1 1,967.70 51.8%Petroleum 72.2 36.6 108.80 2.9%
Gas 290.7 321.7 612.40 16.1%Nuclear 705.4 48.5 753.90 19.8%
Hydroelectric 248.2 24.9 273.10 7.2%
Geothermal 0.2 14.0 14.20 0.4%Other 2.1 67.8 69.90 1.8%
GRANDTOTAL 3,015.4 784.6§
3,800.00 100.0%
Figure 2.1. Energy sources of utility and non-utility generation in 2000.**§ Non Utility Value is preliminary.** Source EIA Table 3 and 58, U.S. Electric Utility and Non Utility Generation 1990 throughJune 2002.

DELIVERY SYSTEM
A system of overhead wires, underground cables and submarine cables is usedto deliver the electric energy from the generation sources to the customers.This delivery system, which electrically operates as a three phase, alternatingcurrent system, has four parts:
1. Transmission;2. Subtransmission;3. Primary distribution;4. Secondary distribution.
The wires that make up the three phases are collectively called a line, circuit,or with distribution, a feeder.
The characteristic which differentiates the four parts of the delivery systemfrom one another is the voltage at which they operate. In any one region ofthe country, transmission operates at the highest voltages, subtransmission at a lower voltage, then the primary distribution followed by the secondarydistribution.
There is no uniformly agreed upon definition of what voltages constitutethe transmission system. Some organizations consider voltage levels of 230kVand above while others consider voltage levels of 115kV and above. Figure2.2 shows the voltages that generally are considered for each grouping in theUnited States.
The transmission systems in the various parts of the United States have dif-ferent characteristics because of differences in the locations of generatingunits and stations in relation to the load centers, differences in the sizes andtypes of generating units, differences in geography and environmental condi-tions, and differences in the time that the transmission systems were built. Due
DELIVERY SYSTEM 17
System Voltages Included
Transmission†† 765kV, 500kV, 345kV 230kV,
169kV, 138kV, 115kV
Subtransmission 138kV, 115kV, 69kV, 33 kV, 27 kV
Primary distribution 33kV, 27kV, 13.8kV, 4kV
Secondary distribution 120/240 volts, 120/208 volts,
240/480 volts
Figure 2.2. Classification of voltages in the United States.†† In addition to the listed voltages, there are a number of high-voltage direct current (HVDC)installations that are classified as transmission.

to these differences, we find different transmission voltages in various sectionsof the country, that is, in some areas there is 765kV, in others 500kV and inothers 345kV.
As the industry developed, generation sites were usually located away fromhigh-density customer load centers and the high-voltage transmission systemwas the most economic and reliable way to move the electricity over long dis-tances.When new large central station generating plants were built, they eitherwere connected to the nearest point on the existing transmission system orthey were the trigger to institute the construction of transmission lines at anew higher transmission voltage.4 The connection points are called substationsor switching stations. These new higher voltage lines were connected to theexisting system by means of transformers. This process is sometimes referredto as an overlay and resulted in older generation being connected to trans-mission at one voltage level and newer, larger generation connected at a newhigher voltage level. Over time, the lower voltage facilities became called sub-transmission.
The progression of transmission voltage levels in the United States in the20th century is shown in Figure 1.1. As shown in Figure 2.3, in 1999 there werealmost 154,500 miles of HVAC transmission operating at a voltage of 230kVor higher in the United States.
Transformers enable the wires and cables of different voltages to operate asa single system.A transformer is used to connect two (or more) voltage levels.5
18 ELECTRIC POWER SYSTEM
4 Remember that the electric system involves a large capital investment for facilities with servicelives measured in decades. Changes to the system are incremental to that which already exists.5 Transformers are explained in Chapter 3.
Voltage Miles of Transmission Line
ac
230 kV 76.762
345 kV 49,250
500kV 26,038
765 kV 2,453
Total AC 154,503
dc
250-300 kV 930
400 kV 852
450 kV 192
500 kV 1,333
Total DC 3,307
Total ac & dc 157,810
Figure 2.3. 1999 transmission circuit miles.‡‡
‡‡ Source—NERC.

Transformers are installed at the generating plant to allow the generators,whose terminal voltage is typically between 13kV and 24kV, to be connectedto transmission. These are called generator step-up transformers. As the delivery system brings the electricity closer to the customers, transformersconnect the higher voltage system to lower voltage facilities. Connections canbe made to the local subtransmission system or directly to the primary distri-bution system. These are step-down transformers. Figure 2.4 shows a concep-tual sketch of a power system.
The connection point between the transmission system or the subtransmis-sion system and the primary distribution system is called a distribution sub-station.6 Depending on the size of the load supplied, there can be one or moretransmission or subtransmission lines supplying the distribution substation.A distribution substation supplies a number of primary distribution feeders.These distribution feeders can supply larger customers directly or they connectto a secondary distribution system through a transformer affixed to the top ofa local utility pole or in a small underground installation.
Depending on the magnitude of their peak demand, customers can be con-nected to any of the four systems. Typically a residential customer will be con-nected to the secondary distribution system. A commercial customer, that is,a supermarket or a commercial office building, will normally be connected tothe primary distribution system. Very large customers such as steel mills oraluminum plants can be connected to either the subtransmission or transmis-sion system.
INTERCONNECTIONS
As individual companies built their own transmission, it became apparent thatthere were many reasons to built transmission lines or interties between adja-cent systems. Among the reasons were:
• Sharing of generation reserves thereby reducing the overall amount ofgenerating capacity and capital investment needed;
• Providing the ability to buy and sell electricity to take advantage of dif-ferences in production costs;
• Facilitating operations by allowing more optimum maintenance scheduling;
• Providing the ability to jointly construct and own power plants;• Providing local load support at or near the company boundaries.
INTERCONNECTIONS 19
6 The substations are sometimes called switching stations. In addition, substations are also calledhigh voltage substations, bulk power substations, and distribution substations.

20 ELECTRIC POWER SYSTEM
LARGEINDUSTRIALCUSTOMER
VERY LARGE
INDUSTRIALCUSTOMER NUCLEAR
STATION
DISTRIBUTIONSUBSTATIONS
SUBTRANSMISSION& DISTRIBUTION
SYSTEM
SUBTRANSMISSIONSYSTEM
69–138 KV
TRANSMISSION LINES115 KV TO 765 KV
BULK POWERSUPPLY SYSTEM
HIGH VOLTAGEOR BULK POWER
SUBSTATIONS
DISTRIBUTIONSUBSTATIONS
DISTRIBUTEDGENERATOR
DISTRIBUTIONSUBSTATION
DISTRIBUTIONSUBSTATION
DISTRIBUTEDGENERATOR
DISTRIBUTIONSUBSTATION
NETWORK
RURALLINE
INDUSTRIALCUSTOMERS
RESIDENTIALCUSTOMERS
DISTRIBUTION TRANSFORMERS
SECONDARY DISTRIBUTION XXXXXXXX
X X X X X X X X
TO ADJACENTSYSTEM
TO ADJACENT SYSTEM
FOSSIL FUELTHERMALSTATION
HYDRO STATIONHIGH HEAD
HYDRO STATIONMEDIUM HEAD
HYDRO STATIONLOW HEAD
SWITCHINGSTATION
Figure 2.4. Conceptual sketch of an electric system.§§
§§ From Electric Utility Systems and Practices, 4th Edition, Homer M. Rustebakke, Wiley, New York.

GRID
The resulting transmission system is not a linear arrangement of lines fed from a single generating station and tying to a single primary distributionsystem, but something much more complex. Generating units are located at anumber of sites as are the locations of distribution substations. The generat-ing sites are often electrically directly connected by transmission lines (someshort and some long) to nearby substations where transmission lines alsoconnect. Other transmission lines connect the substations together and alsoconnect to distribution substations where there are connections to lowervoltage facilities. From some of the substations there are interconnections toother companies.
Taken together, this arrangement of transmission lines tied together atvarious substations provides a degree of redundancy in the delivery paths forthe electric energy. Power engineers have coined the terms “the grid”, the“bulk power system” and “the interconnection” to describe the deliverysystem. Figure 2.5 shows the three large grids in the United States and Canada:the Eastern Interconnection, the Western Interconnection and ERCOT, theTexas system. The generators within each grid operate in synchronism withone another. The Canadian Province of Quebec is interconnected to theeastern United States grid by non-synchronous HVDC ties.
GRID 21
WesternInterconnection
EasternInterconnection
ERCOTInterconnection
NERC Interconnections
Figure 2.5. The three interconnected electric systems in the United States and Canada.****** Source—NERC.


3
23
This chapter describes, as simply as possible, the applicable physical laws and concepts needed to understand the physical operation of an electric power system. In Chapters 10 to 17 the commercial operation of the system is covered. An attempt has been made to present the material in a non-technical (i.e., as few equations as possible) manner.
It is important to remember that the operation of an electric power system is governed and described by the laws of physics, which are unchanging,whereas the commercial operations are subject to man-made rules which are subject to modification and change. There is an interrelationship betweenthe two in that the rules established for commercial operations must recognizeand respect the physical laws by which the power system operates and the commercial rules often determine the design and operation of the system.
A note on terminology is warranted. As the electric utility industry devel-oped, an associated jargon evolved, some of which you have already beenexposed to in Chapter 2. In some instances, the words used are simply con-tractions of longer terms; for example, the use of “amps” in place of “amperes”to describe electrical current. In other instances, a variety of terms are used todescribe a single concept, for example, the use of the terms “grid”, “the inter-connection”, and “the bulk power system” to describe the totality of all theelectric transmission.1
BASIC ELECTRIC POWERCONCEPTS
Understanding Electric Power Systems: An Overview of the Technology and the Marketplace, byJack Casazza and Frank DeleaISBN 0-471-44652-1 Copyright © 2003 The Institute of Electrical and Electronics Engineers
1 There are many glossaries defining the terms used in connection with electric power systemsand business. One of the most useful is CIGRE Glossary of Terms Used in the Electricity Supply

ELECTRIC ENERGY
Energy is defined as “the capacity for doing work.” Electricity is but one ofmany forms of energy. Other familiar forms of or descriptions of energy arethermal or heat, light, mechanical, and so on. Energy is also described askinetic, that energy associated with a moving body, and potential energy, thatenergy associated with an object’s position.
For centuries mankind has used energy in its various forms to enhance itsstandard of living. In many cases, ways have been devised to change energyfrom one form to another to increase its usefulness. An example as old asmankind is the burning of a fuel to produce heat and light. Electric powersystems thus provide a service, energy in a usable form, not a product, to consumers.
Electrical energy possesses unique characteristics that made it an extremelyvaluable form of energy. It has unique properties:
• It can be produced at one location and transmitted to another instantaneously;
• It can be transformed to other energy forms and thereby used in a varietyof ways;
• It can be delivered by a system of wires, and control;• It cannot be stored.
Consistent terminology has always been an issue when discussing electric-ity and electric power. Convention is to use a system of measurement basedon the MKS (meter, kilogram, second) system.
Figure 3.1 summarizes the terms used to describe various aspects of elec-tricity and shows some of the interrelationships between them. There is anelectric charge associated with electrons. This charge is described by a quan-tity called a coulomb. The rate of flow of these charges is called the electriccurrent and is described by a quantity called an ampere. One ampere is equalto the flow of one coulomb of charge during one second across a referencepoint. The capital letter, I, is used to indicate current and the quantity is some-times referred to as amps. In many texts, electric current is described as a phys-ical flow of electrons. It is not. The electrons do not flow.2 Rather electricity isa flow of energy as a result of electron vibrations. The mechanism is the trans-fer of energy from one electron to another as they collide, one with another.
Electromagnetic force (EMF), voltage, and difference in potential are different descriptions of the notion of what causes these charges to flow.A physics text would define voltage as the energy per a unit of charge where
24 BASIC ELECTRIC POWER CONCEPTS
Industry, February 2002. This includes the definitions used by the IEEE, NERC, EEI, and inEurope.2 “Amicus Brief to Supreme Court”, August 2001, www.tca-us.com.

energy is measured by a quantity called a watt-second.3 An engineering textwould say that a difference in potential (or of voltage) of one volt causes acurrent of one ampere to flow through a circuit that has a resistance of oneohm.
The letter E is used when referring to a voltage source such as a generatoror a battery and is often called an electromagnetic force. The letter V is usedin all other instances. In both cases the quantity is measured by a quantitycalled a volt.4 One volt is equal to one watt-second of energy per one coulombof charge.
Voltage can be thought of as electric potential to deliver energy.5 Differ-ences in voltage measure the work that would have to be done6 to move a unitcharge from a point of one voltage to that of another voltage.
ELECTRIC ENERGY 25
Quantity Name or Unit Symbol Relationships
Electric charge Coulomb q
Time Seconds, Hours t
Current Amperes I I = q / t = V / R
Resistance Ohms R R = V / I
Inductive Reactance Ohms XL XL = 2*p*f *L
CapacitiveReactance
Ohms XC XC = 1 / (2*p*f *C)
Impedance Ohms Z Z = R +j (XL + XC)
Voltage Electromagneticforce (EMF),Volts,kilovolts
E, V, kV V = I * RV = J / Q
Power or Real
Power
Watts, kiloWatts,megaWatts,
P P = V * IP = I2 * RP= V2 / R
Reactive Power VArs, kiloVArs,megaVArs
Q Q = I2 * XL
Q = I2 * XC
Apparent Power S S = P + j Q
Energy kiloWatthours,megaWatthours,Joules
J J=V * I * tJ= I2 * R * t
Frequency Hertz, cycles persecond
f
Figure 3.1. Basic electric relationships.
3 In physics texts, the term joule is also used for energy. One joule = 1 watt-second.4 Named after Alessandro Volta, (1745–1827), an Italian who invented the battery.5 The voltage associated with an electric generator is called an electromagnetic force or EMF.6 This work would be done against the electric field.

When a source of voltage is applied to a wire, a current will flow. The mate-rial in the wire offers some resistance to the flow of current. This resistance isdescribed by a quantity called an ohm.7 One ohm is defined as the resistanceof a circuit element when an applied voltage of one volt results in a currentof one ampere. The resistance of wire depends on the material it is made of,the cross-sectional area of the wire and its length. For a given material, thelarger the cross-sectional area the lower the resistance. The letter R is used torepresent resistance in ohms. The relationship between voltage, current andresistance is known as Ohm’s Law; that is, voltage = current ¥ resistance. Thisrelationship is applicable for direct current conditions. Later in this chapterwe will introduce a version of this law when it is applied to alternating currentcircuits of the type used in power systems.
As mentioned earlier, electricity is a form of energy which is measured bya quantity called a watt-second. Electric customers usually see their bills keyedto their watt-hour usage.A related but different quantity is electric power.Theunit of power is the Watt.
In an electric power system the magnitudes of many quantities are such that larger units are needed to describe them. The larger increments usuallyencountered are described by the addition of the term kilo or the term megato the base unit. For example, a kiloVolt is 1,000 Volts; a kiloWatt is 1,000Watts, a megaWatt is 1,000,000 Watts or 1,000 kiloWatts, a kiloWatthour is1,000 Watthours.
CONCEPTS RELATING TO THE FLOW OF ELECTRICITY
The two laws which define the flow pattern of electricity through electric linesare known as Kirchhoff’s Laws8.These laws reflect two basic physical concepts:
1. The algebraic sum of voltage drops around a closed loop is zero. Thevoltage across a source is considered positive while the voltage dropacross an element (i.e. a resistor) is considered negative.
2. The algebraic sum of currents entering any common point (a node)where three or more lines connect must equal the algebraic sum of thecurrents leaving that point.
In a complex network of lines such as one finds in a power system, the flowof power and current in any one line is determined by the line’s electrical char-acteristics, the characteristics of the other lines in the network, the location of the power injections and the locations of the power deliveries. All linesoperating in a network participate to a greater or lesser extent whenever there
26 BASIC ELECTRIC POWER CONCEPTS
7 Named after George Simon Ohm, (1787–1854), a German physicist.8 Named after Gustav Robert Kirchhoff, (1824–1887), a German physicist.

is an increment in generation to supply an increment of load. Later in thischapter we will discuss this notion in more detail.
DIRECT CURRENT
The first utility systems installed by Edison used direct current technology.Theelectrical energy in a direct current system is the same as found when a batteryis used. If one looked at a picture of the voltage and the current, one wouldsee that both had a constant, non-varying value. Not long after Edison installedhis direct current system, others realized that the use of an alternating currentsystem had advantages over the direct current. The concepts discussed heretofore apply to direct current systems.
ALTERNATING CURRENT
The modern electric power system is an alternating current, three phasesystem. Electricity is generated by synchronous generators which are machineswhich convert the rotational energy of a shaft into electrical energy. The generator shaft or rotor is rotated by means of a turbine as discussed inChapter 5.
The energy conversion is based on a phenomenon associated with mag-netism and electricity called induction. If a stationary wire loop is placed inthe field of a rotating magnet, an electric current will be induced in the wire.The rotor of an electric generator is made to look like a magnet by energiz-ing conductors embedded in it with a source of direct current. The system thatprovides direct current to the rotor windings is called the excitation system.The energized windings on the rotor are conventionally called the field or fieldcircuit. In modern generators the direct current excitation is derived from analternating current source that has been rectified to provide dc.
The direct current excitation establishes a magnetic field in the metal of therotor which extends across the air gap between the rotor and the stationarypart of the generator (stator or armature). Electricity is induced in coils whichare placed in slots in the stator. The voltage induced in any one coil reflectsthe time varying characteristic of the magnetic field, as viewed by a stationaryobserver, caused by the rotation of the rotor. The magnitude of the inducedvoltage can be adjusted up or down by changing the magnitude of the directcurrent flowing in the rotor. This is done by a voltage regulator in the excita-tion system which monitors the voltage at the terminal of the electric gener-ator and adjusts the field voltage up or down as required to maintain thedesired generator terminal voltage.
The voltage and current have a sinusoidal shape, that is, in each cycle of 360degrees, it starts at a zero value at zero degrees, rises to a positive maximumat 90 degrees, falls to zero at 180 degrees, continues to fall to a negative
ALTERNATING CURRENT 27

maximum at 270 degrees and returns to zero at 360 degrees, where the processrepeats as shown in Figure 3.2. This sinusoidal shape reflects the rotatingpattern of the magnetic field produced on the rotor. If the stator coil is con-nected to an external load, current will flow. The current will also be oscilla-tory in nature, hence the name alternating current. The number of full cyclesthat occur in a set time defines the frequency of the electricity. In the UnitedStates and many other areas of the world, the frequency is 60 hertz9 or cyclesper second. In other areas a frequency of 50 cycles is used. The frequency isset by the number of magnetic circuits that are established on the rotor. Thefrequency of the electricity produced by a particular generator is defined as:
where n is the speed in revolutions per minute (rpm) and p is the number ofpairs of magnetic poles. Steam turbines rotate at high speeds. For example, ifone magnetic circuit is established, that is, there two magnetic poles estab-lished (a single pair consisting of a north and a south pole), a speed of 3,600rpm will result in a frequency of 60 hertz. Alternately, if two magnetic circuitsare established using two pairs of poles, a speed of only 1,800rpm is neededto produce a frequency of 60 hertz. Hydraulic turbines rotate at relatively lowspeeds and will have many poles to produce the required frequency.
Because of the oscillatory nature of the voltage and current, an “effective”voltage11 and current value is defined. These effective values are consideredto be equivalent to the direct current voltage and currents that would producethe same power dissipation (as heat) in a resistance. The effective value for asine wave is equal to 0.707 ¥ the peak value. In the United States, for example,the oft quoted household voltage of 120 volts is an effective value and corre-sponds to a peak value of 169.7 volts.
f = ( )n p* ,6010
28 BASIC ELECTRIC POWER CONCEPTS
+10° 90° 180° 270° 360°
0
–1
Figure 3.2. Sinusoidal shape of voltage or current.
9 Named after Heinrich R. Hertz, (1857–1894), a German physicist.10 In this text, an asterisk (*) is used to indicate multiplication.11 The term root mean squared (RMS) is also used.

THREE PHASES
The efficiency of the energy transformation and delivery process improves asthe number of independent coils located on stator is increased. The electricalconductors on the stator are physically arranged so that three separate butequal voltages are produced. The three conductors are connected together ata common point resulting in a configuration called a wye. The rotating pat-terns of these voltages are displaced from one another by 120 degrees. Takentogether, the voltages and currents in the three coils become the three phasesof a single circuit.
In a wye connection, two voltage measurements are defined: the phasevoltage of the phase with respect to the neutral point, VLN, and the voltagebetween phases or between lines, VLL. When the system is balanced, that is,generators and customer load connected in such a way as to result in equalvoltages and currents on each phase of a circuit, these two voltages are relatedas follows:
The convention used when referring to power system voltages is to use theeffective or RMS value of the line to line voltage.
SYNCHRONISM
When a number of generators are connected to the same electric grid, theyare said to be in synchronism because they operate at the same frequency andthe angular differences between the voltage angles of each generator arestable and less than 90 degrees. Units operating in synchronism are magneti-cally coupled by their connections through the power system. If any onechanges its angle of operation, all the others are affected.
CHARACTERISTICS OF AC SYSTEMS
Resistance
In an ac system, the voltage across a resistor and the current flowing thoughtit are said to be in phase, that is, their zero value and their maximum values occur at the same times. There are two types of fields associated withan ac electric system; electric fields and magnetic fields. Electric fields relateto the voltage and magnetic fields relate to the current.12 The waveforms
V V VLL LN LN= =3 1 732* . *
CHARACTERISTICS OF AC SYSTEMS 29
12 Since they operate at high voltage, transmission lines generate strong electric fields. If they areheavily loaded, i.e., carrying large amounts of power, they also will have strong magnetic fields.Distribution lines, which operate at lower voltages, generate weak electric fields, but can gener-ate strong magnetic fields depending on the local customer load levels.

of the voltage and current associated with both of these characteristics are not in phase, that is, the times of the maximum and zero values are not identical.
Induction and Inductive Reactance
When we discussed the operation of a generator, we noted that an electricvoltage is induced in a wire when a moving magnetic field “cuts” that wire.Similarly, a current varying with time (an alternating current) will produce amagnetic field around the wire carrying the current. Since the current isvarying so will the magnetic field. This varying magnetic field “cuts” the con-ductor and a voltage is induced in the wire which acts to impede the origi-nating current.
The relationship between the current and the induced voltage is defined bya quantity called the inductance. One Henry is the amount of inductancerequired to induce one volt when the current is changing at the rate of oneampere per second.The letter L is used to represent the inductance in Henries.
The inductance, L, of one phase of a transmission or distribution line is cal-culated by considering the self-inductance of the individual phase conductorand the mutual inductance between that phase and all other nearby phasesboth of the same circuit/feeder and other nearby circuits/feeders. These quan-tities are calculated based on the physical dimensions of the wires and the distances between them. The induced voltage across an inductor will be amaximum when the rate of change of current is greatest. Because of the sinu-soidal shape of the current, this occurs when the actual current is zero. Thusthe induced voltage reaches its maximum value a quarter-cycle before thecurrent does—the voltage across an inductor is said to lead the current by 90degrees, or conversely, the current lags the voltage by 90 degrees.
Inductive Reactance
The inductive reactance, XL is a term defined to enable us to calculate the mag-nitude of the voltage drop across an inductor.The inductive reactance is meas-ured in Ohms and it is equal to 2*p* f*L, where 2pf is the rotational speedin radians per second; p is called pi and its value is 3.1416, f = frequency inhertz and L = inductance in Henries. Inductances consume reactive power orVARs equal to I2XL.
Capacitance and Capacitive Reactance
An electric field around the conductor results from a potential differencebetween the conductor and ground. There is also a potential differencebetween each conductor in a three phase circuit and with any other nearbytransmission lines. The relationship between the charge and the potential dif-ference is defined by a quantity called the capacitance. One Farad is the
30 BASIC ELECTRIC POWER CONCEPTS

amount of capacitance present when one coulomb produces a potential dif-ference of one volt. The letter F is used to represent the capacitance in Farads.
The capacitance C, depends on the dimensions of the conductor and thespacing between the adjacent lines and ground. Since the charge on a capac-itor varies directly with the voltage, when an alternating voltage is impressedacross a capacitor, the flow of charge (or current) will be greatest when therate of change of voltage is at a maximum. This occurs when the voltage wavecrosses the zero point.Thus in an alternating current system, the current acrossa capacitor reaches its maximum value a quarter-cycle before the voltagedoes—the voltage is said to lag the current by 90 degrees, or conversely, thecurrent leads the voltage by 90 degrees.
Capacitive Reactance
The capacitive reactance, XC, is a term defined equal to 1/2*p * f*C, where C= capacitance in Farads. The unit of the capacitive reactance is Ohms. In apower system the capacitive reactance is viewed as a shunt connecting the con-ductor to ground. Capacitors supply reactive power or VARs equal to I2Xc.Figure 3.3 demonstrates the current and voltage relationships for a resistor,an inductor and a capacitor.
Reactance
Both inductive reactance and capacitive reactance have an impact on the rela-tionship between voltage and current in electric circuits. Although they areboth measured in Ohms, they cannot be added to the resistance of the circuitsince their impacts are quite different from that of resistance. In fact, theirimpacts differ one from the other. The current through an inductor leads thevoltage by 90 degrees, while current through a capacitor lags the voltage by90 degrees. Because of this difference, their effects will cancel one another.The convention is to consider the effect associated with the inductive reac-tance a positive value and that with the capacitive reactance a negative valueand VARs as consumed by inductive reactance and supplied by capacitivereactance.A general term, reactance, is defined which represents the net effectof the capacitive reactance and inductive reactance. It is denoted by the capitalletter X.
Impedance
Once determined, the reactance is combined with the resistance of a circuit toform a new quantity called Impedance which is denoted by the capital letterZ.To determine a single number representation of the impedance, the conceptknown as complex numbers is employed. Simply speaking, resistance and reac-tance are treated as both legs of a right triangle separated by 90 degrees. Acommon way of representing the impedance term is:
CHARACTERISTICS OF AC SYSTEMS 31

32 BASIC ELECTRIC POWER CONCEPTS
0 100 200 300 400
Degrees
V, I
Current
Voltage
AC Voltage & Current Across an Inductor
AC Voltage & Current Across a Resistor
42033024015060–30
V,I
Degrees
VoltageCurrent
a
b
c
◆◆
◆
◆
◆
◆
◆
◆◆◆ ◆
◆
◆
◆
◆
◆
◆
◆
◆◆◆
◆◆ ◆◆
◆
◆
◆
■
■
■■■■
■■
■
■
■
■
■
■
■■
■■ ■■
■
■
■
■
■
■
■■
5004003002001000
Degrees
Current
Voltage
AC Voltage & Current Across a Capacitor
Figure 3.3. Current and voltage relationships for (a) a resistor, (b) an inductor and (c) a capacitor.

where the letter j, is used as a convention to indicate that the reactance is notto be directly added to the resistance. The magnitude of the impedance isdetermined by Pythagoras’ Theorem, that is, the square of the impedance isequal to the sum of the squares of the resistance and the reactance.
Ohm’s Law for Alternating Current
Ohm’s Law as originally construed for dc cannot be applied to ac circuits sinceit recognizes only resistance and not the inductive and capacitive reactanceeffects. The Law can be modified to take into consideration the effect of reac-tance by simply replacing the term for the resistance with a term for thecircuit’s impedance and treating the voltage and the current as time varyingquantities rather than as constants as in a direct current circuit. In engineer-ing textbooks, the ac quantities are indicated by letters with lines drawn overthem or by bold letters. We shall follow this latter convention.
POWER IN ALTERNATING CURRENT CIRCUITS
In a dc circuit, the power is equal to the voltage times the current, or P =V*I.This is also true in an ac circuit when the current and voltage are in phase;that is, when the circuit is resistive. But, if the ac circuit contains reactance,there is a power component associated with the magnetic and/or electric fields. The power associated with these fields is not consumed as it is in a re-sistance, but rather stored and then discharged as the alternating electriccurrent/voltage goes through its cycle. This leads to another definition:
Apparent power or True power associated with apower associated with an or
= ( )+ ( )
Real resistanceReactive inductance capacitance13 .
V = I Z*
where X X XL C= -
Z R X= +( )2 2 0 5.,
Z R X or2 2 2= + ,
Z R X XL C= + -( )j
POWER IN ALTERNATING CURRENT CIRCUITS 33
13 Another name that has been used for this quality is Imaginary Power. The name derived fromthe application of the complex number convention to calculate Z.
A related concept is that of power factor, which is defined as a magnitude of P divided by amagnitude of S. In the electric power industry, if the power factor is too low (typically under 0.85)because of the magnitude of the reactive component Q, corrective actions are usually taken.

Using symbols:
Real Power
Real power is available to do work and is equal to the value of the resistancemultiplied by the square of the current through the resistance. It is measuredby a quantity called megawatts (mW) or kilowatts (kW).
Reactive Power
Reactive power neither consumes nor supplies energy. The reactive powerassociated with an inductive reactance is the value of the inductive reactancemultiplied by the square of the current through it. The reactive power is measured by a quantity called volt-ampere reactive or VARs. As the length of a line increases, its inductive reactance increases, and the more capac-itive reactive power needed to offset the effect and to maintain adequatevoltage:
The capacitive reactive power, QC, relates to the establishment of the elec-tric field around a line. There are a number of ways to calculate this value, butthe following offer insight into its effects on the transmission system.
In a power system, under normal operations, the voltage level on any one line is kept more or less constant, so the reactive power associated with the capacitance of the line is also relatively constant. Charging current, IC, is defined as the line to neutral voltage divided by the capacitivereactance
If the charging current becomes too large, much of the line’s current car-rying capacity may be “eaten up” by charging current. This situation sets limitson the length of an overhead line or of a cable that can be operated withoutinstalling some intermediate measures to offset the capacitive current. It isuseful to visualize the impact of various devices on the reactive power of apower system as follows:
I V XC LN C=
Q V X or V IC LN C LL C= =3 32* * *
Q I XL L= 2 *
P I R= 2 *
S P jQ= +
34 BASIC ELECTRIC POWER CONCEPTS
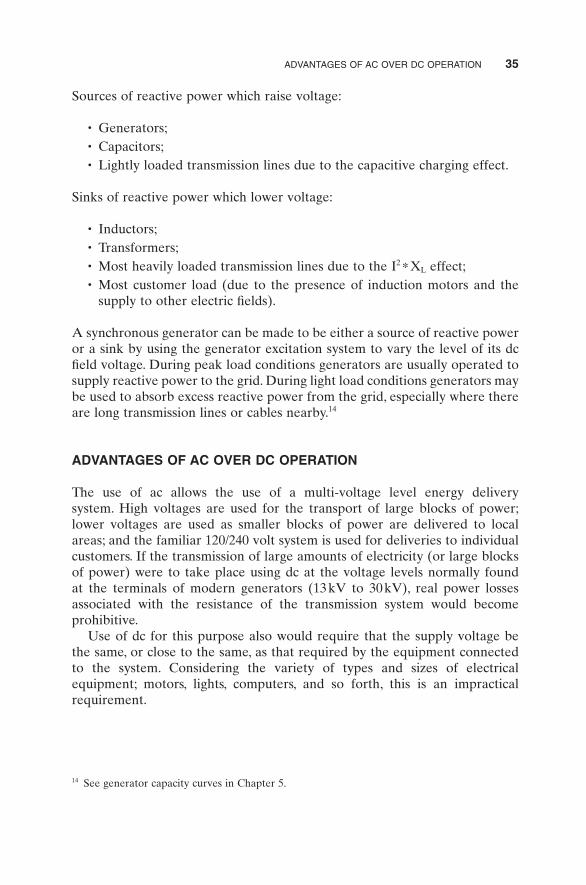
Sources of reactive power which raise voltage:
• Generators;• Capacitors;• Lightly loaded transmission lines due to the capacitive charging effect.
Sinks of reactive power which lower voltage:
• Inductors;• Transformers;• Most heavily loaded transmission lines due to the I2 *XL effect;• Most customer load (due to the presence of induction motors and the
supply to other electric fields).
A synchronous generator can be made to be either a source of reactive poweror a sink by using the generator excitation system to vary the level of its dcfield voltage. During peak load conditions generators are usually operated tosupply reactive power to the grid. During light load conditions generators maybe used to absorb excess reactive power from the grid, especially where thereare long transmission lines or cables nearby.14
ADVANTAGES OF AC OVER DC OPERATION
The use of ac allows the use of a multi-voltage level energy delivery system. High voltages are used for the transport of large blocks of power;lower voltages are used as smaller blocks of power are delivered to local areas; and the familiar 120/240 volt system is used for deliveries to individualcustomers. If the transmission of large amounts of electricity (or large blocksof power) were to take place using dc at the voltage levels normally found at the terminals of modern generators (13kV to 30kV), real power losses associated with the resistance of the transmission system would become prohibitive.
Use of dc for this purpose also would require that the supply voltage be the same, or close to the same, as that required by the equipment connectedto the system. Considering the variety of types and sizes of electrical equipment; motors, lights, computers, and so forth, this is an impracticalrequirement.
ADVANTAGES OF AC OVER DC OPERATION 35
14 See generator capacity curves in Chapter 5.

TRANSFORMERS
The device which allows the use of a multi-voltage level energy delivery systemis a transformer. A transformer makes use of the principal of electromagneticinduction that we’ve seen before. Figure 3.4 contains a simplified exampleshowing two independent circuits wound about a common core. A magneticpath, B, is established in the core by the ac in one of the circuits.
It can be shown that because of the time varying nature of the magneticfield created by the current in coil 1, an ac voltage is induced in the secondcoil (coil 2). The induced voltage is related to the ac voltage impressed on thefirst coil (coil 1) multiplied by the ratio of the number of turns (N2/N1) thatthe respective circuits make around the core.
Symbolically:
Depending on the number of turns of wire constructed into the transformer,the voltage level on the secondary side can be increased or can be decreasedfrom that on the primary side.This capability offers significant flexibility in thedesign of a power system.
In an ideal situation (no losses associated with the transformer), the powerentering the transformer is equal to the power exiting it:
A significant reduction of real power line losses can be achieved by usinga transformer to raise the transmission voltage and thereby lowering thecurrent resulting in lower I2 ·R losses.
V I V I1 1 2 2* *=
V V N N2 1 2 1= ( )*
36 BASIC ELECTRIC POWER CONCEPTS
I2
I1
E1
E1
V2
V2
N2 turns
N1 turns
N2
N1= ––––––
E,* I, =V2* I2
Figure 3.4. Conceptual schematic of a simple transformer.

POWER FLOW
By using Kirchhoff’s Laws and the concept of impedance, calculations can bemade to determine the currents, and real and reactive powers flowing intransmission lines and the voltages at all terminals (buses, nodes) in an acsystem. Textbooks are written to educate students in the techniques of per-forming the required calculations. For our purposes we will summarize theinsights that one gets from doing those analyses.15
Division of Power Flow Among Transmission Lines
Power flows on all possible transmission paths between a source of generationand a load approximately in proportion to the relative impedances of all thepaths, not only on the most direct path.16 It will not flow just on a path forwhich a commercial arrangement has been made (contracted path), nor onlyon the facilities of the owner or purchaser of the electricity.
For a vertically integrated utility, electricity from its generating plants willuse all parallel paths to reach its load—including transmission facilities ofneighboring utilities. When interregional power transfers are scheduled, thefacilities of many utilities, not only those involved in the transaction, may carrysome of the power. This phenomenon will always occur, no matter who ownsthe power plants or the transmission lines.
Voltage Drop and Reactive Power Flow
The magnitude of the voltage drop across a transmission line will depend pre-dominately on the amount of reactive power (Q) that flows through the reac-tance of the line.17 This means that to minimize a voltage drop, reactive powersources should be located as close as possible to the load. This relationship issummarized in the following formula:
Power Flow and Phase Angle Differences
The magnitude of power flow on a power system is dependent predominatelyon the phase angle difference between two points since the line reactance isconstant and the terminal voltages V1 and V2 are essentially constant:
V V X Q VL1 2 2-( ) = *
POWER FLOW 37
15 In many instances the resistance of elements can be ignored because they are typically an orderof magnitude smaller than the reactance of the same element.16 Development is under way on devices that can be inserted in series with transmission lines tochange their effective series impedance. Some of these devices are currently (2002) undergoingfield testing. If successful, these devices will provide some level of control of the paths by whichpower will flow.17 “VARs don’t travel well,” G. Loehr.

STABILITY
Stability refers to the ability of the generators in a power system to operatein synchronism both under normal conditions and following disturbances.Three categories of instability are:
• Steady-state instability;• Transient instability;• Dynamic instability.
Steady-state instability refers to the condition where the equilibrium of thegenerators connected to the power system cannot accommodate increases inpower requirements that occur relatively slowly or when a transmission lineis removed from service for maintenance.
Since the power flow from one point to another is proportional to the sine of the angular difference between the voltages at the two points andinversely proportional to the total impedance of the circuits connecting the two points, there is a maximum level of power flow, that is, the deliverylevel at which the angular difference is 90 degrees, and the sine is equal to one.
The fact that the power flow is dependent on the sine of the angular dif-ference between the voltages has an important significance in that it definesthe maximum amount of power that can be moved across the facilities con-nected by the impedance X12. If the power required by the customers at bus2 is greater than the amount that can be delivered at a 90 degrees separationin the voltages, the system is unworkable. A technical term to describe a situ-ation where the customer load at bus 2 slowly increases and the angular spreadresponds until it reaches the 90 degree point and then goes beyond 90 degreesis that the system becomes unstable and will collapse.
If the net impedance is increased by removing a line, less power can betransmitted. If there are a number of lines connecting bus 1 with bus 2, theloss or outage of any one of them will increase the impedance between thetwo buses and the system can again become unstable. Conversely, if the netimpedance is reduced, more power can be transmitted. The value of the netimpedance can be reduced by:
• Building an additional line(s) in parallel;• Raising the design voltage of one or more of the existing lines;• Decreasing the impedance of any of the existing lines by inserting a capac-
itor in series (remember XC cancels out XL).
P V V X12 1 2 12 12= * *sineq
38 BASIC ELECTRIC POWER CONCEPTS
Transient instability refers to the condition where there is a disturbance on the system that causes a disruption in the synchronism or balance of the system. The disturbance can be a number of types of varying degrees ofseverity:
• The opening of a transmission line increasing the XL of the system.• The occurrence of a fault decreasing voltage on the system. (The voltage
at the fault goes to zero, decreasing all system voltages in the area.)• The loss of a generator disturbing the energy balance and requiring an
increase in the angular separation as other generators adjust to make upthe lost energy.
• The loss of a large block of load in an exporting area.
When there is a disturbance on the system, the energy balance of genera-tors is disturbed. Under normal conditions, the mechanical energy input to thegenerator equals the net electrical energy output plus losses in the conversionprocess within the turbine generator and the power consumed in the powerplant.
If a generator sees the electric demand at its terminal in excess of itsmechanical energy input it will tend to slow down as rotational energy isremoved from its rotor to supply the new increased demand. If a generatorsees an electric demand at its terminal less than its mechanical energy input,it will tend to speed up due to the sudden energy imbalance. This initial reac-tion is called the inertial response.
Disturbances may also change the voltage at the generator’s terminals.In response, the generator’s automatic voltage regulating system will sense the change and adjust the generator’s field excitation, either up or down, tocompensate.18
Transient stability or instability considers that period immediately after adisturbance, usually before the generator’s governor and other control systemshave a chance to operate. In all cases, the disturbance causes the generatorangles to change automatically as they adjust to find a new stable operatingpoint with respect to one another. In an unstable case, the angular separationbetween one generator or group of generators and another group keepsincreasing. This type of instability happens so quickly, in a few seconds, thatoperator corrective action is impossible.
If stable conditions exist, the generator’s speed governor system, sensingthe beginning of change in speed, will then react to either admit more mechan-ical energy into the rotor to regain its speed or to reduce the energy input toreduce the speed. Directives may also be received by the generator from thecompany or area control center to adjust its scheduled output.
STABILITY 39
18 See Chapter 8.

In addition to the measures noted to improve steady-state stability, otherdesign measures available for selected disturbances to mitigate this type insta-bility are:
• Improving the speed by which relays detect the fault and the speed bywhich circuit breakers operate to disconnect the faulted equipmentsooner;
• The use of dynamic braking resistors which, in the event of a fault, areautomatically connected to the system near generators to reduce exportfrom the generators;
• The installation of fast-valving systems on turbines, allowing rapid reduc-tion in the mechanical energy input to the turbine generator;
• Automatic generator tripping;• Automatic load disconnection;• Special transmission line tripping schemes.
Dynamic instability refers to a condition where the control systems of gen-erators interreact in such a way as to produce oscillations between generatorsor groups of generators which increase in magnitude and result in instability,that is, there is insufficient damping of the oscillations. These conditions canoccur either in normal operation or after a disturbance.
RESULTS OF INSTABILITY
In cases of instability, as the generator angles separate, the voltage and currentangular relationships at points on the system change drastically. Some of theprotective line relays will detect these changes and react as if they were dueto fault conditions causing the opening of many transmission lines.
The resulting transmission system is usually segmented into two or moreelectrically isolated islands, some of which will have excess generation andsome will be generation deficient. In excess generation pockets, the frequencywill rise. In generation deficient pockets, the frequency will fall. If the fre-quency falls too far, generator auxiliary systems (motors, fans) will fail, causinggenerators to be automatically disconnected by their protective devices. Indus-try practice is to provide for situations where there is insufficient generationby installing under frequency-load-shedding relays. These relays, keyed tovarious levels of low frequency, will actuate the disconnection of blocks of customer load in an effort to restore the load-generation balance.
In situations where the frequency rises because of excess generation,generators will be automatically removed from service by protective devicesdetecting an overspeed condition. If studies indicate potential excess genera-tion pockets, special, selective generation disconnection controls can beinstalled.
40 BASIC ELECTRIC POWER CONCEPTS

4
41
This chapter discusses customer electric energy requirements. Industry prac-tice is to refer to these requirements as “customer load”. To supply customerload, the power system must also supply the losses in the system that deliversthe energy.These losses are typically between 7% and 12% of the power deliv-ered to consumers, larger than any single consumer.The power system plannermust forecast and provide capacity to meet these needs.
END-USES FOR ELECTRICITY
Electricity serves a wide variety of end-uses. Each customer served by an elec-tric utility has his own unique set of electric use requirements. Individual cus-tomer requirements for electric energy vary in magnitude and timing andreflect an almost endless array of devices employed individually or in combi-nation with other devices. Among the principal categories of electric end-useequipment are:
• Electric motors;• Electric furnaces;• Lighting equipment;• Space conditioning systems;
ELECTRIC ENERGYCONSUMPTION
Understanding Electric Power Systems: An Overview of the Technology and the Marketplace, byJack Casazza and Frank DeleaISBN 0-471-44652-1 Copyright © 2003 The Institute of Electrical and Electronics Engineers

• Electric communications and computing devices;• Machine tools; and• Electrolytic devices.
Within each of these principal categories a wide variety of specific applica-tions can be found. For example, electric motors include such sub-categoriesas compressors, pumps, fans, and conveyors. Furthermore, even within suchsub-categories specific types of equipment may differ substantially in size,efficiency, and time pattern of electricity requirements.
CUSTOMER CLASSES
Customers of electric utilities also differ widely in their requirements for elec-tricity. Such differences are reflected in both the timing and magnitude ofrequirements. Although each electric utility customer tends to have a some-what unique pattern of electricity use requirements, customers are frequentlysegregated into classes of use for technical, administrative, and regulatory pur-poses. The primary classes of electric customers separate users into residen-tial, commercial, industrial, and agricultural sectors. Some specific utilities,however, may identify other primary classes of customers. For example,generating utilities may have wholesale power customers. Customers in thisclass generally include other generating and non-generating utilities, whichgenerally resell the purchased power to their own retail customers.
Other retail classes of customers may include street lighting systems,electric rail systems, churches, and governmental users of electricity. Still other customers are considered preference customers. These are typicallyfound on federal- or state-owned utilities (Bonneville Power Administration,Southwest Power Administration, Tennessee Valley Authority, and PowerAuthority of the State of New York). These utility systems were developedspecifically to provide electric service to these customers, who therefore mustreceive all of their electrical requirements at the lowest costs before powercan be sold to other customers inside or outside the service areas of thesesystems.
Within these broad classes of service, customers may be further segregatedon the basis of other technical and administrative parameters. Common dis-tinctions of this type include:
• Phase and/or voltage level of service;• Whether service is from underground or overhead facilities;• The magnitude and/or timing of requirements;• Type of specific end-use or major end-use requirement;• Physical location of the end-use activity; and• Quality or reliability of service provided.
42 ELECTRIC ENERGY CONSUMPTION

In the United States, retail sales to the three major customer classificationsare approximately equal in magnitude for the year 2000, as shown in Figure4.1. While retail sales have grown 23.6% since 1991, the mix of its componentshas changed, with the commercial sector’s share of the total growing from27.4% in 1991 to 30.4% in 2000 and the industrial sector’s share dropping form34.3% to 31.4% over the same period.
RATE CLASSES
Such distinctions in the character of service provided are frequently the basisfor the establishment of rate classes for regulatory and rate setting purposes.For example, within the residential sector separate rate classes are often estab-lished for customers with electric space heating, or electric water heat, require-ments. Some electric utilities have special rate classes for all electric homes.Commercial and industrial customers may constitute separate rate classes ormay be grouped together in general service rate classes.Also, within the broadcategory of general-service customers, separate rate schedules may be estab-lished on the basis of the magnitude of customer requirements, type of cus-tomer end-use, and the quality of service provided.
Definitions of rate classes may vary substantially among utilities and,between service jurisdictions within the same utility. A single utility, which provides service in more than one regulatory jurisdiction (e.g., more than one state), is likely to have a different set of rate class definitions in each jurisdiction.
Some states require that major electric systems provide daily kilowattdemand load curves for each electric consumer class for which there is a sep-arate rate. This means that major electric consuming devices (such as air con-ditioners, water heaters, and space heating systems in residential dwellings)
RATE CLASSES 43
CustomerClass
Millions kWhrsin 2000
% of Total
Residential 1,192,446 34.9%
Commercial 1,055,232 30.8%
Industrial 1,064,239 31.1%
Other 109,496 3.2%
Total 3,421,414 100.0%
Figure 4.1. Customer electrical consumption 2000.‡‡‡
‡‡‡ Source—EIA Table 44, Electric Utility Sales by Sector—Includes energy service provider(power marketer) data.

must be sub-metered for a sample of customers. For other load research activities, utilities will occasionally measure the consumption patterns of cus-tomers on a single transmission or distribution circuit from substation or trans-former locations. These and other aggregate measures of consumption mayalso be used in the planning and operation of an individual utility’s system,power pools, or reliability councils.
DEMAND AND ENERGY
The metering of electric utility service typically involves measurement of theamount of electricity used over a period of time and/or measurement of therate (or rates) of use during the same period. Measures of the rate of use aremeasures of “demand”, and they are usually stated in terms of watts or kilo-watts (i.e., 1,000 watts). A customer who turns on a 100-watt light bulb createsan instantaneous demand of 100 watts on the electric system. If that light bulbwere to operate continuously for one hour, 100 watt-hours of electricity wouldbe consumed. The watt-hours of consumption represent the “energy” measureof the customer requirements. If ten 100-watt light bulbs were operated con-tinuously for one hour, the customer would consume one thousand watt-hours,or one kilowatt-hour, of electric energy.
Consumer demands (i.e., the rates at which customers consume electricity)are not generally measured on an instantaneous basis. Instead, measures of customer’s demands generally compute an average level of usage over arelatively short period of time. The most common periods for measuring cus-tomer demands are 15-minute, 30-minute, and one-hour intervals. However, inspecial circumstances, demand measures as short as one minute, or as long asthree hours have been employed. A daily pattern of electricity use for a utilitysystem is shown on Figure 4.2.
ENERGY
For billing purposes, electricity consumption by smaller customers (e.g., resi-dential and small general-service customers) is typically measured only interms of the kilowatt-hours consumed. Only rarely are the maximum demandsof smaller users of electricity directly metered. As the magnitude of customerrequirement increases, the importance of measuring the maximum rate of con-sumption by the customer also increases. Most utilities install meters whichmeasure both kilowatt-hour consumption and maximum monthly demands for all customers that have a pre-established consumption level. For example,a utility may require demand metering for all customers whose monthlydemands are expected to exceed 25 kilowatts and/or for all customers whosemonthly consumption exceeds 6,000 kilowatt-hours. For certain very large cus-
44 ELECTRIC ENERGY CONSUMPTION

tomers or classes of customers, demands may be measured on a continuousbasis (as opposed to just monthly maximum) for every 15-minute, 30-minute,or hourly period throughout a month.
The recent trend toward time-of-use rates (i.e., the cost per kilowatt-hourvaries at various times of the day) has also required the metering of energyconsumption and/or maximum demand by time-of-use periods. These ratesrequire metering of consumption for discontinuous periods within each billing month. For example, one utility defines its peak period for largegeneral-service customers to include all weekday hours between 12 noon and8:00 p.m.
EFFECTS OF LOAD DIVERSITY
There are two types of load diversity—that of different peak loads betweencustomer classes, and that of different peak loads at different hours of the dayand days of the year.
From continuously recorded demand data, a number of different demandmeasures may be derived. The most commonly metered measure of customerdemand is individual customer maximum demand. This measure indicates the
EFFECTS OF LOAD DIVERSITY 45
0
5000
10000
15000
20000
25000
30000
1 2 3 4 5 6 7 8 9 10 11 12 13 14 15 16 17 18 19 20 21 22 23 24
Hour
Meg
awat
tsNYISO Load Forecast 8/21/02
Figure 4.2. Daily pattern of summer weekday electricity use for New York State.††
†† Source—NYISO Website.

highest demand level incurred by the customer during any metering intervalin a billing period. Due to varying types and uses of electrical equipment acrosscustomers, there are broad differences in the times that customers achievetheir individual maximum demands. For example, one customer whose majoruse of electricity is outdoor light may regularly experience maximum demandin the late evening hours of the day; while a second customer, whose majorrequirement for electricity is for air conditioning, is more likely to experiencea maximum demand during afternoon hours in the summer months. Further-more, the electrical load requirements of an industrial process may be closelytied to work shift hours, or may be nearly flat throughout the 24-hour day ifthe process operates on a continuous basis.
These differences in the timing of individual maximum demands arereferred to as diversity. Diversity in load requirements not only exists amongindividual customers, but also can be observed among rate classes, customerclasses, jurisdictional divisions, utility systems, and power pools.
The inverse of diversity is coincidence. Coincident demand measures themaximum amount of load which occurs within a given measurement interval.If a customer has two or more electricity consuming devices at their facility,or residence, the customer’s individual maximum demand will occur at thetime at which the requirements of the individual devices are most highly coin-cident (i.e., demonstrate the least diversity).The sum of the maximum require-ments of the individual devices will always be greater than, or equal to, thecustomer’s individual maximum demand.
Other measures of individual customer demands tend to relate the indi-vidual customer’s requirements to rate class, customer class, jurisdictional, orsystem requirements. Owing to diversity among customers, each individualcustomer’s contribution to class, jurisdictional, or system maximum require-ments, cannot be greater than, and tends to be less than; the customer’s indi-vidual maximum demand.
System, jurisdictional, class, or customer demand are typically measured onan annual, monthly, or daily basis. However, billing data (both demand andenergy measures) typically do not correspond directly to calendar month orcalendar year measures. Usage reported on a bill in January, for example, mayinclude substantial amounts of consumption which occurred in December ofthe previous year. This occurs because cost-effective meter reading and billprocessing schedules generally require that not all meters be read on the sameday but rather some are read on each working day of each month. Each cus-tomer is billed based on his metered consumption in the prior billing cycle.Measures of actual requirements on a calendar month basis are not availablefor individual customers, except where expensive continuously recordingdemand meters are installed.
At the system level, monthly aggregate requirements are usually deter-mined by adding net electricity interchange into and out of an area to the netgeneration within the area from continuously recorded data typically main-tained by utilities at the generation and transmission levels.
46 ELECTRIC ENERGY CONSUMPTION

SYSTEM LOAD
The sum of each customer’s coincident demand contributes to the “native”load of a utility system. This is the requirement for electric power placed onthe utility’s physical system by customers located within its franchised servicearea. It includes the actual customer requirements plus any electrical losses onthe transmission and distribution system which are incurred when supplyingthese customer requirements. These losses are typically from 7% to 12% ofcustomer energy consumption and as much as 50% of total system reactiverequirements.
In addition to customer requirements and electrical losses, the electricutility’s generating equipment must also provide electric power for the utilityto operate its equipment. This includes the electricity needed to run variousauxiliary devices within the generating stations (pumps, heaters, motors,etc.) and is known as “station service.”This is typically about 5% of the energyproduced in steam-generating plants, and less for gas turbines and hydroplants.
Net peak system demand is the load used for planning purposes. Thisincludes customer loads and system losses, but not the “station service.” Figure4.3 is a typical annual load duration curve which shows that the peak loadoccurs for only a small percentage of hours each year. In many areas becauseof the weather sensitivity of customer demand, there are usually only a fewpercent of the hours in a year when the system load is at or greater than 95%of the peak load.
The net generation on a utility system includes net system load, plus orminus purchases or sales to other utilities. This load is sometimes called totalload.When load data are obtained from utilities, it is essential that it be clearlydelineated whether native load or total load is desired. It is also important thatnet loads be obtained since this is the industry norm.
The load experienced in any one area varies both daily, weekly and
SYSTEM LOAD 47
0% 100% % YearHours
0
Peak Load
mW
Figure 4.3. Annual load duration curve.

seasonally.This variation is measured by a quantity called a load factor.A loadfactor is defined as the ratio of average load to peak load during a specificperiod of time, expressed as a percent. Residential loads tend to have poorerload factors than industrial loads. The lower the load factor, the lower the fullutilization of installed generating and distribution capacity.
The diversity in customer peak loads can result in situations where the timeof the peak load in a specific geographic area may differ from the time of thesystem peak, that is, a residential area peaking in the evening while the systempeaks during the late afternoon.
LOAD MANAGEMENT
Until the 1970s, emphasis was placed on ensuring that sufficient generatingcapacity was available to meet the peak load. That emphasis, however, wasextremely expensive because of the rising cost of building generation plants,some of which only were needed for a few hours each year. Utilities institutedprograms to manage demand so that the peak load could be reduced toobviate the need for the additional generating capacity.
Load can be reduced by the utility by charging more for power at certaintimes of the day or year, or it can be controlled directly by the electric utility(load management).1 In load management, the electric company connects acontrol device to one or more appliances on the customer’s premises. Duringperiods of high demand, the electric company turns off the appliance for aperiod of time, thereby making it less necessary for the utility to keep gener-ating reserves. In a sense, the utility has created additional interruptible cus-tomers. Tests indicate that, for many systems, the cost of load managementequipment per KW of demand reduction is far less than that of capacity addedto meet each KW of additional demand. However, the reduction in tariffrequired for customer acceptance may be quite large.
Although the exact definitions vary considerably, utility load managementtechniques are usually divided into two major classes: direct control, in whichthe utility controls end-use devices by means of supervisory control, and in-direct control, for which load shifting is left to the discretion of the customerby provision of price incentives. It is not immediately clear how interruptibleservice contracts would be classified in such a partitioning. Some define twoslightly different classes, namely: active load management, which permit theutility to control, interrupt, or displace a fairly precise quantity of load for afairly precise time interval, to accommodate a fairly specific need and passiveload management, which is subject to customer whim, and may or may not
48 ELECTRIC ENERGY CONSUMPTION
1 Over the longer range electric load can also be reduced by improvements in the design of moreefficient lighting, motors and so on. Appliances such as refrigerators and air conditions haveenergy efficiency ratings.

result in an optimum benefit to the utility. In this case, the former class clearlyincludes interruptible service as an active load management technique.
For the purposes of this discussion, the two classes will be designated utility-controlled load management and customer-controlled load management.Utility-controlled load management shall include all load modification (or dis-placement) measures over which the utility retains complete control to imple-ment or not, as the need arises. Customer-controlled measures, on the otherhand, not only include measures over which the customer maintains completecontrol, but also fixed load control agreements (such as preset, timed switchon a water heater), which, from the moment to moment, are not under thedirect control of either party.
A classification of various utility-controlled and customer-controlled loadmanagement practices is presented in Figure 4.4. As the figure shows, utility-controlled measures are divided into those such as storage and pooling, whichtends to increase the amount of capacity during peak systems, and those suchas interruptible service or remote load control, which attempt to reduce theload at these times. In either case, the net effect is to increase the differencebetween available generating capacity and system load during peak periods.All of the utility-controlled techniques listed may be used to reduce eitherdaily or seasonal variations in system load.
Figure 4.4 also shows two classes of customer-controlled load management.The first of these includes all those measures taken by customers to meet theirown end-use requirements for energy during utility peak periods. Such meas-ures include self-generation and energy storage. The second class includes any customer-initiated actions to either deter or curtail specific end-use loadsduring utility-defined peak demand intervals. These actions may be basedeither on some negotiated contract or agreement between the customer andutility or on the customer’s voluntary response to other incentives, such as timeof day rates.
LOAD MANAGEMENT 49
Utility Controlled Customer Controlled
Supply Side Demand Side Backup or Storage End-UseModification
Energy Storage Interruptible Power On-Peak SelfGeneration
Load Deferral
Power Pooling Remote Control ofCustomer Load
Customer EnergyStorage
Load Curtailment
- Under contract- Voluntary
response toincentives
Figure 4.4. Possible classification of utility load management techniques.

REACTIVE POWER
So far in this chapter we’ve talked about real power. As discussed in Chapter 3, there is another aspect of power, that is, reactive power, which isneeded by equipment that involves the use of coils or motors, and so forth,requiring a magnetic field for proper operation. These devices look like aninductive load to the system and engineers refer to this effect as resulting ina lagging power factor on the system.
This reactive power can be provided from a number of sources, one of whichis the generators on the electric power system. Other sources are capacitorsconnected between lines and the ground (called “shunt capacitors”) and thecapacitance effect of high-voltage cables and long-distance overhead trans-mission lines.
A power system will not function properly and will not remain in opera-tion unless sufficient reactive power is available equal to the reactive loadsplus the large reactive losses on the system.
FORECASTS
To a large extent, the business of the electric power industry is driven by fore-casts. Forecasts of peak electric demand are used as the basis of long-rangedecisions for generation, transmission and distribution additions. While anaggregate forecast is usually suitable for generation planning purposes, theforecast has to be disaggregated for transmission and distribution planningpurposes.
Forecasts of energy requirements are also used. These forecasts can be ona sendout basis or on a sales basis. The difference between sendout and salesis that sendout is the quantity measured at the output of the generators andis, in essence, “real time”. Sales data, on the other hand, is that informationobtained from the meters at customer’s premises and is usually the total elec-tricity used by the customer in the prior month (or “billing cycle—the periodsince the customer’s meter was last read”).
Sendout forecasts are used in the planning of generation resources sincecustomer energy requirements determine the amount of fuel needed for gen-eration. Sales forecasts are usually the basis of the revenue forecast neededfor financial planning and rate making purposes.
Forecasts are usually prepared annually taking into consideration the mostrecent experience. Many participants base their forecasts on presumedweather conditions, that is, a temperature and humidity standard, basedperhaps on the weather experience in a previous number of years. The experi-enced peak loads and energy sendout and sales are “weather normalized” andthese values are used as the starting point for the forecasts.
The time horizon for peak load forecasts is driven by the planning cycle.There is no industry-wide magic horizon year for the forecast since the plan-
50 ELECTRIC ENERGY CONSUMPTION

ning cycle differs form area to area, driven in large part by the time it takesto obtain state regulatory approval for new generation and transmission facil-ities. Generally speaking, in recent years, the lead time to construct new gen-eration has decreased and the forecast horizon has also decreased. FERC, inits July 31, 2001, Notice of Proposed Rulemaking on Standard Market Design,indicates that Independent Transmission Service Providers will be required toforecast demand for a planning horizon of 3 to 5 years. Many consider theseperiods to be insufficient.
Energy and revenue forecasts tend to be driven by individual system andregulatory needs. In some states rate cases are based on forecast test years,requiring sales and revenue forecasts as inputs to a projected revenue require-ment analysis.
Every forecast, since it depends on assumptions, has a degree of uncertainty.The longer the period the forecast covers, the greater the uncertainty. From aplanning perspective, this creates a two edged sword—forecast too low andthere may not be enough generation to supply customer load; forecast too highand revenue will be less than expected creating economic problems.
There are a number of approaches used to forecast peak demand. The mostelementary being extrapolation of experienced loads. This technique assumesthat the underlying customer usage pattern remains the same. This techniquehas applicability in short-term day-to-day and week-to-week forecasts foroperating purposes.
Forecasts can be either “top down” or “bottom up”. A top down forecast,called an econometric model, relates the future total system load to a set ofmacroeconomic assumptions. A variety of statistical modeling techniques areused to relate prior load to one or more explanatory variables. Various meas-ures of employment, gross domestic product (GDP) values, and energy pricesare among the more commonly used variables. Forecasts of these variables aremade and used to drive the forecast. The forecasts can be based on a singlemodel for an entire service area or there can be a number of models for dif-ferent customer classifications, that is, residential, commercial, and so forth,each with its own explanatory variables.
A weakness of this approach is that, since it assumes that the underlyingelectrical uses remain the same as in the past; it does not capture the impactof new technologies or of significant changes in the underlying customer usagepatterns. For example, a model based on 1970 and 1980 load data would nothave captured the effect on aggregate load of the large influx of personal com-puters experienced in the 1990s. Models based on data from even the early1990s wouldn’t capture the trend for employees to work at home instead ofin large office buildings.
A solution is to define the particular equipment of each customer class andits energy usage called an end-use approach. The forecast relates the futureload to known or assumed changes in the stock of individual energy consum-ing devices.A residential customer might be identified by the number and typeof its appliances, its cooling and heating systems, its lighting, and so on.
FORECASTS 51
Using a residential end-use model the forecaster can explicitly addressissues of turnover of appliances, appliance efficiencies, DSM impacts, new tech-nology impacts and so on. This flexibility comes at a cost, that is, the largevolume of information that is required. An aggregate consumption is devel-oped for each customer and then for all the customers of the same type. Thisapproach requires information on the types of appliances customers have, theelectrical requirements for each including information about its age and effi-ciency (to factor into the forecast the effects of appliance turnover with newer,higher efficiency devices), the types of equipment they are buying, the averagetime period each is used and the coincidence factor of usage patterns betweencustomers.
Commercial end-use modeling is more complicated than residential end-use modeling because of the complexity of the systems employed by these cus-tomers and the attendant problem of acquiring the necessary data about them.The Commend Program developed by EPRI defines twelve building types, tenend-uses and four fuel types (to allow for evaluation of the potential of sub-stitution of alternate energy sources for electricity). The squared footage foreach building type must be provided as well as an energy use per square foot.Changes in the customer base, for example, new office space coming intoservice, can be factored into the model.
Industrial customer end-use models are generally not used because of thevariety of individual industries that comprise the sector, each one requiring its own model.
One approach, sometimes called the bottom-up approach, applies some ofthese techniques to smaller areas or regions, which are then combined to largerregion totals. This bottom-up approach has the advantage of diversity ofassumptions. Some forecasts may be high, some low with errors compensat-ing. With the top-down forecasts, if a major assumption is in error the entireforecast is in error.
In some instances a combination of techniques is used, an end-use modelfor residential load, an econometric model for commercial load and an extra-polation of prior load adjusted for known changes (plant openings or closings)for industrial load.The modeling techniques selected are determined to a largeextent by the size and types of the electric load, the availability of data andthe resources available to the forecaster.
LOSSES AND UNACCOUNTED-FOR ENERGY IN THE DELIVERY SYSTEM
All the energy that leaves the generating stations is not reflected in the billssent to customers.The difference is attributable to two issues.The first is calledunaccounted-for energy. This energy is not metered by the local utility and isusually due to theft of service. In some underdeveloped countries this cate-gory can be as much as 50% of the energy generated. The second is the losses
52 ELECTRIC ENERGY CONSUMPTION
in the system directly related to the electric characteristics of the deliverysystem. They are an important consideration when selecting new electricpower policies, when locating new generating plants, when deciding what generator to run to supply the next increment of load, when deciding on thevoltage level and conductor sizes for new transmission and when deciding onthe amount of voltage support to provide.
Losses occur in both lines and transformers. Line losses are directly relatedto the square of the value of the current (I2R). The greater the amount of elec-tricity the delivery system carries, and the greater the distance the greater theamount of energy lost as heat. Transformer losses are of two types: no-loadloss and load loss. No-load losses are related to hysteresis and eddy-currentloss in the transformer core and are independent of the current. Transformerload loss is related to I2R. The no-load losses vary as the third to fifth powerof the voltage and increase significantly when voltages are outside of designrange.
Transformer manufacturers consider the amount of losses as one elementof the requirements when designing a transformer. Typically, the cost of antic-ipated losses is a tradeoff with the capital cost to purchase the transformer.Losses can be reduced by increasing the size, and hence the cost, of a trans-former. Rustebakke2 reports that the total losses at rated transformer outputamount to approximately 0.3–0.6% of the rated kiloVolt-Amperes of the unit.On most power systems load losses are 60% to 70% of total losses with trans-former no load losses being from 30%–40%. In recent years, as the wholesaleelectric power market has been deregulated; new dispatch procedures and theincreased flow of electricity on the bulk transmission system over longer dis-tances without a commensurate increase in transmission capacity has causedan increase in transmission losses.
LOSSES AND UNACCOUNTED-FOR ENERGY IN THE DELIVERY SYSTEM 53
2 Rustebakke, Homer M. 1983, Electric Utility Systems and Practices, Fourth Edition, Wiley, NewYork.


5
55
Generation is the process of converting energy resources into electric powerand energy, in order to be able to supply customer electricity requirements at all times. In describing the function of electric generating units, it is usefulto view each unit as a complete system with input (fuel) and output (electri-cal energy). Between the input and output are various energy conversiondevices—boilers, engines, turbines, electric generators—which convert energycontained in fuel to thermal energy (heat), thermal energy to mechanicalenergy and, finally, mechanical energy to electricity.
The generation of electric power is accomplished through the coordinatedoperation of several hundred physical components. The specific processdepends on the types and sizes of plants. Some of the more general elementsof electric power generation are best understood by reviewing the varioustypes of plants and their characteristics.
In order to analyze, operate and plan generating systems, certain types ofdata are usually required, for example, efficiency data, such as heat rates, theamount of fuel required to produce a kilowatt-hour of electricity. This infor-mation, along with the fuel cost, is used in scheduling the division of loadamong the various generators on the system. For more than 80 years this wasdone to minimize total production costs. Since restructuring, this informationis used by the plant owners to determine their prices and maximize theirprofits in the selling of bulk electric power.
The assurance of sufficient capacity is another requirement for a generat-ing system. For this purpose, equipment breakdown data, outage data and
ELECTRIC POWER—GENERATION
Understanding Electric Power Systems: An Overview of the Technology and the Marketplace, byJack Casazza and Frank DeleaISBN 0-471-44652-1 Copyright © 2003 The Institute of Electrical and Electronics Engineers

maintenance requirements are essential. Through the availability of such data,reliability analyses can be made to determine the adequacy of the total amountof generating capacity provided to meet the maximum demand that will beput on the system ay a given time.
It is also important that generating systems have sufficient fuel available orin storage for various types of future requirements if fuel supplies are dis-rupted for any reason. Data for this purpose, and for minimizing fuel costs,must be kept.
TYPES OF GENERATION
Many types of generating plants are in use and possible for the future, includ-ing steam plants fueled by coal, oil, or gas, nuclear plants, hydro plants andplants which use renewable energy. Most types of electric generating units canbe grouped by prime mover—the type of device that drives the electric gen-erator. The types of prime movers in use in the United States today are:
• Steam turbine;• Combustion turbine; and• Reciprocating engines.
Different fuels may be used for the various types of primer movers. Thesource of heat can be from the burning of coal, oil, gas or the heat given offin a nuclear reactor.
Steam Turbines
In a steam turbine generating plant fossil fuels (coal, oil, gas) are burned in afurnace. (In a nuclear plant heat is produced as a result of a nuclear chain reac-tion.) The heat given off by this combustion is used to heat water in a boilerto such a temperature that steam is produced. This steam (which may be ashot as 1,000 degrees F and at pressures as high as 3,600psi) is then passedthrough one or more turbines. Energy contained in the steam is extracted byallowing the steam to expand and cool as it passes through the turbine(s). Thisenergy turns the blades of the turbine, which are connected to a shaft. Thisshaft is connected to the electric generator and rotates the coils of the mag-netic field of the generator, thus producing electricity. After passing throughthe turbine, the steam passes through a condenser, where it is cooled andbecomes water for reintroduction to the boiler.
The functioning of a steam plant requires many pumps, fans, and auxiliarydevices, particularly important are the feed water pumps, which force waterthrough the boilers, the forced and induced draft fans, which provide sufficientair for the combustion in the boiler, and the system that injects the fuel into
56 ELECTRIC POWER—GENERATION

the boiler.After leaving the turbine additional heat is extracted from the steamin feed water heaters, heating water going to the boiler. The steam is then con-densed and fed back into the boiler. Differences in the fuel used to produceheat will result in design and equipment differences for each generatingstation.
Combustion (Gas) Turbines
Combustion turbines are most often fueled by gas but can be fueled with someliquids. In a combustion turbine hot gasses (ignited fuel–air mixture) burn, areexpanded through a turbine, driving a generator. An additional component ofa combustion turbine is a compressor. This device increases the pressure ofthe air used in the combustion section by a factor of approximately 10. Whenthe air is compressed in this manner, its temperature is increased. The result-ing combustion of this heated air and fuel mixture raises the temperature ofthe gas to as much as 2,000°F. This gas is then passed through a turbine, whereit is cooled and expanded. The dissipated energy turns the turbine, which, inturn, runs an electrical generator. Gas turbines are not as efficient as steamplants, but are considerably lower in capital costs. For this reason they areoften used as “peaking” plants to supply peak electricity needs.
There are several variations on this basic design, each attempting to makemaximum use of the energy input to the system. In some cases the turbineexhaust gases are used to preheat air prior to combustion. In other cases, theexhaust is used to heat steam in a boiler to operate in conjunction with a smallsteam turbine generator. This is known as a combined cycle plant. Combinedcycle plants have excellent efficiency since a considerable amount of theenergy in the gas turbine exhaust is recovered. Gas-fired combined cycle gen-eration plants are currently the units of choice in the United States.
Hydro Turbines
Electric power is produced from water by directing a column of falling waterpast the “fins” of a hydraulic turbine. In a typical hydroelectric power plant,water is contained behind a dam. This dam causes the water level to rise. Asa result, potential energy is stored in the water. To produce electricity, thewater is made to flow through a turbine to a lower level. The difference in ele-vations between the two water levels is called the “head”. In hydroelectric gen-eration, the amount of electric energy that a given column of water is capableof producing varies directly with the head.
In the most common configuration, the hydraulic turbines and electricalgenerators are located at the site of the dam. However, it is not uncommon tohave the turbines and generators located several miles downstream from thedam. Under this arrangement, water flows through a large pipe or “penstock”from the dam to the turbines.
There are several types of hydroelectric plants in use today. In the simplest
TYPES OF GENERATION 57

form, a stream or river is diverted to pass through a hydraulic turbine.However, daily and seasonal variations in stream flow will cause the output ofthe hydro project to change.To deal with this situation, storage ponds are built.A portion of the stream flow is diverted into the storage facility during normalor high-flow conditions. Then, at low stream flow times, the water from thestorage pond is released, thus maintaining the electric output of the project.
Pumped Storage
In still other configurations, water is stored in a lower reservoir and pumpedto a higher elevation reservoir at night by using low-cost electrical energy pro-duced by the utility’s thermal plants at off peak times. During the peak loadhours, the water is released from the upper reservoir and passed through aturbine or turbines, which drive electric generators. Often these turbine gen-erators are reversible and used to pump the water in the lower reservoir backto the upper reservoir the next night. This type of hydroelectric station isknown as pumped storage. On a net basis pumped storage plants do notproduce electric energy but, in fact, consume energy, since about a third of theenergy stored is lost in the process. They also perform a “relay” function. Theyreceive low-cost energy produced at one time and place, hold it for a while,and then pass it on for use at another time in other places when alternateenergy sources would be more expensive.
Nuclear Units
Nuclear units utilize a nuclear reaction as a source of heat for a conventionalcycle. There are two primary designs used for nuclear reactors; boiling waterreactors and pressurized water reactors. At the time of this writing, there areslightly more than 100 operating nuclear power units in the United States. Nonew nuclear units have been installed in the United States for many yearsbecause of concern over capital costs and safety. As nuclear units age, someowners are requesting extensions of their operation licenses. Other nuclearunits are being retired.
Reciprocating Engines
This type of generation usually consists of a large diesel engine which uses �2diesel fuel as a source of energy. Electricity is produced by connecting theoutput shaft of the engine to an electrical generator. Diesel engine improve-ments have resulted in considerable reductions in weight and improvement inefficiency.
Micro Turbines
These are small turbines that can be located at or near the customers. Theycan be installed on the customer’s side of the meter or on the distribution or
58 ELECTRIC POWER—GENERATION

subtransmission system, depending on their size. They are usually fueled fromthe natural gas supply available.
Other Forms of Generation
There are other methods of producing electric power that currently contributeonly small amounts to the total electric power production. There has been arenaissance, however, in the development of many new “small” technologiesas fuel costs have increased. These technologies use sun, hydro, and othersources of energy to produce electricity. These methods include fuel cells,photo voltage cells, windmills, and so forth. A comparison of some of thesesmall technologies is shown on the Figure 5.1.
TYPES OF GENERATION 59
Dispersedtechnology
Typica lSize
Cost Compared to ConventionalPlants
Use ofScarceFuel
Resource s
Environmenta lImpact
ProbableDateOf
Introductio nInto Power
Systems
SpecialConsiderations .
Capital Operatin g Maintenanc e
Small windsystems
100 W-750 kW
L L L L L Now An intermittentpower source
Small scalehydro
1 kW –15 mW-
L L L L L Now Output variesseasonally;seasonal patternmay vary fromyear to year
SolarThermal 1-10
mWG L G L L 5 – 10 yrs Truly
intermittent;operates onlyduring daylight,output varieswith weather
Photovoltaics 1–500kW
G L L L L 5 – 10 yrs Same as above,also requiresvery largesurface area
Fuel cells 5kW-30 mW
E L G Dependson fuel
L 5 – 15 yrs Modular andexpandable, nomoving parts
Cogeneration 20-100mW
G L L Dependson fuel
Depends onfuel
now Electricaloutput typicallydepends ondemand forthermal output
Wastederived fuels
1–20mW
G L G Dependsonemissioncontrols
Depends onemissioncontrols
now Economics mayrequire fuelcost to be“negative”
StorageBatteries 0–5
mWE L L L L Depends on
technologyBattery life aconcern
CompressedAir
0–100mW
G E E L E now Limited sitesavailable
Microturbines 0-5 mW G E G G L now Limited siteavailability
Diesels 0-10mW
E E E G G now Limited siteavailability
Figure 5.1. Comparison of small dispersed power production technologies.§§§
G = Greater than, L = less than, E = equal to§§§ Some of the comparative data are derived from Cigre Paper �41-01
The interest in renewable energy sources has also spurred the developmentof improved methods for wind energy generating electricity. The wind is usedto drive a turbine, which drives a generator. Due to the variable nature of theenergy source, the speed of the wind turbine is not constant and machinesother than synchronous generators have been applied. These include induc-tion generators, dc generators, and variable reluctance generators. The furtherdevelopment of power electronic controls will doubtlessly result in new con-figurations for wind power generating systems.The effective generating capac-ity from wind power is considerably less than the capacity of the generatorsbecause there are periods when wind is not available.
Producing power directly from solar energy is not currently a significantfactor in electricity generation. However, this technology has attracted theattention of electric utilities and industry as an alternative for future energyproduction. Photovoltaics are semiconductor devices that convert solar radi-ation (sunlight) directly into electricity. While the electricity is essentially freein that there are no fuel costs, photovoltaics have not been widely used, evenin attractive climates due to the high initial investment required for thedevices, their inability to produce power during periods of darkness, and thelack of knowledge about how long they will last. They are economic, however,for applications where expensive extensions of wires is needed to providenormal electric service, for example, railroad crossings.
Both wind power and solar power may need to be complimented withenergy storage of some type to increase their effectiveness in supplying elec-tricity requirements of the system.
CHARACTERISTICS OF GENERATING PLANTS
Some of the more common characteristics used to describe electric generat-ing facilities are size, energy source, efficiency, type of use and availability.These elements are certainly not all inclusive of the information available todescribe this equipment. In practice, hundreds, if not thousands, of measure-ments dealing with unit operation are made and/or recorded on a daily, hourly,or continuous basis. Many of these measurements describe the operation ofthe individual components of the generating facilities rather than the entireunit or plant.
Of overriding interest, however, are the characteristics of the overall gen-erating plant consisting of a collection of fuel feeders, heat producers, energyconverters, exciters, and electrical generators which must be operated in orderfor electricity to be produced. A plant may consist of several gas turbines,several boilers supplying steam to two or more steam turbines which drive twoor more electric generators. A typical steam plant is shown in Figure 5.2, whilea typical hydro plant is shown in Figure 5.3.
60 ELECTRIC POWER—GENERATION

CHARACTERISTICS OF GENERATING PLANTS 61
CONDENSER
WATERTREATMENT
MAKE-UPFROM WATERSOURCE
BOILERFEED PUMP
STEAMTURBINE(S)
STEAM
STEAMBOILER
EXHAUSTGAS
EXHAUST GASPULLUTIONCONTROL
AIR
STACK
TO STATIONSERVICE
ELECTRICGENERATOR(S)
TO POWERSYSTEMPRIMARILY
PULVERIZERSAND CLEANERS FOR COAL
COOLINGMECHANISM
FUEL FUELPROCESSING
Figure 5.2. Schematic of conventional fossil steam power plant.
HYDRAULICTURBINE
PENSTOCK
PENSTOCK
DAMMED RIVER FLOW
TOSTATIONSERVICE
GENERATOR
WATER EXIT
TOPOWERSYSTEM
STREAM
Figure 5.3. Schematic of conventional hydro electric plant.

Size
The size of a generating unit is measured by the number of megawatts it canproduce for the electric power system. The capability of the unit may belimited by any of its components, for example, by the boiler, turbine, con-denser, generator, or step-up transformer. Every generating unit comes fromthe manufacturer with a nameplate attached to it. This “plate” gives thedesigned capability of the electric generator and the steam turbine. This infor-mation is not usually used in determining a generating unit’s actual capabil-ity. Both the mW and mVAr capabilities of generation are given in a capabilitycurve, such as that shown in Figure 5.4.
Actual capability is determined by tests conducted on a regular basis where
62 ELECTRIC POWER—GENERATION
PER UNIT KILOWATTS
AT RATED VOLTAGE
CURVE AB LIMITED BY FIELD HEATINGCURVE BC LIMITED BY ARMATURE HEATINGCURVE CD LIMITED BY ARMATURE CORE END HEATING
Typical reactive capability curves
LEA
D
P
ER
UN
IT K
ILO
VA
RS
LA
G
0
0.5
0.5
0.5 1.0
A 45 PSIG
A 30 PSIG
A 15 PSIG
A 0.5 PSIG
0.60 P.F.
0.70 P.F.
0.80 P.F.
0.90 P.F.
0.95 P.F.
0.98 P.F.
0.95 P.F.
0.85 P.F.0.80 P.F.
0.70 P.F.0.60 P.F.
0.90 P.F.
0.85 P.F.
B
B
B
B
B
BC
C
CC
D
Figure 5.4. Generator reactive capability curve.******** From Electric Utility Systems and Practices, 4th Edition, Homer M. Rustebakke, Wiley, NewYork.

the output of a unit is demonstrated over a set time period.The results of thesetests provide an indication of the maximum capability of the unit under normaland emergency conditions, that is, the ratings of the unit.
Depending on system conditions, such an ambient temperature, the dura-tion of the production period, and the need for maximum capability, even atthe expense of efficiency, generating units are given a number of differentcapability ratings which are usually different from the manufactures genera-tor nameplate rating. Normal practice provides for the establishment of netdependable capabilities and emergency capabilities for generating units.Sometimes ratings are established for various seasons such as summer andwinter, because of the effect of differences in ambient and cooling water tem-peratures. Net dependable capabilities are used for normal operation and arethe basis for most production costing and fuel-use studies. Under emergencyconditions, when extra capability is required to meet customer demand forelectricity, various auxiliary devices such as feed water heaters may be by-passed, thereby decreasing unit efficiency but increasing its capability. Emer-gency capabilities are sometimes used for reliability calculations coveringrelatively infrequent occurrences of short duration.
Gross and net values may be referred to when discussing the size or capa-bility of generating units. Gross capability is the output of a unit as measuredat the terminals of the electric generator. However, many of the pieces ofequipment used to operate the generating unit—crushers, pulverizers, pumps,building heaters, and so on—are themselves users of electric energy, typicallyabout 5% of the unit’s output in a steam plant. This electric energy is suppliedby the generating unit through a special auxiliary transformer and reduces the amount of the unit’s capability that can be delivered to the transmissionsystem. This internal use of electric power is referred to as “station service”and the resulting capability that can be delivered by the plant is known as thenet capability.
Generating units are built in sizes from a few kilowatts to over a thousandmegawatts. The units driven by internal combustion engines and combustionturbines are generally at the lower end of the size scale. Gas driven micro-turbines are the smallest. Steam units have been built as small as severalhundred kilowatts. Present day technologies and competitive economics aredetermining the best size of steam units. Figure 1.5 shows for the United Statesthe number of units and the total capacity installed by fuel type.
The net dependable capability can change with changes in cooling watertemperature, ambient air temperature, atmospheric pressure or the malfunc-tion of a non-critical component. For example, a coal-fired generating unit hasa number of pulverizers which grind the coal prior to combustion. The mal-function of one or more pulverizers could reduce the maximum fuel input witha resulting reduction in the capability of the unit. This is called a “partialoutage.”
The capability of a hydroelectric generating unit is determined by the sizeof the hydraulic turbine, the electric generator and the height of the water
CHARACTERISTICS OF GENERATING PLANTS 63

(head). The volume of water does not directly affect the maximum capabilityof the unit or plant, but rather affects the maximum amount of energy thatmay be generated in a given period of time. In practice, hydro units are gen-erally scheduled to operate when they can replace the highest cost thermalgeneration. If the volume of available water is limited, the amount dischargedper hour must be limited in order to permit the unit to operate for a desiredperiod of time. Thus the capability of the unit can be effectively reduced forthe period of low water conditions since the head will be reduced. When spec-ifying the capability of hydro units, it is important to know the assumed waterflow conditions on which the capability was based.
Efficiency
The thermal efficiency of a generating unit is a measure of the amount of elec-trical energy produced per unit of energy input. In the case of thermal units,the input is fuel and the means of measuring efficiency is called heat rate. Heatrate is defined as the ratio of the amount of fuel input (in BTUs) to a gener-ating unit to the amount of electrical energy obtained (kilowatt-hours).1 Theresulting value is in units of BTU/kWh. For thermal units, this ratio will changeas the output level of the unit is changed. In general, the efficiency of the unitwill increase (i.e., the heat rate will decrease) as the output level of the unit isincreased up to the normal rating of the unit.
A generating unit that is 100% efficient would use 3,412 BTUs of fuel toproduce 1 kilowatt-hour of electric energy. Modern day steam units have heatrates in the 9,000–10,000 BTU/kWh range. Newer combined cycles have lowerheat rates, some down to 7,000 BTU/kWh.
Dividing 3,412 by the unit’s actual heat rate and then multiplying by 100will give the overall percentage efficiency of a unit. When the heat rate is mul-tiplied by the unit cost of BTUs in the fuel, the unit cost of the energy pro-duction cost ($/kilowatt hour) can be determined.
Two basic kinds of heat rates are used—average and incremental. Theaverage heat rate simply defines the amount of fuel actually consumed foreach hour that the generating unit is operating at a given level of electricaloutput. The incremental heat rate gives the increase in thermal input requiredto produce an additional increment of electrical energy, also in BTU/kWh.Changes as output decreases are sometimes called the decremental heat rates.Both the incremental heat rate and the average heat rate are given in units ofBTU/kWh. Therefore, it is essential that the type of heat rate be defined whenrequesting or providing heat rate data.
64 ELECTRIC POWER—GENERATION
1 A BTU is the amount of heat required to raise the temperature of one pound of water onedegree Fahrenheit.

Availability
The operation of a generating unit requires the coordinated operation of hun-dreds of individual components. Each component has a different level ofimportance to the overall operation of the generating unit. Failure of somepieces of equipment might cause little or no impairment in the operation ofthe unit. Still others might cause immediate and total shut-down of the unit ifthey fail. The failure rates of all the various components of a generating unitcontribute to the overall unavailability of the unit. The unavailability of a gen-erating unit due to component failure is known as its “forced outage rate”. Itis expressed as a percentage of time and is a measure of the amount of timethe unit has been or might be unavailable to supply customer demand. Thenature of forced outages is that they are random occurrences over which theplant owner has little or no control. The usual definition of forced outage rateis the number of hours that the unit is forced out of service divided by the sumof the number of hours the unit is connected to the power system plus thetotal number of hours that the unit is forced out of service.
There are two types of forced outages: partial and full. Partial forcedoutages are reductions in the capability of the unit due to failure of a compo-nent. Full forced outages occur when a critical component of the unit fails andthe unit can no longer operate.This can happen in two ways: protective devicescan “trip out” the unit, removing it from service; or, the plant operators canshut the unit down to protect equipment or personnel. Equivalent ForcedOutage Rate (EFOR) is the term used to indicate the combination of full andprorated partial forced outage rates.
Another factor which contributes to unit availability is maintenance.Various components of generating units must be removed from service on aregular basis for preventive maintenance or to replace components before aforced outage results. Major maintenance would include turbine overhauls,generator rewinds and boiler retubing, for which complete shut-downs arerequired. In general, any condition requiring repair which can be postponedto a weekend is called a maintenance outage. If the unit must be removed from service during weekdays for a component problem, this is usually calleda forced outage. Forced outages are events whose specific occurrence can not be predicted but which can be described by using probability measures.Maintenance outages are events which can be scheduled in advance. This dif-ference is important in making analyses of total generator requirements for asystem.
In the real world there are major areas of judgment and discretion involvedin classifying availability data.They are often influenced by economic and reli-ability considerations. For this reason compilation and analyses of availabilitydata requires extensive judgment and experience.
CHARACTERISTICS OF GENERATING PLANTS 65

CAPITAL COST OF GENERATION
A key factor in selecting new generating facilities to be installed is their capitalcost. The capital cost is the amount invested in the construction of the plantor any major improvements which might be made. During construction pay-ments for equipment and contractors must be made. Those expendituresinvolve interest costs which must subsequently be recovered along with directcapital costs after the plant begins operating.
The combination of capital costs with those of fuel and operations andmaintenance (O&M) determine the total cost of producing electricity at aplant. As previously discussed, this can be determined on an average basis or an incremental basis from both a short-term or long-term perspective.Short-term incremental costs would include fuel and labor. Long-term incre-mental costs would include fuel, labor, and maintenance. Both the return ofcapital and the return on capital must be considered in determining long-termcosts.
TYPE OF USE
Generating units may be classified into three categories based on their modeof operation. These are:
1. Base Load;2. Intermediate;3. Peaking.
Base load units tend to be large units with low operating costs. They aregenerally operated at full capacity during most of the hours that they are avail-able. They are designed to operate for long periods of time at or near theirmaximum dependable capability. Their low operating costs result from theiruse of low-cost nuclear and coal fuels and/or lower heat rates (higher effi-ciencies) than other units on the system. For a typical region, base load is onthe order of 40% to 60% of the annual maximum hourly load and, since thisrepresents the amount of load that will be supplied in the region at essentiallyall hours, it represents perhaps 60% to 70% of the annual energy requirementsof the region.
Base load units are usually shut down for forced outages or maintenanceonly. Because of their size and complexity, these units may require from 24hours to several days to be restarted from a “cold” condition. Once the deci-sion has been made to shut down one of these units, periods of up to 24 hoursmay be required before another “start-up” may be attempted. When operat-ing a power system decisions on the time of restarting units play an importantrole in hour-by-hour schedules for generation.
66 ELECTRIC POWER—GENERATION

Intermediate units are those generating units which are used to respond to the variations in customer demand which occur during the day. They aredesigned to withstand repeated heating and cooling cycles caused by changesin output levels. Intermediate units usually have lower capital costs, and some-what higher heat rates (lower efficiencies) than base load units. The interme-diate load may be on the order of 30–50% of the maximum hourly load for atypical system and represents perhaps 20–30% of the annual energy require-ments for the utility.
Peaking units are those generating units that are called upon to supply cus-tomer demand for electricity only during the peak load hours of a given period(day, month, year). Combustion turbines, reciprocating engines and smallhydroelectric units comprise the majority of peaking units. These are ordinar-ily units with a low maximum capability (usually less than 150Mw), which arecapable of achieving full load operation from a cold condition within tenminutes. Peaking units usually have the highest heat rate sand lowest capitalcosts of the three categories of units. In addition to supplying system needsduring peak load hours, they may be called upon to replace the capability ofother base load or cycling units which have been suddenly removed fromservice due to forced outages. They generally supply about 5% of the totalenergy requirements of a system.
As generating units age, unit efficiency and performance generally decrease.In addition, newer, more efficient, lower operating cost units are continuouslyadded to a power system. These two occurrences tend to cause most generat-ing units to be operated fewer hours as they age.
LIFE EXTENSION
Most generating units were designed to have lives of 25–30 years.As units builtin the past are retired, utilities must replace the capacity lost. In some casesthe cost of performing major overhauls and modifications to those old units ismore economic than building new capacity. The plant owners evaluate theseoptions as part of their normal planning process.
The issue of life extension has become controversial because of the issueof enforcement of new source pollution standards. Under the Clean Air Act,existing power plants were exempt from the new standards. However, someolder units have been upgraded so extensively in association with life exten-sion programs that some maintain they are, essentially new units and, as such,should be subject to the standards.
SYNCHRONOUS GENERATORS
Essentially all of the world’s electric power is generated by synchronousmachines. The synchronous generator has proven to be a reliable and efficient
SYNCHRONOUS GENERATORS 67

device for converting mechanical power to electric power. Since the typicalpower system uses alternating current (60 Hz in the United States), the chiefrequirement of such a device is that it produces power at a controllable voltageat a constant frequency.A typical synchronous machine consists of a rotor witha field winding and a stator with a three-phase ac winding. The rotor has a dcpower supply and the stator is connected to the power system through a gen-erator step-up transformer. The turbine rotates the field at a constant speed,often as high as 3,600rpm.
If the stator windings are connected to a load, current flows through thewindings and the load. As the electrical load increases, the prime mover(turbine) must expend more mechanical energy to keep the rotor turning ata constant speed. Thus mechanical energy input by the turbine is being trans-formed into electrical energy. Generators in hydro plants are also synchronousmachines, but rotate at lower speeds than steam unit or gas turbines.
The electrical power produced by a synchronous generator is almost equalto the mechanical power input, the efficiency being in the range of 98%. Thedivision of electric load among a number of generators is determined by anumber of factors, including economics. At a given operating point eachturbine generator has an incremental cost, which is the cost per kWh to gen-erate an additional small amount of power. Maximum system economy resultswhen all generators are operating at the same incremental production cost.
The control of the real power and regulation of the speed (which must beheld constant to provide a constant frequency) is done with the speed gover-nor and automatic generator controls (AGC) and interaction with the systemcontrol center.
RESOURCE PROCUREMENT
Fuel provides the basic source of energy that is converted to electric powerby electric generating units. The primary fuels used for the production of elec-tric power are coal, oil, gas, nuclear fuel (uranium), and water. Solar energyand wind energy are presently contributing a negligible amount of the elec-tric power produced in the United States today.
The physical units of measurement used to record a quantity of fuel con-sumed are tons, barrels and cubic feet for coal, oil, and natural gas, respec-tively. The given quantity of water used in hydroelectric power generation canproduce varying amounts of electric power, depending on the distance throughwhich it falls, or head, which will change as the water level behind the damchanges. Similarly, the quantity of nuclear fuel used is measured in terms ofits total heat content or its ability to produce a certain amount of electricpower—kilowatt hours.
Fuel arrives at generating stations from many different sources and by dif-ferent modes of transportation. Even within a single utility system its gener-ating stations are likely to receive fuel from different suppliers and regions of
68 ELECTRIC POWER—GENERATION

the country. These differences in source of supply and transportation cost con-tribute to large differences in the delivered price of fuels and their quality.
Fuel Measurements
One of the primary means of measuring the quality of fuel is to record theamount of heat contained in a given quantity. For fossil fuels (coil, oil, gas) thisis usually given in units of BTU (British Thermal Units) per pound, gallon orcubic foot. The price paid by a utility for a quantity of fuel is usually keyed tothe heat content of a particular shipment. For instance, coal arriving at twodifferent generating stations from two different mines might have heat con-tents of 10,000 BTU per pound for one and 12,000 BTU per pound for theother. If both shipments were burned in identical generating units, one ton ofthe 12,000 BTU per pound coal would produce 20% more kilowatt hours ofelectricity than the 10,000 BTU per pound coal. It is for this reason that fuelprices are often quoted on a cost per BTU basis rather than a cost per ton,barrel, or cubit foot basis.
Other factors affecting the quality of fuels are the amount of non-combustible material contained in a given quantity. For coal and oil, most ofthese “impurities” are ash and sulfur. The amount of these elements containedin a shipment of fuel is determined by a chemical analysis conducted at thegenerating station and the results are given as percentage of the coal weight.
In quoting a price for a quantity of fuel, the supplier specifies the minimumheat content of the fuel as well as the maximum allowable quantity of otherimpurities. Any deviation from these specifications, as determined by theutility’s chemical analyses, usually results in an adjustment of price paid forthe shipment of fuel such that the quoted cost per BTU is maintained. Typicalfuel prices are shown on Figure 5.5.
The delivery of natural gas to power plants is on a more continuous basisthan either oil or coal deliveries. Consequently, measurement of fuel qualityis less rigorous and on a more sporadic basis than for coal or oil.
RESOURCE PROCUREMENT 69
Fuel Sulfur Content Price Range$/MMBTU
Oil:Heavy (No. 6) 1.50–3.50Light (No.2)
Low Sulfur 1.35–1.50High Sulfur 3.00–4.50
Gas 3.00–6.00Coal:
Low Sulfur 1.50–1.60High Sulfur 1.00–1.40
Figure 5.5. Typical fuel price ranges ($/MMBTU).

Fuel Transportation
The mode of transporting fuel from their source of supply to generating sta-tions varies from station to station. Coal is generally transported from themines to stations by rail. In some cases, due to the location of generating sta-tions and regional geography, a portion of the coal transportation route isaccomplished by barge over water. After delivery, the coal is deposited ontoa coal storage pile. From there it is fed by conveyors into the hoppers of thegenerating stations.These hoppers are large bins designed to hold enough coalto run the generating unit for up to 24 hours between refills, depending on theoutput level of the unit.
Before being fed to the boiler, the coal passes through a series of grindersand pulverizers which reduce the coal to the consistency of talcum powder.These fine particles of coal are mixed with air and “sprayed” into the boilerand burned. Oil and natural gas generally arrive at the generating system byway of pipelines. Although some storage of oil is maintained, there is a closercorrelation between delivery and use of these fuels than with coal. A largecoal-fired power plant might receive one 80-car coal train per day and main-tain as much as 90 days use in storage. Decisions have to be made betweenthe amount of coal reserves maintained at the generating station to guardagainst interruptions in supply and the cost of maintaining this inventory. Oiltends to flow into a power plant on a intermittent basis with storage facilitiesof about 30 days. Gas is usually taken directly off of a pipe line with no storageat the power plant.
Fuel Used
Gas is the main source of fuel for new generation. It causes a low environ-mental impact and is currently readily available. A major concern, however, isthe ability of gas pipelines to supply long-range future requirements and theability of the gas industry to meet both electric system and local heatingrequirements.
Coal is the predominant fuel used for the generation of electric power inthe United States. Use of coal requires compliance with environmental constraints given in the Clean Air Act and other legislation.2 Coal is usuallyclassified as high sulfur or low sulfur. The procedures to meet environmentalrequirements vary. Power plants have various devices such as precipitators andflue gas desulphurization systems to help.Another alternate that has been con-sidered for meeting environmental requirements is the fluidized bed boiler.
The most common type of oil used in steam electric generating stations isresidual or �6 oil. This grade of oil must be heated by burning higher (�2 oil)before it can be introduced into the boiler.
In addition to being used as a starting fuel and as a flame stabilizer (when
70 ELECTRIC POWER—GENERATION
2 See www.eia.doe.gov.

mixed with coal), �2 oil is also extensively used to run generators which aredriven by diesel engines. The quantity of �2 oil used for these purposes isusually small enough to permit delivery by tank truck with a minimal amountof storage.
Some fossil-fueled power plants operating in the United States today havebeen designed with the capability of burning more than one type of fuel. Thiscapability is usually designed into the combustion section or the furnace. Evenif fuel-handling equipment or alternate fuel-storage capabilities do not cur-rently exist at a power plant, this capability of burning an alternative fuelremains a valuable design feature. Over the past 15 years, the ability of burningalternate fuels in power plants has enabled utilities to mitigate the effects oflong-term disruptions and response to significant shifts in the prices of fossilfuels.
Fuel Purchasing
Each generator may obtain fuel from several sources under a mix of arrange-ments. Some generators have long-term contracts for most of their fuelrequirements with the price fluctuating over time but the quantity guaranteed.Other generators rely mainly on spot market purchase of fuels. Many gener-ators use a combination of both procurement strategies to help ensure a con-tinued supply of fuel at the lowest practicable price.
Emission Rights
Environmental legislation requires generators to have emission rights basedon the type of fuel burned in the unit. Emission rights are traded in an openmarket, helping to lead to a minimum cost solution to meeting environmen-tal requirements.
RESOURCE PROCUREMENT 71


6
73
This chapter discusses the elements of the transmission system. Included in thematerial are descriptions of overhead and underground transmission lines andsubstations. Transmission is the means by which large amounts of power aremoved from generating stations, where this power is produced, to substationsfrom which distribution facilities transport the power to customers. Transmis-sion lines are also used to provide connections to neighboring systems.
COMPONENTS
The transmission system consists of three-phase transmission lines and theirterminals—called substations or switching stations. Transmission lines can beeither overhead, underground (cable) or submarine. There are high-voltagealternating current (HVAC) lines and high-voltage direct current lines(HVDC). Overhead transmission, subtransmission and primary distributionlines are strung between towers or poles. In urban settings underground cablesare used primarily because of the impracticality of running overhead linesalong city streets. While underground cables are more reliable than overheadlines (because they have less exposure to climatological conditions such as hurricanes, ice storms, tornadoes, etc.), they are also much more expensivethan overhead lines to construct for unit of capacity and take much longer torepair because of the difficulty in finding the location of a cable failure andreplacement.
TECHNOLOGY OF THEELECTRIC TRANSMISSION
SYSTEM
Understanding Electric Power Systems: An Overview of the Technology and the Marketplace, byJack Casazza and Frank DeleaISBN 0-471-44652-1 Copyright © 2003 The Institute of Electrical and Electronics Engineers

HVAC
Overhead
The primary components of an overhead transmission line are:
• Conductors;• Ground or shield wires;• Insulators;• Support Structures; and• Land or right-of-way (R-O-W).
Conductors are the wires through which the electricity passes. Transmissionwires are usually of the aluminum conductor steel reinforced (ACSR) type,made of stranded aluminum woven around a core of stranded steel which pro-vides structural strength.When there are two or more of these wires per phase,they are called bundled conductors.
Ground or shield wires are wires strung from the top of one transmissiontower to the next, over the transmission line. Their function is to shield thetransmission line from lightning strokes. Insulators are made of materials whichdo not permit the flow of electricity.They are used to attach the energized con-ductors to the supporting structures which are grounded. The higher thevoltage at which the line operates, the longer the insulator strings. In recentyears, polymer insulators have become popular in place of the older, porcelainvariety. They have the advantage of not shattering if struck by a projectile.
The most common form of support structure for transmission lines is a steellattice tower, although wood H frames (so named because of their shape) arealso used. In recent years, as concern about the visual impact of these struc-tures has increased, tubular steel towers also have come into use. The primarypurpose of the support structure is to maintain the electricity carrying con-ductors at a safe distance from ground and from each other. Higher-voltagetransmission lines require greater distances between phases and from the con-ductors to ground than lower-voltage lines and therefore they require biggertowers. The clearance from ground of the transmission line is usually deter-mined at the midpoint between two successive towers, at the low point of thecatenary formed by the line.
RATINGS
The capability of an individual overhead transmission line, or its rating, isusually determined by the requirement that the line does not exceed codeclearances with the ground.As power flows through the transmission line, heatis produced because of the I2R effect. This heat will cause an expansion of themetal in the conductor and a resultant increase in the amount of its sag. Theamount of sag will also be impacted by the ambient temperature, wind-speed
74 TECHNOLOGY OF THE ELECTRIC TRANSMISSION SYSTEM

and sunlight conditions. Ratings are usually of two types—normal and emer-gency—and are determined for both summer and winter conditions. Somecompanies average the summer and winter ratings for the fall and spring. Inrecent years there has been a trend to calculating ratings for critical trans-mission lines on a real-time basis reflecting actual ambient temperatures aswell as the recent loading (and therefore heating) pattern.
Ratings are also specified for various time periods. A normal rating is thatlevel of power flow that the line can carry continuously. An emergency ratingis that level of power flow the line can carry for a various periods of time, forexample, 15 minutes, 30 minutes, 2 hours, 4 hours, 24 hours, and so forth.
The land that the tower line transverses is called the right-of-way (ROW).To maintain adequate clearances, as the transmission voltage increases, R-O-W widths also increase. In areas where it is difficult to obtain R-O-Ws, utili-ties design their towers to carry multiple circuits. In many areas of the countryit is not uncommon to see a structure supporting two transmission lines andone or more subtransmission or distribution lines.
There are different philosophies on the selection of R-O-Ws. One philoso-phy is to try to site the corridor where there is little if any visual impact tomost people. The other is that the R-O-W should be adjacent to existing infra-structure, that is, a railroad, highways, natural gas pipelines, so as to minimizethe overall number of corridors dedicated to infrastructure needs. Reliabilityconcerns argue for as much separation as possible between transmission R-O-Ws, to minimize exposure to incidents which might damage all lines on a R-O-W, so called common mode failures, such as ice storms, hurricanes, tor-nadoes, forest fires, airplane crashes, and the like. An ongoing issue with R-O-Ws is that they must be maintained to avoid excessive vegetation growth,which reduces the clearances between the line and ground.
CABLE
The majority of the transmission cable systems in the United States are high-pressure fluid filled (HPFF) or high-pressure liquid filled (HPLF) pipe typecable systems. Each phase of a high-voltage power cable usually consists ofstranded copper wire with oil-impregnated paper insulation. All three phasesare enclosed in a steel pipe. The insulation is maintained by constantly applying a hydraulic pressure through an external oil adjustment tank to compensate for any expansion or shrinkage of the cable caused by tempera-ture variations.
In recent years laminated paper-polypropylene insulation has been intro-duced. Also, cross-linked polyethylene insulated cable (XLPE) has come intouse at lower transmission voltages. Since it has no metallic sheath, it hasgreater flexibility and lower weight, as compared with conventional paperinsulated cable. Both oil-filled and XLPE cables are available today for op-eration at voltages up to 500kV ac, although there is limited experience withXLPE cables operating above 220kV.
CABLE 75

Cable capacity is determined by concerns over the effect of heat on thecable insulation. Since the cable is in a pipe which is buried in a trench, dissi-pation of the I2R heat is a major issue in cable design and operation. Cablecapacity can be increased by surrounding the pipe with a thermal sand, whichhelps dissipate heat. To maintain integrity of the insulation, the splicing ofcable sections is done under controlled environmental conditions. To increasethe HPLF cable’s capacity, the dielectric fluid can be circulated to mitigatelocal hot spots and to remove generated heat; air-cooled heat exchangers canbe added to improve the dissipation of the generated heat from the circulatedoil. At least one utility has employed a refrigeration cooled heat exchanger.
A limitation on the application of HPLF ac cables is their high level ofcapacitance, causing high charging currents, which limits the length of cablethat can be used without some intermediate location where shunt reactor com-pensation can be installed. XLPE cables, since they do not have a metal sheath,have lower levels of capacitance.
Submarine Cables
Submarine cables are usually laid underwater in trenches, with the distancebetween each phase measured in feet. A major consideration is to have thetrench deep enough and wide enough so that the cables are not damaged byanchors or fishing trawlers. The environmental impacts of dielectric fluid leaksfrom damaged cables are a concern. Also of concern is the need for longlengths of spare cable to facilitate repairs in the event of damage or failure.In any case, repair times will be long, possibly a month or months.
SUBSTATIONS
Substations are locations where transmission lines are tied together. Theyfulfill a number of functions.
• They allow power from different generating stations to be fed into themain transmission corridors.
• They provide a terminus for interconnections with other systems.• They provide a location where transformers can be connected to feed
power into the subtransmission or distribution systems.• They allow transmission lines to be segmented to provide a degree of
redundancy in the transmission paths.• They provide a location where compensation devices such as shunt or
series reactors or capacitors can be connected to the transmission system.• They provide a location where transmission lines can be de-energized,
either for maintenance or because of an electrical malfunction involvingthe line.
• They provide a location for protection, control, and metering equipment.
76 TECHNOLOGY OF THE ELECTRIC TRANSMISSION SYSTEM

Substation Equipment
There are a number of designs used for substations. However, there are ele-ments common to all:
• Bus is the given name given to the electrical structure to which all linesand transformers are connected. Buses are of two generic types: open airand enclosed. Enclosed buses are used when substations are located inbuildings or outdoors where space is at a premium. They involve the useof an insulating gas such as sulfur hexafluoride (SF6) to allow reducedspacing between energized phases. Bus structures are designed to with-stand the large mechanical forces that can result from fields produced byhigh short-circuit currents. These forces vary with the third power of thecurrent. A bus section is the part of a bus to which a single line or trans-former is connected.
• Protective relays are devices that continuously monitor the voltages andcurrents associated with the line and its terminals to detect failures ormalfunctions in the line/equipment. Such failures are called faults andinvolve contact between phases or between one or more phases andground.1 The relays actuate circuit breakers.
• Circuit breakers are devices that are capable of interrupting the flow ofelectricity to isolate either a line or a transformer. They do so by openingthe circuit and extinguishing the arc that forms using a variety of tech-nologies such as oil, vacuum, air blast or sulfur hexafluoride (SF6). Break-ers may be in series with the line or transformer or may be installed on both sides of the bus section where the line connects. They allow indi-vidual lines or transformers to be removed from service (de-energized)automatically when equipment (protective relays) detects operating con-ditions outside a safe range.They must be capable of interrupting the veryhigh currents that occur during fault conditions and are rated by theamount of current they can interrupt. These fault current levels can be 20or 30 times larger than the current flow under normal operating condi-tions, that is, thousands of amperes. To minimize the impact of electrical“shocks” to the transmission system, minimizing the total time for therelay to detect the condition and the circuit breaker to open the circuit isa critical design issue. Circuit breakers also allow lines or transformers tobe removed from service for maintenance. Circuit breakers normallyinterrupt all three phases simultaneously, although in certain specialapplications, single-phase circuit breakers can be employed, which willopen only the phase with a problem.
• Transformers are devices that are used to connect facilities operating attwo different voltage levels. For example a transformer would be used toconnect a 138kV bus to a 13kV bus.The transformer connects to all three
SUBSTATIONS 77
1 A malfunction can also be a situation where one phase is open without contacting ground.

phases of the bus. Physically the transformers can include all three phaseswithin one tank or there can be three separate tanks, one per phase.Larger capacity units may have three separate tanks because their sizeand weight may be a limiting factor because of transportation issues.Transformers can be designed with two mechanisms to adjust the voltageratio. One mechanism is the provision of more than one fixed tap posi-tion on one side of the transformer. For example, a transformer mighthave a nominal turns ratio of 345/138, with fixed taps on the 345kVwinding of 327.8, 336.7, 345, 353.6 and 362.3. The transformer must bedeenergized to adjust the fixed tap ratio.Another mechanism is called tapchanging under load (TCUL). In this mechanism the ratio can be adjustedwhile the transformer is energized, providing greater operating flexibility.Some transformers have both types of mechanisms; with a fixed tapadjustment in the high voltage winding and the TCUL adjustment in thelow voltage winding.Another type transformer is an autotransformer, which is used when facil-ities at nearly the same voltage are to be connected, for example, 138kVto 115kV. Rather than having two separate paths for the electricity,connected only by the magnetic flux through the transformer as in a conventional unit, the winding of autotransformer involves a tap on thehigher voltage winding which supplies the lower voltage.All larger transformers have mechanisms to remove the heat generatedwithin the tank involving some manner of circulating the transformerinsulating/cooling oil through an external heat exchanger involving finsmounted on the side of the transformer and fans to circulate air acrossthe fins to maximize heat dissipation.
• Disconnect switches are used to open a circuit when only “charging”current present is due. These would be used primarily to connect or dis-connect circuit breakers or transformers which are not carrying loadcurrent.They are also used in conjunction with circuit breakers to provideanother level of safety for workers by inserting a second opening betweenstation equipment out of service for work and the still energized sectionof line or bus.
• Lightning arrestors are used to protect transformers and switchgear fromthe effects of high voltage due to lightning stroke or a switching operation.They are designed to flashover when the voltage at the transformer exceedsa pre-selected level which is chosen by the station design engineers to coor-dinate with the basic insulation level of the transformer (BIL).
• Metering equipment is provided to measure line and transformer loadingsand bus voltages so operating personnel can ensure that these facilitiesare within acceptable limits. Metering equipment also is provided at somelocations to measure the flow of energy for the billing that is required forsales and purchases of energy between various participants in the electricenergy market.
78 TECHNOLOGY OF THE ELECTRIC TRANSMISSION SYSTEM
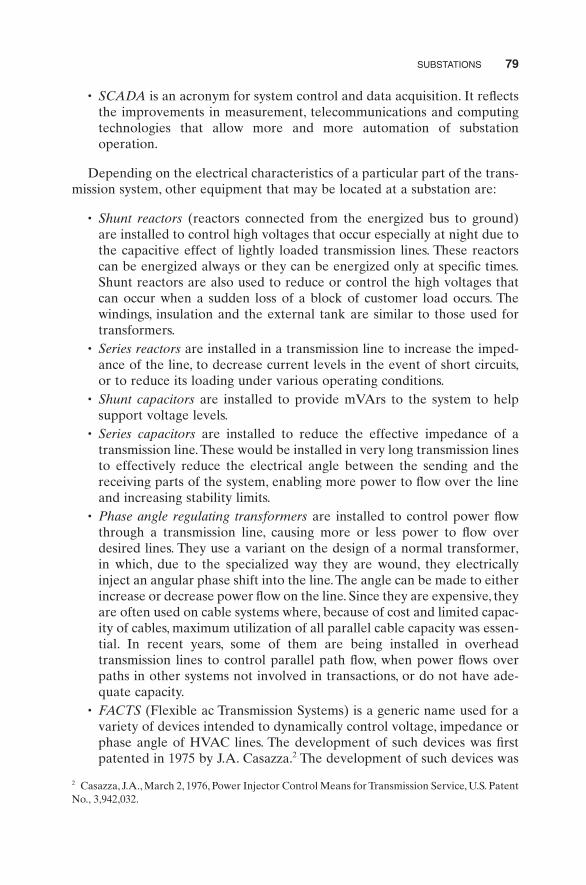
• SCADA is an acronym for system control and data acquisition. It reflectsthe improvements in measurement, telecommunications and computingtechnologies that allow more and more automation of substation operation.
Depending on the electrical characteristics of a particular part of the trans-mission system, other equipment that may be located at a substation are:
• Shunt reactors (reactors connected from the energized bus to ground) are installed to control high voltages that occur especially at night due tothe capacitive effect of lightly loaded transmission lines. These reactorscan be energized always or they can be energized only at specific times.Shunt reactors are also used to reduce or control the high voltages thatcan occur when a sudden loss of a block of customer load occurs. Thewindings, insulation and the external tank are similar to those used fortransformers.
• Series reactors are installed in a transmission line to increase the imped-ance of the line, to decrease current levels in the event of short circuits,or to reduce its loading under various operating conditions.
• Shunt capacitors are installed to provide mVArs to the system to helpsupport voltage levels.
• Series capacitors are installed to reduce the effective impedance of atransmission line. These would be installed in very long transmission linesto effectively reduce the electrical angle between the sending and thereceiving parts of the system, enabling more power to flow over the lineand increasing stability limits.
• Phase angle regulating transformers are installed to control power flowthrough a transmission line, causing more or less power to flow overdesired lines. They use a variant on the design of a normal transformer,in which, due to the specialized way they are wound, they electricallyinject an angular phase shift into the line.The angle can be made to eitherincrease or decrease power flow on the line. Since they are expensive, theyare often used on cable systems where, because of cost and limited capac-ity of cables, maximum utilization of all parallel cable capacity was essen-tial. In recent years, some of them are being installed in overheadtransmission lines to control parallel path flow, when power flows overpaths in other systems not involved in transactions, or do not have ade-quate capacity.
• FACTS (Flexible ac Transmission Systems) is a generic name used for avariety of devices intended to dynamically control voltage, impedance orphase angle of HVAC lines. The development of such devices was firstpatented in 1975 by J.A. Casazza.2 The development of such devices was
SUBSTATIONS 79
2 Casazza, J.A., March 2, 1976, Power Injector Control Means for Transmission Service, U.S. PatentNo., 3,942,032.

encouraged in the 1980s by a program of the Electric Power ResearchInstitute (EPRI).3
These devices mirror and extend the benefits of the fixed series and shuntinductors and capacitors previously discussed in that the FACTS devices allowrapid and precise adjustments. Depending on the device, these FACTS devicesprovide a number of benefits: increased power transfer capability, rapidvoltage control, improved system stability, and mitigation of sub-synchronousresonance (a condition experienced in a number of regions in the UnitedStates, where oscillations occur caused by interaction of generator controlsystems and the capacitance of long transmission distances). There are manydevices by many manufacturers, some of which are in the development stageand a few of which are in service. The names of the devices vary somewhat,depending on the manufacturer. The following lists some of the devices:
• Static VAr Compensators (SVCs)—These devices employ fixed banks ofcapacitors, controlled with thyristors, which can switch them on and offrapidly. In many instances, there are also thyristor-switched inductors toprevent system resonance.
• Thyristor Controlled Series Compensators (or Series Capacitors)(TCSCs)—A thyristor controlled reactor is placed in parallel with a seriescapacitor, allowing a continuous and rapidly variable series compensationsystem.
• Static Compensators (STATCOMs) are gate turn-off type thyristors(GTO) based SVCs. They are solid-state synchronous voltage generatorsthat consist of multi-pulsed, voltage sourced inverters connected in shuntwith transmission lines. They do not require capacitor banks and shuntreactors but rely on electronic processing of voltage and current wave-forms to provide inductive or capacitive reactive power. They have theadded advantage that their output is not seriously impacted by low systemvoltage.
• Unified Power Flow Controllers (UPFC)—These devices have shunt con-nected STATCOM with an additional series branch in the transmissionline supplied by the STATCOM’s dc circuit. These devices are compara-ble to phase shifting transformers. They can control all three basic powertransfer parameters: voltage, impedance and phase angle.
• SVC Light4 (STATCOM)—Are based on voltage source converter tech-nology equipped with Insulated Gate Bipolar Transistors (IGBT) a power
80 TECHNOLOGY OF THE ELECTRIC TRANSMISSION SYSTEM
3 FACTS—Flexible Alternating Transmission Systems for Cost Effective and Reliable Transmis-sion of Electric Energy, K. Habur, Siemens AG, and D. O’Leary, World Bank; also derived fromWestinghouse Flexible AC Transmission Systems (FACTS)—www.ece.umr.edu, and ABBFACTS—Flexible AC Transmission Systems—www.abb.com4 The ABB brand name.

switching component. They provide reactive power as well as absorp-tion purely by means of electronic processing of voltage and currentwaveforms.
Substation Breaker Arrangements
Figure 6.1 shows the most commonly used bus/circuit breaker arrangements.The breaker and half design is the one most usually used in newer trans-mission substations since it provides excellent reliability and operating flexibility.
SUBSTATIONS 81
Ring bus
Single busTRANSFER MAIN
Main and transfer bus
Breaker-and-a-half
Double bus-double breaker
Legend:Circuit breakert
Disconnect switch
Transformer
Figure 6.1. Typical substation circuit breaker arrangements.††††
†††† From Electric Utility Systems and Practices, 4th Edition, Homer M. Rustebakke, Wiley, NewYork.

TRANSMISSION SYSTEM AGING
Transmission systems are aging with a large portion of the lines, cables, andsubstation equipment reaching average ages in excess of 30 years, and somein excess of 75 years. This has increased future failure rates and maintenancerequirements5 causing reliability problems.
HVDC
An alternate means of transmitting electricity is to use high-voltage directcurrent (HVDC) technology. As the name implies, HVDC uses direct currentto transmit power. Direct current facilities are connected to HVAC systemsby means of rectifiers, which convert alternating current to direct current, andinverters, which convert direct current to alternating current. Early applica-tions used mercury arc valves for the rectifiers and inverters but, starting inthe 1970s, thyristors became the valve type of choice.
Thyristors are controllable semiconductors that can carry very high currentsand can block very high voltages.They are connected is series to form a thyris-tor valve, which allows electricity to flow during the positive half of the alter-nating current voltage cycle but not during the negative half. Since all threephases of the HVAC system are connected to the valves, the resultant voltageis unidirectional but with some residual oscillation. Smoothing reactors areprovided to dampen this oscillation.
HVDC transmission lines can either be single pole or bipolar, althoughmost are bipolar, that is, they use two conductors operating at different polar-ities such as +/-500kV. HVDC submarine cables are either of the solid typewith oil-impregnated paper insulation or of the self-contained oil-filled type.New applications also use cables with extruded insulation, cross-linked polyethylene.
Although synchronous HVAC transmission is normally preferred becauseof its flexibility, historically there have been a number of applications whereHVDC technology has advantages:
• The need to transmit large amounts of power (>500mW) over very longdistances (>500km), where the large electrical angle across long HVACtransmission lines (due to their impedances) would result in an unstablesystem. Examples of this application are the 1,800mW Nelson RiverProject, where the transmission delivers the power to Winnipeg, Canada,approximately 930km away; the 3,000mW system from the Three Gorgesproject to Shanghai in China, approximately 1,000km distant; and the1,456km long, 1,920mW line from the Cabora Bassa project in Mozambique to Apollo, in South Africa. In the United States the 3,100
82 TECHNOLOGY OF THE ELECTRIC TRANSMISSION SYSTEM
5 See Chapter 9 on Reliability.

mW Pacific HVDC Intertie (PDCI) connects the Pacific Northwest(Celilo Converter Station) with the Los Angeles area (Sylmar ConverterStation) by a 1,361km line.
• The need to transmit power across long distances of water, where thereis no method of providing the intermediate voltage compensation thatHVAC requires. An example is the 64km Moyle interconnector, fromNorthern Ireland to Scotland.
• When HVAC interties would not have enough capacity to withstand theelectrical swings that would occur between two systems. An example isthe ties from Hydro Quebec to the United States.
• The need to connect two existing systems in an asynchronous manner toprevent losses of a block of generation in one system from causing trans-mission overloads in the other system if connected with HVAC. Anexample is the HVDC ties between Texas and the other regional systems.
• Connection of electrical systems that operate at different frequencies.These applications are referred to as back-to-back ties. An example isHVDC ties between England and France.
• Provision of isolation from short-circuit contributors from adjacentsystems since dc does not transmit short-circuit currents from one systemto another.
With the deregulation of the wholesale power market in the United States,there is increasing interest in the use of HVDC technology to facilitate thenew markets. HVDC provides direct control of the power flow and is there-fore a better way for providing contractual transmission services. Some havesuggested that dividing the large synchronous areas in the United States intosmaller areas interconnected by HVDC will eliminate coordination problemsbetween regions, will provide better local control, and will reduce short-circuitduties, significantly reducing costs.
Advantages of HVDC
As the technology has developed, the breakeven distance for HVDC versusHVAC transmission lines has decreased. Some studies indicate a breakevendistance of 60km using modern HVDC technology. Some of the advantagesidentified are:
• No technical limits in transmitted distance; increasing losses provide aneconomic limit;
• Very fast control of power flow, which allows improvements in system stability;
• The direction of power flow can be changed very quickly (bi-directionality);
HVDC 83
• An HVDC link does not increase the short-circuit currents at the connecting points. This means that it will not be necessary to change thecircuit breakers in the existing network;
• HVDC can carry more power than HVAC for a given size of conductor;• The need for ROW is much smaller for HVDC than for HVAC, for the
same transmitted power.
Disadvantages of HVDC
The primary disadvantages of HVDC are its higher costs and that it remainsa technology that can only be applied in point-to-point applications becauseof the lack of an economic and reliable HVDC circuit breaker. The lack of anHVDC circuit breaker reflects the technological problem that a direct currentsystem does not have a point where its voltage is zero as in an alternatingcurrent system. An HVAC circuit breaker utilizes this characteristic when itopens an HVAC circuit.
KNOWLEDGE REQUIRED OF TRANSMISSION SYSTEM
Those familiar with transmission system problems and policies have developedthe following list, sometimes called the “ten commandments” of transmissionknowledge:
Thou shall understand and consider:
1. How systems are planned and operated;2. Effect of generation on transmission and vise versa;3. Causes of circulating power, parallel path flow, and loop flow;4. Differences between individual circuit capacities and transmission
capacities;5. Synchronous ac connection advantages and disadvantages;6. Reactive power and its role;7. Causes and consequences of blackouts;8. Need for new technology;9. Disincentives to building new transmission;
10. Need for special training and education.
Some of these have been discussed in this and previous chapters. The restwill be covered in the following chapters.
84 TECHNOLOGY OF THE ELECTRIC TRANSMISSION SYSTEM

7
85
The primary function of the distribution system is to connect the electric bulk power system to customers requiring service at voltages below that ofthe transmission and subtransmission systems. The distribution system is theportion of the electric power system most readily seen by the customer andwhich contributes most directly to providing electric service.
Of the three primary functions of the electric utility, generation, transmis-sion, and distribution, the distribution system plays the largest role in thequality of service received by the consumers. Figure 2.4 shows the relationshipof the distribution system to the total system.1 The primary components of adistribution system are:
• Distribution Substation;• Primary Feeder;• Distribution Transformer;• Secondaries and Services.
The distribution substation receives electric power directly from the trans-mission or sub transmission system and converts it to a lower voltage for useon a primary distribution feeder. In a common configuration a distribution
DISTRIBUTION
Understanding Electric Power Systems: An Overview of the Technology and the Marketplace, byJack Casazza and Frank DeleaISBN 0-471-44652-1 Copyright © 2003 The Institute of Electrical and Electronics Engineers
1 Wiley Encyclopedia of Energy Technology and the Environment, New York, February 1995,p. 459.

substation may have several transformers and a number of primary distribu-tion feeders emanating from it. These feeders are most commonly seen beingsupported by wooden utility poles on residential streets.
The distribution transformer, usually on a pole, is supplied by the primarydistribution feeder (primaries) and transforms the voltage of the primaryfeeder (2400 volts through 34,500 volts) to a lower voltage most commonlyused by consumers. The secondary lines (secondaries) and service connectionsprovide electric service directly to the ultimate consumer at the lower volt-ages produced at the output terminals of the distribution transformers.
PRIMARY FEEDERS
Primary voltage in the “13kV class” is predominate among United States util-ities. The 4-kV class primary systems are older and are gradually beingreplaced. In some cases 34kV is used in new, high-density-load areas.
The three-phase, four-wire primary system is the most widely used. Underbalanced operating conditions, the voltages of each phase are equal in mag-nitude and 120° out of phase with each of the other two phases. The fourthwire in these Y-connected systems is used as a neutral for the primaries, or asa common neutral when both primaries and secondaries are present. Thecommon neutral is also grounded at frequent intervals along the primaryfeeder, at distribution transformers, and at customers’ service entrances.
Rural and suburban areas are usually served by overhead primary lines,with distribution transformers, fuses, switches, and other equipment mountedon poles. Urban areas with high-density loads are served by underground cablesystems, with distribution transformers and switchgear installed in under-ground vaults or in ground-level cabinets. There is also an increasing trendtoward underground single-phase primaries serving residential areas. Under-ground cable systems are highly reliable and unaffected by weather, but canhave longer repair times. The costs of underground distribution are signifi-cantly higher than overhead. Primary distribution includes three basic types:(1) radial, (2) loop, (3) and primary network systems.
Radial Systems
The radial system is a widely used, economical system often found in low-loaddensity areas. To reduce the duration of interruptions, overhead feeders canbe protected by automatic reclosing devices located at the substation or atvarious locations on the feeder.These devices reenergize the feeder if the faultis temporary. To further reduce the duration and extent of customer interrup-tions, sectionalizing fuses are installed on branches of radial feeders allowingunaffected portions of a feeder to remain in service.
86 DISTRIBUTION

Loop Systems
The loop system is used where a higher level of service reliability is desired.Two feeders form a closed loop, open at one point, so that load can be trans-ferred from one feeder to another in the event of an outage of one circuit byclosing the open point and opening at another location. One or more addi-tional feeders along separate routes may be provided for critical loads, suchas hospitals that cannot tolerate long interruptions. Switching from the normalfeeder to an alternate feeder can be done manually or automatically withcircuit breakers and electrical interlocks to prevent the connection of a goodfeeder to a faulted feeder.
Primary Network Systems
The primary network system consists of a grid of interconnected primaryfeeders supplied from a number of substations. It provides higher service reli-ability and quality than a radial or loop system. Only a few primary networksare in operation today. They are typically found in downtown areas of largecities with high load densities.
DISTRIBUTION TRANSFORMERS
Distribution transformers are of several types:
• Single phase or three phase;• Pole mounted or pad mounted;• Underground.
They come in various sizes usually small single phase units, and are filled witha dielectric fluid.The basic components of typical distribution transformers areshown in Figure 7.1. They can be purchased with various efficiencies, withbetter efficiencies costing more.
SECONDARY SYSTEMS
Secondary distribution delivers energy at customer utilization voltages fromdistribution transformers to meters at customers’ premises. Figure 7.2 showstypical secondary voltages and applications in the United States. There are anumber of types of secondary systems. Usually single phase, three-wire serviceis provided in residential areas. One of the three wires is a ground wire, theother two are energized. Connecting to the two energized wires provides 240 volts; connecting from either energized wire to the ground will supply 120 volts. Each transformer supplies a separate secondary system. In many
SECONDARY SYSTEMS 87

88 DISTRIBUTION
Primary Bushings
Cover
SealingBand
Grounding Lug
Mounting Lugs
Name and Data Plate(function, serial number,tap positions, etc.)
High VoltageBushing
Tap Changer
Core and Coil Coil Assembly
Oil Level
Low VoltageBushings
Figure 7.1. Typical distribution transformer.

cases, there are tie-points between the secondary systems so that a supply maybe obtained from an adjacent system if a transformer fails. Commercial andindustrial loads are heavier than loads in residential areas, and a three-phase4 wire supply is often installed since larger motors, used by these type cus-tomers, use three-phase power.
To supply high-density load areas in downtown sections of cities, where thehighest degree of reliability is needed, secondary networks are used. Such net-works are supplied by two or more primary feeders through network trans-formers. These transformers are protected by devices that open to disconnectthe transformer from the network if the transformer or supply feeder arefaulted. Special current limiting devices are also used at various locations inthe secondary to keep problems from spreading. Smaller secondary networkscalled spot networks are also used to supply loads requiring extra reliability.
DISTRIBUTION CAPACITY
The capacity of the distribution system is determined in most cases by thethermal ratings of the equipment. In more rural areas with low load density itmay be determined by voltage limits. The distribution substation capacitydepends on the size of transformers and the provision of an additional sparetransformer. If a substation has two transformers, all load must be supplied bythe remaining one if one fails. In this case, the substation capacity will dependon the capability of the remaining transformer to carry the load for the timerequired to replace the failed transformer, with the capacity being lower if thereplacement time is longer. For substations with a single transformer, load islimited to what can be transferred to other substations at remote feeder tiepoints.
The allowable primary feeder loading can be limited by the size of con-ductors used and the characteristics of the load supplied. If the load varies,higher maximum loads can be carried by the feeder than steady loads, sincethe rating of the feeder depends on the heating effect of the current over time.Feeder loading may also be limited by the voltage drop that occurs at the endof longer feeders.
The distribution transformer capacity is determined by the size of the trans-former and the characteristics of the load. In some cases, the distribution trans-
DISTRIBUTION CAPACITY 89
Voltage # Phases # Wires Application
120/240 V Single phase Three Residential
208Y/120 V Three phase Four Residential/Commercial
480 Y/ 277 V Three phase Four Commercial/Industrial/High Rise
Figure 7.2. Typical secondary distribution voltages in the United States.

formers are single phase. When a three-phase supply is needed, three single-phase transformers can be used, each connected to a different phase of thethree-phase primary supply. Alternatively, a three-phase transformer may beused in which the three phases are in a single tank.
The capacity of the secondaries is determined by the size of wire used, theirlength, and the characteristics of the load they supply.
LOSSES
Distribution systems have two types of energy losses: losses in the conductorsand feeders due to the magnitude of the current and transformer core lossesthat are independent of current. Current related losses are equal to the currentsquared time the resistance of the feeder or transformer (I2R). Accompany-ing these losses are reactive losses which are given by (I2X). The core lossesresult from the energy used in transformer cores as a result of hysteresis andeddy currents. These losses depend on the magnetic material used in the core.As voltages vary from the design level, core losses can vary by as much as V3
to V5. Core losses in a power system can exceed 3% of the power generatedconstituting as much as 40% of the total loss on the system. The capacity ofgeneration and reactive sources must be sufficient to supply these losses.
RATINGS
As in the case of transmission facilities, the ratings of distribution componentsare generally given as the product of the voltage at which they are operatedand the current that is flowing through them (kVA). Normally seasonal ratingsare used to recognize ambient temperature differences.
Distribution facilities are generally capable of operating at their rated valuefor specified periods of time for specific cycles, usually expressed as the “lossfactor”. The maximum rating and the period of time over which a componentmay be operated at its maximum rating depend upon the ambient tempera-ture, the wind, sunlight, and the load levels experienced just prior to the timeof the peak demand.
METERING
The maximum power and energy supplied the distribution substation, and thevoltage in the substation, are continuously measured by recording meters inthe substation. The energy used by each customer is continuously measuredat the customer’s meters. The electronic communication of customer meterreadings to the utility for billing purposes and provision of data to assist oper-ations and system design is increasing.
90 DISTRIBUTION

Significant changes in metering requirements have occurred as a result ofthe restructuring of the electric power industry to provide the ability to keeptrack of energy provided by various power suppliers. The use of telemetry isbeing increased to provide real time data. It helps reduce interruptions andaccelerates restoration of power to customers.
CONTROL OF VOLTAGE
Good quality electric service requires that the voltage at the consumers’ prem-ises be kept within an acceptable voltage range for satisfactory operation ofconsumer equipment. At the 120-volt level, this is 110–126 volts at the uti-lization point. It is customary for utilities to hold voltage at the customer meterlocation between 114 and 126 volts, which allows for a 4-volt drop to the uti-lization point in the residence.The location of the voltage extremes are usuallyat the first and last customer locations on the primary feeder. During peakload conditions the first customer usually receives the highest voltage and thelast customer the lowest. The variations from light to heavy load at these loca-tions will establish the voltage range for the circuit.
As a first step in the control of voltage on such a circuit, most utilities willregulate the primary voltage at the substation. This takes care of variations inthe voltage supplied to the substation and the variation on the feeder up tothe first customers. The equipment usually used for regulation are tap chang-ers on the substation transformers or separate feeder voltage regulators. Formost urban feeders, no other regulating equipment is needed, although shuntcapacitor banks are often installed to supply part of the kilovar portion of theload. On larger or longer feeders, both voltage regulators and shunt-capacitorbanks may be needed out on the feeders to provide supplementary voltagecontrol and reactive supply. In general, the control of voltage is more eco-nomical if both voltage regulators and shunt capacitors are used and if distri-bution voltage control is coordinated with voltage control of the transmissionsystem and of generation.
Capacitors
Capacitors are applied as an economic tool to reduce system losses by sup-plying kilovars locally. Shunt capacitor banks including fixed and switchedbanks are used on primary feeders to reduce voltage drop, reduce power loss,and improve power factor. The closer to the load they can be installed, thegreater the economic benefit. Capacitors are not only an economic tool for thedistribution system, but they can eliminate the need for adding reactivesources in the bulk power system. Kilovars supplied directly to load areasreduce the current in all portions of the system. This releases transmissioncapacity and reduces system losses.
At light load, the capacitors installed for full load operation may cause too
CONTROL OF VOLTAGE 91

high a voltage on the distribution system.Therefore, many capacitors will haveto be switched off during these periods. Various means are used to performthe switching.
Voltage Regulators
Voltage regulators usually are an autotransformer with automatic tap-chang-ing under load. Automatic measuring and tap-changing equipment holds the output voltage within a predetermined bandwidth. By using the smallestpractical bandwidth, more voltage drop can be allowed along the feeder, stillkeeping the consumer voltage within acceptable limits. The means for achiev-ing this are an integral part of the regulator controls called the line drop compensator.
RELIABILITY
The distribution system is that portion of the electric power system which hasthe greatest direct impact on the level of reliability experienced by the con-sumer. Outage of a major generating unit might simply cause the electric utilityto buy power from neighboring utilities or start up higher cost generatingequipment available on their own system. Outage of a major transmission linemight cause other transmission lines within the electric utility system to pickup additional load and require a redispatch of generation. However, outageof a single distribution feeder will usually result in immediate interruption ofservice to consumers directly connected to that feeder.
On overhead circuits, 80–90% of the faults are of a temporary nature causedby wind, lightening, icing, birds, small animals, and contact with tree limbs. Ifthe fault is temporary, lasting only for a short time, the circuit can be success-fully re-energized, restoring service to all consumers.
Protection of primary circuits against excessive currents is provided bycircuit breakers, automatic circuit reclosers, fuses, and sectionalizers, whichdivide the primary circuit into a number of sections. The time-current charac-teristics and operating characteristics of these devices are coordinated so that service is restored to all consumers following a temporary fault, and aminimum number of consumers are interrupted for a permanent fault.
Reclosing circuit breakers and automatic circuit reclosers have both aninstantaneous overcurrent characteristics and a time-delay overcurrent char-acteristic. Initially, these devices trip instantaneously, interrupting the faultcurrent quickly enough to prevent the blowing or melting of downstreamfuses. If the fault persists when the circuit is reclosed, these devices switch toa time-delay trip characteristic. This permits downstream fuses to blow andisolate a permanent fault before the breaker or recloser trips. Automaticreclosing is generally not used on cable circuits to prevent increasing damagefrom a cable fault.
92 DISTRIBUTION

Standards have been established for measuring and comparing the relia-bility provided to distribution customers. These are given in Chapter 9.
Quality of Service
Distribution systems are also subject to voltage dips and other variations inquality of service.These can be caused by the effects of other customer’s appa-ratus or by faults or short-circuits at other points on the system. When a faultoccurs, the voltage at the fault location will go to zero. Voltages at nearly loca-tions will be significantly depressed for the duration of the fault. Voltages willbe depressed to lesser degree at more remote locations. But transmissionsystem faults can cause dips at locations as far away as 100 miles, dependingon the voltage level of the faults. These voltage dips affect digital clocks, com-puters, and other electronic devices and has lead the industry to addressimprovements in the reliability and quality of service.2
DESIGN OF DISTRIBUTION SYSTEMS
A reliable distribution system must be designed to meet future power supplyrequirements. It must also have adequate protection for the various types offaults and short-circuits that can occur. This requires that circuit breakers,fuses, and other protective devices have the ability to interrupt the very highcurrents that can occur when a short-circuit occurs. Relaying to detect suchfaults needs to be provided and coordinated with the protective devices.
There is a considerable amount of software available for the design andoperation of distribution systems, including:
• Capacitor placement optimization;• Circuit breaker duties;• Conductor and conduit sizing—ampacity and temperature computations;• Database management;• Distribution reliability evaluation;• Distribution short-circuit computations;• Graphics for single-line diagrams and mapping systems;• Harmonics analysis;• Motor starting;• Power factor correction;• Power flow/voltage drop computations;• Power loss computations and costs of losses.
DESIGN OF DISTRIBUTION SYSTEMS 93
2 EPRI, The Cost of Power Disturbances for Industrial and Economy Companies, 2001.
DISTRIBUTED GENERATION
The increasing application of small generation sources on the distributionsystem is being driven by economics, reliability concerns and the developmentor new technology. Some distributed generators will be installed by the utilityon the supply side of the customers’ meters. Others will be installed by thecustomers on their side of the meter and will affect the distribution systemand the other customers it supplies. The connection of diesels, fuel cells,photo-voltaic cells, wind generators and micro turbines raises new concernsand problems for distribution systems. They increase short-circuit duties, theyall require relaying and protection changes, and raise questions of safety bothto utility workers and consumers.
The use of distributed generation to help provide power impacts the designand operation of bulk supply systems, including ancillary services such as reac-tive capacity, spinning reserve, and so on. Coordination is needed in the designand operation of the bulk supply system and the distribution system. This iscomplicated by the fact the bulk power and the distribution systems generallyare owned by different parties and separately regulated with the Federal Gov-ernment regulating the bulk supply and the State Government regulating thedistribution systems. One alternative is the development of coordination con-tracts between the parties which will provide for an equitable sharing of thebenefits from coordination.
OPERATION OF DISTRIBUTION SYSTEMS
The distribution system is operated and controlled using SCADA (system con-trol and distribution automation) system at a dispatch center. These systemsare of various types and are under continuous development. They are used toprovide data needed for operation and new billing requirements.
The automation of the distribution systems continues to increase. The benefits of distribution automation include:
• Improved distribution reliability;• Reduced customer outages and outage durations by automatically locat-
ing and isolating faulted sections of distribution circuits and automaticallyrestoring service to unfaulted sections;
• Reduced customer complaints;• Reduced power losses for substation transformers, distribution feeders,
and distribution transformers;• More effective use of distribution through automatic voltage control, load
management, load shedding, and other automatic control functions;• Improved methods for logging, storing, and displaying distribution
data;
94 DISTRIBUTION

• Improved engineering, planning, operating, and maintenance of distribution.
The current status of distribution automation development is shown in Figure 7.3.
OPERATION OF DISTRIBUTION SYSTEMS 95
EFFICIENCYPOWER QUALITY
SCADA/DA MASTER STATION
TELECOMMUNICATION INFRASTRUCTURE
SUBSTATION SCADAFEEDER SCADA
Substation Control System/Remote Terminal Unit/Voltage Regulator/Load Tap Changer
(SCS/RTU/Regulator/LTC)
Remote-Controlled Line Switch, Remote-ControlledLine Recloser, Remote-Controlled Line Capacitor,
Remote-Controlled Line Regulator(RCLS, RCLR, RCLC, RCLREG)
Fault Location Isolation& Service Restoration
(FSISR)
Volt/VARCONTROL
Feeder Reconfiguration& Transformer Balancing
(FRTB)
AutomatedMeter Reading
(AMR)
Reliability-Centered
Maintenance(RCM)
Figure 7.3. Automation of electric distribution systems.‡‡‡‡
‡‡‡‡ Extracted from a DISTRIBUTION AUTOMATION: A STRATEGIC OPTION FOR ELECTRICUTILITIES IN THE RESTRUCTURED AND DEREGULATED ENVIRONMENT—Manuel C.Mendiola, Member, IEEE Manila Electric Company.


8
97
So far we have discussed the elements of the electric system. This chapteraddresses how these elements come together to ensure that electricity is avail-able when needed. The chapter will cover both the operation and the planningof the system.
The process by which the electric bulk power system functions has both atechnical and organizational dimension. At the time of writing this book, theorganization structures are undergoing change due to restructuring effortsunder way at the national and state levels.
COORDINATION
The operation of the bulk power system in the United States reflects the inter-dependency of the various entities involved in supplying electricity to the ulti-mate consumers. These interdependencies have evolved as the utility industrygrew and expanded over the century.
Since the electric system operates in large synchronous interconnections,the effects of power flows and electrical disturbances are felt by all systemsconnected to a synchronous grid. In a power system, the coordination of allelements of the system and all participants are required from an economic anda reliability perspective. Generation, transmission, and distribution facilitiesmust function as a coordinated whole. The scheduling of generation must rec-ognize the capability of the transmission system. Voltage control must involve
FUNCTIONING OF THEELECTRIC BULK
POWER SYSTEM
Understanding Electric Power Systems: An Overview of the Technology and the Marketplace, byJack Casazza and Frank DeleaISBN 0-471-44652-1 Copyright © 2003 The Institute of Electrical and Electronics Engineers

generators as well as transmission and distribution facilities. Actions and deci-sions by one participant, including decisions not to act, affect all participants.
In parallel with its early growth, the industry recognized that it was essen-tial that operations and planning of the system be coordinated and organiza-tions were formed to facilitate the joint operation and planning of the nation’selectric grid. Initially holding companies and then power pools were estab-lished to coordinate the operation of groups of companies.
After the Northeast Blackout of 1965, regional electric reliability councilswere formed to promote the reliability and efficiency of the interconnectedpower systems within their geographic areas. These regional councils joinedtogether shortly afterwards to form a national umbrella group, NERC—theNorth American Electricity Reliability Council. At present there are tenregional councils. The members of these Regional Councils come from all seg-ments of the electric industry: investor-owned utilities; federal power agencies;rural electric cooperatives; state, municipal and provincial utilities; independ-ent power producers; power marketers; and end-use customers. These entitlesaccount for virtually all the electricity supplied in the United States, Canada,and a portion of Baja California Norte, Mexico.1
Since its formation in 1968, the North American Electric Reliability Council(NERC) has operated as a voluntary organization to promote bulk electricsystem reliability and security—one dependent on reciprocity, peer pressure,and the mutual self-interest of all those involved.
In promoting electric system reliability and security, NERC, among otherthings:
• Establishes operating policies and planning standards to ensure electricsystem reliability;
• Reviews the reliability of existing and planned generation and transmis-sion systems;
• Critiques past electric system disturbances for lessons learned and moni-tors the present for compliance and conformance to its policies;
• Maintains liaisons with the federal, state, and provincial governments inthe United States and Canada and electricity supply industry organiza-tions in both countries.
The growth of competition and the structural change taking place in theindustry have significantly altered the incentives and responsibilities of marketparticipants to the point that a system of voluntary compliance is no longeradequate. In response to these changes, NERC is in the process of transform-ing itself into an industry-led self-regulatory reliability organization (SRO)that will develop reliability standards for the North American bulk electricsystem.
98 FUNCTIONING OF THE ELECTRIC BULK POWER SYSTEM
1 Extracted from About NERC, www.NERC.com.
After FERC issued its Orders 888 and 889 in 1996, some areas of thecountry formed Independent System Operators (ISOs). The New York andPJM ISOs mission statements are typical:
New York—“. . . to ensure the reliable, safe, and efficient operation of the State’smajor transmission system and to administer an open, competitive, and non-discriminatory wholesale market for electricity in New York State.”
PJM—“Maintain the safety, adequacy, reliability, and security of the powersystem. Create and operate a robust, competitive, and non-discriminatory elec-tric power market.”
Recently, in response to FERC directives, Regional Transmission Organi-zations (RTOs) are being formed. These organizations will be responsible forthe planning and operation of their respective bulk power grids.
OPERATION
Control Areas
The overriding objectives of those individuals responsible for the performanceof the electric system is to ensure that at every moment of time there is suffi-cient generation to reliably supply the customer requirements and all associ-ated delivery system losses. The process is complicated by the fact that thecustomer load changes continuously and, therefore, the generation must adjustimmediately, either up or down, to accommodate the load change. Since elec-tric power cannot be stored, the generation change must be accomplished bya physical adjustment of the equipment generating the electricity.
To coordinate the operation of the bulk power system, a system of controlareas has evolved. Each control area is responsible for maintaining its ownload/generation balance including its scheduled interchange, either purchasesor sales. A control area can consist of a generator or group of generators, anindividual company, or a portion of a company or a group of companies pro-viding it meets certain certification criteria specified by NERC. It may be aspecific geographic area with set boundaries or it may be scattered generationand load.
Figure 8.1 shows the location of each of the reliability councils as well asthe location of the more than 140 control areas within NERC. The controlareas vary greatly in both geographic size and the amount of generation/loadthey control. One of the results of the on-going process to set up RTOs willbe a reduction in the number of these areas.
Each control center maintains communication with adjoining areas in orderto coordinate operations. Coordination activities can include inter-area powerexchanges, power transfer limits on interties and circulating or inadvertentpower flows.
OPERATION 99

In addition to maintaining communication with other control areas, thecontrol center has to be in contact with its constituents, be they companies orindividual generating stations or generating units or individual substations. Ifthey are in contact with an individual company, that company, in turn, has com-munication links with its generating units or transmission operating centers sothat control signals can be passed rapidly.
Since minute-by-minute customer load change are not known in advance,a system has been developed where generation changes are made in responseto load changes. This system is based on the concept of the area control error.
The control centers also require real time information about the status ofthe system.This information includes power line flows, substation voltages, theoutput of all generators, status of all transmission lines and substation break-ers (in-service or out-of-service) and transformer tap settings. Some areas areimplementing real-time transmission line rating systems requiring additionalinformation such as weather conditions, conductor temperatures, and so forth.
Each control area monitors on an on-going basis the power flow on eachof its interties (in some cases delivery points) and the output of each genera-tor within its control. The sum of the internal generation and the net flow on
100 FUNCTIONING OF THE ELECTRIC BULK POWER SYSTEM
Control center locationDirect communication links
As of July 31, 2002
Figure 8.1. Control areas in NERC.

the interties is equal to the customer load and all transmission losses withinthe area.
The various commercial interests that are involved within the area arerequired to notify the control area personnel of their contractual arrange-ments on an on-going basis for either sales or purchases of electricity with enti-ties outside the area’s boundaries.Additionally, neighboring operating entities,engaged in transactions that will cause power to flow through the control areaare required to notify the control area and to make provision for the atten-dant transmission losses.
The reporting requirements have been formalized by FERC in its Orders888 and 889, issues in 1996. The Order stated, in part, that:
“A public utility . . . must rely on the same electronic information network thatits transmission customers rely on to obtain information about its transmissionsystem when buying or selling power.”
The reports are entered into the Open Access Same-Time InformationSystem (OASIS), an Internet based bulletin board which gives energy mar-keters, utilities, and other wholesale energy customers, real-time access toinformation regarding the availability of transmission line capability. OASISprovides the ability to schedule firm and non-firm transactions.
With this information, the control area operators can compare the totalscheduled interchange into or out of the control area with the actual inter-change. If the receipt of electricity exceeds the schedule, the control area mustcause the scheduled generation levels to increase. If the receipt is too low,scheduled generation within the control area is reduced. These adjustmentsare typically made a day ahead and then in real time. Since these adjustmentsare on-going simultaneously by all control areas, the adjustments balance out.
The process where individual contracts scheduled within OASIS are iden-tified as to source and customer is known as tagging. This information, whileit may be commercially sensitive, is critical if system operators are to adjustsystem power flows to maintain reliable levels.
Concurrently, the system operators can also evaluate the expected powerflows internal to the control area to determine if adjustments are required inthe generation pattern to insure that all transmission facilities are operatedwithin their capabilities.
Each control area also participates in maintaining the average system fre-quency at 60 hertz. The system frequency can deviate from normal when alarge generating unit or block of load is lost.2 In addition to adjustments madebecause of variations of tie flows from schedule, another adjustment is madeto correct frequency deviations.3 Each control area is required to have an
OPERATION 101
2 Generators larger than 10mW within each control area should be equipped with speed gover-nors which will respond to frequency (i.e., speed) excursions.3 This is called automatic generation control (AGC).

adjustment factor related to frequency in its control logic. The term is calledthe tie-line frequency bias (expressed in mW/0.1Hz).
Additionally, since the control process is responsive, there can be a drift inaverage system frequency, which, in turn, affects the accuracy of any electricclocks. This variation is monitored and for a period of time the target fre-quency reference is adjusted to produce the required compensation. Thisprocess is called Time Error Correction.
There are a variety of market rules, which vary across the country, by whichthe output of individual generators is scheduled. These rules are currently in a state of flux as the FERC moves to a free market system for dispatchinggeneration. We will discuss issues attendant to this effort later in the book.
With the restructuring of the industry, the emergence of merchant powerplant owners, the development of ISOs, RTOs, and for-profit transmissioncompanies, and the implementation of retail access in some regulatory juris-dictions, assigning all reliability responsibilities to control areas makes the jobof defining and applying Standards more and more complicated.This is furthercomplicated since some control areas are acting as transmission serviceproviders. NERC has an effort under way to rationalize this process. It’s begunby defining almost 100 reliability functions that need to be addressed.
Operating Reserves
Each control area must provide operating reserves to restore its tie flows toschedule within 15 minutes following its most severe single contingency. Oper-ating reserves consist of spinning and non-spinning reserve. Spinning reserveis generation that is synchronized and available to supply incremental load ina specified time period. Non-spinning reserve is not synchronized but can bemade available within a short period of time. Interruptible load disconnectionand coordinated adjustments to interchange schedules can be considered aspart of operating reserve.
Each control area must supply reactive resources within its boundaries toprotect its voltage levels under contingency conditions.
While balancing load and generation, each control area is responsible forensuring that the bulk power system is operated to meet a consistent set ofcriteria, standards and procedures. NERC has established operating policiesand planning standards to ensure electric system reliability.The specific detailshave been codified by each of the ten regional reliability councils. In addition,local areas may implement more stringent criteria, standards and procedures,if their situation warrants.
Control areas are also required to coordinate maintenance and protectiverelaying and to have a system restoration plan.
Ancillary Services
FERC in its Order 888 specified Ancillary Services needed to facilitate theoperation of a bulk supply system. These services were grouped into threebroad categories. They are:
102 FUNCTIONING OF THE ELECTRIC BULK POWER SYSTEM

• Required to be provided by transmission providers:• Scheduling, system control and dispatch;• Reactive supply and voltage control by generators;
• Required to be offered by transmission provider;• Regulation (AGC);• Operating reserve—spinning;• Operating reserve—supplemental;• Energy imbalance (hourly mismatches).
• Not required of transmission providers:• Load following (hourly or daily);• Back-up supply;• Real power loss replacement;• Dynamic scheduling;• System black start capability;• Network stability services.
Issues attendant to FERC’s Order 888 will be covered more fully later in thisbook.
Emergencies
At present, two basic philosophies exist concerning potential emergencies.1. Preventative Philosophy. One approach that has predominated in the
United States for many years is preventative operation. What this means is ifa system operator or a pool operator discovers a condition on his system wherea single contingency will cause an overload and possible trip out of anotherfacility, he will adjust the operation of his system to reduce the loading con-ditions to eliminate this potential hazard. With this philosophy power trans-fers, interchanges, and economic dispatches which could be economicallybeneficial are often not made. This is the philosophy recommended by theNorth American Reliability Council.
2. Corrective Philosophy. There is an increasing amount of attention beinggiven to the impact of taking larger risks in the operation of transmissionsystems because of the significant savings that might be made. The correctivephilosophy provides that you do not reduce the transfers until after the con-tingency has occurred. This means that for the high percentage of the timesthat the contingency does not occur, the economic benefits will accrue.However, it does mean for the small percentage of the time when the contin-gency does occur that severe reliability penalties could result through a majordisruption of the power supply.
The preventative approach is generally used throughout the United States.Eventually both the capacity and reliability of transmission networks will haveto be improved simultaneously through development of a highly automated,
OPERATION 103

“smart” power system.4 The grid will need technological advances in fourmajor areas:
1. Improved physical control to expedite grid operations by switchingpower more quickly and preventing the propagation of disturbances;
2. Monitoring systems that can improve reliability by surveying networkconditions over a wide area;
3. Analytical capability to interpret the data provided by the wide areamonitoring system for use in network control; and
4. A hierarchical control scheme that will integrate all the above tech-nologies and facilitate flexible network operations on a continental scale.
Electric systems are now adding these technologies to their transmissionsystems, creating smart networks. The possible future of these “smart” controlschemes will have to be carefully analyzed to recognize and evaluate such apotential future.
Operating Emergencies
NERC requires each system, control area, pool and Region to have a set ofplans to cope with operating emergencies. These plans must cover:
• Agreements for emergency assistance from neighboring systems;• Procedures for system operators;• Authority to shed load to restore generation/load balance;• Procedures for system restoration.
Items to be considered include fuel supply and inventory, fuel switching atgenerators where possible, environmental constraints, reduction of in-systemenergy use, public appeals, implementation of load management and voltagereductions,5 appeals to large customers to reduce usage, running generators atmaximum output, requests for governmental aid to implement energy reduc-tions, and mandatory involuntary load curtailment.
In the event the above actions are insufficient or if the situation deve-lops too rapidly to implement them, each area is required to install under-frequency load shedding. This is a system where protective relays detect a low-frequency condition and actuate the disconnection of blocks of load in an attempt to arrest the decline in frequency and restore 60Hz operationbefore the low-frequency results in the loss of additional generation.
104 FUNCTIONING OF THE ELECTRIC BULK POWER SYSTEM
4 K. Stahlkoph & P.R. Sharp, 2000, Where Technology and Politics Meet, Electric Power Trans-mission Under Deregulation, IEEE.5 The effects and duration of load reductions depend on the characteristics of the load.

PARALLEL PATH FLOW AND LOOP FLOW
Parallel power flows reflect the interconnected nature of the bulk powersystem that we have mentioned previously. Since power flows on all trans-mission paths, it is not uncommon to find circumstances where part of a power delivery within one control area flows on the transmission lines inadjoining areas or where a part of a power delivery between two control areas flows over the transmission facilities of a third area. In addition, loopflows also occur and are the result of generation location and transmissionsystem design and reflect the situation where all systems are supplying theirown load from their own resources but result in power flow on the transmis-sion in other systems. These circumstances have been referred to as a seamsissue.
POWER TRANSFER LIMITS
A primary aspect of a control center’s responsibility toward the reliability ofthe bulk power system is to make certain that the levels of power transfersthat take place are within the capability of the bulk power transmission systemreflecting that area’s operating criteria.
In order to define the amount of transmission capacity available for com-mercial transactions, NERC6 developed the following definitions:
where:
• Available Transfer Capability (ATC) is a measure of the transfer capa-bility remaining in the physical transmission network for further com-mercial activity over and above already committed uses.
• Total Transfer Capability (TTC) is the amount of electric power that can be transferred over the interconnected transmission network in a reliable manner while meeting all of a specific set of defined pre- and post-contingency system conditions.
• Transmission Reliability Margin (TRM) is the amount of transmissiontransfer capability necessary to ensure that the interconnected transmis-sion network is secure under a reasonable range of uncertainties in systemconditions.
Available Transfer Capability ATC Total Transfer Capability TTCExisting Commitments Transmission liability TRMCapacity Benefit CBM
( ) = ( )- - ( )- ( )
Re,
MarginMargin
POWER TRANSFER LIMITS 105
6 “Available Transfer Capability Definitions and Determination”—NERC, June 1996.

• Capacity Benefit Margin (CBM) is that amount of transmission transfercapability reserved by load serving entities to ensure access to genera-tion from interconnected systems to meet generation requirements inemergencies.
Determination of Total Transfer Capability
The total transfer capability is the acceptable magnitude of power flow in onedirection over a group of transmission lines often referred to as an interfaceor a flowgate. A control area may have many of these interfaces both internalto the area and at its points of connection with adjoining areas. The transmis-sion lines comprising an interface are not necessarily at the same voltage orbetween the same substations.
The capability is determined by examining the performance of the trans-mission system for a variety of contingencies to determine if the contingencywould occur, the level of power flow when:
• The loading of an individual transmission line exceeds that line’s capability;
• The bulk power voltage at any substation would be unacceptably low;• The system would become unstable if a contingency occurred.
The Total Transfer Capability is set by the power flow level at the most lim-iting constraint. It can be:
• Pre-disturbance related:• Unacceptable line loadings or bus voltages.
• Disturbance related:• Transient or dynamic instability.
• Post-disturbance related:• Unacceptable line loadings or bus voltages.
For a stability limit or a voltage limit, none of the transmission lines on theinterface may be loaded to its individual capacity. For a situation where theloading on an individual line sets the limit, the loadings on all parallel linesare most probably below (perhaps well below) their capacities. It is these lattersituations that are the reason for interest in the use of phase-shifting trans-formers and in the development of FACTS devices, which would allow thesystem to transmit more power with existing facilities.
The contingencies to be considered when determining the Total TransferCapabilities are detailed in NERC and individual reliability council criteria.As a minimum, the bulk power system is to be operated to what is called theN - 1 criteria. NERC states, “All Control Areas shall operate so that instabil-ity, uncontrolled separation, or cascading outages will not occur as a result ofthe most severe single contingency.”
106 FUNCTIONING OF THE ELECTRIC BULK POWER SYSTEM

Reduction of Power Transfers—Congestion Management
Congestion is a term that is applied to situations where the amount of powerflowing or projected to flow across a group of transmission lines (a flowgateor interface) exceeds its capacity. To relieve the potential overload, the elec-trical operation of the system must be adjusted:
• Reducing power flows by reducing generation in the sending system andincreasing generation or reducing load in the receiving system, or
• Changing the system configuration by opening lines or by closing or seg-menting busses.
This process is covered by NERC’s Transmission Loading Relief Procedure.With the on-going efforts to open the electricity systems for market based
wholesale transactions, complications arise when attempting to redispatch thesystem to eliminate or avoid power transfer limit violations—specifically, howshould economics be factored into the adjustments? One complication is thatthe generating units that might have the most direct effect on reducing thetransfer limit violation might be lower cost than other units further removedfrom the violation.A further complication occurs when the various generatorsthat could relieve the violation are in areas using different market rules. Thisis another aspect of the seams issue.
Congestion limits are essentially economic limits concerned with operationof the power market. The location of these limits is not always the same as thelocation of the actual reliability risks in the transmission system (this is dis-cussed further in the reliability chapter).
PLANNING
Prior to the opening of the transmission system to many different users, theplanning process was reasonably straightforward. The process integrated loadforecasting, generation planning and transmission planning and was usuallydone by one entity, either a company or a power pool. Coordination of planswas done under the auspices of the Regional Councils.
The process normally started with a peak load forecast. In most cases theforecast projected a growth in peak loads.7 The planning objectives were:
• Generation—to have enough generation capacity to meet the projectedpeak load plus a reserve margin;
• Transmission—to connect generators to the grid, to have enough trans-mission capability to reliably deliver generation and firm purchases to
PLANNING 107
7 Many utilities experienced financial difficulties during the 1970s and 1980s when forecast peak loads did not materialize, while, at the same time, costly, large generating units were underconstruction.

existing and new load centers, to accommodate the sharing of reserveswith nearby areas, and to allow economically driven power exchangesboth intra-area and inter-area;
• To provide these services over an extended period of time at minimumcost.
In both cases, the financial return on and of the resulting facilities was regu-lated and based on a cost-of-service perspective.
Regional Councils had agreed upon criteria covering:
• Generation reliability expressed in terms of a target reserve or minimumacceptable loss of load probability; and
• Transmission reliability expressed in terms of a number of disturbancesthat the transmission system had to be able to withstand while meetingthe above stated objectives.
PLANNING STANDARDS
NERC’s Planning Standards8 define the reliability aspect of the intercon-nected bulk electric systems in two dimensions:
1. Adequacy—the ability of the electric systems to supply the aggregateelectrical demand and energy requirements of their customers at alltimes, taking into account scheduled and reasonably expected unsched-uled outages of system elements; and
2. Security—the ability of the electric systems to withstand sudden distur-bances such as electric short circuits or unanticipated loss of system ele-ments.
To these we should add safety for workers and the general public and, espe-cially since September 11th, 2001, an expanded sense of the meaning of theterm security.
Generation Planning
Generation reserve margin targets were established using probability tech-niques relating generating availability and potential load forecast errors to aprobability that for some hours of the year the load could not be supplied.These reserve margins were formally established as design requirements. Themost commonly used target was one day in ten years.
The determination usually reflected, for each year, statistics on the relia-
108 FUNCTIONING OF THE ELECTRIC BULK POWER SYSTEM
8 NERC Planning Standards at www.NERC.com.

bility of individual generators, the expectation of hourly peak loads, the effectof aid from nearby systems, intra-area transmission capabilities and variouslevels of remedial actions by operators.
These probability techniques modeled the effects of having interties withneighboring systems and they demonstrated that relying on emergency assis-tance from neighboring areas could result in dramatic reductions in installedreserve requirements for both areas, providing that the transmission intertieswere capable of supporting the power transfers. The probabilistic techniquesare called loss of load probability for capacity constrained systems, or loss ofenergy probability for energy constrained systems.
Recently, the need for targeted reserve margins has been questioned. Theissue is whether the marketplace should determine the level of installed reserve.Some areas require that load servicing entities ensure that they have sufficientcapacity to supply their peak load and to have a reserve margin available.
Once the amount of load was determined, the generating capacity requiredto achieve the targeted reserve levels was known. The next step was to decideon the specific generating types that would comprise the mix. The startingpoint was always the existing installed base of generation.Analyses were madeto determine whether any of these generators should be retired during theforecast period.Typically, generator units might have useful lives of 40 or moreyears. In a regulated system, these older generators might have significantlyhigher operating costs than newer generators but these were somewhat offsetby a reduction in their capital investment due to depreciation. The resultingcapital and operating costs were rolled into an average system rate charged tocustomers. For some existing units an option was a major overhaul and rebuild-ing sometimes referred to as life extension.
New-generation options had two dimensions; the technology to use andwhether the utility should go it alone or become part of a group building aunit to share the financial burden and the risks. Generation types were selectedbased on the number of hours the new unit was expected to run. For example,if the capacity needed was only during peak hours, a peaking unit would beselected. Peaking units would involve a low capital cost, relatively high oper-ating costs and with short lead times. Conversely, if the unit were to run almostcontinuously, a base load design would be selected. These units typically hadhigh capital coats but low operating costs. Availability of sites for the genera-tion including land, cooling water, and means of delivering fuel were consid-ered as well as the costs and availability of various fuel options. Expansionplans covered multi-year periods so that individual decisions to add specifictypes of capacity were made in a broader context.
The options were screened and evaluated using programs which modeledthe yearly dispatch of all units in the system or power pool in which the unitwould operate. These production costing programs considered yearly loadshapes, generation maintenance and unavailability, sales and purchases fromadjoining areas, intra and inter-area transmission capacity, and individual gen-erator fixed and variable running costs including fuel costs versus electrical
PLANNING STANDARDS 109

outlet (heat rates). Economy sales usually were made based on splitting theresulting savings equally.
Least Cost Planning
Past planners evaluated the means by which the forecasted peak load couldbe supplied. Starting in the 1970s, a process known as least cost planning, cameinto wide use.Trade-offs were made between adding new generation and insti-tuting programs to reduce customer peak load.9 As discussed in the customerload section, peak loads occur for very few hours a year. Reducing the peakload in some cases was a less costly alternate than building new generation.At the time, the financial yardstick was not profits but rather minimumrevenue requirements from customers.
Transmission Planning
NERC specifies transmission systems planning standards that cover the typesof contingencies that must be examined for conditions for all facilities inservice and with facilities out-of-service for maintenance while delivering gen-erator output to projected customer demands and providing contracted firm(non-recallable reserved) transmission services, at all demand levels. Thesecontingencies can result in the loss of single or multiple components. For eachof the contingencies, the system must be stable and applicable thermal andvoltage limits must be observed. For the loss of multiple components, the con-trolled interruption of customer demand, the planned removal of generators,or the curtailment of firm (non-recallable reserved) power transfers may benecessary.10
The standards also require evaluation of the risks and consequences of anumber of extreme contingencies such as the loss of all circuits on a R-O-W,all generators at a generating station, or failure of circuit breakers to clear afault. Individual Regions may develop their own regional planning criteria to reflect circumstances applicable to their own situation. These Regional Criteria are evaluated by NERC to ensure consistency with NERC’s planningstandard.
NERC also covers in its Planning Standards:
• Reliability assessment;• Facility connection requirements;• Voltage support and reactive power;• Transfer capability;• Disturbance monitoring.
110 FUNCTIONING OF THE ELECTRIC BULK POWER SYSTEM
9 Over time pressure mounted in some jurisdictions to expand the customer programs from apeak load reduction focus to an energy reduction focus.10 The Table summarizing the Standards has not been included in this document. The reader canaccess the table at www.nerc.com, Planning Standards.

The present complexity of the NERC Standards reflects the changing stateof the electric utility industry. When NERC and the Regional Councils werefirst formed, their membership was almost entirely utilities and the rules, stan-dards, best practices that were produced relied on voluntary observance bythe members. As the industry has moved to its present structure with manymore participants, NERC has been working to make the planning and oper-ating rules for the utility industry clear, universal, and well documented. To dothis has meant that the volume of the associated material has grown to a pointthat no one text could hope to cover it all. As the footnotes indicate, individ-uals wishing more detail on these matters can find them at NERC’s Web site:www.nerc.com.
As a generation expansion pattern was being developed, transmission plan-ners would address the transmission expansion needed to accommodate thegeneration and the forecast load growth. Development of a transmission planhas been described as part science and part art. There are three situations thatconfront the transmission planner:
1. Connect a new generator or generating station to the grid.2. Connect a new substation to the grid.3. Reinforce the existing grid.
The obvious first step for connecting a new generator or a new distributionsubstation is to build one or more lines to the nearest bulk power substation.However, this may not be sufficient or adequate. An examination is needed tosee if the capability of the existing grid is sufficient to accommodate either.This examination has to consider a wide range of operating conditions includ-ing different load levels, different power transfer patterns on the grid, andvarious maintenance outages. The analysis should evaluate a number of yearsinto the future including additional generation and distribution substationrequirements. It may well be that because of future developments, larger morerobust facilities should be installed initially or, even, that future expansion maymitigate the need for facilities now. For example, if generation is presentlybeing sited outside a generation deficient load area, an initial reaction mightbe to build a large-scale transmission development into that area. What if,however, subsequent generation additions are within the generation deficientarea? The result could be that the transmission additions could be lightlyloaded and do not carry enough power to pay for their costs.
An important consideration is that the transmission additions may notalways be near the new generation. The restriction on the capacity of a sectionof the grid can be far removed from the new generator addition. Otherinstances have been seen where new lines are added to increase stabilitymargins although they carry little if any power themselves.
After examining the need over a sufficiently long time span, decisions areneeded on the voltage level of the new line(s), their thermal capacity, their ter-minal locations, and the circuit breaker arrangements at these locations.
PLANNING STANDARDS 111

Load-Flow Studies. The transmission planning process uses a simulationprogram called a load-flow or a power-flow. This program solves Kirchoff’sequations for a moment in time. It provides, for each condition for a givennetwork topology, load level and generation schedule, the resultant real andreactive power flows in each line and transformer, the voltage at each bus andthe mVAr output of each generator.
The simulation requires an enormous amount of information from the indi-vidual utility and from all utilities whose operations might interact with theplanner’s system. Due to the interconnected nature of the bulk power trans-mission system, this requires modeling of large geographic sections of thecountry in enough detail to capture the effects of power flows on all adjacentsystems or resulting from the generation/load patterns in all adjacent systems.The model allows each control area to be modeled separately. Each controlarea is identified usually by attaching an identifier to each bus and a targetedinterchange is specified. The mW output of one generator in each area is designated as being variable to balance the area’s interchange to the desiredlevel.
Repeated simulations allow the planner to evaluate the performance of thesystem at various levels of power transfers before and after various contin-gencies such as the loss of a transmission line, transformer, or generator. Insome areas of the country since the electric system is considered electricallytight,11 the planner can interpolate the results of various contingencies todetermine the limiting contingency, the limiting element, and the limiting levelof power flow.
Stability Studies. Another simulation program used in the transmissionplanning process is called a stability program. It uses, as a starting point, asolved load-flow program. It expands the representation of generation toinclude various levels of detail about the electrical and mechanical character-istics of the turbine generator, including generator reactance, excitation systemcharacteristics, and turbine characteristics. Representations of the protectiverelay characteristics can also be included.
The program simulates the performance of an electric system over a period of time, usually a few seconds, following a disturbance. The length of time of the simulation and the complexity of the electrical effects beingmodeled determines the amount of detail provided about the turbine generators.
As noted in the discussion of load-flow studies, obtaining the required infor-mation for these studies is a major endeavor.
Short-Circuit Duty Studies. In some areas short-circuit duties are aproblem. Short-circuit duties refer to the ability of a circuit breaker to inter-
112 FUNCTIONING OF THE ELECTRIC BULK POWER SYSTEM
11 The electrical angle across the system is small such that variations in the electrical perform-ance can be considered to be linear.

rupt the current that flows to a fault or the ability of all the elements of thesubstation (bus, transformers, etc.) to physically withstand the mechanicalforces that result from the fault current. Considerations involved are: thenumber of phases involved in the fault, the impedance of the fault, and theelectrical proximity of the generating sources (sources of current).
Planners must evaluate the interrupting capability required at all new sub-stations and at all existing substations since both will be affected by new gen-eration. In most instances, the interrupting capability can be achieved bypurchasing circuit breakers of sufficient capacity and/or by upgrading existingbreakers. In some instances, the required circuit breaker capacity cannot bepurchased. In other cases a complete substation rebuild may be required toprovide needed mechanical strength at a very high cost. Other solutions maybe needed. These solutions include:
• Install fault current limiting devices such as series reactors;• Changing the system configuration by opening bus ties or using back-to-
back dc.
NEW PLANNING ENVIRONMENT
Both the objectives and the process of planning have changed. The degree ofchange depends on the area of the country and how far local regulatoryauthorities have moved the restructuring process, that is, has generationdivestiture and/or retail access been implemented? As a matter of nationalpolicy, wholesale power producers are encouraged and given access to thetransmission grid under the same terms and conditions as the local utilities.
The generation planning process has changed in the new environment tothe extent that a global approach is no longer used. NERC no longer has cri-teria defining the minimum acceptable level of generation reliability. Someregional areas retain a required generation reserve, some do not.12 Generationpricing is based on the market not on costs. With many different companiesbuilding power plants, each decision to build is made with less certainty ofwhat the competitive situation will be going forward.The selection of unit sizesand types is made with a view towards those that will be the most profitable,not necessarily towards those that will result in the overall lowest costs to theconsumer. Many felt, perhaps foolishly, that the market would drive pricesdown.
The design objective for the transmission system is being expanded to include provision for sufficient transmission capability to facilitate a geographically wide scale wholesale power market. FERC is actively seekingchange in the way the transmission system is planned:
NEW PLANNING ENVIRONMENT 113
12 FERC, in its proposed standard market design, specifies a level of generation reserve of at least12%.

• In its Order 2000, it specifies one of the minimum functions of an RTOas, in part, that it “. . . must develop a planning and expansion proposalthat (1) encourage market-motivated operating and investment actions(emphasis added) for preventing and relieving congestion.”
• One of the objectives in its Strategic Plan for FY 2002–2007 is to “Firmlyestablish transmission planning function on a regular basis, with a varietyof technology solutions to meet reliability, security, and market needs.”
It is fairly typical to have a lengthy list of proposed new generation in eachstate. However, only some of the proposals are being implemented. Approvalof new power plants is done under regulatory rules which vary state by state.In some states the process is relatively rapid, in others it is not. Merchantpower plant owners obviously will opt for construction in supportive regula-tory jurisdictions. This then translates into an increased need for transmissioncapability to move power from these states to states where power plant con-struction is hindered, since these latter markets probably will have highermarket clearing costs.
NERC also includes the notion of economic interchange when it definesthe purposes of the transmission system:13
• “Deliver Electric Power to Areas of Customer Demand—Transmissionsystems provide for the integration of electric generation resources andelectric system facilities to ensure the reliable delivery of electric powerto continuously changing customer demands under a wide variety ofsystem operating conditions.
• Provide Flexibility for Changing System Conditions—Transmissioncapacity must be available on the interconnected transmission systems toprovide flexibility to handle the shift in facility loadings caused by themaintenance of generation and transmission equipment, the forcedoutages of such equipment, and a wide range of other system variableconditions, such as construction delays, higher than expected customerdemands, and generating unit fuel shortages.
• Reduce Installed Generating Capacity—Transmission interconnectionswith neighboring electric systems allow for the sharing of generatingcapacity through diversity in customer demands and generator availabil-ity, thereby reducing investment in generation facilities.
• Allow Economic Exchange of Electric Power Among Systems—Trans-mission interconnections between systems, coupled with internal systemtransmission facilities, allow for the economic exchange of electric poweramong all systems and industry participants. Such economy transfers helpto reduce the cost of electric supply to customers.”
114 FUNCTIONING OF THE ELECTRIC BULK POWER SYSTEM
13 NERC Planning Standards I, System Adequacy and Security—Discussion.

While some also stress the requirement to plan a transmission system that willfacilitate the electric market, others stress the need to focus on providing adequate reliability at minimum cost. While the goal of designing a system tofacilitate a wholesale power market is commendable, the means for doing sohave become extremely complex due, in large part, to structural changes beingimplemented to establish the markets.
Transmission planning used to involve dealing with a more or less consis-tent pattern of power flow from known sources to known load pockets. Eventhen, in many areas the time it took to plan and get approval for new trans-mission lines could take many years, even when there were relatively few regulatory jurisdictions involved. Going forward the level of uncertainty has increased dramatically. Uncertainties are of both a technical nature andof a structural/financial nature. Among them are:
• How much transmission capability is needed, in both directions, acrosseach and every existing and future interface and flowgate?
• How is the magnitude of this capability determined since:• In spite of the many numerous proposals to build merchant power
plants, the likelihood is that many will never be built.• The locations and sizes and dispatch patterns of those that will be built
are unknown.• The future of existing power plants may be unknown.• The impact of dispersed generation is unknown.• Of those power plants built, how will they be dispatched, given the com-
mercial sensitivity of the contractual arrangement that they will enterinto for sale of the power or the bidding strategies they will use?
• How will variations in the assumed or best-guess generation expansionplan impact a transmission development plan?
• How will trade-offs between different generation options, FACTS deviceapplications, and load-curtailment measures be identified and evaluatedgiven the different financial perspectives of the various involved parties?
• Is there any potential for realizing economies-of-scale, that is, building ahigher voltage line initially instead of a series of lower voltage/capacitylines?
• Can lines ever be built solely for reliability purposes?• Who will finance and build the transmission?• What will be the rules for paying for use of the transmission?• What types return on transmission investments will be needed?• Given the uncertainties involved, how can a plan gain the requisite regu-
latory approvals, especially if multiple jurisdictions are involved?
NEW PLANNING ENVIRONMENT 115


9
117
Interruptions in the supply of electricity to customers can occur at any hourof the day or night and can last from fractions of a second to many hours oreven days. Interruptions can be caused by disturbances to or malfunctions ofany of the three components of the power system—(1) generation, (2) trans-mission, or (3) distribution. They can also be caused by the unavailability ofadequate resources to supply the customer load. These two attributes of reli-ability are characterized by NERC as security and adequacy.
Data show that over 90% of customer outages are caused by problems orig-inating on the local distribution system.Although generation and transmissionrelated outages are less common than those related to the distribution system,they often have much more serious consequences because of the number ofcustomers affected and the duration of the outage.
Disturbances can be initiated by:
• External events such as:• Environmental factors such as wind, rain, lightening, ice, fire, floods,
earthquakes;• Accidents such as cars hitting poles; and sadly• Sabotage.
• Internal events such as:• Insufficient capacity;
RELIABILITY
Understanding Electric Power Systems: An Overview of the Technology and the Marketplace, byJack Casazza and Frank DeleaISBN 0-471-44652-1 Copyright © 2003 The Institute of Electrical and Electronics Engineers

• Failure of equipment due to electrical or mechanical stresses;• Operating errors or decisions.
Lack of resources can be due to:• Insufficient generation caused by:
• Low load forecasts;• Shortages of fuel due to supply disruptions or delivery/transportation
problems;• Opposition to the construction of required new generating capacity;• Failure of equipment due to electrical or mechanical stresses;• Poor planning;• Excessive maintenance outages;• Regulatory actions restricting the operation of power plants;• Transmission constraints;• Generation being retired because it is non-competitive in the new com-
petitive market.• Insufficient transmission or distribution caused by:
• Low load forecasts;• Opposition to the construction of required new transmission or distri-
bution lines;• Failure of equipment due to electrical or mechanical stresses;• Poor planning;• Intentional outages required because of other infrastructure work, that
is, the widening of roads.
The duration of the interruption will be affected by the severity of the dis-turbance, the power system facilities affected, the redundancy or reserve builtinto the system, and the preparedness of the involved operating entities torespond. Some interruptions are of very short duration because the distur-bance is transient and the system self corrects. Some interruptions, such asthose caused by tornadoes or ice storms, damage significant portions of thesystem requiring many days to restore service.When there are insufficient gen-eration resources, the outages may be of a controlled and rotating nature.Theirduration might be only during peak load hours.
The extent of the interruption will be determined by the initiating distur-bances and the facilities affected. For example, cascading outages caused by afault occurring when a system is operating above a safe level can involve manystates as can a widespread ice storm. Conversely, a distribution pole damagedby a car may affect only a few homes.
An increasingly important aspect of power system reliability is the qualityof service or power quality. With the increasing importance of computers
118 RELIABILITY

and new electronic communication procedures, imperfections in electricservice become increasingly important to the customer. Such imperfectionsinclude:
• Momentary interruptions;• Voltages outside of acceptable limits;• Voltage dips of very short duration.
Protection against power quality imperfections can often be handled by theconsumer. Pressure is mounting, however, for the supplier to improve quality.This raises the question of the responsibility for such improvements in anunbundled power industry with separate companies providing distribution,transmission, and power supply services.
COSTS OF POWER OUTAGES
The costs of electric power outages to American electric customers are gen-erally called “socio-economic” costs. Attempts have been made to quantifythese costs but the estimates vary widely. One source reports that the costs are$26 billion each year and that they have been increasing as the electric powerindustry is restructured. A 2001 report1 from the Electric Power ResearchInstitute (EPRI) states that power outages and problems with power qualitycost the U.S. economy over $119 billion per year.
Numerous impacts of power outages have been identified. Included amongthese impacts are:
• Loss of life due to accidents (e.g., no street lights);• Loss of life of ill and elderly (death rates go up);• Loss of productivity by industry;• Loss of sales by business;• Loss of wages of labor;• Damage to equipment in industry;• Fires and explosions;• Riots and thefts;• Increased insurance rates.
COSTS OF POWER OUTAGES 119
1 “The Cost of Power Disturbances to Industrial and Digital Economy Companies,” June 2001.EPRI.

WAYS TO MEASURE RELIABILITY
Reliability of a system is difficult to measure. Perhaps the best way is throughevaluation of the consequences of possible consumer interruptions. Investiga-tions have shown that the best measure of reliability is that of consumer reaction.
Five conditions that have been identified impact the value an average con-sumer puts on an unsupplied mWh of lost energy:2
1. The activities affected by the curtailment and therefore the time of dayand mix of customers;
2. The number of interruptions;3. Availability of advance warning;4. Weather conditions and therefore the time of year;5. The duration of the interruption.
Figure 9.1 shows that this reaction increases dramatically as the frequencyof outages increase, as the duration of the outage increases, and with the mag-nitude or extent of the outage. The following function presents a means ofevaluating this reaction:3
where K is an empirical coefficient proportional to the consumer’s depen-dence on electricity; F is the frequency of interruptions; T is equal to durationof the interruptions; P is the amount of load interrupted, and t is the time whenthe interruption occurs.
R function of K F T P t= { }, , , , ,
120 RELIABILITY
2 Crampton and Lein, Value of Lost Load, University of Maryland, February 2000.3 J.A. Casazza, Generation and Transmission Reliability, CIGRE Paper �32-11, Paris, France,1970.
NegativeCustomerReaction
NegativeCustomerReaction
NegativeCustomerReaction
Frequency ofinterruption
Magnitude ofinterruption
Duration ofinterruption
Figure 9.1. Consumer reaction to interruptions.
Experience has shown that K increases with increasing consumption ofelectricity per customer, and t is greatest at the time of day, week, or year whenpeople suffer the greatest hardships if service is interrupted. This criterion forreliability evaluation does not consider other curtailments of service, such asvoltage or frequency reductions.These “partial” curtailments are not as impor-tant to most consumers as a complete interruption but they should also beconsidered.
A number of indices have been developed, primarily for the distributionsystem, to provide another measure of reliability:
SAIFI System Average Interruption Frequency Index; measures theaverage frequency of sustained interruptions per customer
SAIDI System Average Interruption Duration Index; measures theaverage time that all customers are interrupted
CAIDI Customer Average Interruption Duration Index; represents the average time required to restore service to the average customer per sustained outage
MAIFI Momentary Average Interruption Frequency Index; tracks theaverage frequency of momentary interruptions, typically definedas less than five minutes
PLANNING AND OPERATING A RELIABLE AND ADEQUATE POWER SYSTEM
As discussed in Chapter 8 the electric utility industry, over time, developedplanning, operating, and design standards to address customer expectations ofreliable service. These standards were at first local in perspective but, as inter-ties were built and the interdependent nature of the system became apparent,many of the standards were expanded to a regional and then a national perspective.
Concurrently, over the last century and continuing to the present, customerexpectations of reliable service have also increased. Outages which once werecommon place are now considered unacceptable. Momentary interruptions,which at one time were noticed by only a few customers, now impact manycustomers because of the widespread use of computers and other electronicdevices.
Underlying the industry’s approach to reliability was the realization that itsefforts should be multi-dimensional:
• Plan the system to have enough generation, transmission, and distribu-tion capacity.
• Design the system to reduce the probability of equipment failure.• Operate the system to remain within safe operating margins.
PLANNING AND OPERATING A RELIABLE AND ADEQUATE POWER SYSTEM 121

• Be prepared to restore the system quickly, in the event of a supply disruption.
In all cases, the industries’ efforts involve a trade-off between reliability andcosts. It would be impossible to build enough facilities or operate with enoughof a reserve margin to have a perfectly reliable system. For example, sometypes of common-mode failures due to causes such as tornadoes, ice storms,or hurricanes involve so many facilities that it would be financially impossibleto design a system to tolerate them. This is why the requirement for restora-tion plans is so important.
The bases for the standards that have been developed are varied.All reflect,in one way or another, a view as to an acceptable level of reliability. Genera-tion planning standards have, in the past, been tied to a statistical measure.Standards for operating the generation and transmission systems are basedprimarily on the collective judgments of utility personnel. Over the years, thesestandards have been accepted and legitimized by local, state, and national reg-ulators in rate cases and in after-the-fact reviews of outages. In many of thesereviews, customer complaints over service reliability and over costs havecaused modifications to aspects of individual standards. For example, problemsin some areas with long restoration times after major storms have led torequirements for detailed and publicized restoration plans reflecting customerinputs.
Many of the industry standards, especially those that relate to the bulkpower system, are being assembled and made applicable at the national levelby NERC and its committees and working groups.4 This effort reflects theexpanded number of participants active in the industry.
Transmission Security and Security Coordinators
NERC policies for dealing with transmission security require that controlareas, individually and jointly, shall develop, maintain, and implement formalpolicies and procedures to provide for transmission security.These policies andprocedures shall address the execution and coordination of activities thatimpact inter- and -intra-Regional security, including:
• Equipment ratings;• Monitoring and controlling voltage levels and real and reactive power
flows;• Switching transmission elements;• Planned outages of transmission elements;• Development of Operating Security Limits;• Responding to operating security limit violations:
122 RELIABILITY
4 See www.nerc.com

• Responsibility for transmission security. When operating security limitviolations occur, or are expected to occur, the control areas affected byand the control areas contributing to these violations shall implementestablished joint actions to restore transmission security.
• Action to keep transmission within limits. Control areas shall take allappropriate action up to and including shedding of firm load in order tocomply with Standard 2.A.2.
They also require that every region, sub-region, or inter-regional coordi-nating group shall establish one or more security coordinators to continuouslyassess transmission security and coordinate emergency operations among thecontrol areas within the sub-region, region, and across the regional boundaries.Transmission operating entities are required to cooperate with their hostcontrol areas to ensure their operations support the reliability of the inter-connection.This includes coordination in the planning of transmission outageswith any system that operations planning studies show may be affected.
Information on reliability issues is also obtained from post incident reviews covering major regional disturbances both in the United States andoverseas. Since the laws of electricity apply to all transmission grids, lessonslearned from overseas blackouts can fruitfully be applied in the United States.
Some specific examples of major disturbances where lessons were learnedare the reports on:
• 1965—Northeast United States blackout;• 1967—Mid-Atlantic Blackout;• 1977—New York City Blackout;• 1978—France Blackout;• 1997—California Blackouts;• 1997—New Zealand Blackouts.
In some instances the lessons learned are technical in nature, that is, thecriticality of voltage support as demonstrated in the French Blackout of 1978.In other instances the lessons are organizational, that is, the need for expandedplanning and operational coordination after the great Northeast Blackout of1965 and the need for better intra and inter-area communication after the New York City Blackout of 1977.
As the structure of the industry evolves, the trade-offs between reliabilityand cost will become more difficult, in that different companies will beinvolved in the supply-delivery chain, and each will have a different perspec-tive on the cost—benefit relationship of reliability. Reliability will depend onwhether the “three musketeers” or the “lone ranger” approach is used. Withthe “three musketeers” approach, problems of one system or company areshared by all in an effort to minimize total societal costs. In the “lone ranger”
PLANNING AND OPERATING A RELIABLE AND ADEQUATE POWER SYSTEM 123

approach, each system or business customers suffer alone the consequencesof its problems. Some believe this will provide motivation for all to meet theirobligations.
Paying for Extra Reliability
One finds in the literature discussions of the customer’s willingness to pay fora greater level of reliability.There are two ways to give greater levels of serviceto individual customers:
1. Provide more redundancy of supply to one customer than to another.2. In the event of a disturbance or insufficient capacity, disconnect or inter-
rupt the customer who doesn’t pay a premium rate for electricity.
Given the reality of how a power system is physically structured, the redun-dancy option has limited application in protecting specific customers againsttransmission facility outages especially when the exposure is to a security vio-lation, that is, loss of a facility. In select circumstances, a larger customer maybe able to have a higher level of local distribution service by providing himwith another distribution feeder or transformer, but extending the option tothe typical customer would become cost prohibitive if individual distributionfacilities were to be targeted to individual customers. The same logic appliesto the transmission grid. Additionally, trying to distinguish between customersat the transmission level during dynamic conditions where instability occurswould be impossible under many conditions.
If the reliability problem is one of adequacy, that is, insufficient resources—when operating personnel have time to take corrective action, customerswilling to pay a higher rate could be given preference when adjustments haveto be made to restore the load—generation balance. At the generation level,individual customers could arrange that their supplier maintain additionalgenerating reserves for them at added cost. The process of implementing sucha plan could rely on either financial mechanisms or physical mechanisms todisconnect customers not opting for higher levels of reliability.
Compliance
In the past, compliance with national reliability standards has relied on thevoluntary cooperation of the companies involved. Procedures are being put in place in some regions for implementation of financial penalties for non-compliance. Recognizing the changing nature of the industry, NERC, theNational Association of Utility Commissioner’s (NARUC), and numerousother organizations are pressing Congress for legislation mandating compli-ance with those standards developed for the bulk power system under the aus-pices of NERC.
124 RELIABILITY

GENERATION
As discussed earlier, generation adequacy standards are of two types: thosecovering the amount of installed generation capacity and those covering theamount of operating generating capacity. Generating capacity has tradition-ally been installed to meet a statistically determined reserve requirement, thatis, an amount of installed capacity over and above the expected peak load obli-gation of the supplier. The amount of required reserve was related to a prob-ably of loss of load.The precise determination was tailored to each system andreflected its planning and operating philosophies.
In the evolving industry, the question is unanswered of whether the levelof installed generation capacity should be a design requirement or should bemarket determined. NERC has removed from its planning criteria a require-ment for a targeted installed reserve. NARUC as part of its National Electricpolicy states:
“Congress should mandate compliance with industry-developed reliability standards on the bulk power system that includes adequate reserve margins(emphasis added) and preserves the authority of the States to set more rigorous standards when deemed to be in the public interest.”
In addition to an installed generation reserve, an operating reserve is also defined. On a day-to-day and hour-to-hour basis, there must at all timesbe sufficient generation synchronized to the grid to meet the load require-ments at that time and to be able to respond to short-term variations in customer load, as well as to cover for the loss of another generator. The indus-try has rules governing the amount of operation reserve required at any one time.The reserve is usually related to the amount of generation that couldbe lost as a result of any one of the group of disturbances. This operatingreserve must be available within 15 minutes and is usually allocated amonggroups of companies who have agreed to jointly maintain these reserves. Theallocation of responsibility to each company is then assigned to individual generating units. Allowance is made to reduce load also as part of operatingreserves.
These reserves and this redundancy must cover both the real and reactiveneeds of the system. If insufficient reactive is available, voltages on the systemwill decline and the system could suffer a cascading power interruption whichresults in a complete blackout.5
Another important consideration in the installed generation picture is thediversity of fuel supply. Consistent with costs, a fuel diverse generation mixprovides an additional level of reliability. As examples, hydro systems areexposed to the impact of droughts; while coal and oil fired systems can be
GENERATION 125
5 A good example of this phenomenon occurred in December 1978, in France, and resulted in thepower supply for the entire nation being shut down.

impacted by a number of disruptions including worker strikes, disruption inboat deliveries of fuel, freezing of coal piles in the winter, etc.
TRANSMISSION
Transmission System Problems
Transmission systems are aging and rapidly growing less adequate. Theaverage age for transmission lines, transmission cables, circuit breakers, switch-gear, substations, transformers, and other equipment is approaching 30 years,with some key facilities more than 75 years old. Needed maintenance has notbeen performed in recent years in order to cut costs and improve profits, andmaintenance needs are growing rapidly. Such maintenance requires equipmentto be taken out of service. Transmission outages on our existing systems canbe expected to continue to increase. It is growing increasingly difficult toschedule such outages without taking large reliability risks or incurring largecost penalties due to the inability to deliver low-cost power.
The ability to develop a reliable transmission system has decreased sharplyin recent years as generators are added and retired from service. Transmissionsystem loading conditions and capacity are affected every time a generatorunit is added or retired. Plans exist for the addition of many new units.Purchasers of existing plants expect to retire those that are not sufficientlyprofitable or where they wish to use the plant site for other purposes. Manyof these plans are being made without recognizing the impact on the trans-mission system. The time needed to reinforce the transmission system is oftenmuch longer than the time required to make generation additions. Publicopposition to new transmission lines cannot be expected to decrease. Gener-ator retirements can be made at any time by the plant owners with very littlenotification. There are no provisions for the transmission reinforcements thatmay be needed because of retirements or who will pay for them.
Capital expenditure reductions, reduced maintenance expenditures,increased transmission outages, lack of time to maintain and reinforce thesystem are all occurring. Needed new transmission lines have not been addedin recent years. (An average of about 13,000 miles of transmission were addedin the United States in the 1990–1992 period, while the average in the1996–1999 period was about 6,000.) This trend is creating the potential for anational disaster.
A basic question is, “Can market forces result in an economical and reli-able transmission system?” In the United States we have three huge synchro-nous systems (Figure 1.3). Each of these synchronous systems is a “singlemachine”. This means that outages, generation and transmission changes,problems in any one area in the synchronous network can affect the entirenetwork. Changes in one location affect not only line loadings and voltages,but also stability limits, short-circuit duties, and required relaying in other
126 RELIABILITY

systems. Problems in California affect the northwest and Arizona. If a generator is lost in New York City, its effect is felt in Georgia, Florida,Minneapolis, St. Louis, and New Orleans. Transmission lines cannot be addedhelter-skelter based solely on the profits for the owner. Locations and designsfor new substations selected by the distribution systems must recognize thefuture of the transmission system which will supply them. The transmissionsystem must be designed as an integrated whole. One cannot design a reliablelow-cost automobile by having separate uncoordinated designs for the brakes,the transmission, the engine, and other essential systems. The same is true for the electrical transmission system. It must be designed as an integratedwhole.
Transmission systems must also be optimized in “three dimensions” in orderto achieve necessary reliability and minimum costs for electric power. Theyshould be optimized “geographically”, that is, the transmission system mustmeet the needs of all who are served by the synchronous network, not just theneeds or the profits of any one system, any one area, or any one region. Theymust be optimized “functionally”, that is, the transmission system must meetboth generation requirements and the requirements of the distributionsystems which they supply.These requirements must be balanced on an overallbasis. And lastly, transmission systems must be developed to meet needs overa significant period of time since they cannot be changed once constructed.We must develop transmission systems that not only meet needs this year,but next year, and five years down the road. We must develop transmissionsystems that also recognize our long-term needs. They must be optimized“chronologically”.
Can market forces be used to develop such optimized long-range trans-mission systems? Under current procedures the locations of planned genera-tor additions are not known beyond one or two years in the future. Manybelieve that the only way to develop a transmission system that meets theneeds of this nation is through a National Power Survey which reviews ourlong-term future needs and the transmission systems have been proposed ona national basis similar to past National Power Surveys.
Planning and Operating Standards
The planning and operating standards for the bulk power system are the mostnational in nature. Originally they were developed by individual utilities, after-wards they were established on a regional council and then on a national basisunder NERC. We’ve discussed elements of these standards in Chapter 8.
Attempts have been made to determine and set the level of transmissionsystem reliability based on the reliability of each of the components of thesystem. Although in theory appealing, this effort flounders on the magnitudeand variations in equipment that constitute a power system. The system isdesigned to reflect good engineering judgment. For example, an engineer canselect a number of designs for a new bulk power substation depending on its
TRANSMISSION 127

criticality. The planner could select a substation with a breaker and a halfarrangement which provides more redundancy and, hence, a higher level ofreliability than a ring bus design provides.
Since the effects of electrical disturbances can spread over a wide, multi-state region, the need for regional coordination in planning and operation isobvious. As the new market rules for the electric system are developed, theconcern is that the rules in any one area do not lower the local reliability stan-dards and thereby impact or impair the reliability of the grid.
Voltage and Reactive Control
Present NERC reliability standards require:
1. Monitoring and controlling voltage and mVAr flows. Each control areaindividually or jointly, shall ensure that formal policies and proceduresare developed, maintained, and implemented for monitoring and con-trolling voltage levels and mVAr flows within its boundaries and withneighboring control areas.
2. Providing reactive resources. Each control area shall supply reactiveresources within its boundaries to protect the voltage levels under con-tingency conditions. This includes the control area’s share of the reactiverequirements of interconnecting transmission circuits.a. 2.1 Providing for reactive requirements. Each purchasing selling
entity shall arrange for (self-provide or purchase) reactive resourcesfor its reactive requirements.
3. Operating reactive resources. Each control area shall operate theircapacitive and inductive reactive resources to maintain system and inter-connection voltages within established limits.a. 3.1 Actions. Reactive generation scheduling, transmission line and
reactive resource switching, etc., and load shedding, if necessary, shallbe implemented to maintain these voltage levels.
b. 3.2 Reactive Resources. Each control area shall maintain reactiveresources to support its voltage under first contingency conditions.
c. 3.2.1 Location. Reactive resources shall be dispersed and locatedelectrically so that they can be applied effectively and quickly whencontingencies occur.
d. 3.2.2 Reactive Restoration. When a generator’s voltage regulator isout of service, field excitation shall be maintained at a level to main-tain interconnection and generator stability.
4. Providing operator information. The system operator shall be providedinformation on all available generation and transmission reactive powerresources, including the status of voltage regulators and power systemstabilizers.
128 RELIABILITY

5. Preventing Voltage Collapse. The system operator shall take correctiveaction, including load reduction, necessary to prevent voltage collapsewhen reactive resources are insufficient.
6. Providing voltage and reactive devices. Devices used to regulate trans-mission voltage and reactive flow shall be available under the directionof the system operator.
DISTRIBUTION
Planning and operation of the distribution system is still done according to thestandards and practices of individual utilities and reflect local reliabilityrequirements and cost considerations. The robustness of the supply to a con-gested urban area will be considerably greater than that to a rural farm dis-trict. However, oversight of the local utility’s performance is usually exercisedby state regulatory authorities. It’s not uncommon for post-incident reviewsto be held by regulators after significant local outages. In many areas, the useof incentive rates-of-return reflecting distribution system performance isbecoming popular. Utility design practices reflect standards developed bynational organizations such as the Institute of Electrical and Electronics Engineers (IEEE).
SUMMARY
Future reliability conditions on electric power systems are not subject to exactanalyses. Load conditions on electric power systems vary continuously as cus-tomer utilization apparatus is switched on and off. As the loads vary and assupply equipment on the system is removed because of the need for main-tenance or because of failure, identical conditions will not exist for two of the8,760 hours in a year. While statistics can be accumulated, many other factorsmust be considered. By far the best individuals or organizations to make esti-mates of future reliability conditions are those most familiar with these factors.They must be close to what is going on, able to estimate future conditions andjudge the sureness of the estimates involved, and to assess the relative risks ofalternative courses of action. Reliable determinations are relative and bestmade by those with great experience.
SUMMARY 129


10
131
CAUSES OF RESTRUCTURING
The electric power industry functioned under federal, state, and local regula-tion since the 1910s. From time to time events occurred which demonstratedthat improvements were needed. Utility management at times failed to stressthe need to minimize costs, with some having the attitude, “Don’t worry aboutit, it will go in rate base and increase our earnings.” Regulators often lackedthe competence to understand the technology, and the system economics,and were more concerned with political results than the public welfare. Insome states being chair of the public utility commission was the path to theGovernorship.
In response to increasing costs of electricity, especially complaints fromindustrial customers, legislators and regulators looked to competition, the holygrail of restructuring! It could be introduced by giving customers a choice ofsupplier. Large industrials such as aluminum companies, chlorine companies,and so on, could chose locations for their future plants based on rates offeredby the companies. Organizations such as the railroads in the northeast, whichhad their own transmission systems that ran along their tracks, could negoti-ate to buy power from various utilities along the way. The goal of those favor-ing restructuring was to increase this competition by providing a choice ofsupplier to all users of electricity.
From the utility viewpoint, restructuring offered the opportunity for gettingout from under often incompetent and unfair regulation. From a large indus-
RESTRUCTURING,COMPETITION AND
DEREGULATION
Understanding Electric Power Systems: An Overview of the Technology and the Marketplace, byJack Casazza and Frank DeleaISBN 0-471-44652-1 Copyright © 2003 The Institute of Electrical and Electronics Engineers

trial user viewpoint, there was a chance to obtain a fairer rate structure andperhaps lower rates through competition. Lastly, many professionals, lawyers,accountants, engineers, company executives, saw an opportunity to gain con-siderable additional income as a result of restructuring.
The restructuring effort needed to consider the unusual characteristics ofelectric power systems as discussed in previous chapters. Electricity cannot bestored, electricity flows as dictated by Kirchoff’s laws and not contracts, anddecisions by one supplier to provide or not provide certain services couldaffect the costs of others connected to the electric power system and the totalcost of electricity.
TYPES OF RESTRUCTURING
Worldwide, three basic types of institutional changes occurred:
1. Privatization;2. Introduction of new competitive procedures;3. New forms of regulation.
In the United States, the majority of the electric supply was from utilitiesthat were already privately owned and the major changes were in competitiveprocedures and forms of regulation. Suggestions to privatize government-owned systems as the PMA’s,TVA, Bonneville, and municipals met with strongpolitical opposition, and were soon dropped. Those supplied by these govern-mental systems would lose their tax and financing advantages, and their costswould increase significantly.
Of particular interest are the new competitive procedures that have beenput into place:
1. The unbundling of generation, transmission, and distribution into sep-arate businesses.
2. Open transmission access.3. Control of the operation of the United States’ transmission system
assigned to a relatively few organizations.4. Creation of a new class of non-regulated generators.5. The formation of organizations for dispatch of all generation.6. Prices for bulk power supply ceased to be cost based.7. Competition in power production was achieved with dispatch based on
quoted prices.8. The construction of many gas-burning power plants by independent
owners.9. Payments for some power production based on ‘market clearing’ price,
which is the highest of any accepted bid prices.
132 RESTRUCTURING, COMPETITION AND DEREGULATION

10. Retail wheeling increasing in stages to smaller and smaller size customers.
11. No central planning.12. Hedging contracts to guarantee prices to purchasers in a volatile
market.
Effects of Restructuring
Some of the effects of these new competitive mechanisms were:
1. Bulk power prices for electricity became exceedingly volatile, changingvery drastically from one day to the next, and reaching levels undreamtof when the new markets were established.
2. The volatility of this pricing fostered the development of organizationsthat offer ‘hedging’ contracts. These contracts guarantee the price ofelectricity to the purchaser thus reducing a cost uncertainty in their oper-ation. This is a form of insurance but, like all other forms of insurance,this has added to the cost of electricity a component that did not existunder the previous institutional structure.
3. The driving force for the operation of the various unbundled companieshas been based on maximizing their own profit, not on minimizing elec-tricity costs.
Many believe that the new competitive mechanisms introduced havecaused very significant cost increases that have harmed the users of electric-ity.While improvements are being made to correct past errors, there is increas-ing emphasis on an increase in regulatory control, centered more on a nationalor regional basis than on state-by-state basis as in the past.
SIX NETWORKS
An understanding of the electric power industry and of the implications ofelectric power policy can be achieved by examining six networks describingthe industry. The networks are:
1. The physical network, which supplies electric power consisting of gener-ators, transformers, circuit breakers, transmission lines, conductors, sub-stations, and so forth. This network can be drawn as a diagram which isused in its analysis. This network has been described in the previouschapters of this book.
2. The fuel/energy network, which includes all sources of energy and fuelwhich are converted by various means, delivered by various means, andutilized by various means. It has been described in Chapter 5. This
SIX NETWORKS 133

network can be diagrammed and used for analysis.1 The energy networksupplies the physical electric network in various ways. Examination ofthe various paths of fuel delivery and their efficiencies is helpful inunderstanding how all energy is consumed. For example, the losses inelectric transmission and distribution can be compared with the lossesand energy required to ship gas through pipelines, and so on. The lossesin the energy network are a significant portion of the total energyresources consumed and require far more attention.
3. The regulatory network, by which the government controls the power industry. In the case of the United States, this includes regula-tion by federal government, the state governments, and by local municipalities. The regulatory network controls pricing, reviews andapproves various aspects of system expansion, and establishes controlson the contractual arrangements between the various business participants.
4. The business network, which includes the ownership of the facilitiesinvolved and the contracts between the various parties. An importantpart of this network is the tariff or pricing arrangements established by the parties, usually in conformance of the restraints of the regulatorynetworks.
5. The money network, which includes the money sources and the flow ofmoney among the various participants. Money sources are analogous togenerators in the electric power system. The money sources are thestockholders, consumers, taxpayers, banks, and so forth. By diagrammingthe sources of money, its flow through the networks, and its use forvarious functions, one can get a far better understanding of how ourfinancial systems work. These money networks have been drawn in thepast, starting in the early 1960s initially by engineers. There are trans-formation points, or coupling points, between the money network, theenergy network, and the power network. Money is provided to andreceived from the other networks.
6. The information, communications, and control network, through whichinformation is transferred. This information is used as part of the oper-ation of the power market for e-commerce, for scheduling and dis-patching the power system and the control of the power system andother energy systems.
It is by understanding the operation of these networks and how the opera-tion of one affects the others that one can begin to comprehend the affects ofvarious policies.
134 RESTRUCTURING, COMPETITION AND DEREGULATION
1 “Reference Energy Systems and Resource Data for Use in Assessment of Energy Technolo-gies” Associated Universities of Office of Science and Technology, April 1972.

CHANGING CUSTOMER REQUIREMENTS
As pointed out by Michael Zimmer,
By 2006, the U.S. Department of Commerce estimated that almost half of theU.S. workforce will be employed by industries that are either major producersor intensive users of information technology and e-commerce products and serv-ices. Information technology and e-commerce industries have contributed overone-third of the Nation’s real economic growth from 1998–1999. The one under-lying constant is that these industries are powered with electricity for manyprocesses, marketing, storage, and operating facilities. Without electricity, pro-vided reliable and consistent quality levels, these technology industries simplycannot operate. The continuing transformation of the electricity industry mayoffer advantages to the Internet and information industries, but it may also offersignificant challenges to meet future growth, pricing, efficiency, and reliabilitystandards for service for these information-based companies. Will quality andservice decline? Will reliability management and responsibility shift? Will decen-tralized systems thrive as utility service is altered?
Increasingly, customers are asking for the ability to obtain from their elec-tricity supplier a higher than normal reliability or quality of service. Claims bysome that the utility system should be able to provide such service are igno-rant of the basic functioning of electric power systems as described previouslyin this book. All customers are served by the same transmission system.
The ability of a restructured competitive electric power industry to changeoverall system designs to meet these future requirements for improved qualityraises key questions. The quality of service depends on coordination of thevarious participants in the system, many of whom are competitors. Therequirement for improving the power supply quality may prove an importantincentive for the development of many new decentralized power sources,resulting in additional industry restructuring changes.
CHANGING CUSTOMER REQUIREMENTS 135

11
137
The physical and fuel energy networks have been described in prior chapters.A third, and equally important network, is the regulatory network. The func-tioning of this network is completely controlled by human beings and humandecisions. It plays a vital role in the functioning of all the other networks, some-times providing specific rules for their functioning while at other times providing restraints within which their operation must be conducted. Fromtime-to-time failures to recognize the need for the regulatory networks to beconsistent with the physics and operational requirements of the other net-works has resulted in problems which have increased costs and decreased thereliability of electric power systems. The results in California and many otherregions in the United States provide outstanding examples.
PRICING AND REGULATION
The reconciliation of the interests of the private ownership of the facilities andsystems that provide electric power and the public interest character of theirbusiness is accomplished by the concept of regulation. Regulation refers to thelaws, and the actions of tribunals established under those laws, governing the business of utilities.
The concept of regulation of private business affected with a public inter-est is not a new one. As long ago as during the reign of the Roman EmperorJustinian, laws were passed regulating the business of privately owned docking
LEGISLATION ANDREGULATION—THE
REGULATORY NETWORK
Understanding Electric Power Systems: An Overview of the Technology and the Marketplace, byJack Casazza and Frank DeleaISBN 0-471-44652-1 Copyright © 2003 The Institute of Electrical and Electronics Engineers

facilities assuring access to all interested individuals. There were a limitednumber of choice sites for docks and, once those were occupied, other com-mercial interests were effectively denied access which was recognized as detri-mental to the necessary commercial activities in the Empire. Since that time,granaries, grist mills, breweries, thoroughfares, and a number of other activi-ties have been considered so important to the public interest that special lawswere passed regulating such businesses.
Electricity providers are regulated at the federal, state, and local levels.Every state has a regulatory agency directly concerned with the activities ofutilities. The federal government has several agencies supervising variousaspects of utilities. Local municipalities regulate land use and, in some cases,certain franchise aspects.
In the past, the principal regulation of electric utilities was by state regula-tory authorities. Federal regulation was generally limited to activities involv-ing interstate commerce or situations in which the national interest wasaffected.
FEDERAL LEGISLATION
The foundation of federal regulation of electric utilities is the Public UtilitiesHolding Company Act of 1935 (PUHCA) and the Federal Power Act (FPA).
Public Utility Holding Company Act of 1935
At the turn of the century, America was dotted many small electric utilities,most of which were isolated plants serving small areas within existing cities.Entrepreneurs began buying up these small utilities to form larger and largersystems.
To construct plants and lines, utility owners had to raise substantial capitalfrom the securities markets. Entrepreneurs used relatively little of their owncapital to control utilities, by purchasing with non-voting debt and only a smallportion of equity. Holding companies provided a means of extending thismethod of leveraging small amounts of capital into ever-larger control acrossmany firms. Through this approach one holding company, the Standard Gasand Electric Company, was able to control assets worth $1.2 billion with anequity investment of only $23,000. Companies of unprecedented scope werecreated. These holding companies produced almost half of the electricity pro-duced in the United States.
A history of financial abuse was associated with these large holding com-panies. The abuses included pyramid financial structures with very high levelsof debt, inadequate disclosure of the financial position and earning power ofholding companies, unsound accounting practices, and abusive affiliate trans-actions. Economic benefits did result, however, through the advantages of theeconomy of scale and coordination of systems geographically and functional-
138 LEGISLATION AND REGULATION—THE REGULATORY NETWORK

ity. They provided better engineering and facilitated the raising of capital. Bythe 1930s reactions to the excessive power and abuses of these large compa-nies lead to the passage of the 1935 Holding Company Act (PUHCA).
PUHCA states that:
“Interstate holding companies, engaged through subsidiaries, in the electricutility business or in the retail distribution of natural or manufactured gas aresubject to regulation under this Act. These companies, unless specificallyexempted, are required to submit reports providing detailed information con-cerning the subsidiaries. Holding companies are subject to the SEC regulationson matters such as structure of their utility systems, transactions among compa-nies that are part of the holding company utility system, acquisitions, businesscombinations, the issue and sale of securities, and financial transactions.”1
“The 1935 Act addressed these problems by giving the Commission authorityover various practices of holding companies, including their issuance of securi-ties and their ability to engage in affiliate transactions. The Act also placedrestrictions on the geographic scope of holding company systems and limited reg-istered holding companies to activities related to their gas or electric businesses.”
In the years following the passage of the 1935 Act, the SEC worked to reor-ganize and simplify existing public utility holding companies in order to elim-inate abuses.2 As a result of PHUCA, there was a large decrease in the numberof utility holding companies. By 1958 there were only 18, as compared to 216in 1938.3
PUHCA effectively “closed the door” on new entrants to the private utilityelectric generation business since any entity owning 10% or more of a utilityhad to divest all of its non-utility assets. The private utility model became avertically integrated utility which supplied generation, transmission, and dis-tribution service in a specified area, that is, a franchise area.
Federal Power Act
The Federal Power Act of 1935 gave the Federal Power Commission (“FPC”)4
regulatory power over the terms, conditions, and rates of interstate and whole-sale transactions and transmission of electric power to ensure electricity ratesthat are “reasonable, non-discriminatory, and just to the consumer.”
FEDERAL LEGISLATION 139
1 The full text of this Act is available on-line at www.law.cornell.edu/uscode/15/ch2C.html2 Testimony of Isaac C. Hunt, Jr., Commissioner, SEC before the Subcommittee on Energy andAir Quality, Committee on Energy and Commerce, U.S. House of Representatives, February 13,2002.3 In the 1990s, due to, in large part to the EPACT of 1992, many new holding companies wereformed. This issue will be explored in Chapter 12.4 The FPC had been established under the Federal Water Power Act of 1920 to encourage the development of hydroelectric power plants. The Commission originally consisted of the Secretaries of War, Interior, and Agriculture.

The FPA changed the structure of the FPC so that it consisted of five com-missioners nominated by the President for five year terms, with the stipulationthat no more than three commissioners could come from the same politicalparty.5 It directed the FPC to divide the country into regional districts for “vol-untary interconnection and coordination”. The Commission had the duty topromote and encourage such interconnection and coordination. The FPC alsohad the authority, when applied for by a utility, to order another utility to phys-ically interconnect and to sell or exchange energy.
Other Federal Laws
In the 1930s, other acts were passed which supported and encouraged thedevelopment of publicly owned utilities or the sale of power generated atpower plants owned by governmental organizations:
• 1933—The Tennessee Valley Authority Act (TVA), which dealt with theprovision of electric service in what were then rural areas. The TVA wasauthorized to generate, transmit, and sell electricity. It could build trans-mission lines as needed.
• 1936—The Rural Electrification Act (REA), which allowed loans toorganizations providing electricity to sparsely populated rural areas.
• 1937—The Bonneville Power Act, which created the Bonneville PowerAdministration responsible for the transmission and marketing of powerfrom Federally constructed dams.
Environmental Laws
Figure 11.1 lists the major Federal laws which deal with environmentalmatters, many of which impact electric utilities.
The National Environmental Policy Act (NEPA) requires federal agenciesto integrate environmental values into their decision-making processes by con-sidering the environmental impacts of their proposed actions and reasonablealternatives to those actions. To meet this requirement, federal agenciesprepare a detailed statement known as the Environmental Impact Statement(“EIS”).
The Clean Air Act is a comprehensive Federal law that regulates air emis-sions from area, stationary, and mobile sources. This law authorizes the U.S.Environmental Protection Agency to establish National Ambient Air QualityStandards (NAAQS) to protect public health and the environment. The goalof the Act was to set and achieve NAAQS in every state by 1975. The settingof maximum pollutant standards was coupled with directing the states todevelop state implementation plans (SIPs) applicable to appropriate indus-
140 LEGISLATION AND REGULATION—THE REGULATORY NETWORK
5 From FERC website www.ferc.gov/about

trial sources in the state. The Act was amended in 1977 primarily to set newgoals (dates) for achieving attainment of NAAQS since many areas of thecountry had failed to meet the deadlines.
On January 1, 2000, the electric industry came under Phase II regulations of theClean Air Act Amendments of 1990. This Act was primarily designed to reducepower plant emissions, specifically sulfur dioxide and nitrogen oxides. Phase I,which began on January 1, 1995, affected 435 generating units . . . Under PhaseII, coverage increased to more than 2,000 units, . . . Since 1995, some generatorshave over-complied with Phase I in order to create excess allowances. This hasallowed them to delay enacting additional strategies that would be necessary forcompliance with Phase II. Strategies that are being used for compliance includ-ing fuel switching/blending, co-firing with natural gas, allowance acquisitions,scrubbers, repowering, and plant retirements.6
This environmental and other Federal legislation brought with it theconcept of quantified emission rights.These rights can be bought and sold, thusfacilitating meeting environmental requirements at minimum cost.
Department of Energy Organization Act
In 1977, the Department of Energy Organization Act created the Departmentof Energy. The law consolidated organizations from a dozen departments andagencies. Under this legislation, the FPC was replaced by the Federal EnergyRegulation Commission (“FERC”).
FEDERAL LEGISLATION 141
❑ Clean Air Act (CAA)❑ Clean Water Act (CWA)
❑ Emergency Planning & Community Right-To-Know Act (EPCRA)❑ Endangered Species Act
❑ Federal Insecticide, Fungicide and Rodenticide Act (FIFRA)❑ Freedom of Information Act (FOIA)
❑ National Environmental Policy Act (NEPA)❑ Occupational Safety and Health Act (OSHA)
❑ Oil Pollution Act of 1990 (OPA) Pollution Prevention Act (PPA)
❑ Resource Conservation and Recovery Act (RCRA)❑ Safe Drinking Water Act (SDWA)
❑ Comprehensive Environmental Response, Compensation and Liability Act(CERCLA or Superfund)
❑ Superfund Amendments and Reauthorization Act❑ Toxic Substances Control Act (TSCA)
❑
Figure 11.1. Major environmental laws.Source: www.epa.gov
6 This paragraph is from the EIA report Electric Power Annual 2000, Volume 1, August 2001.

PURPA
The Public Utilities Regulatory Act (PURPA) was one of a group of actsenacted in 1978 by Congress under the composite name of the NationalEnergy Act (NEA). The NEA also included the National Energy Conserva-tion Policy Act, the Power Plant and Industrial Fuel Use Act, the Energy TaxAct, and the Natural Gas Policy Act. Congress was responding to a numberof issues that occurred during the 1970s which were impacting the cost or avail-ability of power:
• The Arab oil embargo, which affected both the cost and security of theNation’s oil supply;
• A perceived developing shortage in the nation’s proven reserves ofnatural gas7;
• The rapid and steep increase in the cost of building nuclear power plants;• The impact on power plants resulting from the Clean Air Act and other
environmental legislation of the period;• The slowdown in economic growth and its negative impact electric
consumption, making many new power plants unneeded although theutilities were looking to recover their investments by raising their rates.
The many reasons cited in the literature for passing these laws can be com-bined into four main categories:
1. Lower the nation’s oil and gas use.2. Lower customer consumption by promoting efficiency.3. Diversify the industry by promoting alternate energy technologies.4. Lower costs to the consumer.
PURPA encouraged the development of alternative generation sources des-ignated as “qualifying facilities” (“QFs”). There are two main types of QFs:
1. Cogenerators, which used a single fuel source to produce electric energyas well as another form of energy, such as heat or steam; and
2. Small power producers, which used renewable resources including solar,wind, biomass, geothermal, and hydro-electric power as their primaryenergy source. Each generator had to have a capacity less than 80mW.
QFs were exempted from regulation under PUHCA and the FERC so thatthe limitation on ownership contained in the PUHCA was bypassed.
Under Section 210 of PURPA, local utilities were required to purchase
142 LEGISLATION AND REGULATION—THE REGULATORY NETWORK
7 The shortages disappeared after price controls on natural gas were lifted in the 1980s and devel-opment began again.

power from QFs at a set price set by state public utility commissions, which was not to exceed the utility’s avoided costs, and to sell back-up power to QFs.The amounts to be paid to the OFs were fixed for the length of the contracts.In many instances, the estimates of avoided costs used by some state commis-sions proved to be too high because of excessively high forecasts then prevail-ing of future oil prices. Subsequently, many utilities found themselves withobligations to buy power in the new marketplace at prices significantly abovethe pre-vailing levels. These contractual obligations were a major componentof the stranded cost issue which affected many utilities’ positions in the 1990sas the industry moved to a new posture on the ownership of wholesale generation.
Some states required utilities to enter into contracts with QFs, even whenthe utilities did not require the capacity. Recognizing these problems, in thelate 1980s some states implemented competitive bidding procedures forrequired new capacity.
The development of OFs had mixed results in the short range. Additionalgenerating resources were built using alternate or more efficient fuel but atthe cost of steadily increasing prices for electricity. Regardless of the originalrationale, PURPA’s long-term effect was to introduce competition into thegeneration sector of the electricity market by creating a market for electricityproduced by non-utility power producers.
PURPA also strengthened the FERC’s power to order interconnections ifit is in the public interest, or encourages conservation. The Commission wasalso given the authority to require a utility to provide transmission service(wheeling) to another utility. The Commission could order a utility to providesuch service if it found such order:
“(1) is the public interest,“(2) would—
“(A) conserve a significant amount of energy,“(B) significantly promote the efficient use of facilities and resources, or“(C) improve the reliability of any electric utility system to which the order
applies . . .”
Certain conditions had to be met before the Commission could order inter-connection or wheeling. The conditions included:
• Does not cause uncompensated economic loss;• Does not place an undue burden;• Does not impair reliability;• Does not impair ability to render adequate service.
The Commission could also exempt electric utilities from state laws, rules,or regulations which prevent voluntary coordination. PURPA also directed
FEDERAL LEGISLATION 143

the FERC “study the opportunities for (a) conservation of energy, (b) opti-mization in the efficiency of use of facilities and resources, and (c) increasedreliability, through pooling arrangements. The Commission could recommendto electric utilities that such utilities should voluntarily enter into negotiationswhere the opportunities for savings exist. The Commission was required toreport annually to the President and Congress regarding any such recom-mendations and subsequent actions taken by electric utilities, by the Com-mission, and by the Secretary under this Act, the Federal Power Act, and anyother provisions of law.”
Energy Policy Act (“EPACT”) of 1992
This wide reaching act contained further modifications to PUHCA and to theFPA intended to further increase competition in the generation sector.
PUHCA Modifications. PUHCA was modified to allow a new class of gen-eration ownership, called Exempt Wholesale Generators (EWGs), to engagein the wholesale electric power market.
• EWGs are free from regulation under PURPA.• Both registered and exempt holding companies can own EWGs.• Utilities can buy electric energy from EWGs with which they are
affiliated.
The law included provisions that require state regulators to review certainaspects of the financial implications of long term wholesale power contractsbetween utilities and EWGs. State PUCs have access to the “books, accounts,memoranda, contracts, and records of” any EWGs selling electricity to a utilitysubject to its jurisdiction, to the EWG, and to any associated company to theEWG including another utility or a holding company.
The act also allowed, subject to certain restrictions, exempt holding com-panies to purchase one or more foreign utilities.8
FPA Modifications. In order to provide a wide market for this new genera-tion, the FPA was modified to require any utility providing transmissionservice to supply such service to anyone generating electric energy for sale forresale. The act required that the transmitting utility enlarge its transmissioncapacity where necessary to provide such services. The intent was to create anopen-access transmission system. FERC was given authority to issue orders toimplement this policy provided that the reliability of the electric systemsaffected by such an order would not be impaired.
144 LEGISLATION AND REGULATION—THE REGULATORY NETWORK
8 To enable investments by existing electric utilities in EWGs and to purchase or invest in foreignutilities, a large number of new holding companies were formed in the United States in the 1990s.Many utilities that purchased overseas utilities in the 1990s were forced to sell then in the early2000s to reduce their high level of debt.

The law contained two perspectives on the use of the transmission system.9
1. The owners of the transmission were to be adequately recompensatedfor the use of the transmission; and
2. The rates charged should be economically efficient and . . . , just and reasonable and not unduly discriminatory.
FEDERAL REGULATORY AGENCIES
FERC10
The Federal Energy Regulatory Commission (“FERC”) is an independentregulatory agency within the Department of Energy. FERC was createdthrough the Department of Energy Organization Act in October 1977. At thattime, its predecessor, the Federal Power Commission (“FPC”) was abolished,and the new agency inherited most of the FPC’s responsibilities. FERC:
• Regulates the transmission and wholesale sales of electricity in interstatecommerce:• For private utilities, power marketers, power pools, power exchanges
and independent system operators;• Reviews rates set by the Federal Power Marketing administrations, such
as the Bonneville Power Administration;• Confers exempt wholesale generator status under the EPACT;• Certifies qualifying small power production and cogeneration facilities.
• Licenses and inspects private, municipal and state hydroelectric projects.• Oversees environmental matters related to natural gas, oil, electricity, and
hydroelectric projects.• Regulates the transmission and sale of natural gas for resale in interstate
commerce.• Regulates the transmission of oil by pipeline in interstate commerce.• Administers accounting and financial reporting regulations and conduct
of jurisdictional companies.
FEDERAL REGULATORY AGENCIES 145
9 “Wholesale transmission services are to be provided at rates, charges, terms, and conditionswhich permit the recovery by such utility (the transmitting utility) of all of the costs incurred inconnection with the transmission services, including, but not limited to, an appropriate share, ifany, of legitimate, verifiable and economic costs, including taking into account any benefits to thetransmission system of providing the transmission service, and the costs of any enlargement oftransmission facilities. Such rates, charges, terms, and conditions, shall promote the economicallyefficient transmission and generation of electricity and shall be just and reasonable, and not undulydiscriminatory or preferential.” The Energy Policy Act of 1992, Title VII—Electricity, Subtitle B—Federal Power Act; Interstate Commerce of Electricity, Section 722, Transmission Services.”10 The material in this section is from the FERC’s Website: www.ferc.gov

• Oversees the issuance of certain stock and debt securities, assumptionof obligations and liabilities, and mergers;
• Reviews the holding of officer and director positions between top offi-cials in utilities and certain other firms they do business with, and;
• Approves site choices as well as abandonment of interstate pipeline facilities.
Its legal authority comes from the Federal Power Act of 1935 (FPA), theNatural Gas Act (NGA) of 1938, the Natural Gas Act (NGPA) of 1978,the Public Utility Regulatory Policies Act (PURPA) of 1978, and the EnergyPolicy Act (EPAct) of 1992.
SEC11
The SEC defines its role as: “The SEC also oversees other key participants inthe securities world, including stock exchanges, broker-dealers, investmentadvisors, mutual funds, and public utility holding companies (emphasis added). . . the SEC is concerned primarily with promoting disclosure of importantinformation, enforcing the securities laws, and protecting investors who inter-act with these various organizations and individuals.”
Its legal authority comes from the Public Utilities Holding Company Act(PUHCA) of 1935. Because of its role in addressing issues involving securi-ties and financings, the SEC was charged with administering the Act.
Environmental Protection Agency (EPA)12
The EPA was established in July 1970 in response to the growing publicdemand for cleaner water, air, and land. “The mission of the U.S. Environ-mental Protection Agency is to protect human health and to safeguard thenational environment—air, water, and land—upon which life depends.”
In part, “EPA’s purpose is to ensure that environmental protection is anintegral consideration of U.S. policies concerning natural resources, humanhealth, economic growth, energy (emphasis added), transportation, agricul-ture, industry, and international trade, and these factors are similarly consid-ered in establishing environmental policy.”
EPA focuses on three main areas regarding NEPA compliance:
1. Coordinating the review of all Environmental Impact Statements (EISs)prepared by other federal agencies;
2. Maintaining a national EIS filing system and publishing weekly noticesof EISs available for review and summaries of EPA’s comments; and
146 LEGISLATION AND REGULATION—THE REGULATORY NETWORK
11 The material in this section is from the SEC’s Website: www.sec.gov12 The material in this section is from the EPA’s Website: www.epa.gov

3. Assuring that EPA’s own actions comply with NEPA and other envi-ronmental requirements.
Department of Energy (DOE)13
The Department of Energy’s mission is to ensure national security. Some of the goals of three of DOE’s four departments directly impacts the utilityindustry:
• The energy program to:• Increase domestic energy production;• Revolutionize our approach to energy conservation and efficiency;• Promote the development of renewable and alternative energy sources.
• The environmental program to:• Permanently and safely dispose of the nation’s radioactive wastes.
• The science program to:• Sponsor cutting-edge science and technology research and development
that revolutionizes how energy is found, produced, and delivered.
As part of its mission, the DOE has sponsored studies relating to the electricutility industry in a restructured environment.14 Many experts consider thesestudies inadequate for setting future national policies.
Federal Legislation Under Consideration
As of early June 2003, Congress is debating the provisions of the Energy PolicyAct of 2003. There are versions in both the House and the Senate. The Houseversion of the bill has been approved by the House; the Senate’s version is stillunder discussion. Once the Senate passes its version of the legislation, a com-mittee of members of both houses will be formed to reconcile the differentbill provisions. As with prior energy legislation, the proposals are far reachingcovering numerous issues including, but not limited to, oil and gas, coal, nuclearenergy, renewable energy, energy efficiency, research and development andelectricity.
In May 2003, FERC’s Chairman announced that FERC, at the request ofthe Senate Energy Committee Chairman, would wait until Congress took finalaction on the new legislation before it finalized its plan to implement the pro-posed SMD. This delay effectively delays implementation of the SMD untilmid 2005, at the earliest.
FEDERAL REGULATORY AGENCIES 147
13 The material in this section is from the DOE’s Website: www.doe.gov14 “Maintaining Reliability in a Competitive U.S. Electricity Industry, Final Report of the TaskForce on Electric System Reliability September 29, 1998”;“The National Transmission Grid Study,U.S. Department of Energy May 2002.”

STATE REGULATORY AUTHORITY
All states regulate the retail rates and tariffs of investor-owned utilities(IOUs). Some states regulate the rates and tariffs charged by municipal andcooperative utilities, generally on a more limited basis than for IOUs. Munic-ipal utilities are an aspect of local government and the fact that the local electorate can exercise control over the policies of the municipal utility by itsvoting rights is considered generally to be an effective form of regulation notrequiring further supervision by a state agency. The customers of cooperativeutilities are its direct owners, and direct the activities of the utility by theirvote.
Even so, a number of states in varying degree allow their regulating agencyto supervise the rates and tariffs of municipal and cooperative utilities. In 20states, the regulatory authority has at least limited jurisdiction over the ratesof municipal utilities; in 30 states, the regulation of rates by the state agencyextends to cooperatives.
As noted earlier, oversight of many federal environmental regulations wasgiven to the individual states.
Many states consider some aspects of the Federal regulation and legislationcurrently (as of 2003) proposed as a major threat to their ability to controlelectricity costs and service reliability in their jurisdictions.
RECENT FEDERAL REGULATION IMPACTING THE ELECTRIC INDUSTRY
While legislation establishes the basic policies for electric power, the imple-menting of these policies is in the hands of the various regulatory agencies.While all of the previously cited agencies play a role in the regulation of theelectric power industry, FERC plays the most important role. FERC is in the process of implementation of the “’92 EPACT”. It has done so with a seriesof orders; Orders 888 and 889 and Order 2000. Presently it is continuing itsactivities with the SMD-NOPR. A review of these key FERC decisions andprocedures is essential to understanding the functioning of the electric powerindustry. The implementation steps FERC mandated have involved a multi-stage approach as lessons have been learned as the process has evolved.
Orders 888 and 889
FERC Issued Orders No. 888 and No. 889 in April 1996, intending “to removeimpediments to competition in the wholesale bulk power marketplace and tobring more efficient, lower cost power to the Nation’s electricity consumers.”Further, they were to “. . . remedy undue discrimination in access to themonopoly owned transmission wires that control whether and to whom elec-tricity can be transported in interstate commerce.”
148 LEGISLATION AND REGULATION—THE REGULATORY NETWORK

These orders had three goals:
1. Promotion of wholesale competition through open access, non-discrim-inatory transmission services by public utilities;
2. Recovery by public utilities and transmitting utilities of stranded costs;3. Establishment of an open access same time information system and
standards of conduct.
All public utilities that owned, control, or operate facilities used for trans-mitting electric energy in interstate commerce were required:
• To file open access non-discriminatory transmission tariffs that containminimum terms and conditions of non-discriminatory service15;
• To take transmissions service (including ancillary services) for their ownnew wholesale sales and purchases of electric energy under the openaccess tariffs;
• To develop and maintain a same time information system that will giveexisting and potential transmission users the same access to transmissioninformation that the public utility enjoys (OASIS).
• To separate transmission from wholesale power service functions (func-tional unbundling instead of the more draconian step of corporateunbundling) meaning that they:• Take wholesale transmission services under the same tariff of general
applicability as they offer their customers;• State separate rates for wholesale generations, transmission, and ancil-
lary services;• Rely on the same electronic information network that their transmis-
sion customers rely on to obtain information about the utilities’ trans-mission systems.
The orders also:
• Clarified federal/state jurisdiction over transmission in interstate com-merce and local distribution;
• Identified ancillary services16 required for the functioning of the trans-mission system;
• Provided guidance regarding the formation of Independent System Oper-ators (ISOs) which would be subject to FERC’s authority, which will bediscussed in Chapter 13.
RECENT FEDERAL REGULATION IMPACTING THE ELECTRIC INDUSTRY 149
15 The Order included a pro-forma open access tariff.16 See Chapter 8 for a list of ancillary services.

Eleven principles for ISOs were identified to ensure that the operation ofthe transmission system would not favor the utility owners. ISOs must:
1. Be structured in a fair and non-discriminatory manner;2. Have no financial interests in any market participant (neither the ISO
nor its employees);3. Provide open access at non-pancaked rates, that is, a single unbundled
grid-wide tariff;4. Have primary responsibility for the short-term reliability of the grid—
by complying with NERC and regional standards;5. Have control over the operation of the interconnected transmission
facilities;6. Identify constraints on the transmission system and take operational
actions to relieve them;7. Have pricing policies for transmission and ancillary services that
promote efficient use of investments in generation and transmission;8. Have incentives for efficient management and administration procured
in the market;9. Develop mechanisms to coordinate with their neighbors;
10. Establish an alternate dispute resolution process;11. Make transmission system information publicly available (OASIS).
Order 2000
In December 1999, FERC issued Order 2000 dealing with Regional Trans-mission Organizations (RTOs). FERC stated “continued discrimination in theprovision of transmission services by vertically integrated utilities may also beimpeding full competitive electricity markets” and that its “goal is to promoteefficiency in wholesale electricity markets and to ensure that electricity con-sumers pay the lowest price possible for reliable service.” To address thisconcern, FERC took its next step in defining its requirements for an inde-pendent transmission provider. It required “. . . that each public utility thatowns, operates, or controls facilities with the transmission of electric energy ininterstate commerce make certain filings with respect to forming and partici-pating in an RTO.”
• It established minimum characteristics and functions for RTOs.• It stated it would sponsor a collaborative process by which public
utilities and non-public utilities that own, operate, or control interstatetransmission facilities may form or join RTOs; in consultation with stateofficials as appropriate.
• It gave a time line for public utilities to make filings to initiate operationof RTOs.
150 LEGISLATION AND REGULATION—THE REGULATORY NETWORK

FERC specified four minimum characteristics and eight functions of anRTO.17 To some extent these mirrored the eleven principles specified for ISOs.They differed in that the RTO material included provisions for planning andexpansion and for management of congestion and parallel path flow.
Tariff Basis
A key FERC requirement is that transmission systems must be open to allpotential users on a non-discriminatory basis. This involves the rights to usethe facilities and the tariffs to be charged. It requires that all others can alsouse a transmission system built to supply a specific group of consumers on thesame basis as the original users.
A major item of contention is the return that should be allowed on newtransmission investments, with transmission owners and potential transmissioninvestors considering the rates of return on investment proposed by FERC tobe too low to provide needed profits and to justify the significant additionalinvestment that is required.
Transmission Rights
Transmission rights define property rights and not only entitle market partic-ipants to the financial benefits associated with the use of a transmission system,but also encourage investment in transmission infrastructure by providing acommodity that is fixed in nature and can be traded in an open market.
There are two types of transmission rights: physical transmission rights(PTRs) and financial transmission rights (FTRs).
Physical Transmission Rights. PTRs provide the owner with the exclusiveright to transport a pre-defined quantity of power between two locations ona transmission network and, importantly, to deny access to the network bymarket participants that do not hold transmission rights. Further, PTRs offerthe two necessary features of transmission rights. They provide clearly definedproperty rights because once the PTR is purchased, the holder of that right isassured that capacity will be reserve exclusively for the transmission of powerunder that right. Also, during periods of high demand, the PTR can be sold toanother party giving them the right to use that same capacity. With a PTR,transmission costs can be determined in advance.
PTRs present numerous problems. First, the right of the PTR holder to self-dispatch can interfere with the transmission system operator’s efforts to effi-
RECENT FEDERAL REGULATION IMPACTING THE ELECTRIC INDUSTRY 151
17 The minimum characteristics of an RTO were specified as: independence, scope and regionalconfiguration, operational authority, and short-term reliability.The minimum functions of an RTOare: tariff administration and design, congestion management, parallel path flow management,ancillary services, OASIS mode and calculate and publish on it total transmission capability (TTC)and available transmission capacity (ATC), market monitoring, planning and expansion of thetransmission system, interregional coordination of both reliability and market issues.

ciently schedule and dispatch the system. This can interfere with the reliabil-ity of the operations of the transmission system. This reliability issue can beaddressed by issuing an amount of PTRs that represent less than the fullcapacity of the system. However, this is inefficient and would prevent costsavings from being realized that result from increasing output in inexpensivelocations and decreasing output in more expensive locations.
Moreover, the PTR holder’s ability to exclude access to the transmissionmarket presents a problem. If a generator holds a PTR for transmission service from point A to point B and owns generation at point B, it could main-tain an artificially high price at point B by preventing generators at point A from transmitting power across the transmission system. Thus, the most efficient generators might be at point A, but by withholding transmissioncapacity, the generator at point B could maintain pricing inefficiencies for itsgain.
Financial Transmission Rights. FTRs are contracts between a market par-ticipant and the transmission system operator.While FTRs are similar to PTRsin that they are defined from a source to a destination and are denominatedin a MW amount, the key difference is that FTRs do not entitle their holderto an exclusive right to use the transmission system. Instead, FTRs are trad-able rights that are automatically assigned to those users that provide thesystem with the highest value. Importantly, FTRs have no adverse impact uponeconomic dispatch because the contracts underlying the FTRs are settledoutside of the physical dispatch of the system.
FTRs provide their holders with the right to payments equal to the energyprice difference between the source and the destination locations. These pay-ments are funded by the congestion payments that arise when energy is pur-chased from lower-priced regions to be sold in higher-priced regions and thereis insufficient transmission capability causing congestion on the transmissionsystem.
FTRs remain one of the most dynamic of issues, since it requires an entirelynew perspective at how to fund grid expansion. These issues are complex.FTRs can be viewed as physical, offering effectively an admission ticket toallow the holder to schedule a transmission transaction, or as financial, asfavored in the Northeast, which offers the holder a stream of revenues evenif it does not deliver or receive physical energy. It has become apparent,however, that the level of congestion payments is insufficient to induce con-struction of new transmission to relieve transmission bottlenecks.
Average System versus Incremental Costs
Another major question is the cost to be charged for use of a transmissionsystem. For example, when a generator is added to the system, a number oftransmission costs may be involved:
152 LEGISLATION AND REGULATION—THE REGULATORY NETWORK

1. The costs to connect the generation to the system;2. Reinforcement of or additions to the transmission system, either in the
vicinity of the generation addition or possibly hundreds of miles awayin other systems;
3. Changes and replacements in protection and control systems, such ascircuit breaker replacements, and new relaying arrangements;
4. The increase in costs resulting from transmission outages while the necessary connection and reinforcement work is done.
One approach is to have the new generator pay all of the above additionalcosts. Additional transmission costs can also be incurred if a generator unit isretired, causing increased loading on certain transmission facilities. This raisesthe question of when the costs would otherwise be incurred if the generatoraddition or retirement were not made.
The other approach is to include all transmission costs except those of the direct connection in overall system tariffs. This raises the question of why should the existing generators and consumers have to pay more for trans-mission service because one party has added or retired a generator? It alsoraises doubts about the selection of the most economic generation additionssince the system costs, which are subsidized by all customers, may be muchlarger for one than another, but do not enter into the competitive decisionprocess.
STATE REGULATION
Complicating the development of the regional markets were differingapproaches that individual states took with respect to utility restructuring.State activities with respect the utility restructuring tended to mirror the relative cost of electricity in their states. States with higher costs generallyimplemented more aggressive restructuring, over and about what FERCrequired, than those with lower costs.
The experience in California has severely reduced the popularity of staterestructuring activities. State restructuring activities included:
• Some form of immediate rate reduction and freezing for a specifiedperiod thereafter with provision for stranded cost recover;
• Mandated or encouraged generation plant divestiture;• Requirements for retail access.
Customer Choice
A major advantage claimed for restructuring is the provision of “customerchoice.” Customers would have the ability to decide from which companies
STATE REGULATION 153

would provide their electric power. Theoretically, this competition might leadto lower electricity prices. The existing distribution system would continue todeliver the power, and would continue to be regulated. Figure 11.2 shows thestates that have enabled customer choice as of February 2003. In general, avery small percentage of the customers having the ability to choose anotherpower supplier have used it. Of those that have switched the majority havebeen industrial and large commercial customers.
Metering
Customer choice has required significant additional metering expenses so thatthe data required for the billing of supplies to many consumers having differ-ent suppliers could be handled. It has also become necessary to meter use overprecise time frames to accommodate new usage rates.
Distribution Rates
In the past, distribution system rates were based on imbedded investment costsand actual operating costs. This procedure is being continued. However,increased attention is being placed on performance based rates, that is, rates
154 LEGISLATION AND REGULATION—THE REGULATORY NETWORK
Status of State Electric Industry RestructuringActivity As of February 2003
Retail access is either currently available to all or some customers or willsoon be available:
❑ Arizona, Connecticut, Delaware, District of Columbia, Illinois,Maine, Maryland, Massachusetts, Michigan, New Hampshire, NewJersey, New York, Ohio, Oregon, Pennsylvania, Rhode Island, Texas,and Virginia. (In Oregon no customers are currently participating inthe State’s retail access program, but the law allows non-residentialcustomers access).
States are not actively pursuing restructuring:❑ Alabama, Alaska, Colorado, Florida, Georgia, Hawaii, Idaho,
Indiana, Iowa, Kansas, Kentucky, Louisiana, Minnesota, Mississippi,Missouri, Nebraska, North Carolina, North Dakota, South Carolina,South Dakota, Tennessee, Utah, Vermont, Washington, WestVirginia, Wisconsin, and Wyoming. (In West Virginia, theLegislature and Governor have not approved the Public ServiceCommission’s restructuring plan, authorized by HB 4277. TheLegislature has not passed a resolution resolving the tax issues of thePSC’s plan, and no activity has occurred since early in 2001).
States where there is a delay in the restructuring process or theimplementation of retail access:
❑ Arkansas, Montana, Nevada, New Mexico, and Oklahoma.
California is the only state where direct retail access has been suspended.
Figure 11.2. Status of state electric industry restructuring activity as of February 2003.§§§§
§§§§ Information extracted from information at EIA Website: www.eia.doe.gov

that depend on the quality and reliability of service, and the overall responseto customer needs.
State and Local Environmental Requirements
State and local laws cover a number of environmental and safety matters.Local communities often must issue building permits. These requirements canmake very difficult the ability to build transmission and transmission facilitiesneeded in a regional basis. Under various Federal Environmental Laws, stateauthorities have been given responsibility for ensuring utility compliance.Insofar as transmission line approvals, almost all states require examinationof environmental compatibility, as well as public need prior to approving newtransmission lines.
OVERALL REGULATORY PROBLEMS
The legislative and regulatory networks discussed above are obviouslycomplex and often create problems because of:
• Lack of understanding by regulators and legislators of the technical andeconomic functioning of electric power systems;
• Conflicts between states and the federal government over policy andauthority;
• Conflicting regulatory priorities, that is, environmental concerns versusthe requirement of low priced electricity.
Many believe we need far greater coordination between our legislation,regulation and power system technology.
OVERALL REGULATORY PROBLEMS 155


12
157
INVESTMENT AND COST RECOVERY
As with any other business, the investors in the electric power business expectto receive a return on their investment commensurate with the risks involvedand a return of their investment over a reasonable period of time. Prices mustbe set to enable the investors to recover all their costs, including taxes, plus a return on their investment, and a return of their investment. The return ontheir investment, they believe, should justify the perceived risks they aretaking. Ultimately, the economic justification for investments depends on theresulting costs for the product or service. While prices must be adequate, theyare affected by commercial policies, subsidies, taxes, and other factors whichare subject to change and man-made decisions.
The electric utility business from its inception has been capital intensivewith the expensive facilities installed having long service lives and, therefore,long periods required for the recovering of the investments involved.
Both engineers and economists had found in the past that a vertically inte-grated power company having exclusive rights to serve a “franchised” areaprovided significant benefits since it facilitated the long-range optimization ofthe total supply system from the fuel source to the customer’s meter. Signifi-cant cost reductions also resulted from a centralized planning, operating, pur-chasing, legal and administrative staff.
Important financial advantages were also possible since revenue from oneportion of the business would help to provide funds if a large unanticipated
THE BUSINESS NETWORK
Understanding Electric Power Systems: An Overview of the Technology and the Marketplace, byJack Casazza and Frank DeleaISBN 0-471-44652-1 Copyright © 2003 The Institute of Electrical and Electronics Engineers

cost increase occurred in another portion of the business. An example is theneed for large amounts of money to repair a distribution system after a majorhurricane. With a vertically integrated organization funds from power salesand transmission system use could help provide the required funds.This diver-sification of risk was an important asset of the vertically integrated utility busi-ness. However, some believed it prevented competition, competition whichcould produce significant benefits.
CHANGING INDUSTRY STRUCTURE
In the 1980s and 1990s a significant movement developed in the United States for a change in the structure of electricity supply industry. Supportersof restructuring proposed that the vertically organized electric utility, withcaptive customers and regulated by government, be replaced with a more competitive environment. For competition in the sale of any commodity to beeffective, all potential suppliers must have the ability to deliver their productto the customers.
It was not always recognized that key to the success of competition is thatways must be developed to reward those who improve productivity and who create additional savings. Because of the unique nature of electric powersystems, major difficulties arose in achieving this result. Many believe thechanging industry structure has increased costs and decreased reliability, andis merely a means of re-allocating costs and profits.
Utility Responses
In addition to the actions mandated by FERC, utilities responded to restruc-turing pressures and state requirements in a variety of other ways by:
• Establishing themselves as subsidiaries of newly formed holding companies;
• Entering the EWG market, both in the United States and overseas,through unregulated subsidiaries;
• Divesting their power plants;• Seeking mergers to acquire economies of scale as well as deeper pockets
to engage in non-regulated activities.
Holding Company Formation. Reversing the reduction of holding compa-nies that the SEC encouraged in the 1935 to early 1950s period, utilities soughtto establish holding companies to give them the flexibility they felt theyneeded to survive in the new environment.
Figure 12.1 lists 28 registered holding companies in existence as of October2002. About one-third of these companies had subsidiaries which also wereholding companies. It is common to find a number of regulated and unregu-
158 THE BUSINESS NETWORK

lated subsidiaries under the umbrella of a parent holding company. In someinstances, the non-regulated subsidiaries became so large they were spun-offinto completely separate companies.1
Unbundling. Economic theory requires effective competitive markets beestablished to achieve the benefits of competition. The first step selected inthis process was the requirement for utilities to “unbundle”, that is, make separate businesses out of their generation, transmission, and distributionsystems. At first, this required keeping separate books of account for eachbusiness. Subsequently pressure increased to make separate companies foreach system.2
CHANGING INDUSTRY STRUCTURE 159
Registered Holding Company NameElectric System (E)
Gas System (G)Number of Subsidiary
Holding CompanyAGL Resources, Inc. G 0Allegheny Energy, Inc. E&G 1Alliant Energy Corp. E&G 0Ameren Corp. E&G 0American Electric Power Co., Inc. E&G 1CenterPoint Energy, Inc. E 0Cinergy Corp. E&G 1Dominion Resources, Inc. E&G 1E.On ag E&G 12Emera, Inc. E 2Energy East Corp. E&G 0Entergy Corp. E&G 0Exelon Corp. E 4FirstEnergy Corp. E&G 0Great Plains Energy, Inc. E 0KeySpan Corp. E&G 0National Fuel Gas Co. G 0National Grid Group plc E 11Nisource, Inc. E&G 1Northeast Utilities E&G 0Pepco Holdings, Inc. E&G 3Progress Energy, Inc. E&T 0SNACA Corp. E&G 0Scottish Power plc E&G 0Southern Co. E 0Unitil Corp E&G 0WGL Holdings, Inc. G 0Xcel Energy, Inc. E&G 0 TOTAL: 28 37
Figure 12.1. Holding companies registered under PUHCA as of October 31, 2002.********** Information extracted from table at SEC Website: www.sec.gov/divisions/investment/regucacompanies.htm.
1 For example, the Southern Company spun off its non-regulated generation subsidiary into anew company Mirant.2 The first system to form separate companies was the Oglethorpe Power Company, which un-bundled in 1997 to form a generation company, and transmission company, and a system opera-tion company.

New Structure
Where full unbundling occurred, the participants in the new industry structurebecame:
• Power producers;• Transmitters;• Distributors;• Power marketers.
Power Producers. The power producers include:
• The existing investor owned, cooperative, municipal and governmentowned systems who retained ownership of their existing generators and,in some cases, installed additional generation.
• Non-utility power producers who either purchased existing power plantsor installed new ones to produce power for sale to others.
• Federal systems producing power for sale, including TVA, BPA, SWPA,and so forth.
The generating capacity of each of these groups is shown in Figure 1.4.
Power Plant Divestitures. In four states,3 state law required power plantdivestiture. In others, divestiture was tied to the utilities’ efforts to securerecovery of stranded investment. The market value of a power plant was con-sidered to be the surest way to determine the stranded cost of a power plant.
Divestitures were of two types:
1. To a non-regulated subsidiary of the utility;4
2. To an independent, non-regulated company.
In most cases, the independent companies purchasing the generation assetswere non-regulated subsidiaries of holding companies which had also a regu-lated company subsidiary.5 However, there were also purchasers who werepart of the new generation of non-regulated power companies.6
Because of concerns about the purchaser acquiring market power, if a singlebuyer acquired all of a utility’s generation assets, many states limited theamount of capacity that any one entity could buy.
160 THE BUSINESS NETWORK
3 California, Connecticut, Maine, and New Hampshire. Texas placed a limit on the amount of generating capacity any one entity could have.4 Illinois Power, Public Service Electric & Gas.5 US Generating—PG&E, Houston Industries/Reliant Power—Houston L&P, FPL Group—Florida P&L, Edison Mission Energy—SoCal Edison.6 Calpine Energy, Sithe, Dynergy.
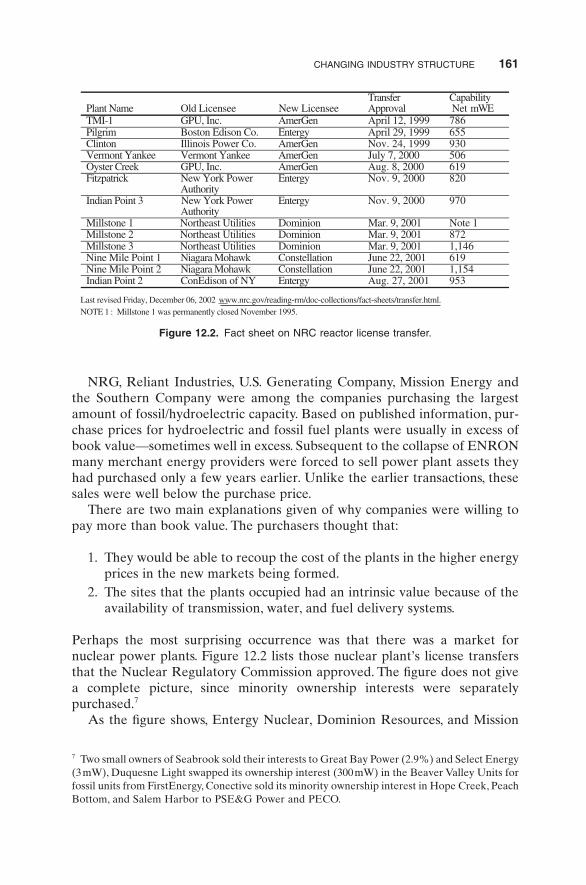
NRG, Reliant Industries, U.S. Generating Company, Mission Energy andthe Southern Company were among the companies purchasing the largestamount of fossil/hydroelectric capacity. Based on published information, pur-chase prices for hydroelectric and fossil fuel plants were usually in excess ofbook value—sometimes well in excess. Subsequent to the collapse of ENRONmany merchant energy providers were forced to sell power plant assets theyhad purchased only a few years earlier. Unlike the earlier transactions, thesesales were well below the purchase price.
There are two main explanations given of why companies were willing topay more than book value. The purchasers thought that:
1. They would be able to recoup the cost of the plants in the higher energyprices in the new markets being formed.
2. The sites that the plants occupied had an intrinsic value because of theavailability of transmission, water, and fuel delivery systems.
Perhaps the most surprising occurrence was that there was a market fornuclear power plants. Figure 12.2 lists those nuclear plant’s license transfersthat the Nuclear Regulatory Commission approved. The figure does not givea complete picture, since minority ownership interests were separately purchased.7
As the figure shows, Entergy Nuclear, Dominion Resources, and Mission
CHANGING INDUSTRY STRUCTURE 161
7 Two small owners of Seabrook sold their interests to Great Bay Power (2.9%) and Select Energy(3mW), Duquesne Light swapped its ownership interest (300mW) in the Beaver Valley Units forfossil units from FirstEnergy, Conective sold its minority ownership interest in Hope Creek, PeachBottom, and Salem Harbor to PSE&G Power and PECO.
Plant Name Old Licensee New LicenseeTransferApproval
Capability Net mWE
TMI-1 GPU, Inc. AmerGen April 12, 1999 786Pilgrim Boston Edison Co. Entergy April 29, 1999 655Clinton Illinois Power Co. AmerGen Nov. 24, 1999 930Vermont Yankee Vermont Yankee AmerGen July 7, 2000 506Oyster Creek GPU, Inc. AmerGen Aug. 8, 2000 619Fitzpatrick New York Power
AuthorityEntergy Nov. 9, 2000 820
Indian Point 3 New York PowerAuthority
Entergy Nov. 9, 2000 970
Millstone 1 Northeast Utilities Dominion Mar. 9, 2001 Note 1Millstone 2 Northeast Utilities Dominion Mar. 9, 2001 872Millstone 3 Northeast Utilities Dominion Mar. 9, 2001 1,146Nine Mile Point 1 Niagara Mohawk Constellation June 22, 2001 619Nine Mile Point 2 Niagara Mohawk Constellation June 22, 2001 1,154Indian Point 2 ConEdison of NY Entergy Aug. 27, 2001 953
Last revised Friday, December 06, 2002 www.nrc.gov/reading-rm/doc-collections/fact-sheets/transfer.html.NOTE 1 : Millstone 1 was permanently closed November 1995.
Figure 12.2. Fact sheet on NRC reactor license transfer.

Energy were the biggest purchasers. The new owners believe that their skill inoperating nuclear plants, rising fossil fuel prices, and increasing air pollutionconcerns will make their investment profitable.
Experience has shown that forced divestiture will not solve market powerabuses. In fact, forced divestiture can create market power problems especiallyif there is a shortage of generating capacity in the region.To protect consumersfrom possible market power abuses, California’s shareholder-owned electriccompanies were “strongly encouraged” by the state’s restructuring law to selltheir fossil fuel-powered generating assets. Electric companies in Californiawere required to buy power on the “spot market.” Long-term, fixed-price con-tracts were not permitted, preventing utilities from locking in stable pricesover a long period. The sale of generating assets meant that the distributionutilities did not own enough capacity to meet their customers’ demands. Whenspot market prices for electricity spiked, shortages, rolling blackouts, and finan-cial chaos resulted from electricity providers and consumers.
Forced divestiture was but one of the many factors that helped bring aboutthe recent breakdown of the California electricity market. But forced divesti-ture played a key role by denying companies the needed capacity to fully servetheir customers’ needs.
Transmitters. Originally, transmission was provided by the vertically inte-grated utilities and Federal agencies such as TVA and Bonneville. Thesesystems later interconnected with each other to achieve economic benefits asdiscussed in Chapter 6, which also discusses the functions of the transmissionsystem. With the advent of restructuring, the purpose of the transmissionsystem was reoriented to become the means of facilitating competition in thebulk power electric market in the sales and purchases of electric energy.
This new requirement diminished the attention given to the other trans-mission functions previously discussed, particularly those related to reliability.The transmission system role in reducing total generating capacity require-ments8 often became neglected and transmission constraints became more andmore frequent.
The United States transmission systems are aging, with some importantfacilities having ages in excess of seventy five years. Very little in the way ofnew transmission facilities have been added over the last ten years because of uncertainties about the revenue that could be earned by the transmissionbusiness and the concern about their use to deliver power supplies from othersources, reducing the earnings from an existing generation business. Mean-while, competitive pressures to reduce costs caused reductions in maintenanceexpenditure.
The combination of these effects has lead to an aging transmission systemwith increasing outages and a large backlog of maintenance requirements.Thishas lead to the FERC requirement to form regional transmission organiza-
162 THE BUSINESS NETWORK
8 This is often called the capacity benefit margin or CBM.

tions to operate and/or to plan transmission systems, specifically RegionalTransmission Organizations (RTOs), Independent System Operators (ISOs),and Integrated Transmission Providers (ITPs), all of which are discussed in thenext chapter.
At present, increasing attention is also being given to “merchant transmis-sion” companies that would make investments in specific transmission linesand be directly compensated for their use.
Development of Non-Regulated Power Market
As a result of power plant divestiture and the construction of new primarilygas-fired power plants by EWGs, the amount of generation supplied by utilityand non-utility generators has changed significantly over the 1990s, as shownon Figure 12.3.
In the decade following EPAct, the number of entities allowed by FERCto charge market based rates has exploded. There are well over 1,400 suchentities as of early 2003.
Distributors
The final delivery of electric power is accomplished by the subtransmissionand distribution systems except for a few very large consumers who are sup-plied by the transmission system. With unbundling, the distribution system is paid only for the delivery service it provides, with its charges determinedbased on traditional cost of service approaches and approved by the state regulators.
CHANGING INDUSTRY STRUCTURE 163
Period Industry Utilities Non-Utilities1991 3,071,201 2,825,023 246,1781992 3,083,367 2,797,219 286,1481993 3,196,924 2,882,525 314,3991994 3,253,799 2,910,712 343,0871995 3,357,837 2,994,529 363,3081996 3,446,994 3,077,442 369,5521997 3,494,223 3,122,523 371,7001998 3,617,873 3,212,171 405,7021999 3,704,544 3,173,674 530,8712000 3,799,944 3,015,383 784,561
NOTES: Values for the industry and non-utilities for 2000 are preliminary; utility valuesfor 2000 are final. Values for 1999 and prior years are final. Due to restructuring of theelectric power industry, electric utilities are selling plants to the non-utility sector. Thiswill affect comparisons of current and historical data. DATAs may not equal sum ofcomponents because of independent rounding.SOURCES: Energy Information Administration, Form EIA-759, “Monthly UtilityPower Plant Report,” Form EIA-900, “Monthly Non-Utility Power Plant Report,” andForm EIA-860B, “Annual Electric Generator Report Non-Utility” (and predecessorforms).
Figure 12.3. Net generation, 1991 through 2000 (Million Kilowatt-hours).

The distribution system not only delivers electric power, but operates as animportant element in the functioning of the overall system. It participates inthe provision of system reactive supply and voltage control. It has under-frequency relaying installed to shed load and limit major bulk supply systemdisturbances when system frequency decline.
Marketers
With unbundling and restructuring of the bulk power market it became feasi-ble for electric power suppliers and large consumers to choose from a numberof power suppliers and a number of transmitters. This offered an opportunityto form marketing organizations to buy and sell power, trading sometimes aday or two ahead of time and sometimes hourly.
These marketing organizations were sometimes in the corporate structureof existing large utilities also having considerable generation and transmissionassets and sometimes purely trading organizations.9 Theoretically, thesetrading organizations would create economic benefits by enabling purchasersto obtain lower cost power and, through competition, driving down overallpower costs. These organizations also provided a means of guaranteed futureelectricity costs, hedging against potential volatile prices. This was a form ofinsurance for which the trading company could earn revenue, but whichincreased the cost of electricity.
Practically, many of the trading organizations became a mechanism for“gaming” the market to increase their profits at considerable expense to theoverall American public. This “gaming” was accomplished in some casesthrough fraud and false bookkeeping and accounting. In other cases it wasaccomplished through legal manipulation10 of the systems and schedules, andcollusion with the power providers.
At first, the growth in activity by marketers was phenomenal, but recentcriminal and other investigations is resulting in the demise of most marketingorganizations. Banks and reputable financial institutions seem destined to bethe surviving marketing organizations.
Wheeling and Customer Choice
Wheeling is a term sometimes used to describe the transmission of power byone system for another system.Wheeling is an essential ingredient in the moveto provide customers with the choice of power supplier.
A significant number of states provide customers with the ability to selecttheir power supplier as was shown in Figure 11.2. In cases where the customer
164 THE BUSINESS NETWORK
9 Enron was this type of organization.10 While legal, some consider these manipulations a violation of the code of ethics for the pro-fessions involved.

selects a supplier other than their local utility, some form of wheeling serviceis needed along with local delivery service.
In cases where an alternate supplier is chosen, the local utility rates arereduced by the revenue requirements associated with the capital and energycosts of the generation it is no longer supplying, leaving only distribution deliv-ery costs. These “offset” costs are those that an alternate supplier must beatto result in a lower total cost to consumers. Experience to date has shown rela-tively little customer switching since alternate suppliers generally have higherpower costs than the present supplier.
In the early stages of restructuring, many companies attempted to developbusinesses supplying customers in other systems. Many of these efforts werenot successful, often resulting in economic losses. As a result, the level of com-petition in the supply of retail customers has decreased significantly.
Contracts and Agreements
With an unbundling electric utility industry, many new contracts are required,including contracts for power purchases and contracts for transmission serv-ices.With the vertically integrated utility, these requirements were coordinatedunder the direction of a single corporate management. With restructuring, theterms and conditions of the required services must be covered by appropriatecontracts.
In addition,“coordination contracts” can help to achieve lower total systemcosts. Because actions by any one company, or failure to act, can affect thecosts of other companies agreements for sharing the costs and benefits of co-ordination. Such coordination contracts are becoming increasingly necessary.One example would be installation of transmission facilities in one system toprovide for reduced costs in another system.
CHANGING INDUSTRY STRUCTURE 165


13
167
In response to the requirements of Orders 888 and 889, which are discussedin Chapter 11, the utility industry embarked on a major voyage of changewhich continues to the date of writing this book. The most noticeable of theimmediate actions were the filing by all transmission providers with FERC ofnew open access tariffs to be used to pay for use of transmission systems, theseparation within companies of the generation/marketing function from thetransmission function and the efforts by various operating entities to developreal time systems to report on use and capability of the transmission systemin their areas.
FERC allowed some flexibility in how the private sector utilities function-ally separated (unbundled) their transmission functions from their generationand marketing functions. Some utilities simply separated within the same corporate structure by imposing restrictions on contacts between individualsworking in the respective areas and by separating the respective costs withintheir accounting system. Others went a step further and formed ISOs.
ISO FORMATION
A number of ISOs were formed to manage the transmission grid.1 These newISOs were primarily the existing power pools with their governance provisions
ISOs, RTOs AND ITPs
Understanding Electric Power Systems: An Overview of the Technology and the Marketplace, byJack Casazza and Frank DeleaISBN 0-471-44652-1 Copyright © 2003 The Institute of Electrical and Electronics Engineers
1 As of mid-2002, there were five ISOs: New England, PJM, New York, California, and ERCOT.

changed to separate the operation and control of the transmission system fromits owners and to have governance provisions acceptable to FERC. The for-malized rules ensuring this separation were a central issue in FERC’s processto approve each of the ISOs.
The issue of the wholesale market structure was also handled in differentways. Some proposed a completely separate entity which would operate/administer the wholesale energy market. Others felt that the function shouldbe a responsibility of the ISO.
Each region was allowed to formulate its own rules for the operation of thelocal power market. It was FERC’s stated intent not to specify how the powermarkets were to be structured. FERC’s focus was on the forms of the organi-zational structure of the market’s management to ensure openness and not onthe mechanics of how the market was going to work. The actions taken todevelop the power markets reflected the lack of specific guidelines withinFERC’s order, resulting in many different market structures. Even thosemarkets supposedly using the same approach, that is, locational marginalpricing, differed in their details.
The different market structures had an impact on the resolution of theseams issues. There are a number of definitions of seams issues, the followingare our own:
• Seams issues refer to issues which arise when there are power transferconditions which involve more than one area, each of which uses dif-ferent operational and/or market rules. These differences in rules canadversely impact the overall economic performance of the electric powersystem in two ways:
• Economic transactions between adjacent areas or through an intermedi-ate area could be hindered or prevented because of differing market rules.
• Reduction of power flows to ensure that power transfer limits areobserved may not be done in a manner to have the lowest impact on theprice of electricity.
Functions of ISOs
Regional Operating Functions. In Order 888, eight operational functionsrequired of each ISO were included in the Order’s eleven principles. As withthe wholesale energy market, areas had latitude on how to address the prin-ciples.The specific approaches to transmission operation differed from region-to-region, but the areas addressed were similar:
Transmission System:
• Calculation of available transmission capability and making these valuesknown by posting on the OASIS system;
• Scheduling transmission and generation maintenance outages in amanner that minimizes the impact on the operation of the grid;
168 ISOs, RTOs AND ITPs

• Having either hands-on or contractual control of the operation of thetransmission system;
• Ensuring that adequate ancillary services are available for the reliableoperation of the transmission system.
Additionally, the ISOs that were formed used a form of bidding for theirenergy markets. The purpose of the wholesale market was:
• Manage a longer term (day ahead) or a shorter term (hour ahead) marketin which capacity, energy, and ancillary services are based on• Bilateral contracts and bids received via the OASIS system;• Available transmission capability.
Regional Planning Functions. The ISO also has the responsibility forensuring that adequate resources are provided. In some ISOs generation ade-quacy is provided by specifying an “Installed Capacity Requirement” (ICAP).A part of this responsibility includes the forecasting of future peaks and sea-sonal loads and comparing expected generating capacity a few years in thefuture. If adequate generating capacity is not expected to be available, the ISOtakes steps to make this known. Appropriate action would be required of theregional reliability council, NERC, and FERC to correct the deficiency. Thisincludes those short generating capacity being required to make capacity pay-ments commensurate with their shortage.
In addition, the ISO has the responsibility of reviewing and/or developinglong-range transmission plans for the region. This is a difficult and uncertainprocess since future generation additions will be determined in the competi-tive generation market and are difficult to estimate. A major concern is thattransmission additions will be based either on meeting only immediate needsor on long-range generation developments that may not materialize. In eitherevent, there is high risk of considerable extra transmission costs or an inade-quate transmission systems.
RTOs
With Order 2000, FERC specified in more detail its requirements for inde-pendent transmission operations. However, it still did not specify the marketstructure or the size that an RTO must take to meet the minimum character-istics and functions.2 “The characteristics and functions could be satisfied bydifferent organizational forms, such as ISOs, Transco’s, combinations of thetwo, or even new organizational forms not yet discussed in the industry or pro-posed to the Commission. Perhaps anticipating a continuing evolution in its
RTOs 169
2 FERC Requirements for RTOs were listed in Chapter 11.

requirements, FERC also indicated: “We also establish an ‘open architecture’policy regarding RTOs, whereby all RTO proposals must allow the RTO andits members the flexibility to improve their organizations in the future in termsof structure, operations, market support, and geographic scope to meet marketneeds.”
The Order did not address the economic impact of different market struc-tures. FERC seemed also to be relying on having very large RTOs as a wayof eliminating seams issues.
The Order was not uniformly accepted across the country. There were twomain objections especially relating to the multi-state size of the RTOs that wasenvisioned:
• State regulators were concerned about their apparent loss of control overthe utilities supplying customers in their states.
• States in the South and the Pacific Northwest, currently experiencinglower-cost electricity, were concerned that the development of a nationaltransmission grid would impact their cost of power because their cheappower would be diverted to higher cost regions.
The RTOs would also be “not-for-profit” companies. As part of FERC’sevolving position, a debate continues, however, on whether the operation ofthe transmission system should be on a “non-profit” or “profit making” basisas will be discussed in Chapter 14.
The utility response to Order 2000 varied region by region. Even withinregions, as the difficulty of reconciling different operating and market rules toform large RTOs became apparent, utilities shifted from one combination ofcompanies in one structure to different combinations.
In the eastern region of the United States three of the ISOs, PJM, ISO NewEngland, and the ISO New York, embraced the “PJM style” market design for their proposed RTOs. The biggest issues bearing on consolidation of theeastern ISOs into a super-RTO are loss of control by market participants andregulators over the existing ISOs, and potential cost shifting from one sub-region to another if the markets are merged.
The southeastern states have resisted RTO/ISO formation for quite a whileand want a model that would maintain the status quo as much as possible.Thisregion has been working diligently to develop an RTO that would be accept-able to state and federal regulatory bodies.
Midwestern states are moving forward with some entities favoring eitherthe MISO or PJM. The west has been unable to form a single broad RTO andcommon market. The result will be the formation of two new entities: RTOWest in the Pacific Northwest, and WestConnect, covering the Southwest.
Texas is an “island” and wishes to remain that way. It is unique in that bothwholesale and retail are under the jurisdiction of a central administrativeentity.
170 ISOs, RTOs AND ITPs

14
171
A vital part of the electric power business is the functioning of its moneynetwork. This network consists of the various sources of money, the variouspaths and organizations through which this money flows, and the money usedfor various reasons, including payments of bills, debts, and profits.
This money network is tied to the physical and energy networks at variouspoints, with the flow of money having important effects on their developmentand operation. The money network is controlled by both the business and regulatory networks, and uses the generation and communication networks.
Money sources are similar to generators in electric power systems. Thesesources are the investors, consumers, taxpayers, banks, and so forth. Bydrawing the diagram for the money network and analyzing the sources ofmoney, its flow through the networks, and the uses, charges, or profits forvarious functions, we can get a far better understanding of how our financialsystems work and are related to electric power policy. These money networkshave been diagramed in the past by engineers, starting in the early 1960s.1 Itis important to identify the connection points between the money network,the energy network, and the power network. What happens to one affects theothers. (Analyses of this network would have provided an early detection ofEnron’s procedures. It would also show what happened to the $38 billion inextra costs that occurred in California.)
THE MONEY NETWORK
Understanding Electric Power Systems: An Overview of the Technology and the Marketplace, byJack Casazza and Frank DeleaISBN 0-471-44652-1 Copyright © 2003 The Institute of Electrical and Electronics Engineers
1 See CIGRE paper in 1962, by Sels and Dillard.

ALLOCATION OF COSTS AND ECONOMIC BENEFITS
In the past, the tariffs paid by all consumers from large industries to small residential consumers were established by the states.Theoretically these tariffswere designed to reflect the costs to supply each class of customer. Practically,political considerations often overrode a fair cost allocation, with large indus-try frequently charged more than its share to subsidize small consumers, whowere a majority of the voters. Large industry often felt its competitive posi-tions were adversely affected by regulatory decisions, and their answer was toget rid of regulation.
The participants in joint power projects and coordination procedures allo-cated costs between the participants based on negotiations between the par-ticipants, with regulatory oversight and approval. Prior to the restructuring ofthe electric power industry, coordination between the supplying systems tookplace to achieve economic benefits. To allocate costs and benefits in projectsinvolving more than one system, a “split savings” approach was used. Thisapproach was based on review of costs to each of the participants without thejoint project and the costs with the project. The benefits from the coordinatedprocedures were allocated to each participant, sometimes 50/50 and some-times based on negotiations. This approach was used for projects involvingcapital investments and for operations such as generation dispatch. It was akey factor in determining the flow of money.
If extra costs were required of any participant, they would be compensatedfor these in addition to receiving their share of the net benefits. With this pro-cedure, all participants in coordinated activities would benefit. It would be a“win-win” situation for all. This procedure produced a great deal of coopera-tion and large savings to the public, estimated to be more than $20 billion peryear in the late 1980s.2 These costs and associated benefits were then reflectedin the tariffs paid by consumers.
New restructuring procedures rely increasingly on market forces and com-petition to achieve cost allocation, especially for generation and the power theplants produce. Major questions exist, however, about the ability of someorganizations to exert “market power” dominating the market, and control-ling pricing. The smaller organizations are concerned with the ability of thelarge ones to drive them out of business.
With the advent of restructuring the coordination achieved with the splitsavings approach has ceased. The revised approach is the use of market forcesand competition to spur cost and price reductions and more economic solu-tions. The revised approaches are a key factor in determining the money flowamong the participants. Results to date indicate restructuring has increasedoverall natural costs for electricity by about 10%3 from what they would otherwise have been.
172 THE MONEY NETWORK
2 Casazza, J.A., Palermo, P.J., Lucas, J., and Branco, F., Generation Planning and TransmissionSystems, CIGRE Paper. Also EEI publications.3 “Electricity Choice: Pick Your Poison—Errant Economics? Lousy Law? Market Manipulation?All Three!”, J.A. Casazza, Public Utilities Fortnightly, March 1, 2001.

Average Costs Versus Incremental Costs
An additional concern in the operation of the new competitive markets iswhether prices should be based on average costs or incremental costs. Theaverage cost approach is simpler and often less contentious. The incrementalcost approach is often fairer since each use or user of the system will pay forthe costs it causes. This question becomes important in determining tariffs andthe allocation of additional investments.
MARKET VERSUS OPERATIONAL CONTROL
In an electric power system, there are two arrangements for the control ofdecisions. Those made by those having “market rights” developed throughoperation of the money network, and those having the operational control ofthe physical network.
Theoretically, the operation of both of these networks should be coordi-nated. The operation of the money network should result in the most efficientoperation of the physical network.
MARKET POWER ISSUES
Market power has been defined as the ability of a supplier to profitably raiseprices above competitive levels and maintain these prices for a significantperiod of time. There are two types of market power: vertical and horizontal.A traditional vertically integrated utility might exercise vertical market powerby using its control of the transmission system to give its own generation preferential treatment. This concern has been a focus of FERC’s in its restruc-turing orders. A supplier could have horizontal market power if it controlleda significant amount of the generation resources in an area; especially if thearea cannot import power because of transmission constraints. This latterconcern was addressed by many state regulators by requiring multiple buyerswhen generation was divested.Another form of market power that can involveboth vertical and horizontal aspects is when a local supplier controls a signif-icant amount of the fuel resources used for generation in an area. Experiencehas shown considerable problems with attempts to rely solely on market forcesto prevent the exercise of market power. Both legal and illegal means havebeen used by some market participants to obtain large profits while increas-ing the overall cost of electricity.
Price Caps
Excessive market power, market manipulation, and even illegal market operations have contributed to wide variability in the price of bulk power electricity.As a result in some areas “price caps” have been established to limitmaximum prices that can be charged in market operations. There are manyarguments, pro and con, on the application of such price caps, some claiming
MARKET POWER ISSUES 173

they are essential to prevent market abuses, and others claiming they prohibitproper operation of the market.
STANDARD MARKET DESIGN (SMD)4
In July 2002, FERC issued a Notice of Proposed Rulemaking (NOPR) “Remedying Undue Discrimination Through Open Access TransmissionService and Standard Electricity Market Design”, which is referred to as theSMD NOPR. It deals directly with the relationship of congestion relief includ-ing the seams issue and the operation of the wholesale energy market. FERChad determined that open-access to the transmission system still hadn’t beenachieved and offered examples to support their view. Many of the examplesdealt with situations where utilities who were engaged in both the transmis-sion and generation businesses acted to unfairly disadvantage competitors byrestricting access to the transmission system. Additionally, FERC felt thatinconsistent design and administration of short-term energy markets wasadversely impacting the goal that electricity consumers pay the lowest pricepossible for reliable service.
Objectives and Goals
FERC stated its objectives as:
• To remedy remaining undue discrimination;• To establish a standardized transmission service;• To establish a wholesale electric market design.
It proposed to meet its objectives by requiring utilities to institute:
• A flexible transmission service;• An open and transparent spot market design.
“The fundamental goal of the Standard Market Design requirements, inconjunction with the standardized transmission service, is to create “seamless”wholesale power markets that allow sellers to transact easily across transmis-sion grid boundaries and that allow customers to receive the benefits of lower-cost and more reliable electric supply.”
Proposals
The Commission, subject to some regional variations, proposed to:
174 THE MONEY NETWORK
4 Much of the material in this section is excerpted directly from FERC’s SMD NOPR. We coverthe SMD in the money network chapter, since the SMD extends FERC’s reach into the opera-tion of the wholesale energy market.

• Exercise jurisdiction over the transmission component of bundled retailtransactions;5
• Modify the existing pro forma transmission tariff to include a single flexible transmission service (Network Access Service) that applies con-sistent transmission rules for all transmission customers—wholesale,unbundled retail and bundled retail;6
• Provide a standard market design for wholesale electric markets.7
Recognizing the alleged abuses that were experienced to date, the orderaddressed the need to include “regulatory backstops” to protect customersagainst the exercise of market power.An important way that the market is notperfect is that it lacks customer demand response to price fluctuations. Asprices rise dramatically, as in California, customers do not see the impactsbecause of other timing differences in billing or because the local utility mustabsorb the cost increases.
Transmission Owner’s Options. Transmission owners were given threeoptions:
1. Meet the definition of an Independent Transmission Provider (ITP).2. Become part of an RTO.3. Contract with an independent entity meeting the definition of an ITP to
operate their transmission system.
Independent Transmission Providers (ITPs)
“An Independent Transmission Provider is any public utility that owns,controls, or operates facilities used for the transmission of electric energy ininterstate commerce, and administers the day-ahead and real-time energy andancillary services markets in connection with its provision of transmissionservices pursuant to the SMD Tariff, and that is independent (i.e., has no finan-cial interest, either directly or through an affiliate, in any market participantin the region in which it provides transmission services or in neighboringregions.)”8
“ITPs” would be responsible for:
STANDARD MARKET DESIGN (SMD) 175
5 Currently regulated by state commissions.6 Eliminating the dual pricing system allowed in prior orders.7 Recognizing that continuing to allow each area the freedom to develop its own market struc-ture with its own rules was untenable if transactions were to be encouraged over a geographicallywidespread market.8 Recognizing the political difficulties that its proposals face and the multi-state nature of theRTOs that it envisioned, FERC indicated that State representatives would have a formal role inthe ITP’s decision making process. FERC avows that it does not want to interfere with the legitimate concerns of state regulatory authorities.

• The administration of the day-ahead and real-time markets for energyand ancillary services;
• Long-term planning and expansion, system impact, and facilities studies;9
and• Transmission transfer capability calculations (including postings on an
Open Access Same-Time Information System (OASIS)).
Transmission Charges
A single transmission charge would be established. “The proposed NetworkAccess Service would combine features of both existing open-access trans-mission services—the flexible and resource and load integration of NetworkIntegration Transmission Service; and the reassignment rights of Point-to-Point Transmission Service. It would give a customer the right to transmitpower between any points on the transmission system—so long as the trans-action is feasible under a security constrained dispatch.”
Access charges reflecting the cost of service of transmission owners would be collected on a pro-rata basis from all customers taking power off thegrid and not on the generators connected to the grid. The charge could beeither based on the zone of delivery within an area (a license plate rate) orcould be the same for the entire ITP’s area (a postage stamp rate). Based onthe notion that charges to transmit energy from distant generation shouldreflect the actual variable transmission costs, FERC proposes that customersreceiving energy from another area only pay the access charges in their ownhome area.
“All customers would pay congestion costs and losses associated with theirparticular transaction.” Congestion would be managed by the use of a bid-based, security constrained spot market using locational marginal pricing(LMP).
To provide a hedge against incurring congestion costs, customers can buycongestion revenue rights. “Congestion Revenue Rights provide the rightsholder with the revenues associated with congestion between the associatedpoints; thus, any congestion costs it pays are fully offset by these revenues.To the extent the Congestion Revenue Rights holder opts not to scheduletransmission service at those points, it would still receive the congestion revenues.”
To give the ITP the ability to access the potential for congestion, “The cus-tomer must identify the ultimate source and sink (i.e., sources of generationand locations of customer load) so that the various system operators in aninterconnection can assess the simultaneous feasibility of all scheduled powerflows.”
176 THE MONEY NETWORK
9 These studies would include studies of the interconnection of a new load or generator, studiesof the feasibility of simultaneous transactions to deal with congestion revenue rights.

Wholesale Electric Market Design
To remedy the negative impacts it perceives because of differing market struc-tures, FERC proposed a new standardized market design. The wholesalemarket would rely on both:
• Bilateral contracts between buyers and sellers;• Short-term spot markets.
FERC feels that the use of bilateral contracts will lessen the impact if powergenerators, presently supplying local areas, seek higher priced markets elsewhere since the local consumers could buy the power under long-term contracts.
The short term spot markets would:
• Be operated by the ITPs;• Be bid-based, security constrained;• Cover two time frames;
• A day ahead• Real time
• Use a market-based locational marginal pricing (LMP) transmission con-gestion management system.
The market would have:
• Tradable financial rights to allow a fixed price for transmission service(congestion revenue rights);• An auction process to allocate these rights is FERC’s preferred
approach• A power market monitoring system and market power mitigation rules.
FERC’s efforts to establish a system of a financial congestion rights (CRR)under the SMD procedures have raised some questions, such as schedulingpriorities for physical transactions, allocation of such rights, and so on. Oneproposal is to use the funds from such rights to help construct new transmis-sion facilities.
Locational Marginal Pricing (LMP). The basic definition of an LMP is “theprice of supplying an additional MW of load at each location (bus) in thesystem.”10 The major factors affecting the LMP values are the generator bidprices, the transmission system elements that are experiencing congestion, thelosses on the system, and the electrical characteristics of the system.
STANDARD MARKET DESIGN (SMD) 177
10 Note it does not say the cost of supplying an additional MW, it says the price.
Although there are some variations from system to system, the basic usageof LMPs is as follows: The LMP is equal to the bid price of the last, and hencemost expensive, generator that is scheduled to meet the load. If there are no transmission constraints, the LMP is the same at all points on the system.If there are transmission constraints, generation is redispatched to avoid the constraint. In this situation there will be more than one LMP, since theprocess reflects the bid prices of different marginal generation, depending on their location in the system. Generators are paid for the energy they supply to the market, according to the LMP at their point of connection to the system. Energy consumers buy the energy they buy from the spot market, based on the LMP at their connection point. Bilateral transactions pay a congestion charge that is based on the difference in the LMPs betweenthe delivery point of the transaction and the receipt point. Transactions intoor out of the system pay congestion charges based on their entry or withdrawalpoint.
LMP values may be calculated for different time periods based on the particular rules for the various systems. Many of them have a day aheadmarket that uses the scheduled quantities of consumption for the variousmarket players, the schedules of bilateral contracts, the price bides, and theimpact of transmission congestion to determine the day ahead LMP values.The calculation of the LMP values is based on the optimization problem inher-ent in the market clearing process. Some systems also have an hour aheadmarket. Hour ahead LMP values can again be calculated as a byproduct ofthe hour ahead market clearing process. Finally, real-time LMP values are cal-culated. These are based on the generation dispatching process used for bal-ancing the system while alleviating congestion. Differences between the LMPsare used as the cost of congestion between any two locations. Loss effects arealso included in the calculations of LMPs.11
Some experts believe that the use of LMP increases the cost of electricityover the use of incremental production costs for dispatch and also can increasetransmission losses.
Resource Adequacy
Each area would have a resource adequacy requirement, the level to be deter-mined on a regional basis by an RTO or other regional entity including staterepresentatives. The RTO would:
• Forecast the region’s future resource needs;• Facilitate regional determination of an adequate future level of
resources;
178 THE MONEY NETWORK
11 The method of calculating losses varies across regions. Some use a fixed quantity expressed inpercent applied to all transactions during all hours. Other regions calculate incremental lossesbased on the actual transactions by using load-flow simulations.

• Access the adequacy of the plans of load-serving entities to meet theregional needs.
The obligation to meet the resource adequacy requirement would be givento the load serving entities (LSEs). “Each load-serving entity would berequired to meet its share of the future regional need through a combinationof generation and demand reduction. A minimum reserve requirement of12%, well below levels employed until recently, was proposed. Additionally,all users of the transmission system would need to comply with standards forensuring system security and reliability.
The responses to FERC’s requests for comments have been varied, and inmany instances heated. Some commentators question whether the proposedmarket will achieve FERC’s goals or lead to an increase in the costs of elec-tricity while the reliability of the system is allowed to deteriorate.
Transmission Tariffs
Recognizing that relying on financial congestion rights and the use of regu-lated rates of return and standard depreciation lives has not proved to beenough of an inducement to build new transmission, FERC has proposed anincentive pricing policy.12
Merchant Transmission
Proposals are being made for independent organizations to build “merchanttransmission”, that is, transmission lines which will be independently ownedand on which transmission service will be provided. Major questions have beenraised concerning such transmission projects, particularly their ability to fitinto future long-range system needs.
Markets for Buying and Selling Rights
A key aspect of restructuring efforts on the money network is the establish-ment of approaches for buying and selling rights such as transmission rightsand emission rights.
STANDARD MARKET DESIGN (SMD) 179
12 See FERC’s “Proposed Pricing Policy for Efficient Operation and Expansion of the Transmission Grid”, issued January 15, 2003.


15
181
This network is an extensive system impacting the physical, energy, money,business and regulatory networks. It includes all mechanisms and processesfor obtaining information, transmitting this information to some locationwhere the information is analyzed and decisions made as necessary and thenthe communication of the decisions so they can be acted upon.
This network is not static in time. We’ve discussed some of the technologyimprovements and innovations being implemented in the physical network.Similarly, the information, communications and control networks is also experiencing similar changes.
The utility industry has been affected, as have many others, by the wide-spread use of the internet, communication networks capable of transmittinglarge quantities of information very quickly, and computer based sensing andcomputing equipment based on microprocessor technology. These develop-ments have allowed improvements in many areas of the business; in reliabil-ity, in productivity, in speed of response, and so forth.
One aspect of the development is the improvements made in so called“legacy” computer systems internal to the utilities. In many cases, thesesystems were characterized by stand alone data bases containing informationthat, if properly combined, would be of great benefit to the company.
In the following material we will mention some, but by no means all, of thecomponents of this network.
INFORMATION,COMMUNICATIONS AND
CONTROL NETWORK
Understanding Electric Power Systems: An Overview of the Technology and the Marketplace, byJack Casazza and Frank DeleaISBN 0-471-44652-1 Copyright © 2003 The Institute of Electrical and Electronics Engineers

FINANCIAL AND BUSINESS OPERATIONS
The introduction of advanced financial management systems allow managersto better understand the cost drivers of their business and business segmentsand to deal with the increasing complexity of the utility business structure,especially on the holding company level. For example, interrelationships ofelectric trading strategies, purchasing decisions, outsourcing strategies can allbe examined.
Computer technology and the internet have had a major impact on the waycompanies do business. The terms e-Business and e-Commerce are used todescribe a wide spectrum of applications that allow the utility to exchangeinformation with its customers, its suppliers, its regulators and the energymarket:
• The internet based OASIS System is at the heart of the wholesale energymarket.
• Internet-based material and services procurement arrangements withsuppliers eliminate processes that added to the time and cost of obtain-ing these services.
• Customers can now pay their bills online.• Customer contact has been improved by the establishment of customer
call centers operated 24 hours a day.• Online filing of documents with the SEC and other regulatory agencies
in now in operation.
The OASIS System is a good example of the interconnectivity of the variousnetworks. For example, it deals with the physical security of the transmissionsystem as well as the financial system since it deals with the submission of bidsfor various generation related products and services.
SYSTEM OPERATIONS
A measurement and communication network has been used for years by theindustry to measure and transmit, to a central control point, information aboutthe physical state of the power system (voltages, currents, breaker and relaystatus, generator output, etc). The network is also used to transmit operationalorders to substations and to generating stations:
• In recent years high-speed communication links and online state estima-tion1 have been implemented.
182 INFORMATION, COMMUNICATIONS AND CONTROL NETWORK
1 The use of tele-metered values to rapidly determine the electrical status at all points on thetransmission system and to suggest remedial actions in case of emergencies.

• Computer programs are being developed to dynamically analyze theoptimum settings of FACTS devices to increase the reliability and powertransfer capability of the transmission system on a real time basis.
DISTRIBUTION OPERATIONS
Significant strides have been made in the ability to automate the operationand reduce the costs associated with the distribution system. Many of the benefits were listed in Chapter 7. Among these are:
• Work management systems (WMS) used for optimizing work schedulingand dispatching of work orders to field crews;2
• Improvements, using microprocessors, in SCADA systems for remotemonitoring and control of the status of the distribution system; that is,line loadings, circuit breaker status, voltages to a central operationscenter;
• Geographic information systems (GIS),3 which relate customers to specific geographic locations;
• Outage-management systems (OMS), to handle the large amount ofinformation relating to system outages, especially outages impactingmany customers due to ice storms, tornadoes, etc. and the efficient dispatching of crews for restoration purposes;
• Asset-management systems which are used to schedule maintenance(AMS);
• Automated meter reading (AMR) which offers the potential for signifi-cant reduction in the labor intensive present system.
Some utilities are combining aspects of these systems to create a morerobust tool. For example, integrating a GIS system with an OMS system, andusing information from 24-hour call centers and from the customer informa-tion system (CIS) provides additional information which can shorten restora-tion times.
DISTRIBUTION OPERATIONS 183
2 Information on WMS can be found in “Utility Automation”. See the January 2003 issue for a broader discussion of issues concerning WFM in an article by Scott Munro, “Work Force Management Unifies Field Operations”.3 Information on GIS systems can be found at the USGS Website: www.usgs.gov. The followingwas excerpted from that site: “In the strictest sense, a GIS is a computer system capable of assembling, storing, manipulating, and displaying geographically referenced information, i.e. dataidentified according to their locations. Practitioners also regard the total GIS as including operating personnel and the data that go into the system.” “The way maps and other data havebeen stored or filed as layers of information in a GIS makes it possible to perform complex analyses.”

PHYSICAL SECURITY
Issues dealing with the physical security of the bulk power system have takenon a new meaning since the attack on September 11, 2001.
The following material was taken form NERC’s website, where the readercan find additional information.
The effort, on a national level, to deal with electric utility security began inthe late 1990s with a Presidential Order “Protecting America’s Critical Infra-structures.” Electric utilities were one of eight areas identified as critical.
In response to the Order, the DOE was appointed the lead agency for theelectric sector. The DOE appointed NERC as the Sector Coordinator, “to:
• Assess sector vulnerabilities;• Develop a plan to reduce electric system vulnerabilities;• Propose a system for identifying and averting attacks;• Develop a plan to alert electricity sector participants and appropriate
government agencies that an attack is imminent or in progress;• Assist in reconstituting minimum essential electric system capabilities in
the aftermath of an attack.”
The industry responded by addressing the following areas:
• Deterrence;• Detection;• Assessment;• Communications;• Response critical.”
As discussed earlier, the electric system is designed to withstand variousdisturbances.The industry has also maintained the capability to rapidly restoreservice in the event of outages. In addition to the physical assets, attention isalso focused on the SCADA systems used for control and communications.Disruption of this system can have wide-ranging impacts, not only on the physical performance of the system (bogus telemetered orders to open manycircuit breakers at the same time resulting in the loss of more facilities thanconsidered in design), but also on the commercial operation of the system.
COMMERCIAL SECURITY
Commercial security has two aspects:
1. The ability of the market to avoid manipulation by exercise of marketpower or by individuals who illegally violate market rules;
184 INFORMATION, COMMUNICATIONS AND CONTROL NETWORK

2. The ability of the market to withstand disruption or manipulation byindividuals who illegally gain access to its communication or computersystems.
FERC has focused its attention on the first aspect ever since it initiated itsefforts on restructuring the industry. Experience in California has shown thatgreat sums of money can be made by exercising various forms of market poweror by violating market rules. It is for this reason that FERC proposed a marketmonitoring function in its SMD NOPR.
The second aspect is a one of the focuses of the nation’s response to ter-rorist threats. NERC has efforts under way in this area.
Cyber attacks can be of two types:
1. Those against an individual or specific functions, such as theft of identi-fication and credit card numbers of an individual;
2. Those against an entire system, such as viruses which attack entire internet systems or against an individual company and all of its files.
As companies rely more and more on computerizing and networking theirsystems, they also make themselves more vulnerable to cyber attack. Effortsto standardize and to use open platforms contribute to this vulnerability.The efforts to combine data base information discussed in the DistributionOperations section above, illustrate the increased exposure when combina-tions are implemented.
The literature contains many articles by specialists who address issues suchas protocols for access to sensitive information and the technology of build-ing robust firewalls.4
COMMERCIAL SECURITY 185
4 See the “National Strategy to Secure Cyberspace” issued by the White House in February 2003,at www.whitehouse.gov/pcipb/cyberspace_strategy.pdf


16
187
The roots of the North American Reliability Council (NERC) lie in the North-east blackout of 1965 and the PJM blackout of 1967. It became generally rec-ognized that measures were required that would:
• Ensure that adjacent systems would be planned, designed, and operatedbased on consistent reliability criteria; and
• Establish appropriate criteria.
To achieve these goals, various regional reliability councils were formed andbegan functioning. It soon became apparent that a national organization wasrequired to ensure coordination between the various regional councils. Whilesome differences in reliability standards and operating procedures were fea-sible, if adjacent regions were not affected adversely by them, others were not.This lead to the formation of what is now called the North American ElectricReliability Council (NERC).1 The various regional councils were the membersof NERC, with NERC activities almost entirely controlled by the utilitysystems that were members of these regional councils.
As restructuring advanced, membership in the reliability councils changedto include all segments of the industry, including independent generators,power marketers, and so forth.As a result, a review of the overall NERC struc-
ROLE OF NERC, NAESBAND OTHER
ORGANIZATIONS
Understanding Electric Power Systems: An Overview of the Technology and the Marketplace, byJack Casazza and Frank DeleaISBN 0-471-44652-1 Copyright © 2003 The Institute of Electrical and Electronics Engineers
1 This originally was the National Electric Reliability Council, but the name was changed whenCanada and Mexico became involved.

ture was made and plans for a revised reliability organization developed, tobe called the North American Electric Reliability Organization (NAERO).
The revised organization provided for NERC to establish reliability stan-dards, monitor compliance, and establish penalties for non-compliance. Amajor decision of NERC/NAERO however, was that it would deal only withreliability matters and not become involved with business, or related mone-tary disputes.
NERC, Reliability Councils, and RTOs
A significant problem remains in the functioning of the reliability councils andNERC. As new RTOs are formed, their membership is not congruent with theexisting reliability councils. In some cases an existing reliability council maycover portions of two RTOs. In other cases several reliability councils, possi-bly having differing reliability standards, may be in a single RTO.
NAESB2
For some years business standards in the gas industry were established by agas standards organization. Discussions with NERC lead to this organizationbecoming the North American Energy Standard Board (NAESB) whichwould establish business standards for the electric power industry. The chair-man of NERC and NAESB have signed a memorandum of understanding(MOU) designed to ensure that the development of wholesale electric busi-ness practices and reliability standards are harmonized and that every effortis made to eliminate duplication of efforts between NERC and NAESB.
The MOU calls for regular communications between the two organizationsabout their respective standards development activities, including a require-ment that NERC and NAESB review and comment on each other’s annualwork plans. The MOU also establishes a Joint Interface Committee (“JIC”)that will review all standards development proposals received by either organ-ization to determine whether NERC or NAESB should draft a particular standard.
NAESB is presently contemplating having the various industry sectorspropose such business standards. They will assist in arriving at a consensuswhich will become the official industry standards.
Enforcement and Dispute Resolution
As both enforceable reliability and business standards are established with significant penalties for non-compliance, it become generally recognized thatan increased number of disputes would arise. Disputes have been frequent in
188 ROLE OF NERC, NAESB AND OTHER ORGANIZATIONS
2 The material in this section is based on NAESB’s Website: www.naesb.org

the past, many of which have resulted in FERC hearings, and sometimes courtchallenges, involving considerable time and expenditures. FERC has estab-lished a dispute resolution department with the responsibility for encouragingvarious types of alternative disputes resolution procedures to reduce the timeand costs required for resolution. These simple procedures would requiremany more mediators and arbitrators. Educational programs to train thesemediators and arbitrators are becoming more important.
PROFESSIONAL ORGANIZATIONS
Many professional organizations are involved in the functioning of the elec-tric power industry.
IEEE3
“The Institute of Electrical and Electronics Engineers, Inc. (IEEE) is a non-profit, technical professional association of more than 377,000 individualmembers in 150 countries.Through its members, the IEEE is a leading author-ity in technical areas ranging from computer engineering, biomedical tech-nology, and telecommunications, to electric power, aerospace, and consumerelectronics, among others. The IEEE is made up of:
• 10 regions;• 37 societies;• 4 councils;• Approximately 1,200 individual and joint society chapters;• 300 sections; and• 1,000 student branches are located at colleges and universities
worldwide.”
The Power Engineering Society is one of the 37 societies in the IEEE andhas 25,000 members.
“Through its technical publishing, conferences, and consensus-based stan-dards activities, the IEEE:
• Produces 30 percent of the world’s published literature in electrical engi-neering, computers, and control technology;
• Holds annually more than 300 major conferences; and• Has nearly 900 active standards with 700 under development.”
PROFESSIONAL ORGANIZATIONS 189
3 The material in this section is from the IEEE/PES website:www.ieee.org/organizations/society/power

“Policy matters related to IEEE Standards are the purview of the IEEEStandards Association (IEEE-SA), which establishes and dictates rules forpreparation and approval . . . Overwhelmingly, it is the Computer Society andthe Power Engineering Society that dominate in this regard, for instance, about40% of all IEEE Standards are . . . within the PES.”
CIGRE
Another important organization is the International Council on Large HighVoltage Electric Systems (CIGRE). CIGRE is an international organizationthrough which ideas can be exchanged with people from various countriesthrough meetings, committee activities, and its publications.4
INDUSTRY ASSOCIATIONS
To exchange ideas and to provide an effective voice in government and publicrelations circles, a number of business organizations have been formed.
NARUC5
“The National Association of Regulatory Utility Commissioners (NARUC) isa non-profit organization founded in 1889. Its members include the govern-mental agencies that are engaged in the regulation of utilities and carries inthe fifty states, the District of Columbia, Puerto Rico, and the Virgin Islands.NARUC’s member agencies regulate the activities of telecommunications,energy, and water utilities.
NARUC’s mission is to serve the public interest by improving the qualityand effectiveness of public utility regulation. Under state law, NARUC’smembers have the obligation to ensure the establishment and maintenance ofsuch energy utility services as may be required by the public convenience andnecessity, and to ensure that such services are provided at rates and conditionsthat are just, reasonable, and nondiscriminatory for all consumers.”
AEIC6
“The Association of Edison Illuminating Companies (AEIC) is an associationof electric utilities, generating companies, transmitting companies and distrib-uting companies in North America and oversees. Organized in 1885, the AEICis the oldest association to be affiliated with the electric utility industry. It provides information exchange through a committee structure, and mutual
190 ROLE OF NERC, NAESB AND OTHER ORGANIZATIONS
4 The material in this section is from the CIGRE website: www.CIGRE.org5 The material in this section is from NARUC’s website: www.naruc.org6 The material in this section is from the AEIC’s website: www.aeic.org

solutions to industry problems, as well as providing literature on load researchand underground cable specifications.”
“The purpose of the Association of Edison Illuminating Companies is:
• To promote the (technology related) business interest of its members;• To discover and adopt increasingly more reliable, economical, and effi-
cient means for the supply and utilization of electrical energy,• To provide an assembly for the exchange of experiences of electrical
properties.”
APPA7
“The American Public Power Association (APPA) is the service organizationfor the nation’s more than 2,000 community-owned electric utilities that servemore than 40 million Americans. It was created in 1940 as a non-profit, non-partisan organization. Its purpose is to advance the public policy interests ofits members and their consumers, and provide member services to ensure ade-quate, reliable electricity at a reasonable price with the proper protection ofthe environment.”
“APPA is governed by a regionally representative Board of Directors.”
EEI8
“Edison Electric Institute (EEI) organized in 1933, is the Association ofUnited States shareholder-owned electric companies, international affiliatesand industry associates worldwide. In 2000, its U.S. members served more than90% of the ultimate customers in the shareholder-owned segment of the indus-try, and nearly 70% of all electric utility ultimate customers in the nation.Theygenerated almost 70% of the electricity generated by U.S. electric utilities.”
EEI’s mission is to ensure members’ success in a new competitive envi-ronment by:
• Advocating public policy;• Expanding market opportunities;• Providing strategic business information.
“EEI works closely with its members, representing their interests and advo-cating equitable policies in legislative and regulatory arenas. . . . the Instituteprovides authoritative analysis and critical industry data to its members,Congress, governmental agencies, the financial community, and other influen-
INDUSTRY ASSOCIATIONS 191
7 The material in this section is from APPA’s website: www.appanet.org8 The material in this section is from the EEI’s website: www.eei.org

tial audiences. EEI provides forums for member company representatives todiscuss issues and strategies to advance the industry and to ensure a compet-itive position in a changing marketplace.”
ELCON9
The Electricity Consumer Resource Council (ELCON), founded in 1976, is“an association of large industrial consumers of electricity . . . coming fromvirtually every manufacturing industry. They consume nearly six percent of allthe electricity used in the United States.” ELCON describes itself as “a . . .voice for competitive policies and market structures.” It strives to lower elec-tricity costs for its industrial members.
NRECA10
“The National Rural Electric Cooperative Association (NRECA) is thenational service organization dedicated to representing the national interestsof consumer-owned cooperative electric utilities and the consumers they serve.The association provides . . . legislative representation before the U.S. Con-gress and the Executive Branch, and representation in legal and regulatoryproceedings affecting electric service and the environment.
NRECA also offers educational and training programs for cooperativedirectors, managers, and employees; collaborative research to enhance coop-eratives’ use of technology and insurance, employee benefits and financialservices and technical advice and electrification assistance in developing coun-tries around the world.”
NRECA’s electric cooperative and public power district members serve 36million people in 47 states. Approximately 855 NRECA members are electricdistribution systems. NRECA membership includes other organizationsformed by these local utilities:
• 64 generation and transmission cooperatives for power supply;• Statewide and regional trade and service associations;• Supply and manufacturing cooperatives;• Data processing cooperatives;• Employee credit unions.
Associate membership is open to equipment manufacturers and distribu-tors, wholesalers, consultants, and other entities that do business with membersof the electric cooperative network.”
192 ROLE OF NERC, NAESB AND OTHER ORGANIZATIONS
9 The material in this section is from ELCON’s website: www.elcon.org10 The material in this section is from NRECA’s website: www.nreca.org

Electric Power Supply Association11
“EPSA is the national trade association representing competitive power sup-pliers, including independent power producers, merchant generators andpower marketers. These suppliers, who account for more than a third of thenation’s installed generating capacity, provide reliable and competitivelypriced electricity from environmentally responsible facilities serving globalpower markets. EPSA seeks to bring the benefits of competition to all powercustomers. Formed as a result of a merger between the National IndependentEnergy Producers and the Electric Generation Association, EPSA combinesthe strengths and policy successes of those two prominent organizations onbehalf of the competitive power supply industry. EPSA’s formation has giventhe competitive power supply industry the ability to speak with a single, unifiedvoice at the global and national levels.”
RESEARCH ORGANIZATIONS
Years ago two types of research organizations were founded. One concernedwith technical research and one with regulatory research.12
EPRI13
“EPRI, the Electric Power Research Institute, was founded in 1973 as a non-profit energy research consortium for the benefit of utility members, their cus-tomers, and society. Its mission is to provide science and technology-basedsolutions . . . by managing a far-reaching program of scientific research,technology development, and product implementation. . . . Serving the entireenergy industry—from energy conversion to end-use in every region of theworld.”
“EPRI’s technical program consists of:
• Power generation;• Distributed resources;• Nuclear;• Environment;• Power delivery and markets.”
“EPRI’s programs are open to all organizations involved in the energyindustry, encompassing:
RESEARCH ORGANIZATIONS 193
11 Information obtained from http://www.epsa.org12 Both EPRI and NRRI were formed at the suggestion of Joseph Swidler, former Chairman ofthe Federal Power Commission.13 The material in this section is from EPRI’s website: www.EPRI.com

• All power utilities, including investor-owned, municipalities, cooperatives,and federal government utilities;
• Competitive power producers, energy service companies, engineeringservice companies, natural gas entities, power marketers, manufacturers,industrial companies, and other energy suppliers;
• Independent system operators, power exchanges, power scheduling coor-dinators, transmission companies, distribution companies, and nuclearlicensees;
• Government organizations involved in funding public-benefit R&D programs.”
Other Research14
Industry-related research is also conducted under the auspices of the DOE,the Empire State Electric Energy Research Corp. (ESEERO), and by numer-ous universities funded by both the industry and the Federal Government.
NRRI15
The National Regulatory Research Institute (NRRI) was established by theNational Association of Regulatory Utility Commissioners at Ohio State Uni-versity in 1976. It is the official research arm of NARUC. It provides “. . .research and services to inform and advance regulatory policy, primarily forU.S. state public utility commissions.”
“The NRRI has four programs of regulatory research and assistance:infrastructure, markets, consumers, and commissions. The programs addressregulatory policy in the electricity, natural gas, telecommunications, and waterindustries.
194 ROLE OF NERC, NAESB AND OTHER ORGANIZATIONS
14 Links to many other research organizations can be found atwww.netl.doe.gov/weblinks/links.html15 The material in this section is from NRRI’s website: www.nrri.ohio-state.edu

17
195
Electricity costs have increased significantly from what they might have beenif the former industry structure and regulatory procedures had remained inplace.1 Claims are made that this will be corrected once market abuses areeliminated and effective market operations are established, but many expertshave their doubts. Some new studies show that, because of its nature, the elec-tricity business results in lower costs to consumers and higher levels of relia-bility with cooperative rather than the new competitive procedures.
To justify the new regulatory approach, claims have been made that it willresult in lower costs to consumers.These claims seemed to be based on a beliefthat the regulatory regime results in higher costs because of mismanagementand the propensity to overbuild in order to increase rate base and, therefore,profits.
From a quantitative perspective, these claims have not been supported.However, from a qualitative perspective, numerous pressures can be iden-tified for increased costs to consumers under the new regulatory regime.Some of the factors that exert upward pressure on the costs to consumers are:2
WHERE RESTRUCTURINGSTANDS
Understanding Electric Power Systems: An Overview of the Technology and the Marketplace, byJack Casazza and Frank DeleaISBN 0-471-44652-1 Copyright © 2003 The Institute of Electrical and Electronics Engineers
1 Transmission Access and Retail Wheeling: The Key Questions, pp. 77–102, in Electricity Trans-mission Pricing and Technology, an EPRI book, Kluwer Academic Publishers, 1996.2 No attempt has been made to present these factors in an order that relates their impact on coststo the consumer.

• A higher risk premium required by generating companies on their investments in the new environment because of an increase in uncertainty;
• For those companies that purchased existing power plants at multiples of their book value, the higher returns needed to recoup their investment;
• Shorter economic service lives and hence higher annual depreciationexpenses for generators;
• An increase in the total amount of generating capacity than would oth-erwise have been necessary to have competitive generation markets workeffectively;
• The use of LMP pricing for dispatched generation where the price of thehighest bid generation needed to supply the customer requirements setsthe price to all customers, rather than the average cost of all generationrun as in the prior situation;
• The recently announced FERC proposal to allow a risk premium of upto 200 basis points to owners of new transmission;
• The increased complexity and, therefore, costs of managing the transmis-sion system;
• The increased number of individuals required by the various entities todo the same functions as were handled by a single staff in a regulatedcompany.
Offsetting these upward pressures are assumptions that:
• Merchant power plants will be installed at a significantly lower capitalcost per megawatt than in the past3;
• Power plants will be better maintained thus increasing their avail-ability and, thereby, lower the total amount of generation capacityneeded4
Along with these effects has been a significant amount of illegal and uneth-ical5 actions by those involved in the electric power industry, including fraud-ulent accounting and “gaming procedures” to increase profits.
196 WHERE RESTRUCTURING STANDS
3 To some extent, this assumption ignores the reality that in some areas of the country buildingof new generation continues to be extremely time consuming and, hence, costly because of strin-gent siting requirements by local governments.4 A lower reserve margin does not necessarily result in lower consumer costs, since a lower reservecan result in higher price generation being at the margin and, therefore, setting the LMP for manymore hours of the year.5 Ethics and Profits—The Crisis of Confidence in American Business, Leonard Silk and DavidVogel, Simon and Schuster, 1976.

REQUIRED ADDITIONAL ANALYSES
An increasing number of engineers, universities, and other organizations havebeen asking for analyses of the past results of deregulation and of proposedfuture policies.While price comparisons have been made, some showing reduc-tions from prior prices and others showing increases, these are strongly influ-enced by other cost changes, that is, fuel, the cost of money, subsidies, taxes,and so on, but the studies are generally not meaningful. Analyses based on theeffects on costs are now being proposed. Only if costs have been decreasedfrom what they would otherwise have been can prices become lower or profitshigher because of deregulation.
The advocates of such cost analyses stress that no sound business would berun based on policies whose results are not evaluated from time-to-time. Theyclaim that the continuing focus on “market forces” to develop future policieswithout any analyses of the effect of these market forces on the costs of elec-tricity perpetuates past errors. The continuing failure to make evaluations ofthe results of restructuring is hard to understand and is raising concerns thatsome are afraid of the answers. Only by thorough cost analyses can the ben-efits and harm of restructuring be determined thus enabling policies to beestablished retaining what is good and discarding what is bad.
ABANDONMENT OF DEREGULATION
Some states that implemented deregulation are deciding that it was a mistakeand are abandoning it, reverting to the previous regulatory structure. Theseinclude California and the Province of Ontario in Canada. Other states arepostponing steps to deregulate, and others, including Florida, have decidedagainst deregulation.
POWER SUPPLY
2002
Electric power supplies were generally adequate in 2002, a year in whichweather was mild, electricity use down, and significant power plant additionswere made. In 2002 more than 45,000MW of new generation was completed.Nearly all of these plants were supplied by natural gas. This 7% growth in newsupply was adequate with the increase in electricity demand being only 2.8%.
The Future
The disappearance in the huge profit incentives to build new power plants hascaused a major decline in the building of new power plants, with more than
POWER SUPPLY 197

100,000MW of new power plants being cancelled or postponed during 2002.Adding to the decreased incentives to build power plants has been the hugedebts accumulated by existing plant owners. About $25 billion of this debt iscoming due in 2003. This is leading to a downgrading of the credit ratings ofalmost half of the utility holding companies and merchant plant owners. Thisincreases their future costs of money for both equity and debt.6
Energy Trading. Along with the financial difficulties of the owners andbuilders of the power plants has been the sharp decline in the number and scope of activities of energy trading companies established by utilities andindependent trading organizations as a result of large financial losses and anumber of illegal activities.
RELIABILITY CONCERNS
Pressure to maintain a lower installed generation reserve increases the risksthat some customer load can’t be supplied and the inability of the competitivemarket to work effectively. Considerable concern exists about the ability tomeet our future national electric power requirements reliably and economi-cally. Some believe that cancellation of major generation projects could leadto political pressures for government takeovers of our electric power systems.
Transmission Problems
The difficulties in building the additional transmission lines needed at thepresent time and in the future continue to exist. State regulatory authoritiesconduct extensive hearings on plans to build new lines. These hearing requirelong-range justification for the lines which has become increasingly difficult toprovide since the future generation locations that determine transmissionrequirements are not known, even for a few years in the future. Needed linesare being delayed as a result.
Investment in new transmission, expenditures for reinforcement, and main-tenance of existing facilities by the transmission owners has declined signifi-cantly since earnings on such investment are difficult to recover. The FERCregulation of both the allowable cost recovery period (depreciation) and thereturn on investments is considered too low and has been discouraging theneeded improvements.
NATIONAL POWER SURVEY
From the early 1920s, it has been the practice in the United States for thefederal government to sponsor “national power surveys” about every 10 or 15
198 WHERE RESTRUCTURING STANDS
6 A number of merchant power plant owners have sought bankruptcy protection.

years. These surveys have been conducted cooperatively by the government,the power industry, and nationally known engineers. These surveys reviewedfuture long-range generation and transmission needs, considering potentialfuture scenarios. While not a blueprint for the future, they provided guidanceto those developing power systems, planning future technology developments,and sponsoring research.
Pressures for a new “national power survey” continue to mount.While eachof the regions performs studies to determine future transmission needs, usuallyunder ISO or RTO sponsorship, a national power survey would provide amechanism to coordinate as a national basis these regional plans. Such ques-tions as the use of DC transmission, the best transmission voltage to use, whichcircuits offered the best opportunities for inter-regional transfers, and theeffect of one region’s plans on another regions could all be reviewed.
CONCLUSIONS
A number of possible developments for the future have been outlined above.Decisions on these problems and procedures will take time. While this is hap-pening, two additional steps appear likely:
1. Increased use of “performance base” rate making;2. Development of “coordination contracts”.
Performance based ratemaking on which rates are based on overall per-formance and customer’s satisfaction instead of purely financial data will overcome some of the inadequacies of former rate making procedures. It willincrease to the rewards for good management.
With the unbundled industry as it now exists, significant benefits are achievable to both the market participants and the consuming public from“coordination contracts”. Coordination contracts provide a means of sharingcosts and benefits in developing plans and operating to minimize total elec-tricity costs. These contracts would cover arrangements under which a partic-ipant could take actions involving increased costs for itself that benefitedothers by a greater amount, thus creating overall system savings. These con-tracts would be negotiated between the parties to determine cost allocationso that all participants benefit and all get an appropriate share of the savings.They are a way to restore some of the benefits of coordination in a competi-tive world.
Competition in the power supply market continues to be developed.Various marketing procedures are still under consideration, varying fromFERC’s proposed SMD to the development of “regional energy service com-missions”, through which groups of states could select their own proceduresin setting up their regional markets.
CONCLUSIONS 199

Retail wheeling and customer choice faces a far more negative future.Evidence is increasing that it will not develop in the future, and may be aban-doned where it exists.
In general, the pace of new legislation and regulation may slow as a resultof the continuing calls for a “time-out” to evaluate the future alternatives.
200 WHERE RESTRUCTURING STANDS

Access charges, 176Active load management, 48Agreements, effect of restructuring on,
165Alternating current (ac), 27–28
circuits, 33–35systems, 29–33
Aluminum conductor steel reinforced(ACSR) wires, 74
American Public Power Association(APPA), 191
Amperes (“amps”), 23, 24Ancillary services, electric bulk power
system, 102–103Apparent power, 33Asset-management systems (AMSs), 183Association of Edison Illuminating
Companies (AEIC), 190–191Associations. See Industry associationsAutomated meter reading (AMR), 183Autotransformer, 78Available Transfer Capability (ATC),
105Average costs, 152–153
versus incremental costs, 173“Avoided costs” approach, 10
Base loaded generator, 16Base load units, 66Basic insulation level (BIL), 78Bidding procedures, competitive, 10
Bilateral contracts, 177Billing data, 46Blackouts, 8–9, 123Bonneville Power Act of 1937, 140Bottom-up forecast, 52Breaker arrangements, substation, 81British Thermal Units (BTUs), 69Bulk power systems, 21. See also Electric
bulk power systemsdistributed generation and, 94
Bus, 77Business networks, 134, 157–165Business operations, 182Business standards, enforcement of,
188–189
Cable systems, 75–76Capability ratings, 63Capacitance, 30–31Capacitive reactance, 30–31, 34Capacitors, 79, 80, 91–92Capacity Benefit Margin (CBM), 106,
162Cascading power interruption, 125Charging current, 34Circuit breakers, 77, 84
reclosing, 92Circuit phases, 29Circuits, alternating current, 33–35Clean Air Act (CAA), 67, 70, 140–141Coal, transportation of, 70
INDEX
201
Understanding Electric Power Systems: An Overview of the Technology and the Marketplace, byJack Casazza and Frank DeleaISBN 0-471-44652-1 Copyright © 2003 The Institute of Electrical and Electronics Engineers

Coincident demand, 46Combined cycle plants, 57Combustion (gas) turbine power
generation, 57Commend Program, 52Commercial customers, 43Commercial end-use modeling, 52Commercial security, 184–185Communication links, high-speed, 182Competition, 158, 199Competitive bidding, 10Competitive procedures, 132–133Computer systems, improvements in, 181Conductors, 74Congestion management, 107Congestion revenue rights, 176Contracts, effect of restructuring on, 165Control areas, electric bulk power
system, 99–102Coordination contracts, 165, 199Cost allocation, 172–173Cost analyses, 197Cost increases, 133Costs, average system versus
incremental, 152–153Coulomb, 24Cross-linked polyethylene insulated
cable (XLPE), 75, 76Current, 27–28Current-limiting devices, 89Customer Average Interruption
Duration Index (CAIDI), 121Customer choice, 200
restructuring and, 153–154wheeling and, 164–165
Customer-controlled load management,49
Customer information system (CIS), 183Customer load, 14–15, 41Customer maximum demand, 45–46Customer requirements, changes in, 135Customers, 13
delineating types of, 14Cyber attacks, 185
Data, generating-system, 55–56Decremental heat rates, 64Delivery system, 17–19. See also
Distribution systems; Electric bulk
202 INDEX
power system; Electric powersystem
losses and unaccounted-for energy in,52–53
Demand measures, 45–46Demand metering, 45“Demand-side” planning, 10Department of Energy (DOE), 147Department of Energy Organization Act
of 1977, 141Deregulation, abandonment of, 197. See
also RestructuringDirect current (dc), 27
versus alternating current, 35Direct load control, 48Disconnect switches, 78Dispute resolution, 188–189Distributed generation, 94–95. See also
Distribution systemsDistribution feeders, 86Distribution operations, 183Distribution rates, 154–155Distribution substations, 19Distribution systems, 85–95. See also
Electric bulk power systemcapacity of, 89–90design of, 93effect of restructuring on, 163–164energy losses from, 90metering in, 90–91primary components of, 85primary feeders into, 86–87ratings of, 90reliability of, 92–93, 129secondary, 87–89voltage control in, 91–92
Distribution transformers, 86, 87, 88Diversity, 15Divestitures. See also Restructuring
forced, 162power plant, 160–162
Dynamic instability, 38, 40
E-business, 182Econometric model, 51Economic benefits, allocation of, 172–173“Economy energy,” 4Edison Electric Institute (EEI), 191–192Edison, Thomas, 1

Effective voltage, 28Efficiency, improvements in, 8Electric bulk power system, 97–115. See
also Delivery system; Distributionsystems; Electric power entries
coordination in, 97–99new planning environment for,
113–115operation of, 99–104parallel path flow and loop flow in,
105planning related to, 107–108planning standards for, 108–113power transfer limits in, 105–107
Electric device types, systemperformance and, 15
Electric energy, 24consumption of, 41–53sources of, 15–16
Electric fields, 29Electric industry. See Electric power
industryElectricity
costs, 195end-uses for, 41–42supply decisions related to, xv
Electricity Consumer Resource Council(ELCON), 192
Electric power concepts, 23–40ac, 27–28, 29–33, 33–35ac versus dc operation, 35circuit phases, 29dc, 27electric energy, 24–26electricity flow, 26–27instability, 38–39, 40power flow, 37stability, 38–40synchronism, 29transformers, 36
Electric power generation. See Powergeneration
Electric power grid, development of,3–6
Electric power industry, 1–3federal regulation impacting, 148–153ownership structure of, 6–7six networks associated with, 133–134trade organizations in, 7
INDEX 203
Electric power policy, xvElectric power system, 13–21. See also
Delivery system; Electric bulkpower system
customer load on, 14–15energy generation in, 15–16interconnections in, 19–20synchronous nature of, 4–6
Electric Power Research Institute(EPRI), 193–194
Electric Power Supply Association(EPSA), 193
Electric reliability councils, 98Electric systems, interconnected, 21. See
also Electric power systemElectric transmission system. See
Transmission systemElectric utilities, 8–11
customer classes for, 42–43demand for, 44rate classes for, 43–44
Electromagnetic force (EMF), 24Emergencies, electric bulk power system,
103–104Emission rights, 71Empire State Electric Energy Research
Corp. (ESEERO), 194End-use forecast, 51–52End-use modeling, commercial, 52Energy. See also Electric energy
demand for, 44electrical, 24–26lost and unaccounted-for, 52–53
Energy losses, from distribution systems,90
Energy Policy Act of 1992 (EPACT), 11,144–145
Energy Policy Act of 2003, 147Energy program, DOE, 147Energy requirement forecasts, 50Energy trading, 198Environmental crisis, 9Environmental Impact Statements
(EISs), 140, 146Environmental laws/legislation, 9,
140–141Environmental program, DOE, 147Environmental Protection Agency
(EPA), 146–147

Environmental requirements, state andlocal, 155
Equipment substation, 77–81Equivalent Forced Outage Rate
(EFOR), 65Excess generation, 40Exempt Wholesale Generators (EWGs),
144
FACTS devices, 106. See also Flexible acTransmission Systems (FACTS)
Farad, 31Federal Energy Regulatory Commission
(FERC), 141, 145–146. See alsoFERC entries
Federal legislation, 138–145under debate, 147
Federal Power Act of 1935 (FPA), 138,139–140
modifications to, 144Federal regulation, recent, 148–153Federal regulatory agencies, 145–147Feeder loading, 89FERC Orders 888 and 889, 148–150,
168FERC Order 2000, 150–151, 170Financial abuses, 138Financial operations, 182Financial Transmission Rights (FTRs),
152Flexible ac Transmission Systems
(FACTS), 79–80. See also FACTSdevices
Forced outage rate, 65Forecasts, 50–52Fossil-fueled power plants, 71Fossil fuels, 56, 69Frequency, 28. See also System frequency
standardized, 2Fuel, 68
measurements of, 69purchasing, 71transportation of, 70types used, 70–71
Fuel cell power generation, 59–60Fuel crisis, 9Fuel/energy network, 133–134Fuel supply, diversity of, 125–126Full forced outages, 65
204 INDEX
Gas turbine power generation, 57Generating plants, 60–65
availability of, 65efficiency of, 64size of, 62–64
Generating units, 66–67. See alsoSynchronous generators
Generation, 18adequacy standards for, 125changes in, 99, 100planning standards for, 108–110pricing of, 113reliability and, 125–126
Generation deficient pockets, 40Generator reactive capability curve, 62Generator step-up transformers, 19Geographic information systems (GISs),
183Grid, 21. See also Electric power grid;
NetworksGross capability, 63
Heat rates, 64“Hedging” contracts, 133Henry, 30Hertz, 28High-density load areas, supplying, 89High-pressure fluid filled (HPFF) cable
systems, 75High-pressure liquid filled (HPLF) cable
systems, 75, 76High-voltage alternating current
(HVAC) lines, 73–74High-voltage direct current (HVDC)
lines, 73High-voltage direct current technology,
82–84High-voltage substations, 19Holding companies, 138–139
formation of, 158–159Horizontal market power, 173Hybrid systems, 15Hydraulic turbines, 28Hydro electric plants, conventional, 61Hydro power generation, 59–60Hydro turbine power generation, 57–58
IEEE Standards Association (IEEE-SA), 190

Imaginary power, 33Impedance, 31–33. See also Net
impedanceIncremental costs, 152–153
versus average costs, 173Incremental heat rate, 64Independent System Operators (ISOs),
99, 149, 167–169principles for, 150
Independent Transmission Providers(ITPs), 167–170
under Standard Market Design,175–176
Indirect load control, 48Inductance, 30Induction, 27, 30Inductive reactance, 30Industrial customers, 43Industry associations, 190–193Industry standards, 121–122Industry structure, 158–165Inertial response, 39Information, communications, and
control network, 134, 181–185commercial security with, 184–185distribution operations of, 183financial and business operations of,
182physical security with, 184system operations of, 182–183
Infrastructure, protecting, 184Instability, power-generation, 38–39,
40Installed Capacity Requirement (ICAP),
169Institute of Electrical and Electronics
Engineers (IEEE), 189–190. See alsoIEEE Standards Association(IEEE-SA)
Insulated Gate Bipolar Transistors(IGBT), 80–81
Insulators, 74Integrated resource planning, 10Interconnection, 21Intermediate units, 67International Council on Large High
Voltage Electric Systems (CIGRE),190
Investor-owned utilities (IOUs), 148
INDEX 205
Joint Interface Committee (JIC), 188
Kilowatt demand load curves, 44Kilowatt-hour consumption, 45Kilowatts (kW), 26, 34Kinetic energy, 24Kirchhoff’s Laws, 26, 37
Least-cost planning, 10standards for, 110
Legislationelectric utility, 8–11environmental, 9, 140–141federal, 138–145unpredictability of, 10–11
Lightning arrestors, 78Line/equipment malfunctions, 77Line losses, 53Line ratings, 74–75Load, 14–15. See also “Native” load
management of, 48–49Load diversity, effects of, 45–46Load factor, 48Load-flow studies, 112Load requirements, diversity in, 46Load serving entities (LSEs), 179Local environmental requirements, 155Locational marginal pricing (LMP),
177–178“Lone Ranger” approach, 123–124Long-term incremental costs, 66Loop flow, 105Loop systems, 87“Loss factor,” 90Lost energy, 52–53
Magnetic fields, 29, 30Maintenance, transmission system, 126.
See also Unit maintenanceMarket control, 173Marketers, effect of restructuring on, 164Market “gaming,” 164Market power, 172, 175, 184, 185
issues related to, 173–174Maximum demand, 45–46Measurements, fuel, 69Megawatts (mW), 26, 34Memorandum of understanding (MOU),
188

Merchant transmission, 163, 179Metering, 44, 45
customer choice and, 154in distribution systems, 90–91
Metering equipment, 15, 78–79Meter reading, 46Microturbines, 58–59, 63Momentary Average Interruption
Frequency Index (MAIFI), 121Money network, 134, 171–179
cost and benefit allocation under,172–173
market power issues under, 173–174
N—1 criteria, 106Nameplate rating, 62National Ambient Air Quality Standards
(NAAQS), 140–141National Association of Regulatory
Utility Commissioners (NARUC),124, 125, 190
National electric power grid,development of, 3–6
National Energy Act of 1978 (NEA),142
National Environmental Policy Act(NEPA), 140
National Power Survey, 127, 198–199National Regulatory Research Institute
(NRRI), 194National Rural Electric Cooperative
Association (NRECA), 192“Native” load, 47Natural gas, 69
transportation of, 70NERC standards, 110–111, 128–129Net dependable capabilities, 63Net impedance, 38Net peak system demand, 47Networks, interconnectivity of, 182. See
also GridNew York City blackout, 8No-load losses, 53Non-regulated power market,
development of, 163Non-spinning reserve, 102Normal line rating, 75North America, synchronous systems of,
5
206 INDEX
North American Electric ReliabilityCouncil (NERC), 98, 187–188. Seealso NERC standards
North American Electric ReliabilityOrganization (NAERO), 188
North American Energy Standard Board(NAESB), 188
“Not-for-profit” companies, 170Notice of Proposed Rulemaking
(NOPR), 174Nuclear fuel, 68Nuclear power plants, 161Nuclear unit power generation, 9, 58
Ohm, 26, 31Ohm’s Law, 26Oil, transportation of, 70OPEC organization, 9Open Access Same-Time Information
System (OASIS), 101, 182“Open architecture” policy, 170Operating emergencies, electric bulk
power system, 104Operating functions, ISO, 168–169Operating reserves, 125
electric bulk power system, 102Operating standards, 127–128Operational control, 173Organizations. See also Industry
associationsprofessional, 189–190research, 193–194role of, 187–194
Outage-management systems (OMS),183
Outages, cascading, 118. See also Fullforced outages; Partial outages;Power outages
Overlay process, 18
Parallel power flow, 105Partial forced outages, 63, 65Passive load management, 48Peak consumption, 14–15Peak electric demand, forecasts of, 50–
52Peaking generator, 16Peaking units, 67, 109Performance-based ratemaking, 199

Phase angle differences, 37Phase angle regulating transformers,
79Photo voltage cell power generation,
59–60Photovoltaics, 60Physical network, 133Physical security, 184Physical Transmission Rights (PTRs),
151–152“PJM style” market design, 170Planning
electric bulk power system, 107–108
standards for, 108–113, 127–128Planning functions, ISO, 169Power Engineering Society, 189Power factor, 33Power flow, 37
studies of, 112Power generation, 55–71. See also
Electric bulk power system; Fuelentries; Generating units
cost of, 66generating plants and, 60–65resource procurement for, 68–71types of, 56–60
Power industry, six networks associatedwith, 133–134. See also Electricpower industry
Power interruptions, 117–118Power market, non-regulated, 163Power outages, costs of, 119Power plant divestitures, 160–162Power plants, 9
new, 114, 197–198Power producers, 160Power quality, 119Power supplies, adequacy of, 197–198Power survey, national, 198–199Power system, planning and operating,
121–124Power transfers, 105–107“Prevention of Power Failures” report,
8–9Price caps, 173–174Pricing, regulation and, 138Primary circuits, protection of, 92Primary distribution systems, 86–87
INDEX 207
Primary feeder loading, 89Primary network systems, 87Privatization, 132Probability techniques, 109Production costing programs, 109Professional organizations, 189–190Protective relays, 77Public Utilities Holding Company Act
of 1935 (PUHCA), 6, 138–139,146
modifications to, 144Public Utilities Regulatory Power Act of
1978 (PURPA), 10, 142–144Pumped storage power generation, 58
Qualifying facilities (QFs), 142–143Quality of service, 93
Radial systems, 86Rate increases, 9–10Ratemaking, performance-based, 199Rate of use, measures of, 44Ratings, distribution component, 90Ratings line, 74–75Reactance, 30–31Reactive control, 128–129Reactive power, 34–35, 50
flow of, 37Reactors, 79. See also Nuclear entriesReal power, 34Reciprocating engine power generation,
58Regional planning criteria, 110Regional reliability councils, 187–188Regional Transmission Organizations
(RTOs), 162–163, 169–170, 188under FERC Order 2000, 150–151
Regulation, 8–11. See also Regulations;Regulatory network
pricing and, 137–138problems associated with, 155
Regulations, unpredictability of, 10–11.See also Regulation
Regulatory agencies, federal, 145–147Regulatory authority, state, 148“Regulatory backstops,” 175Regulatory network, 134, 137–155
federal legislation, 138–145state regulation, 148, 153–155

Relays, protective, 77Reliability, 117–129
of distribution system, 92–93, 129generation and, 125–126paying for extra, 124planning and operating for, 121–124power outage costs and, 119of transmission, 126–129ways to measure, 120–121
Reliability-cost trade-offs, 123Reliability councils, 100, 188Reliability crisis, 8–9Reliability standards, 124, 188–189Renewable energy sources, 60Research organizations, 193–194Reserve margins, 16Residential end-use model, 52Residential loads, 48Resistance, 26, 29–30Resource adequacy requirement, under
Standard Market Design, 178–179Resource procurement, for power
generation, 68–71Restructuring, 131–135
analyses of, 197causes of, 131–132customers and, 164–165distributors and, 163–164effects of, 133marketers and, 164reliability and, 198state, 153–155status of, 195–200transmitters and, 162–163types of, 132–133utility responses to, 158
Retail wheeling, 200. See also WheelingRevenue forecasts, 51Right-of-way (ROW), 75Rights markets, 179Root mean squared (RMS) value, 28, 29Rural Electrification Act of 1936 (REA),
140
Science program, DOE, 147Seams issues, 168Secondary distribution systems, 87–89Securities and Exchange Commission
(SEC), 146
208 INDEX
Security, 184–185. See also Transmissionsecurity
Security coordinators, 122–124Self-regulatory reliability organization
(SRO), 98Sendout forecasts, 50Series capacitors, 79, 80Series reactors, 79Short-circuit duty studies, 112–113Short-term incremental costs, 66Shunt capacitor banks, 91Shunt capacitors, 50, 79Shunt reactors, 79Sinks, 35“Six networks,” understanding, 133–134“Smart” power system, 104“Socio-economic” costs, 119Solar energy, 60Spinning reserve, 102“Split savings” approach, 172Spot markets, 162, 177Stability, 38–40
limits on, 106studies of, 112
Standard Market Design (SMD),174–179
independent transmission providersunder, 175–176
objectives and goals of, 174proposals under, 174–175resource adequacy under, 178–179transmission charges under, 176wholesale market design under,
177–178Standards
enforcement of, 188–189planning, operating, and design,
121–122State environmental requirements, 155State implementation plans (SIPs), 140State regulation, 148, 153–155Static Compensators (STATCOMs),
80Static VAr Compensators (SVCs), 80“Station service,” 47Steady-state instability, 38Steam power plant, 61Steam turbines, 28, 56–57Step-down transformers, 19

Studies, of circuits, 112–113Submarine cables, 76Substation capacity, 89Substations, 18, 76–81
breaker arrangements in, 81equipment in, 77–81
Subtransmission, 18Sun power generation, 59–60SVC Light, 80–81Swidler, Joseph C., xv, 8Switches, disconnect, 78Switching stations, 18, 19Synchronism, 13–14, 29Synchronous generators, 15, 27, 67–68System Average Interruption Duration
Index (SAIDI), 121System Average Interruption Frequency
Index (SAIFI), 121System control and data acquisition
(SCADA), 79, 95, 184System costs, average, 152–153System frequency, 101–102System load, 47–48System operations, 182–183
Tap changing under load (TCUL), 78Targeted reserve margins, 109Tariffs, 151, 172Technical analysis tools, 8Technologies, 3
environmentally benign, 16Tennessee Valley Authority Act of 1933
(TVA), 140Terrorist threats, 184, 185Thermal efficiency, 64Three Mile Island nuclear plant, 10“Three Musketeers” approach, 123Thyristor Controlled Series
Compensators (TCSCs), 80Thyristors, 82Tie-line frequency bias, 102Time error correction, 102Time-of-use rates, 45Top-down forecast, 51Total load, 47Total Transfer Capability (TTC), 101,
105Trade organizations, 7Transformers, 18–19, 36, 77–78
INDEX 209
design of, 78losses in, 53phase angle regulating, 79
Transient instability, 39–40Transmission, 111. See also Transmission
systemslong-range plans for, 169problems with, 198reliable, 126–129rights to, 151–152
Transmission charges, under StandardMarket Design, 176
Transmission lines, 19division of power flow among, 37ratings of, 74–75
Transmission operation, ISO, 168–169Transmission owner, options under
Standard Market Design, 175Transmission planning standards,
110–113Transmission Reliability Margin (TRM),
105Transmission systems, 73–84. See also
Transmissionaging of, 82cable in, 75–76characteristics of, 17–18components of, 73flexible ac, 79–80HVAC lines in, 74HVDC technology and, 82–84line ratings and, 74–75open-access to, 174optimizing, 127problems with, 126–127purposes of, 114substations in, 76–81“ten commandments” of, 84
Transmission tariffs, under StandardMarket Design, 179
Transmission voltages, 2–3Transmitters, effect of restructuring on,
162–163Transportation, fuel, 70Turbine generation, 15
Unaccounted-for energy, 52–53“Unbundling,” 159Underground cable systems, 73, 86

Unified Power Flow Controllers(UPFCs), 80
Unit maintenance, 65United States, interconnected electric
systems in, 21Usage patterns, grouping customers by,
14Utilities, 8
response to restructuring, 158unbundling of, 159
Utility-controlled load management, 49Utility costs, increase in, 9–10Utility industry, 2
change in, 167
Vertical market power, 173Volt, 25Volt-ampere reactive (VARs) power, 31,
34Voltage, 24–25
210 INDEX
sinusoidal shape of, 28transmission system, 17, 18–19
Voltage control, 128–129in distribution systems, 91–92
Voltage dips, 93Voltage drop, 37Voltage regulators, 92
Watts, 26Wheeling, 164–165
retail, 200Wholesale electric market, 168
under Standard Market Design,177–178
Wholesale market structure, 168Windmill power generation, 59–60Work management systems (WMS), 183
Zimmer, Michael, 135

Jack Casazza is presently President of the American Education Institute andan Outside Director of the Georgia Systems Operation Company. Formerly acorporate officer for a large utility in the United States and an executive withmajor consulting firms, he has been responsible for forecasting; DSM studies;integrated system planning; developing generation and transmission plans;economic and financial evaluations; intercompany contract negotiations; rateand cost of service studies; merger studies and analyses; strategic planning;organizational planning; pooling and coordination studies; system reliabilitystandard establishment and evaluations; cogeneration analysis; research pro-grams; and applications of new technology. He has been responsible for con-sulting projects in the USA, South America, Canada, Africa, Asia, Australia,and Europe. He is an IEEE Life Fellow.
Frank Delea retired in 1997 from Consolidated Edison Company, where hehad a wide range of assignments giving him insight into planning, operational,financial, organizational and legal issues. He was the Company’s Chief Elec-tric Planning Engineer, its Chief Forecast Engineer, and its first ProjectManager for Rate Cases. As Director of Corporate Planning, he was involvedin many issues faced by the evolving utility industry including mergers andacquisitions, investments in non-regulated subsidiaries and corporate restruc-turing. He was leader of a team charged with the formation of a holdingcompany. He also was a member of the Generation and the Financial Teamscharged with developing business strategies for a non-regulated generationsubsidiary and for the sale of regulated generation assets. He is presently asso-ciated with the American Education Institute where he conducts short coursesin technical, business, and regulatory issues relating to electric power systemsfor non-engineers. He is a member of the IEEE.
ABOUT THE AUTHORS
211
Understanding Electric Power Systems: An Overview of the Technology and the Marketplace, byJack Casazza and Frank DeleaISBN 0-471-44652-1 Copyright © 2003 The Institute of Electrical and Electronics Engineers