Understanding Commodities and Commodity ETFs · Understanding Commodities and Commodity ETFs ......
29
Understanding Commodities and Commodity ETFs Elisabeth Kashner, CFA, Moderator Senior Vice President, Analytics, IndexUniverse Jamie Farmer, Panelist Executive Director, Global Business Development and Operations, Dow Jones Indexes Sal Gilbertie, Panelist Co‐Founder and President, Teucrium Trading, LLC Alex Depetris, Panelist Vice President, Deutsche Bank, db‐X Group Stephen Hammers, CIMA, Panelist Chief Investment Officer, Compass EMP Funds
Transcript of Understanding Commodities and Commodity ETFs · Understanding Commodities and Commodity ETFs ......
Understanding Commodities and Commodity ETFs
Elisabeth Kashner, CFA,ModeratorSenior Vice President, Analytics, IndexUniverse
Jamie Farmer, PanelistExecutive Director, Global Business Development and Operations, Dow Jones Indexes
Sal Gilbertie, PanelistCo‐Founder and President, TeucriumTrading, LLC
Alex Depetris, PanelistVice President, Deutsche Bank, db‐X Group
Stephen Hammers, CIMA, PanelistChief Investment Officer, Compass EMP Funds
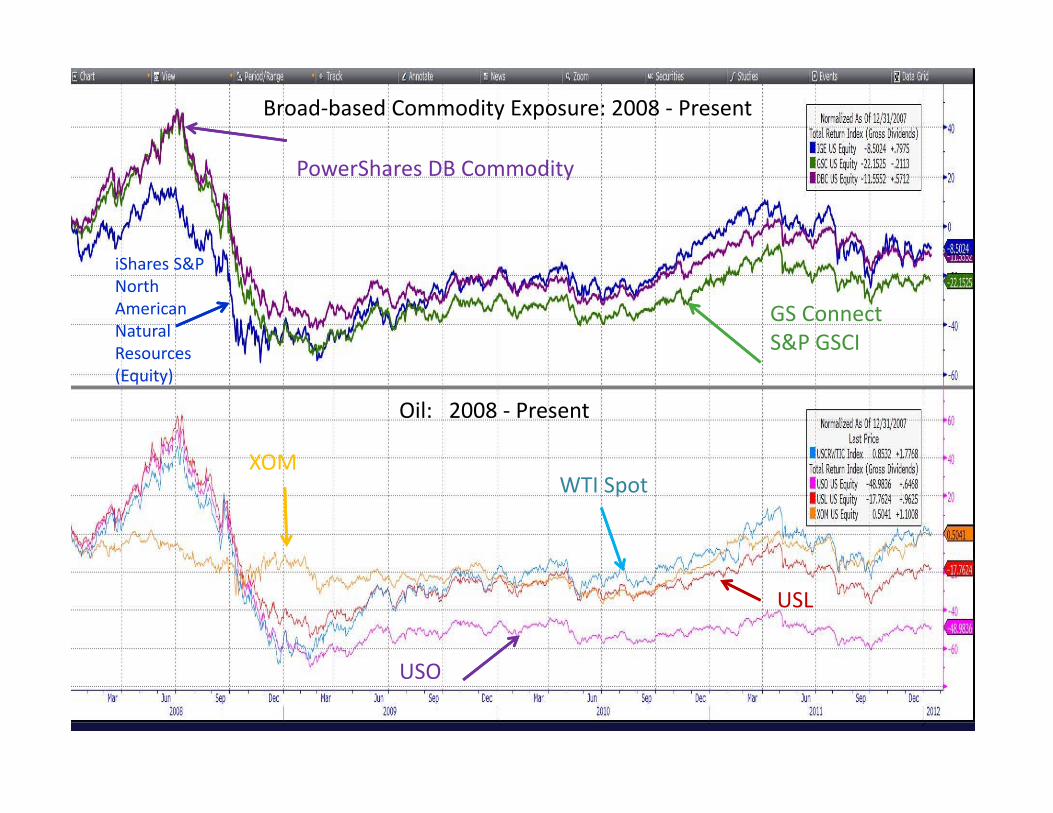
Broad‐based Commodity Exposure: 2008 ‐ Present
Oil: 2008 ‐ Present
WTI Spot
USO
XOM
USL
GS Connect S&P GSCI
iShares S&P North American Natural Resources (Equity)
PowerShares DB Commodity
Jamie Farmer, Executive DirectorGlobal Business Development &Communications
Dow Jones Indexes
Commodities – 2011 Review
-50.00%
-40.00%
-30.00%
-20.00%
-10.00%
0.00%
10.00%
20.00%
NatGas
Wheat
Zinc
Cotton
Nickel
Copper
Aluminum
Soybeans
Soybean Oil
Coffee
Sugar
Silver
Corn
WTI Crude
Lean Hogs
Live Cattle
Heating Oil
Gold
Unleaded
Brent Crude
-25.00%-20.00%-15.00%-10.00%-5.00%0.00%5.00%
10.00%
Ind. Metals
Grains
Ags
Softs
Energy
DJUBS Comp.
Livestock
Petroleum
Precious Metals
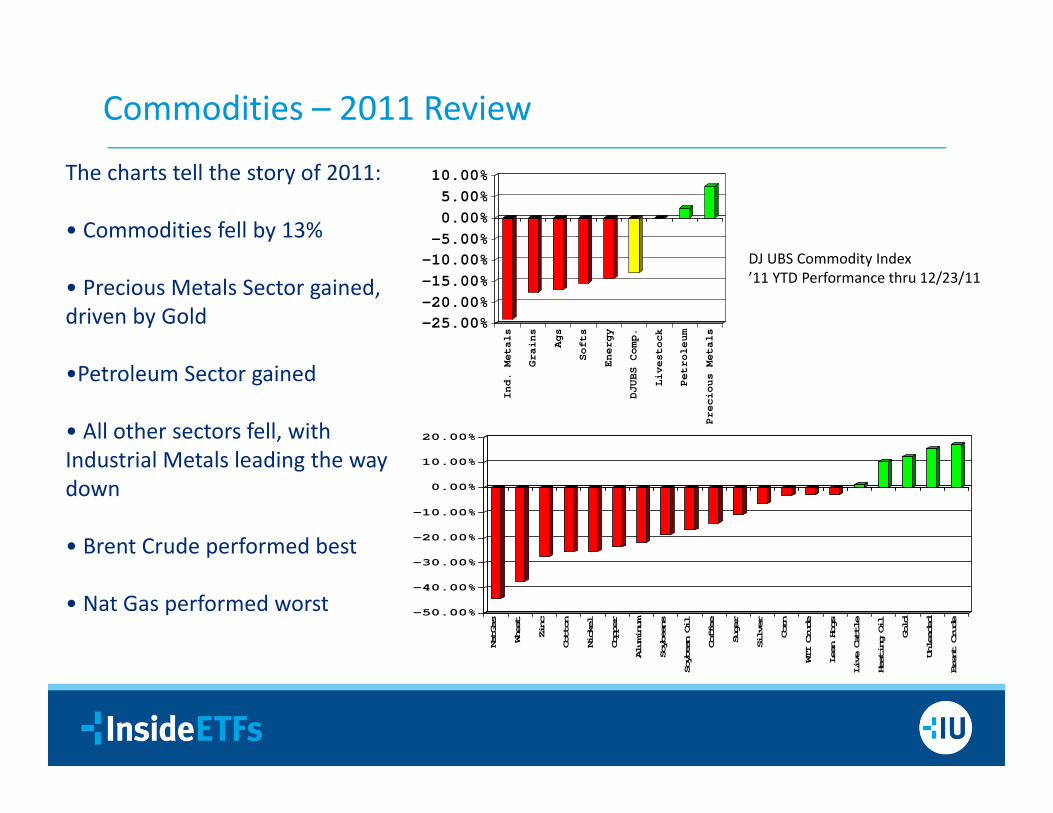
The charts tell the story of 2011:
• Commodities fell by 13%
• Precious Metals Sector gained, driven by Gold
•Petroleum Sector gained
• All other sectors fell, with Industrial Metals leading the way down
• Brent Crude performed best
• Nat Gas performed worst
DJ UBS Commodity Index’11 YTD Performance thru 12/23/11
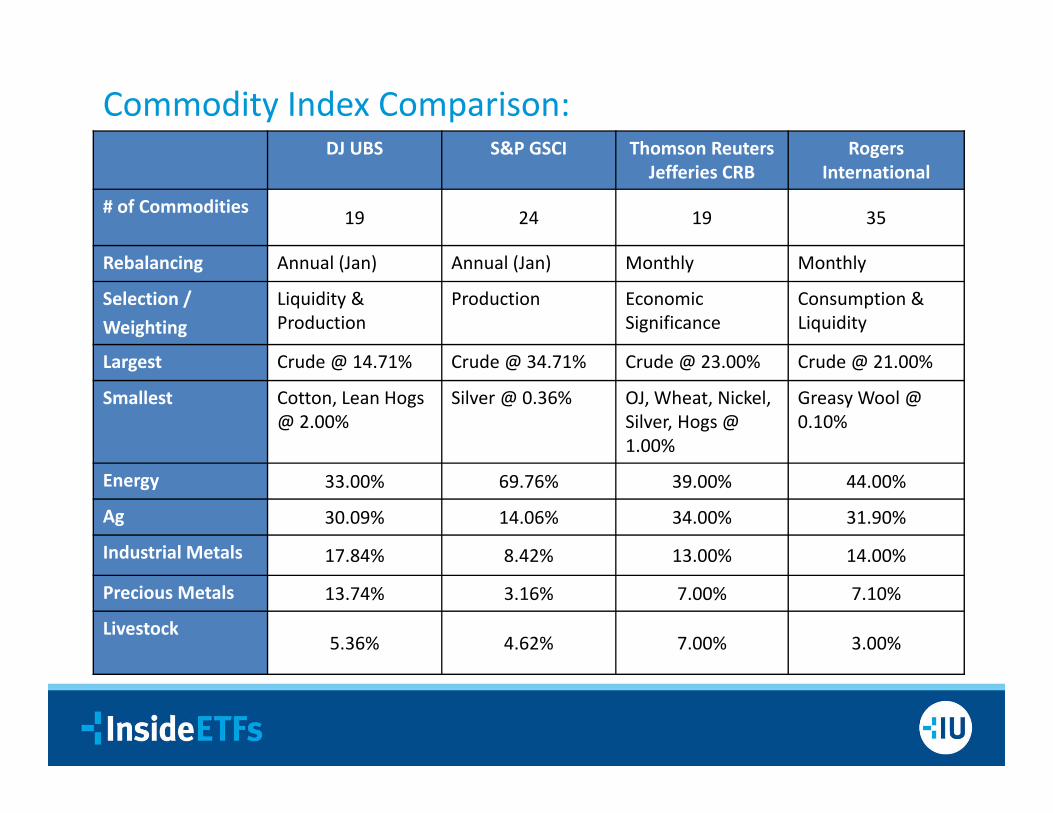
Commodity Index Comparison:DJ UBS S&P GSCI Thomson Reuters
Jefferies CRBRogers
International
# of Commodities 19 24 19 35
Rebalancing Annual (Jan) Annual (Jan) Monthly Monthly
Selection /Weighting
Liquidity & Production
Production Economic Significance
Consumption & Liquidity
Largest Crude @ 14.71% Crude @ 34.71% Crude @ 23.00% Crude @ 21.00%
Smallest Cotton, Lean Hogs @ 2.00%
Silver @ 0.36% OJ, Wheat, Nickel, Silver, Hogs @ 1.00%
Greasy Wool @ 0.10%
Energy 33.00% 69.76% 39.00% 44.00%
Ag 30.09% 14.06% 34.00% 31.90%
Industrial Metals 17.84% 8.42% 13.00% 14.00%
Precious Metals 13.74% 3.16% 7.00% 7.10%
Livestock5.36% 4.62% 7.00% 3.00%
Commodity Index, ETP Trends:
• Development of new DJUBS Commodity Indexes is driven by client demand and market evolution so a review of recent introductions gives insight into how consumer use is evolving and trends are developing:– Forward Curve Versions– Composite Ex‐sectors ‐ e.g. ags, industrial metals, precious metals, etc.– Contango Solutions – e.g. DJ UBS Roll Select– Full Curve Exposure – e.g. DJ UBS 2‐4‐6 Forward Blend– Currency Hedged– New Singles
• Industry‐wide, 2011 US ETP commodity introductions included:– 28 products– Issuers included ETF Securities, US Commodity, iPath, RBS, & Teucrium– Launches included single commodity ETNs, physical metals, trend, and contango‐focused concepts
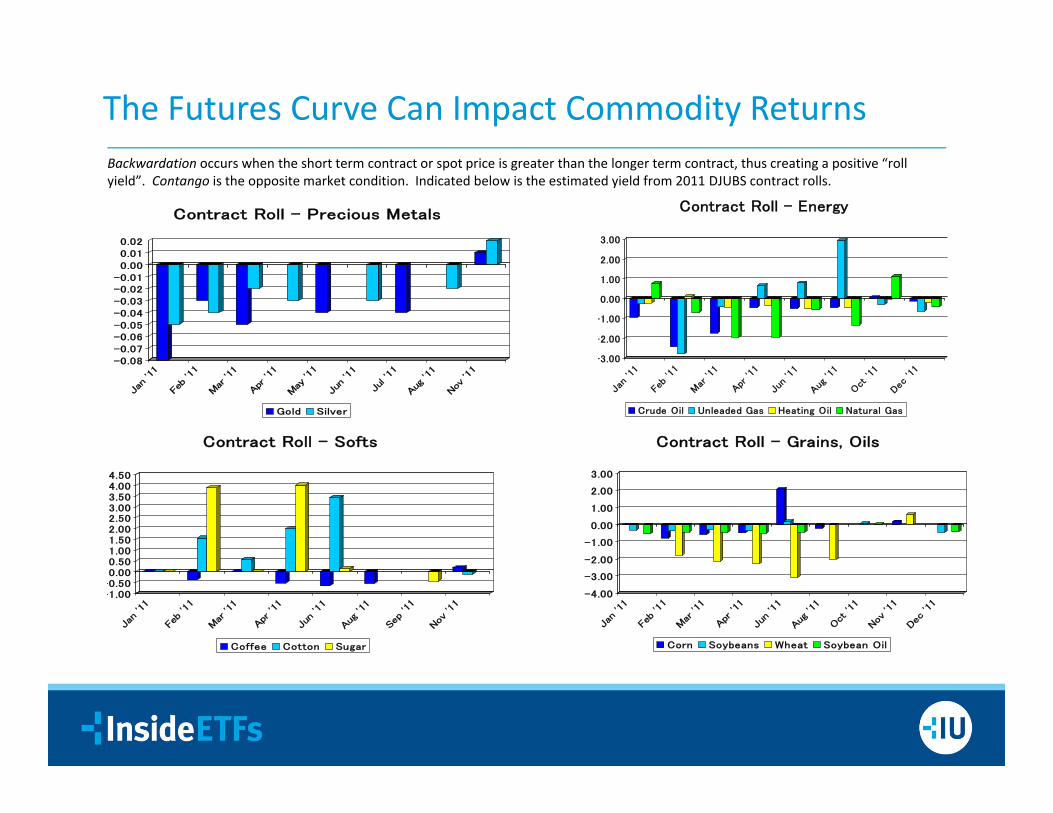
The Futures Curve Can Impact Commodity Returns
-3.00
-2.00
-1.00
0.00
1.00
2.00
3.00
Jan
'11
Feb
'11
Mar
'11
Apr '1
1
Jun
'11
Aug '1
1
Oct
'11
Dec '1
1
Contract Roll - Energy
Crude Oil Unleaded Gas Heating Oil Natural Gas
-0.08-0.07-0.06-0.05-0.04-0.03-0.02-0.010.000.010.02
Jan
'11
Feb
'11
Mar
'11
Apr
'11
May
'11
Jun
'11
Jul '
11
Aug
'11
Nov
'11
Contract Roll - Precious Metals
Gold Silver
-4.00
-3.00
-2.00
-1.00
0.00
1.00
2.00
3.00
Jan
'11
Feb
'11
Mar
'11
Apr
'11
Jun
'11
Aug
'11
Oct
'11
Nov
'11
Dec
'11
Contract Roll - Grains, Oils
Corn Soybeans Wheat Soybean Oil
-1.00-0.500.000.501.001.502.002.503.003.504.004.50
Jan
'11
Feb
'11
Mar
'11
Apr
'11
Jun
'11
Aug
'11
Sep
'11
Nov
'11
Contract Roll - Softs
Coffee Cotton Sugar
Backwardation occurs when the short term contract or spot price is greater than the longer term contract, thus creating a positive “roll yield”. Contango is the opposite market condition. Indicated below is the estimated yield from 2011 DJUBS contract rolls.
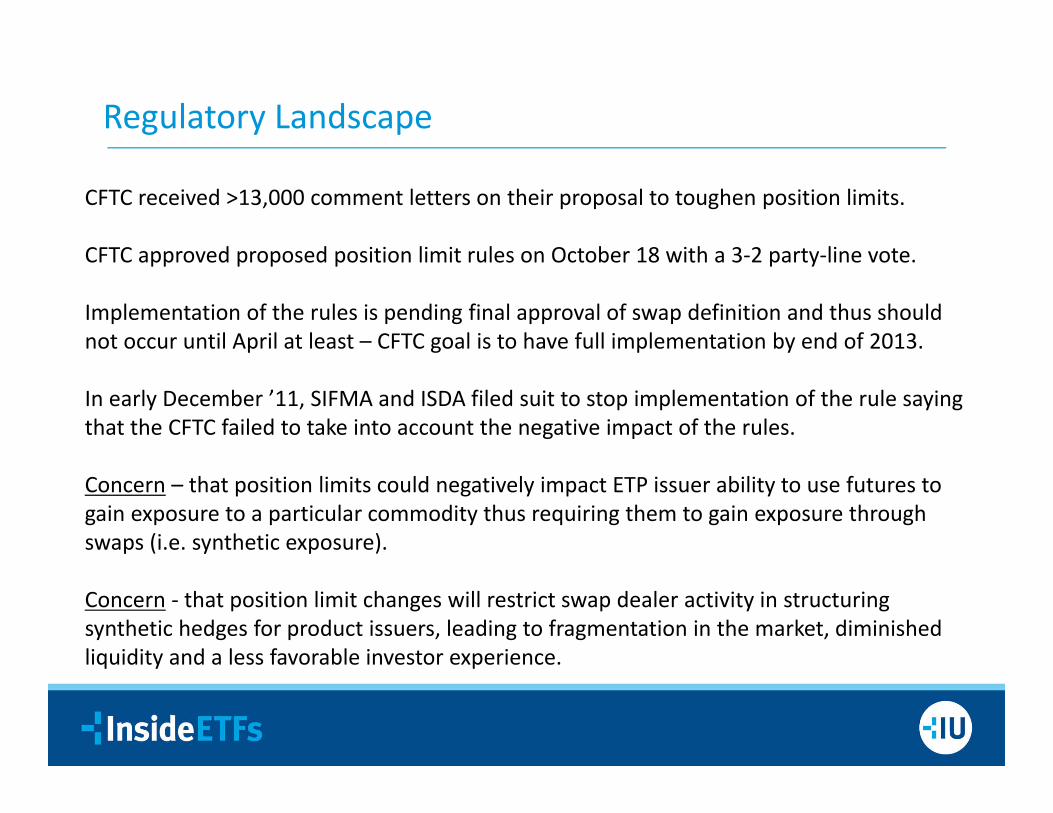
Regulatory Landscape
CFTC received >13,000 comment letters on their proposal to toughen position limits.
CFTC approved proposed position limit rules on October 18 with a 3‐2 party‐line vote.
Implementation of the rules is pending final approval of swap definition and thus should not occur until April at least – CFTC goal is to have full implementation by end of 2013.
In early December ’11, SIFMA and ISDA filed suit to stop implementation of the rule saying that the CFTC failed to take into account the negative impact of the rules.
Concern – that position limits could negatively impact ETP issuer ability to use futures to gain exposure to a particular commodity thus requiring them to gain exposure through swaps (i.e. synthetic exposure).
Concern ‐ that position limit changes will restrict swap dealer activity in structuring synthetic hedges for product issuers, leading to fragmentation in the market, diminished liquidity and a less favorable investor experience.
Sal Gilbertie, Co‐Founder and PresidentTeucrium Trading, LLC
Disclosures & Disclaimers
For Financial Intermediary Use Only ‐ Not For Use With Investing Public
This material must be accompanied by the prospectuses:
http://www.teucriumcornfund.com/pdfs/corn‐prospectus.pdfhttp://www.teucriumweatfund.com/pdfs/weat‐prospectus.pdfhttp://www. teucriumsoybfund.com/pdfs/soyb‐prospectus.pdfhttp://www.teucriumcanefund.com/pdfs/cane‐prospectus.pdfhttp://www.teucriumnagsfund.com/pdfs/nags‐prospectus.pdfhttp://www.teucriumcrudfund.com/pdfs/crud‐prospectus.pdf
The Teucrium Corn Fund (“CORN”), the Teucrium Wheat Fund (“WEAT”), the Teucrium Soybean Fund (“SOYB”), the Teucrium SugarFund (“CANE”), the Teucrium Natural Gas Fund (“NAGS”),and the Teucrium WTI Crude Oil Fund (“CRUD”), collectively the “TeucriumFunds,” have a limited operating history, so there is little performance history to serve as a basis for you to evaluate an investment inany of the Teucrium Funds. Investing in Commodity Interests subjects the Teucrium Funds to the risks of the commodity‐specificmarket, and this could result in substantial fluctuations in the price of the shares of each of the Teucrium Funds. Unlike mutual funds,the Teucrium Funds generally will not distribute dividends to Shareholders. Investors may choose to use the Teucrium Funds as ameans of investing indirectly in specific commodities, and there are risks involved in such investments. The Sponsor has limitedexperience in operating a commodity pool, which is defined as an enterprise in which several individuals contribute funds in order totrade futures or futures options collectively. Investors may choose to use the Teucrium Funds as a vehicle to hedge against the risk ofloss, and there are risks involved in hedging activities. Commodities and futures generally are volatile and are not suitable for allinvestors.
The Teucrium Funds are not mutual funds or any other type of Investment Company within the meaning of the InvestmentCompany Act of 1940, as amended, and are not subject to regulation thereunder.Shares of the Teucrium Funds are not FDIC insured, may lose value, and have no bank guarantee.All supporting documentation will be provided upon request.Foreside Fund Services, LLC is the distributor for the Teucrium Funds.
Addressing Portfolio Risk
For Financial Intermediary Use Only ‐ Not For Use With Investing Public
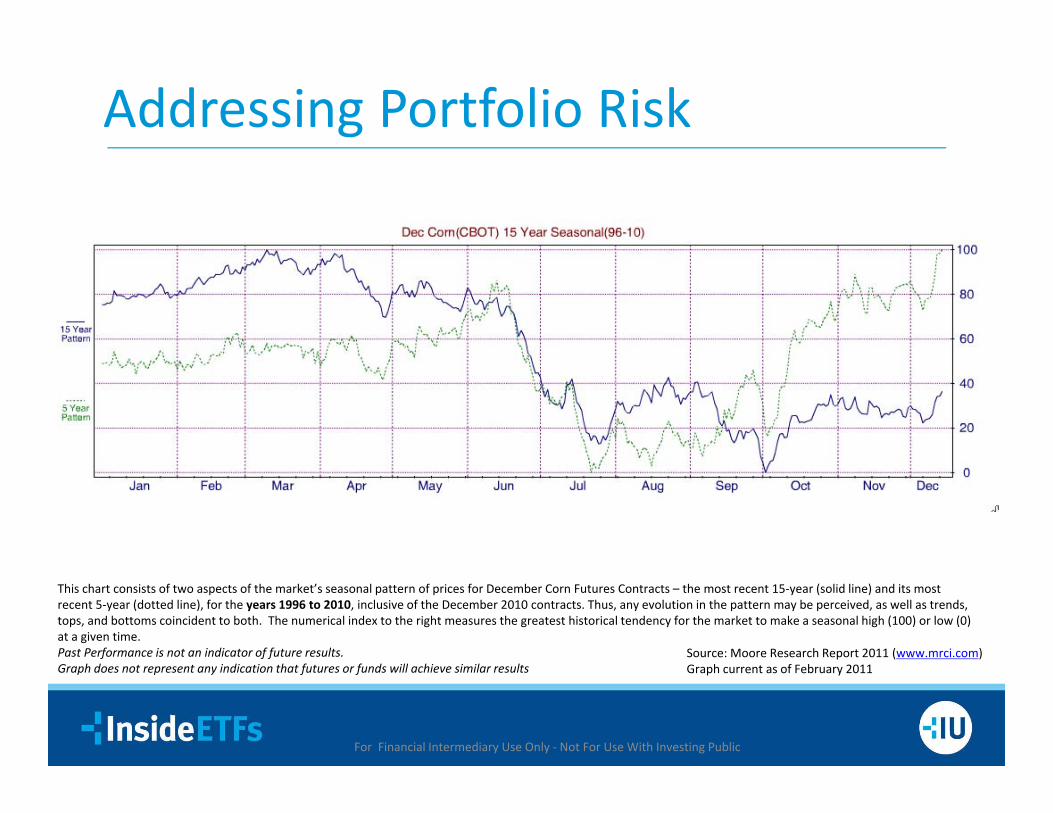
This chart consists of two aspects of the market’s seasonal pattern of prices for December Corn Futures Contracts – the most recent 15‐year (solid line) and its most recent 5‐year (dotted line), for the years 1996 to 2010, inclusive of the December 2010 contracts. Thus, any evolution in the pattern may be perceived, as well as trends, tops, and bottoms coincident to both. The numerical index to the right measures the greatest historical tendency for the market to make a seasonal high (100) or low (0) at a given time.Past Performance is not an indicator of future results.Graph does not represent any indication that futures or funds will achieve similar results
Source: Moore Research Report 2011 (www.mrci.com) Graph current as of February 2011
Addressing Portfolio Risk
Past Performance is not an indicator of future results.Graph does not represent any indication that futures or funds will achieve similar results
For Financial Intermediary Use Only ‐ Not For Use With Investing Public
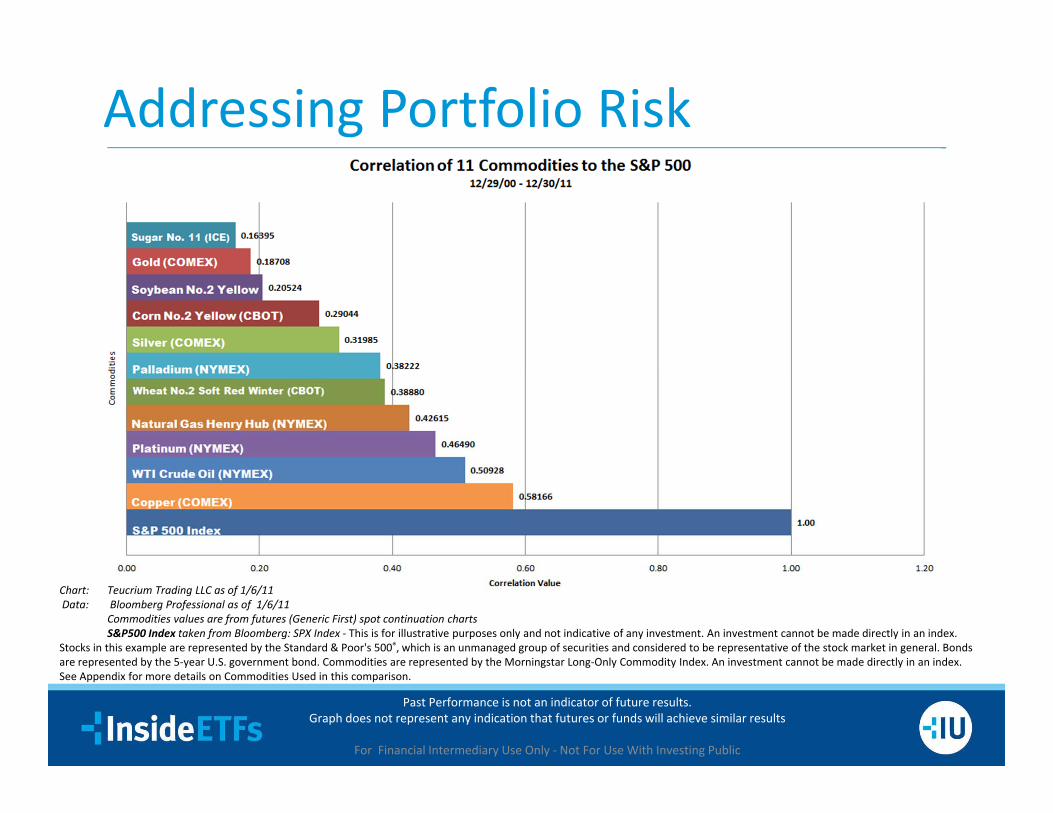
Chart: Teucrium Trading LLC as of 1/6/11Data: Bloomberg Professional as of 1/6/11
Commodities values are from futures (Generic First) spot continuation chartsS&P500 Index taken from Bloomberg: SPX Index ‐ This is for illustrative purposes only and not indicative of any investment. An investment cannot be made directly in an index.
Stocks in this example are represented by the Standard & Poor's 500®, which is an unmanaged group of securities and considered to be representative of the stock market in general. Bonds are represented by the 5‐year U.S. government bond. Commodities are represented by the Morningstar Long‐Only Commodity Index. An investment cannot be made directly in an index.See Appendix for more details on Commodities Used in this comparison.
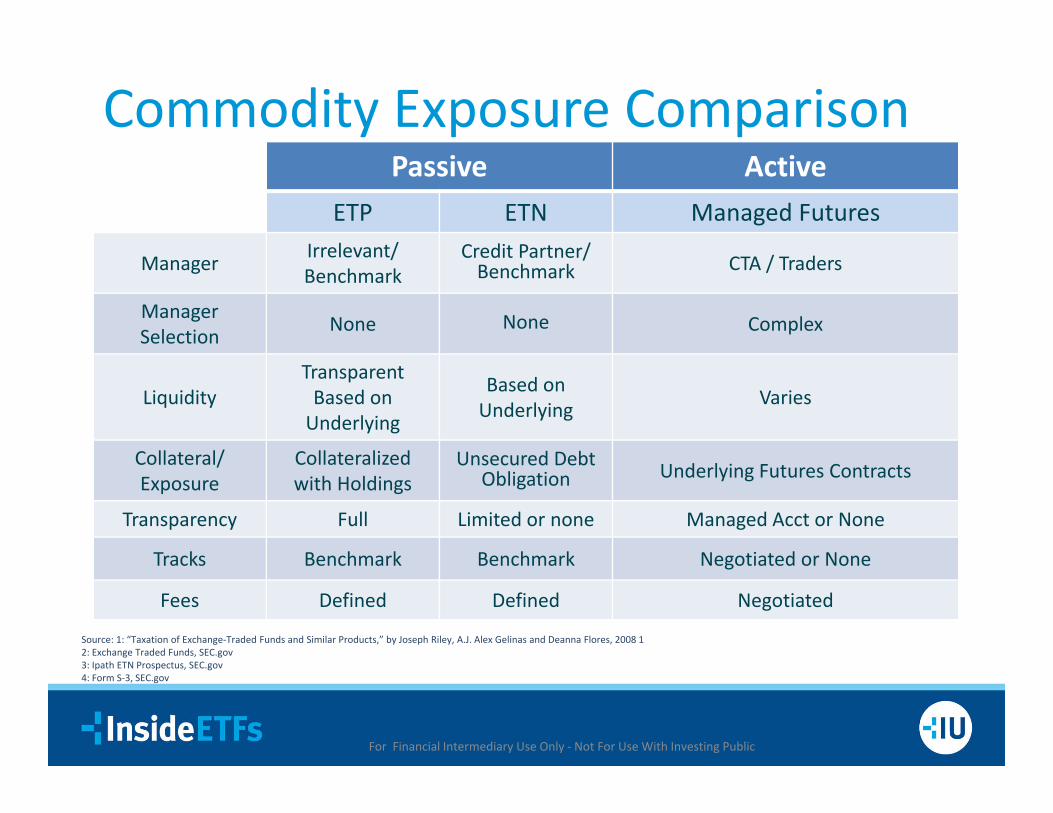
Commodity Exposure ComparisonPassive Active
ETP ETN Managed Futures
Manager Irrelevant/ Benchmark
Credit Partner/ Benchmark CTA / Traders
Manager Selection None None Complex
LiquidityTransparent Based on Underlying
Based on Underlying Varies
Collateral/ Exposure
Collateralizedwith Holdings
Unsecured Debt Obligation Underlying Futures Contracts
Transparency Full Limited or none Managed Acct or None
Tracks Benchmark Benchmark Negotiated or None
Fees Defined Defined Negotiated
Source: 1: “Taxation of Exchange‐Traded Funds and Similar Products,” by Joseph Riley, A.J. Alex Gelinas and Deanna Flores, 2008 12: Exchange Traded Funds, SEC.gov3: Ipath ETN Prospectus, SEC.gov4: Form S‐3, SEC.gov
For Financial Intermediary Use Only ‐ Not For Use With Investing Public
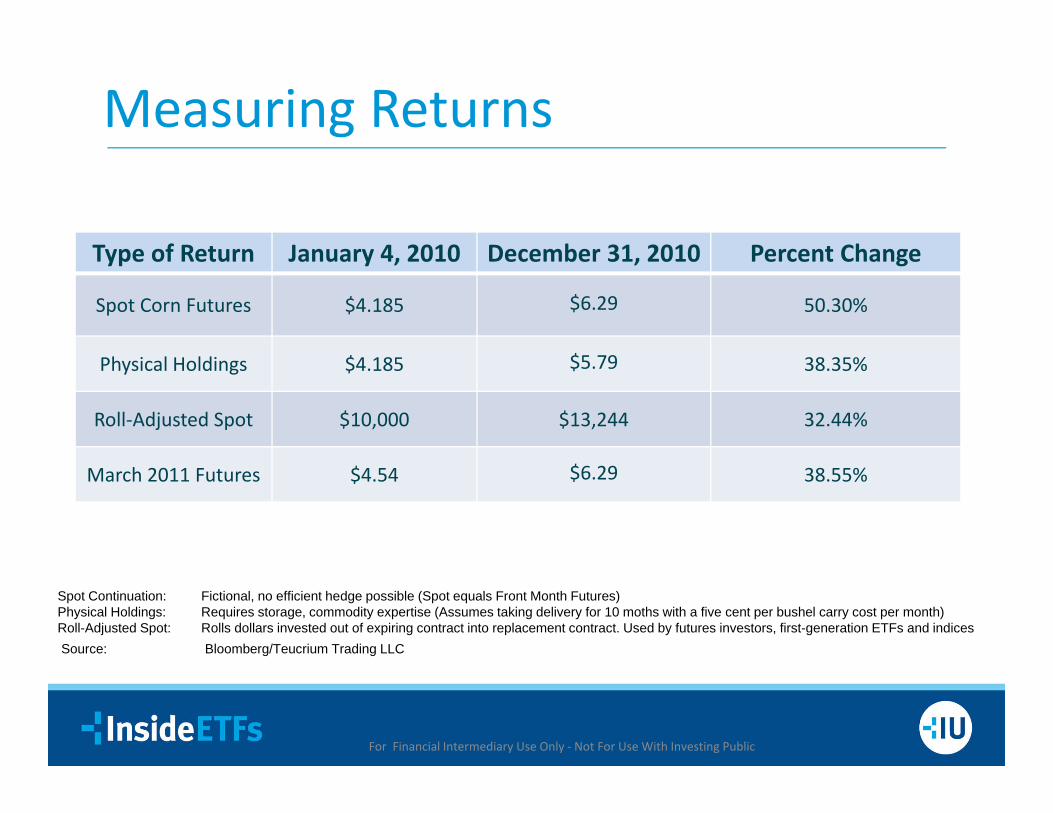
Measuring Returns
Source: Bloomberg/Teucrium Trading LLC
Spot Continuation: Fictional, no efficient hedge possible (Spot equals Front Month Futures)Physical Holdings: Requires storage, commodity expertise (Assumes taking delivery for 10 moths with a five cent per bushel carry cost per month) Roll-Adjusted Spot: Rolls dollars invested out of expiring contract into replacement contract. Used by futures investors, first-generation ETFs and indices
Type of Return January 4, 2010 December 31, 2010 Percent Change
Spot Corn Futures $4.185 $6.29 50.30%
Physical Holdings $4.185 $5.79 38.35%
Roll‐Adjusted Spot $10,000 $13,244 32.44%
March 2011 Futures $4.54 $6.29 38.55%
For Financial Intermediary Use Only ‐ Not For Use With Investing Public
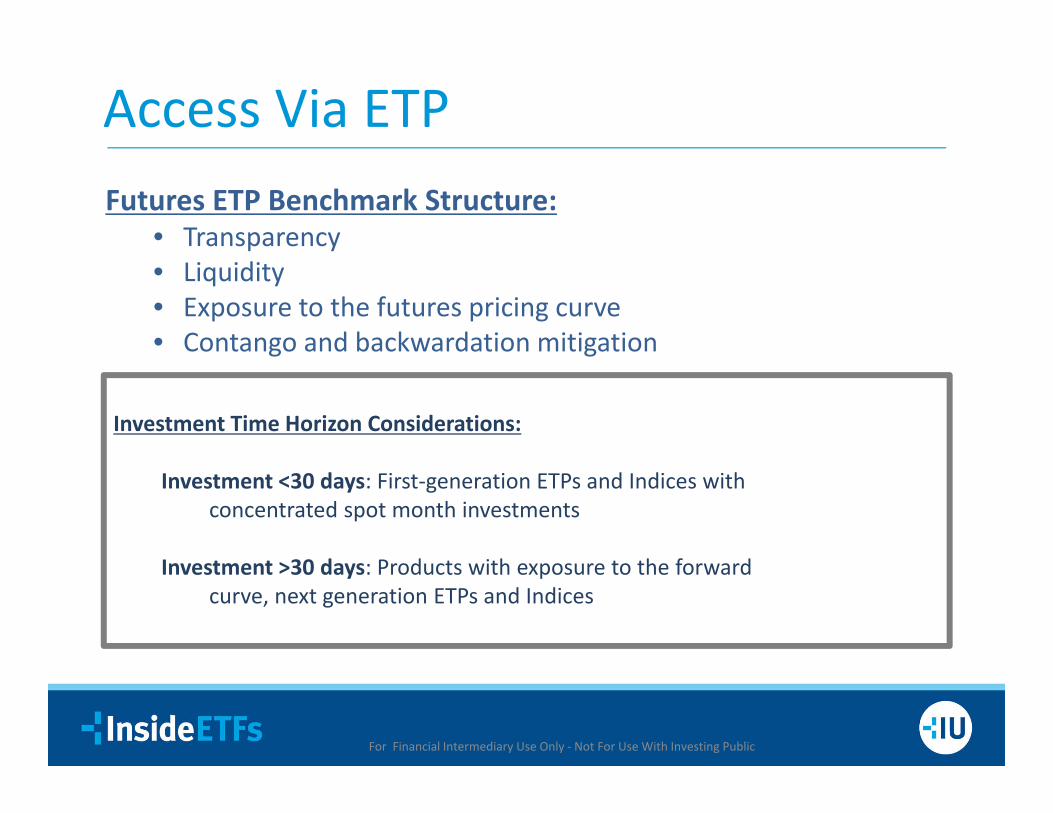
Access Via ETPFutures ETP Benchmark Structure:
• Transparency• Liquidity• Exposure to the futures pricing curve• Contango and backwardation mitigation
Investment Time Horizon Considerations:
Investment <30 days: First‐generation ETPs and Indices withconcentrated spot month investments
Investment >30 days: Products with exposure to the forward curve, next generation ETPs and Indices
For Financial Intermediary Use Only ‐ Not For Use With Investing Public
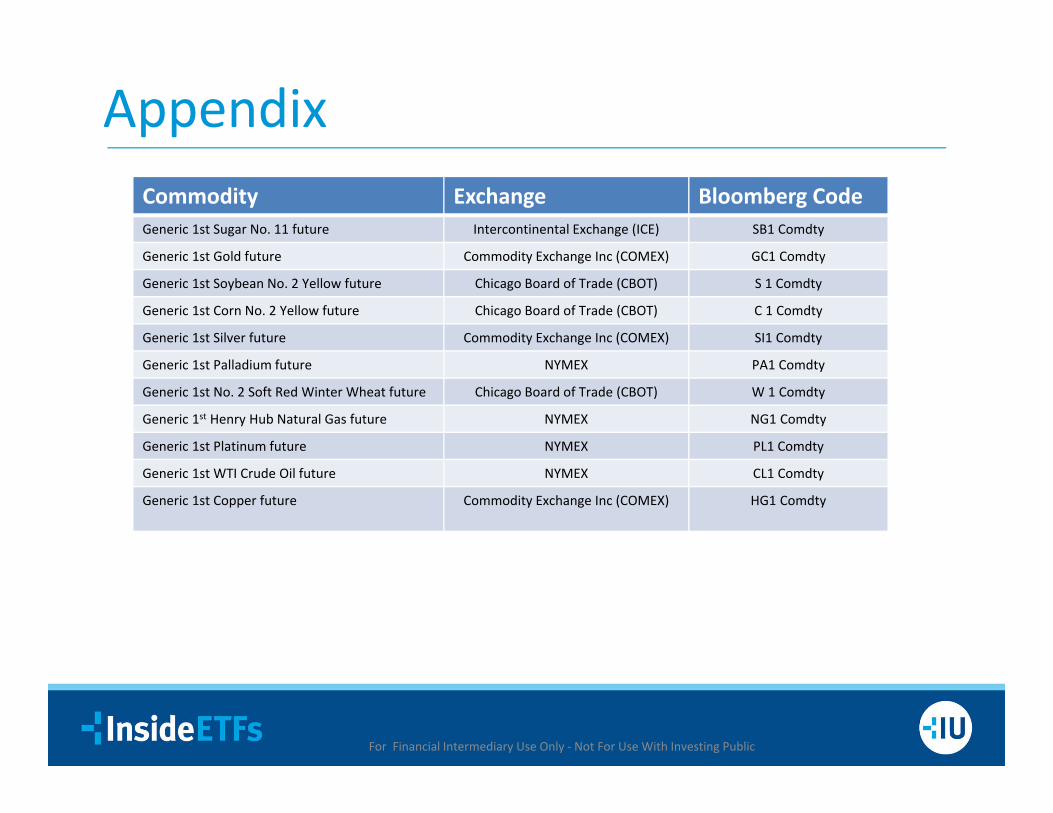
Appendix
For Financial Intermediary Use Only ‐ Not For Use With Investing Public
Commodity Exchange Bloomberg CodeGeneric 1st Sugar No. 11 future Intercontinental Exchange (ICE) SB1 Comdty
Generic 1st Gold future Commodity Exchange Inc (COMEX) GC1 Comdty
Generic 1st Soybean No. 2 Yellow future Chicago Board of Trade (CBOT) S 1 Comdty
Generic 1st Corn No. 2 Yellow future Chicago Board of Trade (CBOT) C 1 Comdty
Generic 1st Silver future Commodity Exchange Inc (COMEX) SI1 Comdty
Generic 1st Palladium future NYMEX PA1 Comdty
Generic 1st No. 2 Soft Red Winter Wheat future Chicago Board of Trade (CBOT) W 1 Comdty
Generic 1st Henry Hub Natural Gas future NYMEX NG1 Comdty
Generic 1st Platinum future NYMEX PL1 Comdty
Generic 1st WTI Crude Oil future NYMEX CL1 Comdty
Generic 1st Copper future Commodity Exchange Inc (COMEX) HG1 Comdty
Disclosures & Disclaimers
For Financial Intermediary Use Only ‐ Not For Use With Investing Public
This material must be accompanied by the prospectuses:
http://www.teucriumcornfund.com/pdfs/corn‐prospectus.pdfhttp://www.teucriumweatfund.com/pdfs/weat‐prospectus.pdfhttp://www. teucriumsoybfund.com/pdfs/soyb‐prospectus.pdfhttp://www.teucriumcanefund.com/pdfs/cane‐prospectus.pdfhttp://www.teucriumnagsfund.com/pdfs/nags‐prospectus.pdfhttp://www.teucriumcrudfund.com/pdfs/crud‐prospectus.pdf
The Teucrium Corn Fund (“CORN”), the Teucrium Wheat Fund (“WEAT”), the Teucrium Soybean Fund (“SOYB”), the Teucrium SugarFund (“CANE”), the Teucrium Natural Gas Fund (“NAGS”),and the Teucrium WTI Crude Oil Fund (“CRUD”), collectively the “TeucriumFunds,” have a limited operating history, so there is little performance history to serve as a basis for you to evaluate an investment inany of the Teucrium Funds. Investing in Commodity Interests subjects the Teucrium Funds to the risks of the commodity‐specificmarket, and this could result in substantial fluctuations in the price of the shares of each of the Teucrium Funds. Unlike mutual funds,the Teucrium Funds generally will not distribute dividends to Shareholders. Investors may choose to use the Teucrium Funds as ameans of investing indirectly in specific commodities, and there are risks involved in such investments. The Sponsor has limitedexperience in operating a commodity pool, which is defined as an enterprise in which several individuals contribute funds in order totrade futures or futures options collectively. Investors may choose to use the Teucrium Funds as a vehicle to hedge against the risk ofloss, and there are risks involved in hedging activities. Commodities and futures generally are volatile and are not suitable for allinvestors.
The Teucrium Funds are not mutual funds or any other type of Investment Company within the meaning of the InvestmentCompany Act of 1940, as amended, and are not subject to regulation thereunder.Shares of the Teucrium Funds are not FDIC insured, may lose value, and have no bank guarantee.All supporting documentation will be provided upon request.Foreside Fund Services, LLC is the distributor for the Teucrium Funds.
Alex Depetris, Vice PresidentDeutsche Bankdb‐X Group
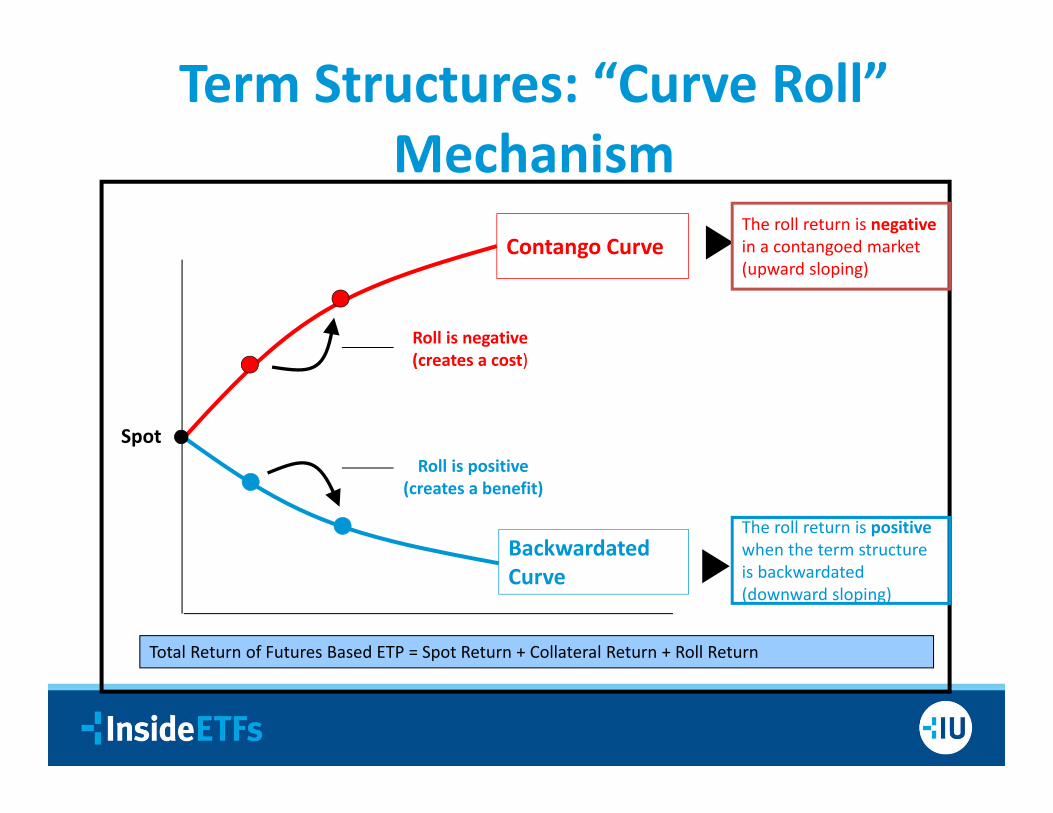
Term Structures: “Curve Roll” Mechanism
Contango Curve
Spot
Roll is negative(creates a cost)
Roll is positive(creates a benefit)
The roll return is positivewhen the term structure is backwardated (downward sloping)
Total Return of Futures Based ETP = Spot Return + Collateral Return + Roll Return
The roll return is negativein a contangoed market (upward sloping)
Backwardated Curve
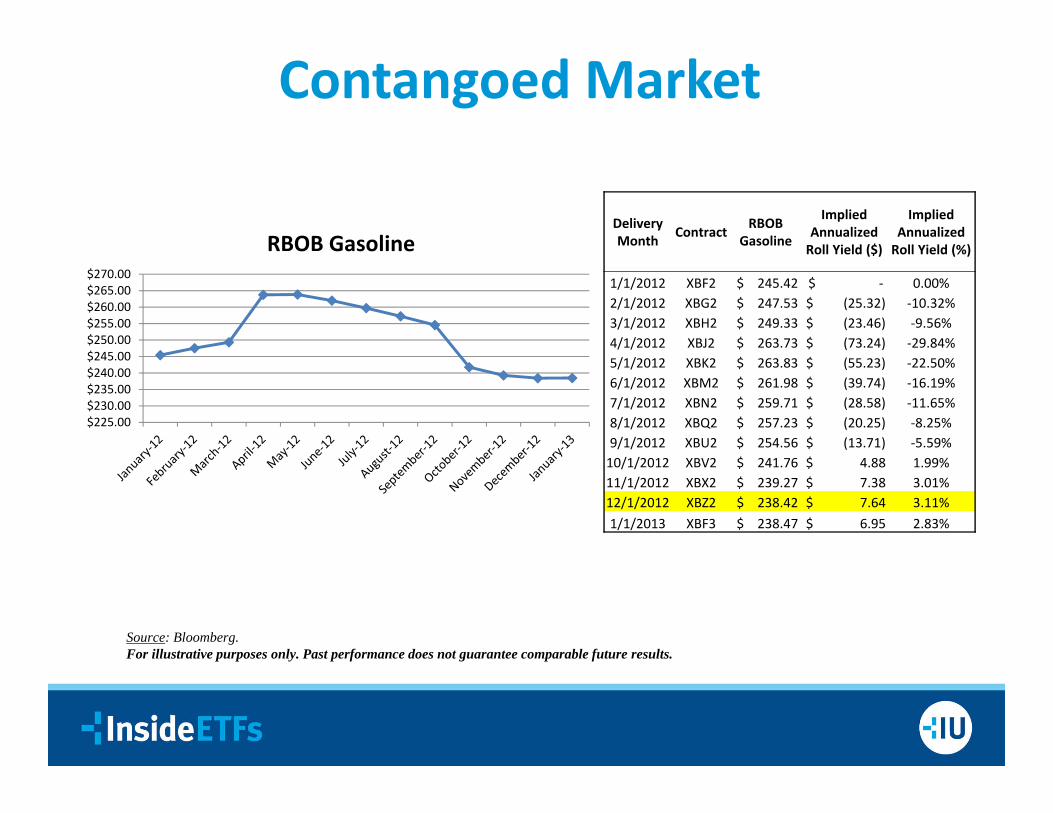
Contangoed Market
$225.00$230.00$235.00$240.00$245.00$250.00$255.00$260.00$265.00$270.00
RBOB GasolineDelivery Month Contract RBOB
Gasoline
Implied Annualized Roll Yield ($)
Implied Annualized Roll Yield (%)
1/1/2012 XBF2 $ 245.42 $ ‐ 0.00%2/1/2012 XBG2 $ 247.53 $ (25.32) ‐10.32%3/1/2012 XBH2 $ 249.33 $ (23.46) ‐9.56%4/1/2012 XBJ2 $ 263.73 $ (73.24) ‐29.84%5/1/2012 XBK2 $ 263.83 $ (55.23) ‐22.50%6/1/2012 XBM2 $ 261.98 $ (39.74) ‐16.19%7/1/2012 XBN2 $ 259.71 $ (28.58) ‐11.65%8/1/2012 XBQ2 $ 257.23 $ (20.25) ‐8.25%9/1/2012 XBU2 $ 254.56 $ (13.71) ‐5.59%10/1/2012 XBV2 $ 241.76 $ 4.88 1.99%11/1/2012 XBX2 $ 239.27 $ 7.38 3.01%12/1/2012 XBZ2 $ 238.42 $ 7.64 3.11%1/1/2013 XBF3 $ 238.47 $ 6.95 2.83%
Source: Bloomberg. For illustrative purposes only. Past performance does not guarantee comparable future results.
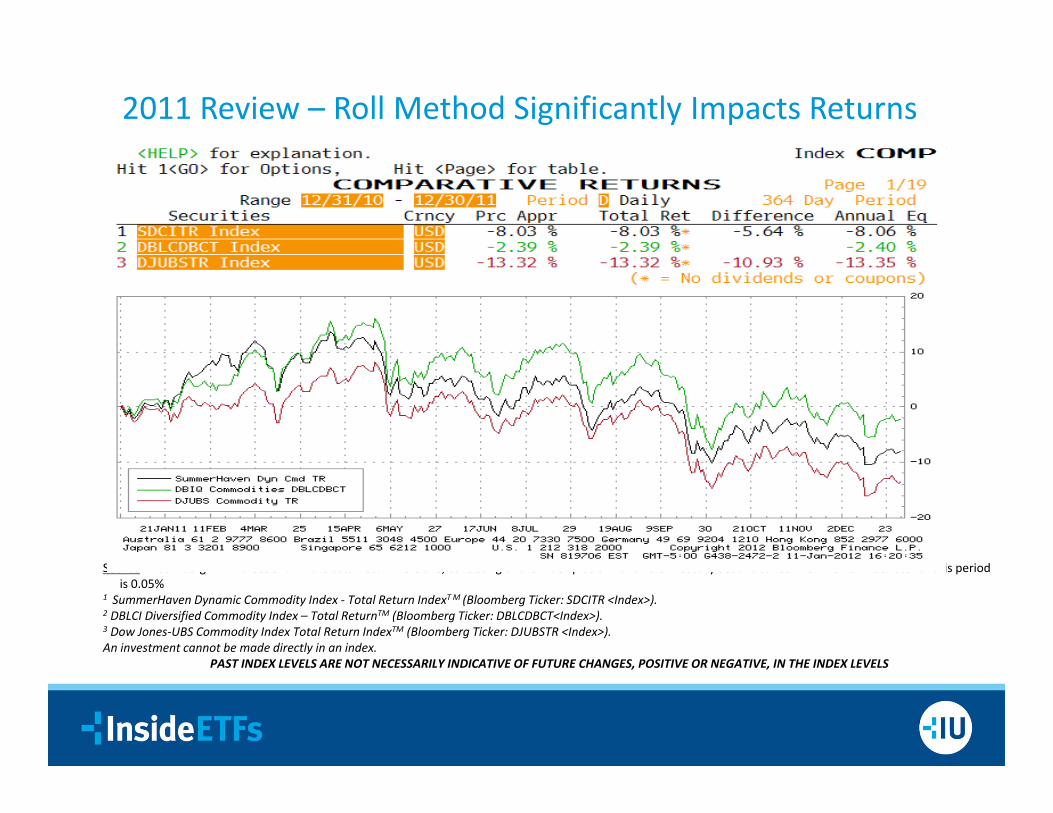
2011 Review – Roll Method Significantly Impacts Returns
Source: Bloomberg. All indices shown are total return versions, consisting of the index plus 3‐month U.S Treasury Securities returns. The risk free rate for this period is 0.05%
1 SummerHaven Dynamic Commodity Index ‐ Total Return IndexT M (Bloomberg Ticker: SDCITR <Index>).2 DBLCI Diversified Commodity Index – Total ReturnTM (Bloomberg Ticker: DBLCDBCT<Index>).3 Dow Jones‐UBS Commodity Index Total Return IndexTM (Bloomberg Ticker: DJUBSTR <Index>).An investment cannot be made directly in an index.
PAST INDEX LEVELS ARE NOT NECESSARILY INDICATIVE OF FUTURE CHANGES, POSITIVE OR NEGATIVE, IN THE INDEX LEVELS
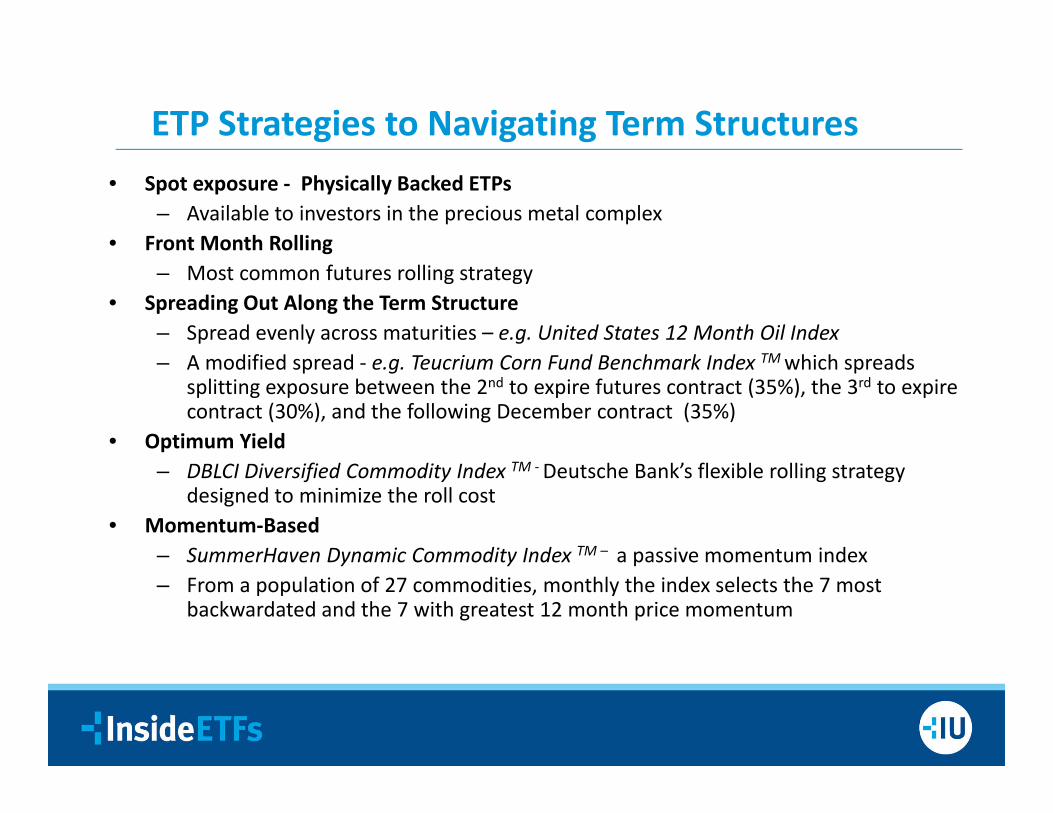
• Spot exposure ‐ Physically Backed ETPs– Available to investors in the precious metal complex
• Front Month Rolling– Most common futures rolling strategy
• Spreading Out Along the Term Structure– Spread evenly across maturities – e.g. United States 12 Month Oil Index– A modified spread ‐ e.g. Teucrium Corn Fund Benchmark Index TM which spreads
splitting exposure between the 2nd to expire futures contract (35%), the 3rd to expire contract (30%), and the following December contract (35%)
• Optimum Yield– DBLCI Diversified Commodity Index TM ‐Deutsche Bank’s flexible rolling strategy
designed to minimize the roll cost• Momentum‐Based
– SummerHaven Dynamic Commodity Index TM – a passive momentum index– From a population of 27 commodities, monthly the index selects the 7 most
backwardated and the 7 with greatest 12 month price momentum
ETP Strategies to Navigating Term Structures
– All commodity ETP’s in the US marketplace track passive, transparent and published indices – there are no “dark” or actively managed commodity ETPs
– All indices tracked by ETPs are potentially subject to front‐running– Front runners may include hedge funds, market makers and other
sophisticated traders– Managers can minimize potential front‐running by implementing a
number of strategies such as: (i) tracking indices that contain the most liquid commodities(ii) spread rolling activity over a number of days(iii) using the most experienced executing commodity brokers
The Challenge to Rolling Transparent Futures Based Commodity Strategies
The information herein is believed to be reliable and has been obtained from sources believed to be reliable, but Deutsche Bank (“DB”) makes no representation or warranty, express or implied, with respect to the fairness, correctness, accuracy, reasonableness or completeness of such information. In addition we have no obligation to update, modify, or amend this communication or to otherwise notify a recipient in the event that any matter stated herein, or any opinion, projection, forecast or estimate set forth herein, changes or subsequently becomes inaccurate.We are not acting and do not purport to act in any way as an advisor or in a fiduciary capacity. We therefore strongly suggest that recipients seek their own independent advice in relation to any investment, financial, legal, tax, accounting or regulatory issues discussed herein. Analyses and opinions contained herein may be based on assumptions that if altered can change the analyses or opinions expressed. Nothing contained herein shall constitute any representation or warranty as to future performance of any financial instrument, credit, currency rate or other market or economic measure. Furthermore, past performance is not necessarily indicative of future results. Past index levels are not necessarily indicative of future changes, positive or negative, in the index levels. This communication is provided for information purposes only. It is not an offer to sell, or a solicitation of an offer to buy, any security, nor to enter into any agreement or contract with Deutsche Bank AG or any affiliates. Any offering or potential transaction that may be related to the subject matter of this communication will be made pursuant to separate and distinct documentation and in such case the information contained herein will be superseded in its entirety by such documentation in final form.Because this communication is a summary only it may not contain all material terms, and therefore this communication in and of itself should not form the basis for any investment decision. Financial instruments that may be discussed herein may not be suitable for all investors, and potential investors must make an independent assessment of the appropriateness of any transaction in light of their own objectives and circumstances, including the possible risks and benefits of entering into such a transaction. By accepting receipt of this communication the recipient will be deemed to represent that they possess, either individually or through their advisers, sufficient investment expertise to understand the risks involved in any purchase or sale of any financial instrument, if applicable, as discussed herein. If a financial instrument is denominated in a currency other than an investor’s currency, a change in exchange rates may adversely affect the price or value of, or the income derived from, the financial instrument, and any investor in that financial instrument effectively assumes currency risk. Prices and availability of any financial instruments described in this communication are subject to change without noticeSecurities and investment banking activities in the United States are performed by Deutsche Bank Securities Inc., member NYSE, FINRA, and SIPC, and its broker-dealer affiliates. Lending and other commercial banking activities in the United States are performed by Deutsche Bank AG, and its banking affiliates. This communication and the information herein is confidential and may not be reproduced or distributed in whole or in part without our prior written consent.
© 2012 Deutsche Bank AG.PAST INDEX LEVELS ARE NOT NECESSARILY INDICATIVE OF FUTURE CHANGES, POSITIVE OR NEGATIVE, IN THE INDEX LEVELS
Disclaimers
Stephen Hammers, CIMAChief Investment OfficerCompass EMP Funds
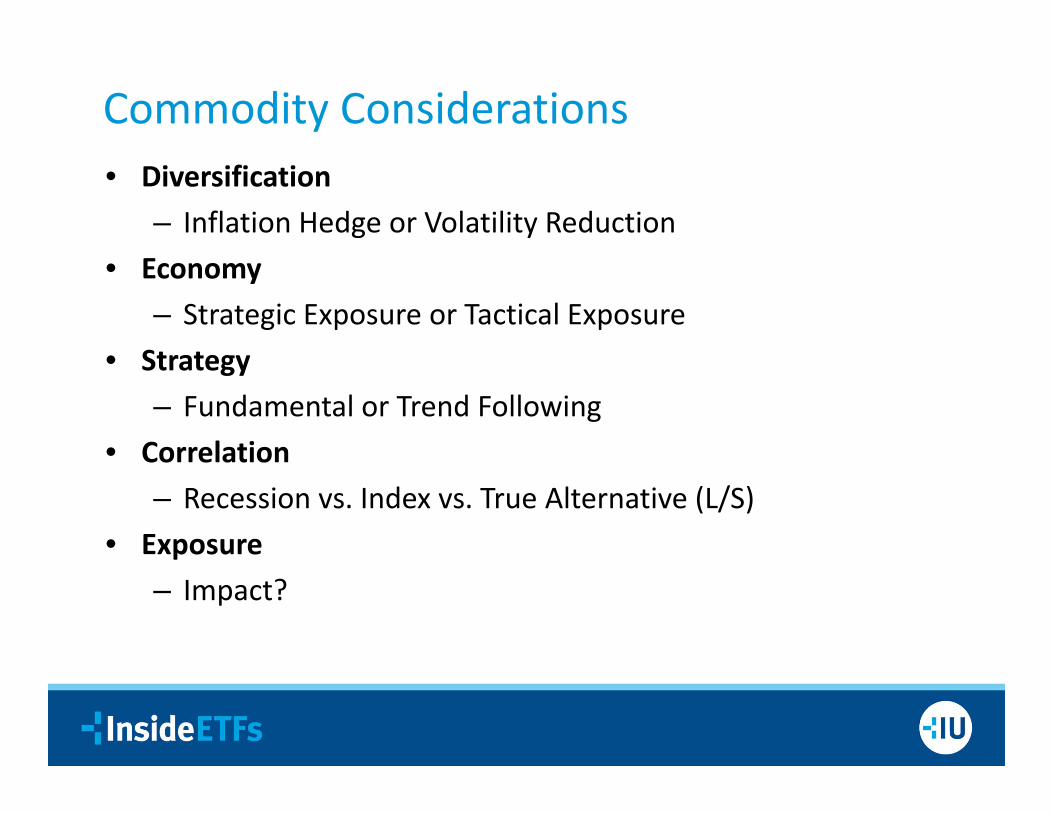
• Diversification– Inflation Hedge or Volatility Reduction
• Economy– Strategic Exposure or Tactical Exposure
• Strategy– Fundamental or Trend Following
• Correlation– Recession vs. Index vs. True Alternative (L/S)
• Exposure– Impact?
Commodity Considerations
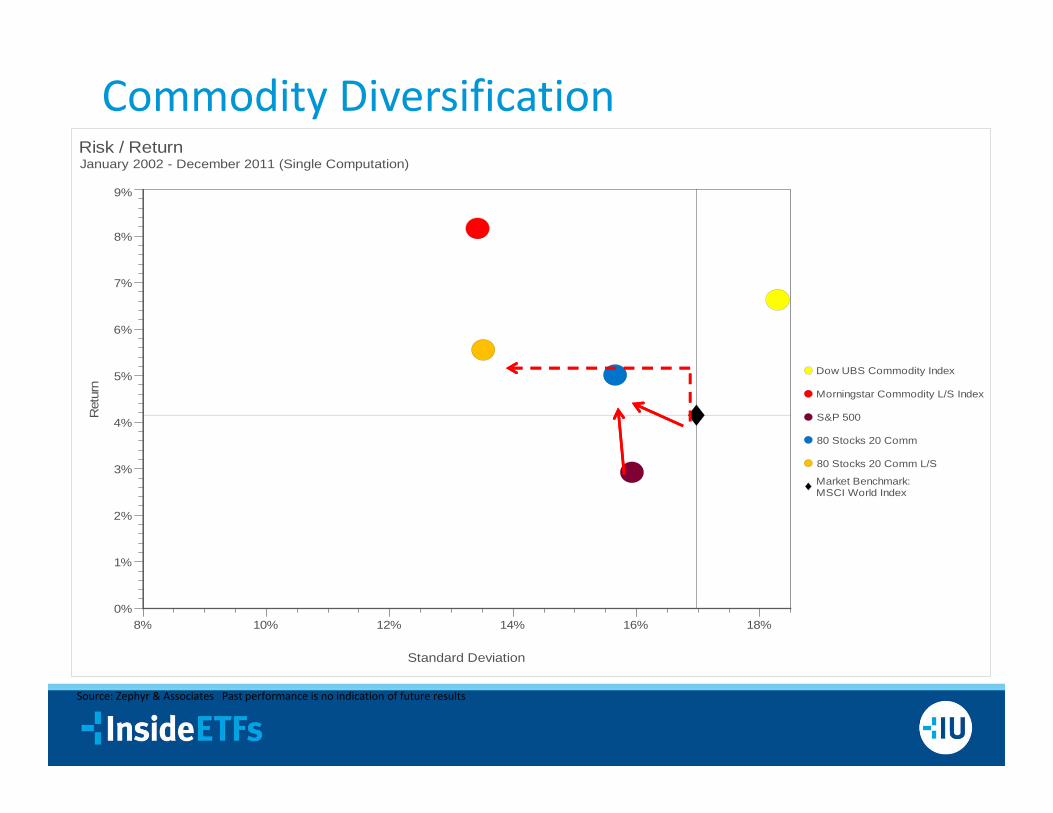
Risk / ReturnJanuary 2002 - December 2011 (Single Computation)
Ret
urn
0%
1%
2%
3%
4%
5%
6%
7%
8%
9%
Standard Deviation
8% 10% 12% 14% 16% 18%
Dow UBS Commodity Index
Morningstar Commodity L/S Index
S&P 500
80 Stocks 20 Comm
80 Stocks 20 Comm L/S
Market Benchmark:MSCI World Index
Commodity Diversification
Source: Zephyr & Associates Past performance is no indication of future results
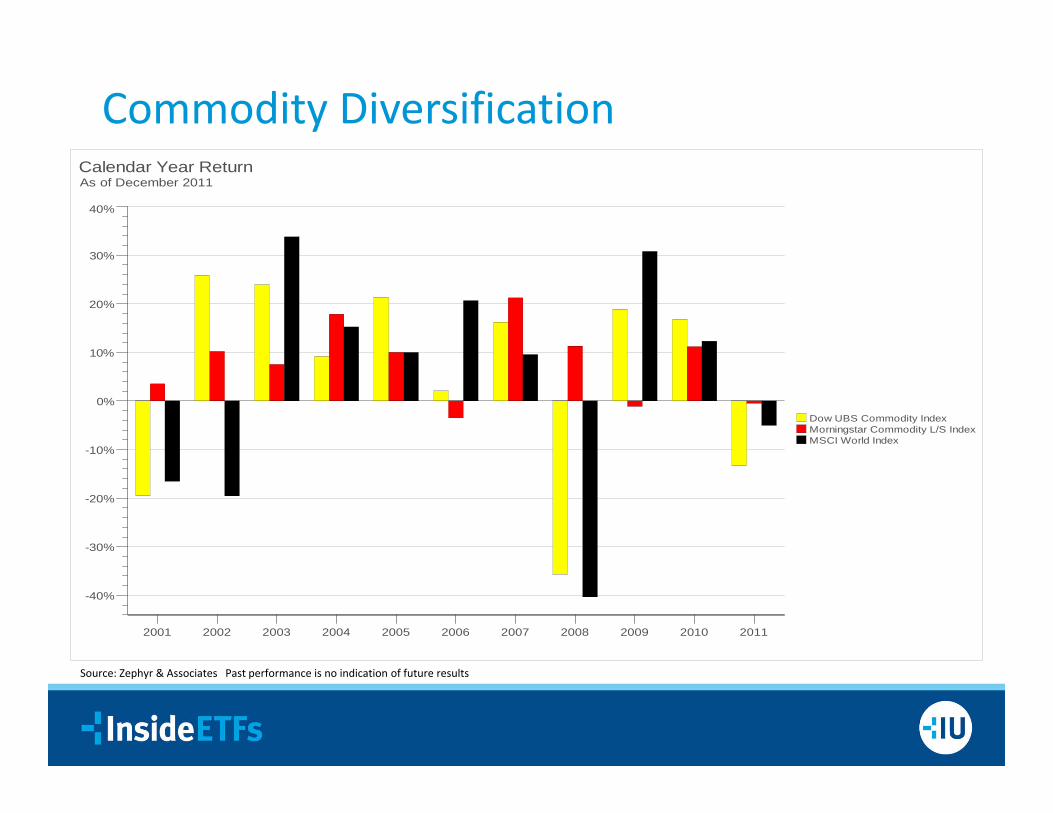
Calendar Year ReturnAs of December 2011
Dow UBS Commodity IndexMorningstar Commodity L/S IndexMSCI World Index
-40%
-30%
-20%
-10%
0%
10%
20%
30%
40%
2001 2002 2003 2004 2005 2006 2007 2008 2009 2010 2011
Commodity Diversification
Source: Zephyr & Associates Past performance is no indication of future results
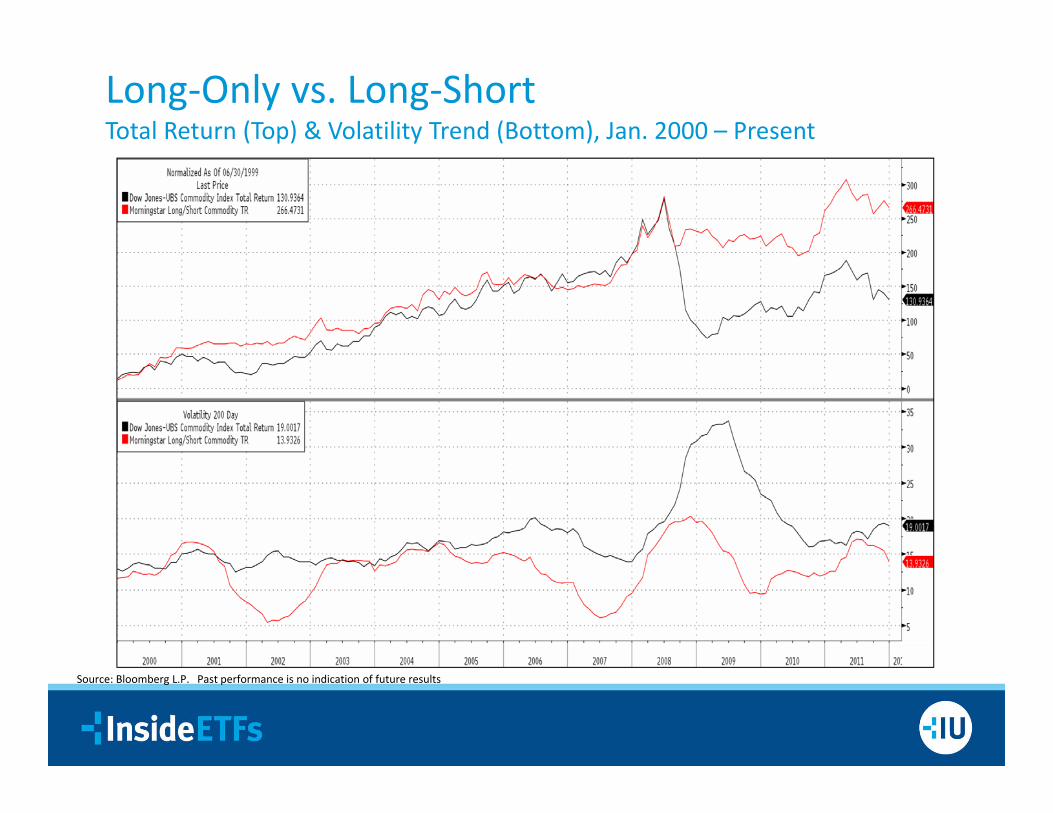
Long‐Only vs. Long‐ShortTotal Return (Top) & Volatility Trend (Bottom), Jan. 2000 – Present
Source: Bloomberg L.P. Past performance is no indication of future results