Understanding and Interpreting Confidence...
25
Statistics: Unlocking the Power of Data Lock 5 Section 3.2 Understanding and Interpreting Confidence Intervals
Transcript of Understanding and Interpreting Confidence...

Statistics: Unlocking the Power of Data Lock5
Section 3.2
Understanding and Interpreting
Confidence Intervals

Statistics: Unlocking the Power of Data Lock5
Outline Interval estimate
Interval estimate based on margin of error
Confidence interval
95% confidence interval using the SE
Understanding confidence intervals
Common misinterpretations

Statistics: Unlocking the Power of Data Lock5
Employer-Based Health Insurance A report from a Gallup poll in 2011 based on a
random sample of n = 147,291 adults says
“Forty-five percent of American adults reported getting their health insurance from an employer…”
How accurate is 45%???
http://www.gallup.com/poll/148079/Employer-Based-Health-Insurance-Declines-Further.aspx
Statistics: Unlocking the Power of Data Lock5
Interval Estimate
An interval estimate gives a range of plausible values for a population
parameter.
Statistics: Unlocking the Power of Data Lock5
Margin of Error
One common form for an interval estimate is
statistic ± margin of error
where the margin of error reflects the precision of the sample statistic as a point
estimate for the parameter.

Statistics: Unlocking the Power of Data Lock5
Employer-Based Health Insurance “Forty-five percent of American adults reported getting their health insurance from an employer…”
Later in the report, it says “the maximum margin of sampling error is ±1 percentage point”
Interval estimate: 45% ± 1% = (44%, 46%)
The percentage of American adults getting their health insurance from an employer is probably between 44% and 46%

Statistics: Unlocking the Power of Data Lock5
Text Messages
• A 2011 random sample of n = 755 US cell phone users aged 18+ found that the average number of text messages sent or received per day is 41.5 messages, with a margin of error of 12.2.
• Give an interval estimate for the average number of text messages sent or received per day for US adult cell phone users. 41.5 ± 12.2
= (29.3, 53.7) Smith, A. “Americans and Text Messaging,” Pew Research Center, http://www.pewinternet.org/Reports/2011/Cell-Phone-Texting-2011/Main-Report/How-Americans-Use-Text-Messaging.aspx , accessed 9/19/11.

Statistics: Unlocking the Power of Data Lock5
Election Polling
http://www.realclearpolitics.com/epolls/2012/president/us/general_election_romney_vs_obama-1171.html
Why is the margin of error smaller for the Gallup poll than the ABC news poll?
http://www.realclearpolitics.com/epolls/2012/president/us/general_election_romney_vs_obama-1171.html

Statistics: Unlocking the Power of Data Lock5
Election Polling Using the Gallup poll, calculate an interval
estimate for the proportion of registered voters who planned to vote for Obama.
Statistics: Unlocking the Power of Data Lock5
Election Polling The 2012 presidential election already
happened, so this is one of the rare situations in which we actually know the true population parameter, p!
In the actual election, 50.4% voted for Obama.
Did your interval estimate contain the true population parameter?
Statistics: Unlocking the Power of Data Lock5
Margin of Error • How do we determine the margin of error???
• We can use the spread of the sampling distribution (the standard error) to determine the margin of error for a statistic
Statistics: Unlocking the Power of Data Lock5
Confidence Interval
A confidence interval for a parameter is an interval computed from sample data by a
method that will capture the parameter for a specified proportion of all samples
The success rate (proportion of all samples whose intervals contain the parameter) is known as the confidence level
A 95% confidence interval will contain the true parameter for 95% of all samples
Statistics: Unlocking the Power of Data Lock5
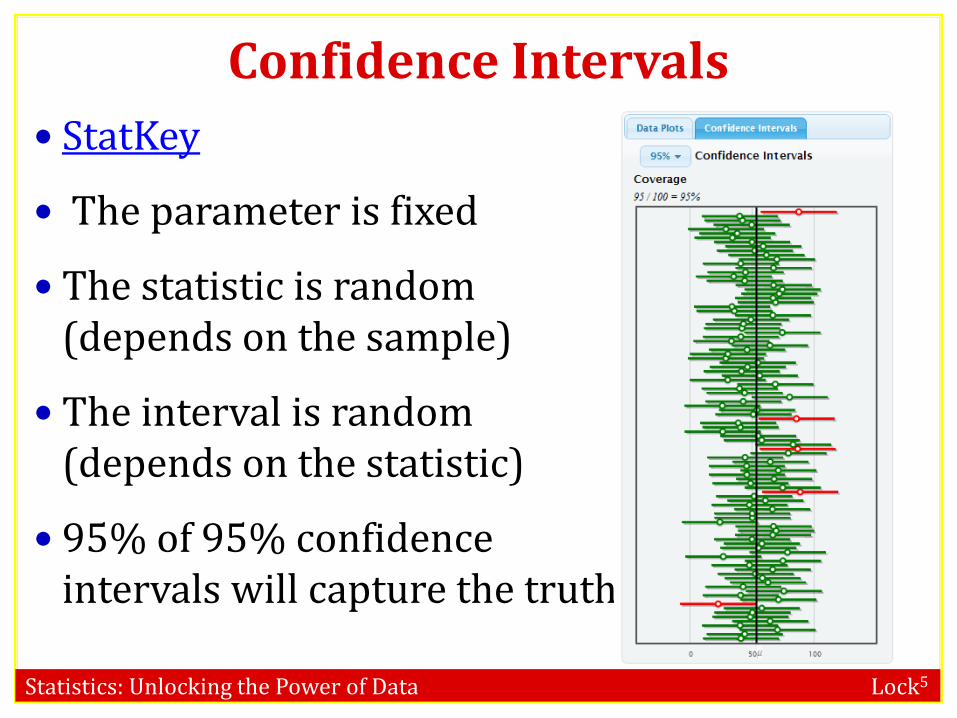
Confidence Intervals StatKey
The parameter is fixed
The statistic is random (depends on the sample)
The interval is random (depends on the statistic)
95% of 95% confidence intervals will capture the truth

Statistics: Unlocking the Power of Data Lock5
If you had access to the sampling distribution, how would you find the margin of error to ensure that intervals of the form
statistic ± margin of error would capture the parameter for 95% of all samples? (Hint: remember the 95% rule from Chapter 2)
Sampling Distribution

Statistics: Unlocking the Power of Data Lock5
95% Confidence Interval
If the sampling distribution is relatively symmetric and bell-shaped, a 95%
confidence interval can be estimated using
statistic ± 2 × SE

Statistics: Unlocking the Power of Data Lock5
Economy A survey of 1,502 Americans in January 2012 found that 86% consider the economy a “top priority” for the president and congress. The standard error for this statistic is 0.01. What is the 95% confidence interval for the true proportion of all Americans that considered the economy a “top priority” at that time?
http://www.people-press.org/2012/01/23/public-priorities-deficit-rising-terrorism-slipping/
statistic ± 2×SE 0.86 ± 2×0.01 0.86 ± 0.02 (0.84, 0.88)
Statistics: Unlocking the Power of Data Lock5
Interpreting a Confidence Interval 95% of all samples yield intervals that contain
the true parameter, so we say we are “95% sure” or “95% confident” that one interval contains the truth.
“We are 95% confident that the true proportion of all Americans that considered the economy a ‘top priority’ in January 2012 is between 0.84 and 0.88”
Statistics: Unlocking the Power of Data Lock5
Carbon in Forest Biomass Scientists hoping to curb deforestation estimate
that the carbon stored in tropical forests in Latin America, sub-Saharan Africa, and southeast Asia has a total biomass of 247 gigatons.
To arrive at this estimate, they first estimate the mean amount of carbon per square kilometer.
Based on a sample of size n = 4079 inventory plots, the sample mean is �̅�𝑥 = 11,600 tons with a standard error of 1000 tons.
Give and interpret a 95% confidence interval. Saatchi, S.S. et. al. “Benchmark Map of Forest Carbon Stocks in Tropical Regions Across Three Continents,” Proceedings of the National Academy of Sciences, 5/31/11.

Statistics: Unlocking the Power of Data Lock5
Carbon in Forest Biomass
95% CI: 11,600 ± 2⋅1000 = (9,600, 13,600)
We are 95% confident that the average amount of carbon stored in each square kilometer of tropical forest is between 9,600 and 13,600 tons.

Statistics: Unlocking the Power of Data Lock5
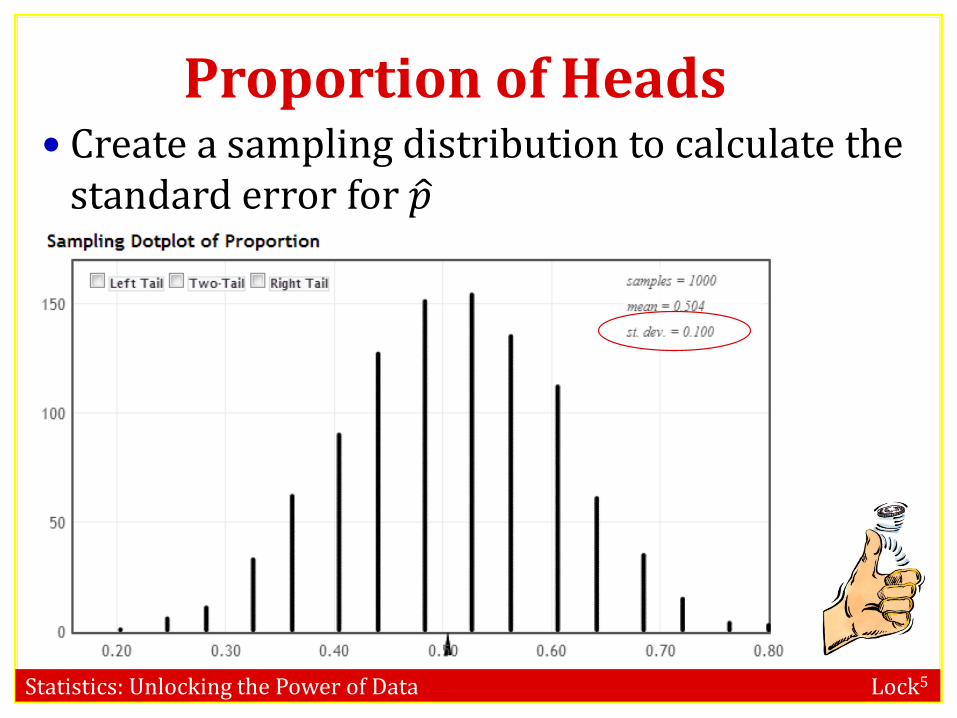
Proportion of Heads p = Proportion of time a coin lands heads
We know p = 0.5, but let’s pretend that we don’t know that, and want to estimate it
Flip a coin 25 times, and compute your sample proportion, 𝑝𝑝�
Statistics: Unlocking the Power of Data Lock5
Proportion of Heads Create a sampling distribution to calculate the
standard error for 𝑝𝑝�

Statistics: Unlocking the Power of Data Lock5
Common Misinterpretations
• Misinterpretation 1: “A 95% confidence interval contains 95% of the data in the population”
• Misinterpretation 2: “I am 95% sure that the mean of a sample will fall within a 95% confidence interval for the mean”
• Misinterpretation 3: “The probability that the population parameter is in this particular 95% confidence interval is 0.95”

Statistics: Unlocking the Power of Data Lock5
Confidence Intervals
Population Sample
Sample
Sample
Sample Sample Sample
. . .
Calculate statistic for each sample
Sampling Distribution
Standard Error (SE): standard deviation of sampling distribution
Margin of Error (ME) (95% CI: ME = 2×SE)
statistic ± ME

Statistics: Unlocking the Power of Data Lock5
Summary • To create a 95% confidence interval for a
parameter: o Take many random samples from the population,
and compute the sample statistic for each sample o Compute the standard error as the standard
deviation of all these statistics o Use statistic ± 2×SE
• One small problem…
Statistics: Unlocking the Power of Data Lock5
Reality
… WE ONLY HAVE ONE SAMPLE!!!!
• How do we know how much sample statistics vary, if we only have one sample?!?
… to be continued


![Problem with Locks - Old Dominion Universitywebspace.cs.odu.edu/.../lock/lock3.pdfMicrosoft PowerPoint - lock3.ppt [Compatibility Mode] Author ibl Created Date 8/6/2015 7:49:02 PM](https://static.fdocuments.net/doc/165x107/5adac2777f8b9afc0f8cea20/problem-with-locks-old-dominion-powerpoint-lock3ppt-compatibility-mode-author.jpg)