Understanding the genetic basis of phenotype variability ...

Understanding and Accounting for Method Variability in Whole Effluent Toxicity Applications
Under the National Pollutant Discharge Elimination System Program
June 30 2000
Understanding and Accounting for Method Variability in WET Applications Under the NPDES Program
This page intentionally left blank
June 30 2000 ii
NOTICE AND DISCLAIMER
This document provides guidance to NPDES regulatory authorities and persons interested in whole effluent toxicity testing This document describes what EPA believes to be sources of variability in the conduct of whole effluent toxicity testing under the Clean Water Act The document is designed to reflect national policy on these issues The document does not however substitute for the Clean Water Act an NPDES permit or EPA or State regulations applicable to permits or whole effluent toxicity testing nor is this document a permit or a regulation itself The document does not and cannot impose any legally binding requirements on EPA States NPDES permittees andor laboratories conducting whole effluent toxicity testing for permittees (or for States in the evaluation of ambient water quality) EPA and State officials retain discretion to adopt approaches on a case-by-case basis that differ from this guidance based on an analysis of site-specific circumstances This guidance may be revised without public notice to reflect changes in EPA policy
June 30 2000 iii
Understanding and Accounting for Method Variability in WET Applications Under the NPDES Program
This page intentionally left blank
June 30 2000 iv
TABLE OF CONTENTS
Acknowledgments ix Executive Summary xi List of Acronyms and Abbreviations xv Glossary xvii 10 INTRODUCTION 1-1
11 Background 1-1 12 Effect of This Guidance 1-2 13 Three Goals of This Document 1-2
20 DEFINITION AND MEASUREMENT OF METHOD VARIABILITY IN WET TESTING 2-1 21 Terms and Definitions 2-1 22 Defining WET Test Variability 2-1 23 Quantifying WET Test Variability 2-2
30 VARIABILITY OF WET TEST METHODS 3-1 31 Acquisition Selection and Quality Assurance of Data Presented in this Document 3-1 32 Variability of EC25 LC50 and NOEC 3-2
321 Within-Laboratory Variability of EC25 LC50 and NOEC 3-2 322 Between-Laboratory Variability of EC25 LC50 and NOEC 3-7
33 Variability of Endpoint Measurements 3-8 34 Conclusions about Variability of WET Methods 3-10
341 Variability of EC25 LC50 NOEC 3-10 342 Variability of Endpoint Measurements 3-11
40 VARIABILITY IN CONTEXT 4-1 41 Society of Environmental Toxicology and Chemistry Pellston WET Workshop 4-1
411 General Conclusions and Recommendations 4-1 412 Conclusions about Data Precision 4-2
42 Water Environment Research Foundation Study 4-3 43 Minimizing Variability by Adhering to WET Methods 4-3 44 Conclusion 4-4
50 GUIDANCE TO REGULATORY AUTHORITIES LABORATORIES AND PERMITTEES GENERATING AND EVALUATING EFFECT CONCENTRATIONS 5-1 51 Steps for Minimizing Test Method Variability 5-1 52 Collecting Representative Effluent Samples 5-1 53 Conducting the Biological Test Methods 5-2
531 Quality Control Procedures 5-3 532 Experimental Design 5-5 533 Test Power to Detect Toxic Effects 5-7
54 Test Acceptability Criteria 5-9 55 Conducting the Statistical Analysis To Determine the Effect Concentration 5-10 56 Chapter Conclusions 5-11
June 30 2000 v
Understanding and Accounting for Method Variability in WET Applications Under the NPDES Program
TABLE OF CONTENTS (continued)
60 GUIDANCE TO REGULATORY AUTHORITIES DETERMINING REASONABLE POTENTIAL AND DERIVING WET PERMIT CONDITIONS 6-1 61 Analytical and Sampling Variability in Calculations for Reasonable
Potential and Permit Limits 6-1 611 ldquoAdjusting for Analytical Variabilityrdquo in Calculations
for Reasonable Potential and Permit Limits 6-1 612 Analytical Variability and Self-monitoring Data 6-2 613 Precision of WET Measurements and Estimates of Effluent CV 6-2 614 Between-Laboratory Variability 6-3
62 Determining Reasonable Potential and Establishing Effluent Limits 6-4 63 Development of a Total Maximum Daily Load for WET 6-5 64 Accounting for and Minimizing Variability in the Regulatory Decision Process 6-5
641 Recommended Additional TACs Lower and Upper Bounds for PMSD 6-5
642 How To Determine the NOEC Using the Lower PMSD Bound 6-8 643 Justification for Implementing the Test Sensitivity Bounds 6-8 644 Guidance to Testing Laboratories on How to Achieve
the Range of Performance for PMSD 6-9 65 Additional Guidance That Regulatory Authorities Should Implement
to Further Support the WET Program 6-9 66 Chapter Conclusions 6-10
70 CONCLUSIONS AND GUIDANCE TO LABORATORIES PERMITTEES and REGULATORY AUTHORITIES 7-1 71 General Conclusions 7-1 72 Recommendations for Minimizing Variability and Its Effects 7-2
721 Guidance to Toxicity Testing Laboratories 7-3 722 Guidance to NPDES Permittees 7-3
73 Guidance to Regulatory Authorities 7-4 74 Future Directions 7-5
80 BIBLIOGRAPHY 8-1
Appendix A Interim Coefficients of Variation Observed Within Laboratories for Reference Toxicant Samples Analyzed Using EPArsquos Promulgated Whole Effluent Toxicity Methods
Appendix B Supplementary Information for Reference Toxicity Data
Appendix C Sample Calculation of Permit Limits Using EPArsquos Statistically-Based Methodology and Sample Permit Language
Appendix D Frequently Asked Questions (FAQs)
Appendix E Examples of Selected State WET Implementation Programs
Appendix F Improvements in Minimizing WET Test Variability by the State of North Carolina
Appendix G Analytical Variability in Reasonable Potential and Permit Limit Calculations
June 30 2000 vi
Understanding and Accounting for Method Variability in WET Applications Under the NPDES Program
List of Tables
3-1 Promulgated WET Methods Included in This Report 3-3 3-2 Quartiles (25th and 75th) and Median (50th) of the Within-Laboratory Values of
CV for EC25 (Chronic Tests) 3-4 3-3 Quartiles (25th and 75th) and Median (50th) of the Within-Laboratory Values of
CV for LC50 3-4 3-4 Quartiles (25th and 75th) and Median (50th) of the Within-Laboratory Values of
CV for NOEC 3-5 3-5 Estimates of Within-Laboratory and Between-Laboratory Components of Variability 3-7 3-6 Range of Relative Variability for Endpoints of Promulgated WET Methods Defined by
the 10th and 90th Percentiles from the Data Set of Reference Toxicant Tests 3-9 3-7 Number of Laboratories Having a Given Percent of Tests Exceeding the PMSD
Upper Bound for the Sublethal Endpoint 3-10 5-1 Tests for Chronic Toxicity Power and Ability To Detect a Toxic Effect
on the Sublethal Endpoint 5-8 5-2 Power to Detect a 25-Percent Difference from the Control at the 90th Percentile PMSD 5-8 6-1 Example of Applying the Lower Bound PMSD for the Chronic Ceriodaphnia Test
with the Reproduction Endpoint 6-8
List of Figures
5-1 Steps to minimize WET test method variability 5-2 6-1 Paradigm that incorporates the lower and upper percent minimum significant difference 6-6 6-2 Implementing applications of upper and lower PMSD bounds
for effluent testing requirements 6-7
June 30 2000 vii
Understanding and Accounting for Method Variability in WET Applications Under the NPDES Program
This page intentionally left blank
June 30 2000 viii
ACKNOWLEDGEMENTS
This guidance was prepared through the cooperative efforts of the US Environshymental Protection Agencyrsquos (EPA) Office
of Wastewater Management and Office of Science and Technology in the Office of Water EPArsquos Office of Research and Development and EPArsquos Office of Enforcement and Compliance Assurance The Cadmus Group Inc provided support for the final document production
EPA Variability Workgroup
Debra Denton EPA Region 9 San Francisco CA John Fox EPA Office of Science and Technology
Washington DC Florence Fulk EPA Office of Research and
Development Cincinnati OH Kathryn Greenwald EPA Office of Enforcement
and Compliance Assurance Washington DC Madonna Narvaez EPA Region 10 Seattle WA Teresa Norberg-King EPA Office of Research and
Development Duluth MN Laura Phillips EPA Office of Wastewater
Management Washington DC
EPA Support Outside of the Variability Workgroup
Gregory Currey EPA Office of Wastewater Management Washington DC
Margarete Heber EPA Office of Wetlands Oceans and Watersheds Washington DC
Phillip Jennings EPA Region 6 Dallas TX Henry Kahn EPA Office of Science and
Technology Washington DC Marion Kelly EPA Office of Science and
Technology Washington DC James Pendergast EPA Office of Wetlands
Oceans and Watersheds Washington DC Stephen Sweeney EPA Office of General
Counsel Washington DC William Telliard EPA Office of Science and
Technology Washington DC Robert Wood EPA Office of Wastewater
Management Washington DC Marcus Zobrist EPA Region 2 New York NY
Contractor Support
The Cadmus Group Inc Durham NC
Karalyn Colopy Susan Conbere Blanche Dean Penelope Kellar
DynCorp Information and Enterprise Technology Inc Alexandria VA
Robert Brent
Science Applications International Corporation Columbia MD
Sidina Dedah Ruth Much Kathleen Stralka
Assistance from States
State Case Example and Chapter 4
EPA especially thanks Larry Ausley and Matt Matthews of the North Carolina Department of Environment and Natural Resources Division of Water Quality for preparing Chapter 4 (Variability in Context) and Appendix F (Improvements in Minimizing WET Test Variability by the State of North Carolina)
State-Specific WET Program Implementation
EPA appreciates the assistance and support from the following States in providing their State-specific approaches to the WET program implementation used for Appendix E (Examples of Selected State WET Implementation Programs) of this document
Betty Jane Boros-Russo State of New Jersey Kari Fleming State of Wisconsin Randall Marshall State of Washington Matt Matthews State of North Carolina Charlie Roth State of Kentucky
Additional Assistance
We also thank the EPA Regions States and laboratories that provided the WET toxicity data used to develop this guidance document
EPA Peer Review
Peer review was conducted following the EPArsquos Science Policy Council Handbook for Peer Review (January 1998) The anonymous review comments are gratefully acknowledged and the changes were incorporated as appropriate
June 30 2000 ix
Understanding and Accounting for Method Variability in WET Applications Under the NPDES Program
This page intentionally left blank
June 30 2000 x
EXECUTIVE SUMMARY
Background
The Federal Water Pollution Control Act commonly known as the Clean Water Act was enacted in 1972 with the objective of ldquorestoring the chemical physical and biological integrity of the Nationrsquos watersrdquo Among the US Environmental Protection Agencyrsquos (EPArsquos) efforts toward this objective is the National Pollutant Discharge Elimination System (NPDES) program This program is designed to control toxic discharges implement water quality standards and restore waters to ldquofishable and swimmablerdquo conditions Point sources that discharge pollutants must do so under the terms and conditions of an NPDES permit One approach EPA employs to control toxic pollutants under the NPDES permits program is using whole effluent toxicity (WET) controls
EPA is issuing this document to both address questions raised on WET test method variability and to satisfy a requirement of a July 1998 settlement agreement with litigants for the Western Coalition of Arid States (WestCAS) and Edison Electric Institute et al This document was developed by an EPA workgroup consisting of EPArsquos Office of Waterrsquos (OW) Headquarters Office of Enforcement and Compliance Assurance Office of Research and Development and Regional staff The document was externally peer reviewed in accordance with EPArsquos peer review guidelines The document addresses WET test method variability by identifying the potential sources of variance associated with WET testing discusses how to minimize it and finally describes how to address it within the NPDES permitting program The document cites both Agency and external ongoing research on this topic and scientific findings particularly technical information that support efforts to minimize WET test result variability
While the document provides recommendations on how to reduce or minimize WET test variability the document does not supersede current Agency guidance policy or regulation including EPArsquos promulgated test methods (40 CFR Part 136) which remain in effect EPA expects that implementation of the NPDES program and NPDES permits will continue to comply with regulatory requirements and follow applicable EPA guidance and policy
Why WET Testing
Whole effluent toxicity is the aggregate toxic effect of an aqueous sample (eg effluent receiving water) measured directly by an aquatic toxicity test Aquatic toxicity tests are laboratory experiments that measure the biological effect (eg growth survival and reproduction) of effluents or receiving waters on aquatic organisms In aquatic toxicity tests organisms of a particular species are held in test chambers and exposed to different concentrations of an aqueous sample for example a reference toxicant an effluent or a receiving water and observations are made at predetermined exposure periods At the end of the test the responses of test organisms are used to estimate the effects of the toxicant or effluent
Whole effluent toxicity test results are an integral tool in the assessment of water quality For the protection of aquatic life the integrated strategy includes the use of three control approaches the chemical-specific control approach the WET control approach and the biological criteriabioassessmentbioassay approach The primary advantage of using WET controls over individual chemical-specific controls is that WET integrates the effects of all chemical(s) in the aqueous sample Reliance solely on chemical-specific numeric criteria or biological criteria would result in only a partially effective State toxics control program These toxicity tests therefore must be performed using best laboratory practices and every effort must be made to enhance repeatability of the test method This document presents EPArsquos approaches to achieve the goals listed below
June 30 2000 xi
Understanding and Accounting for Method Variability in WET Applications Under the NPDES Program
Effect of This Guidance
This document clarifies several issues regarding WET variability and reaffirms EPArsquos guidance in the Technical Support Document for Water Quality-Based Toxics Control (TSD USEPA 1991a) This document provides NPDES regulatory authorities and all stakeholders including permittees with guidance and recommendations on how to address WET variability EPArsquos recommendations and conclusions are detailed in Chapter 7 and Appendix C provides sample NPDES permit language reflecting these recommendations
The most significant recommendation is to use and report the values for the percent minimum significant difference (PMSD) with all WET data results The minimum significant difference (MSD) represents the smallest difference between the control mean and a treatment mean that leads to the statistical rejection of the null hypothesis (ie no toxicity) at each concentration of the WET test dilution series The MSD provides an indication of within-test variability and test method sensitivity Using this information the regulatory authority and permittees can better evaluate WET test results
This document makes several other recommendations such as continue to use the TSD statistical approach without adjusting for test method variability obtain sufficient representative effluent samples verify effluent toxicity data against reference toxicant data maintain clear communication between the regulatory authority and permittee and maintain good laboratory checks and certification programs
Three Goals of This Document
This document describes three goals EPA has defined to address issues surrounding WET variability In addition the document is intended to satisfy the requirements of a settlement agreement to resolve litigation over rulemaking to standardize WET testing procedures
1 Quantify the variability of promulgated test methods and report a coefficient of variation (CV) as a measure of test method variability (see Chapter 3 and Appendix A)
2 Evaluate the statistical methods described in the Technical Support Document for Water Quality-Based Toxics Control (TSD) for determining the need for and deriving WET permit conditions (see Chapter 6 and Appendix G)
3 Suggest guidance for regulatory authorities on approaches to address and minimize test method variability (Chapter 6) In addition the document is intended to provide guidance to regulatory authorities permittees and testing laboratories on conducting the biological and statistical methods and evaluating test effect concentrations (Chapter 5)
Data Evaluated
EPA assembled a comprehensive data base to examine variability in the WET test methods from the EPA Regions several States and private laboratories which represent a widespread sampling of typical laboratories and laboratory practices EPA applied several criteria to the data before they were accepted including detailed sample information strict adherence to published EPA WET test methods and test acceptability criteria (TAC) The resulting data base contains data from 75 laboratories for 23 methods for tests concluded between 1988 and 1999
Approach Taken To Evaluate Test Method Variability
The variability that EPA is assessing is associated with replicate tests using reference toxicants and WET testing methods within analytical laboratories The focus of this guidance is not to quantify test variability between laboratories or to quantify the total variability of WET tests conducted on effluents Rather the purpose is to quantify method variability within laboratories (repeatability) to enable NPDES
June 30 2000 xii
Understanding and Accounting for Method Variability in WET Applications Under the NPDES Program
programs to distinguish between variability caused by the testing method and variability associated with toxicity of multiple effluent samples taken from the same facility
To quantify test method variability within and between laboratories using this data base EPA examined two key parameters (1) the effect concentrations [effect concentration (EC25) lethal concentration (LC50) no observed effect concentration (NOEC)] estimated by the test which are used to derive WET permit limits and evaluate self-monitoring data with those limits and (2) the minimum significant difference (MSD) which summarizes the variability of organism responses at each test concentration within an individual test The MSD represents the smallest difference that can be distinguished between the response of the control organisms and the response of the organisms exposed to the aqueous sample The MSD provides an indication of within-test variability and test method sensitivity
Principal Conclusions
The principal conclusions of this document follow
Evaluation of Test Method Variability
bull Comparisons of WET method precision with method precision for analytes commonly limited in NPDES permits clearly demonstrate that the variability of the promulgated WET methods is within the range of variability experienced in other types of analyses Several independent researchers and studies also have concluded that method performance improves when prescribed methods are followed closely by experienced analysts (Section 43)
bull This document provides interim CVs for promulgated WET methods in Appendix A Tables A-1 (acute methods) and A-2 (chronic methods) pending completion of between-laboratory studies which may affect these interim CV estimates
Evaluation of Approach To Incorporate Test Method Variability
bull EPArsquos TSD presents guidance for developing effluent limits that appropriately protect water quality regarding both effluent variability and analytical variability provided that the WET criteria and waste load allocation (WLA) are derived correctly (Section 6 and Appendix G)
bull EPArsquos analysis of data gathered in the development of this document indicates that the TSD approach appropriately accounts for both effluent variability and method variability EPA does not believe a reasonable alternative approach is available to determine a factor that would discount the effects of method variability using the TSD procedures because the approach would not ensure adequate protection of water quality (Section 611 and Appendix G)
Development of Guidance to Regulatory Authorities
bull EPA recommends that regulatory authorities implement the statistical approach as described in the TSD to evaluate effluent for reasonable potential and to derive WET limits or monitoring triggers (Section 61 and Appendix G)
bull EPA recommends that regulatory authorities calculate the facility-specific CVs using point estimate techniques to determine the need for and derive a permit limit for WET even if self-monitoring data are to be determined using hypothesis testing techniques for example to determine a ldquono effectrdquo concentration (ldquoNOECrdquo) This document describes such facility-specific calculations (Section 341 and 62)
June 30 2000 xiii
Understanding and Accounting for Method Variability in WET Applications Under the NPDES Program
Additional Recommendations and Guidance
This document also provides recommendations and guidance on minimizing variability in three specific areas in order to generate sound WET test results (1) obtaining a representative effluent sample (2) conducting the toxicity tests properly to generate the biological endpoints and (3) conducting the appropriate statistical analysis to obtain defensible effect concentrations (EC25 LC50 NOEC) If these recommendations are addressed the reliability of the test endpoint values should improve
bull Regulatory Authorities Design a sampling program that collects representative effluent samples to fully characterize effluent variability for a specific facility over time (Sections 613 and 62)
bull Regulatory Authorities Ensure proper application of WET statistical procedures and test methods (Sections 52 through 55)
bull Regulatory Authorities Incorporate both the upper and lower bounds using the percent minimum significant difference (PMSD) to control and to minimize within-test method variability and increase test sensitivity To achieve the PMSD upper bound either the replication should increase or within-test method variability should decrease or both (Section 64 and Table 3-6)
bull Testing Laboratories Encourage WET testing laboratories to maintain control charts for PMSD and the control mean and report the PMSD with all WET test results (Section 5311)
bull Regulatory Authorities Participate in the National Environment Laboratory Accreditation Program and routine performance audit inspections to evaluate laboratory performance (Section 5311)
bull Regulatory Authorities Incorporate EPArsquos guidance on error rate assumption adjustments concentration-response relationships confidence intervals acceptable dilution waters how to block by parentage for the chronic Ceriodaphnia dubia test and control of pH drift (USEPA 2000a)
June 30 2000 xiv
LIST OF ACRONYMS AND ABBREVIATIONS1
ACR acute-to-chronic ratio
AML average monthly limit
ANOVA analysis of variance
APHA-AWWA- American Public Health Association-American Water Works Association-Water WEF Environment Federation
ASTM American Society for Testing and Materials
BSAB Biomonitoring Science Advisory Board
CCC criteria continuous concentration
CFR Code of Federal Regulations
CMC criteria maximum concentration
CV coefficient of variation
CWA Clean Water Act
DMR discharge monitoring report
EMS error mean square [also referred to as mean square error (MSE)]
EPA US Environmental Protection Agency (also the Agency)
FR Federal Register
IC inhibition concentration
IWC instream waste concentration (sometimes referred to as receiving water concentration)
LC50 lethal concentration 50 percent
LOEC lowest observed effect concentration
LTA long-term average (LTAa = acute LTA LTAc = chronic LTA LTAac = acute-to-chronic LTA)
MDL maximum daily limit
MSD minimum significant difference
MSE mean square error [also referred to as error mean square (EMS)]
MZ mixing zone
NELAP National Environment Laboratory Accreditation Program
NOEC no observed effect concentration
NPDES National Pollutant Discharge Elimination System
NTRD National Toxicant Reference Database
PAI Performance Audit Inspections
PMSD percent minimum significant difference
Note These acronyms and abbreviations may have other meanings in other EPA programs or documents
June 30 2000
1
xv
Understanding and Accounting for Method Variability in WET Applications Under the NPDES Program
QA quality assurance
QC quality control
rMSE square root of the mean square error
RP reasonable potential
RWC receiving water concentration (sometimes referred to as instream waste concentration)
SCTAG Southern California Toxicity Assessment Group
SETAC Society of Environmental Toxicology and Chemistry
TAC test acceptability criteria
TIE toxicity identification evaluation
TMDL total maximum daily load
TRE toxicity reduction evaluation
TSD EPArsquos Technical Support Document for Water Quality-based Toxics Control (March 1991 EPA5052-90-001)
TU toxic unit (TUa = acute toxicity TUc = chronic toxicity)
VF variability factor
WET whole effluent toxicity
WLA waste load allocation
WQBEL water quality based effluent limit
June 30 2000 xvi
GLOSSARY
Acute Toxicity Test is a test to determine the concentration of effluent or ambient waters that causes an adverse effect (usually death) on a group of test organisms during a short-term exposure (eg 24 48 or 96 hours) Acute toxicity is measured using statistical procedures (eg point estimate techniques or a t-test)
Acute-to-Chronic Ratio (ACR) is the ratio of the acute toxicity of an effluent or a toxicant to its chronic toxicity It is used as a factor for estimating chronic toxicity on the basis of acute toxicity data or for estimating acute toxicity on the basis of chronic toxicity data
Ambient Toxicity is measured by a toxicity test on a sample collected from a receiving waterbody
ANOVA is analysis of variance
Average Monthly Limit (AML) is the calculated average monthly limit of waste load allocation assigned by a State or EPA for a particular facility
CCC are water quality criteria for chronic exposure (criteria continuous concentrations)
Chronic Toxicity Test is a short-term test in which sublethal effects (eg reduced growth or reproduction) are usually measured in addition to lethality Chronic toxicity is defined as TUc = 100NOEC or TUc = 100ECp or ICp
CMC are water quality criteria for acute exposures (criteria maximum concentration)
Coefficient of Variation (CV) is a standard statistical measure of the relative variation of a distribution or set of data defined as the standard deviation divided by the mean It is also called the relative standard deviation (RSD) The CV can be used as a measure of precision within (within-laboratory) and between (between-laboratory) laboratories or among replicates for each treatment concentration
Confidence Interval is the numerical interval constructed around a point estimate of a population parameter
Effect Concentration (EC) is a point estimate of the toxicant concentration that would cause an observable adverse effect (eg death immobilization or serious incapacitation) in a given percent of the test organisms calculated from a continuous model (eg Probit Model) EC25 is a point estimate of the toxicant concentration that would cause an observable adverse effect in 25 percent of the test organisms
Hypothesis Testing is a statistical technique (eg Dunnettrsquos test) for determining whether a tested concentration is statistically different from the control Endpoints determined from hypothesis testing are NOEC and LOEC The two hypotheses commonly tested in WET are
Null hypothesis (Ho) The effluent is not toxic Alternative hypothesis (Ha) The effluent is toxic
Inhibition Concentration (IC) is a point estimate of the toxicant concentration that would cause a given percent reduction in a non-lethal biological measurement (eg reproduction or growth) calculated from a continuous model (ie Interpolation Method) IC25 is a point estimate of the toxicant concentration that would cause a 25-percent reduction in a non-lethal biological measurement
Instream Waste Concentration (IWC) is the concentration of a toxicant in the receiving water after mixing The IWC is the inverse of the dilution factor It is sometimes referred to as the receiving water concentration (RWC)
June 30 2000 xvii
Understanding and Accounting for Method Variability in WET Applications Under the NPDES Program
LC50 (lethal concentration 50 percent) is the toxicant or effluent concentration that would cause death in 50 percent of the test organisms
Lowest Observed Effect Concentration (LOEC) is the lowest concentration of an effluent or toxicant that results in adverse effects on the test organisms (ie where the values for the observed endpoints are statistically different from the control)
Long-term Averages (LTAs) of pollutant concentration or effluent toxicity are calculated from waste load allocations (WLAs) typically assuming that the WLA is a 99th percentile value (or another upper bound value) based on the lognormal distribution One LTA is calculated for each WLA (typically an acute LTA and a chronic LTA for aquatic life protection) The LTA represents expected long-term average performance from the permitted facility required to achieve the associated WLA
Maximum Daily Limit (MDL) is the calculated maximum WLA assigned by a State or EPA for a particular facility
Minimum Significant Difference (MSD) is the magnitude of difference from control where the null hypothesis is rejected in a statistical test comparing a treatment with a control MSD is based on the number of replicates control performance and power of the test
Mean Square Error (MSE) is the average dispersion of the items around the treatment means It is an estimate of a common variance the within variation or variation among observations treated alike [Also referred to as error mean square (EMS)]
Mixing Zone is an area where an effluent discharge undergoes initial dilution and is extended to cover the secondary mixing in the ambient waterbody A mixing zone is an allocated impact zone where water quality criteria can be exceeded as long as acutely toxic conditions are prevented
No Observed Effect Concentration (NOEC) is the highest tested concentration of an effluent or toxicant that causes no observable adverse effect on the test organisms (ie the highest concentration of toxicant at which the values for the observed responses are not statistically different from the controls)
National Pollutant Discharge Elimination System (NPDES) program regulates discharges to the nationrsquos waters Discharge permits issued under the NPDES program are required by EPA regulation to contain where necessary effluent limits based on water quality criteria for the protection of aquatic life and human health
Power is the probability of correctly detecting an actual toxic effect (ie declaring an effluent toxic when in fact it is toxic)
Precision is a measure of reproducibility within a data set Precision can be measured both within a laboratory (within-laboratory) and between laboratories (between-laboratory) using the same test method and toxicant
Quality Assurance (QA) is a practice in toxicity testing that addresses all activities affecting the quality of the final effluent toxicity data QA includes practices such as effluent sampling and handling source and condition of test organisms equipment condition test conditions instrument calibration replication use of reference toxicants recordkeeping and data evaluation
Quality Control (QC) is the set of more focused routine day-to-day activities carried out as part of the overall QA program
Reasonable Potential (RP) is where an effluent is projected or calculated to cause an excursion above a water quality standard based on a number of factors
xviii June 30 2000
Understanding and Accounting for Method Variability in WET Applications Under the NPDES Program
Reference Toxicant Test is a check of the sensitivity of the test organisms and the suitability of the test methodology Reference toxicant data are part of a routine QAQC program to evaluate the performance of laboratory personnel and the robustness and sensitivity of the test organisms
Significant Difference is defined as a statistically significant difference (eg 95 percent confidence level) in the means of two distributions of sampling results
Statistic is a computed or estimated quantity such as the mean standard deviation or coefficient of variation
Test Acceptability Criteria (TAC) are specific criteria for determining whether toxicity test results are acceptable The effluent and reference toxicant must meet specific criteria as defined in the test method (eg for the Ceriodaphnia dubia survival and reproduction test the criteria are as follows the test must achieve at least 80 percent survival and an average of 15 young per surviving female in the controls)
Total Maximum Daily Load (TMDL) is a determination of the amount of a pollutant or property of a pollutant from point nonpoint and natural background sources including a margin of safety that may be discharged to a water quality-limited waterbody
t-Test (formally Studentrsquos t-Test) is a statistical analysis comparing two sets of replicate observations in the case of WET only two test concentrations (eg a control and 100 percent effluent) The purpose of this test is to determine if the means of the two sets of observations are different [eg if the 100-percent effluent concentration differs from the control (ie the test passes or fails)]
Type I Error (alpha) is the rejection of the null hypothesis (Ho) when it is in fact true (ie determining that the effluent is toxic when the effluent is not toxic)
Type II Error (beta) is the acceptance of the null hypothesis (Ho) when it is not true (ie determining that the effluent is not toxic when the effluent is toxic)
Toxicity Test is a procedure to determine the toxicity of a chemical or an effluent using living organisms A toxicity test measures the degree of effect of a specific chemical or effluent on exposed test organisms
Toxic Unit-Acute (TUa) is the reciprocal of the effluent concentration (ie TUa = 100LC50) that causes 50 percent of the organisms to die by the end of an acute toxicity test
Toxic Unit-Chronic (TUc) is the reciprocal of the effluent concentration (eg TUc = 100NOEC) that causes no observable effect (NOEC) on the test organisms by the end of a chronic toxicity test
Toxic Unit (TU) is a measure of toxicity in an effluent as determined by the acute toxicity units (TUa) or chronic toxicity units (TUc) measured Higher TUs indicate greater toxicity
Toxicity Identification Evaluation (TIE) is a set of procedures used to identify the specific chemicals causing effluent toxicity
Toxicity Reduction Evaluation (TRE) is a site-specific study conducted in a step-wise process designed to identify the causative agents of effluent toxicity isolate the source of toxicity evaluate the effectiveness of toxicity control options and then confirm the reduction in effluent toxicity
Variance is a measure of the dispersion in a set of values defined as the sum of the squared deviations divided by their total number
Whole Effluent Toxicity (WET) is the total toxic effect of an effluent measured directly with a toxicity test
Waste Load Allocation (WLA) is the portion of a receiving waterrsquos total maximum daily load that is allocated to one of its existing or future point sources of pollution
June 30 2000 xix
Understanding and Accounting for Method Variability in WET Applications Under the NPDES Program
This page intentionally left blank
June 30 2000 xx
10 INTRODUCTION
11 Background
The Federal Water Pollution Control Act commonly known as the Clean Water Act (CWA) was enacted in 1972 with the objective of ldquorestoring the chemical physical and biological integrity of the Nationrsquos watersrdquo Several goals and policies were established in the Act including the following
bull Eliminating the discharge of pollutants into navigable waters by 1985
bull Wherever attainable achieving an interim goal of water quality that provides for the protection and propagation of fish shellfish and wildlife and provides for recreation in and on the water by November 1 1983 and
bull Prohibiting the discharge of toxic pollutants in toxic amounts
In the 28 years since the CWA was enacted the US Environmental Protection Agency (EPA) and States authorized to administer EPArsquos National Pollutant Discharge Elimination System (NPDES) permitting program have made significant progress toward achieving these goals NPDES is designed to control toxic discharges implement a water quality standards program and restore waters to ldquofishable and swimmablerdquo conditions A point source that discharges pollutants to waters of the United States must do so under the terms and conditions of an NPDES permit In setting these terms and conditions EPA and the States have integrated their control of toxic pollutants through combined use of three approaches [Technical Support Document for Water Quality-based Toxics Control (USEPA 1991a referred to as the TSD)]
bull Chemical-specific controls
bull Whole effluent toxicity (WET) controls and
bull Biological criteriabioassessments and bioassays
The WET approach to protection of water quality is the primary subject of this document
In 1989 EPA defined whole effluent toxicity as ldquothe aggregate toxic effect of an effluent measured directly by an aquatic toxicity testrdquo [54 Federal Register (FR) 23868 at 23895 June 2 1989] Aquatic toxicity tests are laboratory experiments that measure the biological effect (eg growth survival and reproduction) of effluents or receiving waters on aquatic organisms In aquatic toxicity tests groups of organisms of a particular species are held in test chambers and exposed to different concentrations of an aqueous test sample for example a reference toxicant an effluent or a receiving water Observations are made at predetermined exposure periods At the end of the test the responses of test organisms are used to estimate the effects of the toxicant or effluent
In the early 1980s EPA published methods (USEPA 1985 1988 1989) for estimating the short-term acute and chronic toxicity of effluents and receiving waters to freshwater and marine organisms WET data gathered in the 1980s indicated that approximately 40 percent of NPDES facilities nationwide discharged an effluent with sufficient toxicity to cause water quality problems Further reductions in the toxicity of wastewater discharges were necessary to achieve compliance with narrative water quality standards expressed as ldquono toxics in toxic amountsrdquo In response to these findings EPA implemented a policy to reduce or eliminate toxic discharges The Policy for the Development of Water Quality-based Permit Limitations for Toxic Pollutants (49 FR 9016 March 9 1984) introduced EPArsquos integrated toxics control program To support this policy EPA developed the TSD (USEPA 1991a) The TSD provides guidance to
June 30 2000 1-1
Understanding and Accounting for Method Variability in WET Applications Under the NPDES Program
regulators in implementing WET testing requirements in NPDES permits In 1989 EPA promulgated regulations specifying procedures for determining when water quality-based effluent limitations are required in NPDES permits [40 CFR 12244(d)] On October 26 1995 EPA promulgated WET test methods (USEPA 1993 1994a and 1994b) and added them to the list of EPA methods approved under Section 304(h) of the CWA (40 CFR 136) for use in the NPDES program Although the rulemaking was challenged in court that challenge has been stayed pending completion of a settlement agreement The rulemaking remains in force and effect unless and until EPA takes further action
12 Effect of This Guidance
This document attempts to clarify several issues regarding WET variability and reaffirms EPArsquos earlier guidance and recommendations published in the TSD (USEPA 1991a) This document is intended to provide NPDES regulatory authorities and all stakeholders including permittees with guidance and recommendations on how to understand and account for measurement variability in WET testing The documentrsquos recommendations and conclusions are detailed in Section 7 Appendix C provides sample NPDES permit language reflecting these recommendations
The most significant recommendation is to use and report the values for the percent minimum significant difference (PMSD) with all WET data results The minimum significant difference (MSD) is the smallest difference that can be distinguished between the response of control organisms and the response of test organisms at each concentration of the WET test dilution series The MSD provides an indication of the within-test variability and test method sensitivity Using this information the regulatory authority and permittees can better evaluate WET test results
This document also recommends the following
bull Continue to use the EPA TSD statistical approach for NPDES permit limit development (no test method variability adjustments are needed)
bull Collect and evaluate a sufficient number of representative effluent samples
bull Verify effluent toxicity data carefully along with reference toxicant data
bull Maintain good communication between the regulatory authority and permittee throughout all phases of the permitting process
bull Implement the PMSD to evaluate both WET and reference toxicant data to minimize within-test method variability and increase test sensitivity
bull Maintain laboratory checks with good laboratory certification programs to encourage experienced laboratories and skilled analysts for the toxicity testing program for individual WET laboratory performance
13 Three Goals of This Document
EPA prepared this document to achieve the following three goals
1 Quantify the variability of promulgated test methods and report a coefficient of variation (CV) as a measure of test method variability (see Chapter 3 and Appendix A)
June 30 2000 1-2
Understanding and Accounting for Method Variability in WET Applications Under the NPDES Program
2 Evaluate the statistical methods described in the Technical Support Document for Water Quality-Based Toxics Control (TSD) for determining the need for and deriving WET permit conditions (see Chapter 6 and Appendix G)
3 Suggest guidance for regulatory authorities on approaches to address and minimize test method variability (Chapter 6) In addition the document is intended to provide guidance to regulatory authorities permittees and testing laboratories on conducting the biological and statistical methods and evaluating test effect concentrations (Chapter 5)
This document does not address effluent variability It does however discuss how handling effluent samples can affect tests Chapter 2 provides definitions of terms used and discusses the ways in which variability can be quantified Chapter 3 describes the variability of the effect concentration estimates (EC25 LC50 and NOEC) and the variability of endpoint measurements (survival growth and reproduction) Chapter 4 discusses WET variability in the context of chemical-specific method variability Chapter 5 provides guidance to permittees testing laboratories and regulatory authorities to minimize test method variability Chapter 6 provides guidance to regulatory authorities on how to determine reasonable potential (RP) and derive permit limits or monitoring triggers and evaluate self-monitoring data Chapter 7 presents EPArsquos principal conclusions Chapter 8 is a bibliography containing a list of documents cited herein and additional reading material
June 30 2000 1-3
Understanding and Accounting for Method Variability in WET Applications Under the NPDES Program
This page intentionally left blank
June 30 2000 1-4
20 DEFINITION AND MEASUREMENT OF METHOD VARIABILITY IN WET TESTING
The terms used to express toxicity test results are defined in this chapter and methods for quantifying WET test method variability are discussed Additional terms used throughout this document along with their definitions are provided in the Glossary as part of the front matter of this document
21 Terms and Definitions
Biological endpoints are the biological observations recorded when conducting toxicity tests These observations may include the number of surviving organisms or the number of young produced There are two basic types of biological endpoints responses recorded as responseno response (eg dead or alive) are quantal data responses recorded as a measured response (eg weight) or as a count (eg number of young produced) are considered continuous data For most WET tests the observations for each tested concentration are combined and then reported as an average or percentage to represent the biological endpoint For example the fathead minnow larval survival and growth chronic test method has two biological endpoints (ie percent survival and average dry weight for each test concentration)
Effect concentrations are concentrations of a test material (ie effluent referent toxicant receiving water) derived from the observed biological endpoints followed by data analysis using either hypothesis testing procedures or point estimate techniques Effect concentrations derived using point estimation techniques represent the concentration of a test material at which a predetermined level of effect occurs For example LC50 is the lethal concentration at which 50 percent of the organisms respond Effect concentrations commonly estimated for WET methods are LC50 EC50 (effect concentration at which a 50shypercent effect occurs) and IC25 (inhibition concentration at which a 25-percent effect occurs) Hypothesis test methods are used to determine the no observed effect concentration (NOEC) The NOEC represents the highest effect concentration in the test concentration response that is not significantly different from the control response Multiple statistical endpoints can be derived for each WET method For example the endpoints for the fathead minnow larval survival and growth chronic test can be reported as an EC25 for growth an NOEC for growth an LC50 (or EC50) for survival and an NOEC for survival
22 Defining WET Test Variability
As with any measurement process WET tests have a degree of variability associated with the test method performance Three measures of variability related to WET tests are within-test variability within-laboratory variability and between-laboratory variability
bull Within-test (intra-test) variability is the variability in test organism response within a concentration averaged across all concentrations of the test material in a single test
bull Within-laboratory (intra-laboratory) variability is the variability that is measured when tests are conducted using specific methods under reasonably constant conditions in the same laboratory Within-laboratory variability as used in this document includes within-test variability The American Society for Testing and Materials (ASTM) uses the term ldquorepeatabilityrdquo to describe within-laboratory variability Repeatability is estimated (as a sample variance or standard deviation) by repeating a test method under realistically constant conditions within a single laboratory
bull Between-laboratory (inter-laboratory) variability is the variability between laboratories It is measured by obtaining results from different laboratories using the same test method and the same
June 30 2000 2-1
Understanding and Accounting for Method Variability in WET Applications Under the NPDES Program
test material (eg reference toxicant) Between-laboratory variability as used in this document does not include the within-laboratory component of variance ASTM uses the term ldquoreproducibilityrdquo to describe between-laboratory variability Reproducibility is estimated by having nearly identical test samples (duplicates or splits) analyzed by multiple laboratories using similar standard methods Although reproducibility is generally synonymous with between-laboratory variability estimates of reproducibility may combine within-laboratory and between-laboratory components of variance making between-laboratory variability numerically larger than within-laboratory variability as defined above
For purposes of consistency EPA uses the terms within-laboratory and between-laboratory variability throughout this document
Numerous factors can affect the variability of any toxicity test method These factors include the number of test organisms the number of treatment replicates randomization techniques the source and health of the test organisms the type of food used laboratory environmental conditions and dilution water quality The experience of the analyst performing the test analyzing the data and interpreting the results may also affect variability (Grothe et al 1996 Fulk 1996)
23 Quantifying WET Test Variability
Historically information on the variability of toxicity tests has been developed using effect concentrations such as the NOEC EC25 EC50 and LC50 for survival fecundity and growth Variability measures should be quantified based on the end use of the data (ie effect concentrations) and be directly related to the WET permit requirement Typically the effect concentrations are the endpoints used for evaluating self-monitoring results The variability of the effect concentrations is quantified by obtaining multiple test results under similar test conditions using the same test material For example the sample standard deviation and mean for EC25 obtained from multiple monthly reference toxicant tests for the fathead minnow survival and growth chronic test conducted at one laboratory would quantify ldquowithinshylaboratoryrdquo variability for that laboratory EPA used this approach to evaluate data for the development of this document (see Chapter 3)
Examining variability for each effect concentration of each biological endpoint for each test method is essential The biological endpoints may be different for various toxicants and effluents One biological endpoint such as reproduction may be more sensitive to a certain toxicant than another endpoint such as survival That sensitivity may be reversed for a different toxicant Alternatively an endpoint may be more sensitive to one toxicant than another toxicant
Three other measures of variability (which are not addressed in this document) that have been applied to WET tests are
1 Determine the variability of the biological endpoint response For example the variance of the biological response (eg growth and survival) can be calculated This approach is useful but does not quantify variability of the WET test effect concentration which is important in the context of this document
2 Quantify the uncertainty of each test point estimate (eg the EC50 EC25 or LC50) using confidence intervals which reflect within-test variability
3 Use the standard deviation to quantify the uncertainty in the mean of the replicate response at each concentration within a particular test For example laboratories can compare the standard deviations of the average weight of fathead minnow larvae in four chronic tests at one test concentration such as 1 mgL sodium chloride These standard deviations may be pooled across
June 30 2000 2-2
Understanding and Accounting for Method Variability in WET Applications Under the NPDES Program
all the concentrations when data have been transformed (if necessary) to give similar variances at each concentration From the pooled variance one may calculate a minimum significant difference (MSD) value which is a useful indication of test sensitivity (see Chapters 3 and 5) In this document the standard deviation at each concentration was not evaluated as a measure of variability However the MSD was considered as a measure of WET test variability
June 30 2000 2-3
Understanding and Accounting for Method Variability in WET Applications Under the NPDES Program
This page intentionally left blank
June 30 2000 2-4
30 VARIABILITY OF WET TEST METHODS
Chapter 3 describes the variability of effect concentration estimates (EC25 LC50 and NOEC) and endpoint measurements (survival growth and reproduction) For definitive studies of the variability of WET methods readers should also refer to the TSD (USEPA 1991a Part 133) and to WET methods manuals (USEPA 1993 1994a 1994b) EPA will complete and report on a new between-laboratory study of promulgated methods in 2000 or 2001
31 Acquisition Selection and Quality Assurance of Data Presented in This Document
EPA solicited data for reference toxicant tests from laboratories that conduct WET tests and use reference toxicant testing as part of their quality control (QC) program Reference toxicant testing is required as specified in EPA toxicity test methods to document laboratory performance over time for laboratories conducting self-monitoring tests When laboratories are conducting effluent tests at least one reference toxicant test must be conducted each month using the same toxicant test concentrations dilution water and data analysis methods These reference toxicant tests must be conducted using the same test conditions (type of dilution water temperature test protocol and species) that are used for WET tests conducted by the laboratory
Reference toxicant tests were used to characterize method variability because in contrast to effluent samples fixed concentrations of known toxicants are used Only with this standardization is it possible to conclude that variability of the effect concentration estimates is derived from the sources discussed above rather than from changes in the toxicant
EPA received reference toxicant test data from several States private laboratory sources and the EPA Regions Data sources used for these analyses include the EPA National Toxicant Reference Database (NTRD) the EPA Region 9 Toxicity Data Base and laboratory bench sheets voluntarily submitted by independent sources Although the data do not represent a random sample of laboratories or tests they do represent a widespread sampling of typical laboratories and practices
EPA required that reference toxicant tests included in its data base meet the following four criteria
1 Test records documented the test method organism test date laboratory reference toxicant and individual biological responses in the concentration series
2 Data for each replicate were provided as required in the published method using the current test method
3 The test used at least five toxicant concentrations and a control for the most commonly reported chronic toxicity test methodsmdash(1) 10000 fathead minnow larval survival and growth (2) 10020 Ceriodaphnia survival and reproduction and (3) 10060 inland silverside survival and growth For other chronic toxicity test methods the test used at least four toxicant concentrations and a control because the methods permitted in the recent past the use of only four concentrations
4 EPA personnel or an EPA contractor calculated the effect concentration verified that all test acceptability criteria (TAC) had been met and verified that the statistical flowchart had been followed correctly Thus all summary statistics and estimates were calculated from the replicate data and strictly followed the most current EPA test methods
June 30 2000 3-1
Understanding and Accounting for Method Variability in WET Applications Under the NPDES Program
Details of data quality assurance and test acceptance are provided in a separate document available at EPArsquos Office of Water docket located in the Office of Science and Technology [ldquoWhole Effluent Toxicity (WET) Data Test Acceptance and Quality Assurance Protocolrdquo] An attachment to that document provides a laboratory-by-laboratory listing of quality assurance flags test dates and toxicant concentrations as well as summary statistics by laboratory for the NOEC EC25 and LC50 estimates and test endpoints (survival growth reproduction etc) Laboratories are not identified by name
The data set of reference toxicant tests includes information from 75 laboratories for 23 methods for tests conducted between 1988 and 1999 This document addresses and provides specific guidance on the variability of methods promulgated by EPA in 40 CFR Part 136 (Table 3-1) The data are also used to develop between-laboratory interim estimates of method variability for the promulgated methods (Appendix A) The Agency identifies these CVs as ldquointerimrdquo EPA may revise some or all of these estimates based on between-laboratory studies to evaluate some of the promulgated test methods
The next section presents summary statistics for the promulgated methods Summary statistics for all methods in the data set appear in Appendix B For methods represented by a few laboratories summary statistics should not be considered representative of method performance For example EPArsquos Office of Water usually relies on acceptable data from at least six laboratories (USEPA 1996b) when it conducts a multi-laboratory study to quantify method performance The data used here have not been obtained under conditions as rigorous as those applied to a between-laboratory study and for that reason may overestimate variability particularly for the extremes
Coefficients of variation are used as descriptive statistics for NOECs in this document Because NOECs can take on only values that correspond to concentrations tested the distribution (and CV) of NOECs can be influenced by the selection of experimental concentrations as well as additional factors (eg within-test variability) that affect both NOECs and point estimates This makes CVs for NOECs more uncertain than the CVs for point estimates and the direction of this uncertainty is not uniformly toward larger or smaller CVs Despite these confounding issues CVs are used herein as the best available means of expressing the variability of interest in this document and for general comparisons among methods Readers should be cautioned however that small differences in CVs between NOECs and point estimates may be artifactual large differences are more likely to reflect real differences in variability (a definition of what is ldquosmallrdquo or ldquolargerdquo would require a detailed statistical analysis and would depend upon the experimental and statistical details surrounding each comparison) NOECs can only be a fixed number of discrete values the mean standard deviation and CV cannot be interpreted and applied as they are for a continuous variable such as the EC25 or EC50 For instance the typical reference toxicant test might result in only three observed NOEC values most of them at one or two concentrations The mean will fall between tested concentrations as will the stated confidence intervals thus these do not actually represent expected outcomes only approximations of the expected outcome
As an alternative to CVs ratios are used to quantify variability of EC25 EC50 and NOEC measurements in Appendix B Ratios of measurements have been used previously to quantify and compare variability of NOEC and EC50 (Chapman et al 1996b Dhaliwal et al 1997)
32 Variability of EC25 LC50 and NOEC
321 Within-Laboratory Variability of EC25 LC50 and NOEC
This section characterizes the within-test and within-laboratory variability of effect concentration estimates Tables 3-2 through 3-4 summarize variation across laboratories of the within-laboratory coefficients of variation (CVs) without respect to reference toxicant tested Tables showing more extensive summaries appear in Appendix B (Tables B-1 through B-3)
June 30 20003-2
Understanding and Accounting for Method Variability in WET Applications Under the NPDES Program
Table 3-1 Promulgated WET Methods Included in This Report
Test Method No Test Method
EPA Data Base
Toxicants Tests Labs
Freshwater Methods for Chronic Toxicitya
10000 Pimephales promelas Fathead Minnow Larval Survival and Growth Test
Cd Cr Cu KCl NaCl NaPCP SDS
205 19
10000 Pimephales promelas Fathead Minnow Embryo-Larval Survival and Teratogenicity Test
0 0
10020 Ceriodaphnia dubia Water Flea Survival and Reproduction Test
Cd Cu KCl NaCl NaPCP 393 33
10030 Selenastrum capricornutum b Green Alga Growth Test
Cu NaCl Zn 85 9
Marine amp Estuarine Methods for Chronic Toxicityc
10040 Cyprinodon variegatus Sheepshead Minnow Larval Survival and Growth Test
Cd KCl 57 5
10050 Cyprinodon variegatus Sheepshead Minnow Embryo-larval Survival and Teratogenicity Test
0 0
10060 Menidia beryllina Inland Silverside Larval Survival and Growth Test
Cr Cu KCl SDS 193 16
10070 Americamysis (Mysidopsis) bahia Mysid Survival Growth and Fecundity Test
Cr Cu KCl 130 10
10080 Arbacia punctulata Sea Urchin Fertilization Test 0 0
10090 Champia parvula Red Macroalga Reproduction Test
Cu SDS 23 2
Methods for Acute Toxicity de
20000 Fathead Minnow Survival Test Cd Cu KCl NaCl NaPCP 217 21
20020 Ceriodaphnia dubia Survival Test Cd Cu KCl NaCl NaPCP 241 23
20040 Sheepshead Minnow Survival Test SDS 65 3
20060 Inland Silverside Survival Test Cd KCl SDS 48 5
20070 Mysid (A bahia) Survival Test Cd Cu SDS 32 3
20110 Mysid (H costata) Survival Test Cd SDS 14 2
20190 Rainbow Trout Survival Test Cu Zn 10 1
20210 Daphnia magna Survival Test Cd 48 5
20220 Daphnia pulex Survival Test Cu NaCl SDS Cd Cu NaCl NaPCP
57 6
a See publications EPA6004-89-001 (USEPA 1989) and EPA6004-91-002 (USEPA 1994b)b The genus and species names for Selenastrum capricornutum have been changed to Raphidocelis subcapitata In this
document however Selenastrum capricornutum is used to avoid confusion See publication EPA6004-91-003 (USEPA 1994a) and EPA6004-87028 (USEPA 1988)
d See publications EPA6004-85013 (USEPA 1985) and EPA6004-90027F (USEPA 1993) e EPA did not assign method numbers for acute methods in EPA6004-90027F The numbers assigned here were created for
use in this document and in related materials and data bases Reference toxicant codes Cd cadmium NaCl sodium chloride Cr chromium NaPCP sodium pentachlorophenate Cu copper SDS sodium dodecyl sulfate KCl potassium chloride Zn zinc
June 30 2000 3-3
c
Understanding and Accounting for Method Variability in WET Applications Under the NPDES Program
Table 3-2 Quartiles (25th and 75th) and Median (50th) of the Within-Laboratory Values of CV for EC25 (Chronic Tests)
Test Methoda
Test Method
No Endpoint
b No of Labs
Percentiles of CV
25th 50th 75th
Fathead Minnow Larval Survival amp Growth 10000 G 19 021 026 038
Fathead Minnow Larval Survival amp Growth 10000 S 16 011 022 032
Ceriodaphnia (Cd) Survival amp Reproduction 10020 R 33 017 027 045
Ceriodaphnia (Cd) Survival amp Reproduction 10020 S 25 011 023 041
Green Alga (Selenastrum) Growth 10030 G 6 025 026 039
Sheepshead Minnow Larval Survival amp Growth 10040 G 5 009 013 014
Sheepshead Minnow Larval Survival amp Growth 10040 S 2 015 016 017
Inland Silverside Larval Survival amp Growth 10060 G 16 018 027 043
Inland Silverside Larval Survival amp Growth 10060 S 13 022 035 042
Mysid (Ab) Survival Growth amp Fecundity 10070 F 4 030 038 041
Mysid (Ab) Survival Growth amp Fecundity 10070 G 10 024 028 032
Mysid (Ab) Survival Growth amp Fecundity 10070 S 7 017 021 028
Red Macroalga (Champia parvula) Reproduction 10090 R 2 058 058 059 a Cd = Ceriodaphnia dubia Ab = Americamysis (Mysidopsis) bahia b G = growth S = survival R = reproduction F = fecundity
Table 3-3 Quartiles (25th and 75th) and Median (50th) of the Within-Laboratory Values of CV for LC50
Test Methoda Test
Method No Endpoint
b No of Labs
Percentiles of CV
25th 50th 75th
Freshwater Methods for Chronic Toxicityc
Fathead Minnow Larval Survival amp Growth 10000 S 19 015 023 031
Ceriodaphnia (Cd) Survival amp Reproduction 10020 S 33 010 016 029
Sheepshead Minnow Larval Survival amp Growth 10040 S 5 007 008 012
Inland Silverside Larval Survival amp Growth 10060 S 16 016 028 035
Mysid (Ab) Survival Growth amp Fecundity 10070 S 10 016 026 027
Methods for Acute Toxicityde
Fathead Minnow Larval Survival 20000 S 21 010 016 019
Ceriodaphnia (Cd) Survival 20020 S 23 011 019 029
Sheepshead Minnow Survival 20040 S 5 012 014 021
Inland Silverside Larval Survival 20060 S 5 015 016 021
Mysid (Ab) Survival 20070 S 3 017 025 026
Mysid (Hc) Survival 20110 S 2 027 030 034
Rainbow Trout Survival 20190 S 1 023 023 023
Daphnia (Dm) Survival 20210 S 5 007 022 024
Daphnia (Dp) Survival 20220 S 6 019 021 027 a Cd = Ceriodaphnia dubia Ab = Americamysis (Mysidopsis) bahia Hc = Holmesimysis costata Dm = Daphnia magna
Dp = Daphnia pulex b S = survival
See publications EPA6004-89-001 (USEPA 1989) and EPA6004-91-002 (USEPA 1994b)d See publications EPA6004-85-013 (USEPA 1985 and EPA6004-90027F (USEPA 1993) e EPA did not assign method numbers for acute methods in EPA6004-90027F The numbers assigned here were created for
use in this document and in related materials and data bases
June 30 2000 3-4
c
Understanding and Accounting for Method Variability in WET Applications Under the NPDES Program
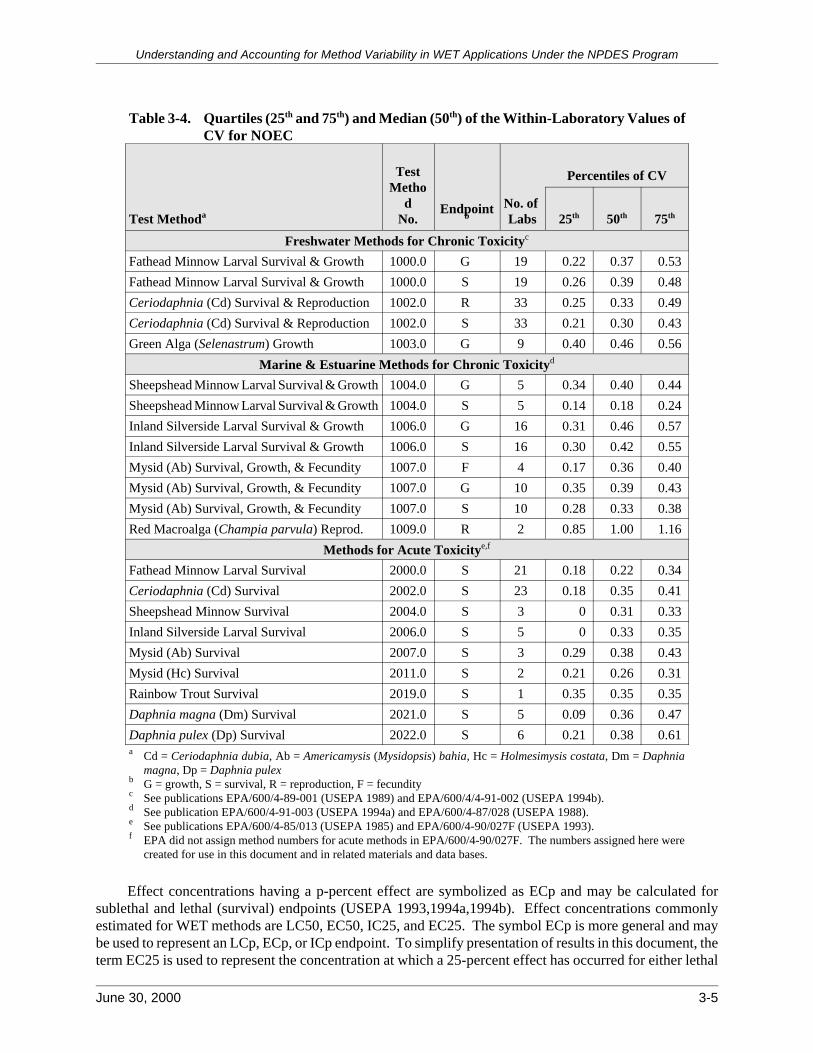
Table 3-4 Quartiles (25th and 75th) and Median (50th) of the Within-Laboratory Values of CV for NOEC
Test Methoda
Test Metho
d No
Endpointb
No of Labs
Percentiles of CV
25th 50th 75th
Freshwater Methods for Chronic Toxicityc
Fathead Minnow Larval Survival amp Growth 10000 G 19 022 037 053
Fathead Minnow Larval Survival amp Growth 10000 S 19 026 039 048
Ceriodaphnia (Cd) Survival amp Reproduction 10020 R 33 025 033 049
Ceriodaphnia (Cd) Survival amp Reproduction 10020 S 33 021 030 043
Green Alga (Selenastrum) Growth 10030 G 9 040 046 056
Marine amp Estuarine Methods for Chronic Toxicityd
Sheepshead Minnow Larval Survival amp Growth 10040 G 5 034 040 044
Sheepshead Minnow Larval Survival amp Growth 10040 S 5 014 018 024
Inland Silverside Larval Survival amp Growth 10060 G 16 031 046 057
Inland Silverside Larval Survival amp Growth 10060 S 16 030 042 055
Mysid (Ab) Survival Growth amp Fecundity 10070 F 4 017 036 040
Mysid (Ab) Survival Growth amp Fecundity 10070 G 10 035 039 043
Mysid (Ab) Survival Growth amp Fecundity 10070 S 10 028 033 038
Red Macroalga (Champia parvula) Reprod 10090 R 2 085 100 116
Methods for Acute Toxicityef
Fathead Minnow Larval Survival 20000 S 21 018 022 034
Ceriodaphnia (Cd) Survival 20020 S 23 018 035 041
Sheepshead Minnow Survival 20040 S 3 0 031 033
Inland Silverside Larval Survival 20060 S 5 0 033 035
Mysid (Ab) Survival 20070 S 3 029 038 043
Mysid (Hc) Survival 20110 S 2 021 026 031
Rainbow Trout Survival 20190 S 1 035 035 035
Daphnia magna (Dm) Survival 20210 S 5 009 036 047
Daphnia pulex (Dp) Survival 20220 S 6 021 038 061 a Cd = Ceriodaphnia dubia Ab = Americamysis (Mysidopsis) bahia Hc = Holmesimysis costata Dm = Daphnia
magna Dp = Daphnia pulex b G = growth S = survival R = reproduction F = fecundity
See publications EPA6004-89-001 (USEPA 1989) and EPA60044-91-002 (USEPA 1994b)d See publication EPA6004-91-003 (USEPA 1994a) and EPA6004-87028 (USEPA 1988) e See publications EPA6004-85013 (USEPA 1985) and EPA6004-90027F (USEPA 1993)f EPA did not assign method numbers for acute methods in EPA6004-90027F The numbers assigned here were
created for use in this document and in related materials and data bases
Effect concentrations having a p-percent effect are symbolized as ECp and may be calculated for sublethal and lethal (survival) endpoints (USEPA 19931994a1994b) Effect concentrations commonly estimated for WET methods are LC50 EC50 IC25 and EC25 The symbol ECp is more general and may be used to represent an LCp ECp or ICp endpoint To simplify presentation of results in this document the term EC25 is used to represent the concentration at which a 25-percent effect has occurred for either lethal
June 30 2000 3-5
c
Understanding and Accounting for Method Variability in WET Applications Under the NPDES Program
or sublethal endpoints The term LC50 is used to represent the concentration at which a 50-percent effect has occurred for lethal endpoints The EC25 for survival is not routinely used in generating self-monitoring data and is presented here for comparison to the EC25 for sublethal endpoints (ie IC25) Estimates of EC25 LC50 and NOEC were calculated for this document as required in the EPA test methods (USEPA 1993 1994a 1994b) A CV is reported for NOEC measurements in this document See Appendix A for further details
The results in Tables 3-2 through 3-4 were obtained as follows using as an example the EC25 of the growth endpoint in Method 10000 (fathead minnow larval chronic test) on the first row of Table 3-2 The CV of the EC25 estimates was calculated for each laboratory This calculation resulted in 19 CVs (one per laboratory with each laboratory tested using one toxicant) The sample percentiles were calculated for this set of 19 CVs In Table 3-2 the column headed ldquo50thrdquo shows the 50th percentile (median value) of CV found across these 19 laboratories the 50th percentile value is 026 In the column headed ldquo75thrdquo the 75th percentile CV is reported as 038 When a method is represented by fewer than four laboratories the minimum and maximum CVs are shown in the columns headed ldquo25thrdquo and ldquo75thrdquo respectively Note that these CVs represent within-laboratory variability and that Tables 3-2 through 3-4 show the quartiles and median of the within-laboratory CVs These tables thus report the typical range of within-laboratory test method variation
Variation across laboratories in the CV for effect concentration estimates (Tables 3-2 through 3-4) may be summarized as follows ignoring methods represented by only one or two laboratories [Refer to the column headed ldquo75thrdquo (the 75th percentile)]
For the EC25 of the growth and reproduction endpoints in chronic toxicity tests 75 percent of laboratories have a CV no more than 014 to 045 depending on the method (Table 3-2) For the two most commonly used methods (10000 fathead minnow larval chronic test and 10020 Ceriodaphnia chronic test) 75 percent of the laboratories have CVs no more than 038 and 045 respectively
For the LC50 of the survival endpoint in chronic toxicity tests 75 percent of laboratories have a CV no more than 012 to 035 depending on the method For the two most commonly used methods (10000 and 10020) 75 percent of laboratories have CVs no more than 031 and 029 respectively (Table 3-3) For the LC50 in acute toxicity tests 75 percent of laboratories have a CV no more than 019 to 029 depending on the method For the two most commonly used methods (20000 and 20020) 75 percent of laboratories have CVs no more than 019 and 029 respectively
For the NOEC of growth or reproduction endpoints in chronic toxicity tests 75 percent of laboratories have a CV no more than 043 to 057 depending on the method For the two most commonly used methods (10000 and 10020) 75 percent of laboratories have CVs no more than 053 and 049 respectively (Table 3-4) For the NOEC of survival in chronic toxicity tests 75 percent of laboratories have a CV no more than 024 to 055 depending on the method For the two most commonly used methods (10000 and 10020) 75 percent of laboratories have CVs no more than 048 and 043 respectively For the NOEC of survival in acute toxicity tests 75 percent of laboratories have a CV no more than 034 to 061 depending on the method For the two most commonly used acute methods (20000 and 20020) 75 percent of laboratories have CVs no more than 034 and 041 respectively
Appendix B discusses the range of toxicant concentrations reported as the NOEC For chronic toxicity tests most laboratories report the NOEC to within two to three concentration intervals and half the laboratories report most NOECs within one to two concentration intervals for reference toxicants For acute toxicity tests most laboratories report NOECs at one or two concentrations This outcome agrees with EPArsquos expected performance for these methods The normal variation of the effect concentration estimate in reference toxicant tests has been reported for some EPA WET methods (USEPA 1994a 1994b) to be plus or minus one dilution concentration for the NOEC and less for LC50
June 30 2000 3-6
Understanding and Accounting for Method Variability in WET Applications Under the NPDES Program
322 Between-Laboratory Variability of EC25 LC50 and NOEC
The data set compiled for this document provided reasonable estimates of between-laboratory variability for only a few methods For many methods and toxicants there were too few laboratories in the data base Additional summaries of between-laboratory variability of WET methods are included in the TSD (USEPA 1991a Part 133) and the WET methods manuals (USEPA 1994a 1994b) EPA also intends to provide new data in a forthcoming EPA between-laboratory study of promulgated methods
Using the data set credible estimates of between-laboratory variability could be made for a few toxicants and methods having data for six or more laboratories (Table 3-5) The statistical methods are described in Appendix B Table 3-5 shows values of the square root of within-laboratory and between-laboratory variance components (ie standard deviations F) The standard deviations and mean are expressed in units of toxicant concentration (eg gL or mgL) Between-laboratory Fb estimates the standard deviation for laboratory means of EC25 LC50 and NOEC The ldquoMeanrdquo column in Table 3-5 shows the mean of the laboratory means not the mean for all tests Because the number of tests differed among laboratories these two means are different These data suggest that between-laboratory variability (Fb) is comparable to within-laboratory variability (Fw) for the methods listed in the table
In Table 3-5 the ratio of Fb to the mean is an estimate of the relative variability (CVb) of laboratory means around their combined mean The ratio of Fw to the mean may approach the value of the average within-laboratory CV when the sample of laboratories is large but to characterize within-laboratory CVs readers should use Tables 3-2 through 3-4
Table 3-5 Estimates of Within-Laboratory and Between-Laboratory Components of Variabilitya
Test Methodb
Test EC Estimate Toxicant
End-Pointc Tests Labs
Within-lab FFW
Between-lab FFb Mean CVw CVb
10000 EC25 NaCl G 73 6 067 044 263 025 017
10000 LC50 NaCl S 73 6 114 045 415 027 011
10000 NOEC N Cl G 73 6 072 035 218 033 016
10000 NOEC NaCl S 73 6 096 051 243 040 021
10020 EC25 NaCl R 292 23 029 027 092 032 029
10020 LC50 NaCl S 285 23 048 024 178 027 013
10020 NOEC NaCl G 292 23 028 018 074 038 024
10020 NOEC NaCl S 292 23 047 026 142 033 018
10060 EC25 Cu G 130 9 451 524 974 046 054
10060 LC50 Cu S 130 9 484 707 1270 038 056
10060 NOEC Cu G 130 9 518 444 801 065 055
10060 NOEC Cu S 130 9 342 395 654 052 060
20000 LC50 NaCl S 154 14 105 124 746 014 017
20020 LC50 NaCl S 167 15 036 038 197 018 019 a F = within-laboratory standard deviation Fb = between-laboratory standard deviationw
CV = within-laboratory coefficient of variation CVb = between-laboratory coefficient of variationwb EPA did not assign method numbers for acute methods in EPA6004-90027F The numbers assigned here
were created for use in this document and in related materials and data bases G = growth S = survival R = reproduction
June 30 2000 3-7
c
Understanding and Accounting for Method Variability in WET Applications Under the NPDES Program
33 Variability of Endpoint Measurements
This section characterizes the within-laboratory precision of endpoint measurements (eg growth reproduction and survival) Endpoint variability in methods for chronic toxicity is characterized here using sublethal endpoints The sublethal endpoint was designed to be more sensitive than the survival endpoint and it incorporates the effect of mortality (ie it incorporates biomass) For example for the chronic survival and growth fathead minnow larval test the total dry weight at each replicate is divided by the original number of larvae rather than the surviving number of larvae
EPA reports measures of test precision based on the control CV [(control standard deviation)(control mean)] and the ldquoPercent MSDrdquo [100timesMSD(control mean)] symbolized as PMSD Recall that MSD the ldquominimum significant differencerdquo is calculated as [d EMS (2r)] where ldquodrdquo is the critical value of Dunnettrsquos statistic when comparing ldquokrdquo treatments to a control EMS is the error mean square from the analysis of variance of the endpoint responses and ldquorrdquo is the number of replicates at each concentration (USEPA 1993 1994a 1994b) These measures of test precision quantify within-test variability or the sensitivity of each test to toxic effects on the biological endpoint
Measures of variability relative to the control mean are used for two reasons First a laboratory having consistently large mean endpoint values for the control will also tend to have larger values of MSD and control standard deviation Second PMSD is readily interpreted as the minimum percent difference between control and treatment that can be declared statistically significant in a WET test A significant effect occurs when (control mean - treatment mean) exceeds the MSD Dividing by the control mean and multiplying by 100 states this relationship in terms of the percent difference between control and treatment
To characterize the distribution of values of PMSD values from all laboratories and toxicants for a given method and endpoint were combined and sample percentiles reported Percentiles are also reported for the CV of the control which also indicates variability among replicates under non-toxic conditions and may be a useful indicator of uniformity of the test organisms The sample percentiles are reported in more detail in Appendix B the 10th and 90th percentiles are shown in Table 3-6 Method 10090 (red macroalga) is omitted from Table 3-6 because it would be inadvisable to characterize method variability using only 23 tests from only two laboratories
The 90th percentile may be used as an upper PMSD bound (ie a limit on the insensitivity of a test) The 10th percentile may be used as a lower PMSD bound for declaring a significant difference or a lower limit to test sensitivity The 90th percentile has been used in other WET programs (Chapter 5) The 95th
percentile is used as a practical upper limit for the variability of analytical results in well-controlled between-laboratory studies that use a standard protocol and specific quality assurance procedures (ASTM 1992 1998 USEPA 1993 1996a 1996b) The tests summarized here have not been subjected to the rigorous standardization and quality assurance of collaborative studies and the data have not been screened for outliers as specified by ASTM Practices D2777 and E691 (ATSM 1992 1998) These considerations justify using the sample 90th percentile to set an upper bound A lower bound is necessary to avoid creating a disincentive for improving test precision and to objectively specify a limit to the test sensitivity achieved in practice If no more than ten percent of tests are more precise than this lower bound then in practice the analytical method rarely detects toxic effects of this small magnitude
When comparing values in Table 3-6 to a test result it is important that the testrsquos MSD be calculated according to procedures described in the EPA method manuals (USEPA 1993 1994a 1994b) for Dunnettrsquos test for multiple comparisons with a control (see Section 641) An analysis of variance (ANOVA) is conducted using several treatments including the control EPA methods require excluding from the ANOVA those concentrations for which no organisms survived in any replicate For a sublethal endpoint concentrations are excluded from the analysis if they exceed the NOEC for survival The MSD is calculated
June 30 2000 3-8
c
Understanding and Accounting for Method Variability in WET Applications Under the NPDES Program
using the square root of the error mean square (rEMS) from the ANOVA and using Dunnettrsquos critical value (which depends on the number of replicates and concentrations used in the ANOVA)
Table 3-6 Range of Relative Variability for Endpoints of Promulgated WET Methods Defined by the 10th and 90th Percentiles from the Data Set of Reference Toxicant Testsa
Test Methodb Endpointc No of Labs
No of Tests
PMSD Control CVd
10th 90th 10th 90th
10000 Fathead Minnow G 19 205 94 35 0035 020
10020 Ceriodaphnia dubia R 33 393 11 37 0089 042
10030 Green Alga G 9 85 93 23 0034 017
10040 Sheepshead Minnow G 5 57 63 23 0034 013
10060 Inland Silverside G 18 193 12 35 0044 018
10070 Mysid G 10 130 12 32 0088 028
20000 Fathead Minnow S 20 217 42 30 0 0074
20020 Ceriodaphnia S 23 241 50 21 0 011
20040 Sheepshead Minnow S 5 65 0e 55 0 0
20060 Inland Silverside S 5 48 70 41 0 0079
20070 Mysid (A bahia) S 3 32 51 26 0 0081
20110 Mysid (H costata) S 2 14 18 47 0 0074
20210 Daphnia (D magna) S 5 48 53 23 0 011
20220 Daphnia (D pulex) S 6 57 58 23 0 011 a The precision of the data warrants only three significant figures When determining agreement with these values one may
round off values to two significant figures (eg values gt345000 and 35000 are rounded to 35) Method 10090 (red macroalga) is not reported because it is inadvisable to characterize method variability using only 23 tests from just two laboratories
b EPA did not assign method numbers for acute methods in EPA6004-90027F The numbers assigned here were created for use in this document and in related materials and data bases G = growth R = reproduction S = survival
d CVs were calculated using untransformed control means for each test e An MSD of zero will not occur when the EPA flow chart for statistical analysis is followed In this report MSD was
calculated for every test including those for which the flow chart would require a nonparametric hypothesis test EPA recommends using the value 42 (the 10th percentile shown for the fathead minnow acute test) in place of zero as the 10th
percentile PMSD (lower PMSD bound) for the sheepshead minnow acute test
The MSD was calculated for all test results reported here including those for which non-normality and heterogeneity of variance were indicated Thus this document presents MSD as an approximate index of test sensitivity Estimates of power are also approximate The MSD generally will be related to test sensitivity even when the assumptions for ANOVA and Dunnettrsquos test are not strictly satisfied
Table 3-7 shows the number of laboratories in the WET variability data set having tests exceeding the upper PMSD bound reported in Table 3-6 One-half to two-thirds of the laboratories never or infrequently exceeded the bound and roughly one in five exceeded it in at least 20 percent of their tests By definition of the 90th percentile about 10 percent of all the tests exceeded the bound
June 30 2000 3-9
Understanding and Accounting for Method Variability in WET Applications Under the NPDES Program
Table 3-7 Number of Laboratories Having a Given Percent of Tests Exceeding the PMSD Upper Bound for the Sublethal Endpoint
Test Method No Labs Endpointsa
Number of Labs with Various Percentages of Tests Exceeding the PMSD Upper Bound
0 0-10 10-20 20-50 50-100
10000 Fathead Minnow 19 G 8 2 7 2 0
10020 Ceriodaphnia dubia 33 R 15 7 5 6 0
10030 Green Alga 9 G 6 1 0 2 0
10040 Sheepshead Minnow 5 G 3 1 0 1 0
10060 Inland Silverside 16 G 6 5 1 4 0
10070 Mysid (growth) 10 G 5 2 0 3 0 a G = growth R = reproduction
34 Conclusions about Variability of WET Methods
341 Variability of EC25 LC50 NOEC
For EC25 the quartiles of the within-laboratory CVs ranged across the promulgated methods from 009 to 045 and the median CV ranged from 013 to 038 For LC50 the quartiles of the within-laboratory CVs ranged from 007 to 035 and the median CV ranged from 008 to 028 For NOEC the quartiles of the within-laboratory CVs ranged from 0 to 061 and the median CV ranged from 018 to 046 This summary applies to those methods represented by at least 20 tests and three laboratories
EPA concludes from Tables 3-2 through 3-4 that point estimates are substantially less variable than the NOEC for the same method and endpoint and that the LC50 for an acute toxicity test usually is less variable than the LC50 for a chronic toxicity test The estimated NOEC is more variable than ECp using current experimental designs because NOEC can take only those values equal to the concentrations tested while ECp interpolates between tested concentrations (there may be other more technical reasons as well) In principle NOEC could be estimated more accurately and precisely by changing the experimental design to use more concentrations at narrower dilution ratios and by using more replicates The greater variability of the NOEC underscores the desirability of using point estimates to characterize effluent toxicity
Tables 3-2 through 3-4 may be used as benchmarks for variability allowing comparison of one laboratoryrsquos CV for reference toxicant testing with CVs reported by experienced laboratories reporting tests that passed the TAC However CVs for methods represented by too few laboratories in the table may be atypical
The CVs in Tables 3-2 through 3-4 may be used as an adjunct to the control chart If the CV for reference toxicant tests is above the 75th percentile in Tables 3-2 through 3-4 variability likely can be reduced even if the individual EC25 or LC50 values fall within the control limits If a control chart is constructed using an unreasonably large standard deviation the control limits will be unreasonable If a high CV is not fully explained by an unusually small mean the standard deviation of EC25 or LC50 should be reduced to bring the CV within the normal range If the CV exceeds the 90th percentile (Appendix B) there is no question that variability is unacceptably large Detailed guidance is provided in Chapter 5 (Section 5311)
Tables 3-2 through 3-4 indicate the magnitude of the analytical variability that becomes part of the variability of effluent test results under certain conditions This occurs when effluent test results (NOECs LC50s or EC25s) fall between the lowest and highest concentrations tested Under other conditions these
3-10 June 30 2000
Understanding and Accounting for Method Variability in WET Applications Under the NPDES Program
CVs may not accurately represent analytical variability If tests give results consistently near or at the lowest or highest concentrations tested or if the tests often produce ldquoless thanrdquo or ldquogreater thanrdquo results Tables 3-2 through 3-4 will not accurately characterize the analytical CV for such tests To measure the analytical CV under such conditions reference toxicant tests would have to be designed to have the effect concentration at or near the lowest or highest concentration The CV and standard deviation measured under such conditions are unknown but are likely to differ from those for standard reference toxicant tests
The data set did not contain information supporting an analysis of the causes of between-laboratory variability Possible causes may include laboratory differences in concentration series incorrect or ambiguous calculation or reporting of concentrations (eg concentration of the metal ion versus the salt) laboratory differences in dilution water (eg water hardness or pH) laboratory differences in foods and feeding regimes and laboratory differences in cultures (genotypic and phenotypic differences in sensitivity to various toxicants)
The lack of a standard or common reference toxicant creates a problem for permittees and regulatory authorities attempting to evaluate and compare laboratories Real or apparent differences occur between laboratories in the mean values of EC25 LC50 and NOEC Some of this difference is random and reflects only the within-laboratory variance some may be systematic Systematic between-laboratory differences can be inferred reliably only when laboratories use the same test method use the same reference toxicants and dilution series use similar dilution waters and report a sufficient number of tests
342 Variability of Endpoint Measurements
EPA has selected the PMSD to characterize endpoint variability for WET test methods because it integrates variability from several concentrations (always including the control) and it represents the MSD used in the WET hypothesis test The control CV by itself does not fully represent the variability affecting a WET hypothesis test or point estimate The PMSD also represents the variability affecting point estimates because it is calculated using the EMS for the endpoint measurement (However the standard error of a point estimate of an effect concentration may be a complicated function of the EMS)
PMSD for sublethal endpoints ranged from 6 to 37 across the promulgated chronic methods For the fathead minnow chronic method PMSD ranged from 9 to 35 for the Ceriodaphnia chronic method PMSD ranged from 11 to 37 Thus most chronic tests were able to distinguish a reduction of 37 percent or smaller in the endpoint Further analysis in Chapter 5 shows that most tests were unable to distinguish consistently a 25-percent reduction For the survival endpoint of promulgated acute methods PMSD ranged from 0 to 55 For the two most commonly used acute methods (fathead minnow and Ceriodaphnia) PMSD ranged from 4 to 30 and from 5 to 21 respectively Thus PMSD varied markedly for some acute methods and not for others
As shown by the size of PMSD test sensitivity to detect substantial toxic effects is occasionally insufficient at some laboratories and routinely insufficient at a few laboratories Inadequate test sensitivity is not always signaled by control charts of EC25 LC50 and NOEC Laboratories should consider maintaining control charts for MSD or PMSD and should report MSD and the control mean with all WET tests
Some portion of MSDs in the WET variability data set could be considered exceptionally large if not outliers This observation underscores the importance of a careful review for each WET test including an examination of means and standard deviations for endpoint responses at each concentration the plotting of replicate data (not just concentration means) and when necessary a search for possible causes of excessive variability The tables and plots in the promulgated methods (USEPA 1994a 1994b) provide good examples
June 30 2000 3-11
Understanding and Accounting for Method Variability in WET Applications Under the NPDES Program
This page intentionally left blank
3-12 June 30 2000
40 VARIABILITY IN CONTEXT
EPA manages the regulation of WET in the same way it manages the regulation of chemical-specific pollutants in order to determine reasonable potential (RP) derive permit limits determine data quality control and evaluate self-monitoring data Many similarities between chemical-specific toxicant and WET controls can be found in the TSD (USEPA 1991a) Determining RP in both cases uses many of the same strategies Permit limit derivation makes similar exposure assumptions and relies on nearly identical toxicological data bases
Considering a value other than the best analytical estimate as a measure for WET or for specific chemical analytes is inappropriate All analytical results in either chemical-specific analyses or WET tests incorporate some estimated range of uncertainty While infrequently discussed for chemical methods uncertainty does play a role in the meaning of analytical results One end of the confidence interval likely will be less protective of aquatic resources than the other The derived limit and therefore final reported analytical results become the best estimate of the actual ecological need and assessment of the effect
Significant debate has occurred over assertions that WET data have too much inherent variability for reliable use in the NPDES program This debate has engendered considerable evaluation of WET precision Groups of scientists and individual researchers have repeatedly concluded that currently promulgated WET methods are technically sound and that the observed precision is within the range of precision of other analyses frequently required in NPDES permits (Grothe et al 1996) The findings of some of the significant sources of these conclusions are summarized below
41 Society of Environmental Toxicology and Chemistry Pellston WET Workshop
The 1995 Society of Environmental Toxicology and Chemistry (SETAC) Pellston Workshop on Whole Effluent Toxicity convened 47 experts in the discipline to assess applied methods and their application in the regulatory process Representation at the workshop was intentionally balanced among government business and academic participants These scientists published consensus conclusions and recommendashytions including the following
411 General Conclusions and Recommendations
Grothe et al (1996) state ldquoExisting WET testing methods (USEPA 1985 USEPA 1988 USEPA 1989) are technically sound but certain modifications would improve endpoint interpretation Such changes involve implementing improvements to currently used statistical procedures establishing acceptable limits for MSD values and adding confidence limits to WET test endpointsrdquo
ldquoA number of problems with WET tests are caused by misapplication of the tests misinterpretation of the data lack of competence of the laboratories conducting WET testing poor conditionhealth of test organisms and lack of training of laboratory personnel regulators and permittees More widespread use of WET related guidance provided in USEPArsquos TSD (1991a) would help alleviate some of these problems In addition an effective QAQC program will improve data quality and reduce test variabilityrdquo
ldquoIncrease training opportunities for regulators and permittees to improve the implementation of WET objectives and to promote national consistency in permitting and compliance issuesrdquo
June 30 2000 4-1
Understanding and Accounting for Method Variability in WET Applications Under the NPDES Program
ldquoImplement a broadly based and standardized QAQC program to improve WET testing performance and data qualityrdquo
ldquoQuantify the lsquoconfidencersquo around test endpoints to improve interpretation of WET test results Specific statistical methods that could improve precision are presented in Chapter 3 of this document and processes to reduce variability are discussed in Chapter 5 In addition WET tests should be performed using a dilution series of exposure concentrations to establish a dose-response relationshiprdquo
412 Conclusions about Data Precision
Ausley (1996) compared CVs of chemical analyses and aquatic toxicity tests conducted by North Carolina NPDES permittees Ausley found that CVs of reported values for chemical analytes (including metals organic analytes and non-metal inorganic analytes) ranged from 118 percent to 2917 percent Coefficients of variation for toxicity parameters (acute and chronic Ceriodaphnia dubia acute and chronic Pimephales promelas acute Daphnia pulex and acute Mysidopsis bahia) ranged from 148 percent to 676 percent From this review he concluded that ldquothe precision of toxicity analyses is within the range of that being reported for commonly analyzed and regulated chemical parametersrdquo Ausley highlighted the difficulty in comparing precision estimates of chemical analytes and WET analyses (particularly NOECs) noting that while chemical precision is often determined well above analytical detection WET precision is often based on the minimum detection level An assumption that WET precision will vary among toxicants is also logical To establish ldquoinherent variabilityrdquo considering toxicants that cause minimal variability in the analysis may be appropriate The high coefficients of variation for some chemical parameters reported by Ausley reflect the fact that in practice analytical precision can vary widely in individual studies in which the effects of a single (or a few) poorly operating laboratory can adversely affect precision estimates In practice this kind of data must be screened for quality prior to use to evaluate self-monitoring data or estimates of overall method quality
Ausleyrsquos results closely approximate analytical precision of chemical analytes referenced in the TSD (USEPA 1991a Chapter 12) The CVs for metals (aluminum cadmium chromium copper iron lead manganese mercury silver and zinc) ranged from 18 percent to 129 percent at the low end of the measurement detection range Between-laboratory CVs for organic analytes ranged from greater than 12 percent to 91 percent The CVs for non-metal analytes (alkalinity residual chlorine ammonia nitrogen Kjeldahl nitrogen nitrate nitrogen total phosphorus biological oxygen demand chemical oxygen demand and total organic carbon) ranged from 46 percent to 70 percent in between-laboratory studies of precision
Burton et al (1996) concluded that ldquoUSEPA-published methods are functional and appropriate in the context of effluent toxicity control programsrdquo They recommended developing limits on within-test variability a quality assurance and audit program and guidance for permittee procurement of WET analytical services
Denton and Norberg-King (1996) cited various studies that favorably compare WET methods with chemical analytical methods (Grothe and Kimerle 1985 Rue et al 1988 Morrison et al 1989 Grothe et al 1990) They proposed that improvements in test result consistency could be accomplished by limiting the range of within-test variability through controls of upper and lower statistical power (eg limits on test MSD) Three practices to control within-test variability most effectively are (1) controlling within-test sensitivity (2) following well-defined test methods and (3) maintaining communication within the regulatory community For example the permittee and regulatory authorities should discuss any facility-specific issues to fully characterize the appropriate permit conditions
June 30 2000 4-2
Understanding and Accounting for Method Variability in WET Applications Under the NPDES Program
42 Water Environment Research Foundation Study
Another publication ldquoWhole Effluent Toxicity Testing Program Evaluation of Practices and Implementationrdquo (DeGraeve et al 1998) presents the results of a survey of publicly owned treatment works and State regulatory programs about WET issues The Water Environment Research Foundation (WERF) sponsored this study Conclusions by DeGraeve et al (1998) include the following
ldquoThe project team believes that the results demonstrate that the test methods can be routinely completed successfully by well-trained competent WET testing laboratories and that the results considered collectively suggest that the test methods that are being used to measure WET are technically soundrdquo
ldquoThere is a need for better trainingguidance in WET-related issues for both the regulatory staff responsible for implementing WET requirements and for permittees responsible for meeting WET limitsrdquo
DeGraeve et al (1998) considered the conclusions of the SETAC Pellston WET publication concurring that between-laboratory CV values of toxicity test methods were low training of regulatory and permittee staff is needed nationally and strengthened quality assurance (QA)quality control (QC) practices could improve performance of analyses Unlike the SETAC Pellston WET conclusions they found that there are enough laboratories to meet the current market demand for analyses Like the SETAC effort DeGraeve et al (1998) concluded that a national center of expertise on WET issues would be beneficial to provide guidance to regulatory agencies permittees and laboratories
WERF also funded a project entitled ldquoWhole Effluent Toxicity Testing Methods Accounting for Variancerdquo (Warren-Hicks et al 1999) This study compared within- and between-laboratory results of reference toxicant test variation as measures of reproducibility and comparability respectively The authors concluded that some laboratories could consistently reproduce test results while others could not and inferred that test precision is a factor of laboratory experience and not inherent methodological weakness The authors recommended that national studies be conducted to evaluate within- and between-laboratory precision of promulgated WET test methods (EPA has already initiated this study) They also recommended that additional test acceptability criteria (TAC) such as upper and lower bounds of MSD be established and incorporated in the NPDES process The latter recommendation corroborates other researchersrsquo recommendations discussed above
43 Minimizing Variability by Adhering to WET Toxicity Test Methods
Specific factors that affect variability in WET analyses have been described in several papers (Burton et al 1996 Ausley 1996 Erickson et al 1998 Davis et al 1998) The most important initial consideration in developing precise data is a laboratoryrsquos experience and success in performing a specific analysis Most critical reviews of WET data precision emphasize this initial consideration Experienced professionals most likely will be able to develop the most consistent and reliable information and can interpret anomalous conditions in the testing or results
An additional factor in considering WET test method variability is whether the prescribed methods (eg the EPA toxicity test methods promulgated in 40 CFR Part 136) are being followed appropriately (see Chapter 5) If tests are submitted that do not meet specified TAC or are produced when laboratory QA testing indicates analyses are beyond control limits these results should not be used in the NPDES process Tests performed on effluent samples that have not met required temperature maxima or holding times should not be considered for regulatory purposes Rigorous QA practices are critical to the success of any analytical program Both the regulatory authority and permittee should strive to ensure that such practices are in place
June 30 2000 4-3
Understanding and Accounting for Method Variability in WET Applications Under the NPDES Program
for any program developing WET data whether by national laboratory accreditation State regulatory certification direct permittee oversight or specific contractual agreement with the laboratory
Comparisons of WET method precision with analytes commonly limited in NPDES permits clearly demonstrate that the promulgated WET methods are within the range of variability experienced in other analyses Several researchers also noted clear indications that method performance improves when prescribed methods are followed closely by experienced analysts (Grothe et al 1996 DeGraeve et al 1998)
A review of WET test results confirms that imprecise WET data are being reported As with any analytical technique inexperienced individuals can perform analyses incorrectly or fail to follow appropriate methods and quality assurance practices Using the training that is available for these methods and quality assurance techniques referenced by this document will help ensure that data of maximum reliability are used and that sound decisions are made based on those results The Western Coalition of Arid States conducted a study in 1997 (Moore et al 2000) which reported the results of 16 tests with a non-toxic test sample using the Ceriodaphnia dubia chronic test These results indicated that 43 percent of the tests showed toxicity EPA is in the process of reviewing the paper and the raw data
Persons interested in WET issues may consult another source of information developed by the SETAC Whole Effluent Toxicity Expert Advisory Panels This group established under a cooperative agreement with EPA provides scientific opinion and training on WET technical issues This information is available on the Internet at the SETAC web site httpwwwsetacorg Appendix D contains frequently asked questions with answers prepared by the SETAC WET Expert Advisory Panels The expert panels have identified and discussed various factors that affect WET variability
44 Conclusion
When the variability of WET analyses is viewed in the context of the NPDES program these techniques produce data that are as precise as those from chemical analyses As with any other analytical system lack of experience in performing the analyses adherence to prescribed QA practices or good laboratory practices will reduce the precision of the results Studies of these factors by independent researchers from both the regulatory and regulated communities support these conclusions While examples of poor-quality highly variable results from chemical analyses have also been publicized these results are frequently influenced by the shortcomings mentioned above Permittees that must generate and use WET data should become well-educated in data quality interpretation and permittees should require that QC practices be followed by laboratories generating the data Various sources of information presented in this chapter should assist permittees testing laboratories and regulatory authorities with this education process Examples of practices that can further reduce the imprecision of analyses are also discussed in Chapters 5 and 6 of this document Additional refinements of TAC can likewise improve test power to detect effects (or the lack thereof) and increase the statistical confidence in results
June 30 2000 4-4
50 GUIDANCE TO REGULATORY AUTHORITIES LABORATORIES AND PERMITTEES GENERATING AND EVALUATING
EFFECT CONCENTRATIONS
51 Steps for Minimizing Test Method Variability
This chapter provides the background and recommendations on WET test procedures related to sampling conducting the toxicity test methods and conducting the statistical methods Implementing these recommendations should decrease or minimize WET test method variability thereby increasing confidence to make regulatory decisions (see Figure 5-1) EPA stands behind the technical soundness of the current WET test methods The critical steps in minimizing WET test method variability are (1) obtaining a representative effluent sample (2) conducting the toxicity tests properly to generate the biological endpoints and (3) conducting the appropriate statistical analysis to obtain powerful and technically defensible effect concentrations Minimizing variability at each step increases the reliability of the WET test results For example factors that affect variability include sampling procedures sample representativeness deviations from standardized test conditions (eg temperature test duration feeding) test organisms source of dilution water and analyst experience and technique in conducting the toxicity tests properly (Burton et al 1996)
52 Collecting Representative Effluent Samples
The goal of effluent sampling is to obtain a representative sample that reflects real-world biological responses Factors affecting the representativeness of effluent samples may include the sampling location frequency and type (eg composite or grab) and sample volume container preservation methods and holding time Burton et al (1996) concluded that the above factors considerably influence test result variability
Effluent samples must be collected at a location that represents the entire regulated flow or discharge Typically the sampling site is designated in the discharge permit As with sampling for any parameter effluent samples should be collected from a location where the flow is turbulent and well-mixed Additionally effluent samples should be collected at a frequency that enables adequate characterization of the discharge over time (eg accounts for daily to seasonal changes and variations in effluent quality) Major facilities should conduct WET testing monthly or quarterly while minor facilities should conduct WET testing semi-annually or annually
Appropriate sample types should be collected to represent the effluent fully When the effluent is variable collecting composite samples may be necessary When the effluent is less variable grab samples may be sufficient (eg from long-term retention pond facilities)
Sample containers should be non-reactive so that they do not affect sample characteristics Table II of 40 CFR Part 136 requires that toxicity test samples be collected in glass or plastic containers as specified in the methods Sufficient sample volume should be collected for the type of test being conducted including the number of test dilutions When samples are collected in Cubitainersreg headspace should be minimized
Samples must be properly preserved Part 136 of 40 CFR requires that samples for WET testing be cooled to 4EC when shipped off-site and between test sample renewals Samples must be cooled during all phases of collection transportation and storage to minimize physicochemical changes Samples must be tested within the specified maximum holding times before significant changes occur such as volatilization or biological or chemical degradation If samples are not tested within specified maximum holding times the test is invalid and must be repeated by collecting a new effluent sample and conducting a new toxicity test to comply with the NPDES permit
June 30 2000 5-1
Understanding and Accounting for Method Variability in WET Applications Under the NPDES Program
Figure 5-1 Steps to minimize WET test method variability
53 Conducting the Biological Test Methods
Four main components of WET tests afford opportunities to control and minimize variability within tests and within and between laboratories (1) quality control (QC) procedures (2) experimental design (3) test power and (4) test acceptability criteria (TAC) beyond the minimum requirements specified in EPArsquos WET test methods
June 30 2000 5-2
Understanding and Accounting for Method Variability in WET Applications Under the NPDES Program
531 Quality Control Procedures
Quality assurance (QA) practices for toxicity tests address all aspects of the tests that affect data quality These practices include effluent sampling and handling test organism source and condition equipment condition test conditions instrument calibration replication use of reference toxicants recordkeeping and data evaluation The EPA WET toxicity testing manuals specify the minimum requirements for each aspect Regulatory authorities have the discretion to prepare and implement additional guidance beyond the minimum requirements specified in EPArsquos WET test methods
An integral part of the QA program is quality control (QC) The QC procedures are the more focused and routine activities conducted under the overall QA program An important QC component in WET testing is the requirement to conduct reference toxicant tests with effluent tests The WET test methods outline when reference toxicant tests are to be conducted (See sections on quality of test organisms in the manuals) Reference toxicant testing serves two purposes (1) determine the sensitivity of the test organisms over time and (2) assess the comparability of within- and between-laboratory test results Reference toxicant test results can be used to identify potential sources of variability such as test organism health differences among batches of organisms changes in laboratory water or food quality and performance by laboratory technicians In the QA section of each promulgated test method (USEPA 1993 1994a 1994b) EPA recommends sodium chloride potassium chloride cadmium chloride copper sulfate copper chloride sodium dodecyl sulfate and potassium dichromate as suitable reference toxicants The methods do not however specify a particular reference toxicant or the specific test concentrations for each test method
The current characterization of WET test method variability is limited by the ability to quantify sources of within- and between-laboratory variability because laboratories can use different reference toxicants and test concentrations for a particular method Future evaluations of method variability would be greatly enhanced by having data to analyze from multiple laboratories for the same reference toxicant the same dilution water at similar pH and hardness and the same test concentrations By standardizing reference toxicants testing laboratories could compare test results permittees and regulatory authorities could better compare and evaluate laboratories and the data could be used to further quantify within- and between-laboratory test precision Specification of the reference toxicant and test concentrations for a method across laboratories would provide a much larger and consistent data base to assess the comparability of within- and between-laboratory test results
Standardizing reference toxicants and test concentrations has been discussed in the literature For example the chronic methods manual for West Coast species (USEPA 1995) specifies the reference toxicant and test concentrations for each test species The Southern California Toxicity Assessment Group (SCTAG) is comprised of representatives from permittees testing laboratories regulatory authorities and academic institutions that met to discuss technical aspects of WET testing (eg standardization of reference toxicants control charts) The SCTAG (1996) prepared a report to standardize reference toxicants for the chronic freshwater test methods This report evaluated an extensive data base of reference toxicant data The report recommended specific reference toxicants and test concentrations for these methods The SCTAG (1997) also prepared a QAQC checklist to help toxicity testing laboratories establish and maintain appropriate data quality measures Regulatory authorities should review these publications when standardizing reference toxicants
The selection of reference toxicants and test concentrations should be based on specific criteria The following criteria recommended in the SCTAG report provide an excellent basis for selecting standardized reference toxicants
1 The toxicant should provide precise and reliable measures of toxicological sensitivity
2 Toxicant disposal should not be legally or environmentally problematic
June 30 2000 5-3
Understanding and Accounting for Method Variability in WET Applications Under the NPDES Program
3 The toxicant should produce a concentration-response effect for the test organism
4 The toxicant should be quantifiable
5 The toxicant should not pose an unacceptable health hazard to laboratory personnel
6 The toxicant should be readily available
Most recently Warren-Hicks et al (1999) recommended that national acceptance criteria be specified with upper and lower acceptance limits for reference toxicant test results which all laboratories would need to achieve to obtain accreditation Variability could decrease nationally if testing laboratories are provided with more detail on the evaluation and interpretation of reference toxicant control charts (APHA-AWWAshyWEF 1998) For example such guidance could describe how to evaluate test results within the warning limits Both Environment Canada (1990 2000) and APHA-AWWA-WEF (1998) have prepared guidance on evaluating control chart data The Environment Canada (2000) report specifies using zinc as an inorganic reference toxicant and phenol as an organic reference toxicant for many aquatic tests The report also specifies eight criteria for selecting specific reference toxicants
1 Previous use
2 Availability in a pure form
3 Solubility
4 Stability in solution
5 Stability during storage
6 Ease of analysis
7 Stable toxicity with normal changes in qualities of laboratory water
8 Ability to detect abnormal organisms
Regulatory authorities may want to evaluate the above reports and the SCTAG reference toxicant recommendations for the chronic freshwater test methods Regulatory authorities may also want to evaluate and recommend a standard reference toxicant and a specific concentration series for each acute and chronic test method using data from this guidance document
5311 Guidance Related to Quality Control Charts and Laboratory Audits
Ausley (1996) recommends some oversight of data quality such as evaluating tests in meeting QC criteria using randomization procedures and operating in allowed reference toxicant ranges to ensure that QC procedures are properly implemented Another integral component of QC is the maintenance of control charts for reference toxicants and effluents Laboratories should provide regular review of control charts EPA suggests keeping a control chart for each combination of test material test species test conditions and endpoints with a maximum of 20 test results Modern software makes accumulating data and reviewing key test statistics possible with relatively little effort Elementary methods can identify problems contributing to variability Laboratories should practice regular control charting of test PMSDs and control performance for all tests along with control charting of effect concentrations such as NOEC and point estimates for reference toxicants tests Successive tests should be compared occasionally to detect repeated patterns such as one replicatersquos being consistently higher or aberrant or a trend over time Time sequence plots of concentration means and standard deviations would be useful in this regard Occasionally a set of 5 to 20 tests in which block positions (see Appendix A in USEPA 1994b) have been recorded should be subjected to ANOVA for block or position effects If such effects are significant or large the laboratory should seek advice on randomizing the replicates and concentrations
June 30 2000 5-4
Understanding and Accounting for Method Variability in WET Applications Under the NPDES Program
If a laboratoryrsquos CV exceeds the 75th percentile CV from Tables 3-2 through 3-4 EPA recommends calculating warning and control limits based on the 75th and 90th percentiles respectively of CVs for the method and endpoint (Tables 3-2 and 3-3 and Appendix Tables B-1 and B-2) For example suppose the mean EC25 for a series of Ceriodaphnia chronic tests (Method 10020 with reproduction as the endpoint) conducted at one laboratory with reference toxicant is 134 gL NaCl Also suppose that the standard deviation of the EC25s for these tests is 085 The CV for this set of EC25s is thus 063 In Table 3-2 the 75th percentile of CVs for this testrsquos reproduction endpoint is 045 Calculate the standard deviation corresponding to the 75th percentile CV SA75 = 134 times 045 = 060 In Appendix Table B-1 the 90th
percentile of CVs is 062 for this method and endpoint Calculate SA90 = 134 times 062 = 083 Because the CV for this series of EC25s exceeds the 90th percentile reported in Table B-1 EPA recommends the following
bull Set control limits using SA90 = 083
bull Set warning limits using SA75 = 060
bull Promptly take actions to bring results within the control limits and
bull Attempt to bring results within the warning limits in 3-12 months
If the CV for the set of EC25s is less than the 90th percentile reported in Table B-1 use that CV to set control limits If the CV for the set of EC25s is less than the 75th percentile in Table 3-2 do not set warning limits using the latter value
In addition Burton et al (1996) encourage regulatory programs to have a laboratory audit component to document the existence and effectiveness of a QAQC program directed at toxicity testing including analyst training and experience Regulatory authorities should use the National Environment Laboratory Accreditation Program (NELAP) (USEPA 1999a) and routine performance audit inspections to evaluate individual laboratory performance Inspections should evaluate the laboratoryrsquos performance with QC control charts based on reference toxicants examine procedures for conducting the toxicity test procedures and examine procedures for analyzing test results
Regulatory authorities should develop a QC checklist to assist in evaluating and interpreting toxicity test results Appendix E presents examples of State WET implementation procedures related to reviewing reference toxicant data and information on additional QAQC criteria that have been developed and implemented Regulatory authorities should also provide additional guidance related to the interpretation of QC control charts This additional guidance could be that laboratories maintain control charts on within-test variability (eg PMSD) and use warning and control limits based on the 75th and 90th percentiles of CVs for the test method and endpoint
532 Experimental Design
Experimental design includes randomizing the experimental units (ie treatments organisms replicates) establishing the statistical significance level (ie alpha level) and specifying the minimum numbers of replicates test organisms and treatments Oris and Bailer (1993) recommend that test design and TAC be based not only on a minimum level of control performance but also on the ability to detect a particular level of effect (ie test power)
A Type I error (ie ldquofalse positiverdquo) results in the false conclusion that an effluent is toxic when it is not toxic A Type II error (ie ldquofalse negativerdquo) results in the false conclusion that an effluent is not toxic when it actually is toxic Power (1 - beta) is the probability of correctly detecting a true toxic effect (ie declaring an effluent toxic when it is in fact toxic) Acceptable values for alpha range from 001 to 010 (1 to 10 percent) The current EPA test methods recommend an alpha rate of 005 or 5 percent in the toxicity
June 30 2000 5-5
Understanding and Accounting for Method Variability in WET Applications Under the NPDES Program
testing manuals Currently EPA is preparing guidance on when an alpha rate of 001 or 1 percent would be considered acceptable (USEPA 2000a)
5321 False Positives in WET Testing
The hypothesis test procedures prescribed in EPArsquos WET methods provide adequate protection against incorrectly concluding that an effluent is toxic when it is not The expected maximum rate of such errors is the alpha level used in the hypothesis test The hypothesis test procedure is designed to provide an error rate no greater than alpha when the default assumptions are met The statistical flow chart provided with each EPA WET method identifies cases when default assumptions are not satisfied and therefore when data transformations or alternative statistical methods (eg a nonparametric test) should be used
Alpha and beta are related (ie as alpha increases beta decreases) assuming that the sample size (number of treatments number of replicates) size of difference to be detected and variance are held constant The alpha and beta error rates depend on satisfying the assumptions of the hypothesis test To ensure that statistical assumptions and methods are properly applied testing laboratories should review the statistical procedures used to produce WET test results and other factors such as biological and statistical quality assurance and verify that test conditions and test acceptability criteria were achieved
If a test is properly conducted and correctly interpreted identifying any particular outcome as a ldquofalse positiverdquo is impossible An effluent that is deemed toxic may require that the permittee conduct additional toxicity tests to determine if toxicity is re-occurring Even if no toxicity is demonstrated in follow-up tests that does not rule out that the original toxic event was a true toxic spike in the effluent False negatives however impact the environment by allowing the discharge of harmful toxicants without identification This may occur because the toxic effects are not identified as statistically significant due to lack of test sensitivity (see Sections 533 and 64)
Measurement error should not affect the protection against false positives provided by hypothesis tests and confidence intervals when they are appropriately applied Measurement error in the case of WET test treatment mean values likely consists largely of sampling errors (eg variability among organisms or containers) although errors in counting weighing and other procedures may also occur Such sources of imprecision are implicitly accounted for in WET test statistical inferences because the sample variance among the replicates within each treatment (dilution) is used for inference The test ldquosizerdquo 1 - alpha will protect adequately against false positives A larger variance among replicates however could make detecting real toxicity (ie false negatives) more difficult unless the number of replicates is increased to provide more test sensitivity and power which will reduce the rate of false negatives
5322 False Negatives in WET Testing
For a given alpha beta decreases (power increases) as the sample size increases and the variance decreases Decreasing alpha from 005 to 001 without otherwise changing the hypothesis test will reduce the ability of the test to detect toxicity that is will reduce the power of the test Thus as alpha for the hypothesis test is decreased there is an inevitable trade-off between the rate of false positives when toxicity is not present and the ability to detect toxicity when it is present (ie statistical power)
To limit within-test variability and thus increase power EPA developed a minimum significant difference (MSD) criterion that must be achieved in the chronic West Coast marine test methods (USEPA 1995) The MSD is a measure of the within-test variability and represents differences between treatments and the control that can be detected statistically Distributions of the MSD values of multiple tests for a specific reference toxicant and test method can be used to determine the level of test sensitivity achievable by a certain percentage of tests Denton and Norberg-King (1996) analyzed several chronic test methods to quantify the effect size based on the existing toxicity test method experimental design and MSD distributions
June 30 2000 5-6
Understanding and Accounting for Method Variability in WET Applications Under the NPDES Program
Denton and Norberg-King found when setting the beta error rate at 020 (power = 080) the effect size detected varies from at least a 15-percent reduction from the control response for the chronic red abalone larval development test to a 40-percent reduction from the control response for the chronic Ceriodaphnia dubia test In this document EPA has calculated power for each test method (see Section 533)
533 Test Power To Detect Toxic Effects
This section describes the statistical power and ability to detect toxic effects achieved by the current WET methods as inferred from the WET variability data set used to develop this document These inferences are approximate because assumptions of normality and homogeneity of variance were not always satisfied
Power can be characterized only by repeated testing Power is an attribute not of a single test but of a sequence of many tests conducted under similar conditions and with the same test design Therefore in this document EPA used the sample averages for each laboratoryrsquos data set to characterize each laboratory The following two parameters were required (1) the mean endpoint response in the control (growth reproduction survival) and (2) the mean value of the error mean square (EMS) for tests
EPA evaluated the ability to detect toxic effects using three approaches for each test method (1) number of replicates required to detect a 25-percent difference from the control with power of 080 (2) percent difference from the control that can be detected with power of 080 and (3) power to detect a 25shypercent difference from the control All calculations are based on a one-sided two-sample t-test at a level of 095 (alpha of 005) The power for a multiple comparison (Dunnettrsquos or Steelrsquos test) will be less than the power for this two-sample t-test
Table 5-1 summarizes the results for this evaluation Depending on the method between 30 percent and 80 percent of the laboratories were able to detect a 25-percent effect for the sublethal endpoint consistently Between 60 percent and 100 percent of the laboratories were able to detect a 33-percent effect
To examine whether the upper bounds presented in Table 3-6 provide adequate test precision EPA calculated an estimate of the power to detect a 25-percent effect on a sublethal endpoint when the PMSD equals the upper bound reported in Table 3-6 The upper bounds of the PMSD are shown in Table 3-6 in Chapter 3 At the lower PMSD bound the power always exceeded 098 Tests with PMSD equaling the upper bound are not often able to detect a 25-percent effect This finding does not mean that the upper bound is ineffective The PMSD varies between tests and each laboratory has a distribution of PMSDs To avoid exceeding this upper bound often a laboratory would have to achieve substantially lower PMSDs in most tests
5331 Attainment of the PMSD Related to Power
The power of the current experimental design could be reevaluated by comparing it to alternative designs that use increased number of replicates or number of test concentrations (Chapman et al 1996) In this document EPA found that about half of the laboratories in the data set were able routinely to detect a 25-percent difference between control and treatment About two-thirds of the laboratories could routinely detect a 33-percent difference (Table 5-2) For example mere attainment of the 90th percentile PMSD values shown in Table 3-6 will not ensure the ability to detect a 25-percent effect (Table 5-2) If every acceptable test has a PMSD below that upper bound however the average PMSD will be lowered Based on the within-laboratory variability of PMSD1 the average PMSD likely will be substantially lower than the upper bound in Table 3-6 if most tests conducted by a laboratory are to have acceptable PMSDs
The average CV for PMSD is one-third to one-half its mean in commonly used methods
June 30 2000
1
5-7
Understanding and Accounting for Method Variability in WET Applications Under the NPDES Program
Table 5-1 Tests for Chronic Toxicity Power and Ability To Detect a Toxic Effect on the Sublethal Endpoint
Test Method No
Labs
No Labs with Power
Power (Range)
No Labs Having Power at Least 08 To Detect
Effect of
Effect Detected with Power 08 as Percent of
Control Mean (Range)$$ 08 $$ 05 25 33
10000 Fathead Minnow 19 6 14 021 - 100 6 13 82 - 62
10020 Ceriodaphnia 33 10 29 038 - 100 10 19 14 - 45
10030 Green Alga 9 7 8 033 - 099 7 8 13 - 49
10040 Sheepshead Minnow 5 4 5 077 - 100 4 5 86 - 26
10060 Inland Silverside 16 7 13 023 - 097 7 12 17 - 59
10070 Mysid (growth) 10 5 8 021 - 091 5 8 21 - 70
Note Power was calculated for a two-sample one-sided t-test at alpha = 005 for a 25-percent difference from the control Effect size detected was calculated for the same test using power 080 Calculations used the average EMS from all tests at each laboratory and the minimum number of replicates reported for those tests Calculations assumed that the parametric mean and variance equal the corresponding sample estimates They also assumed approximate normality of means and homogeneity of variance Because these assumptions may be violated the results here are approximate By saying ldquodetect a 25-percent difference from controlrdquo this alternative hypothesis is intended (control mean - treatment mean) gt 025 times control mean
Table 5-2 Power To Detect a 25-Percent Difference from the Control at the 90th Percentile PMSD
Chronic Method Replicates 90th Percentiles
of PMSD
Three Treatments
Four Treatments
Five Treatments
alpha = 005
alpha = 0053
alpha = 005
alpha = 0054
alpha = 005
alpha = 0055
10000 Fathead Minnow 3 35 039 025 039 019 039 015
4 35 041 030 042 026 043 023
10020 Ceriodaphnia 10 37 039 031 041 030 043 030
10030 Green Alga 3 35 039 025 039 019 039 015
4 35 041 030 042 026 043 023
10040 Sheepshead Minnow 3 23 072 069 072 062 073 055
4 23 073 071 074 068 075 066
10060 Inland Silverside 3 23 072 069 072 062 073 055
4 23 073 071 074 068 075 066
10070 Mysid 8 32 048 041 050 040 052 040
Notes Values are rounded to two significant figures Number of treatments is the number of concentrations compared with the control in the hypothesis test The calculations assumed (1) the usual assumptions of the test are satisfied (approximate normality homogeneity of variances) and (2) equal replication in treatments and control Because these assumptions may be violated the results here are approximate Because the MSDmean implies a value for [root (error mean square)mean] the latter could be calculated from the MSD Dunnettrsquos critical value and the number of replicates and then used in a calculation of power Calculations apply to a one-sided two-sample t-test of equal means assuming equal variances and equal replication with hypotheses Hocontrol mean - treatment mean = 0 versus Hacontrol mean - treatment mean gt 025 times control mean The power achieved by Dunnettrsquos multiple comparison procedure will lie between the two-sample power at alpha = 005 and that for alpha = 005(no of treatments)
June 30 2000 5-8
Understanding and Accounting for Method Variability in WET Applications Under the NPDES Program
Testing laboratories and permittees can examine the EMS or MSD in Tables B-14 and B-15 (Appendix B) to estimate the ability of a WET test to detect toxic effects Some regulatory authorities may require a comparison between the control and the receiving water concentration which requires a two-sample one-sided t-test Others may require the multiple comparisons procedure described in the EPA WET methods (Dunnettrsquos or Steelrsquos tests one-sided with alpha of 005) The power of Dunnettrsquos procedure falls between the power of the one-sided two-sample t-test with alpha of 005 and alpha of 001 assuming that no more than five toxicant concentrations are compared to a control The power of Steelrsquos procedure will be related to and should usually increase with the power of Dunnettrsquos procedure and the t-tests Tables B-14 and B-15 in Appendix B also provide an appropriate guide to achieving power using a nonparametric test
Recently the State of Washington (1997) issued guidance specifying an acute and chronic statistical power standard to be achieved for compliance testing EPArsquos sediment toxicity testing manuals (USEPA 1994c USEPA 2000) include power curves for various numbers of experimental units CV ranges and associated alpha and beta levels Sheppard (1999) is a good source to provide a simple explanation of how power helps determine how large a sample should be Additional information on power may be obtained at httpwwwpsychologieuni-trierde8000projectsgpowerliteraturehtml
EPA recommends that regulatory authorities specify in their State WET implementation procedures that individual test results achieve a level of within-test sensitivity by using the upper and lower PMSD test sensitivity bounds (see Section 64) To achieve the test sensitivity bounds testing laboratories may need to minimize within-test variability (eg EMS) or increase the number of replicates tested or both If laboratories cannot achieve PMSD values of less than 25 percent for the toxicity test methods that require a minimum of only three replicates (Methods 10000 10040 10060) then the numbers of replicates may need to be increased Appendix B (Section B4) provides information related to the number of replicates needed and discusses the relationship between test power and effect size achieved The magnitude of the effect size achieved relates to the test sensitivity
54 Test Acceptability Criteria
EPA test methods have specific TAC that the effluent and reference toxicant tests must meet A test is considered invalid if the TACs are not met The recommended test conditions for each test method specify the minimum requirements and the TAC For example control survival must be 80 percent or greater and average control reproduction at least 15 young per surviving female in the chronic Ceriodaphnia dubia survival and reproduction test
The chronic West Coast marine methods (USEPA 1995) require additional TAC For example to limit the degree of within-test variability the methods specify a maximum allowable value for PMSD (see Section 532 on experimental design) Some States have additional TAC in their State WET implementation policies North Carolina (1998) for example requires that the chronic Ceriodaphnia dubia analyses meet an additional TAC of complete third brood neonate production by at least 80 percent of the control organisms and that the control reproduction CV be less than 40 percent
Additional TAC might be specified to minimize variability among replicates Variability of any toxicity test result is influenced by the number of replicates used number of organisms tested and variability among replicates at each test concentration and the control Variability among replicates has been quantified by treatment CV EMS or MSD The application of a maximum acceptable value for CV or MSD helps ensure adequate laboratory QAQC and increases the reliability of submitted data One benefit of requiring a maximum allowable within-test variability limit is that laboratories will improve culturing test handling and housekeeping which are usually incorporated into the laboratoriesrsquo standard operating procedures For example the CV requirement might be incorporated directly into the NPDES permit Sample EPA Region 6 permit language reads
June 30 2000 5-9
Understanding and Accounting for Method Variability in WET Applications Under the NPDES Program
1 The coefficient of variation between replicates shall be less than or equal to 40 percent in the control
2 The coefficient of variation between replicates shall be less than or equal to 40 percent at the instream waste concentration (IWC)
3 Test failure may not be construed or reported as invalid due to a CV of greater than 40 percent A repeat test shall be conducted within the required reporting period if any test is determined to be invalid
Occasionally statistical analyses indicate a test failure when as little as 15-percent mortality has occurred in a test dilution Permit language has been developed to address this occurrence as in the following example
If all TAC conditions are met and the percent survival of the test organism is greater than or equal to 80 percent (in a chronic test) or 90 percent (in an acute test) in the critical dilution concentration and all lower dilution concentrations the test shall be considered to be a valid test and the PERMITTEES shall report an NOEC of not less than the critical dilution for the discharge monitoring report (DMR) reporting requirements
Regulatory authorities may consider providing guidance or imposing additional TAC such as those implemented by EPA Region 6 or like some States have implemented (North Carolina 1998 Washington 1997) Appendix E provides additional examples of States that have implemented further guidance on WET QAQC procedures and TAC Warren-Hicks (1999) also recommended that additional national TAC be established for each test method (eg upper and lower bounds on the MSD) Therefore EPA recommends that regulatory authorities require that additional TACs be implemented in permits to minimize within-test variability and increase test sensitivity (see Section 64 and Appendix C for sample permit language)
55 Conducting the Statistical Analysis To Determine the Effect Concentration
EPA test methods currently recommend two statistical approaches to estimate a chemical or effluent concentration for each biological effect endpoint (eg survival growth and reproduction) One approach is to derive the NOEC by hypothesis testing which equates biological significance with statistical significance The second approach is to estimate an effect concentration that reduces the control response by 25 percent for chronic methods The expanded use of WET tests in the NPDES program has brought increased attention to the statistical analysis of toxicity test data A common goal for both regulatory authorities and permittees is to confirm that the effect concentrations were derived correctly using the appropriate analysis approaches Reliable effect concentrations lead to increased confidence in the data used for making regulatory decisions such as determining reasonable potential deriving a permit limit or monitoring trigger and generating self-monitoring test results
Another important consideration in conducting statistical analyses is the inconsistent use of statistical programs The proliferation of statistical packages has been helpful in data analysis however these packages also can result in the misapplication of the statistical methods APCA-AWWA-WEF (1998) cautions the user to confirm the results of each analysis with each package before accepting them The data user is responsible for evaluating all data submitted to the regulatory authorities
The 1995 SETAC Pellston Workshop discussed unresolved scientific issues and highlighted significant research needs associated with WET testing The attendees recommended the following
Immediately instigate studies to evaluate improvements in the statistical analysis of WET test data These studies should include but not necessarily be limited to the following activities
5-10 June 30 2000
Understanding and Accounting for Method Variability in WET Applications Under the NPDES Program
(a) investigate the implications of concurrent application of NOECMSD tests of bioequivalence and ECp estimators (Chapman et al 1996a)
In response to this recommendation EPA began projects to evaluate the bioequivalence approach and additional point estimate models for the WET program At present two test methods are being used for this evaluation (1) the chronic Ceriodaphnia dubia survival and reproduction tests and (2) the giant kelp germination and germ-tube length test with reference toxicants
The bioequivalence approach poses the following question Do the mean responses of the effluent concentration and the control differ by more than some amount For example the control response and the response at the critical effluent concentration (ie instream waste concentration) must differ by no more than a fixed value in order to accept the hypothesis of no significant difference (ie no toxicity) This approach could address the concern that an imprecise test might not detect toxicity when toxicity is present or that a small but statistically significant effect would detect toxicity that may not be biologically important Some researchers have suggested that the bioequivalence approach could provide a positive incentive for dischargers to produce test results with lower within-test variability to demonstrate that no toxicity occurs at a level greater than a biologically (bioequivalence approach) significant amount (Shukla et al 2000 Wang et al 2000)
Bailer et al (2000) evaluated the proposed regression-based estimators with the current EPA point estimate models They found that it appears reasonable to incorporate parametric estimation models in the WET program Bailer et al (2000) concluded that these models are appropriate for all response scales (ie dichotomous count and continuous) and can incorporate monotonicity without bias However confidence intervals still need to be developed for these parametric models
In this document EPA has not recommended either the bioequivalence or additional point estimate models to supplement the current statistical approaches as described in the testing manuals An independent peer-reviewed workshop should be convened to evaluate the benefits of these alternative statistical approaches to enhance the statistical approaches currently applied
56 Chapter Conclusions
In this chapter EPA provides guidance to permittees and testing laboratories on collecting representative effluent samples conducting the biological test methods and evaluating the statistical analyses EPA recommends that States implement the lower and upper PMSD test sensitivity bounds to achieve an acceptable level of test sensitivity and minimize within-test variability (see Section 64) EPA also provides guidance to permittees and testing laboratories on the number of replicates required to achieve the PMSD bounds Testing laboratories should maintain and evaluate both effluent and reference toxicant data using a measure of within-test variability such as the PMSD
Permittees and toxicity testing laboratories may need to increase replication in order to reduce PMSD below the upper bound Table B-15 can be used for initial planning of replication given knowledge of typical values of the error mean square (EMS) or MSD and the number of concentrations used in the multiple comparison hypothesis test To ensure that all PMSD values fall below the upper bound in Table 3-6 a laboratory would select the largest EMS value experienced in its past testing
EPA recommends that testing laboratories require a minimum of four replicates for the fathead minnow sheepshead minnow and inland silverside chronic test methods (Methods 10000 10040 and 10060 respectively) Four replicates are needed to execute the statistical flow chart when a nonparametric test is needed Three replicates are also sometimes insufficient to keep PMSD below the recommended upper bound In addition four replicates are needed to help achieve the upper PMSD bound
June 30 2000 5-11
Understanding and Accounting for Method Variability in WET Applications Under the NPDES Program
This page intentionally left blank
5-12 June 30 2000
60 GUIDANCE TO REGULATORY AUTHORITIES DETERMINING REASONABLE POTENTIAL AND DERIVING WET PERMIT CONDITIONS
EPA developed the TSD (USEPA 1991a) to support implementation of national policy to control the discharge of toxic pollutants The TSD presents a statistical approach for determining the need for and the method of deriving water quality-based effluent limits (WQBELs) based on aquatic life (including WET) human health and wildlife criteria This approach accounts for the uncertainty associated with small data sets and data variability by assuming a statistical distribution of effluent data (usually lognormal) and calculating a CV or using a default CV to describe data variability
61 Analytical and Sampling Variability in Calculations for Reasonable Potential and Permit Limits
Section 61 discusses use of the CV of sample measurements of toxicity to make a reasonable potential determination and to calculate permit limits Two points must be understood (1) this CV is to be calculated using toxic unit (TU) values (USEPA 1991a) (see Section 62) and (2) EPA strongly recommends that point estimates (not NOEC or LOEC values) be used to calculate the TU values (USEPA 1994a 1994b)
Water quality-based effluent limits are required when a discharge causes has reasonable potential to cause or contributes to an instream excursion above a water quality standard Throughout this document EPA uses the commonly understood shorthand reference ldquoreasonable potentialrdquo to refer to this standard for determining the need for a water quality-based effluent limit
611 ldquoAdjusting for Analytical Variabilityrdquo in Calculations for Reasonable Potential and Permit Limits
Adjustment approaches (see Appendix G3) have been suggested to ldquoadjust for analytical variabilityrdquo when deriving permit limits and determining the need for a WET limit in the first place EPA does not recommend these adjustment approaches (Appendix G3) and strongly reaffirms the statistical approach and methods for calculating permit limits provided in the TSD (USEPA 1991a) EPA recommends that regulatory authorities use the statistical approach and calculation methods in the TSD The TSD methods were designed to provide a reasonable degree of protection for water quality (ie to avoid exceedances of water quality criteria) while providing a reasonable degree of protection from the variability of effluent toxicity and analytical variability The various ldquoadjustmentrdquo approaches would undermine these objectives
The TSD limit calculation for a point source can be divided into two steps first convert the wasteload allocation (WLA) to a long-term average (LTA) and then convert the LTA to effluent limits (maximum daily average weekly and average monthly limits) WET limit calculations include an intermediate step in which the acute WLA is converted to a WLAac These calculations employ a facility-specific CV based upon effluent sampling data The TSD approach uses this CV in both steps
Adjustment approaches intended to account for analytical variability discussed in detail in Appendix G would inappropriately use different CVs in these two steps The first step would use an estimate of the CV of ldquotruerdquo effluent toxicity which is smaller than the CV for measured toxicities This approach would result in a larger calculated LTA The second step would use the CV for the measured toxicities which is the same CV used in both steps of the TSD approach
Use of such adjustment approaches would frequently result in setting an average monthly permit limit (AML) that exceeds the chronic WLA Appendix G demonstrates that such outcomes (ie the AML exceeds
June 30 2000 6-1
Understanding and Accounting for Method Variability in WET Applications Under the NPDES Program
the chronic WLA) generally can be expected to occur when various adjustment approaches are used Appendix G Table G-1 presents a numerical example of how an adjustment approach would allow calculation of an AML exceeding the chronic WLA (a four-day average value) even when sampling frequency for the calculation is set at the recommended minimum of four samples per month [It is acceptable for the maximum daily limit (MDL) which applies to a single sample to exceed the chronic WLA It is also acceptable for the AML to exceed the chronic WLA if the AML calculation is based on fewer than four samples per month Note however that the TSD recommends always assuming at least four samples per month when calculating the AML]
The TSD reasonable potential calculation first calculates the percentile represented by the maximum observed TU value For example the maximum of 10 reported TU values is identified with the 63rd
percentile Then the sample CV is used to project the 95th or 99th percentile TU value using a table of reasonable potential multiplying factors This value is combined with the appropriate mixing-zone dilution to project a maximum receiving water toxicity which is compared with the applicable water-quality criterion If an adjustment were applied to the reasonable potential calculation the CV would be adjusted downward and the maximum projected receiving water toxicity would be smaller This would make a determination of need for a permit limit less likely
Because of these considerations EPA strongly recommends that no adjustment be made to the CV or variance of toxicity either for reasonable potential or permit limit calculations The TSD statistical approaches already account for analytical variability appropriately EPA continues to recommend the TSD approach which ensures that effluent limits and thereby measured effluent toxicity or pollutant parameter concentrations are consistent with calculated WLAs
612 Analytical Variability and Self-monitoring Data
EPA determines compliance with permit limits on the basis of self-monitoring data and these data include some measure of analytical variability The influence of analytical variability is accounted for in the TSD statistical procedures used to set water-quality limits and determine the potential for toxicity as explained in Appendix G
The permittee is responsible for ensuring that measured discharge toxicity never exceeds the permit limits No special allowance is made for analytical variability in assessing compliance The maximum discharge toxicity should incorporate a margin of safety which will account for sampling and analytical variability In other words to avoid exceeding permit limits the facilityrsquos treatment system should be designed so that the maximum toxicity is somewhat lower than its permit limits
613 Precision of WET Measurements and Estimates of Effluent CV
Single measurements on effluent involve some uncertainties about the true concentration or toxicity related to representativeness of the sample including sample holding time and conditions and the analytical measurement system Like all analytical measurements WET measurements (NOEC EC25 LC50) are inexact That is the exact toxicity of an analyte in a sample can be specified only within some range This imprecision can be reduced by using a suitable number of organisms and replicates for each test (see Section 532 on experimental design)
The numbers of organisms and replicates required for EPA WET method test acceptability are specified as minimums Test precision will be approximately proportional to the square root of the number of replicates Thus doubling the number of replicates may decrease the MSD to approximately 70 percent of its former value Increased replication also tightens the confidence interval for a point estimate of the effect concentration (eg EC25 and LC50)
June 30 2000 6-2
Understanding and Accounting for Method Variability in WET Applications Under the NPDES Program
EPA strongly recommends that toxicity measurements of an effluent be obtained at least quarterly for three years to provide a good basis for determining the need for limits and for calculating limits One year should be regarded as the minimum duration needed to characterize effluent variability (due to seasonal stream flow or process fluctuations) and ten the minimum number of measurements unless scientific and technical knowledge supports a shorter period as representative of the distribution of pollutant types and concentrations of toxicity
Estimates based on multiple measurements involve the same uncertainties that apply to single measurements They also may involve larger uncertainties related to sampling error that is the chance that typical levels of toxicity or concentrations of pollutant may not be encountered during the sampling program The sampling program may not fully characterize effluent variability if too few samples are taken the sampling times and dates are not representative or the duration of the sampling program is not long enough to represent the full range of effluent variability When determining the need for limits and calculating limits the variance or the CV of toxicity measurements is key The larger the number of samples the more precise is the estimate Confidence intervals for the variance and CV can be calculated and carried through the calculations for reasonable potential and effluent limits (Appendix G) Even when assumptions are not strictly met confidence intervals provide a useful perspective on the uncertainty of the results and the need for more samples The minimum number of measurements recommended for calculating estimates of the CV for effluent toxicity is 10
614 Between-Laboratory Variability
Between-laboratory variability may increase the CV as discussed in Section 611 if the toxicity tests were conducted by more than one laboratory for a specific facility A concern to permittees is that this may increase the likelihood of making a finding of reasonable potential
Within-laboratory variability is the component of analytical variability that should be reflected in regulatory calculations If the data used for reasonable potential or permit limit calculations are effluent measurement data reported by at least two laboratories there are ways to appropriately estimate the variance to be used in TSD statistical calculations
For example
bull If the same laboratories continue to be used in the same proportion or frequency and the measurements from the individual laboratories represent different sampling dates the measurement data can be treated as if they were generated by a single laboratory This approach may increase the estimated variance and the AML which is not in the interest of the permittee Selecting one laboratory for future monitoring based on the variance of its reported reference toxicant test results should mitigate this problem
bull If only one laboratory has reported data on each sampling date and the other laboratories report over different time spans or over the same time span on alternating dates EPA recommends forming a pooled estimate of variance Calculate the sample variance (S2) of log(TU) for each laboratory separately and combine these using the formula
pooled variance of log(X) = [(N1 - 1)S12 + (N2 - 1)S2
2] [(N1 - 1) + (N2 - 1)]
An analogous formula is used for more than two laboratories The same result can be obtained by conducting a one-way analysis of variance on log(TU) (with laboratories treated as the groups or classes) and using the reported EMS
June 30 2000 6-3
Understanding and Accounting for Method Variability in WET Applications Under the NPDES Program
Changing a laboratory may change analytical (within-laboratory) variability of measurements and test sensitivity (ie PMSD values) That is the average effect concentration may change (eg Warren-Hicks et al 1999) Ideally the permittee will anticipate and plan for a change of testing laboratory Permittees should compare reference toxicant test data for current and candidate replacement laboratories selecting one with acceptable variability and a similar average effect concentration
62 Determining Reasonable Potential and Establishing Effluent Limits
Effluent characterization is an essential step in determining the need for an NPDES permit limit NPDES regulations under 40 CFR Part 12244(d)(1)(ii) specify that reasonable potential include ldquowhether a discharge causes has the reasonable potential to cause or contributes to an instream excursion above a State water quality standardrdquo Calculations for reasonable potential determination and for permit limits should follow EPA guidance in the TSD (USEPA 1991a) In particular the TSD statistical methods should be used Such calculations should use TUs for WET data not effect concentrations (percent whole effluent) Toxic units are defined (USEPA 1991a Chapter 131 page 6) as the reciprocal of the effect concentration times 100 where the effect concentration is expressed as a percentage of whole effluent thus TUa = 100 LC50 and TUc = 100ECp
When characterizing an effluent to determine whether a permit limit is necessary permit writers can use the available effluent WET data and a water-quality model to perform a reasonable potential analysis The TSD outlines the statistical approach This approach uses existing effluent data to project a maximum pollutant concentration or a maximum toxicity in the effluent (USEPA 1991a) The projected maximum concentration or toxicity is used as an input in the water quality model to determine whether the effluent has the reasonable potential to cause or contribute to an excursion of ambient water quality criteria If reasonable potential exists the permit writer must derive a WET permit limit for that facility1
The variability of the existing effluent data as measured by the CV has a significant effect on the projected maximum pollutant concentration or toxicity The higher the CV the higher the projected maximum and the more likely that there is reasonable potential and a limit is needed EPA recommends that regulatory authorities use all valid relevant and representative data in making reasonable potential determinations EPA is developing a national policy clarifying use of the TSD procedures for determining reasonable potential for WET Important components of this policy include specifying the minimum number of valid WET tests necessary to calculate facility-specific CVs2 as well as recommending a step-wise approach to determining the need for WET permit limits This approach reflects a strong preference by EPA and its stakeholders to rely on facility-specific WET testing based on adequate frequency and duration of effluent sampling for making reasonable potential determinations for toxicity
EPA recommends that point estimates be used to estimate effluent variability to determine the need for limits and to set permit limits This is recommended whether the self-monitoring test results will be determined using hypothesis tests or point estimates Point estimates have less analytical variability than NOECs using current experimental designs as shown in Chapter 3 Point estimates make the best use of the WET test data for purposes of estimating the CV LTA and RP factor and calculating the permit limit
1 When the State has narrative criteria for toxicity and the TIETRE identifies a specific chemical that is the source of toxicity the permit writer may include a chemical-specific limit for that parameter instead of a WET permit limit in accordance with 40 CFR Part 12244(d)(v)
2 If fewer than ten data points are available the regulatory authority must use a default CV As a result the need for a WET permit limit may be based on a default value rather than actual data
June 30 2000 6-4
Understanding and Accounting for Method Variability in WET Applications Under the NPDES Program
63 Development of a Total Maximum Daily Load for WET
Total maximum daily loads (TMDLs) may be indicated when there is acute or chronic toxicity in a waterbody leading to the listing of the waterbody as impaired under CWA Section 303(d) and when there are multiple sources of the toxicity EPA believes that TMDL calculations should be performed on the pollutants causing toxicity whenever possible In these situations EPA suggests that the first step of the analysis is to conduct ambient toxicity identification evaluations to identify the pollutant(s) and the source(s) causing the toxicity Once the pollutant(s) and source(s) causing toxicity have been identified for the waterbody then a TMDL should be developed for the individual pollutant(s)
64 Accounting for and Minimizing Variability In the Regulatory Decision Process
A common goal for the permittee and the regulatory authority is to have confidence in the test results from the biological and statistical procedures Both permittees and regulatory authorities would then have more confidence in taking regulatory actions such as evaluating multiple effluent samples to determine reasonable potential and derive permit conditions (eg permit limits monitoring triggers) If steps such as collecting a representative effluent sample to conducting the toxicity tests properly as discussed in Sections 52 through 54 and requiring additional TACs (Section 641) are used to reduce or minimize within-test variability then the reliability of the WET test results increases
641 Recommended Additional TACs Lower and Upper Bounds for PMSD
Reference toxicant data from a large number of tests and laboratories were used to generate PMSD values percentiles of these values are reported in Table 3-6 The MSD represents the smallest difference between the control mean and a treatment mean that leads to the statistical rejection of the null hypothesis (ie no toxicity) using Dunnettrsquos multiple comparison test MSD values are divided by the control mean and multiplied by 100 to produce a ldquopercent MSDrdquo (PMSD) value The PMSD allows comparison of different tests and represents the smallest significant difference from the control as a percentage of the control mean Thus it represents the smallest significant value of the relative difference [100 (control mean shytreatment mean)control mean] The MSD is often expressed as a percentage of the biological endpoint in the control response
The following formula is used to calculate MSD (as recommended by USEPA 1995)
MSD ds w (1n1) (1n)
where d = critical value for the Dunnettrsquos procedure
sw = the square root of the error mean square (EMS) n1 = number of experimental units in the control treatment n = the number of experimental units per treatment assuming an equal number at all other
treatments
Percent MSD is calculated as follows MSDPMSD times 100
control mean
EPA recommends that regulatory authorities implement both the lower and upper PMSD bound approach to minimize within-test variability when using hypothesis testing approaches to report an NOEC The implementation of the upper PMSD bound should also apply when using point estimate techniques There are five possible outcomes for regulatory decisions (see Figure 6-1) Two outcomes imply unqualified acceptance of the WET test statistical result
June 30 2000 6-5
Understanding and Accounting for Method Variability in WET Applications Under the NPDES Program
1 Unqualified PassndashThe testrsquos PMSD is within bounds and there is no significant difference between the means for the control and the instream waste concentration (IWC) treatment The regulatory authority would conclude that there is no toxicity at the IWC concentration
2 Unqualified FailndashThe testrsquos PMSD is larger than the lower bound (but not greater than the upper bound) in Table 3-6 and there is a significant difference between the means for the control and the IWC treatment The regulatory authority would conclude that there is toxicity at the IWC concentration
3 Lacks Test SensitivityndashThe testrsquos PMSD exceeds the upper bound in Table 3-6 and there is no significant difference between the means for the control and the IWC treatment The test is considered invalid A new effluent sample must be collected and another toxicity test must be conducted
4 Lacks Test SensitivityndashThe testrsquos PMSD exceeds the upper bound in Table 3-6 and there is a significant difference between the means for the control and the IWC treatment The test is considered valid The regulatory authority would conclude that there is toxicity at the IWC concentration
5 Very Small but Significant DifferencendashThe relative difference (see Section 642 below) between the means for the control and the IWC treatment is smaller than the lower bound in Table 3-6 and this difference is statistically significant The test is acceptable The NOEC is determined as described in Section 642 below
Test Unacceptable Lacks Sensitivity
Very Small Determine the NOEC
(Section 642)
PASS
FAIL
MIN
MAX (0c - 0IWC) = PMSD
Percent Minimum
Significant Difference
MIN MAX(0 - 0IWC)c
0 = control meanc
0IWC = instream waste concentration mean
Figure 6-1 Paradigm that incorporates the lower and upper percent minimum significant difference
Regulatory authorities should examine the sample permit language as provided in Appendix C for incorporation of the PMSD bound language in a NPDES permit
Note that ldquounqualified acceptancerdquo of a WET test result requires that all of the following must be achieved (1) collect the effluent sample properly (2) conduct the toxicity test methods as specified in the toxicity manuals (3) meet the required TACs (4) meet the proper water quality parameters (eg temperature pH) and (5) conduct the proper statistical calculations All these conditions must be reviewed and deemed acceptable before a test is evaluated for self-monitoring data and reporting
June 30 2000 6-6
Understanding and Accounting for Method Variability in WET Applications Under the NPDES Program
Figure 6-2 provides a decision tree that regulatory authorities can use when implementing the lower and upper PMSD bounds
Use Data for Calculating Reasonable Potential Limit Self-Monitoring Data
KEY PMSD = Percent minimum
significant difference MT = Monitoring trigger TAC = Test acceptability criteria WQ = Water quality
Verify TAC
Check WQ Parameters
amp Test Conditions
Calculate amp Report PMSD
Calculate Statistical Endpoints
Conduct Toxicity Tests
Evaluate Test Data
Continue Routine Testing
Conduct Additional Tests
Determine NOEC According to 643
Repeat Test with New Effluent Sample
Within PMSD Bounds
amp IS NOT Significant
at IWC
Within PMSD Bounds amp IS Significant
at IWC Exceeds Upper
PMSD Bound amp IS Significant
at IWC
Exceeds Upper PMSD
Bound amp IS NOT
Significant at IWC
Below Lower
PMSD Bound amp IS Significant
at IWC
5
1
4
2
3
Figure 6-2 Implementing applications of upper and lower PMSD bounds for effluent toxicity testing requirements
June 30 2000 6-7
Understanding and Accounting for Method Variability in WET Applications Under the NPDES Program
642 How to Determine the NOEC Using the Lower PMSD Bound
If the permit specifies that self-monitoring data are to be generated using hypothesis testing approaches then the analyst should report the NOEC as the following Find the smallest concentration for which (a) the treatment mean differs significantly from the control mean and (b) the relative difference (see example below) is not smaller than the 10th percentile in Table 3-6 Therefore the NOEC is the next smaller test concentration
In other words concentrations having a very small relative difference with control (smaller than the lower PMSD bound) would be treated as if they do not differ significantly from control (even if they do so) for the purpose of determining the NOEC
Table 6-1 illustrates the application of the lower PMSD bound for the reproduction endpoint of a Ceriodaphnia chronic test In this example the testrsquos PMSD was 99 smaller than the 10th percentile value of 11 found in Table 3-6 The IWC concentration differed significantly from the control The test falls under outcome number 5 a significant but very small difference at the IWC The first step is to calculate the relative differences from control (Table 6-1) as [(control mean - treatment mean) divided by (control mean)] times 100 The next step is to determine which relative differences exceed the PMSD lower bound 11 in this case (see the last column of Table 6-1) Finally the NOEC is determined as described above The NOEC is 125 percent effluent for this example
Table 6-1 Example of Applying the Lower PMSD Bound for the Chronic Ceriodaphnia Test with the Reproduction Endpoint
Concentration (percent effluent)
Reproduction (mean of ten replicates)
Relative Difference
from Control
Does Relative Difference Exceed 11
100 508 82 Yes
50 124 56 Yes
25 234 17 Yes
IWC = 125 253 10 No
625 261 74 No
Control 282 0 No
NOTE The lower PMSD bound for this method and endpoint is 11 (Table 3-6) In this example the NOEC is 625 percent effluent using the testrsquos (very small) PMSD Therefore the reported NOEC should be 125 percent effluent after applying the lower PMSD bound
Differs statistically from the control as determined by MSD = 28 neonates Thus treatment means that are less than 282 - 28 = 254 would be statistically significant These correspond to relative differences greater than 100 (28 282) = 99 percent
643 Justification for Implementing the Test Sensitivity Bounds
A lower bound is needed to avoid penalizing laboratories that achieve unusually high precision The 10th percentile PMSD represents a practical limit to the sensitivity of the test method because few laboratories are able to achieve such precision on a regular basis and most do not achieve it even occasionally Several independent researchers have evaluated and provide support for using the MSD approach as additional TAC for the toxicity test methods Thursby et al (1997) advocate and provide reasons for using an empirical data base of minimum significant differences to provide TAC using statistical performance assessment The State of California (Hunt et al 1996 Starrett et al 1993) and the West Coast marine toxicity test methods (USEPA 1995) have implemented an upper PMSD bound to minimize insensitive tests Also the State of North Carolina has implemented additional requirements for the Ceriodaphnia chronic tests that reduced method
June 30 2000 6-8
Understanding and Accounting for Method Variability in WET Applications Under the NPDES Program
variability North Carolinarsquos evaluation of these additional TACs and subsequent improvements in test sensitivity appears in Appendix F
The North Carolina data base affords the opportunity to evaluate the effectiveness of additional TAC and changes to the toxicity test procedures as they relate to the variability of WET test results (see Appendix F) For example for PMSD the median value decreased from 21 percent to 16 percent while the 90th percentile decreased from 39 percent to 31 percent indicating an overall increase in test sensitivity The range in median values across all laboratories before adopting additional TACs was 12 percent to 36 percent After adopting additional TACs the range in median values was 10 percent to 27 percent indicating a decrease in the overall spread between laboratories The range in control CVs within a laboratory was from 21 percent to 79 percent before adopting TACs compared to the range in control CVs within a laboratory after adopting TACs which was narrowed to 17 percent to 36 percent Overall laboratories are generating data with more consistency within and between laboratories after implementation of the additional TACs and additional method guidance provided by the State for the chronic Ceriodaphnia dubia test method
644 Guidance to Testing Laboratories on How to Achieve the Range of Performance for PMSD
EPA recommends that regulatory authorities use the upper bounds (90th percentiles for PMSD in Table 3-6) to identify tests that are insufficiently sensitive If PMSD exceeds this upper bound more often than occasionally the laboratory should thoroughly investigate ways to reduce variability There are three principal ways to reduce PMSD (1) decrease within-test variability (that is decrease the error mean square and therefore the standard deviation at each concentration) (2) increase the control mean and (3) increase the number of replicates The number of replicates required could be determined by trial-and-error calculations using the error mean square values obtained from a series of WET tests At least 20 tests are recommended The number ldquonrdquo in the formula for MSD (number of replicates) would be increased and MSD re-calculated for each error mean square value This approach uses a sample of tests specific to a particular laboratory and reveals the variation among tests This approach would demonstrate how many replicates would be needed to achieve the upper PMSD bound as required in Table 3-6
65 Additional Guidance That Regulatory Authorities Should Implement to Further Support the WET Program
As discussed in Section 53 regulatory authorities have the discretion to develop and implement additional WET program requirements and guidance to ensure that WET test method variability is reduced by specifying additional guidance beyond the minimum requirements of EPArsquos WET test methodrsquos QAQC and TACs Appendix E provides a snapshot of State approaches to implementing NPDES WET programs to minimize WET test variability
These State approaches include WET information to assist the regulated community with the following
bull Guidance regarding the evaluation of reference toxicant and effluent test results
bull Guidance regarding how the State reviews reference toxicant data for laboratory performance
bull Guidance regarding additional QAQC criteria the State has developed and implemented
bull Guidance regarding efforts the State has made to minimize test method variability
bull Description of how the State reviews or conducts performance laboratory audits
bull Description of specific implementation guidance that the State has developed to assist permit writers
bull Description of how the State provides or uses toxicity test training
June 30 2000 6-9
Understanding and Accounting for Method Variability in WET Applications Under the NPDES Program
States contemplating such changes should consult with EPA to ensure the changes will be appropriate in the context of the Statersquos overall NPDES WET program In addition States should implement a step-wise approach to address toxicity when the permit limit or monitoring trigger is exceeded in their State WET implementation plans
For example when an effluent is deemed toxic then the permittee should take appropriate steps to demonstrate the magnitude frequency and potential source(s) of the toxicity The components of the stepshywise approach could include increased frequency of toxicity testing to characterize the magnitude and frequency of toxicity If continued toxicity is demonstrated then the permittee could conduct a Toxicity Reduction EvaluationToxicity Identification Evaluation (TRETIE) with toxic effluent sample(s) (USEPA 1991b 1992) For example EPA Regions 9 and 10 have prepared WET implementation guidance to assist their States (Denton and Narvaez 1996) This guidance provides sample permit language for a step-wise approach to address toxic samples (see Appendix C)
66 Chapter Conclusions
The TSD statistical approach to reasonable potential determination and permit limit derivation considers combined effluent and analytical variability through the CV of measured effluent values Because determination of effluent variability is based on empirical measurements the variability estimated for effluent measurements includes the variability of pollutant levels sampling variability and a smaller component owed to method variability Steps should be taken to reduce these sources of variability EPA believes that the TSD statistical procedures are appropriately protective in considering both effluent and analytical variability in reasonable potential and effluent limit calculations
EPA recommends that regulatory authorities use a sampling program that conducts at least ten representative WET tests over a period of three years to represent the full range of effluent variability Regulatory authorities should use recommended procedures in the TSD to determine when numeric WET limits or WET monitoring triggers are needed Other permit conditions may include monitoring triggers such as increased toxicity testing TREsTIEs and follow-up actions initiated because a permit limit is exceeded or a monitoring trigger is not met Regulatory authorities should implement the additional test sensitivity requirements by requiring that each test result not exceed the upper PMSD bound In addition regulatory authorities should determine the appropriate NOEC for test results below the lower PMSD bound as described in Section 642 These efforts should lead to increased confidence in the effect concentrations that are generated to evaluate self-monitoring data
6-10 June 30 2000
70 CONCLUSIONS AND GUIDANCE TO LABORATORIES PERMITTEES AND REGULATORY AUTHORITIES
This document was prepared to address whole effluent toxicity (WET) test variability The document has three goals (1) quantify the variability of promulgated test methods and report a coefficient of variation (CV) as a measure of test method variability (2) evaluate the statistical methods described in the TSD for determining the need for and deriving WET permit conditions and (3) suggest guidance for regulatory authorities on approaches to address and minimize test method variability This document quantified the variability of toxicity test methods based on the end use of the data that is the effect concentrations (eg NOEC LC50 EC25) The within-laboratory variability of these effect concentrations was quantified by obtaining multiple test results under similar test conditions using the same reference toxicant The major conclusions of this document are discussed below
71 General Conclusions
bull EPArsquos Technical Support Document for Water Quality-based Toxics Control (referred to as the TSD) presents guidance for developing effluent limits based on three key components (1) water quality criteria (2) a calculated dilution factor used to derive a waste load allocation (WLA) from the criteria and (3) a statistical calculation procedure that uses a CV based on effluent data to calculate effluent limits from the WLA EPArsquos TSD statistical approach is appropriately protective regarding both effluent and analytical variability provided that the criteria and WLA are derived correctly It is inappropriate to adjust the TSD statistical methodology for determining when water quality-based effluent limits are needed and for calculating such limits (Section 6 and Appendix G)
bull EPArsquos analysis indicates that the TSD approach appropriately accounts for both effluent variability and method variability EPA does not believe a reasonable alternative approach is available to determine a factor that would discount the effects of method variability using the TSD procedures (Section 611 and Appendix G)
bull Interim CVs are identified for promulgated WET test methods [Appendix A Table A-1 (acute methods) and Table A-2 (chronic methods)] pending completion of between-laboratory studies which may affect these interim CV estimates
bull Comparisons of WET method precision with method precision for analytes commonly limited in the National Pollutant Discharge Elimination System (NPDES) permits clearly demonstrate that the variability of the promulgated WET methods is within the range of variability experienced in other types of analyses Several researchers also noted that method performance improves when prescribed methods are followed closely by experienced analysts (Section 43)
bull The hypothesis test procedures prescribed in EPArsquos WET methods will provide adequate protection against false conclusions that an effluent is toxic However the incidence of false negatives can be high because of high within-test variability making it difficult to detect toxicity when toxicity is truly present Therefore evaluating the power of current experimental designs is desirable EPA expects that regulatory authorities will make prompt and measurable progress toward the goal of requiring all WET tests to detect a toxic effect of 25 percent to 33 percent with power of 080 (Section 533 and Appendix B4)
bull Quality assurance problems became apparent when evaluating the data for this study especially for the metal reference toxicants and sodium dodecyl sulfate (SDS) Standardizing the choice of reference toxicant and the concentrations to be tested may be appropriate as well as establishing bounds on the range of acceptable effect concentrations for each test method As a result
June 30 2000 7-1
Understanding and Accounting for Method Variability in WET Applications Under the NPDES Program
quantifying between-laboratory variability will be difficult unless these issues can be resolved (Section 531 and Appendix G25)
bull The data analysis did not reveal the potential sources and causes of variability such as using different sources of test organisms dilution water and food To assess the sources of variability fully experimenters must carefully design new studies (Section 531)
72 Recommendations for Minimizing Variability and Its Effects
Three critical areas are identified to minimize WET test method variability
bull Obtaining a representative effluent sample
bull Conducting the toxicity tests properly to generate biological endpoints and
bull Calculating the appropriate statistical endpoints to have confidence in the effect concentration
This document provides guidance to toxicity testing laboratories permittees and regulatory authorities in conducting biological and statistical methods and evaluating test effect concentrations It also develops guidance for regulatory authorities on approaches to address and minimize test method variability The principal aspects of the guidance are presented in Table 3-6 and re-presented here
Range of Relative Variability for Endpoints of Promulgated WET Methods Defined by the 10th
and 90th Percentiles from the Data Set of Reference Toxicant Testsa
Test Methodb Endpointc No of Labs
No of Tests
PMSD Control CVd
10th 90th 10th 90th
10000 Fathead Minnow G 19 205 94 35 0035 020
10020 Ceriodaphnia dubia R 33 393 11 37 0089 042
10030 Green Alga G 9 85 93 23 0034 017
10040 Sheepshead Minnow G 5 57 63 23 0034 013
10060 Inland Silverside G 18 193 12 35 0044 018
10070 Mysid G 10 130 12 32 0088 028
20000 Fathead Minnow S 20 217 42 30 0 0074
20020 Ceriodaphnia S 23 241 50 21 0 011
20040 Sheepshead Minnow S 5 65 0e 55 0 0
20060 Inland Silverside S 5 48 70 41 0 0079
20070 Mysid (A bahia) S 3 32 51 26 0 0081
20110 Mysid (H costata) S 2 14 18 47 0 0074
20210 Daphnia (D magna) S 5 48 53 23 0 011
20220 Daphnia (D pulex) S 6 57 58 23 0 011 a The precision of the data warrants only three significant figures When determining agreement with these values one may
round off values to two significant figures (eg values gt345000 and 35000 are rounded to 35) Method 10090 (red macroalga) is not reported because it is inadvisable to characterize method variability using only 23 tests from just two laboratories
b EPA did not assign method numbers for acute methods in EPA6004-90027F The numbers assigned here were created for use in this document and in related materials and data bases G = growth R = reproduction S = survival
d CVs were calculated using untransformed control means for each test e An MSD of zero will not occur when the EPA flow chart for statistical analysis is followed In this report MSD was
calculated for every test including those for which the flow chart would require a nonparametric hypothesis test EPA recommends using the value 42 (the 10th percentile shown for the fathead minnow acute test) in place of zero as the 10th
percentile PMSD (lower PMSD bound) for the sheepshead minnow acute test
June 30 2000 7-2
c
Understanding and Accounting for Method Variability in WET Applications Under the NPDES Program
721 Guidance to Toxicity Testing Laboratories
bull Testing laboratories should maintain quality assurancequality control (QAQC) control charts for percent minimum significant difference (PMSD) along with the statistical endpoints such as NOEC LC50 and EC25 Testing laboratories should regularly plot the individual raw test data and the average treatment responses to examine possible causes of excessive variability (Section 5311)
bull The minimum number of replicates for the chronic toxicity tests should be four for the chronic fathead minnow sheepshead minnow and inland silverside test methods (Sections 5331 and 56)
bull Testing laboratories should take steps to ensure that the test PMSD does not exceed the upper bound provided in the table above (Sections 33 533 and 64 and Table 3-6) This may require ensuring more uniformity among test organisms andor using more replicates Tables are provided to aid in choosing the number of replicates (Tables B-14 and B-15)
bull Testing laboratories should examine the power tables to ensure that test results will meet the recommended test sensitivity criteria These tables can be used to make decisions about replication given the knowledge of typical values for error mean square (EMS) and number of tested concentrations (Section 533 and Tables B-9 through B-15)
722 Guidance to NPDES Permittees
bull Permittees should select and conduct all data analyses with one qualified toxicity testing laboratory to determine reasonable potential derive permit limits and generate self-monitoring test results Conducting all effluent testing consistently using one reference toxicant is also prudent (Section 614 and Appendix G25)
bull Permittees should generate WET data (n = 10) that have been accumulated over a year or more to fully characterize effluent variability over time The sampling dates and times should span a sufficient duration to represent the full range of effluent variability (Sections 613 and 62 and Appendix G24)
bull Permittees should examine testing laboratoriesrsquo QAQC control charts If the CV for reference toxicant tests is greater than the 75th percentile in Tables 3-2 through 3-4 variability can likely be reduced even if the individual EC25 and LC50 values fall within the control limits (Section 5311)
bull Permittees should examine toxicity test data to ensure that data being submitted to regulatory authorities meet specified effluent holding times temperature laboratory control limits and test acceptability criteria such as requirements for test sensitivity lower and upper PMSD bounds (Sections 52 through 54)
bull Permittees should anticipate and plan for a change if switching to a different testing laboratory The permittee should compare reference toxicant test data from the current laboratory with data from the candidate replacement laboratory in order to ensure acceptable variability and a similar average effect (Section 614)
June 30 2000 7-3
Understanding and Accounting for Method Variability in WET Applications Under the NPDES Program
73 Guidance to Regulatory Authorities
Guidance to Regulatory Authorities Related to Determining Reasonable Potential and Deriving Permit Limits
bull Regulatory authorities should use EPArsquos recommended statistical approach in deriving permit limitations The statistical approach outlined in the TSD represents an effective and appropriately protective approach to effluent limit development (Section 61 and Appendix G1)
bull Regulatory authorities should calculate the facility-specific CV using point estimate techniques to determine the need for and derive a permit limit even if the self-monitoring test results will be determined using hypothesis test procedures (Sections 341 and 62)
bull Regulatory authorities that need to cite a characteristic CV for a promulgated method may use Tables A-1 and A-2 in Appendix A which show the median CV from Tables 3-2 through 3-4 pending completion of between-laboratory studies
bull EPA recommends that regulatory authorities implement a step-wise approach to address toxicity This approach can determine the magnitude and frequency of toxicity and appropriate follow-up actions for test results that indicate exceedance of a monitoring trigger or a permit limit (Section 65)
Guidance to Regulatory Authorities Related to Collecting Effluent Samples Conducting the Toxicity Test and Evaluating the Effect Concentrations
bull Regulatory authorities should design a sampling program that collects representative effluent samples to fully characterize effluent variability for a specific facility over time At least 10 samples are needed to estimate a variance or CV with acceptable precision for a specific facility (Sections 613 and 62)
bull Regulatory authorities should ensure that statistical procedures and test methods have been properly applied to produce WET test results Evaluating other factors and data such as biological and statistical quality assurance and ensuring that test conditions and test acceptability criteria (TAC) have been met would be prudent (Sections 52 through 55)
bull Regulatory authorities should apply both the upper and lower bounds using the PMSD as an additional TAC (Section 64 and Table 3-6) The State of North Carolina implemented an effective WET program that required additional TAC and guidance for test methods that served to minimize test method variability (Appendix F)
bull Regulatory authorities should develop a QC checklist to assist in evaluating and interpreting toxicity test results (Section 5311) See Appendix E for examples of State WET implementation procedures
bull Regulatory authorities should consider participation in the National Environment Laboratory Accreditation Program and should conduct routine performance audit inspections to evaluate individual laboratory performance Inspections should evaluate the laboratoryrsquos performance with QC control charts based on reference toxicants examine procedures for conducting the toxicity test procedures and examine procedures for analyzing test results (Section 5311)
bull Regulatory authorities should incorporate revised technical guidance recently published by EPA captioned ldquoMethod Guidance and Recommendations for Whole Effluent Toxicity (WET) Testingrdquo
June 30 2000 7-4
Understanding and Accounting for Method Variability in WET Applications Under the NPDES Program
(40 CFR Part 136) (USEPA 2000a) The guidance addresses (1) error rate assumption adjustments (2) concentration-response relationships (3) incorporation of confidence intervals (4) acceptable dilution waters for testing (5) guidance on blocking by parentage for the chronic C dubia test method and (6) procedures for controlling pH drift
74 Future Directions
bull An independent peer-reviewed workshop should be convened to evaluate alternatives to the statistical approaches currently used in EPArsquos WET test methods Such a workshop might suggest alternatives regarding (1) WET statistical flowcharts (2) WET statistical methods used to estimate effect concentrations and (3) test data interpretation and review guidelines (Section 55)
bull Such a workshop might also evaluate additional QC requirements and recommendations regarding the specification of a reference toxicant and the concentrations to be tested for each test method (Section 531)
June 30 2000 7-5
Understanding and Accounting for Method Variability in WET Applications Under the NPDES Program
This page intentionally left blank
June 30 2000 7-6
80 BIBLIOGRAPHY
Anderson BS JW Hunt SL Turpen AR Coulon M Martin DL Denton and FH Palmer 1990 Procedures Manual for Conducting Toxicity Tests Developed by the Marine Bioassay Project California State Water Resources Control Board No 90-10WQ
Anderson SL and TJ Norberg-King 1991 Precision of short-term chronic toxicity tests in the real world Environ Toxicol Chem 10(2)143ndash145
APHA-AWWA-WEF 1998 Standard Methods for the Examination of Water and Wastewater (20th Edition) LS Clesceri AE Greenberg and A Eaton eds American Public Health Association American Water Works Association and Water Environment Federation Washington DC ISBN 0-87553-235shy7WB
American Society for Testing and Materials (ASTM) 1992 Standard Practice for Conducting an Interlaboratory Study To Determine the Precision of a Test Method E691-92
ASTM 1998 Standard Practice for Determination of Precision and Bias of Applicable Test Methods of Committee D-19 on Water D2777
Ausley LW 1996 Effluent toxicity testing variability In Whole Effluent Toxicity Testing An Evaluation of Methods and Prediction of Receiving System Impacts DR Grothe KL Dickson and DK Reed-Judkins eds Pensacola FL SETAC Press 157ndash171
Bailer AJ MR Hughes DL Denton and JT Oris 2000 An empirical comparison of effective concentration estimators for evaluating aquatic toxicity test responses Environ Toxicol Chem 19(1) 141-150
Biomonitoring Science Advisory Board (BSAB) 1994 West Coast Marine Species Chronic Protocol Variability Study Washington Department of Ecology Olympia WA
Burton GA A Raymon LA Ausley JA Black GM DeGraeve FA Fulk JF Heltshe WH Peltier JJ Pletl and JH Rodgers 1996 Session 4 Effluent toxicity test variability In Whole Effluent Toxicity Testing An Evaluation of Methods and Prediction of Receiving System Impacts DR Grothe KL Dickson and DK Reed-Judkins eds Pensacola FL SETAC Press 131ndash156
Chapman GA 1992 Sea Urchin (Strongylocentrotus purpuratus) Fertilization Test Method USEPA ERL-Narragansett Pacific Ecosystems Branch Newport OR
Chapman GA BS Anderson AJ Bailer RB Baird R Berger DT Burton DL Denton WL Goodfellow MA Heber LL McDonald TJ Norberg-King and PL Ruffier 1996a Discussion synopsis methods and appropriate endpoints In Whole Effluent Toxicity Testing An Evaluation of Methods and Prediction of Receiving System Impacts DR Grothe KL Dickson and DK Reed-Judkins eds Pensacola FL SETAC Press 51-82
Chapman PF M Crane J Wiles F Noppert and E McIndoe 1996b Improving the quality of statistics in regulatory ecotoxicity tests Ecotoxicol 5169-186
Chapman PM RS Caldwell and PF Chapman 1996c A warning NOECs are inappropriate for regulatory use Environ Toxicol Chem 1577ndash79
June 30 2000 8-1
Understanding and Accounting for Method Variability in WET Applications Under the NPDES Program
Collett D 1991 Modelling Binary Data London Chapman amp Hall
Commonwealth of Virginia 1993 Toxics Management Program Implementation Guidance
Davis RB AJ Bailer and JT Oris 1998 Effects of organism allocation on toxicity test results Environ Toxicol Chem 17(5) 928-931
DeGraeve GM JD Cooney BH Marsh TL Pollock NG Reichenbach JH Dean and MD Marcus 1991 Variability in the performance of the seven-day fathead minnow (Pimephales promelas) larval survival and growth test A within- and among-laboratory study Environ Toxicol Chem 10(9)1189ndash1203
DeGraeve GM JD Cooney BH Marsh TL Pollock and NG Reichenbach 1992 Variability in the performance of the 7-d Ceriodaphnia dubia survival and reproduction test A within- and among-laboratory study Environ Toxicol Chem 11(6)851ndash866
DeGraeve GM G Smith W Clement D McIntyre and T Forgette 1998 WET Testing Program Evaluation of Practices and Implementation Water Environment Research Foundation Project 94shyHHE-1 Alexandria VA
Denton DL and TJ Norberg-King 1996 Whole effluent toxicity statistics A regulatory perspective In Whole Effluent Toxicity Testing An Evaluation of Methods and Prediction of Receiving System Impacts DR Grothe KL Dickson and DK Reed-Judkins eds Pensacola FL SETAC Press 83ndash102
Denton DL and M Narvaez 1996 Regions 9 and 10 Guidance for Implementing Whole Effluent Toxicity Testing Programs U S Environmental Protection Agency Regions 9 and 10 May
Denton DL AL Suer BS Anderson and JW Hunt 1992 Precision of marine critical life stage tests with west coast species (abstract) In Society of Environmental Toxicology and Chemistry (SETAC) Abstracts 13th Annual Meeting November 8-12 1992 Cincinnati OH Pensacola FL SETAC Press 184
Dhaliwal BS RJ Dolan CW Batts JM Kelly RW Smith and S Johnson 1997 Warning replacing NOECs with point estimates may not solve regulatory contradictions Environ Toxicol Chem 16124ndash126
Dinnel PJ J Link and Q Stober 1987 Improved methodology for sea urchin sperm cell bioassay for marine waters Arch Environ Contam Toxicol 1623ndash32
Dunnett CW 1964 New tables for multiple comparisons with a control Biometrics 20482-491
Eagleson KW SW Tedder and LW Ausley 1986 Strategy for whole effluent toxicity evaluations in North Carolina In Aquatic Toxicology and Environmental Fate Ninth Volume ASTM STP 921 TM Poston R Purdy eds American Society for Testing and Materials Philadelphia PA 154-160
Environment Canada 1990 Guidance Document on Control of Toxicity Test Precision Using Reference Toxicants Ottawa Ontario Environmental Protection Conservation and Protection Report EPSIRM12
June 30 2000 8-2
Understanding and Accounting for Method Variability in WET Applications Under the NPDES Program
Environment Canada 2000 Guidance Document on Application and Interpretation of Single-species Tests in Environmental Toxicology Ottawa Ontario Environmental Technology Centre Method Development and Application Section Report EPS 1RM34
Erickson RJ LT Brooke MD Kahl F Vende SL Venter T Harting P Markee and RL Spehar 1998 Effects of laboratory test conditions on the toxicity of silver to aquatic organisms Environ Toxicol Chem 17(4) 572-578
Fulk FA 1996 Whole effluent toxicity testing variability A statistical perspective In Whole Effluent Toxicity Testing An Evaluation of Methods and Prediction of Receiving System Impacts DR Grothe KL Dickson and DK Reed-Judkins eds Pensacola FL SETAC Press 172ndash179
Grothe DR and RA Kimerle 1985 Inter- and intralaboratory variability in Daphnia magna effluent toxicity test results Environ Toxicol Chem 4(2)189ndash192
Grothe DR RA Kimerle and CD Malloch 1990 A perspective on biological assessments Water Environ Technol pp 1707ndash1710
Grothe DR KL Dickson and DK Reed-Judkins eds 1996 Whole Effluent Toxicity Testing An Evaluation of Methods and Prediction of Receiving System Impacts Pensacola FL SETAC Press
Hunt JW BS Anderson S Tudor MD Stephenson HM Puckett FH Palmer and MW Reeve 1996 Marine Bioassay Project Eighth Report Sacramento CA State Water Resources Control Board Report 85-102
Kahn HD and MB Rubin 1989 Use of statistical methods in industrial water pollution control regulations in the United States Environ Monitor Assess 12129ndash148
Moore TF SP Canton and M Grimes 2000 Investigation of the incidence of type I errors for chronic whole effluent toxicity testing using Ceriodaphnia dubia Environ Toxicol Chem 19(1)118-122
Morrison GE E Torelo R Comeleo R Walsh A Kuhn R Burgess M Tagliabue and W Green 1989 Interlaboratory precision of saltwater short-term chronic toxicity tests Res J Wat Pollut Control Fed 611707-1710
New Jersey Department of Environmental Protection 1994 The Use of Chronic Whole Effluent Toxicity Testing in the New Jersey Pollutant Discharge Elimination SystemmdashAn Assessment of Compliance Data
North Carolina Department of Environment and Natural Resources 1998 North Carolina Biological Laboratory CertificationCriteria Procedures Document Division of Water Quality Water Quality Section Raleigh NC
Oris JT and AJ Bailer 1993 Statistical analysis of the Ceriodaphnia toxicity test Sample size determination for reproductive effects Environ Toxicol Chem 12(1)85ndash90
Rosebrock MM NW Bedwell and LW Ausley 1994 Indicators of Ceriodaphnia dubia chronic toxicity test performance and sensitivity Poster presentation Society of Environmental Toxicology and Chemistry 15th Annual Meeting Denver CO
June 30 2000 8-3
Understanding and Accounting for Method Variability in WET Applications Under the NPDES Program
Rue WJ JA Fava and DR Grothe 1988 A review of inter- and intralaboratory effluent toxicity test method variability In Aquatic Toxicology and Hazard Assessment (10th Volume) WJ Adams GA Chapman and WG Landis eds ASTM STP 971
SAS Institute 1990 SASSTA Userrsquos Guide (4th Edition) Version 6 Cary NC
Sheppard CR 1999 How large should my sample be Some quick guides to sample size and the power of tests Mar Pollut Bull 38(6)439-477
Shukla R Q Wang FA Fulk C Deng and DL Denton 2000 Bioequivalence approach for whole effluent toxicity testing Environ Toxicol Chem 19(1)169-174
Southern California Toxicity Assessment Group (SCTAG) 1996 Reference Toxicant Standardization and Use in Toxicity Testing JR Gully RB Baird PJ Markle and JP Bottomley eds First Report Fountain Valley CA
SCTAG 1997 Laboratory Practices Checklist Toxicity Testing (3rd Edition) Fountain Valley CA
Starrett GL DL Denton and RW Smith 1993 Sensitivity of toxicity test protocols and the need for additional quality assurance requirements (abstract) In Society of Environmental Toxicology and Chemistry (SETAC) Abstracts 14th Annual Meeting November 14-18 1993 Houston TX Pensacola FL SETAC Press P106 p 183
Thursby GB J Heltshe and KJ Scott 1997 Revised approach to toxicity test acceptability criteria using a statistical performance assessment Environ Toxicol Chem 161322-1329
TOXISreg [computer software] Ojai CA EcoAnalysis Inc
TOXCALCreg [computer software] McKinleyville CA TidePool Scientific Software
USEPA 1985 Methods for Measuring the Acute Toxicity of Effluents to Freshwater and Marine Organisms (3rd Edition) W Peltier and CI Weber eds Environmental Monitoring Systems Laboratory Cincinnati OH EPA6004-85013
USEPA 1988 Short-term Methods for Estimating the Chronic Toxicity of Effects of Receiving Water to MarineEstuarine Organisms (1st Edition) CI Weber WB Horning DJ Klemm TW Neiheisel PA Lewis EL Robinson JR Menkedick FA Kessler eds Office of Research and Development Cincinnati OH EPA6004-87028
USEPA 1989 Short-term Methods for Estimating the Chronic Toxicity of Effluents and Receiving Waters to Freshwater Organisms (2nd Edition) CI Weber WH Peltier TJ Norberg-King WB Homing II FA Kessler JR Menkedick TW Neiheisel PA Lewis DJ Klemm QH Pickering EL Robinson JM Lazorchak LJ Wymer RW Freyberg eds Office of Research and Development Cincinnati OH EPA6004-89001
USEPA 1989a Generalized Methodology for Conducting Industrial Toxicity Reduction Evaluations (TREs) Office of Research and Development Cincinnati OH EPA600-2-88-070
USEPA 1989b Toxicity Reduction Evaluation Protocol for Municipal Wastewater Treatment Plants Office of Research and Development Washington DC EPA6002-88-062
June 30 2000 8-4
Understanding and Accounting for Method Variability in WET Applications Under the NPDES Program
USEPA 1989c Methods for Aquatic Toxicity Identification Evaluations Phase II Toxicity Identification Procedures Office of Research and Development Washington DC EPA6003-88-035
USEPA 1989d Methods for Aquatic Toxicity Identification Evaluations Phase III Toxicity Confirmation Procedures Office of Research and Development Washington DC EPA6003-88-036
USEPA1991a Technical Support Document for Water Quality-based Toxics Control Office of Water Washington DC EPA5052-90-001
USEPA 1991b Methods for Aquatic Toxicity Identification Evaluations Phase I Toxicity Characterization Procedures (2nd Edition) TJ Norberg-King DI Mount EJ Durhan GT Ankley LP Burkhard JR Amato MT Lukasewycz MK Schubauer-Berigan and L Anderson-Carnahan eds Office of Research and Development Washington DC EPA6006-91-003
USEPA 1992 Toxicity Identification Evaluation Characterization of Chronically Toxic Effluents Phase I TJ Norberg-King DI Mount JR Amato DA Jensen and JA Thompson eds Office of Research and Development Washington DC EPA6006-91-005F
USEPA 1993 Methods for Measuring the Acute Toxicity of Effluents and Receiving Waters to Freshwater and Marine Organisms (4th Edition) CI Weber ed Office of Research and Development Cincinnati OH EPA6004-90027F
USEPA 1993a Methods for Aquatic Toxicity Identification Evaluations Phase II Toxicity Identification Procedures for Samples Exhibiting Acute and Chronic Toxicity Office of Research and Development Washington DC EPA600R-92-080
USEPA 1993b Methods for Aquatic Toxicity Identification Evaluations Phase III Toxicity Identification Procedures for Acutely and Chronically Toxic Samples US Environmental Protection Agency Duluth MN EPA600R-92-081
USEPA 1994a Short-term Methods for Estimating the Chronic Toxicity of Effluents and Receiving Waters to Marine and Estuarine Organisms (2nd Edition) DJ Klemm GE Morrison TJ Norberg-King WH Peltier and MA Heber eds Office of Research and Development Cincinnati OH EPA6004shy91003
USEPA 1994b Short-term Methods for Estimating the Chronic Toxicity of Effluents and Receiving Waters to Freshwater Organisms (3rd Edition) PA Lewis DJ Klemm JM Lazorchak TJ Norberg-King WH Peltier and MA Heber eds Office of Research and Development Cincinnati OH EPA6004shy91002
USEPA 1994c Short-term Methods for Estimating the Sediment Toxicity of Effluents and Receiving Waters to Freshwater and Estuarine Organisms Office of Research and Development Duluth MN EPA600R-94-001
USEPA 1995 Short-term Methods for Estimating the Chronic Toxicity of Effluents and Receiving Waters to West Coast Marine and Estuarine Organisms GA Chapman DL Denton and JM Lazorchak eds Office of Research and Development Cincinnati OH EPA600R-95-136
USEPA 1996a NPDES Permit Writerrsquos Manual Office of Water Washington DC EPA833B-96-003
USEPA 1996b Guide to Method Flexibility and Approval of EPA Water Methods EPA821D-96-004
June 30 2000 8-5
Understanding and Accounting for Method Variability in WET Applications Under the NPDES Program
USEPA 1999a National Environmental Laboratory Accreditation Conference Constitution Bylaws and Standards Office of Research and Development Washington DC EPA600R-99-068
USEPA 1999b Toxicity Reduction Evaluation Guidance for Municipal Wastewater Treatment Plants (2nd
Edition) Office of Water Washington DC EPA833B-99-002
USEPA 1999c Errata for Effluent and Receiving Water Toxicity Test Manuals Acute Toxicity manuals Acute Toxicity of Effluents and Receiving Waters to Freshwater and Marine Organisms Short-Term methods for Estimating the Chronic Toxicity of Effluents and Receiving Waters to Freshwater Organisms and Short-Term Methods for Estimating the Chronic Toxicity of Effluents and Receiving Waters to Marine and Estuaraine Organisms Office of Research and Development Duluth MN
USEPA 2000a Method Guidance and Recommendations for Whole Effluent Toxicity (WET) Testing (40 CFR Part 136) Office of Water Office of Science and Technology Washington DC EPA821B-00shy004
USEPA 2000b Methods for Measuring the Toxicity and Bioaccumulation of Sediment-Associated Contaminants with Freshwater Invertebrates (2nd Edition) Office of Research and Development Duluth MN EPA600R-99064
Wang Q DL Denton and R Shukla 2000 Applications and statistical properties of minimum significant difference-based criterion testing in a toxicity testing program Environ Toxicol Chem 19(1)113-117
Warren-Hicks W BR Parkhurst D Moore and S Teed 1999 Whole Effluent Toxicity Testing Methods Accounting for Variance Water Environment Research Foundation Project 95-PQL-1 ISBN 1shy893664-01-5
Washington State Department of Ecology 1997 Laboratory Guidance and Whole Effluent Toxicity Test Review Criteria Publication No WQ-R-95-80
Washington State Department of Ecology 1998 Whole Effluent Toxicity (WET) Program Evaluation Publication No 98-03
Whitehouse P M Crane CJ Redshaw and C Turner 1996 Aquatic toxicity tests for the control of effluent discharges in the UK The influence of test precision Ecotoxicol 5155-168
June 30 2000 8-6

Understanding and Accounting for Method Variability in WET Applications Under the NPDES Program
This page intentionally left blank
June 30 2000 ii
NOTICE AND DISCLAIMER
This document provides guidance to NPDES regulatory authorities and persons interested in whole effluent toxicity testing This document describes what EPA believes to be sources of variability in the conduct of whole effluent toxicity testing under the Clean Water Act The document is designed to reflect national policy on these issues The document does not however substitute for the Clean Water Act an NPDES permit or EPA or State regulations applicable to permits or whole effluent toxicity testing nor is this document a permit or a regulation itself The document does not and cannot impose any legally binding requirements on EPA States NPDES permittees andor laboratories conducting whole effluent toxicity testing for permittees (or for States in the evaluation of ambient water quality) EPA and State officials retain discretion to adopt approaches on a case-by-case basis that differ from this guidance based on an analysis of site-specific circumstances This guidance may be revised without public notice to reflect changes in EPA policy
June 30 2000 iii
Understanding and Accounting for Method Variability in WET Applications Under the NPDES Program
This page intentionally left blank
June 30 2000 iv
TABLE OF CONTENTS
Acknowledgments ix Executive Summary xi List of Acronyms and Abbreviations xv Glossary xvii 10 INTRODUCTION 1-1
11 Background 1-1 12 Effect of This Guidance 1-2 13 Three Goals of This Document 1-2
20 DEFINITION AND MEASUREMENT OF METHOD VARIABILITY IN WET TESTING 2-1 21 Terms and Definitions 2-1 22 Defining WET Test Variability 2-1 23 Quantifying WET Test Variability 2-2
30 VARIABILITY OF WET TEST METHODS 3-1 31 Acquisition Selection and Quality Assurance of Data Presented in this Document 3-1 32 Variability of EC25 LC50 and NOEC 3-2
321 Within-Laboratory Variability of EC25 LC50 and NOEC 3-2 322 Between-Laboratory Variability of EC25 LC50 and NOEC 3-7
33 Variability of Endpoint Measurements 3-8 34 Conclusions about Variability of WET Methods 3-10
341 Variability of EC25 LC50 NOEC 3-10 342 Variability of Endpoint Measurements 3-11
40 VARIABILITY IN CONTEXT 4-1 41 Society of Environmental Toxicology and Chemistry Pellston WET Workshop 4-1
411 General Conclusions and Recommendations 4-1 412 Conclusions about Data Precision 4-2
42 Water Environment Research Foundation Study 4-3 43 Minimizing Variability by Adhering to WET Methods 4-3 44 Conclusion 4-4
50 GUIDANCE TO REGULATORY AUTHORITIES LABORATORIES AND PERMITTEES GENERATING AND EVALUATING EFFECT CONCENTRATIONS 5-1 51 Steps for Minimizing Test Method Variability 5-1 52 Collecting Representative Effluent Samples 5-1 53 Conducting the Biological Test Methods 5-2
531 Quality Control Procedures 5-3 532 Experimental Design 5-5 533 Test Power to Detect Toxic Effects 5-7
54 Test Acceptability Criteria 5-9 55 Conducting the Statistical Analysis To Determine the Effect Concentration 5-10 56 Chapter Conclusions 5-11
June 30 2000 v
Understanding and Accounting for Method Variability in WET Applications Under the NPDES Program
TABLE OF CONTENTS (continued)
60 GUIDANCE TO REGULATORY AUTHORITIES DETERMINING REASONABLE POTENTIAL AND DERIVING WET PERMIT CONDITIONS 6-1 61 Analytical and Sampling Variability in Calculations for Reasonable
Potential and Permit Limits 6-1 611 ldquoAdjusting for Analytical Variabilityrdquo in Calculations
for Reasonable Potential and Permit Limits 6-1 612 Analytical Variability and Self-monitoring Data 6-2 613 Precision of WET Measurements and Estimates of Effluent CV 6-2 614 Between-Laboratory Variability 6-3
62 Determining Reasonable Potential and Establishing Effluent Limits 6-4 63 Development of a Total Maximum Daily Load for WET 6-5 64 Accounting for and Minimizing Variability in the Regulatory Decision Process 6-5
641 Recommended Additional TACs Lower and Upper Bounds for PMSD 6-5
642 How To Determine the NOEC Using the Lower PMSD Bound 6-8 643 Justification for Implementing the Test Sensitivity Bounds 6-8 644 Guidance to Testing Laboratories on How to Achieve
the Range of Performance for PMSD 6-9 65 Additional Guidance That Regulatory Authorities Should Implement
to Further Support the WET Program 6-9 66 Chapter Conclusions 6-10
70 CONCLUSIONS AND GUIDANCE TO LABORATORIES PERMITTEES and REGULATORY AUTHORITIES 7-1 71 General Conclusions 7-1 72 Recommendations for Minimizing Variability and Its Effects 7-2
721 Guidance to Toxicity Testing Laboratories 7-3 722 Guidance to NPDES Permittees 7-3
73 Guidance to Regulatory Authorities 7-4 74 Future Directions 7-5
80 BIBLIOGRAPHY 8-1
Appendix A Interim Coefficients of Variation Observed Within Laboratories for Reference Toxicant Samples Analyzed Using EPArsquos Promulgated Whole Effluent Toxicity Methods
Appendix B Supplementary Information for Reference Toxicity Data
Appendix C Sample Calculation of Permit Limits Using EPArsquos Statistically-Based Methodology and Sample Permit Language
Appendix D Frequently Asked Questions (FAQs)
Appendix E Examples of Selected State WET Implementation Programs
Appendix F Improvements in Minimizing WET Test Variability by the State of North Carolina
Appendix G Analytical Variability in Reasonable Potential and Permit Limit Calculations
June 30 2000 vi
Understanding and Accounting for Method Variability in WET Applications Under the NPDES Program
List of Tables
3-1 Promulgated WET Methods Included in This Report 3-3 3-2 Quartiles (25th and 75th) and Median (50th) of the Within-Laboratory Values of
CV for EC25 (Chronic Tests) 3-4 3-3 Quartiles (25th and 75th) and Median (50th) of the Within-Laboratory Values of
CV for LC50 3-4 3-4 Quartiles (25th and 75th) and Median (50th) of the Within-Laboratory Values of
CV for NOEC 3-5 3-5 Estimates of Within-Laboratory and Between-Laboratory Components of Variability 3-7 3-6 Range of Relative Variability for Endpoints of Promulgated WET Methods Defined by
the 10th and 90th Percentiles from the Data Set of Reference Toxicant Tests 3-9 3-7 Number of Laboratories Having a Given Percent of Tests Exceeding the PMSD
Upper Bound for the Sublethal Endpoint 3-10 5-1 Tests for Chronic Toxicity Power and Ability To Detect a Toxic Effect
on the Sublethal Endpoint 5-8 5-2 Power to Detect a 25-Percent Difference from the Control at the 90th Percentile PMSD 5-8 6-1 Example of Applying the Lower Bound PMSD for the Chronic Ceriodaphnia Test
with the Reproduction Endpoint 6-8
List of Figures
5-1 Steps to minimize WET test method variability 5-2 6-1 Paradigm that incorporates the lower and upper percent minimum significant difference 6-6 6-2 Implementing applications of upper and lower PMSD bounds
for effluent testing requirements 6-7
June 30 2000 vii
Understanding and Accounting for Method Variability in WET Applications Under the NPDES Program
This page intentionally left blank
June 30 2000 viii
ACKNOWLEDGEMENTS
This guidance was prepared through the cooperative efforts of the US Environshymental Protection Agencyrsquos (EPA) Office
of Wastewater Management and Office of Science and Technology in the Office of Water EPArsquos Office of Research and Development and EPArsquos Office of Enforcement and Compliance Assurance The Cadmus Group Inc provided support for the final document production
EPA Variability Workgroup
Debra Denton EPA Region 9 San Francisco CA John Fox EPA Office of Science and Technology
Washington DC Florence Fulk EPA Office of Research and
Development Cincinnati OH Kathryn Greenwald EPA Office of Enforcement
and Compliance Assurance Washington DC Madonna Narvaez EPA Region 10 Seattle WA Teresa Norberg-King EPA Office of Research and
Development Duluth MN Laura Phillips EPA Office of Wastewater
Management Washington DC
EPA Support Outside of the Variability Workgroup
Gregory Currey EPA Office of Wastewater Management Washington DC
Margarete Heber EPA Office of Wetlands Oceans and Watersheds Washington DC
Phillip Jennings EPA Region 6 Dallas TX Henry Kahn EPA Office of Science and
Technology Washington DC Marion Kelly EPA Office of Science and
Technology Washington DC James Pendergast EPA Office of Wetlands
Oceans and Watersheds Washington DC Stephen Sweeney EPA Office of General
Counsel Washington DC William Telliard EPA Office of Science and
Technology Washington DC Robert Wood EPA Office of Wastewater
Management Washington DC Marcus Zobrist EPA Region 2 New York NY
Contractor Support
The Cadmus Group Inc Durham NC
Karalyn Colopy Susan Conbere Blanche Dean Penelope Kellar
DynCorp Information and Enterprise Technology Inc Alexandria VA
Robert Brent
Science Applications International Corporation Columbia MD
Sidina Dedah Ruth Much Kathleen Stralka
Assistance from States
State Case Example and Chapter 4
EPA especially thanks Larry Ausley and Matt Matthews of the North Carolina Department of Environment and Natural Resources Division of Water Quality for preparing Chapter 4 (Variability in Context) and Appendix F (Improvements in Minimizing WET Test Variability by the State of North Carolina)
State-Specific WET Program Implementation
EPA appreciates the assistance and support from the following States in providing their State-specific approaches to the WET program implementation used for Appendix E (Examples of Selected State WET Implementation Programs) of this document
Betty Jane Boros-Russo State of New Jersey Kari Fleming State of Wisconsin Randall Marshall State of Washington Matt Matthews State of North Carolina Charlie Roth State of Kentucky
Additional Assistance
We also thank the EPA Regions States and laboratories that provided the WET toxicity data used to develop this guidance document
EPA Peer Review
Peer review was conducted following the EPArsquos Science Policy Council Handbook for Peer Review (January 1998) The anonymous review comments are gratefully acknowledged and the changes were incorporated as appropriate
June 30 2000 ix
Understanding and Accounting for Method Variability in WET Applications Under the NPDES Program
This page intentionally left blank
June 30 2000 x
EXECUTIVE SUMMARY
Background
The Federal Water Pollution Control Act commonly known as the Clean Water Act was enacted in 1972 with the objective of ldquorestoring the chemical physical and biological integrity of the Nationrsquos watersrdquo Among the US Environmental Protection Agencyrsquos (EPArsquos) efforts toward this objective is the National Pollutant Discharge Elimination System (NPDES) program This program is designed to control toxic discharges implement water quality standards and restore waters to ldquofishable and swimmablerdquo conditions Point sources that discharge pollutants must do so under the terms and conditions of an NPDES permit One approach EPA employs to control toxic pollutants under the NPDES permits program is using whole effluent toxicity (WET) controls
EPA is issuing this document to both address questions raised on WET test method variability and to satisfy a requirement of a July 1998 settlement agreement with litigants for the Western Coalition of Arid States (WestCAS) and Edison Electric Institute et al This document was developed by an EPA workgroup consisting of EPArsquos Office of Waterrsquos (OW) Headquarters Office of Enforcement and Compliance Assurance Office of Research and Development and Regional staff The document was externally peer reviewed in accordance with EPArsquos peer review guidelines The document addresses WET test method variability by identifying the potential sources of variance associated with WET testing discusses how to minimize it and finally describes how to address it within the NPDES permitting program The document cites both Agency and external ongoing research on this topic and scientific findings particularly technical information that support efforts to minimize WET test result variability
While the document provides recommendations on how to reduce or minimize WET test variability the document does not supersede current Agency guidance policy or regulation including EPArsquos promulgated test methods (40 CFR Part 136) which remain in effect EPA expects that implementation of the NPDES program and NPDES permits will continue to comply with regulatory requirements and follow applicable EPA guidance and policy
Why WET Testing
Whole effluent toxicity is the aggregate toxic effect of an aqueous sample (eg effluent receiving water) measured directly by an aquatic toxicity test Aquatic toxicity tests are laboratory experiments that measure the biological effect (eg growth survival and reproduction) of effluents or receiving waters on aquatic organisms In aquatic toxicity tests organisms of a particular species are held in test chambers and exposed to different concentrations of an aqueous sample for example a reference toxicant an effluent or a receiving water and observations are made at predetermined exposure periods At the end of the test the responses of test organisms are used to estimate the effects of the toxicant or effluent
Whole effluent toxicity test results are an integral tool in the assessment of water quality For the protection of aquatic life the integrated strategy includes the use of three control approaches the chemical-specific control approach the WET control approach and the biological criteriabioassessmentbioassay approach The primary advantage of using WET controls over individual chemical-specific controls is that WET integrates the effects of all chemical(s) in the aqueous sample Reliance solely on chemical-specific numeric criteria or biological criteria would result in only a partially effective State toxics control program These toxicity tests therefore must be performed using best laboratory practices and every effort must be made to enhance repeatability of the test method This document presents EPArsquos approaches to achieve the goals listed below
June 30 2000 xi
Understanding and Accounting for Method Variability in WET Applications Under the NPDES Program
Effect of This Guidance
This document clarifies several issues regarding WET variability and reaffirms EPArsquos guidance in the Technical Support Document for Water Quality-Based Toxics Control (TSD USEPA 1991a) This document provides NPDES regulatory authorities and all stakeholders including permittees with guidance and recommendations on how to address WET variability EPArsquos recommendations and conclusions are detailed in Chapter 7 and Appendix C provides sample NPDES permit language reflecting these recommendations
The most significant recommendation is to use and report the values for the percent minimum significant difference (PMSD) with all WET data results The minimum significant difference (MSD) represents the smallest difference between the control mean and a treatment mean that leads to the statistical rejection of the null hypothesis (ie no toxicity) at each concentration of the WET test dilution series The MSD provides an indication of within-test variability and test method sensitivity Using this information the regulatory authority and permittees can better evaluate WET test results
This document makes several other recommendations such as continue to use the TSD statistical approach without adjusting for test method variability obtain sufficient representative effluent samples verify effluent toxicity data against reference toxicant data maintain clear communication between the regulatory authority and permittee and maintain good laboratory checks and certification programs
Three Goals of This Document
This document describes three goals EPA has defined to address issues surrounding WET variability In addition the document is intended to satisfy the requirements of a settlement agreement to resolve litigation over rulemaking to standardize WET testing procedures
1 Quantify the variability of promulgated test methods and report a coefficient of variation (CV) as a measure of test method variability (see Chapter 3 and Appendix A)
2 Evaluate the statistical methods described in the Technical Support Document for Water Quality-Based Toxics Control (TSD) for determining the need for and deriving WET permit conditions (see Chapter 6 and Appendix G)
3 Suggest guidance for regulatory authorities on approaches to address and minimize test method variability (Chapter 6) In addition the document is intended to provide guidance to regulatory authorities permittees and testing laboratories on conducting the biological and statistical methods and evaluating test effect concentrations (Chapter 5)
Data Evaluated
EPA assembled a comprehensive data base to examine variability in the WET test methods from the EPA Regions several States and private laboratories which represent a widespread sampling of typical laboratories and laboratory practices EPA applied several criteria to the data before they were accepted including detailed sample information strict adherence to published EPA WET test methods and test acceptability criteria (TAC) The resulting data base contains data from 75 laboratories for 23 methods for tests concluded between 1988 and 1999
Approach Taken To Evaluate Test Method Variability
The variability that EPA is assessing is associated with replicate tests using reference toxicants and WET testing methods within analytical laboratories The focus of this guidance is not to quantify test variability between laboratories or to quantify the total variability of WET tests conducted on effluents Rather the purpose is to quantify method variability within laboratories (repeatability) to enable NPDES
June 30 2000 xii
Understanding and Accounting for Method Variability in WET Applications Under the NPDES Program
programs to distinguish between variability caused by the testing method and variability associated with toxicity of multiple effluent samples taken from the same facility
To quantify test method variability within and between laboratories using this data base EPA examined two key parameters (1) the effect concentrations [effect concentration (EC25) lethal concentration (LC50) no observed effect concentration (NOEC)] estimated by the test which are used to derive WET permit limits and evaluate self-monitoring data with those limits and (2) the minimum significant difference (MSD) which summarizes the variability of organism responses at each test concentration within an individual test The MSD represents the smallest difference that can be distinguished between the response of the control organisms and the response of the organisms exposed to the aqueous sample The MSD provides an indication of within-test variability and test method sensitivity
Principal Conclusions
The principal conclusions of this document follow
Evaluation of Test Method Variability
bull Comparisons of WET method precision with method precision for analytes commonly limited in NPDES permits clearly demonstrate that the variability of the promulgated WET methods is within the range of variability experienced in other types of analyses Several independent researchers and studies also have concluded that method performance improves when prescribed methods are followed closely by experienced analysts (Section 43)
bull This document provides interim CVs for promulgated WET methods in Appendix A Tables A-1 (acute methods) and A-2 (chronic methods) pending completion of between-laboratory studies which may affect these interim CV estimates
Evaluation of Approach To Incorporate Test Method Variability
bull EPArsquos TSD presents guidance for developing effluent limits that appropriately protect water quality regarding both effluent variability and analytical variability provided that the WET criteria and waste load allocation (WLA) are derived correctly (Section 6 and Appendix G)
bull EPArsquos analysis of data gathered in the development of this document indicates that the TSD approach appropriately accounts for both effluent variability and method variability EPA does not believe a reasonable alternative approach is available to determine a factor that would discount the effects of method variability using the TSD procedures because the approach would not ensure adequate protection of water quality (Section 611 and Appendix G)
Development of Guidance to Regulatory Authorities
bull EPA recommends that regulatory authorities implement the statistical approach as described in the TSD to evaluate effluent for reasonable potential and to derive WET limits or monitoring triggers (Section 61 and Appendix G)
bull EPA recommends that regulatory authorities calculate the facility-specific CVs using point estimate techniques to determine the need for and derive a permit limit for WET even if self-monitoring data are to be determined using hypothesis testing techniques for example to determine a ldquono effectrdquo concentration (ldquoNOECrdquo) This document describes such facility-specific calculations (Section 341 and 62)
June 30 2000 xiii
Understanding and Accounting for Method Variability in WET Applications Under the NPDES Program
Additional Recommendations and Guidance
This document also provides recommendations and guidance on minimizing variability in three specific areas in order to generate sound WET test results (1) obtaining a representative effluent sample (2) conducting the toxicity tests properly to generate the biological endpoints and (3) conducting the appropriate statistical analysis to obtain defensible effect concentrations (EC25 LC50 NOEC) If these recommendations are addressed the reliability of the test endpoint values should improve
bull Regulatory Authorities Design a sampling program that collects representative effluent samples to fully characterize effluent variability for a specific facility over time (Sections 613 and 62)
bull Regulatory Authorities Ensure proper application of WET statistical procedures and test methods (Sections 52 through 55)
bull Regulatory Authorities Incorporate both the upper and lower bounds using the percent minimum significant difference (PMSD) to control and to minimize within-test method variability and increase test sensitivity To achieve the PMSD upper bound either the replication should increase or within-test method variability should decrease or both (Section 64 and Table 3-6)
bull Testing Laboratories Encourage WET testing laboratories to maintain control charts for PMSD and the control mean and report the PMSD with all WET test results (Section 5311)
bull Regulatory Authorities Participate in the National Environment Laboratory Accreditation Program and routine performance audit inspections to evaluate laboratory performance (Section 5311)
bull Regulatory Authorities Incorporate EPArsquos guidance on error rate assumption adjustments concentration-response relationships confidence intervals acceptable dilution waters how to block by parentage for the chronic Ceriodaphnia dubia test and control of pH drift (USEPA 2000a)
June 30 2000 xiv
LIST OF ACRONYMS AND ABBREVIATIONS1
ACR acute-to-chronic ratio
AML average monthly limit
ANOVA analysis of variance
APHA-AWWA- American Public Health Association-American Water Works Association-Water WEF Environment Federation
ASTM American Society for Testing and Materials
BSAB Biomonitoring Science Advisory Board
CCC criteria continuous concentration
CFR Code of Federal Regulations
CMC criteria maximum concentration
CV coefficient of variation
CWA Clean Water Act
DMR discharge monitoring report
EMS error mean square [also referred to as mean square error (MSE)]
EPA US Environmental Protection Agency (also the Agency)
FR Federal Register
IC inhibition concentration
IWC instream waste concentration (sometimes referred to as receiving water concentration)
LC50 lethal concentration 50 percent
LOEC lowest observed effect concentration
LTA long-term average (LTAa = acute LTA LTAc = chronic LTA LTAac = acute-to-chronic LTA)
MDL maximum daily limit
MSD minimum significant difference
MSE mean square error [also referred to as error mean square (EMS)]
MZ mixing zone
NELAP National Environment Laboratory Accreditation Program
NOEC no observed effect concentration
NPDES National Pollutant Discharge Elimination System
NTRD National Toxicant Reference Database
PAI Performance Audit Inspections
PMSD percent minimum significant difference
Note These acronyms and abbreviations may have other meanings in other EPA programs or documents
June 30 2000
1
xv
Understanding and Accounting for Method Variability in WET Applications Under the NPDES Program
QA quality assurance
QC quality control
rMSE square root of the mean square error
RP reasonable potential
RWC receiving water concentration (sometimes referred to as instream waste concentration)
SCTAG Southern California Toxicity Assessment Group
SETAC Society of Environmental Toxicology and Chemistry
TAC test acceptability criteria
TIE toxicity identification evaluation
TMDL total maximum daily load
TRE toxicity reduction evaluation
TSD EPArsquos Technical Support Document for Water Quality-based Toxics Control (March 1991 EPA5052-90-001)
TU toxic unit (TUa = acute toxicity TUc = chronic toxicity)
VF variability factor
WET whole effluent toxicity
WLA waste load allocation
WQBEL water quality based effluent limit
June 30 2000 xvi
GLOSSARY
Acute Toxicity Test is a test to determine the concentration of effluent or ambient waters that causes an adverse effect (usually death) on a group of test organisms during a short-term exposure (eg 24 48 or 96 hours) Acute toxicity is measured using statistical procedures (eg point estimate techniques or a t-test)
Acute-to-Chronic Ratio (ACR) is the ratio of the acute toxicity of an effluent or a toxicant to its chronic toxicity It is used as a factor for estimating chronic toxicity on the basis of acute toxicity data or for estimating acute toxicity on the basis of chronic toxicity data
Ambient Toxicity is measured by a toxicity test on a sample collected from a receiving waterbody
ANOVA is analysis of variance
Average Monthly Limit (AML) is the calculated average monthly limit of waste load allocation assigned by a State or EPA for a particular facility
CCC are water quality criteria for chronic exposure (criteria continuous concentrations)
Chronic Toxicity Test is a short-term test in which sublethal effects (eg reduced growth or reproduction) are usually measured in addition to lethality Chronic toxicity is defined as TUc = 100NOEC or TUc = 100ECp or ICp
CMC are water quality criteria for acute exposures (criteria maximum concentration)
Coefficient of Variation (CV) is a standard statistical measure of the relative variation of a distribution or set of data defined as the standard deviation divided by the mean It is also called the relative standard deviation (RSD) The CV can be used as a measure of precision within (within-laboratory) and between (between-laboratory) laboratories or among replicates for each treatment concentration
Confidence Interval is the numerical interval constructed around a point estimate of a population parameter
Effect Concentration (EC) is a point estimate of the toxicant concentration that would cause an observable adverse effect (eg death immobilization or serious incapacitation) in a given percent of the test organisms calculated from a continuous model (eg Probit Model) EC25 is a point estimate of the toxicant concentration that would cause an observable adverse effect in 25 percent of the test organisms
Hypothesis Testing is a statistical technique (eg Dunnettrsquos test) for determining whether a tested concentration is statistically different from the control Endpoints determined from hypothesis testing are NOEC and LOEC The two hypotheses commonly tested in WET are
Null hypothesis (Ho) The effluent is not toxic Alternative hypothesis (Ha) The effluent is toxic
Inhibition Concentration (IC) is a point estimate of the toxicant concentration that would cause a given percent reduction in a non-lethal biological measurement (eg reproduction or growth) calculated from a continuous model (ie Interpolation Method) IC25 is a point estimate of the toxicant concentration that would cause a 25-percent reduction in a non-lethal biological measurement
Instream Waste Concentration (IWC) is the concentration of a toxicant in the receiving water after mixing The IWC is the inverse of the dilution factor It is sometimes referred to as the receiving water concentration (RWC)
June 30 2000 xvii
Understanding and Accounting for Method Variability in WET Applications Under the NPDES Program
LC50 (lethal concentration 50 percent) is the toxicant or effluent concentration that would cause death in 50 percent of the test organisms
Lowest Observed Effect Concentration (LOEC) is the lowest concentration of an effluent or toxicant that results in adverse effects on the test organisms (ie where the values for the observed endpoints are statistically different from the control)
Long-term Averages (LTAs) of pollutant concentration or effluent toxicity are calculated from waste load allocations (WLAs) typically assuming that the WLA is a 99th percentile value (or another upper bound value) based on the lognormal distribution One LTA is calculated for each WLA (typically an acute LTA and a chronic LTA for aquatic life protection) The LTA represents expected long-term average performance from the permitted facility required to achieve the associated WLA
Maximum Daily Limit (MDL) is the calculated maximum WLA assigned by a State or EPA for a particular facility
Minimum Significant Difference (MSD) is the magnitude of difference from control where the null hypothesis is rejected in a statistical test comparing a treatment with a control MSD is based on the number of replicates control performance and power of the test
Mean Square Error (MSE) is the average dispersion of the items around the treatment means It is an estimate of a common variance the within variation or variation among observations treated alike [Also referred to as error mean square (EMS)]
Mixing Zone is an area where an effluent discharge undergoes initial dilution and is extended to cover the secondary mixing in the ambient waterbody A mixing zone is an allocated impact zone where water quality criteria can be exceeded as long as acutely toxic conditions are prevented
No Observed Effect Concentration (NOEC) is the highest tested concentration of an effluent or toxicant that causes no observable adverse effect on the test organisms (ie the highest concentration of toxicant at which the values for the observed responses are not statistically different from the controls)
National Pollutant Discharge Elimination System (NPDES) program regulates discharges to the nationrsquos waters Discharge permits issued under the NPDES program are required by EPA regulation to contain where necessary effluent limits based on water quality criteria for the protection of aquatic life and human health
Power is the probability of correctly detecting an actual toxic effect (ie declaring an effluent toxic when in fact it is toxic)
Precision is a measure of reproducibility within a data set Precision can be measured both within a laboratory (within-laboratory) and between laboratories (between-laboratory) using the same test method and toxicant
Quality Assurance (QA) is a practice in toxicity testing that addresses all activities affecting the quality of the final effluent toxicity data QA includes practices such as effluent sampling and handling source and condition of test organisms equipment condition test conditions instrument calibration replication use of reference toxicants recordkeeping and data evaluation
Quality Control (QC) is the set of more focused routine day-to-day activities carried out as part of the overall QA program
Reasonable Potential (RP) is where an effluent is projected or calculated to cause an excursion above a water quality standard based on a number of factors
xviii June 30 2000
Understanding and Accounting for Method Variability in WET Applications Under the NPDES Program
Reference Toxicant Test is a check of the sensitivity of the test organisms and the suitability of the test methodology Reference toxicant data are part of a routine QAQC program to evaluate the performance of laboratory personnel and the robustness and sensitivity of the test organisms
Significant Difference is defined as a statistically significant difference (eg 95 percent confidence level) in the means of two distributions of sampling results
Statistic is a computed or estimated quantity such as the mean standard deviation or coefficient of variation
Test Acceptability Criteria (TAC) are specific criteria for determining whether toxicity test results are acceptable The effluent and reference toxicant must meet specific criteria as defined in the test method (eg for the Ceriodaphnia dubia survival and reproduction test the criteria are as follows the test must achieve at least 80 percent survival and an average of 15 young per surviving female in the controls)
Total Maximum Daily Load (TMDL) is a determination of the amount of a pollutant or property of a pollutant from point nonpoint and natural background sources including a margin of safety that may be discharged to a water quality-limited waterbody
t-Test (formally Studentrsquos t-Test) is a statistical analysis comparing two sets of replicate observations in the case of WET only two test concentrations (eg a control and 100 percent effluent) The purpose of this test is to determine if the means of the two sets of observations are different [eg if the 100-percent effluent concentration differs from the control (ie the test passes or fails)]
Type I Error (alpha) is the rejection of the null hypothesis (Ho) when it is in fact true (ie determining that the effluent is toxic when the effluent is not toxic)
Type II Error (beta) is the acceptance of the null hypothesis (Ho) when it is not true (ie determining that the effluent is not toxic when the effluent is toxic)
Toxicity Test is a procedure to determine the toxicity of a chemical or an effluent using living organisms A toxicity test measures the degree of effect of a specific chemical or effluent on exposed test organisms
Toxic Unit-Acute (TUa) is the reciprocal of the effluent concentration (ie TUa = 100LC50) that causes 50 percent of the organisms to die by the end of an acute toxicity test
Toxic Unit-Chronic (TUc) is the reciprocal of the effluent concentration (eg TUc = 100NOEC) that causes no observable effect (NOEC) on the test organisms by the end of a chronic toxicity test
Toxic Unit (TU) is a measure of toxicity in an effluent as determined by the acute toxicity units (TUa) or chronic toxicity units (TUc) measured Higher TUs indicate greater toxicity
Toxicity Identification Evaluation (TIE) is a set of procedures used to identify the specific chemicals causing effluent toxicity
Toxicity Reduction Evaluation (TRE) is a site-specific study conducted in a step-wise process designed to identify the causative agents of effluent toxicity isolate the source of toxicity evaluate the effectiveness of toxicity control options and then confirm the reduction in effluent toxicity
Variance is a measure of the dispersion in a set of values defined as the sum of the squared deviations divided by their total number
Whole Effluent Toxicity (WET) is the total toxic effect of an effluent measured directly with a toxicity test
Waste Load Allocation (WLA) is the portion of a receiving waterrsquos total maximum daily load that is allocated to one of its existing or future point sources of pollution
June 30 2000 xix
Understanding and Accounting for Method Variability in WET Applications Under the NPDES Program
This page intentionally left blank
June 30 2000 xx
10 INTRODUCTION
11 Background
The Federal Water Pollution Control Act commonly known as the Clean Water Act (CWA) was enacted in 1972 with the objective of ldquorestoring the chemical physical and biological integrity of the Nationrsquos watersrdquo Several goals and policies were established in the Act including the following
bull Eliminating the discharge of pollutants into navigable waters by 1985
bull Wherever attainable achieving an interim goal of water quality that provides for the protection and propagation of fish shellfish and wildlife and provides for recreation in and on the water by November 1 1983 and
bull Prohibiting the discharge of toxic pollutants in toxic amounts
In the 28 years since the CWA was enacted the US Environmental Protection Agency (EPA) and States authorized to administer EPArsquos National Pollutant Discharge Elimination System (NPDES) permitting program have made significant progress toward achieving these goals NPDES is designed to control toxic discharges implement a water quality standards program and restore waters to ldquofishable and swimmablerdquo conditions A point source that discharges pollutants to waters of the United States must do so under the terms and conditions of an NPDES permit In setting these terms and conditions EPA and the States have integrated their control of toxic pollutants through combined use of three approaches [Technical Support Document for Water Quality-based Toxics Control (USEPA 1991a referred to as the TSD)]
bull Chemical-specific controls
bull Whole effluent toxicity (WET) controls and
bull Biological criteriabioassessments and bioassays
The WET approach to protection of water quality is the primary subject of this document
In 1989 EPA defined whole effluent toxicity as ldquothe aggregate toxic effect of an effluent measured directly by an aquatic toxicity testrdquo [54 Federal Register (FR) 23868 at 23895 June 2 1989] Aquatic toxicity tests are laboratory experiments that measure the biological effect (eg growth survival and reproduction) of effluents or receiving waters on aquatic organisms In aquatic toxicity tests groups of organisms of a particular species are held in test chambers and exposed to different concentrations of an aqueous test sample for example a reference toxicant an effluent or a receiving water Observations are made at predetermined exposure periods At the end of the test the responses of test organisms are used to estimate the effects of the toxicant or effluent
In the early 1980s EPA published methods (USEPA 1985 1988 1989) for estimating the short-term acute and chronic toxicity of effluents and receiving waters to freshwater and marine organisms WET data gathered in the 1980s indicated that approximately 40 percent of NPDES facilities nationwide discharged an effluent with sufficient toxicity to cause water quality problems Further reductions in the toxicity of wastewater discharges were necessary to achieve compliance with narrative water quality standards expressed as ldquono toxics in toxic amountsrdquo In response to these findings EPA implemented a policy to reduce or eliminate toxic discharges The Policy for the Development of Water Quality-based Permit Limitations for Toxic Pollutants (49 FR 9016 March 9 1984) introduced EPArsquos integrated toxics control program To support this policy EPA developed the TSD (USEPA 1991a) The TSD provides guidance to
June 30 2000 1-1
Understanding and Accounting for Method Variability in WET Applications Under the NPDES Program
regulators in implementing WET testing requirements in NPDES permits In 1989 EPA promulgated regulations specifying procedures for determining when water quality-based effluent limitations are required in NPDES permits [40 CFR 12244(d)] On October 26 1995 EPA promulgated WET test methods (USEPA 1993 1994a and 1994b) and added them to the list of EPA methods approved under Section 304(h) of the CWA (40 CFR 136) for use in the NPDES program Although the rulemaking was challenged in court that challenge has been stayed pending completion of a settlement agreement The rulemaking remains in force and effect unless and until EPA takes further action
12 Effect of This Guidance
This document attempts to clarify several issues regarding WET variability and reaffirms EPArsquos earlier guidance and recommendations published in the TSD (USEPA 1991a) This document is intended to provide NPDES regulatory authorities and all stakeholders including permittees with guidance and recommendations on how to understand and account for measurement variability in WET testing The documentrsquos recommendations and conclusions are detailed in Section 7 Appendix C provides sample NPDES permit language reflecting these recommendations
The most significant recommendation is to use and report the values for the percent minimum significant difference (PMSD) with all WET data results The minimum significant difference (MSD) is the smallest difference that can be distinguished between the response of control organisms and the response of test organisms at each concentration of the WET test dilution series The MSD provides an indication of the within-test variability and test method sensitivity Using this information the regulatory authority and permittees can better evaluate WET test results
This document also recommends the following
bull Continue to use the EPA TSD statistical approach for NPDES permit limit development (no test method variability adjustments are needed)
bull Collect and evaluate a sufficient number of representative effluent samples
bull Verify effluent toxicity data carefully along with reference toxicant data
bull Maintain good communication between the regulatory authority and permittee throughout all phases of the permitting process
bull Implement the PMSD to evaluate both WET and reference toxicant data to minimize within-test method variability and increase test sensitivity
bull Maintain laboratory checks with good laboratory certification programs to encourage experienced laboratories and skilled analysts for the toxicity testing program for individual WET laboratory performance
13 Three Goals of This Document
EPA prepared this document to achieve the following three goals
1 Quantify the variability of promulgated test methods and report a coefficient of variation (CV) as a measure of test method variability (see Chapter 3 and Appendix A)
June 30 2000 1-2
Understanding and Accounting for Method Variability in WET Applications Under the NPDES Program
2 Evaluate the statistical methods described in the Technical Support Document for Water Quality-Based Toxics Control (TSD) for determining the need for and deriving WET permit conditions (see Chapter 6 and Appendix G)
3 Suggest guidance for regulatory authorities on approaches to address and minimize test method variability (Chapter 6) In addition the document is intended to provide guidance to regulatory authorities permittees and testing laboratories on conducting the biological and statistical methods and evaluating test effect concentrations (Chapter 5)
This document does not address effluent variability It does however discuss how handling effluent samples can affect tests Chapter 2 provides definitions of terms used and discusses the ways in which variability can be quantified Chapter 3 describes the variability of the effect concentration estimates (EC25 LC50 and NOEC) and the variability of endpoint measurements (survival growth and reproduction) Chapter 4 discusses WET variability in the context of chemical-specific method variability Chapter 5 provides guidance to permittees testing laboratories and regulatory authorities to minimize test method variability Chapter 6 provides guidance to regulatory authorities on how to determine reasonable potential (RP) and derive permit limits or monitoring triggers and evaluate self-monitoring data Chapter 7 presents EPArsquos principal conclusions Chapter 8 is a bibliography containing a list of documents cited herein and additional reading material
June 30 2000 1-3
Understanding and Accounting for Method Variability in WET Applications Under the NPDES Program
This page intentionally left blank
June 30 2000 1-4
20 DEFINITION AND MEASUREMENT OF METHOD VARIABILITY IN WET TESTING
The terms used to express toxicity test results are defined in this chapter and methods for quantifying WET test method variability are discussed Additional terms used throughout this document along with their definitions are provided in the Glossary as part of the front matter of this document
21 Terms and Definitions
Biological endpoints are the biological observations recorded when conducting toxicity tests These observations may include the number of surviving organisms or the number of young produced There are two basic types of biological endpoints responses recorded as responseno response (eg dead or alive) are quantal data responses recorded as a measured response (eg weight) or as a count (eg number of young produced) are considered continuous data For most WET tests the observations for each tested concentration are combined and then reported as an average or percentage to represent the biological endpoint For example the fathead minnow larval survival and growth chronic test method has two biological endpoints (ie percent survival and average dry weight for each test concentration)
Effect concentrations are concentrations of a test material (ie effluent referent toxicant receiving water) derived from the observed biological endpoints followed by data analysis using either hypothesis testing procedures or point estimate techniques Effect concentrations derived using point estimation techniques represent the concentration of a test material at which a predetermined level of effect occurs For example LC50 is the lethal concentration at which 50 percent of the organisms respond Effect concentrations commonly estimated for WET methods are LC50 EC50 (effect concentration at which a 50shypercent effect occurs) and IC25 (inhibition concentration at which a 25-percent effect occurs) Hypothesis test methods are used to determine the no observed effect concentration (NOEC) The NOEC represents the highest effect concentration in the test concentration response that is not significantly different from the control response Multiple statistical endpoints can be derived for each WET method For example the endpoints for the fathead minnow larval survival and growth chronic test can be reported as an EC25 for growth an NOEC for growth an LC50 (or EC50) for survival and an NOEC for survival
22 Defining WET Test Variability
As with any measurement process WET tests have a degree of variability associated with the test method performance Three measures of variability related to WET tests are within-test variability within-laboratory variability and between-laboratory variability
bull Within-test (intra-test) variability is the variability in test organism response within a concentration averaged across all concentrations of the test material in a single test
bull Within-laboratory (intra-laboratory) variability is the variability that is measured when tests are conducted using specific methods under reasonably constant conditions in the same laboratory Within-laboratory variability as used in this document includes within-test variability The American Society for Testing and Materials (ASTM) uses the term ldquorepeatabilityrdquo to describe within-laboratory variability Repeatability is estimated (as a sample variance or standard deviation) by repeating a test method under realistically constant conditions within a single laboratory
bull Between-laboratory (inter-laboratory) variability is the variability between laboratories It is measured by obtaining results from different laboratories using the same test method and the same
June 30 2000 2-1
Understanding and Accounting for Method Variability in WET Applications Under the NPDES Program
test material (eg reference toxicant) Between-laboratory variability as used in this document does not include the within-laboratory component of variance ASTM uses the term ldquoreproducibilityrdquo to describe between-laboratory variability Reproducibility is estimated by having nearly identical test samples (duplicates or splits) analyzed by multiple laboratories using similar standard methods Although reproducibility is generally synonymous with between-laboratory variability estimates of reproducibility may combine within-laboratory and between-laboratory components of variance making between-laboratory variability numerically larger than within-laboratory variability as defined above
For purposes of consistency EPA uses the terms within-laboratory and between-laboratory variability throughout this document
Numerous factors can affect the variability of any toxicity test method These factors include the number of test organisms the number of treatment replicates randomization techniques the source and health of the test organisms the type of food used laboratory environmental conditions and dilution water quality The experience of the analyst performing the test analyzing the data and interpreting the results may also affect variability (Grothe et al 1996 Fulk 1996)
23 Quantifying WET Test Variability
Historically information on the variability of toxicity tests has been developed using effect concentrations such as the NOEC EC25 EC50 and LC50 for survival fecundity and growth Variability measures should be quantified based on the end use of the data (ie effect concentrations) and be directly related to the WET permit requirement Typically the effect concentrations are the endpoints used for evaluating self-monitoring results The variability of the effect concentrations is quantified by obtaining multiple test results under similar test conditions using the same test material For example the sample standard deviation and mean for EC25 obtained from multiple monthly reference toxicant tests for the fathead minnow survival and growth chronic test conducted at one laboratory would quantify ldquowithinshylaboratoryrdquo variability for that laboratory EPA used this approach to evaluate data for the development of this document (see Chapter 3)
Examining variability for each effect concentration of each biological endpoint for each test method is essential The biological endpoints may be different for various toxicants and effluents One biological endpoint such as reproduction may be more sensitive to a certain toxicant than another endpoint such as survival That sensitivity may be reversed for a different toxicant Alternatively an endpoint may be more sensitive to one toxicant than another toxicant
Three other measures of variability (which are not addressed in this document) that have been applied to WET tests are
1 Determine the variability of the biological endpoint response For example the variance of the biological response (eg growth and survival) can be calculated This approach is useful but does not quantify variability of the WET test effect concentration which is important in the context of this document
2 Quantify the uncertainty of each test point estimate (eg the EC50 EC25 or LC50) using confidence intervals which reflect within-test variability
3 Use the standard deviation to quantify the uncertainty in the mean of the replicate response at each concentration within a particular test For example laboratories can compare the standard deviations of the average weight of fathead minnow larvae in four chronic tests at one test concentration such as 1 mgL sodium chloride These standard deviations may be pooled across
June 30 2000 2-2
Understanding and Accounting for Method Variability in WET Applications Under the NPDES Program
all the concentrations when data have been transformed (if necessary) to give similar variances at each concentration From the pooled variance one may calculate a minimum significant difference (MSD) value which is a useful indication of test sensitivity (see Chapters 3 and 5) In this document the standard deviation at each concentration was not evaluated as a measure of variability However the MSD was considered as a measure of WET test variability
June 30 2000 2-3
Understanding and Accounting for Method Variability in WET Applications Under the NPDES Program
This page intentionally left blank
June 30 2000 2-4
30 VARIABILITY OF WET TEST METHODS
Chapter 3 describes the variability of effect concentration estimates (EC25 LC50 and NOEC) and endpoint measurements (survival growth and reproduction) For definitive studies of the variability of WET methods readers should also refer to the TSD (USEPA 1991a Part 133) and to WET methods manuals (USEPA 1993 1994a 1994b) EPA will complete and report on a new between-laboratory study of promulgated methods in 2000 or 2001
31 Acquisition Selection and Quality Assurance of Data Presented in This Document
EPA solicited data for reference toxicant tests from laboratories that conduct WET tests and use reference toxicant testing as part of their quality control (QC) program Reference toxicant testing is required as specified in EPA toxicity test methods to document laboratory performance over time for laboratories conducting self-monitoring tests When laboratories are conducting effluent tests at least one reference toxicant test must be conducted each month using the same toxicant test concentrations dilution water and data analysis methods These reference toxicant tests must be conducted using the same test conditions (type of dilution water temperature test protocol and species) that are used for WET tests conducted by the laboratory
Reference toxicant tests were used to characterize method variability because in contrast to effluent samples fixed concentrations of known toxicants are used Only with this standardization is it possible to conclude that variability of the effect concentration estimates is derived from the sources discussed above rather than from changes in the toxicant
EPA received reference toxicant test data from several States private laboratory sources and the EPA Regions Data sources used for these analyses include the EPA National Toxicant Reference Database (NTRD) the EPA Region 9 Toxicity Data Base and laboratory bench sheets voluntarily submitted by independent sources Although the data do not represent a random sample of laboratories or tests they do represent a widespread sampling of typical laboratories and practices
EPA required that reference toxicant tests included in its data base meet the following four criteria
1 Test records documented the test method organism test date laboratory reference toxicant and individual biological responses in the concentration series
2 Data for each replicate were provided as required in the published method using the current test method
3 The test used at least five toxicant concentrations and a control for the most commonly reported chronic toxicity test methodsmdash(1) 10000 fathead minnow larval survival and growth (2) 10020 Ceriodaphnia survival and reproduction and (3) 10060 inland silverside survival and growth For other chronic toxicity test methods the test used at least four toxicant concentrations and a control because the methods permitted in the recent past the use of only four concentrations
4 EPA personnel or an EPA contractor calculated the effect concentration verified that all test acceptability criteria (TAC) had been met and verified that the statistical flowchart had been followed correctly Thus all summary statistics and estimates were calculated from the replicate data and strictly followed the most current EPA test methods
June 30 2000 3-1
Understanding and Accounting for Method Variability in WET Applications Under the NPDES Program
Details of data quality assurance and test acceptance are provided in a separate document available at EPArsquos Office of Water docket located in the Office of Science and Technology [ldquoWhole Effluent Toxicity (WET) Data Test Acceptance and Quality Assurance Protocolrdquo] An attachment to that document provides a laboratory-by-laboratory listing of quality assurance flags test dates and toxicant concentrations as well as summary statistics by laboratory for the NOEC EC25 and LC50 estimates and test endpoints (survival growth reproduction etc) Laboratories are not identified by name
The data set of reference toxicant tests includes information from 75 laboratories for 23 methods for tests conducted between 1988 and 1999 This document addresses and provides specific guidance on the variability of methods promulgated by EPA in 40 CFR Part 136 (Table 3-1) The data are also used to develop between-laboratory interim estimates of method variability for the promulgated methods (Appendix A) The Agency identifies these CVs as ldquointerimrdquo EPA may revise some or all of these estimates based on between-laboratory studies to evaluate some of the promulgated test methods
The next section presents summary statistics for the promulgated methods Summary statistics for all methods in the data set appear in Appendix B For methods represented by a few laboratories summary statistics should not be considered representative of method performance For example EPArsquos Office of Water usually relies on acceptable data from at least six laboratories (USEPA 1996b) when it conducts a multi-laboratory study to quantify method performance The data used here have not been obtained under conditions as rigorous as those applied to a between-laboratory study and for that reason may overestimate variability particularly for the extremes
Coefficients of variation are used as descriptive statistics for NOECs in this document Because NOECs can take on only values that correspond to concentrations tested the distribution (and CV) of NOECs can be influenced by the selection of experimental concentrations as well as additional factors (eg within-test variability) that affect both NOECs and point estimates This makes CVs for NOECs more uncertain than the CVs for point estimates and the direction of this uncertainty is not uniformly toward larger or smaller CVs Despite these confounding issues CVs are used herein as the best available means of expressing the variability of interest in this document and for general comparisons among methods Readers should be cautioned however that small differences in CVs between NOECs and point estimates may be artifactual large differences are more likely to reflect real differences in variability (a definition of what is ldquosmallrdquo or ldquolargerdquo would require a detailed statistical analysis and would depend upon the experimental and statistical details surrounding each comparison) NOECs can only be a fixed number of discrete values the mean standard deviation and CV cannot be interpreted and applied as they are for a continuous variable such as the EC25 or EC50 For instance the typical reference toxicant test might result in only three observed NOEC values most of them at one or two concentrations The mean will fall between tested concentrations as will the stated confidence intervals thus these do not actually represent expected outcomes only approximations of the expected outcome
As an alternative to CVs ratios are used to quantify variability of EC25 EC50 and NOEC measurements in Appendix B Ratios of measurements have been used previously to quantify and compare variability of NOEC and EC50 (Chapman et al 1996b Dhaliwal et al 1997)
32 Variability of EC25 LC50 and NOEC
321 Within-Laboratory Variability of EC25 LC50 and NOEC
This section characterizes the within-test and within-laboratory variability of effect concentration estimates Tables 3-2 through 3-4 summarize variation across laboratories of the within-laboratory coefficients of variation (CVs) without respect to reference toxicant tested Tables showing more extensive summaries appear in Appendix B (Tables B-1 through B-3)
June 30 20003-2
Understanding and Accounting for Method Variability in WET Applications Under the NPDES Program
Table 3-1 Promulgated WET Methods Included in This Report
Test Method No Test Method
EPA Data Base
Toxicants Tests Labs
Freshwater Methods for Chronic Toxicitya
10000 Pimephales promelas Fathead Minnow Larval Survival and Growth Test
Cd Cr Cu KCl NaCl NaPCP SDS
205 19
10000 Pimephales promelas Fathead Minnow Embryo-Larval Survival and Teratogenicity Test
0 0
10020 Ceriodaphnia dubia Water Flea Survival and Reproduction Test
Cd Cu KCl NaCl NaPCP 393 33
10030 Selenastrum capricornutum b Green Alga Growth Test
Cu NaCl Zn 85 9
Marine amp Estuarine Methods for Chronic Toxicityc
10040 Cyprinodon variegatus Sheepshead Minnow Larval Survival and Growth Test
Cd KCl 57 5
10050 Cyprinodon variegatus Sheepshead Minnow Embryo-larval Survival and Teratogenicity Test
0 0
10060 Menidia beryllina Inland Silverside Larval Survival and Growth Test
Cr Cu KCl SDS 193 16
10070 Americamysis (Mysidopsis) bahia Mysid Survival Growth and Fecundity Test
Cr Cu KCl 130 10
10080 Arbacia punctulata Sea Urchin Fertilization Test 0 0
10090 Champia parvula Red Macroalga Reproduction Test
Cu SDS 23 2
Methods for Acute Toxicity de
20000 Fathead Minnow Survival Test Cd Cu KCl NaCl NaPCP 217 21
20020 Ceriodaphnia dubia Survival Test Cd Cu KCl NaCl NaPCP 241 23
20040 Sheepshead Minnow Survival Test SDS 65 3
20060 Inland Silverside Survival Test Cd KCl SDS 48 5
20070 Mysid (A bahia) Survival Test Cd Cu SDS 32 3
20110 Mysid (H costata) Survival Test Cd SDS 14 2
20190 Rainbow Trout Survival Test Cu Zn 10 1
20210 Daphnia magna Survival Test Cd 48 5
20220 Daphnia pulex Survival Test Cu NaCl SDS Cd Cu NaCl NaPCP
57 6
a See publications EPA6004-89-001 (USEPA 1989) and EPA6004-91-002 (USEPA 1994b)b The genus and species names for Selenastrum capricornutum have been changed to Raphidocelis subcapitata In this
document however Selenastrum capricornutum is used to avoid confusion See publication EPA6004-91-003 (USEPA 1994a) and EPA6004-87028 (USEPA 1988)
d See publications EPA6004-85013 (USEPA 1985) and EPA6004-90027F (USEPA 1993) e EPA did not assign method numbers for acute methods in EPA6004-90027F The numbers assigned here were created for
use in this document and in related materials and data bases Reference toxicant codes Cd cadmium NaCl sodium chloride Cr chromium NaPCP sodium pentachlorophenate Cu copper SDS sodium dodecyl sulfate KCl potassium chloride Zn zinc
June 30 2000 3-3
c
Understanding and Accounting for Method Variability in WET Applications Under the NPDES Program
Table 3-2 Quartiles (25th and 75th) and Median (50th) of the Within-Laboratory Values of CV for EC25 (Chronic Tests)
Test Methoda
Test Method
No Endpoint
b No of Labs
Percentiles of CV
25th 50th 75th
Fathead Minnow Larval Survival amp Growth 10000 G 19 021 026 038
Fathead Minnow Larval Survival amp Growth 10000 S 16 011 022 032
Ceriodaphnia (Cd) Survival amp Reproduction 10020 R 33 017 027 045
Ceriodaphnia (Cd) Survival amp Reproduction 10020 S 25 011 023 041
Green Alga (Selenastrum) Growth 10030 G 6 025 026 039
Sheepshead Minnow Larval Survival amp Growth 10040 G 5 009 013 014
Sheepshead Minnow Larval Survival amp Growth 10040 S 2 015 016 017
Inland Silverside Larval Survival amp Growth 10060 G 16 018 027 043
Inland Silverside Larval Survival amp Growth 10060 S 13 022 035 042
Mysid (Ab) Survival Growth amp Fecundity 10070 F 4 030 038 041
Mysid (Ab) Survival Growth amp Fecundity 10070 G 10 024 028 032
Mysid (Ab) Survival Growth amp Fecundity 10070 S 7 017 021 028
Red Macroalga (Champia parvula) Reproduction 10090 R 2 058 058 059 a Cd = Ceriodaphnia dubia Ab = Americamysis (Mysidopsis) bahia b G = growth S = survival R = reproduction F = fecundity
Table 3-3 Quartiles (25th and 75th) and Median (50th) of the Within-Laboratory Values of CV for LC50
Test Methoda Test
Method No Endpoint
b No of Labs
Percentiles of CV
25th 50th 75th
Freshwater Methods for Chronic Toxicityc
Fathead Minnow Larval Survival amp Growth 10000 S 19 015 023 031
Ceriodaphnia (Cd) Survival amp Reproduction 10020 S 33 010 016 029
Sheepshead Minnow Larval Survival amp Growth 10040 S 5 007 008 012
Inland Silverside Larval Survival amp Growth 10060 S 16 016 028 035
Mysid (Ab) Survival Growth amp Fecundity 10070 S 10 016 026 027
Methods for Acute Toxicityde
Fathead Minnow Larval Survival 20000 S 21 010 016 019
Ceriodaphnia (Cd) Survival 20020 S 23 011 019 029
Sheepshead Minnow Survival 20040 S 5 012 014 021
Inland Silverside Larval Survival 20060 S 5 015 016 021
Mysid (Ab) Survival 20070 S 3 017 025 026
Mysid (Hc) Survival 20110 S 2 027 030 034
Rainbow Trout Survival 20190 S 1 023 023 023
Daphnia (Dm) Survival 20210 S 5 007 022 024
Daphnia (Dp) Survival 20220 S 6 019 021 027 a Cd = Ceriodaphnia dubia Ab = Americamysis (Mysidopsis) bahia Hc = Holmesimysis costata Dm = Daphnia magna
Dp = Daphnia pulex b S = survival
See publications EPA6004-89-001 (USEPA 1989) and EPA6004-91-002 (USEPA 1994b)d See publications EPA6004-85-013 (USEPA 1985 and EPA6004-90027F (USEPA 1993) e EPA did not assign method numbers for acute methods in EPA6004-90027F The numbers assigned here were created for
use in this document and in related materials and data bases
June 30 2000 3-4
c
Understanding and Accounting for Method Variability in WET Applications Under the NPDES Program
Table 3-4 Quartiles (25th and 75th) and Median (50th) of the Within-Laboratory Values of CV for NOEC
Test Methoda
Test Metho
d No
Endpointb
No of Labs
Percentiles of CV
25th 50th 75th
Freshwater Methods for Chronic Toxicityc
Fathead Minnow Larval Survival amp Growth 10000 G 19 022 037 053
Fathead Minnow Larval Survival amp Growth 10000 S 19 026 039 048
Ceriodaphnia (Cd) Survival amp Reproduction 10020 R 33 025 033 049
Ceriodaphnia (Cd) Survival amp Reproduction 10020 S 33 021 030 043
Green Alga (Selenastrum) Growth 10030 G 9 040 046 056
Marine amp Estuarine Methods for Chronic Toxicityd
Sheepshead Minnow Larval Survival amp Growth 10040 G 5 034 040 044
Sheepshead Minnow Larval Survival amp Growth 10040 S 5 014 018 024
Inland Silverside Larval Survival amp Growth 10060 G 16 031 046 057
Inland Silverside Larval Survival amp Growth 10060 S 16 030 042 055
Mysid (Ab) Survival Growth amp Fecundity 10070 F 4 017 036 040
Mysid (Ab) Survival Growth amp Fecundity 10070 G 10 035 039 043
Mysid (Ab) Survival Growth amp Fecundity 10070 S 10 028 033 038
Red Macroalga (Champia parvula) Reprod 10090 R 2 085 100 116
Methods for Acute Toxicityef
Fathead Minnow Larval Survival 20000 S 21 018 022 034
Ceriodaphnia (Cd) Survival 20020 S 23 018 035 041
Sheepshead Minnow Survival 20040 S 3 0 031 033
Inland Silverside Larval Survival 20060 S 5 0 033 035
Mysid (Ab) Survival 20070 S 3 029 038 043
Mysid (Hc) Survival 20110 S 2 021 026 031
Rainbow Trout Survival 20190 S 1 035 035 035
Daphnia magna (Dm) Survival 20210 S 5 009 036 047
Daphnia pulex (Dp) Survival 20220 S 6 021 038 061 a Cd = Ceriodaphnia dubia Ab = Americamysis (Mysidopsis) bahia Hc = Holmesimysis costata Dm = Daphnia
magna Dp = Daphnia pulex b G = growth S = survival R = reproduction F = fecundity
See publications EPA6004-89-001 (USEPA 1989) and EPA60044-91-002 (USEPA 1994b)d See publication EPA6004-91-003 (USEPA 1994a) and EPA6004-87028 (USEPA 1988) e See publications EPA6004-85013 (USEPA 1985) and EPA6004-90027F (USEPA 1993)f EPA did not assign method numbers for acute methods in EPA6004-90027F The numbers assigned here were
created for use in this document and in related materials and data bases
Effect concentrations having a p-percent effect are symbolized as ECp and may be calculated for sublethal and lethal (survival) endpoints (USEPA 19931994a1994b) Effect concentrations commonly estimated for WET methods are LC50 EC50 IC25 and EC25 The symbol ECp is more general and may be used to represent an LCp ECp or ICp endpoint To simplify presentation of results in this document the term EC25 is used to represent the concentration at which a 25-percent effect has occurred for either lethal
June 30 2000 3-5
c
Understanding and Accounting for Method Variability in WET Applications Under the NPDES Program
or sublethal endpoints The term LC50 is used to represent the concentration at which a 50-percent effect has occurred for lethal endpoints The EC25 for survival is not routinely used in generating self-monitoring data and is presented here for comparison to the EC25 for sublethal endpoints (ie IC25) Estimates of EC25 LC50 and NOEC were calculated for this document as required in the EPA test methods (USEPA 1993 1994a 1994b) A CV is reported for NOEC measurements in this document See Appendix A for further details
The results in Tables 3-2 through 3-4 were obtained as follows using as an example the EC25 of the growth endpoint in Method 10000 (fathead minnow larval chronic test) on the first row of Table 3-2 The CV of the EC25 estimates was calculated for each laboratory This calculation resulted in 19 CVs (one per laboratory with each laboratory tested using one toxicant) The sample percentiles were calculated for this set of 19 CVs In Table 3-2 the column headed ldquo50thrdquo shows the 50th percentile (median value) of CV found across these 19 laboratories the 50th percentile value is 026 In the column headed ldquo75thrdquo the 75th percentile CV is reported as 038 When a method is represented by fewer than four laboratories the minimum and maximum CVs are shown in the columns headed ldquo25thrdquo and ldquo75thrdquo respectively Note that these CVs represent within-laboratory variability and that Tables 3-2 through 3-4 show the quartiles and median of the within-laboratory CVs These tables thus report the typical range of within-laboratory test method variation
Variation across laboratories in the CV for effect concentration estimates (Tables 3-2 through 3-4) may be summarized as follows ignoring methods represented by only one or two laboratories [Refer to the column headed ldquo75thrdquo (the 75th percentile)]
For the EC25 of the growth and reproduction endpoints in chronic toxicity tests 75 percent of laboratories have a CV no more than 014 to 045 depending on the method (Table 3-2) For the two most commonly used methods (10000 fathead minnow larval chronic test and 10020 Ceriodaphnia chronic test) 75 percent of the laboratories have CVs no more than 038 and 045 respectively
For the LC50 of the survival endpoint in chronic toxicity tests 75 percent of laboratories have a CV no more than 012 to 035 depending on the method For the two most commonly used methods (10000 and 10020) 75 percent of laboratories have CVs no more than 031 and 029 respectively (Table 3-3) For the LC50 in acute toxicity tests 75 percent of laboratories have a CV no more than 019 to 029 depending on the method For the two most commonly used methods (20000 and 20020) 75 percent of laboratories have CVs no more than 019 and 029 respectively
For the NOEC of growth or reproduction endpoints in chronic toxicity tests 75 percent of laboratories have a CV no more than 043 to 057 depending on the method For the two most commonly used methods (10000 and 10020) 75 percent of laboratories have CVs no more than 053 and 049 respectively (Table 3-4) For the NOEC of survival in chronic toxicity tests 75 percent of laboratories have a CV no more than 024 to 055 depending on the method For the two most commonly used methods (10000 and 10020) 75 percent of laboratories have CVs no more than 048 and 043 respectively For the NOEC of survival in acute toxicity tests 75 percent of laboratories have a CV no more than 034 to 061 depending on the method For the two most commonly used acute methods (20000 and 20020) 75 percent of laboratories have CVs no more than 034 and 041 respectively
Appendix B discusses the range of toxicant concentrations reported as the NOEC For chronic toxicity tests most laboratories report the NOEC to within two to three concentration intervals and half the laboratories report most NOECs within one to two concentration intervals for reference toxicants For acute toxicity tests most laboratories report NOECs at one or two concentrations This outcome agrees with EPArsquos expected performance for these methods The normal variation of the effect concentration estimate in reference toxicant tests has been reported for some EPA WET methods (USEPA 1994a 1994b) to be plus or minus one dilution concentration for the NOEC and less for LC50
June 30 2000 3-6
Understanding and Accounting for Method Variability in WET Applications Under the NPDES Program
322 Between-Laboratory Variability of EC25 LC50 and NOEC
The data set compiled for this document provided reasonable estimates of between-laboratory variability for only a few methods For many methods and toxicants there were too few laboratories in the data base Additional summaries of between-laboratory variability of WET methods are included in the TSD (USEPA 1991a Part 133) and the WET methods manuals (USEPA 1994a 1994b) EPA also intends to provide new data in a forthcoming EPA between-laboratory study of promulgated methods
Using the data set credible estimates of between-laboratory variability could be made for a few toxicants and methods having data for six or more laboratories (Table 3-5) The statistical methods are described in Appendix B Table 3-5 shows values of the square root of within-laboratory and between-laboratory variance components (ie standard deviations F) The standard deviations and mean are expressed in units of toxicant concentration (eg gL or mgL) Between-laboratory Fb estimates the standard deviation for laboratory means of EC25 LC50 and NOEC The ldquoMeanrdquo column in Table 3-5 shows the mean of the laboratory means not the mean for all tests Because the number of tests differed among laboratories these two means are different These data suggest that between-laboratory variability (Fb) is comparable to within-laboratory variability (Fw) for the methods listed in the table
In Table 3-5 the ratio of Fb to the mean is an estimate of the relative variability (CVb) of laboratory means around their combined mean The ratio of Fw to the mean may approach the value of the average within-laboratory CV when the sample of laboratories is large but to characterize within-laboratory CVs readers should use Tables 3-2 through 3-4
Table 3-5 Estimates of Within-Laboratory and Between-Laboratory Components of Variabilitya
Test Methodb
Test EC Estimate Toxicant
End-Pointc Tests Labs
Within-lab FFW
Between-lab FFb Mean CVw CVb
10000 EC25 NaCl G 73 6 067 044 263 025 017
10000 LC50 NaCl S 73 6 114 045 415 027 011
10000 NOEC N Cl G 73 6 072 035 218 033 016
10000 NOEC NaCl S 73 6 096 051 243 040 021
10020 EC25 NaCl R 292 23 029 027 092 032 029
10020 LC50 NaCl S 285 23 048 024 178 027 013
10020 NOEC NaCl G 292 23 028 018 074 038 024
10020 NOEC NaCl S 292 23 047 026 142 033 018
10060 EC25 Cu G 130 9 451 524 974 046 054
10060 LC50 Cu S 130 9 484 707 1270 038 056
10060 NOEC Cu G 130 9 518 444 801 065 055
10060 NOEC Cu S 130 9 342 395 654 052 060
20000 LC50 NaCl S 154 14 105 124 746 014 017
20020 LC50 NaCl S 167 15 036 038 197 018 019 a F = within-laboratory standard deviation Fb = between-laboratory standard deviationw
CV = within-laboratory coefficient of variation CVb = between-laboratory coefficient of variationwb EPA did not assign method numbers for acute methods in EPA6004-90027F The numbers assigned here
were created for use in this document and in related materials and data bases G = growth S = survival R = reproduction
June 30 2000 3-7
c
Understanding and Accounting for Method Variability in WET Applications Under the NPDES Program
33 Variability of Endpoint Measurements
This section characterizes the within-laboratory precision of endpoint measurements (eg growth reproduction and survival) Endpoint variability in methods for chronic toxicity is characterized here using sublethal endpoints The sublethal endpoint was designed to be more sensitive than the survival endpoint and it incorporates the effect of mortality (ie it incorporates biomass) For example for the chronic survival and growth fathead minnow larval test the total dry weight at each replicate is divided by the original number of larvae rather than the surviving number of larvae
EPA reports measures of test precision based on the control CV [(control standard deviation)(control mean)] and the ldquoPercent MSDrdquo [100timesMSD(control mean)] symbolized as PMSD Recall that MSD the ldquominimum significant differencerdquo is calculated as [d EMS (2r)] where ldquodrdquo is the critical value of Dunnettrsquos statistic when comparing ldquokrdquo treatments to a control EMS is the error mean square from the analysis of variance of the endpoint responses and ldquorrdquo is the number of replicates at each concentration (USEPA 1993 1994a 1994b) These measures of test precision quantify within-test variability or the sensitivity of each test to toxic effects on the biological endpoint
Measures of variability relative to the control mean are used for two reasons First a laboratory having consistently large mean endpoint values for the control will also tend to have larger values of MSD and control standard deviation Second PMSD is readily interpreted as the minimum percent difference between control and treatment that can be declared statistically significant in a WET test A significant effect occurs when (control mean - treatment mean) exceeds the MSD Dividing by the control mean and multiplying by 100 states this relationship in terms of the percent difference between control and treatment
To characterize the distribution of values of PMSD values from all laboratories and toxicants for a given method and endpoint were combined and sample percentiles reported Percentiles are also reported for the CV of the control which also indicates variability among replicates under non-toxic conditions and may be a useful indicator of uniformity of the test organisms The sample percentiles are reported in more detail in Appendix B the 10th and 90th percentiles are shown in Table 3-6 Method 10090 (red macroalga) is omitted from Table 3-6 because it would be inadvisable to characterize method variability using only 23 tests from only two laboratories
The 90th percentile may be used as an upper PMSD bound (ie a limit on the insensitivity of a test) The 10th percentile may be used as a lower PMSD bound for declaring a significant difference or a lower limit to test sensitivity The 90th percentile has been used in other WET programs (Chapter 5) The 95th
percentile is used as a practical upper limit for the variability of analytical results in well-controlled between-laboratory studies that use a standard protocol and specific quality assurance procedures (ASTM 1992 1998 USEPA 1993 1996a 1996b) The tests summarized here have not been subjected to the rigorous standardization and quality assurance of collaborative studies and the data have not been screened for outliers as specified by ASTM Practices D2777 and E691 (ATSM 1992 1998) These considerations justify using the sample 90th percentile to set an upper bound A lower bound is necessary to avoid creating a disincentive for improving test precision and to objectively specify a limit to the test sensitivity achieved in practice If no more than ten percent of tests are more precise than this lower bound then in practice the analytical method rarely detects toxic effects of this small magnitude
When comparing values in Table 3-6 to a test result it is important that the testrsquos MSD be calculated according to procedures described in the EPA method manuals (USEPA 1993 1994a 1994b) for Dunnettrsquos test for multiple comparisons with a control (see Section 641) An analysis of variance (ANOVA) is conducted using several treatments including the control EPA methods require excluding from the ANOVA those concentrations for which no organisms survived in any replicate For a sublethal endpoint concentrations are excluded from the analysis if they exceed the NOEC for survival The MSD is calculated
June 30 2000 3-8
c
Understanding and Accounting for Method Variability in WET Applications Under the NPDES Program
using the square root of the error mean square (rEMS) from the ANOVA and using Dunnettrsquos critical value (which depends on the number of replicates and concentrations used in the ANOVA)
Table 3-6 Range of Relative Variability for Endpoints of Promulgated WET Methods Defined by the 10th and 90th Percentiles from the Data Set of Reference Toxicant Testsa
Test Methodb Endpointc No of Labs
No of Tests
PMSD Control CVd
10th 90th 10th 90th
10000 Fathead Minnow G 19 205 94 35 0035 020
10020 Ceriodaphnia dubia R 33 393 11 37 0089 042
10030 Green Alga G 9 85 93 23 0034 017
10040 Sheepshead Minnow G 5 57 63 23 0034 013
10060 Inland Silverside G 18 193 12 35 0044 018
10070 Mysid G 10 130 12 32 0088 028
20000 Fathead Minnow S 20 217 42 30 0 0074
20020 Ceriodaphnia S 23 241 50 21 0 011
20040 Sheepshead Minnow S 5 65 0e 55 0 0
20060 Inland Silverside S 5 48 70 41 0 0079
20070 Mysid (A bahia) S 3 32 51 26 0 0081
20110 Mysid (H costata) S 2 14 18 47 0 0074
20210 Daphnia (D magna) S 5 48 53 23 0 011
20220 Daphnia (D pulex) S 6 57 58 23 0 011 a The precision of the data warrants only three significant figures When determining agreement with these values one may
round off values to two significant figures (eg values gt345000 and 35000 are rounded to 35) Method 10090 (red macroalga) is not reported because it is inadvisable to characterize method variability using only 23 tests from just two laboratories
b EPA did not assign method numbers for acute methods in EPA6004-90027F The numbers assigned here were created for use in this document and in related materials and data bases G = growth R = reproduction S = survival
d CVs were calculated using untransformed control means for each test e An MSD of zero will not occur when the EPA flow chart for statistical analysis is followed In this report MSD was
calculated for every test including those for which the flow chart would require a nonparametric hypothesis test EPA recommends using the value 42 (the 10th percentile shown for the fathead minnow acute test) in place of zero as the 10th
percentile PMSD (lower PMSD bound) for the sheepshead minnow acute test
The MSD was calculated for all test results reported here including those for which non-normality and heterogeneity of variance were indicated Thus this document presents MSD as an approximate index of test sensitivity Estimates of power are also approximate The MSD generally will be related to test sensitivity even when the assumptions for ANOVA and Dunnettrsquos test are not strictly satisfied
Table 3-7 shows the number of laboratories in the WET variability data set having tests exceeding the upper PMSD bound reported in Table 3-6 One-half to two-thirds of the laboratories never or infrequently exceeded the bound and roughly one in five exceeded it in at least 20 percent of their tests By definition of the 90th percentile about 10 percent of all the tests exceeded the bound
June 30 2000 3-9
Understanding and Accounting for Method Variability in WET Applications Under the NPDES Program
Table 3-7 Number of Laboratories Having a Given Percent of Tests Exceeding the PMSD Upper Bound for the Sublethal Endpoint
Test Method No Labs Endpointsa
Number of Labs with Various Percentages of Tests Exceeding the PMSD Upper Bound
0 0-10 10-20 20-50 50-100
10000 Fathead Minnow 19 G 8 2 7 2 0
10020 Ceriodaphnia dubia 33 R 15 7 5 6 0
10030 Green Alga 9 G 6 1 0 2 0
10040 Sheepshead Minnow 5 G 3 1 0 1 0
10060 Inland Silverside 16 G 6 5 1 4 0
10070 Mysid (growth) 10 G 5 2 0 3 0 a G = growth R = reproduction
34 Conclusions about Variability of WET Methods
341 Variability of EC25 LC50 NOEC
For EC25 the quartiles of the within-laboratory CVs ranged across the promulgated methods from 009 to 045 and the median CV ranged from 013 to 038 For LC50 the quartiles of the within-laboratory CVs ranged from 007 to 035 and the median CV ranged from 008 to 028 For NOEC the quartiles of the within-laboratory CVs ranged from 0 to 061 and the median CV ranged from 018 to 046 This summary applies to those methods represented by at least 20 tests and three laboratories
EPA concludes from Tables 3-2 through 3-4 that point estimates are substantially less variable than the NOEC for the same method and endpoint and that the LC50 for an acute toxicity test usually is less variable than the LC50 for a chronic toxicity test The estimated NOEC is more variable than ECp using current experimental designs because NOEC can take only those values equal to the concentrations tested while ECp interpolates between tested concentrations (there may be other more technical reasons as well) In principle NOEC could be estimated more accurately and precisely by changing the experimental design to use more concentrations at narrower dilution ratios and by using more replicates The greater variability of the NOEC underscores the desirability of using point estimates to characterize effluent toxicity
Tables 3-2 through 3-4 may be used as benchmarks for variability allowing comparison of one laboratoryrsquos CV for reference toxicant testing with CVs reported by experienced laboratories reporting tests that passed the TAC However CVs for methods represented by too few laboratories in the table may be atypical
The CVs in Tables 3-2 through 3-4 may be used as an adjunct to the control chart If the CV for reference toxicant tests is above the 75th percentile in Tables 3-2 through 3-4 variability likely can be reduced even if the individual EC25 or LC50 values fall within the control limits If a control chart is constructed using an unreasonably large standard deviation the control limits will be unreasonable If a high CV is not fully explained by an unusually small mean the standard deviation of EC25 or LC50 should be reduced to bring the CV within the normal range If the CV exceeds the 90th percentile (Appendix B) there is no question that variability is unacceptably large Detailed guidance is provided in Chapter 5 (Section 5311)
Tables 3-2 through 3-4 indicate the magnitude of the analytical variability that becomes part of the variability of effluent test results under certain conditions This occurs when effluent test results (NOECs LC50s or EC25s) fall between the lowest and highest concentrations tested Under other conditions these
3-10 June 30 2000
Understanding and Accounting for Method Variability in WET Applications Under the NPDES Program
CVs may not accurately represent analytical variability If tests give results consistently near or at the lowest or highest concentrations tested or if the tests often produce ldquoless thanrdquo or ldquogreater thanrdquo results Tables 3-2 through 3-4 will not accurately characterize the analytical CV for such tests To measure the analytical CV under such conditions reference toxicant tests would have to be designed to have the effect concentration at or near the lowest or highest concentration The CV and standard deviation measured under such conditions are unknown but are likely to differ from those for standard reference toxicant tests
The data set did not contain information supporting an analysis of the causes of between-laboratory variability Possible causes may include laboratory differences in concentration series incorrect or ambiguous calculation or reporting of concentrations (eg concentration of the metal ion versus the salt) laboratory differences in dilution water (eg water hardness or pH) laboratory differences in foods and feeding regimes and laboratory differences in cultures (genotypic and phenotypic differences in sensitivity to various toxicants)
The lack of a standard or common reference toxicant creates a problem for permittees and regulatory authorities attempting to evaluate and compare laboratories Real or apparent differences occur between laboratories in the mean values of EC25 LC50 and NOEC Some of this difference is random and reflects only the within-laboratory variance some may be systematic Systematic between-laboratory differences can be inferred reliably only when laboratories use the same test method use the same reference toxicants and dilution series use similar dilution waters and report a sufficient number of tests
342 Variability of Endpoint Measurements
EPA has selected the PMSD to characterize endpoint variability for WET test methods because it integrates variability from several concentrations (always including the control) and it represents the MSD used in the WET hypothesis test The control CV by itself does not fully represent the variability affecting a WET hypothesis test or point estimate The PMSD also represents the variability affecting point estimates because it is calculated using the EMS for the endpoint measurement (However the standard error of a point estimate of an effect concentration may be a complicated function of the EMS)
PMSD for sublethal endpoints ranged from 6 to 37 across the promulgated chronic methods For the fathead minnow chronic method PMSD ranged from 9 to 35 for the Ceriodaphnia chronic method PMSD ranged from 11 to 37 Thus most chronic tests were able to distinguish a reduction of 37 percent or smaller in the endpoint Further analysis in Chapter 5 shows that most tests were unable to distinguish consistently a 25-percent reduction For the survival endpoint of promulgated acute methods PMSD ranged from 0 to 55 For the two most commonly used acute methods (fathead minnow and Ceriodaphnia) PMSD ranged from 4 to 30 and from 5 to 21 respectively Thus PMSD varied markedly for some acute methods and not for others
As shown by the size of PMSD test sensitivity to detect substantial toxic effects is occasionally insufficient at some laboratories and routinely insufficient at a few laboratories Inadequate test sensitivity is not always signaled by control charts of EC25 LC50 and NOEC Laboratories should consider maintaining control charts for MSD or PMSD and should report MSD and the control mean with all WET tests
Some portion of MSDs in the WET variability data set could be considered exceptionally large if not outliers This observation underscores the importance of a careful review for each WET test including an examination of means and standard deviations for endpoint responses at each concentration the plotting of replicate data (not just concentration means) and when necessary a search for possible causes of excessive variability The tables and plots in the promulgated methods (USEPA 1994a 1994b) provide good examples
June 30 2000 3-11
Understanding and Accounting for Method Variability in WET Applications Under the NPDES Program
This page intentionally left blank
3-12 June 30 2000
40 VARIABILITY IN CONTEXT
EPA manages the regulation of WET in the same way it manages the regulation of chemical-specific pollutants in order to determine reasonable potential (RP) derive permit limits determine data quality control and evaluate self-monitoring data Many similarities between chemical-specific toxicant and WET controls can be found in the TSD (USEPA 1991a) Determining RP in both cases uses many of the same strategies Permit limit derivation makes similar exposure assumptions and relies on nearly identical toxicological data bases
Considering a value other than the best analytical estimate as a measure for WET or for specific chemical analytes is inappropriate All analytical results in either chemical-specific analyses or WET tests incorporate some estimated range of uncertainty While infrequently discussed for chemical methods uncertainty does play a role in the meaning of analytical results One end of the confidence interval likely will be less protective of aquatic resources than the other The derived limit and therefore final reported analytical results become the best estimate of the actual ecological need and assessment of the effect
Significant debate has occurred over assertions that WET data have too much inherent variability for reliable use in the NPDES program This debate has engendered considerable evaluation of WET precision Groups of scientists and individual researchers have repeatedly concluded that currently promulgated WET methods are technically sound and that the observed precision is within the range of precision of other analyses frequently required in NPDES permits (Grothe et al 1996) The findings of some of the significant sources of these conclusions are summarized below
41 Society of Environmental Toxicology and Chemistry Pellston WET Workshop
The 1995 Society of Environmental Toxicology and Chemistry (SETAC) Pellston Workshop on Whole Effluent Toxicity convened 47 experts in the discipline to assess applied methods and their application in the regulatory process Representation at the workshop was intentionally balanced among government business and academic participants These scientists published consensus conclusions and recommendashytions including the following
411 General Conclusions and Recommendations
Grothe et al (1996) state ldquoExisting WET testing methods (USEPA 1985 USEPA 1988 USEPA 1989) are technically sound but certain modifications would improve endpoint interpretation Such changes involve implementing improvements to currently used statistical procedures establishing acceptable limits for MSD values and adding confidence limits to WET test endpointsrdquo
ldquoA number of problems with WET tests are caused by misapplication of the tests misinterpretation of the data lack of competence of the laboratories conducting WET testing poor conditionhealth of test organisms and lack of training of laboratory personnel regulators and permittees More widespread use of WET related guidance provided in USEPArsquos TSD (1991a) would help alleviate some of these problems In addition an effective QAQC program will improve data quality and reduce test variabilityrdquo
ldquoIncrease training opportunities for regulators and permittees to improve the implementation of WET objectives and to promote national consistency in permitting and compliance issuesrdquo
June 30 2000 4-1
Understanding and Accounting for Method Variability in WET Applications Under the NPDES Program
ldquoImplement a broadly based and standardized QAQC program to improve WET testing performance and data qualityrdquo
ldquoQuantify the lsquoconfidencersquo around test endpoints to improve interpretation of WET test results Specific statistical methods that could improve precision are presented in Chapter 3 of this document and processes to reduce variability are discussed in Chapter 5 In addition WET tests should be performed using a dilution series of exposure concentrations to establish a dose-response relationshiprdquo
412 Conclusions about Data Precision
Ausley (1996) compared CVs of chemical analyses and aquatic toxicity tests conducted by North Carolina NPDES permittees Ausley found that CVs of reported values for chemical analytes (including metals organic analytes and non-metal inorganic analytes) ranged from 118 percent to 2917 percent Coefficients of variation for toxicity parameters (acute and chronic Ceriodaphnia dubia acute and chronic Pimephales promelas acute Daphnia pulex and acute Mysidopsis bahia) ranged from 148 percent to 676 percent From this review he concluded that ldquothe precision of toxicity analyses is within the range of that being reported for commonly analyzed and regulated chemical parametersrdquo Ausley highlighted the difficulty in comparing precision estimates of chemical analytes and WET analyses (particularly NOECs) noting that while chemical precision is often determined well above analytical detection WET precision is often based on the minimum detection level An assumption that WET precision will vary among toxicants is also logical To establish ldquoinherent variabilityrdquo considering toxicants that cause minimal variability in the analysis may be appropriate The high coefficients of variation for some chemical parameters reported by Ausley reflect the fact that in practice analytical precision can vary widely in individual studies in which the effects of a single (or a few) poorly operating laboratory can adversely affect precision estimates In practice this kind of data must be screened for quality prior to use to evaluate self-monitoring data or estimates of overall method quality
Ausleyrsquos results closely approximate analytical precision of chemical analytes referenced in the TSD (USEPA 1991a Chapter 12) The CVs for metals (aluminum cadmium chromium copper iron lead manganese mercury silver and zinc) ranged from 18 percent to 129 percent at the low end of the measurement detection range Between-laboratory CVs for organic analytes ranged from greater than 12 percent to 91 percent The CVs for non-metal analytes (alkalinity residual chlorine ammonia nitrogen Kjeldahl nitrogen nitrate nitrogen total phosphorus biological oxygen demand chemical oxygen demand and total organic carbon) ranged from 46 percent to 70 percent in between-laboratory studies of precision
Burton et al (1996) concluded that ldquoUSEPA-published methods are functional and appropriate in the context of effluent toxicity control programsrdquo They recommended developing limits on within-test variability a quality assurance and audit program and guidance for permittee procurement of WET analytical services
Denton and Norberg-King (1996) cited various studies that favorably compare WET methods with chemical analytical methods (Grothe and Kimerle 1985 Rue et al 1988 Morrison et al 1989 Grothe et al 1990) They proposed that improvements in test result consistency could be accomplished by limiting the range of within-test variability through controls of upper and lower statistical power (eg limits on test MSD) Three practices to control within-test variability most effectively are (1) controlling within-test sensitivity (2) following well-defined test methods and (3) maintaining communication within the regulatory community For example the permittee and regulatory authorities should discuss any facility-specific issues to fully characterize the appropriate permit conditions
June 30 2000 4-2
Understanding and Accounting for Method Variability in WET Applications Under the NPDES Program
42 Water Environment Research Foundation Study
Another publication ldquoWhole Effluent Toxicity Testing Program Evaluation of Practices and Implementationrdquo (DeGraeve et al 1998) presents the results of a survey of publicly owned treatment works and State regulatory programs about WET issues The Water Environment Research Foundation (WERF) sponsored this study Conclusions by DeGraeve et al (1998) include the following
ldquoThe project team believes that the results demonstrate that the test methods can be routinely completed successfully by well-trained competent WET testing laboratories and that the results considered collectively suggest that the test methods that are being used to measure WET are technically soundrdquo
ldquoThere is a need for better trainingguidance in WET-related issues for both the regulatory staff responsible for implementing WET requirements and for permittees responsible for meeting WET limitsrdquo
DeGraeve et al (1998) considered the conclusions of the SETAC Pellston WET publication concurring that between-laboratory CV values of toxicity test methods were low training of regulatory and permittee staff is needed nationally and strengthened quality assurance (QA)quality control (QC) practices could improve performance of analyses Unlike the SETAC Pellston WET conclusions they found that there are enough laboratories to meet the current market demand for analyses Like the SETAC effort DeGraeve et al (1998) concluded that a national center of expertise on WET issues would be beneficial to provide guidance to regulatory agencies permittees and laboratories
WERF also funded a project entitled ldquoWhole Effluent Toxicity Testing Methods Accounting for Variancerdquo (Warren-Hicks et al 1999) This study compared within- and between-laboratory results of reference toxicant test variation as measures of reproducibility and comparability respectively The authors concluded that some laboratories could consistently reproduce test results while others could not and inferred that test precision is a factor of laboratory experience and not inherent methodological weakness The authors recommended that national studies be conducted to evaluate within- and between-laboratory precision of promulgated WET test methods (EPA has already initiated this study) They also recommended that additional test acceptability criteria (TAC) such as upper and lower bounds of MSD be established and incorporated in the NPDES process The latter recommendation corroborates other researchersrsquo recommendations discussed above
43 Minimizing Variability by Adhering to WET Toxicity Test Methods
Specific factors that affect variability in WET analyses have been described in several papers (Burton et al 1996 Ausley 1996 Erickson et al 1998 Davis et al 1998) The most important initial consideration in developing precise data is a laboratoryrsquos experience and success in performing a specific analysis Most critical reviews of WET data precision emphasize this initial consideration Experienced professionals most likely will be able to develop the most consistent and reliable information and can interpret anomalous conditions in the testing or results
An additional factor in considering WET test method variability is whether the prescribed methods (eg the EPA toxicity test methods promulgated in 40 CFR Part 136) are being followed appropriately (see Chapter 5) If tests are submitted that do not meet specified TAC or are produced when laboratory QA testing indicates analyses are beyond control limits these results should not be used in the NPDES process Tests performed on effluent samples that have not met required temperature maxima or holding times should not be considered for regulatory purposes Rigorous QA practices are critical to the success of any analytical program Both the regulatory authority and permittee should strive to ensure that such practices are in place
June 30 2000 4-3
Understanding and Accounting for Method Variability in WET Applications Under the NPDES Program
for any program developing WET data whether by national laboratory accreditation State regulatory certification direct permittee oversight or specific contractual agreement with the laboratory
Comparisons of WET method precision with analytes commonly limited in NPDES permits clearly demonstrate that the promulgated WET methods are within the range of variability experienced in other analyses Several researchers also noted clear indications that method performance improves when prescribed methods are followed closely by experienced analysts (Grothe et al 1996 DeGraeve et al 1998)
A review of WET test results confirms that imprecise WET data are being reported As with any analytical technique inexperienced individuals can perform analyses incorrectly or fail to follow appropriate methods and quality assurance practices Using the training that is available for these methods and quality assurance techniques referenced by this document will help ensure that data of maximum reliability are used and that sound decisions are made based on those results The Western Coalition of Arid States conducted a study in 1997 (Moore et al 2000) which reported the results of 16 tests with a non-toxic test sample using the Ceriodaphnia dubia chronic test These results indicated that 43 percent of the tests showed toxicity EPA is in the process of reviewing the paper and the raw data
Persons interested in WET issues may consult another source of information developed by the SETAC Whole Effluent Toxicity Expert Advisory Panels This group established under a cooperative agreement with EPA provides scientific opinion and training on WET technical issues This information is available on the Internet at the SETAC web site httpwwwsetacorg Appendix D contains frequently asked questions with answers prepared by the SETAC WET Expert Advisory Panels The expert panels have identified and discussed various factors that affect WET variability
44 Conclusion
When the variability of WET analyses is viewed in the context of the NPDES program these techniques produce data that are as precise as those from chemical analyses As with any other analytical system lack of experience in performing the analyses adherence to prescribed QA practices or good laboratory practices will reduce the precision of the results Studies of these factors by independent researchers from both the regulatory and regulated communities support these conclusions While examples of poor-quality highly variable results from chemical analyses have also been publicized these results are frequently influenced by the shortcomings mentioned above Permittees that must generate and use WET data should become well-educated in data quality interpretation and permittees should require that QC practices be followed by laboratories generating the data Various sources of information presented in this chapter should assist permittees testing laboratories and regulatory authorities with this education process Examples of practices that can further reduce the imprecision of analyses are also discussed in Chapters 5 and 6 of this document Additional refinements of TAC can likewise improve test power to detect effects (or the lack thereof) and increase the statistical confidence in results
June 30 2000 4-4
50 GUIDANCE TO REGULATORY AUTHORITIES LABORATORIES AND PERMITTEES GENERATING AND EVALUATING
EFFECT CONCENTRATIONS
51 Steps for Minimizing Test Method Variability
This chapter provides the background and recommendations on WET test procedures related to sampling conducting the toxicity test methods and conducting the statistical methods Implementing these recommendations should decrease or minimize WET test method variability thereby increasing confidence to make regulatory decisions (see Figure 5-1) EPA stands behind the technical soundness of the current WET test methods The critical steps in minimizing WET test method variability are (1) obtaining a representative effluent sample (2) conducting the toxicity tests properly to generate the biological endpoints and (3) conducting the appropriate statistical analysis to obtain powerful and technically defensible effect concentrations Minimizing variability at each step increases the reliability of the WET test results For example factors that affect variability include sampling procedures sample representativeness deviations from standardized test conditions (eg temperature test duration feeding) test organisms source of dilution water and analyst experience and technique in conducting the toxicity tests properly (Burton et al 1996)
52 Collecting Representative Effluent Samples
The goal of effluent sampling is to obtain a representative sample that reflects real-world biological responses Factors affecting the representativeness of effluent samples may include the sampling location frequency and type (eg composite or grab) and sample volume container preservation methods and holding time Burton et al (1996) concluded that the above factors considerably influence test result variability
Effluent samples must be collected at a location that represents the entire regulated flow or discharge Typically the sampling site is designated in the discharge permit As with sampling for any parameter effluent samples should be collected from a location where the flow is turbulent and well-mixed Additionally effluent samples should be collected at a frequency that enables adequate characterization of the discharge over time (eg accounts for daily to seasonal changes and variations in effluent quality) Major facilities should conduct WET testing monthly or quarterly while minor facilities should conduct WET testing semi-annually or annually
Appropriate sample types should be collected to represent the effluent fully When the effluent is variable collecting composite samples may be necessary When the effluent is less variable grab samples may be sufficient (eg from long-term retention pond facilities)
Sample containers should be non-reactive so that they do not affect sample characteristics Table II of 40 CFR Part 136 requires that toxicity test samples be collected in glass or plastic containers as specified in the methods Sufficient sample volume should be collected for the type of test being conducted including the number of test dilutions When samples are collected in Cubitainersreg headspace should be minimized
Samples must be properly preserved Part 136 of 40 CFR requires that samples for WET testing be cooled to 4EC when shipped off-site and between test sample renewals Samples must be cooled during all phases of collection transportation and storage to minimize physicochemical changes Samples must be tested within the specified maximum holding times before significant changes occur such as volatilization or biological or chemical degradation If samples are not tested within specified maximum holding times the test is invalid and must be repeated by collecting a new effluent sample and conducting a new toxicity test to comply with the NPDES permit
June 30 2000 5-1
Understanding and Accounting for Method Variability in WET Applications Under the NPDES Program
Figure 5-1 Steps to minimize WET test method variability
53 Conducting the Biological Test Methods
Four main components of WET tests afford opportunities to control and minimize variability within tests and within and between laboratories (1) quality control (QC) procedures (2) experimental design (3) test power and (4) test acceptability criteria (TAC) beyond the minimum requirements specified in EPArsquos WET test methods
June 30 2000 5-2
Understanding and Accounting for Method Variability in WET Applications Under the NPDES Program
531 Quality Control Procedures
Quality assurance (QA) practices for toxicity tests address all aspects of the tests that affect data quality These practices include effluent sampling and handling test organism source and condition equipment condition test conditions instrument calibration replication use of reference toxicants recordkeeping and data evaluation The EPA WET toxicity testing manuals specify the minimum requirements for each aspect Regulatory authorities have the discretion to prepare and implement additional guidance beyond the minimum requirements specified in EPArsquos WET test methods
An integral part of the QA program is quality control (QC) The QC procedures are the more focused and routine activities conducted under the overall QA program An important QC component in WET testing is the requirement to conduct reference toxicant tests with effluent tests The WET test methods outline when reference toxicant tests are to be conducted (See sections on quality of test organisms in the manuals) Reference toxicant testing serves two purposes (1) determine the sensitivity of the test organisms over time and (2) assess the comparability of within- and between-laboratory test results Reference toxicant test results can be used to identify potential sources of variability such as test organism health differences among batches of organisms changes in laboratory water or food quality and performance by laboratory technicians In the QA section of each promulgated test method (USEPA 1993 1994a 1994b) EPA recommends sodium chloride potassium chloride cadmium chloride copper sulfate copper chloride sodium dodecyl sulfate and potassium dichromate as suitable reference toxicants The methods do not however specify a particular reference toxicant or the specific test concentrations for each test method
The current characterization of WET test method variability is limited by the ability to quantify sources of within- and between-laboratory variability because laboratories can use different reference toxicants and test concentrations for a particular method Future evaluations of method variability would be greatly enhanced by having data to analyze from multiple laboratories for the same reference toxicant the same dilution water at similar pH and hardness and the same test concentrations By standardizing reference toxicants testing laboratories could compare test results permittees and regulatory authorities could better compare and evaluate laboratories and the data could be used to further quantify within- and between-laboratory test precision Specification of the reference toxicant and test concentrations for a method across laboratories would provide a much larger and consistent data base to assess the comparability of within- and between-laboratory test results
Standardizing reference toxicants and test concentrations has been discussed in the literature For example the chronic methods manual for West Coast species (USEPA 1995) specifies the reference toxicant and test concentrations for each test species The Southern California Toxicity Assessment Group (SCTAG) is comprised of representatives from permittees testing laboratories regulatory authorities and academic institutions that met to discuss technical aspects of WET testing (eg standardization of reference toxicants control charts) The SCTAG (1996) prepared a report to standardize reference toxicants for the chronic freshwater test methods This report evaluated an extensive data base of reference toxicant data The report recommended specific reference toxicants and test concentrations for these methods The SCTAG (1997) also prepared a QAQC checklist to help toxicity testing laboratories establish and maintain appropriate data quality measures Regulatory authorities should review these publications when standardizing reference toxicants
The selection of reference toxicants and test concentrations should be based on specific criteria The following criteria recommended in the SCTAG report provide an excellent basis for selecting standardized reference toxicants
1 The toxicant should provide precise and reliable measures of toxicological sensitivity
2 Toxicant disposal should not be legally or environmentally problematic
June 30 2000 5-3
Understanding and Accounting for Method Variability in WET Applications Under the NPDES Program
3 The toxicant should produce a concentration-response effect for the test organism
4 The toxicant should be quantifiable
5 The toxicant should not pose an unacceptable health hazard to laboratory personnel
6 The toxicant should be readily available
Most recently Warren-Hicks et al (1999) recommended that national acceptance criteria be specified with upper and lower acceptance limits for reference toxicant test results which all laboratories would need to achieve to obtain accreditation Variability could decrease nationally if testing laboratories are provided with more detail on the evaluation and interpretation of reference toxicant control charts (APHA-AWWAshyWEF 1998) For example such guidance could describe how to evaluate test results within the warning limits Both Environment Canada (1990 2000) and APHA-AWWA-WEF (1998) have prepared guidance on evaluating control chart data The Environment Canada (2000) report specifies using zinc as an inorganic reference toxicant and phenol as an organic reference toxicant for many aquatic tests The report also specifies eight criteria for selecting specific reference toxicants
1 Previous use
2 Availability in a pure form
3 Solubility
4 Stability in solution
5 Stability during storage
6 Ease of analysis
7 Stable toxicity with normal changes in qualities of laboratory water
8 Ability to detect abnormal organisms
Regulatory authorities may want to evaluate the above reports and the SCTAG reference toxicant recommendations for the chronic freshwater test methods Regulatory authorities may also want to evaluate and recommend a standard reference toxicant and a specific concentration series for each acute and chronic test method using data from this guidance document
5311 Guidance Related to Quality Control Charts and Laboratory Audits
Ausley (1996) recommends some oversight of data quality such as evaluating tests in meeting QC criteria using randomization procedures and operating in allowed reference toxicant ranges to ensure that QC procedures are properly implemented Another integral component of QC is the maintenance of control charts for reference toxicants and effluents Laboratories should provide regular review of control charts EPA suggests keeping a control chart for each combination of test material test species test conditions and endpoints with a maximum of 20 test results Modern software makes accumulating data and reviewing key test statistics possible with relatively little effort Elementary methods can identify problems contributing to variability Laboratories should practice regular control charting of test PMSDs and control performance for all tests along with control charting of effect concentrations such as NOEC and point estimates for reference toxicants tests Successive tests should be compared occasionally to detect repeated patterns such as one replicatersquos being consistently higher or aberrant or a trend over time Time sequence plots of concentration means and standard deviations would be useful in this regard Occasionally a set of 5 to 20 tests in which block positions (see Appendix A in USEPA 1994b) have been recorded should be subjected to ANOVA for block or position effects If such effects are significant or large the laboratory should seek advice on randomizing the replicates and concentrations
June 30 2000 5-4
Understanding and Accounting for Method Variability in WET Applications Under the NPDES Program
If a laboratoryrsquos CV exceeds the 75th percentile CV from Tables 3-2 through 3-4 EPA recommends calculating warning and control limits based on the 75th and 90th percentiles respectively of CVs for the method and endpoint (Tables 3-2 and 3-3 and Appendix Tables B-1 and B-2) For example suppose the mean EC25 for a series of Ceriodaphnia chronic tests (Method 10020 with reproduction as the endpoint) conducted at one laboratory with reference toxicant is 134 gL NaCl Also suppose that the standard deviation of the EC25s for these tests is 085 The CV for this set of EC25s is thus 063 In Table 3-2 the 75th percentile of CVs for this testrsquos reproduction endpoint is 045 Calculate the standard deviation corresponding to the 75th percentile CV SA75 = 134 times 045 = 060 In Appendix Table B-1 the 90th
percentile of CVs is 062 for this method and endpoint Calculate SA90 = 134 times 062 = 083 Because the CV for this series of EC25s exceeds the 90th percentile reported in Table B-1 EPA recommends the following
bull Set control limits using SA90 = 083
bull Set warning limits using SA75 = 060
bull Promptly take actions to bring results within the control limits and
bull Attempt to bring results within the warning limits in 3-12 months
If the CV for the set of EC25s is less than the 90th percentile reported in Table B-1 use that CV to set control limits If the CV for the set of EC25s is less than the 75th percentile in Table 3-2 do not set warning limits using the latter value
In addition Burton et al (1996) encourage regulatory programs to have a laboratory audit component to document the existence and effectiveness of a QAQC program directed at toxicity testing including analyst training and experience Regulatory authorities should use the National Environment Laboratory Accreditation Program (NELAP) (USEPA 1999a) and routine performance audit inspections to evaluate individual laboratory performance Inspections should evaluate the laboratoryrsquos performance with QC control charts based on reference toxicants examine procedures for conducting the toxicity test procedures and examine procedures for analyzing test results
Regulatory authorities should develop a QC checklist to assist in evaluating and interpreting toxicity test results Appendix E presents examples of State WET implementation procedures related to reviewing reference toxicant data and information on additional QAQC criteria that have been developed and implemented Regulatory authorities should also provide additional guidance related to the interpretation of QC control charts This additional guidance could be that laboratories maintain control charts on within-test variability (eg PMSD) and use warning and control limits based on the 75th and 90th percentiles of CVs for the test method and endpoint
532 Experimental Design
Experimental design includes randomizing the experimental units (ie treatments organisms replicates) establishing the statistical significance level (ie alpha level) and specifying the minimum numbers of replicates test organisms and treatments Oris and Bailer (1993) recommend that test design and TAC be based not only on a minimum level of control performance but also on the ability to detect a particular level of effect (ie test power)
A Type I error (ie ldquofalse positiverdquo) results in the false conclusion that an effluent is toxic when it is not toxic A Type II error (ie ldquofalse negativerdquo) results in the false conclusion that an effluent is not toxic when it actually is toxic Power (1 - beta) is the probability of correctly detecting a true toxic effect (ie declaring an effluent toxic when it is in fact toxic) Acceptable values for alpha range from 001 to 010 (1 to 10 percent) The current EPA test methods recommend an alpha rate of 005 or 5 percent in the toxicity
June 30 2000 5-5
Understanding and Accounting for Method Variability in WET Applications Under the NPDES Program
testing manuals Currently EPA is preparing guidance on when an alpha rate of 001 or 1 percent would be considered acceptable (USEPA 2000a)
5321 False Positives in WET Testing
The hypothesis test procedures prescribed in EPArsquos WET methods provide adequate protection against incorrectly concluding that an effluent is toxic when it is not The expected maximum rate of such errors is the alpha level used in the hypothesis test The hypothesis test procedure is designed to provide an error rate no greater than alpha when the default assumptions are met The statistical flow chart provided with each EPA WET method identifies cases when default assumptions are not satisfied and therefore when data transformations or alternative statistical methods (eg a nonparametric test) should be used
Alpha and beta are related (ie as alpha increases beta decreases) assuming that the sample size (number of treatments number of replicates) size of difference to be detected and variance are held constant The alpha and beta error rates depend on satisfying the assumptions of the hypothesis test To ensure that statistical assumptions and methods are properly applied testing laboratories should review the statistical procedures used to produce WET test results and other factors such as biological and statistical quality assurance and verify that test conditions and test acceptability criteria were achieved
If a test is properly conducted and correctly interpreted identifying any particular outcome as a ldquofalse positiverdquo is impossible An effluent that is deemed toxic may require that the permittee conduct additional toxicity tests to determine if toxicity is re-occurring Even if no toxicity is demonstrated in follow-up tests that does not rule out that the original toxic event was a true toxic spike in the effluent False negatives however impact the environment by allowing the discharge of harmful toxicants without identification This may occur because the toxic effects are not identified as statistically significant due to lack of test sensitivity (see Sections 533 and 64)
Measurement error should not affect the protection against false positives provided by hypothesis tests and confidence intervals when they are appropriately applied Measurement error in the case of WET test treatment mean values likely consists largely of sampling errors (eg variability among organisms or containers) although errors in counting weighing and other procedures may also occur Such sources of imprecision are implicitly accounted for in WET test statistical inferences because the sample variance among the replicates within each treatment (dilution) is used for inference The test ldquosizerdquo 1 - alpha will protect adequately against false positives A larger variance among replicates however could make detecting real toxicity (ie false negatives) more difficult unless the number of replicates is increased to provide more test sensitivity and power which will reduce the rate of false negatives
5322 False Negatives in WET Testing
For a given alpha beta decreases (power increases) as the sample size increases and the variance decreases Decreasing alpha from 005 to 001 without otherwise changing the hypothesis test will reduce the ability of the test to detect toxicity that is will reduce the power of the test Thus as alpha for the hypothesis test is decreased there is an inevitable trade-off between the rate of false positives when toxicity is not present and the ability to detect toxicity when it is present (ie statistical power)
To limit within-test variability and thus increase power EPA developed a minimum significant difference (MSD) criterion that must be achieved in the chronic West Coast marine test methods (USEPA 1995) The MSD is a measure of the within-test variability and represents differences between treatments and the control that can be detected statistically Distributions of the MSD values of multiple tests for a specific reference toxicant and test method can be used to determine the level of test sensitivity achievable by a certain percentage of tests Denton and Norberg-King (1996) analyzed several chronic test methods to quantify the effect size based on the existing toxicity test method experimental design and MSD distributions
June 30 2000 5-6
Understanding and Accounting for Method Variability in WET Applications Under the NPDES Program
Denton and Norberg-King found when setting the beta error rate at 020 (power = 080) the effect size detected varies from at least a 15-percent reduction from the control response for the chronic red abalone larval development test to a 40-percent reduction from the control response for the chronic Ceriodaphnia dubia test In this document EPA has calculated power for each test method (see Section 533)
533 Test Power To Detect Toxic Effects
This section describes the statistical power and ability to detect toxic effects achieved by the current WET methods as inferred from the WET variability data set used to develop this document These inferences are approximate because assumptions of normality and homogeneity of variance were not always satisfied
Power can be characterized only by repeated testing Power is an attribute not of a single test but of a sequence of many tests conducted under similar conditions and with the same test design Therefore in this document EPA used the sample averages for each laboratoryrsquos data set to characterize each laboratory The following two parameters were required (1) the mean endpoint response in the control (growth reproduction survival) and (2) the mean value of the error mean square (EMS) for tests
EPA evaluated the ability to detect toxic effects using three approaches for each test method (1) number of replicates required to detect a 25-percent difference from the control with power of 080 (2) percent difference from the control that can be detected with power of 080 and (3) power to detect a 25shypercent difference from the control All calculations are based on a one-sided two-sample t-test at a level of 095 (alpha of 005) The power for a multiple comparison (Dunnettrsquos or Steelrsquos test) will be less than the power for this two-sample t-test
Table 5-1 summarizes the results for this evaluation Depending on the method between 30 percent and 80 percent of the laboratories were able to detect a 25-percent effect for the sublethal endpoint consistently Between 60 percent and 100 percent of the laboratories were able to detect a 33-percent effect
To examine whether the upper bounds presented in Table 3-6 provide adequate test precision EPA calculated an estimate of the power to detect a 25-percent effect on a sublethal endpoint when the PMSD equals the upper bound reported in Table 3-6 The upper bounds of the PMSD are shown in Table 3-6 in Chapter 3 At the lower PMSD bound the power always exceeded 098 Tests with PMSD equaling the upper bound are not often able to detect a 25-percent effect This finding does not mean that the upper bound is ineffective The PMSD varies between tests and each laboratory has a distribution of PMSDs To avoid exceeding this upper bound often a laboratory would have to achieve substantially lower PMSDs in most tests
5331 Attainment of the PMSD Related to Power
The power of the current experimental design could be reevaluated by comparing it to alternative designs that use increased number of replicates or number of test concentrations (Chapman et al 1996) In this document EPA found that about half of the laboratories in the data set were able routinely to detect a 25-percent difference between control and treatment About two-thirds of the laboratories could routinely detect a 33-percent difference (Table 5-2) For example mere attainment of the 90th percentile PMSD values shown in Table 3-6 will not ensure the ability to detect a 25-percent effect (Table 5-2) If every acceptable test has a PMSD below that upper bound however the average PMSD will be lowered Based on the within-laboratory variability of PMSD1 the average PMSD likely will be substantially lower than the upper bound in Table 3-6 if most tests conducted by a laboratory are to have acceptable PMSDs
The average CV for PMSD is one-third to one-half its mean in commonly used methods
June 30 2000
1
5-7
Understanding and Accounting for Method Variability in WET Applications Under the NPDES Program
Table 5-1 Tests for Chronic Toxicity Power and Ability To Detect a Toxic Effect on the Sublethal Endpoint
Test Method No
Labs
No Labs with Power
Power (Range)
No Labs Having Power at Least 08 To Detect
Effect of
Effect Detected with Power 08 as Percent of
Control Mean (Range)$$ 08 $$ 05 25 33
10000 Fathead Minnow 19 6 14 021 - 100 6 13 82 - 62
10020 Ceriodaphnia 33 10 29 038 - 100 10 19 14 - 45
10030 Green Alga 9 7 8 033 - 099 7 8 13 - 49
10040 Sheepshead Minnow 5 4 5 077 - 100 4 5 86 - 26
10060 Inland Silverside 16 7 13 023 - 097 7 12 17 - 59
10070 Mysid (growth) 10 5 8 021 - 091 5 8 21 - 70
Note Power was calculated for a two-sample one-sided t-test at alpha = 005 for a 25-percent difference from the control Effect size detected was calculated for the same test using power 080 Calculations used the average EMS from all tests at each laboratory and the minimum number of replicates reported for those tests Calculations assumed that the parametric mean and variance equal the corresponding sample estimates They also assumed approximate normality of means and homogeneity of variance Because these assumptions may be violated the results here are approximate By saying ldquodetect a 25-percent difference from controlrdquo this alternative hypothesis is intended (control mean - treatment mean) gt 025 times control mean
Table 5-2 Power To Detect a 25-Percent Difference from the Control at the 90th Percentile PMSD
Chronic Method Replicates 90th Percentiles
of PMSD
Three Treatments
Four Treatments
Five Treatments
alpha = 005
alpha = 0053
alpha = 005
alpha = 0054
alpha = 005
alpha = 0055
10000 Fathead Minnow 3 35 039 025 039 019 039 015
4 35 041 030 042 026 043 023
10020 Ceriodaphnia 10 37 039 031 041 030 043 030
10030 Green Alga 3 35 039 025 039 019 039 015
4 35 041 030 042 026 043 023
10040 Sheepshead Minnow 3 23 072 069 072 062 073 055
4 23 073 071 074 068 075 066
10060 Inland Silverside 3 23 072 069 072 062 073 055
4 23 073 071 074 068 075 066
10070 Mysid 8 32 048 041 050 040 052 040
Notes Values are rounded to two significant figures Number of treatments is the number of concentrations compared with the control in the hypothesis test The calculations assumed (1) the usual assumptions of the test are satisfied (approximate normality homogeneity of variances) and (2) equal replication in treatments and control Because these assumptions may be violated the results here are approximate Because the MSDmean implies a value for [root (error mean square)mean] the latter could be calculated from the MSD Dunnettrsquos critical value and the number of replicates and then used in a calculation of power Calculations apply to a one-sided two-sample t-test of equal means assuming equal variances and equal replication with hypotheses Hocontrol mean - treatment mean = 0 versus Hacontrol mean - treatment mean gt 025 times control mean The power achieved by Dunnettrsquos multiple comparison procedure will lie between the two-sample power at alpha = 005 and that for alpha = 005(no of treatments)
June 30 2000 5-8
Understanding and Accounting for Method Variability in WET Applications Under the NPDES Program
Testing laboratories and permittees can examine the EMS or MSD in Tables B-14 and B-15 (Appendix B) to estimate the ability of a WET test to detect toxic effects Some regulatory authorities may require a comparison between the control and the receiving water concentration which requires a two-sample one-sided t-test Others may require the multiple comparisons procedure described in the EPA WET methods (Dunnettrsquos or Steelrsquos tests one-sided with alpha of 005) The power of Dunnettrsquos procedure falls between the power of the one-sided two-sample t-test with alpha of 005 and alpha of 001 assuming that no more than five toxicant concentrations are compared to a control The power of Steelrsquos procedure will be related to and should usually increase with the power of Dunnettrsquos procedure and the t-tests Tables B-14 and B-15 in Appendix B also provide an appropriate guide to achieving power using a nonparametric test
Recently the State of Washington (1997) issued guidance specifying an acute and chronic statistical power standard to be achieved for compliance testing EPArsquos sediment toxicity testing manuals (USEPA 1994c USEPA 2000) include power curves for various numbers of experimental units CV ranges and associated alpha and beta levels Sheppard (1999) is a good source to provide a simple explanation of how power helps determine how large a sample should be Additional information on power may be obtained at httpwwwpsychologieuni-trierde8000projectsgpowerliteraturehtml
EPA recommends that regulatory authorities specify in their State WET implementation procedures that individual test results achieve a level of within-test sensitivity by using the upper and lower PMSD test sensitivity bounds (see Section 64) To achieve the test sensitivity bounds testing laboratories may need to minimize within-test variability (eg EMS) or increase the number of replicates tested or both If laboratories cannot achieve PMSD values of less than 25 percent for the toxicity test methods that require a minimum of only three replicates (Methods 10000 10040 10060) then the numbers of replicates may need to be increased Appendix B (Section B4) provides information related to the number of replicates needed and discusses the relationship between test power and effect size achieved The magnitude of the effect size achieved relates to the test sensitivity
54 Test Acceptability Criteria
EPA test methods have specific TAC that the effluent and reference toxicant tests must meet A test is considered invalid if the TACs are not met The recommended test conditions for each test method specify the minimum requirements and the TAC For example control survival must be 80 percent or greater and average control reproduction at least 15 young per surviving female in the chronic Ceriodaphnia dubia survival and reproduction test
The chronic West Coast marine methods (USEPA 1995) require additional TAC For example to limit the degree of within-test variability the methods specify a maximum allowable value for PMSD (see Section 532 on experimental design) Some States have additional TAC in their State WET implementation policies North Carolina (1998) for example requires that the chronic Ceriodaphnia dubia analyses meet an additional TAC of complete third brood neonate production by at least 80 percent of the control organisms and that the control reproduction CV be less than 40 percent
Additional TAC might be specified to minimize variability among replicates Variability of any toxicity test result is influenced by the number of replicates used number of organisms tested and variability among replicates at each test concentration and the control Variability among replicates has been quantified by treatment CV EMS or MSD The application of a maximum acceptable value for CV or MSD helps ensure adequate laboratory QAQC and increases the reliability of submitted data One benefit of requiring a maximum allowable within-test variability limit is that laboratories will improve culturing test handling and housekeeping which are usually incorporated into the laboratoriesrsquo standard operating procedures For example the CV requirement might be incorporated directly into the NPDES permit Sample EPA Region 6 permit language reads
June 30 2000 5-9
Understanding and Accounting for Method Variability in WET Applications Under the NPDES Program
1 The coefficient of variation between replicates shall be less than or equal to 40 percent in the control
2 The coefficient of variation between replicates shall be less than or equal to 40 percent at the instream waste concentration (IWC)
3 Test failure may not be construed or reported as invalid due to a CV of greater than 40 percent A repeat test shall be conducted within the required reporting period if any test is determined to be invalid
Occasionally statistical analyses indicate a test failure when as little as 15-percent mortality has occurred in a test dilution Permit language has been developed to address this occurrence as in the following example
If all TAC conditions are met and the percent survival of the test organism is greater than or equal to 80 percent (in a chronic test) or 90 percent (in an acute test) in the critical dilution concentration and all lower dilution concentrations the test shall be considered to be a valid test and the PERMITTEES shall report an NOEC of not less than the critical dilution for the discharge monitoring report (DMR) reporting requirements
Regulatory authorities may consider providing guidance or imposing additional TAC such as those implemented by EPA Region 6 or like some States have implemented (North Carolina 1998 Washington 1997) Appendix E provides additional examples of States that have implemented further guidance on WET QAQC procedures and TAC Warren-Hicks (1999) also recommended that additional national TAC be established for each test method (eg upper and lower bounds on the MSD) Therefore EPA recommends that regulatory authorities require that additional TACs be implemented in permits to minimize within-test variability and increase test sensitivity (see Section 64 and Appendix C for sample permit language)
55 Conducting the Statistical Analysis To Determine the Effect Concentration
EPA test methods currently recommend two statistical approaches to estimate a chemical or effluent concentration for each biological effect endpoint (eg survival growth and reproduction) One approach is to derive the NOEC by hypothesis testing which equates biological significance with statistical significance The second approach is to estimate an effect concentration that reduces the control response by 25 percent for chronic methods The expanded use of WET tests in the NPDES program has brought increased attention to the statistical analysis of toxicity test data A common goal for both regulatory authorities and permittees is to confirm that the effect concentrations were derived correctly using the appropriate analysis approaches Reliable effect concentrations lead to increased confidence in the data used for making regulatory decisions such as determining reasonable potential deriving a permit limit or monitoring trigger and generating self-monitoring test results
Another important consideration in conducting statistical analyses is the inconsistent use of statistical programs The proliferation of statistical packages has been helpful in data analysis however these packages also can result in the misapplication of the statistical methods APCA-AWWA-WEF (1998) cautions the user to confirm the results of each analysis with each package before accepting them The data user is responsible for evaluating all data submitted to the regulatory authorities
The 1995 SETAC Pellston Workshop discussed unresolved scientific issues and highlighted significant research needs associated with WET testing The attendees recommended the following
Immediately instigate studies to evaluate improvements in the statistical analysis of WET test data These studies should include but not necessarily be limited to the following activities
5-10 June 30 2000
Understanding and Accounting for Method Variability in WET Applications Under the NPDES Program
(a) investigate the implications of concurrent application of NOECMSD tests of bioequivalence and ECp estimators (Chapman et al 1996a)
In response to this recommendation EPA began projects to evaluate the bioequivalence approach and additional point estimate models for the WET program At present two test methods are being used for this evaluation (1) the chronic Ceriodaphnia dubia survival and reproduction tests and (2) the giant kelp germination and germ-tube length test with reference toxicants
The bioequivalence approach poses the following question Do the mean responses of the effluent concentration and the control differ by more than some amount For example the control response and the response at the critical effluent concentration (ie instream waste concentration) must differ by no more than a fixed value in order to accept the hypothesis of no significant difference (ie no toxicity) This approach could address the concern that an imprecise test might not detect toxicity when toxicity is present or that a small but statistically significant effect would detect toxicity that may not be biologically important Some researchers have suggested that the bioequivalence approach could provide a positive incentive for dischargers to produce test results with lower within-test variability to demonstrate that no toxicity occurs at a level greater than a biologically (bioequivalence approach) significant amount (Shukla et al 2000 Wang et al 2000)
Bailer et al (2000) evaluated the proposed regression-based estimators with the current EPA point estimate models They found that it appears reasonable to incorporate parametric estimation models in the WET program Bailer et al (2000) concluded that these models are appropriate for all response scales (ie dichotomous count and continuous) and can incorporate monotonicity without bias However confidence intervals still need to be developed for these parametric models
In this document EPA has not recommended either the bioequivalence or additional point estimate models to supplement the current statistical approaches as described in the testing manuals An independent peer-reviewed workshop should be convened to evaluate the benefits of these alternative statistical approaches to enhance the statistical approaches currently applied
56 Chapter Conclusions
In this chapter EPA provides guidance to permittees and testing laboratories on collecting representative effluent samples conducting the biological test methods and evaluating the statistical analyses EPA recommends that States implement the lower and upper PMSD test sensitivity bounds to achieve an acceptable level of test sensitivity and minimize within-test variability (see Section 64) EPA also provides guidance to permittees and testing laboratories on the number of replicates required to achieve the PMSD bounds Testing laboratories should maintain and evaluate both effluent and reference toxicant data using a measure of within-test variability such as the PMSD
Permittees and toxicity testing laboratories may need to increase replication in order to reduce PMSD below the upper bound Table B-15 can be used for initial planning of replication given knowledge of typical values of the error mean square (EMS) or MSD and the number of concentrations used in the multiple comparison hypothesis test To ensure that all PMSD values fall below the upper bound in Table 3-6 a laboratory would select the largest EMS value experienced in its past testing
EPA recommends that testing laboratories require a minimum of four replicates for the fathead minnow sheepshead minnow and inland silverside chronic test methods (Methods 10000 10040 and 10060 respectively) Four replicates are needed to execute the statistical flow chart when a nonparametric test is needed Three replicates are also sometimes insufficient to keep PMSD below the recommended upper bound In addition four replicates are needed to help achieve the upper PMSD bound
June 30 2000 5-11
Understanding and Accounting for Method Variability in WET Applications Under the NPDES Program
This page intentionally left blank
5-12 June 30 2000
60 GUIDANCE TO REGULATORY AUTHORITIES DETERMINING REASONABLE POTENTIAL AND DERIVING WET PERMIT CONDITIONS
EPA developed the TSD (USEPA 1991a) to support implementation of national policy to control the discharge of toxic pollutants The TSD presents a statistical approach for determining the need for and the method of deriving water quality-based effluent limits (WQBELs) based on aquatic life (including WET) human health and wildlife criteria This approach accounts for the uncertainty associated with small data sets and data variability by assuming a statistical distribution of effluent data (usually lognormal) and calculating a CV or using a default CV to describe data variability
61 Analytical and Sampling Variability in Calculations for Reasonable Potential and Permit Limits
Section 61 discusses use of the CV of sample measurements of toxicity to make a reasonable potential determination and to calculate permit limits Two points must be understood (1) this CV is to be calculated using toxic unit (TU) values (USEPA 1991a) (see Section 62) and (2) EPA strongly recommends that point estimates (not NOEC or LOEC values) be used to calculate the TU values (USEPA 1994a 1994b)
Water quality-based effluent limits are required when a discharge causes has reasonable potential to cause or contributes to an instream excursion above a water quality standard Throughout this document EPA uses the commonly understood shorthand reference ldquoreasonable potentialrdquo to refer to this standard for determining the need for a water quality-based effluent limit
611 ldquoAdjusting for Analytical Variabilityrdquo in Calculations for Reasonable Potential and Permit Limits
Adjustment approaches (see Appendix G3) have been suggested to ldquoadjust for analytical variabilityrdquo when deriving permit limits and determining the need for a WET limit in the first place EPA does not recommend these adjustment approaches (Appendix G3) and strongly reaffirms the statistical approach and methods for calculating permit limits provided in the TSD (USEPA 1991a) EPA recommends that regulatory authorities use the statistical approach and calculation methods in the TSD The TSD methods were designed to provide a reasonable degree of protection for water quality (ie to avoid exceedances of water quality criteria) while providing a reasonable degree of protection from the variability of effluent toxicity and analytical variability The various ldquoadjustmentrdquo approaches would undermine these objectives
The TSD limit calculation for a point source can be divided into two steps first convert the wasteload allocation (WLA) to a long-term average (LTA) and then convert the LTA to effluent limits (maximum daily average weekly and average monthly limits) WET limit calculations include an intermediate step in which the acute WLA is converted to a WLAac These calculations employ a facility-specific CV based upon effluent sampling data The TSD approach uses this CV in both steps
Adjustment approaches intended to account for analytical variability discussed in detail in Appendix G would inappropriately use different CVs in these two steps The first step would use an estimate of the CV of ldquotruerdquo effluent toxicity which is smaller than the CV for measured toxicities This approach would result in a larger calculated LTA The second step would use the CV for the measured toxicities which is the same CV used in both steps of the TSD approach
Use of such adjustment approaches would frequently result in setting an average monthly permit limit (AML) that exceeds the chronic WLA Appendix G demonstrates that such outcomes (ie the AML exceeds
June 30 2000 6-1
Understanding and Accounting for Method Variability in WET Applications Under the NPDES Program
the chronic WLA) generally can be expected to occur when various adjustment approaches are used Appendix G Table G-1 presents a numerical example of how an adjustment approach would allow calculation of an AML exceeding the chronic WLA (a four-day average value) even when sampling frequency for the calculation is set at the recommended minimum of four samples per month [It is acceptable for the maximum daily limit (MDL) which applies to a single sample to exceed the chronic WLA It is also acceptable for the AML to exceed the chronic WLA if the AML calculation is based on fewer than four samples per month Note however that the TSD recommends always assuming at least four samples per month when calculating the AML]
The TSD reasonable potential calculation first calculates the percentile represented by the maximum observed TU value For example the maximum of 10 reported TU values is identified with the 63rd
percentile Then the sample CV is used to project the 95th or 99th percentile TU value using a table of reasonable potential multiplying factors This value is combined with the appropriate mixing-zone dilution to project a maximum receiving water toxicity which is compared with the applicable water-quality criterion If an adjustment were applied to the reasonable potential calculation the CV would be adjusted downward and the maximum projected receiving water toxicity would be smaller This would make a determination of need for a permit limit less likely
Because of these considerations EPA strongly recommends that no adjustment be made to the CV or variance of toxicity either for reasonable potential or permit limit calculations The TSD statistical approaches already account for analytical variability appropriately EPA continues to recommend the TSD approach which ensures that effluent limits and thereby measured effluent toxicity or pollutant parameter concentrations are consistent with calculated WLAs
612 Analytical Variability and Self-monitoring Data
EPA determines compliance with permit limits on the basis of self-monitoring data and these data include some measure of analytical variability The influence of analytical variability is accounted for in the TSD statistical procedures used to set water-quality limits and determine the potential for toxicity as explained in Appendix G
The permittee is responsible for ensuring that measured discharge toxicity never exceeds the permit limits No special allowance is made for analytical variability in assessing compliance The maximum discharge toxicity should incorporate a margin of safety which will account for sampling and analytical variability In other words to avoid exceeding permit limits the facilityrsquos treatment system should be designed so that the maximum toxicity is somewhat lower than its permit limits
613 Precision of WET Measurements and Estimates of Effluent CV
Single measurements on effluent involve some uncertainties about the true concentration or toxicity related to representativeness of the sample including sample holding time and conditions and the analytical measurement system Like all analytical measurements WET measurements (NOEC EC25 LC50) are inexact That is the exact toxicity of an analyte in a sample can be specified only within some range This imprecision can be reduced by using a suitable number of organisms and replicates for each test (see Section 532 on experimental design)
The numbers of organisms and replicates required for EPA WET method test acceptability are specified as minimums Test precision will be approximately proportional to the square root of the number of replicates Thus doubling the number of replicates may decrease the MSD to approximately 70 percent of its former value Increased replication also tightens the confidence interval for a point estimate of the effect concentration (eg EC25 and LC50)
June 30 2000 6-2
Understanding and Accounting for Method Variability in WET Applications Under the NPDES Program
EPA strongly recommends that toxicity measurements of an effluent be obtained at least quarterly for three years to provide a good basis for determining the need for limits and for calculating limits One year should be regarded as the minimum duration needed to characterize effluent variability (due to seasonal stream flow or process fluctuations) and ten the minimum number of measurements unless scientific and technical knowledge supports a shorter period as representative of the distribution of pollutant types and concentrations of toxicity
Estimates based on multiple measurements involve the same uncertainties that apply to single measurements They also may involve larger uncertainties related to sampling error that is the chance that typical levels of toxicity or concentrations of pollutant may not be encountered during the sampling program The sampling program may not fully characterize effluent variability if too few samples are taken the sampling times and dates are not representative or the duration of the sampling program is not long enough to represent the full range of effluent variability When determining the need for limits and calculating limits the variance or the CV of toxicity measurements is key The larger the number of samples the more precise is the estimate Confidence intervals for the variance and CV can be calculated and carried through the calculations for reasonable potential and effluent limits (Appendix G) Even when assumptions are not strictly met confidence intervals provide a useful perspective on the uncertainty of the results and the need for more samples The minimum number of measurements recommended for calculating estimates of the CV for effluent toxicity is 10
614 Between-Laboratory Variability
Between-laboratory variability may increase the CV as discussed in Section 611 if the toxicity tests were conducted by more than one laboratory for a specific facility A concern to permittees is that this may increase the likelihood of making a finding of reasonable potential
Within-laboratory variability is the component of analytical variability that should be reflected in regulatory calculations If the data used for reasonable potential or permit limit calculations are effluent measurement data reported by at least two laboratories there are ways to appropriately estimate the variance to be used in TSD statistical calculations
For example
bull If the same laboratories continue to be used in the same proportion or frequency and the measurements from the individual laboratories represent different sampling dates the measurement data can be treated as if they were generated by a single laboratory This approach may increase the estimated variance and the AML which is not in the interest of the permittee Selecting one laboratory for future monitoring based on the variance of its reported reference toxicant test results should mitigate this problem
bull If only one laboratory has reported data on each sampling date and the other laboratories report over different time spans or over the same time span on alternating dates EPA recommends forming a pooled estimate of variance Calculate the sample variance (S2) of log(TU) for each laboratory separately and combine these using the formula
pooled variance of log(X) = [(N1 - 1)S12 + (N2 - 1)S2
2] [(N1 - 1) + (N2 - 1)]
An analogous formula is used for more than two laboratories The same result can be obtained by conducting a one-way analysis of variance on log(TU) (with laboratories treated as the groups or classes) and using the reported EMS
June 30 2000 6-3
Understanding and Accounting for Method Variability in WET Applications Under the NPDES Program
Changing a laboratory may change analytical (within-laboratory) variability of measurements and test sensitivity (ie PMSD values) That is the average effect concentration may change (eg Warren-Hicks et al 1999) Ideally the permittee will anticipate and plan for a change of testing laboratory Permittees should compare reference toxicant test data for current and candidate replacement laboratories selecting one with acceptable variability and a similar average effect concentration
62 Determining Reasonable Potential and Establishing Effluent Limits
Effluent characterization is an essential step in determining the need for an NPDES permit limit NPDES regulations under 40 CFR Part 12244(d)(1)(ii) specify that reasonable potential include ldquowhether a discharge causes has the reasonable potential to cause or contributes to an instream excursion above a State water quality standardrdquo Calculations for reasonable potential determination and for permit limits should follow EPA guidance in the TSD (USEPA 1991a) In particular the TSD statistical methods should be used Such calculations should use TUs for WET data not effect concentrations (percent whole effluent) Toxic units are defined (USEPA 1991a Chapter 131 page 6) as the reciprocal of the effect concentration times 100 where the effect concentration is expressed as a percentage of whole effluent thus TUa = 100 LC50 and TUc = 100ECp
When characterizing an effluent to determine whether a permit limit is necessary permit writers can use the available effluent WET data and a water-quality model to perform a reasonable potential analysis The TSD outlines the statistical approach This approach uses existing effluent data to project a maximum pollutant concentration or a maximum toxicity in the effluent (USEPA 1991a) The projected maximum concentration or toxicity is used as an input in the water quality model to determine whether the effluent has the reasonable potential to cause or contribute to an excursion of ambient water quality criteria If reasonable potential exists the permit writer must derive a WET permit limit for that facility1
The variability of the existing effluent data as measured by the CV has a significant effect on the projected maximum pollutant concentration or toxicity The higher the CV the higher the projected maximum and the more likely that there is reasonable potential and a limit is needed EPA recommends that regulatory authorities use all valid relevant and representative data in making reasonable potential determinations EPA is developing a national policy clarifying use of the TSD procedures for determining reasonable potential for WET Important components of this policy include specifying the minimum number of valid WET tests necessary to calculate facility-specific CVs2 as well as recommending a step-wise approach to determining the need for WET permit limits This approach reflects a strong preference by EPA and its stakeholders to rely on facility-specific WET testing based on adequate frequency and duration of effluent sampling for making reasonable potential determinations for toxicity
EPA recommends that point estimates be used to estimate effluent variability to determine the need for limits and to set permit limits This is recommended whether the self-monitoring test results will be determined using hypothesis tests or point estimates Point estimates have less analytical variability than NOECs using current experimental designs as shown in Chapter 3 Point estimates make the best use of the WET test data for purposes of estimating the CV LTA and RP factor and calculating the permit limit
1 When the State has narrative criteria for toxicity and the TIETRE identifies a specific chemical that is the source of toxicity the permit writer may include a chemical-specific limit for that parameter instead of a WET permit limit in accordance with 40 CFR Part 12244(d)(v)
2 If fewer than ten data points are available the regulatory authority must use a default CV As a result the need for a WET permit limit may be based on a default value rather than actual data
June 30 2000 6-4
Understanding and Accounting for Method Variability in WET Applications Under the NPDES Program
63 Development of a Total Maximum Daily Load for WET
Total maximum daily loads (TMDLs) may be indicated when there is acute or chronic toxicity in a waterbody leading to the listing of the waterbody as impaired under CWA Section 303(d) and when there are multiple sources of the toxicity EPA believes that TMDL calculations should be performed on the pollutants causing toxicity whenever possible In these situations EPA suggests that the first step of the analysis is to conduct ambient toxicity identification evaluations to identify the pollutant(s) and the source(s) causing the toxicity Once the pollutant(s) and source(s) causing toxicity have been identified for the waterbody then a TMDL should be developed for the individual pollutant(s)
64 Accounting for and Minimizing Variability In the Regulatory Decision Process
A common goal for the permittee and the regulatory authority is to have confidence in the test results from the biological and statistical procedures Both permittees and regulatory authorities would then have more confidence in taking regulatory actions such as evaluating multiple effluent samples to determine reasonable potential and derive permit conditions (eg permit limits monitoring triggers) If steps such as collecting a representative effluent sample to conducting the toxicity tests properly as discussed in Sections 52 through 54 and requiring additional TACs (Section 641) are used to reduce or minimize within-test variability then the reliability of the WET test results increases
641 Recommended Additional TACs Lower and Upper Bounds for PMSD
Reference toxicant data from a large number of tests and laboratories were used to generate PMSD values percentiles of these values are reported in Table 3-6 The MSD represents the smallest difference between the control mean and a treatment mean that leads to the statistical rejection of the null hypothesis (ie no toxicity) using Dunnettrsquos multiple comparison test MSD values are divided by the control mean and multiplied by 100 to produce a ldquopercent MSDrdquo (PMSD) value The PMSD allows comparison of different tests and represents the smallest significant difference from the control as a percentage of the control mean Thus it represents the smallest significant value of the relative difference [100 (control mean shytreatment mean)control mean] The MSD is often expressed as a percentage of the biological endpoint in the control response
The following formula is used to calculate MSD (as recommended by USEPA 1995)
MSD ds w (1n1) (1n)
where d = critical value for the Dunnettrsquos procedure
sw = the square root of the error mean square (EMS) n1 = number of experimental units in the control treatment n = the number of experimental units per treatment assuming an equal number at all other
treatments
Percent MSD is calculated as follows MSDPMSD times 100
control mean
EPA recommends that regulatory authorities implement both the lower and upper PMSD bound approach to minimize within-test variability when using hypothesis testing approaches to report an NOEC The implementation of the upper PMSD bound should also apply when using point estimate techniques There are five possible outcomes for regulatory decisions (see Figure 6-1) Two outcomes imply unqualified acceptance of the WET test statistical result
June 30 2000 6-5
Understanding and Accounting for Method Variability in WET Applications Under the NPDES Program
1 Unqualified PassndashThe testrsquos PMSD is within bounds and there is no significant difference between the means for the control and the instream waste concentration (IWC) treatment The regulatory authority would conclude that there is no toxicity at the IWC concentration
2 Unqualified FailndashThe testrsquos PMSD is larger than the lower bound (but not greater than the upper bound) in Table 3-6 and there is a significant difference between the means for the control and the IWC treatment The regulatory authority would conclude that there is toxicity at the IWC concentration
3 Lacks Test SensitivityndashThe testrsquos PMSD exceeds the upper bound in Table 3-6 and there is no significant difference between the means for the control and the IWC treatment The test is considered invalid A new effluent sample must be collected and another toxicity test must be conducted
4 Lacks Test SensitivityndashThe testrsquos PMSD exceeds the upper bound in Table 3-6 and there is a significant difference between the means for the control and the IWC treatment The test is considered valid The regulatory authority would conclude that there is toxicity at the IWC concentration
5 Very Small but Significant DifferencendashThe relative difference (see Section 642 below) between the means for the control and the IWC treatment is smaller than the lower bound in Table 3-6 and this difference is statistically significant The test is acceptable The NOEC is determined as described in Section 642 below
Test Unacceptable Lacks Sensitivity
Very Small Determine the NOEC
(Section 642)
PASS
FAIL
MIN
MAX (0c - 0IWC) = PMSD
Percent Minimum
Significant Difference
MIN MAX(0 - 0IWC)c
0 = control meanc
0IWC = instream waste concentration mean
Figure 6-1 Paradigm that incorporates the lower and upper percent minimum significant difference
Regulatory authorities should examine the sample permit language as provided in Appendix C for incorporation of the PMSD bound language in a NPDES permit
Note that ldquounqualified acceptancerdquo of a WET test result requires that all of the following must be achieved (1) collect the effluent sample properly (2) conduct the toxicity test methods as specified in the toxicity manuals (3) meet the required TACs (4) meet the proper water quality parameters (eg temperature pH) and (5) conduct the proper statistical calculations All these conditions must be reviewed and deemed acceptable before a test is evaluated for self-monitoring data and reporting
June 30 2000 6-6
Understanding and Accounting for Method Variability in WET Applications Under the NPDES Program
Figure 6-2 provides a decision tree that regulatory authorities can use when implementing the lower and upper PMSD bounds
Use Data for Calculating Reasonable Potential Limit Self-Monitoring Data
KEY PMSD = Percent minimum
significant difference MT = Monitoring trigger TAC = Test acceptability criteria WQ = Water quality
Verify TAC
Check WQ Parameters
amp Test Conditions
Calculate amp Report PMSD
Calculate Statistical Endpoints
Conduct Toxicity Tests
Evaluate Test Data
Continue Routine Testing
Conduct Additional Tests
Determine NOEC According to 643
Repeat Test with New Effluent Sample
Within PMSD Bounds
amp IS NOT Significant
at IWC
Within PMSD Bounds amp IS Significant
at IWC Exceeds Upper
PMSD Bound amp IS Significant
at IWC
Exceeds Upper PMSD
Bound amp IS NOT
Significant at IWC
Below Lower
PMSD Bound amp IS Significant
at IWC
5
1
4
2
3
Figure 6-2 Implementing applications of upper and lower PMSD bounds for effluent toxicity testing requirements
June 30 2000 6-7
Understanding and Accounting for Method Variability in WET Applications Under the NPDES Program
642 How to Determine the NOEC Using the Lower PMSD Bound
If the permit specifies that self-monitoring data are to be generated using hypothesis testing approaches then the analyst should report the NOEC as the following Find the smallest concentration for which (a) the treatment mean differs significantly from the control mean and (b) the relative difference (see example below) is not smaller than the 10th percentile in Table 3-6 Therefore the NOEC is the next smaller test concentration
In other words concentrations having a very small relative difference with control (smaller than the lower PMSD bound) would be treated as if they do not differ significantly from control (even if they do so) for the purpose of determining the NOEC
Table 6-1 illustrates the application of the lower PMSD bound for the reproduction endpoint of a Ceriodaphnia chronic test In this example the testrsquos PMSD was 99 smaller than the 10th percentile value of 11 found in Table 3-6 The IWC concentration differed significantly from the control The test falls under outcome number 5 a significant but very small difference at the IWC The first step is to calculate the relative differences from control (Table 6-1) as [(control mean - treatment mean) divided by (control mean)] times 100 The next step is to determine which relative differences exceed the PMSD lower bound 11 in this case (see the last column of Table 6-1) Finally the NOEC is determined as described above The NOEC is 125 percent effluent for this example
Table 6-1 Example of Applying the Lower PMSD Bound for the Chronic Ceriodaphnia Test with the Reproduction Endpoint
Concentration (percent effluent)
Reproduction (mean of ten replicates)
Relative Difference
from Control
Does Relative Difference Exceed 11
100 508 82 Yes
50 124 56 Yes
25 234 17 Yes
IWC = 125 253 10 No
625 261 74 No
Control 282 0 No
NOTE The lower PMSD bound for this method and endpoint is 11 (Table 3-6) In this example the NOEC is 625 percent effluent using the testrsquos (very small) PMSD Therefore the reported NOEC should be 125 percent effluent after applying the lower PMSD bound
Differs statistically from the control as determined by MSD = 28 neonates Thus treatment means that are less than 282 - 28 = 254 would be statistically significant These correspond to relative differences greater than 100 (28 282) = 99 percent
643 Justification for Implementing the Test Sensitivity Bounds
A lower bound is needed to avoid penalizing laboratories that achieve unusually high precision The 10th percentile PMSD represents a practical limit to the sensitivity of the test method because few laboratories are able to achieve such precision on a regular basis and most do not achieve it even occasionally Several independent researchers have evaluated and provide support for using the MSD approach as additional TAC for the toxicity test methods Thursby et al (1997) advocate and provide reasons for using an empirical data base of minimum significant differences to provide TAC using statistical performance assessment The State of California (Hunt et al 1996 Starrett et al 1993) and the West Coast marine toxicity test methods (USEPA 1995) have implemented an upper PMSD bound to minimize insensitive tests Also the State of North Carolina has implemented additional requirements for the Ceriodaphnia chronic tests that reduced method
June 30 2000 6-8
Understanding and Accounting for Method Variability in WET Applications Under the NPDES Program
variability North Carolinarsquos evaluation of these additional TACs and subsequent improvements in test sensitivity appears in Appendix F
The North Carolina data base affords the opportunity to evaluate the effectiveness of additional TAC and changes to the toxicity test procedures as they relate to the variability of WET test results (see Appendix F) For example for PMSD the median value decreased from 21 percent to 16 percent while the 90th percentile decreased from 39 percent to 31 percent indicating an overall increase in test sensitivity The range in median values across all laboratories before adopting additional TACs was 12 percent to 36 percent After adopting additional TACs the range in median values was 10 percent to 27 percent indicating a decrease in the overall spread between laboratories The range in control CVs within a laboratory was from 21 percent to 79 percent before adopting TACs compared to the range in control CVs within a laboratory after adopting TACs which was narrowed to 17 percent to 36 percent Overall laboratories are generating data with more consistency within and between laboratories after implementation of the additional TACs and additional method guidance provided by the State for the chronic Ceriodaphnia dubia test method
644 Guidance to Testing Laboratories on How to Achieve the Range of Performance for PMSD
EPA recommends that regulatory authorities use the upper bounds (90th percentiles for PMSD in Table 3-6) to identify tests that are insufficiently sensitive If PMSD exceeds this upper bound more often than occasionally the laboratory should thoroughly investigate ways to reduce variability There are three principal ways to reduce PMSD (1) decrease within-test variability (that is decrease the error mean square and therefore the standard deviation at each concentration) (2) increase the control mean and (3) increase the number of replicates The number of replicates required could be determined by trial-and-error calculations using the error mean square values obtained from a series of WET tests At least 20 tests are recommended The number ldquonrdquo in the formula for MSD (number of replicates) would be increased and MSD re-calculated for each error mean square value This approach uses a sample of tests specific to a particular laboratory and reveals the variation among tests This approach would demonstrate how many replicates would be needed to achieve the upper PMSD bound as required in Table 3-6
65 Additional Guidance That Regulatory Authorities Should Implement to Further Support the WET Program
As discussed in Section 53 regulatory authorities have the discretion to develop and implement additional WET program requirements and guidance to ensure that WET test method variability is reduced by specifying additional guidance beyond the minimum requirements of EPArsquos WET test methodrsquos QAQC and TACs Appendix E provides a snapshot of State approaches to implementing NPDES WET programs to minimize WET test variability
These State approaches include WET information to assist the regulated community with the following
bull Guidance regarding the evaluation of reference toxicant and effluent test results
bull Guidance regarding how the State reviews reference toxicant data for laboratory performance
bull Guidance regarding additional QAQC criteria the State has developed and implemented
bull Guidance regarding efforts the State has made to minimize test method variability
bull Description of how the State reviews or conducts performance laboratory audits
bull Description of specific implementation guidance that the State has developed to assist permit writers
bull Description of how the State provides or uses toxicity test training
June 30 2000 6-9
Understanding and Accounting for Method Variability in WET Applications Under the NPDES Program
States contemplating such changes should consult with EPA to ensure the changes will be appropriate in the context of the Statersquos overall NPDES WET program In addition States should implement a step-wise approach to address toxicity when the permit limit or monitoring trigger is exceeded in their State WET implementation plans
For example when an effluent is deemed toxic then the permittee should take appropriate steps to demonstrate the magnitude frequency and potential source(s) of the toxicity The components of the stepshywise approach could include increased frequency of toxicity testing to characterize the magnitude and frequency of toxicity If continued toxicity is demonstrated then the permittee could conduct a Toxicity Reduction EvaluationToxicity Identification Evaluation (TRETIE) with toxic effluent sample(s) (USEPA 1991b 1992) For example EPA Regions 9 and 10 have prepared WET implementation guidance to assist their States (Denton and Narvaez 1996) This guidance provides sample permit language for a step-wise approach to address toxic samples (see Appendix C)
66 Chapter Conclusions
The TSD statistical approach to reasonable potential determination and permit limit derivation considers combined effluent and analytical variability through the CV of measured effluent values Because determination of effluent variability is based on empirical measurements the variability estimated for effluent measurements includes the variability of pollutant levels sampling variability and a smaller component owed to method variability Steps should be taken to reduce these sources of variability EPA believes that the TSD statistical procedures are appropriately protective in considering both effluent and analytical variability in reasonable potential and effluent limit calculations
EPA recommends that regulatory authorities use a sampling program that conducts at least ten representative WET tests over a period of three years to represent the full range of effluent variability Regulatory authorities should use recommended procedures in the TSD to determine when numeric WET limits or WET monitoring triggers are needed Other permit conditions may include monitoring triggers such as increased toxicity testing TREsTIEs and follow-up actions initiated because a permit limit is exceeded or a monitoring trigger is not met Regulatory authorities should implement the additional test sensitivity requirements by requiring that each test result not exceed the upper PMSD bound In addition regulatory authorities should determine the appropriate NOEC for test results below the lower PMSD bound as described in Section 642 These efforts should lead to increased confidence in the effect concentrations that are generated to evaluate self-monitoring data
6-10 June 30 2000
70 CONCLUSIONS AND GUIDANCE TO LABORATORIES PERMITTEES AND REGULATORY AUTHORITIES
This document was prepared to address whole effluent toxicity (WET) test variability The document has three goals (1) quantify the variability of promulgated test methods and report a coefficient of variation (CV) as a measure of test method variability (2) evaluate the statistical methods described in the TSD for determining the need for and deriving WET permit conditions and (3) suggest guidance for regulatory authorities on approaches to address and minimize test method variability This document quantified the variability of toxicity test methods based on the end use of the data that is the effect concentrations (eg NOEC LC50 EC25) The within-laboratory variability of these effect concentrations was quantified by obtaining multiple test results under similar test conditions using the same reference toxicant The major conclusions of this document are discussed below
71 General Conclusions
bull EPArsquos Technical Support Document for Water Quality-based Toxics Control (referred to as the TSD) presents guidance for developing effluent limits based on three key components (1) water quality criteria (2) a calculated dilution factor used to derive a waste load allocation (WLA) from the criteria and (3) a statistical calculation procedure that uses a CV based on effluent data to calculate effluent limits from the WLA EPArsquos TSD statistical approach is appropriately protective regarding both effluent and analytical variability provided that the criteria and WLA are derived correctly It is inappropriate to adjust the TSD statistical methodology for determining when water quality-based effluent limits are needed and for calculating such limits (Section 6 and Appendix G)
bull EPArsquos analysis indicates that the TSD approach appropriately accounts for both effluent variability and method variability EPA does not believe a reasonable alternative approach is available to determine a factor that would discount the effects of method variability using the TSD procedures (Section 611 and Appendix G)
bull Interim CVs are identified for promulgated WET test methods [Appendix A Table A-1 (acute methods) and Table A-2 (chronic methods)] pending completion of between-laboratory studies which may affect these interim CV estimates
bull Comparisons of WET method precision with method precision for analytes commonly limited in the National Pollutant Discharge Elimination System (NPDES) permits clearly demonstrate that the variability of the promulgated WET methods is within the range of variability experienced in other types of analyses Several researchers also noted that method performance improves when prescribed methods are followed closely by experienced analysts (Section 43)
bull The hypothesis test procedures prescribed in EPArsquos WET methods will provide adequate protection against false conclusions that an effluent is toxic However the incidence of false negatives can be high because of high within-test variability making it difficult to detect toxicity when toxicity is truly present Therefore evaluating the power of current experimental designs is desirable EPA expects that regulatory authorities will make prompt and measurable progress toward the goal of requiring all WET tests to detect a toxic effect of 25 percent to 33 percent with power of 080 (Section 533 and Appendix B4)
bull Quality assurance problems became apparent when evaluating the data for this study especially for the metal reference toxicants and sodium dodecyl sulfate (SDS) Standardizing the choice of reference toxicant and the concentrations to be tested may be appropriate as well as establishing bounds on the range of acceptable effect concentrations for each test method As a result
June 30 2000 7-1
Understanding and Accounting for Method Variability in WET Applications Under the NPDES Program
quantifying between-laboratory variability will be difficult unless these issues can be resolved (Section 531 and Appendix G25)
bull The data analysis did not reveal the potential sources and causes of variability such as using different sources of test organisms dilution water and food To assess the sources of variability fully experimenters must carefully design new studies (Section 531)
72 Recommendations for Minimizing Variability and Its Effects
Three critical areas are identified to minimize WET test method variability
bull Obtaining a representative effluent sample
bull Conducting the toxicity tests properly to generate biological endpoints and
bull Calculating the appropriate statistical endpoints to have confidence in the effect concentration
This document provides guidance to toxicity testing laboratories permittees and regulatory authorities in conducting biological and statistical methods and evaluating test effect concentrations It also develops guidance for regulatory authorities on approaches to address and minimize test method variability The principal aspects of the guidance are presented in Table 3-6 and re-presented here
Range of Relative Variability for Endpoints of Promulgated WET Methods Defined by the 10th
and 90th Percentiles from the Data Set of Reference Toxicant Testsa
Test Methodb Endpointc No of Labs
No of Tests
PMSD Control CVd
10th 90th 10th 90th
10000 Fathead Minnow G 19 205 94 35 0035 020
10020 Ceriodaphnia dubia R 33 393 11 37 0089 042
10030 Green Alga G 9 85 93 23 0034 017
10040 Sheepshead Minnow G 5 57 63 23 0034 013
10060 Inland Silverside G 18 193 12 35 0044 018
10070 Mysid G 10 130 12 32 0088 028
20000 Fathead Minnow S 20 217 42 30 0 0074
20020 Ceriodaphnia S 23 241 50 21 0 011
20040 Sheepshead Minnow S 5 65 0e 55 0 0
20060 Inland Silverside S 5 48 70 41 0 0079
20070 Mysid (A bahia) S 3 32 51 26 0 0081
20110 Mysid (H costata) S 2 14 18 47 0 0074
20210 Daphnia (D magna) S 5 48 53 23 0 011
20220 Daphnia (D pulex) S 6 57 58 23 0 011 a The precision of the data warrants only three significant figures When determining agreement with these values one may
round off values to two significant figures (eg values gt345000 and 35000 are rounded to 35) Method 10090 (red macroalga) is not reported because it is inadvisable to characterize method variability using only 23 tests from just two laboratories
b EPA did not assign method numbers for acute methods in EPA6004-90027F The numbers assigned here were created for use in this document and in related materials and data bases G = growth R = reproduction S = survival
d CVs were calculated using untransformed control means for each test e An MSD of zero will not occur when the EPA flow chart for statistical analysis is followed In this report MSD was
calculated for every test including those for which the flow chart would require a nonparametric hypothesis test EPA recommends using the value 42 (the 10th percentile shown for the fathead minnow acute test) in place of zero as the 10th
percentile PMSD (lower PMSD bound) for the sheepshead minnow acute test
June 30 2000 7-2
c
Understanding and Accounting for Method Variability in WET Applications Under the NPDES Program
721 Guidance to Toxicity Testing Laboratories
bull Testing laboratories should maintain quality assurancequality control (QAQC) control charts for percent minimum significant difference (PMSD) along with the statistical endpoints such as NOEC LC50 and EC25 Testing laboratories should regularly plot the individual raw test data and the average treatment responses to examine possible causes of excessive variability (Section 5311)
bull The minimum number of replicates for the chronic toxicity tests should be four for the chronic fathead minnow sheepshead minnow and inland silverside test methods (Sections 5331 and 56)
bull Testing laboratories should take steps to ensure that the test PMSD does not exceed the upper bound provided in the table above (Sections 33 533 and 64 and Table 3-6) This may require ensuring more uniformity among test organisms andor using more replicates Tables are provided to aid in choosing the number of replicates (Tables B-14 and B-15)
bull Testing laboratories should examine the power tables to ensure that test results will meet the recommended test sensitivity criteria These tables can be used to make decisions about replication given the knowledge of typical values for error mean square (EMS) and number of tested concentrations (Section 533 and Tables B-9 through B-15)
722 Guidance to NPDES Permittees
bull Permittees should select and conduct all data analyses with one qualified toxicity testing laboratory to determine reasonable potential derive permit limits and generate self-monitoring test results Conducting all effluent testing consistently using one reference toxicant is also prudent (Section 614 and Appendix G25)
bull Permittees should generate WET data (n = 10) that have been accumulated over a year or more to fully characterize effluent variability over time The sampling dates and times should span a sufficient duration to represent the full range of effluent variability (Sections 613 and 62 and Appendix G24)
bull Permittees should examine testing laboratoriesrsquo QAQC control charts If the CV for reference toxicant tests is greater than the 75th percentile in Tables 3-2 through 3-4 variability can likely be reduced even if the individual EC25 and LC50 values fall within the control limits (Section 5311)
bull Permittees should examine toxicity test data to ensure that data being submitted to regulatory authorities meet specified effluent holding times temperature laboratory control limits and test acceptability criteria such as requirements for test sensitivity lower and upper PMSD bounds (Sections 52 through 54)
bull Permittees should anticipate and plan for a change if switching to a different testing laboratory The permittee should compare reference toxicant test data from the current laboratory with data from the candidate replacement laboratory in order to ensure acceptable variability and a similar average effect (Section 614)
June 30 2000 7-3
Understanding and Accounting for Method Variability in WET Applications Under the NPDES Program
73 Guidance to Regulatory Authorities
Guidance to Regulatory Authorities Related to Determining Reasonable Potential and Deriving Permit Limits
bull Regulatory authorities should use EPArsquos recommended statistical approach in deriving permit limitations The statistical approach outlined in the TSD represents an effective and appropriately protective approach to effluent limit development (Section 61 and Appendix G1)
bull Regulatory authorities should calculate the facility-specific CV using point estimate techniques to determine the need for and derive a permit limit even if the self-monitoring test results will be determined using hypothesis test procedures (Sections 341 and 62)
bull Regulatory authorities that need to cite a characteristic CV for a promulgated method may use Tables A-1 and A-2 in Appendix A which show the median CV from Tables 3-2 through 3-4 pending completion of between-laboratory studies
bull EPA recommends that regulatory authorities implement a step-wise approach to address toxicity This approach can determine the magnitude and frequency of toxicity and appropriate follow-up actions for test results that indicate exceedance of a monitoring trigger or a permit limit (Section 65)
Guidance to Regulatory Authorities Related to Collecting Effluent Samples Conducting the Toxicity Test and Evaluating the Effect Concentrations
bull Regulatory authorities should design a sampling program that collects representative effluent samples to fully characterize effluent variability for a specific facility over time At least 10 samples are needed to estimate a variance or CV with acceptable precision for a specific facility (Sections 613 and 62)
bull Regulatory authorities should ensure that statistical procedures and test methods have been properly applied to produce WET test results Evaluating other factors and data such as biological and statistical quality assurance and ensuring that test conditions and test acceptability criteria (TAC) have been met would be prudent (Sections 52 through 55)
bull Regulatory authorities should apply both the upper and lower bounds using the PMSD as an additional TAC (Section 64 and Table 3-6) The State of North Carolina implemented an effective WET program that required additional TAC and guidance for test methods that served to minimize test method variability (Appendix F)
bull Regulatory authorities should develop a QC checklist to assist in evaluating and interpreting toxicity test results (Section 5311) See Appendix E for examples of State WET implementation procedures
bull Regulatory authorities should consider participation in the National Environment Laboratory Accreditation Program and should conduct routine performance audit inspections to evaluate individual laboratory performance Inspections should evaluate the laboratoryrsquos performance with QC control charts based on reference toxicants examine procedures for conducting the toxicity test procedures and examine procedures for analyzing test results (Section 5311)
bull Regulatory authorities should incorporate revised technical guidance recently published by EPA captioned ldquoMethod Guidance and Recommendations for Whole Effluent Toxicity (WET) Testingrdquo
June 30 2000 7-4
Understanding and Accounting for Method Variability in WET Applications Under the NPDES Program
(40 CFR Part 136) (USEPA 2000a) The guidance addresses (1) error rate assumption adjustments (2) concentration-response relationships (3) incorporation of confidence intervals (4) acceptable dilution waters for testing (5) guidance on blocking by parentage for the chronic C dubia test method and (6) procedures for controlling pH drift
74 Future Directions
bull An independent peer-reviewed workshop should be convened to evaluate alternatives to the statistical approaches currently used in EPArsquos WET test methods Such a workshop might suggest alternatives regarding (1) WET statistical flowcharts (2) WET statistical methods used to estimate effect concentrations and (3) test data interpretation and review guidelines (Section 55)
bull Such a workshop might also evaluate additional QC requirements and recommendations regarding the specification of a reference toxicant and the concentrations to be tested for each test method (Section 531)
June 30 2000 7-5
Understanding and Accounting for Method Variability in WET Applications Under the NPDES Program
This page intentionally left blank
June 30 2000 7-6
80 BIBLIOGRAPHY
Anderson BS JW Hunt SL Turpen AR Coulon M Martin DL Denton and FH Palmer 1990 Procedures Manual for Conducting Toxicity Tests Developed by the Marine Bioassay Project California State Water Resources Control Board No 90-10WQ
Anderson SL and TJ Norberg-King 1991 Precision of short-term chronic toxicity tests in the real world Environ Toxicol Chem 10(2)143ndash145
APHA-AWWA-WEF 1998 Standard Methods for the Examination of Water and Wastewater (20th Edition) LS Clesceri AE Greenberg and A Eaton eds American Public Health Association American Water Works Association and Water Environment Federation Washington DC ISBN 0-87553-235shy7WB
American Society for Testing and Materials (ASTM) 1992 Standard Practice for Conducting an Interlaboratory Study To Determine the Precision of a Test Method E691-92
ASTM 1998 Standard Practice for Determination of Precision and Bias of Applicable Test Methods of Committee D-19 on Water D2777
Ausley LW 1996 Effluent toxicity testing variability In Whole Effluent Toxicity Testing An Evaluation of Methods and Prediction of Receiving System Impacts DR Grothe KL Dickson and DK Reed-Judkins eds Pensacola FL SETAC Press 157ndash171
Bailer AJ MR Hughes DL Denton and JT Oris 2000 An empirical comparison of effective concentration estimators for evaluating aquatic toxicity test responses Environ Toxicol Chem 19(1) 141-150
Biomonitoring Science Advisory Board (BSAB) 1994 West Coast Marine Species Chronic Protocol Variability Study Washington Department of Ecology Olympia WA
Burton GA A Raymon LA Ausley JA Black GM DeGraeve FA Fulk JF Heltshe WH Peltier JJ Pletl and JH Rodgers 1996 Session 4 Effluent toxicity test variability In Whole Effluent Toxicity Testing An Evaluation of Methods and Prediction of Receiving System Impacts DR Grothe KL Dickson and DK Reed-Judkins eds Pensacola FL SETAC Press 131ndash156
Chapman GA 1992 Sea Urchin (Strongylocentrotus purpuratus) Fertilization Test Method USEPA ERL-Narragansett Pacific Ecosystems Branch Newport OR
Chapman GA BS Anderson AJ Bailer RB Baird R Berger DT Burton DL Denton WL Goodfellow MA Heber LL McDonald TJ Norberg-King and PL Ruffier 1996a Discussion synopsis methods and appropriate endpoints In Whole Effluent Toxicity Testing An Evaluation of Methods and Prediction of Receiving System Impacts DR Grothe KL Dickson and DK Reed-Judkins eds Pensacola FL SETAC Press 51-82
Chapman PF M Crane J Wiles F Noppert and E McIndoe 1996b Improving the quality of statistics in regulatory ecotoxicity tests Ecotoxicol 5169-186
Chapman PM RS Caldwell and PF Chapman 1996c A warning NOECs are inappropriate for regulatory use Environ Toxicol Chem 1577ndash79
June 30 2000 8-1
Understanding and Accounting for Method Variability in WET Applications Under the NPDES Program
Collett D 1991 Modelling Binary Data London Chapman amp Hall
Commonwealth of Virginia 1993 Toxics Management Program Implementation Guidance
Davis RB AJ Bailer and JT Oris 1998 Effects of organism allocation on toxicity test results Environ Toxicol Chem 17(5) 928-931
DeGraeve GM JD Cooney BH Marsh TL Pollock NG Reichenbach JH Dean and MD Marcus 1991 Variability in the performance of the seven-day fathead minnow (Pimephales promelas) larval survival and growth test A within- and among-laboratory study Environ Toxicol Chem 10(9)1189ndash1203
DeGraeve GM JD Cooney BH Marsh TL Pollock and NG Reichenbach 1992 Variability in the performance of the 7-d Ceriodaphnia dubia survival and reproduction test A within- and among-laboratory study Environ Toxicol Chem 11(6)851ndash866
DeGraeve GM G Smith W Clement D McIntyre and T Forgette 1998 WET Testing Program Evaluation of Practices and Implementation Water Environment Research Foundation Project 94shyHHE-1 Alexandria VA
Denton DL and TJ Norberg-King 1996 Whole effluent toxicity statistics A regulatory perspective In Whole Effluent Toxicity Testing An Evaluation of Methods and Prediction of Receiving System Impacts DR Grothe KL Dickson and DK Reed-Judkins eds Pensacola FL SETAC Press 83ndash102
Denton DL and M Narvaez 1996 Regions 9 and 10 Guidance for Implementing Whole Effluent Toxicity Testing Programs U S Environmental Protection Agency Regions 9 and 10 May
Denton DL AL Suer BS Anderson and JW Hunt 1992 Precision of marine critical life stage tests with west coast species (abstract) In Society of Environmental Toxicology and Chemistry (SETAC) Abstracts 13th Annual Meeting November 8-12 1992 Cincinnati OH Pensacola FL SETAC Press 184
Dhaliwal BS RJ Dolan CW Batts JM Kelly RW Smith and S Johnson 1997 Warning replacing NOECs with point estimates may not solve regulatory contradictions Environ Toxicol Chem 16124ndash126
Dinnel PJ J Link and Q Stober 1987 Improved methodology for sea urchin sperm cell bioassay for marine waters Arch Environ Contam Toxicol 1623ndash32
Dunnett CW 1964 New tables for multiple comparisons with a control Biometrics 20482-491
Eagleson KW SW Tedder and LW Ausley 1986 Strategy for whole effluent toxicity evaluations in North Carolina In Aquatic Toxicology and Environmental Fate Ninth Volume ASTM STP 921 TM Poston R Purdy eds American Society for Testing and Materials Philadelphia PA 154-160
Environment Canada 1990 Guidance Document on Control of Toxicity Test Precision Using Reference Toxicants Ottawa Ontario Environmental Protection Conservation and Protection Report EPSIRM12
June 30 2000 8-2
Understanding and Accounting for Method Variability in WET Applications Under the NPDES Program
Environment Canada 2000 Guidance Document on Application and Interpretation of Single-species Tests in Environmental Toxicology Ottawa Ontario Environmental Technology Centre Method Development and Application Section Report EPS 1RM34
Erickson RJ LT Brooke MD Kahl F Vende SL Venter T Harting P Markee and RL Spehar 1998 Effects of laboratory test conditions on the toxicity of silver to aquatic organisms Environ Toxicol Chem 17(4) 572-578
Fulk FA 1996 Whole effluent toxicity testing variability A statistical perspective In Whole Effluent Toxicity Testing An Evaluation of Methods and Prediction of Receiving System Impacts DR Grothe KL Dickson and DK Reed-Judkins eds Pensacola FL SETAC Press 172ndash179
Grothe DR and RA Kimerle 1985 Inter- and intralaboratory variability in Daphnia magna effluent toxicity test results Environ Toxicol Chem 4(2)189ndash192
Grothe DR RA Kimerle and CD Malloch 1990 A perspective on biological assessments Water Environ Technol pp 1707ndash1710
Grothe DR KL Dickson and DK Reed-Judkins eds 1996 Whole Effluent Toxicity Testing An Evaluation of Methods and Prediction of Receiving System Impacts Pensacola FL SETAC Press
Hunt JW BS Anderson S Tudor MD Stephenson HM Puckett FH Palmer and MW Reeve 1996 Marine Bioassay Project Eighth Report Sacramento CA State Water Resources Control Board Report 85-102
Kahn HD and MB Rubin 1989 Use of statistical methods in industrial water pollution control regulations in the United States Environ Monitor Assess 12129ndash148
Moore TF SP Canton and M Grimes 2000 Investigation of the incidence of type I errors for chronic whole effluent toxicity testing using Ceriodaphnia dubia Environ Toxicol Chem 19(1)118-122
Morrison GE E Torelo R Comeleo R Walsh A Kuhn R Burgess M Tagliabue and W Green 1989 Interlaboratory precision of saltwater short-term chronic toxicity tests Res J Wat Pollut Control Fed 611707-1710
New Jersey Department of Environmental Protection 1994 The Use of Chronic Whole Effluent Toxicity Testing in the New Jersey Pollutant Discharge Elimination SystemmdashAn Assessment of Compliance Data
North Carolina Department of Environment and Natural Resources 1998 North Carolina Biological Laboratory CertificationCriteria Procedures Document Division of Water Quality Water Quality Section Raleigh NC
Oris JT and AJ Bailer 1993 Statistical analysis of the Ceriodaphnia toxicity test Sample size determination for reproductive effects Environ Toxicol Chem 12(1)85ndash90
Rosebrock MM NW Bedwell and LW Ausley 1994 Indicators of Ceriodaphnia dubia chronic toxicity test performance and sensitivity Poster presentation Society of Environmental Toxicology and Chemistry 15th Annual Meeting Denver CO
June 30 2000 8-3
Understanding and Accounting for Method Variability in WET Applications Under the NPDES Program
Rue WJ JA Fava and DR Grothe 1988 A review of inter- and intralaboratory effluent toxicity test method variability In Aquatic Toxicology and Hazard Assessment (10th Volume) WJ Adams GA Chapman and WG Landis eds ASTM STP 971
SAS Institute 1990 SASSTA Userrsquos Guide (4th Edition) Version 6 Cary NC
Sheppard CR 1999 How large should my sample be Some quick guides to sample size and the power of tests Mar Pollut Bull 38(6)439-477
Shukla R Q Wang FA Fulk C Deng and DL Denton 2000 Bioequivalence approach for whole effluent toxicity testing Environ Toxicol Chem 19(1)169-174
Southern California Toxicity Assessment Group (SCTAG) 1996 Reference Toxicant Standardization and Use in Toxicity Testing JR Gully RB Baird PJ Markle and JP Bottomley eds First Report Fountain Valley CA
SCTAG 1997 Laboratory Practices Checklist Toxicity Testing (3rd Edition) Fountain Valley CA
Starrett GL DL Denton and RW Smith 1993 Sensitivity of toxicity test protocols and the need for additional quality assurance requirements (abstract) In Society of Environmental Toxicology and Chemistry (SETAC) Abstracts 14th Annual Meeting November 14-18 1993 Houston TX Pensacola FL SETAC Press P106 p 183
Thursby GB J Heltshe and KJ Scott 1997 Revised approach to toxicity test acceptability criteria using a statistical performance assessment Environ Toxicol Chem 161322-1329
TOXISreg [computer software] Ojai CA EcoAnalysis Inc
TOXCALCreg [computer software] McKinleyville CA TidePool Scientific Software
USEPA 1985 Methods for Measuring the Acute Toxicity of Effluents to Freshwater and Marine Organisms (3rd Edition) W Peltier and CI Weber eds Environmental Monitoring Systems Laboratory Cincinnati OH EPA6004-85013
USEPA 1988 Short-term Methods for Estimating the Chronic Toxicity of Effects of Receiving Water to MarineEstuarine Organisms (1st Edition) CI Weber WB Horning DJ Klemm TW Neiheisel PA Lewis EL Robinson JR Menkedick FA Kessler eds Office of Research and Development Cincinnati OH EPA6004-87028
USEPA 1989 Short-term Methods for Estimating the Chronic Toxicity of Effluents and Receiving Waters to Freshwater Organisms (2nd Edition) CI Weber WH Peltier TJ Norberg-King WB Homing II FA Kessler JR Menkedick TW Neiheisel PA Lewis DJ Klemm QH Pickering EL Robinson JM Lazorchak LJ Wymer RW Freyberg eds Office of Research and Development Cincinnati OH EPA6004-89001
USEPA 1989a Generalized Methodology for Conducting Industrial Toxicity Reduction Evaluations (TREs) Office of Research and Development Cincinnati OH EPA600-2-88-070
USEPA 1989b Toxicity Reduction Evaluation Protocol for Municipal Wastewater Treatment Plants Office of Research and Development Washington DC EPA6002-88-062
June 30 2000 8-4
Understanding and Accounting for Method Variability in WET Applications Under the NPDES Program
USEPA 1989c Methods for Aquatic Toxicity Identification Evaluations Phase II Toxicity Identification Procedures Office of Research and Development Washington DC EPA6003-88-035
USEPA 1989d Methods for Aquatic Toxicity Identification Evaluations Phase III Toxicity Confirmation Procedures Office of Research and Development Washington DC EPA6003-88-036
USEPA1991a Technical Support Document for Water Quality-based Toxics Control Office of Water Washington DC EPA5052-90-001
USEPA 1991b Methods for Aquatic Toxicity Identification Evaluations Phase I Toxicity Characterization Procedures (2nd Edition) TJ Norberg-King DI Mount EJ Durhan GT Ankley LP Burkhard JR Amato MT Lukasewycz MK Schubauer-Berigan and L Anderson-Carnahan eds Office of Research and Development Washington DC EPA6006-91-003
USEPA 1992 Toxicity Identification Evaluation Characterization of Chronically Toxic Effluents Phase I TJ Norberg-King DI Mount JR Amato DA Jensen and JA Thompson eds Office of Research and Development Washington DC EPA6006-91-005F
USEPA 1993 Methods for Measuring the Acute Toxicity of Effluents and Receiving Waters to Freshwater and Marine Organisms (4th Edition) CI Weber ed Office of Research and Development Cincinnati OH EPA6004-90027F
USEPA 1993a Methods for Aquatic Toxicity Identification Evaluations Phase II Toxicity Identification Procedures for Samples Exhibiting Acute and Chronic Toxicity Office of Research and Development Washington DC EPA600R-92-080
USEPA 1993b Methods for Aquatic Toxicity Identification Evaluations Phase III Toxicity Identification Procedures for Acutely and Chronically Toxic Samples US Environmental Protection Agency Duluth MN EPA600R-92-081
USEPA 1994a Short-term Methods for Estimating the Chronic Toxicity of Effluents and Receiving Waters to Marine and Estuarine Organisms (2nd Edition) DJ Klemm GE Morrison TJ Norberg-King WH Peltier and MA Heber eds Office of Research and Development Cincinnati OH EPA6004shy91003
USEPA 1994b Short-term Methods for Estimating the Chronic Toxicity of Effluents and Receiving Waters to Freshwater Organisms (3rd Edition) PA Lewis DJ Klemm JM Lazorchak TJ Norberg-King WH Peltier and MA Heber eds Office of Research and Development Cincinnati OH EPA6004shy91002
USEPA 1994c Short-term Methods for Estimating the Sediment Toxicity of Effluents and Receiving Waters to Freshwater and Estuarine Organisms Office of Research and Development Duluth MN EPA600R-94-001
USEPA 1995 Short-term Methods for Estimating the Chronic Toxicity of Effluents and Receiving Waters to West Coast Marine and Estuarine Organisms GA Chapman DL Denton and JM Lazorchak eds Office of Research and Development Cincinnati OH EPA600R-95-136
USEPA 1996a NPDES Permit Writerrsquos Manual Office of Water Washington DC EPA833B-96-003
USEPA 1996b Guide to Method Flexibility and Approval of EPA Water Methods EPA821D-96-004
June 30 2000 8-5
Understanding and Accounting for Method Variability in WET Applications Under the NPDES Program
USEPA 1999a National Environmental Laboratory Accreditation Conference Constitution Bylaws and Standards Office of Research and Development Washington DC EPA600R-99-068
USEPA 1999b Toxicity Reduction Evaluation Guidance for Municipal Wastewater Treatment Plants (2nd
Edition) Office of Water Washington DC EPA833B-99-002
USEPA 1999c Errata for Effluent and Receiving Water Toxicity Test Manuals Acute Toxicity manuals Acute Toxicity of Effluents and Receiving Waters to Freshwater and Marine Organisms Short-Term methods for Estimating the Chronic Toxicity of Effluents and Receiving Waters to Freshwater Organisms and Short-Term Methods for Estimating the Chronic Toxicity of Effluents and Receiving Waters to Marine and Estuaraine Organisms Office of Research and Development Duluth MN
USEPA 2000a Method Guidance and Recommendations for Whole Effluent Toxicity (WET) Testing (40 CFR Part 136) Office of Water Office of Science and Technology Washington DC EPA821B-00shy004
USEPA 2000b Methods for Measuring the Toxicity and Bioaccumulation of Sediment-Associated Contaminants with Freshwater Invertebrates (2nd Edition) Office of Research and Development Duluth MN EPA600R-99064
Wang Q DL Denton and R Shukla 2000 Applications and statistical properties of minimum significant difference-based criterion testing in a toxicity testing program Environ Toxicol Chem 19(1)113-117
Warren-Hicks W BR Parkhurst D Moore and S Teed 1999 Whole Effluent Toxicity Testing Methods Accounting for Variance Water Environment Research Foundation Project 95-PQL-1 ISBN 1shy893664-01-5
Washington State Department of Ecology 1997 Laboratory Guidance and Whole Effluent Toxicity Test Review Criteria Publication No WQ-R-95-80
Washington State Department of Ecology 1998 Whole Effluent Toxicity (WET) Program Evaluation Publication No 98-03
Whitehouse P M Crane CJ Redshaw and C Turner 1996 Aquatic toxicity tests for the control of effluent discharges in the UK The influence of test precision Ecotoxicol 5155-168
June 30 2000 8-6

Understanding and Accounting for Method Variability in WET Applications Under the NPDES Program
This page intentionally left blank
June 30 2000 iv
TABLE OF CONTENTS
Acknowledgments ix Executive Summary xi List of Acronyms and Abbreviations xv Glossary xvii 10 INTRODUCTION 1-1
11 Background 1-1 12 Effect of This Guidance 1-2 13 Three Goals of This Document 1-2
20 DEFINITION AND MEASUREMENT OF METHOD VARIABILITY IN WET TESTING 2-1 21 Terms and Definitions 2-1 22 Defining WET Test Variability 2-1 23 Quantifying WET Test Variability 2-2
30 VARIABILITY OF WET TEST METHODS 3-1 31 Acquisition Selection and Quality Assurance of Data Presented in this Document 3-1 32 Variability of EC25 LC50 and NOEC 3-2
321 Within-Laboratory Variability of EC25 LC50 and NOEC 3-2 322 Between-Laboratory Variability of EC25 LC50 and NOEC 3-7
33 Variability of Endpoint Measurements 3-8 34 Conclusions about Variability of WET Methods 3-10
341 Variability of EC25 LC50 NOEC 3-10 342 Variability of Endpoint Measurements 3-11
40 VARIABILITY IN CONTEXT 4-1 41 Society of Environmental Toxicology and Chemistry Pellston WET Workshop 4-1
411 General Conclusions and Recommendations 4-1 412 Conclusions about Data Precision 4-2
42 Water Environment Research Foundation Study 4-3 43 Minimizing Variability by Adhering to WET Methods 4-3 44 Conclusion 4-4
50 GUIDANCE TO REGULATORY AUTHORITIES LABORATORIES AND PERMITTEES GENERATING AND EVALUATING EFFECT CONCENTRATIONS 5-1 51 Steps for Minimizing Test Method Variability 5-1 52 Collecting Representative Effluent Samples 5-1 53 Conducting the Biological Test Methods 5-2
531 Quality Control Procedures 5-3 532 Experimental Design 5-5 533 Test Power to Detect Toxic Effects 5-7
54 Test Acceptability Criteria 5-9 55 Conducting the Statistical Analysis To Determine the Effect Concentration 5-10 56 Chapter Conclusions 5-11
June 30 2000 v
Understanding and Accounting for Method Variability in WET Applications Under the NPDES Program
TABLE OF CONTENTS (continued)
60 GUIDANCE TO REGULATORY AUTHORITIES DETERMINING REASONABLE POTENTIAL AND DERIVING WET PERMIT CONDITIONS 6-1 61 Analytical and Sampling Variability in Calculations for Reasonable
Potential and Permit Limits 6-1 611 ldquoAdjusting for Analytical Variabilityrdquo in Calculations
for Reasonable Potential and Permit Limits 6-1 612 Analytical Variability and Self-monitoring Data 6-2 613 Precision of WET Measurements and Estimates of Effluent CV 6-2 614 Between-Laboratory Variability 6-3
62 Determining Reasonable Potential and Establishing Effluent Limits 6-4 63 Development of a Total Maximum Daily Load for WET 6-5 64 Accounting for and Minimizing Variability in the Regulatory Decision Process 6-5
641 Recommended Additional TACs Lower and Upper Bounds for PMSD 6-5
642 How To Determine the NOEC Using the Lower PMSD Bound 6-8 643 Justification for Implementing the Test Sensitivity Bounds 6-8 644 Guidance to Testing Laboratories on How to Achieve
the Range of Performance for PMSD 6-9 65 Additional Guidance That Regulatory Authorities Should Implement
to Further Support the WET Program 6-9 66 Chapter Conclusions 6-10
70 CONCLUSIONS AND GUIDANCE TO LABORATORIES PERMITTEES and REGULATORY AUTHORITIES 7-1 71 General Conclusions 7-1 72 Recommendations for Minimizing Variability and Its Effects 7-2
721 Guidance to Toxicity Testing Laboratories 7-3 722 Guidance to NPDES Permittees 7-3
73 Guidance to Regulatory Authorities 7-4 74 Future Directions 7-5
80 BIBLIOGRAPHY 8-1
Appendix A Interim Coefficients of Variation Observed Within Laboratories for Reference Toxicant Samples Analyzed Using EPArsquos Promulgated Whole Effluent Toxicity Methods
Appendix B Supplementary Information for Reference Toxicity Data
Appendix C Sample Calculation of Permit Limits Using EPArsquos Statistically-Based Methodology and Sample Permit Language
Appendix D Frequently Asked Questions (FAQs)
Appendix E Examples of Selected State WET Implementation Programs
Appendix F Improvements in Minimizing WET Test Variability by the State of North Carolina
Appendix G Analytical Variability in Reasonable Potential and Permit Limit Calculations
June 30 2000 vi
Understanding and Accounting for Method Variability in WET Applications Under the NPDES Program
List of Tables
3-1 Promulgated WET Methods Included in This Report 3-3 3-2 Quartiles (25th and 75th) and Median (50th) of the Within-Laboratory Values of
CV for EC25 (Chronic Tests) 3-4 3-3 Quartiles (25th and 75th) and Median (50th) of the Within-Laboratory Values of
CV for LC50 3-4 3-4 Quartiles (25th and 75th) and Median (50th) of the Within-Laboratory Values of
CV for NOEC 3-5 3-5 Estimates of Within-Laboratory and Between-Laboratory Components of Variability 3-7 3-6 Range of Relative Variability for Endpoints of Promulgated WET Methods Defined by
the 10th and 90th Percentiles from the Data Set of Reference Toxicant Tests 3-9 3-7 Number of Laboratories Having a Given Percent of Tests Exceeding the PMSD
Upper Bound for the Sublethal Endpoint 3-10 5-1 Tests for Chronic Toxicity Power and Ability To Detect a Toxic Effect
on the Sublethal Endpoint 5-8 5-2 Power to Detect a 25-Percent Difference from the Control at the 90th Percentile PMSD 5-8 6-1 Example of Applying the Lower Bound PMSD for the Chronic Ceriodaphnia Test
with the Reproduction Endpoint 6-8
List of Figures
5-1 Steps to minimize WET test method variability 5-2 6-1 Paradigm that incorporates the lower and upper percent minimum significant difference 6-6 6-2 Implementing applications of upper and lower PMSD bounds
for effluent testing requirements 6-7
June 30 2000 vii
Understanding and Accounting for Method Variability in WET Applications Under the NPDES Program
This page intentionally left blank
June 30 2000 viii
ACKNOWLEDGEMENTS
This guidance was prepared through the cooperative efforts of the US Environshymental Protection Agencyrsquos (EPA) Office
of Wastewater Management and Office of Science and Technology in the Office of Water EPArsquos Office of Research and Development and EPArsquos Office of Enforcement and Compliance Assurance The Cadmus Group Inc provided support for the final document production
EPA Variability Workgroup
Debra Denton EPA Region 9 San Francisco CA John Fox EPA Office of Science and Technology
Washington DC Florence Fulk EPA Office of Research and
Development Cincinnati OH Kathryn Greenwald EPA Office of Enforcement
and Compliance Assurance Washington DC Madonna Narvaez EPA Region 10 Seattle WA Teresa Norberg-King EPA Office of Research and
Development Duluth MN Laura Phillips EPA Office of Wastewater
Management Washington DC
EPA Support Outside of the Variability Workgroup
Gregory Currey EPA Office of Wastewater Management Washington DC
Margarete Heber EPA Office of Wetlands Oceans and Watersheds Washington DC
Phillip Jennings EPA Region 6 Dallas TX Henry Kahn EPA Office of Science and
Technology Washington DC Marion Kelly EPA Office of Science and
Technology Washington DC James Pendergast EPA Office of Wetlands
Oceans and Watersheds Washington DC Stephen Sweeney EPA Office of General
Counsel Washington DC William Telliard EPA Office of Science and
Technology Washington DC Robert Wood EPA Office of Wastewater
Management Washington DC Marcus Zobrist EPA Region 2 New York NY
Contractor Support
The Cadmus Group Inc Durham NC
Karalyn Colopy Susan Conbere Blanche Dean Penelope Kellar
DynCorp Information and Enterprise Technology Inc Alexandria VA
Robert Brent
Science Applications International Corporation Columbia MD
Sidina Dedah Ruth Much Kathleen Stralka
Assistance from States
State Case Example and Chapter 4
EPA especially thanks Larry Ausley and Matt Matthews of the North Carolina Department of Environment and Natural Resources Division of Water Quality for preparing Chapter 4 (Variability in Context) and Appendix F (Improvements in Minimizing WET Test Variability by the State of North Carolina)
State-Specific WET Program Implementation
EPA appreciates the assistance and support from the following States in providing their State-specific approaches to the WET program implementation used for Appendix E (Examples of Selected State WET Implementation Programs) of this document
Betty Jane Boros-Russo State of New Jersey Kari Fleming State of Wisconsin Randall Marshall State of Washington Matt Matthews State of North Carolina Charlie Roth State of Kentucky
Additional Assistance
We also thank the EPA Regions States and laboratories that provided the WET toxicity data used to develop this guidance document
EPA Peer Review
Peer review was conducted following the EPArsquos Science Policy Council Handbook for Peer Review (January 1998) The anonymous review comments are gratefully acknowledged and the changes were incorporated as appropriate
June 30 2000 ix
Understanding and Accounting for Method Variability in WET Applications Under the NPDES Program
This page intentionally left blank
June 30 2000 x
EXECUTIVE SUMMARY
Background
The Federal Water Pollution Control Act commonly known as the Clean Water Act was enacted in 1972 with the objective of ldquorestoring the chemical physical and biological integrity of the Nationrsquos watersrdquo Among the US Environmental Protection Agencyrsquos (EPArsquos) efforts toward this objective is the National Pollutant Discharge Elimination System (NPDES) program This program is designed to control toxic discharges implement water quality standards and restore waters to ldquofishable and swimmablerdquo conditions Point sources that discharge pollutants must do so under the terms and conditions of an NPDES permit One approach EPA employs to control toxic pollutants under the NPDES permits program is using whole effluent toxicity (WET) controls
EPA is issuing this document to both address questions raised on WET test method variability and to satisfy a requirement of a July 1998 settlement agreement with litigants for the Western Coalition of Arid States (WestCAS) and Edison Electric Institute et al This document was developed by an EPA workgroup consisting of EPArsquos Office of Waterrsquos (OW) Headquarters Office of Enforcement and Compliance Assurance Office of Research and Development and Regional staff The document was externally peer reviewed in accordance with EPArsquos peer review guidelines The document addresses WET test method variability by identifying the potential sources of variance associated with WET testing discusses how to minimize it and finally describes how to address it within the NPDES permitting program The document cites both Agency and external ongoing research on this topic and scientific findings particularly technical information that support efforts to minimize WET test result variability
While the document provides recommendations on how to reduce or minimize WET test variability the document does not supersede current Agency guidance policy or regulation including EPArsquos promulgated test methods (40 CFR Part 136) which remain in effect EPA expects that implementation of the NPDES program and NPDES permits will continue to comply with regulatory requirements and follow applicable EPA guidance and policy
Why WET Testing
Whole effluent toxicity is the aggregate toxic effect of an aqueous sample (eg effluent receiving water) measured directly by an aquatic toxicity test Aquatic toxicity tests are laboratory experiments that measure the biological effect (eg growth survival and reproduction) of effluents or receiving waters on aquatic organisms In aquatic toxicity tests organisms of a particular species are held in test chambers and exposed to different concentrations of an aqueous sample for example a reference toxicant an effluent or a receiving water and observations are made at predetermined exposure periods At the end of the test the responses of test organisms are used to estimate the effects of the toxicant or effluent
Whole effluent toxicity test results are an integral tool in the assessment of water quality For the protection of aquatic life the integrated strategy includes the use of three control approaches the chemical-specific control approach the WET control approach and the biological criteriabioassessmentbioassay approach The primary advantage of using WET controls over individual chemical-specific controls is that WET integrates the effects of all chemical(s) in the aqueous sample Reliance solely on chemical-specific numeric criteria or biological criteria would result in only a partially effective State toxics control program These toxicity tests therefore must be performed using best laboratory practices and every effort must be made to enhance repeatability of the test method This document presents EPArsquos approaches to achieve the goals listed below
June 30 2000 xi
Understanding and Accounting for Method Variability in WET Applications Under the NPDES Program
Effect of This Guidance
This document clarifies several issues regarding WET variability and reaffirms EPArsquos guidance in the Technical Support Document for Water Quality-Based Toxics Control (TSD USEPA 1991a) This document provides NPDES regulatory authorities and all stakeholders including permittees with guidance and recommendations on how to address WET variability EPArsquos recommendations and conclusions are detailed in Chapter 7 and Appendix C provides sample NPDES permit language reflecting these recommendations
The most significant recommendation is to use and report the values for the percent minimum significant difference (PMSD) with all WET data results The minimum significant difference (MSD) represents the smallest difference between the control mean and a treatment mean that leads to the statistical rejection of the null hypothesis (ie no toxicity) at each concentration of the WET test dilution series The MSD provides an indication of within-test variability and test method sensitivity Using this information the regulatory authority and permittees can better evaluate WET test results
This document makes several other recommendations such as continue to use the TSD statistical approach without adjusting for test method variability obtain sufficient representative effluent samples verify effluent toxicity data against reference toxicant data maintain clear communication between the regulatory authority and permittee and maintain good laboratory checks and certification programs
Three Goals of This Document
This document describes three goals EPA has defined to address issues surrounding WET variability In addition the document is intended to satisfy the requirements of a settlement agreement to resolve litigation over rulemaking to standardize WET testing procedures
1 Quantify the variability of promulgated test methods and report a coefficient of variation (CV) as a measure of test method variability (see Chapter 3 and Appendix A)
2 Evaluate the statistical methods described in the Technical Support Document for Water Quality-Based Toxics Control (TSD) for determining the need for and deriving WET permit conditions (see Chapter 6 and Appendix G)
3 Suggest guidance for regulatory authorities on approaches to address and minimize test method variability (Chapter 6) In addition the document is intended to provide guidance to regulatory authorities permittees and testing laboratories on conducting the biological and statistical methods and evaluating test effect concentrations (Chapter 5)
Data Evaluated
EPA assembled a comprehensive data base to examine variability in the WET test methods from the EPA Regions several States and private laboratories which represent a widespread sampling of typical laboratories and laboratory practices EPA applied several criteria to the data before they were accepted including detailed sample information strict adherence to published EPA WET test methods and test acceptability criteria (TAC) The resulting data base contains data from 75 laboratories for 23 methods for tests concluded between 1988 and 1999
Approach Taken To Evaluate Test Method Variability
The variability that EPA is assessing is associated with replicate tests using reference toxicants and WET testing methods within analytical laboratories The focus of this guidance is not to quantify test variability between laboratories or to quantify the total variability of WET tests conducted on effluents Rather the purpose is to quantify method variability within laboratories (repeatability) to enable NPDES
June 30 2000 xii
Understanding and Accounting for Method Variability in WET Applications Under the NPDES Program
programs to distinguish between variability caused by the testing method and variability associated with toxicity of multiple effluent samples taken from the same facility
To quantify test method variability within and between laboratories using this data base EPA examined two key parameters (1) the effect concentrations [effect concentration (EC25) lethal concentration (LC50) no observed effect concentration (NOEC)] estimated by the test which are used to derive WET permit limits and evaluate self-monitoring data with those limits and (2) the minimum significant difference (MSD) which summarizes the variability of organism responses at each test concentration within an individual test The MSD represents the smallest difference that can be distinguished between the response of the control organisms and the response of the organisms exposed to the aqueous sample The MSD provides an indication of within-test variability and test method sensitivity
Principal Conclusions
The principal conclusions of this document follow
Evaluation of Test Method Variability
bull Comparisons of WET method precision with method precision for analytes commonly limited in NPDES permits clearly demonstrate that the variability of the promulgated WET methods is within the range of variability experienced in other types of analyses Several independent researchers and studies also have concluded that method performance improves when prescribed methods are followed closely by experienced analysts (Section 43)
bull This document provides interim CVs for promulgated WET methods in Appendix A Tables A-1 (acute methods) and A-2 (chronic methods) pending completion of between-laboratory studies which may affect these interim CV estimates
Evaluation of Approach To Incorporate Test Method Variability
bull EPArsquos TSD presents guidance for developing effluent limits that appropriately protect water quality regarding both effluent variability and analytical variability provided that the WET criteria and waste load allocation (WLA) are derived correctly (Section 6 and Appendix G)
bull EPArsquos analysis of data gathered in the development of this document indicates that the TSD approach appropriately accounts for both effluent variability and method variability EPA does not believe a reasonable alternative approach is available to determine a factor that would discount the effects of method variability using the TSD procedures because the approach would not ensure adequate protection of water quality (Section 611 and Appendix G)
Development of Guidance to Regulatory Authorities
bull EPA recommends that regulatory authorities implement the statistical approach as described in the TSD to evaluate effluent for reasonable potential and to derive WET limits or monitoring triggers (Section 61 and Appendix G)
bull EPA recommends that regulatory authorities calculate the facility-specific CVs using point estimate techniques to determine the need for and derive a permit limit for WET even if self-monitoring data are to be determined using hypothesis testing techniques for example to determine a ldquono effectrdquo concentration (ldquoNOECrdquo) This document describes such facility-specific calculations (Section 341 and 62)
June 30 2000 xiii
Understanding and Accounting for Method Variability in WET Applications Under the NPDES Program
Additional Recommendations and Guidance
This document also provides recommendations and guidance on minimizing variability in three specific areas in order to generate sound WET test results (1) obtaining a representative effluent sample (2) conducting the toxicity tests properly to generate the biological endpoints and (3) conducting the appropriate statistical analysis to obtain defensible effect concentrations (EC25 LC50 NOEC) If these recommendations are addressed the reliability of the test endpoint values should improve
bull Regulatory Authorities Design a sampling program that collects representative effluent samples to fully characterize effluent variability for a specific facility over time (Sections 613 and 62)
bull Regulatory Authorities Ensure proper application of WET statistical procedures and test methods (Sections 52 through 55)
bull Regulatory Authorities Incorporate both the upper and lower bounds using the percent minimum significant difference (PMSD) to control and to minimize within-test method variability and increase test sensitivity To achieve the PMSD upper bound either the replication should increase or within-test method variability should decrease or both (Section 64 and Table 3-6)
bull Testing Laboratories Encourage WET testing laboratories to maintain control charts for PMSD and the control mean and report the PMSD with all WET test results (Section 5311)
bull Regulatory Authorities Participate in the National Environment Laboratory Accreditation Program and routine performance audit inspections to evaluate laboratory performance (Section 5311)
bull Regulatory Authorities Incorporate EPArsquos guidance on error rate assumption adjustments concentration-response relationships confidence intervals acceptable dilution waters how to block by parentage for the chronic Ceriodaphnia dubia test and control of pH drift (USEPA 2000a)
June 30 2000 xiv
LIST OF ACRONYMS AND ABBREVIATIONS1
ACR acute-to-chronic ratio
AML average monthly limit
ANOVA analysis of variance
APHA-AWWA- American Public Health Association-American Water Works Association-Water WEF Environment Federation
ASTM American Society for Testing and Materials
BSAB Biomonitoring Science Advisory Board
CCC criteria continuous concentration
CFR Code of Federal Regulations
CMC criteria maximum concentration
CV coefficient of variation
CWA Clean Water Act
DMR discharge monitoring report
EMS error mean square [also referred to as mean square error (MSE)]
EPA US Environmental Protection Agency (also the Agency)
FR Federal Register
IC inhibition concentration
IWC instream waste concentration (sometimes referred to as receiving water concentration)
LC50 lethal concentration 50 percent
LOEC lowest observed effect concentration
LTA long-term average (LTAa = acute LTA LTAc = chronic LTA LTAac = acute-to-chronic LTA)
MDL maximum daily limit
MSD minimum significant difference
MSE mean square error [also referred to as error mean square (EMS)]
MZ mixing zone
NELAP National Environment Laboratory Accreditation Program
NOEC no observed effect concentration
NPDES National Pollutant Discharge Elimination System
NTRD National Toxicant Reference Database
PAI Performance Audit Inspections
PMSD percent minimum significant difference
Note These acronyms and abbreviations may have other meanings in other EPA programs or documents
June 30 2000
1
xv
Understanding and Accounting for Method Variability in WET Applications Under the NPDES Program
QA quality assurance
QC quality control
rMSE square root of the mean square error
RP reasonable potential
RWC receiving water concentration (sometimes referred to as instream waste concentration)
SCTAG Southern California Toxicity Assessment Group
SETAC Society of Environmental Toxicology and Chemistry
TAC test acceptability criteria
TIE toxicity identification evaluation
TMDL total maximum daily load
TRE toxicity reduction evaluation
TSD EPArsquos Technical Support Document for Water Quality-based Toxics Control (March 1991 EPA5052-90-001)
TU toxic unit (TUa = acute toxicity TUc = chronic toxicity)
VF variability factor
WET whole effluent toxicity
WLA waste load allocation
WQBEL water quality based effluent limit
June 30 2000 xvi
GLOSSARY
Acute Toxicity Test is a test to determine the concentration of effluent or ambient waters that causes an adverse effect (usually death) on a group of test organisms during a short-term exposure (eg 24 48 or 96 hours) Acute toxicity is measured using statistical procedures (eg point estimate techniques or a t-test)
Acute-to-Chronic Ratio (ACR) is the ratio of the acute toxicity of an effluent or a toxicant to its chronic toxicity It is used as a factor for estimating chronic toxicity on the basis of acute toxicity data or for estimating acute toxicity on the basis of chronic toxicity data
Ambient Toxicity is measured by a toxicity test on a sample collected from a receiving waterbody
ANOVA is analysis of variance
Average Monthly Limit (AML) is the calculated average monthly limit of waste load allocation assigned by a State or EPA for a particular facility
CCC are water quality criteria for chronic exposure (criteria continuous concentrations)
Chronic Toxicity Test is a short-term test in which sublethal effects (eg reduced growth or reproduction) are usually measured in addition to lethality Chronic toxicity is defined as TUc = 100NOEC or TUc = 100ECp or ICp
CMC are water quality criteria for acute exposures (criteria maximum concentration)
Coefficient of Variation (CV) is a standard statistical measure of the relative variation of a distribution or set of data defined as the standard deviation divided by the mean It is also called the relative standard deviation (RSD) The CV can be used as a measure of precision within (within-laboratory) and between (between-laboratory) laboratories or among replicates for each treatment concentration
Confidence Interval is the numerical interval constructed around a point estimate of a population parameter
Effect Concentration (EC) is a point estimate of the toxicant concentration that would cause an observable adverse effect (eg death immobilization or serious incapacitation) in a given percent of the test organisms calculated from a continuous model (eg Probit Model) EC25 is a point estimate of the toxicant concentration that would cause an observable adverse effect in 25 percent of the test organisms
Hypothesis Testing is a statistical technique (eg Dunnettrsquos test) for determining whether a tested concentration is statistically different from the control Endpoints determined from hypothesis testing are NOEC and LOEC The two hypotheses commonly tested in WET are
Null hypothesis (Ho) The effluent is not toxic Alternative hypothesis (Ha) The effluent is toxic
Inhibition Concentration (IC) is a point estimate of the toxicant concentration that would cause a given percent reduction in a non-lethal biological measurement (eg reproduction or growth) calculated from a continuous model (ie Interpolation Method) IC25 is a point estimate of the toxicant concentration that would cause a 25-percent reduction in a non-lethal biological measurement
Instream Waste Concentration (IWC) is the concentration of a toxicant in the receiving water after mixing The IWC is the inverse of the dilution factor It is sometimes referred to as the receiving water concentration (RWC)
June 30 2000 xvii
Understanding and Accounting for Method Variability in WET Applications Under the NPDES Program
LC50 (lethal concentration 50 percent) is the toxicant or effluent concentration that would cause death in 50 percent of the test organisms
Lowest Observed Effect Concentration (LOEC) is the lowest concentration of an effluent or toxicant that results in adverse effects on the test organisms (ie where the values for the observed endpoints are statistically different from the control)
Long-term Averages (LTAs) of pollutant concentration or effluent toxicity are calculated from waste load allocations (WLAs) typically assuming that the WLA is a 99th percentile value (or another upper bound value) based on the lognormal distribution One LTA is calculated for each WLA (typically an acute LTA and a chronic LTA for aquatic life protection) The LTA represents expected long-term average performance from the permitted facility required to achieve the associated WLA
Maximum Daily Limit (MDL) is the calculated maximum WLA assigned by a State or EPA for a particular facility
Minimum Significant Difference (MSD) is the magnitude of difference from control where the null hypothesis is rejected in a statistical test comparing a treatment with a control MSD is based on the number of replicates control performance and power of the test
Mean Square Error (MSE) is the average dispersion of the items around the treatment means It is an estimate of a common variance the within variation or variation among observations treated alike [Also referred to as error mean square (EMS)]
Mixing Zone is an area where an effluent discharge undergoes initial dilution and is extended to cover the secondary mixing in the ambient waterbody A mixing zone is an allocated impact zone where water quality criteria can be exceeded as long as acutely toxic conditions are prevented
No Observed Effect Concentration (NOEC) is the highest tested concentration of an effluent or toxicant that causes no observable adverse effect on the test organisms (ie the highest concentration of toxicant at which the values for the observed responses are not statistically different from the controls)
National Pollutant Discharge Elimination System (NPDES) program regulates discharges to the nationrsquos waters Discharge permits issued under the NPDES program are required by EPA regulation to contain where necessary effluent limits based on water quality criteria for the protection of aquatic life and human health
Power is the probability of correctly detecting an actual toxic effect (ie declaring an effluent toxic when in fact it is toxic)
Precision is a measure of reproducibility within a data set Precision can be measured both within a laboratory (within-laboratory) and between laboratories (between-laboratory) using the same test method and toxicant
Quality Assurance (QA) is a practice in toxicity testing that addresses all activities affecting the quality of the final effluent toxicity data QA includes practices such as effluent sampling and handling source and condition of test organisms equipment condition test conditions instrument calibration replication use of reference toxicants recordkeeping and data evaluation
Quality Control (QC) is the set of more focused routine day-to-day activities carried out as part of the overall QA program
Reasonable Potential (RP) is where an effluent is projected or calculated to cause an excursion above a water quality standard based on a number of factors
xviii June 30 2000
Understanding and Accounting for Method Variability in WET Applications Under the NPDES Program
Reference Toxicant Test is a check of the sensitivity of the test organisms and the suitability of the test methodology Reference toxicant data are part of a routine QAQC program to evaluate the performance of laboratory personnel and the robustness and sensitivity of the test organisms
Significant Difference is defined as a statistically significant difference (eg 95 percent confidence level) in the means of two distributions of sampling results
Statistic is a computed or estimated quantity such as the mean standard deviation or coefficient of variation
Test Acceptability Criteria (TAC) are specific criteria for determining whether toxicity test results are acceptable The effluent and reference toxicant must meet specific criteria as defined in the test method (eg for the Ceriodaphnia dubia survival and reproduction test the criteria are as follows the test must achieve at least 80 percent survival and an average of 15 young per surviving female in the controls)
Total Maximum Daily Load (TMDL) is a determination of the amount of a pollutant or property of a pollutant from point nonpoint and natural background sources including a margin of safety that may be discharged to a water quality-limited waterbody
t-Test (formally Studentrsquos t-Test) is a statistical analysis comparing two sets of replicate observations in the case of WET only two test concentrations (eg a control and 100 percent effluent) The purpose of this test is to determine if the means of the two sets of observations are different [eg if the 100-percent effluent concentration differs from the control (ie the test passes or fails)]
Type I Error (alpha) is the rejection of the null hypothesis (Ho) when it is in fact true (ie determining that the effluent is toxic when the effluent is not toxic)
Type II Error (beta) is the acceptance of the null hypothesis (Ho) when it is not true (ie determining that the effluent is not toxic when the effluent is toxic)
Toxicity Test is a procedure to determine the toxicity of a chemical or an effluent using living organisms A toxicity test measures the degree of effect of a specific chemical or effluent on exposed test organisms
Toxic Unit-Acute (TUa) is the reciprocal of the effluent concentration (ie TUa = 100LC50) that causes 50 percent of the organisms to die by the end of an acute toxicity test
Toxic Unit-Chronic (TUc) is the reciprocal of the effluent concentration (eg TUc = 100NOEC) that causes no observable effect (NOEC) on the test organisms by the end of a chronic toxicity test
Toxic Unit (TU) is a measure of toxicity in an effluent as determined by the acute toxicity units (TUa) or chronic toxicity units (TUc) measured Higher TUs indicate greater toxicity
Toxicity Identification Evaluation (TIE) is a set of procedures used to identify the specific chemicals causing effluent toxicity
Toxicity Reduction Evaluation (TRE) is a site-specific study conducted in a step-wise process designed to identify the causative agents of effluent toxicity isolate the source of toxicity evaluate the effectiveness of toxicity control options and then confirm the reduction in effluent toxicity
Variance is a measure of the dispersion in a set of values defined as the sum of the squared deviations divided by their total number
Whole Effluent Toxicity (WET) is the total toxic effect of an effluent measured directly with a toxicity test
Waste Load Allocation (WLA) is the portion of a receiving waterrsquos total maximum daily load that is allocated to one of its existing or future point sources of pollution
June 30 2000 xix
Understanding and Accounting for Method Variability in WET Applications Under the NPDES Program
This page intentionally left blank
June 30 2000 xx
10 INTRODUCTION
11 Background
The Federal Water Pollution Control Act commonly known as the Clean Water Act (CWA) was enacted in 1972 with the objective of ldquorestoring the chemical physical and biological integrity of the Nationrsquos watersrdquo Several goals and policies were established in the Act including the following
bull Eliminating the discharge of pollutants into navigable waters by 1985
bull Wherever attainable achieving an interim goal of water quality that provides for the protection and propagation of fish shellfish and wildlife and provides for recreation in and on the water by November 1 1983 and
bull Prohibiting the discharge of toxic pollutants in toxic amounts
In the 28 years since the CWA was enacted the US Environmental Protection Agency (EPA) and States authorized to administer EPArsquos National Pollutant Discharge Elimination System (NPDES) permitting program have made significant progress toward achieving these goals NPDES is designed to control toxic discharges implement a water quality standards program and restore waters to ldquofishable and swimmablerdquo conditions A point source that discharges pollutants to waters of the United States must do so under the terms and conditions of an NPDES permit In setting these terms and conditions EPA and the States have integrated their control of toxic pollutants through combined use of three approaches [Technical Support Document for Water Quality-based Toxics Control (USEPA 1991a referred to as the TSD)]
bull Chemical-specific controls
bull Whole effluent toxicity (WET) controls and
bull Biological criteriabioassessments and bioassays
The WET approach to protection of water quality is the primary subject of this document
In 1989 EPA defined whole effluent toxicity as ldquothe aggregate toxic effect of an effluent measured directly by an aquatic toxicity testrdquo [54 Federal Register (FR) 23868 at 23895 June 2 1989] Aquatic toxicity tests are laboratory experiments that measure the biological effect (eg growth survival and reproduction) of effluents or receiving waters on aquatic organisms In aquatic toxicity tests groups of organisms of a particular species are held in test chambers and exposed to different concentrations of an aqueous test sample for example a reference toxicant an effluent or a receiving water Observations are made at predetermined exposure periods At the end of the test the responses of test organisms are used to estimate the effects of the toxicant or effluent
In the early 1980s EPA published methods (USEPA 1985 1988 1989) for estimating the short-term acute and chronic toxicity of effluents and receiving waters to freshwater and marine organisms WET data gathered in the 1980s indicated that approximately 40 percent of NPDES facilities nationwide discharged an effluent with sufficient toxicity to cause water quality problems Further reductions in the toxicity of wastewater discharges were necessary to achieve compliance with narrative water quality standards expressed as ldquono toxics in toxic amountsrdquo In response to these findings EPA implemented a policy to reduce or eliminate toxic discharges The Policy for the Development of Water Quality-based Permit Limitations for Toxic Pollutants (49 FR 9016 March 9 1984) introduced EPArsquos integrated toxics control program To support this policy EPA developed the TSD (USEPA 1991a) The TSD provides guidance to
June 30 2000 1-1
Understanding and Accounting for Method Variability in WET Applications Under the NPDES Program
regulators in implementing WET testing requirements in NPDES permits In 1989 EPA promulgated regulations specifying procedures for determining when water quality-based effluent limitations are required in NPDES permits [40 CFR 12244(d)] On October 26 1995 EPA promulgated WET test methods (USEPA 1993 1994a and 1994b) and added them to the list of EPA methods approved under Section 304(h) of the CWA (40 CFR 136) for use in the NPDES program Although the rulemaking was challenged in court that challenge has been stayed pending completion of a settlement agreement The rulemaking remains in force and effect unless and until EPA takes further action
12 Effect of This Guidance
This document attempts to clarify several issues regarding WET variability and reaffirms EPArsquos earlier guidance and recommendations published in the TSD (USEPA 1991a) This document is intended to provide NPDES regulatory authorities and all stakeholders including permittees with guidance and recommendations on how to understand and account for measurement variability in WET testing The documentrsquos recommendations and conclusions are detailed in Section 7 Appendix C provides sample NPDES permit language reflecting these recommendations
The most significant recommendation is to use and report the values for the percent minimum significant difference (PMSD) with all WET data results The minimum significant difference (MSD) is the smallest difference that can be distinguished between the response of control organisms and the response of test organisms at each concentration of the WET test dilution series The MSD provides an indication of the within-test variability and test method sensitivity Using this information the regulatory authority and permittees can better evaluate WET test results
This document also recommends the following
bull Continue to use the EPA TSD statistical approach for NPDES permit limit development (no test method variability adjustments are needed)
bull Collect and evaluate a sufficient number of representative effluent samples
bull Verify effluent toxicity data carefully along with reference toxicant data
bull Maintain good communication between the regulatory authority and permittee throughout all phases of the permitting process
bull Implement the PMSD to evaluate both WET and reference toxicant data to minimize within-test method variability and increase test sensitivity
bull Maintain laboratory checks with good laboratory certification programs to encourage experienced laboratories and skilled analysts for the toxicity testing program for individual WET laboratory performance
13 Three Goals of This Document
EPA prepared this document to achieve the following three goals
1 Quantify the variability of promulgated test methods and report a coefficient of variation (CV) as a measure of test method variability (see Chapter 3 and Appendix A)
June 30 2000 1-2
Understanding and Accounting for Method Variability in WET Applications Under the NPDES Program
2 Evaluate the statistical methods described in the Technical Support Document for Water Quality-Based Toxics Control (TSD) for determining the need for and deriving WET permit conditions (see Chapter 6 and Appendix G)
3 Suggest guidance for regulatory authorities on approaches to address and minimize test method variability (Chapter 6) In addition the document is intended to provide guidance to regulatory authorities permittees and testing laboratories on conducting the biological and statistical methods and evaluating test effect concentrations (Chapter 5)
This document does not address effluent variability It does however discuss how handling effluent samples can affect tests Chapter 2 provides definitions of terms used and discusses the ways in which variability can be quantified Chapter 3 describes the variability of the effect concentration estimates (EC25 LC50 and NOEC) and the variability of endpoint measurements (survival growth and reproduction) Chapter 4 discusses WET variability in the context of chemical-specific method variability Chapter 5 provides guidance to permittees testing laboratories and regulatory authorities to minimize test method variability Chapter 6 provides guidance to regulatory authorities on how to determine reasonable potential (RP) and derive permit limits or monitoring triggers and evaluate self-monitoring data Chapter 7 presents EPArsquos principal conclusions Chapter 8 is a bibliography containing a list of documents cited herein and additional reading material
June 30 2000 1-3
Understanding and Accounting for Method Variability in WET Applications Under the NPDES Program
This page intentionally left blank
June 30 2000 1-4
20 DEFINITION AND MEASUREMENT OF METHOD VARIABILITY IN WET TESTING
The terms used to express toxicity test results are defined in this chapter and methods for quantifying WET test method variability are discussed Additional terms used throughout this document along with their definitions are provided in the Glossary as part of the front matter of this document
21 Terms and Definitions
Biological endpoints are the biological observations recorded when conducting toxicity tests These observations may include the number of surviving organisms or the number of young produced There are two basic types of biological endpoints responses recorded as responseno response (eg dead or alive) are quantal data responses recorded as a measured response (eg weight) or as a count (eg number of young produced) are considered continuous data For most WET tests the observations for each tested concentration are combined and then reported as an average or percentage to represent the biological endpoint For example the fathead minnow larval survival and growth chronic test method has two biological endpoints (ie percent survival and average dry weight for each test concentration)
Effect concentrations are concentrations of a test material (ie effluent referent toxicant receiving water) derived from the observed biological endpoints followed by data analysis using either hypothesis testing procedures or point estimate techniques Effect concentrations derived using point estimation techniques represent the concentration of a test material at which a predetermined level of effect occurs For example LC50 is the lethal concentration at which 50 percent of the organisms respond Effect concentrations commonly estimated for WET methods are LC50 EC50 (effect concentration at which a 50shypercent effect occurs) and IC25 (inhibition concentration at which a 25-percent effect occurs) Hypothesis test methods are used to determine the no observed effect concentration (NOEC) The NOEC represents the highest effect concentration in the test concentration response that is not significantly different from the control response Multiple statistical endpoints can be derived for each WET method For example the endpoints for the fathead minnow larval survival and growth chronic test can be reported as an EC25 for growth an NOEC for growth an LC50 (or EC50) for survival and an NOEC for survival
22 Defining WET Test Variability
As with any measurement process WET tests have a degree of variability associated with the test method performance Three measures of variability related to WET tests are within-test variability within-laboratory variability and between-laboratory variability
bull Within-test (intra-test) variability is the variability in test organism response within a concentration averaged across all concentrations of the test material in a single test
bull Within-laboratory (intra-laboratory) variability is the variability that is measured when tests are conducted using specific methods under reasonably constant conditions in the same laboratory Within-laboratory variability as used in this document includes within-test variability The American Society for Testing and Materials (ASTM) uses the term ldquorepeatabilityrdquo to describe within-laboratory variability Repeatability is estimated (as a sample variance or standard deviation) by repeating a test method under realistically constant conditions within a single laboratory
bull Between-laboratory (inter-laboratory) variability is the variability between laboratories It is measured by obtaining results from different laboratories using the same test method and the same
June 30 2000 2-1
Understanding and Accounting for Method Variability in WET Applications Under the NPDES Program
test material (eg reference toxicant) Between-laboratory variability as used in this document does not include the within-laboratory component of variance ASTM uses the term ldquoreproducibilityrdquo to describe between-laboratory variability Reproducibility is estimated by having nearly identical test samples (duplicates or splits) analyzed by multiple laboratories using similar standard methods Although reproducibility is generally synonymous with between-laboratory variability estimates of reproducibility may combine within-laboratory and between-laboratory components of variance making between-laboratory variability numerically larger than within-laboratory variability as defined above
For purposes of consistency EPA uses the terms within-laboratory and between-laboratory variability throughout this document
Numerous factors can affect the variability of any toxicity test method These factors include the number of test organisms the number of treatment replicates randomization techniques the source and health of the test organisms the type of food used laboratory environmental conditions and dilution water quality The experience of the analyst performing the test analyzing the data and interpreting the results may also affect variability (Grothe et al 1996 Fulk 1996)
23 Quantifying WET Test Variability
Historically information on the variability of toxicity tests has been developed using effect concentrations such as the NOEC EC25 EC50 and LC50 for survival fecundity and growth Variability measures should be quantified based on the end use of the data (ie effect concentrations) and be directly related to the WET permit requirement Typically the effect concentrations are the endpoints used for evaluating self-monitoring results The variability of the effect concentrations is quantified by obtaining multiple test results under similar test conditions using the same test material For example the sample standard deviation and mean for EC25 obtained from multiple monthly reference toxicant tests for the fathead minnow survival and growth chronic test conducted at one laboratory would quantify ldquowithinshylaboratoryrdquo variability for that laboratory EPA used this approach to evaluate data for the development of this document (see Chapter 3)
Examining variability for each effect concentration of each biological endpoint for each test method is essential The biological endpoints may be different for various toxicants and effluents One biological endpoint such as reproduction may be more sensitive to a certain toxicant than another endpoint such as survival That sensitivity may be reversed for a different toxicant Alternatively an endpoint may be more sensitive to one toxicant than another toxicant
Three other measures of variability (which are not addressed in this document) that have been applied to WET tests are
1 Determine the variability of the biological endpoint response For example the variance of the biological response (eg growth and survival) can be calculated This approach is useful but does not quantify variability of the WET test effect concentration which is important in the context of this document
2 Quantify the uncertainty of each test point estimate (eg the EC50 EC25 or LC50) using confidence intervals which reflect within-test variability
3 Use the standard deviation to quantify the uncertainty in the mean of the replicate response at each concentration within a particular test For example laboratories can compare the standard deviations of the average weight of fathead minnow larvae in four chronic tests at one test concentration such as 1 mgL sodium chloride These standard deviations may be pooled across
June 30 2000 2-2
Understanding and Accounting for Method Variability in WET Applications Under the NPDES Program
all the concentrations when data have been transformed (if necessary) to give similar variances at each concentration From the pooled variance one may calculate a minimum significant difference (MSD) value which is a useful indication of test sensitivity (see Chapters 3 and 5) In this document the standard deviation at each concentration was not evaluated as a measure of variability However the MSD was considered as a measure of WET test variability
June 30 2000 2-3
Understanding and Accounting for Method Variability in WET Applications Under the NPDES Program
This page intentionally left blank
June 30 2000 2-4
30 VARIABILITY OF WET TEST METHODS
Chapter 3 describes the variability of effect concentration estimates (EC25 LC50 and NOEC) and endpoint measurements (survival growth and reproduction) For definitive studies of the variability of WET methods readers should also refer to the TSD (USEPA 1991a Part 133) and to WET methods manuals (USEPA 1993 1994a 1994b) EPA will complete and report on a new between-laboratory study of promulgated methods in 2000 or 2001
31 Acquisition Selection and Quality Assurance of Data Presented in This Document
EPA solicited data for reference toxicant tests from laboratories that conduct WET tests and use reference toxicant testing as part of their quality control (QC) program Reference toxicant testing is required as specified in EPA toxicity test methods to document laboratory performance over time for laboratories conducting self-monitoring tests When laboratories are conducting effluent tests at least one reference toxicant test must be conducted each month using the same toxicant test concentrations dilution water and data analysis methods These reference toxicant tests must be conducted using the same test conditions (type of dilution water temperature test protocol and species) that are used for WET tests conducted by the laboratory
Reference toxicant tests were used to characterize method variability because in contrast to effluent samples fixed concentrations of known toxicants are used Only with this standardization is it possible to conclude that variability of the effect concentration estimates is derived from the sources discussed above rather than from changes in the toxicant
EPA received reference toxicant test data from several States private laboratory sources and the EPA Regions Data sources used for these analyses include the EPA National Toxicant Reference Database (NTRD) the EPA Region 9 Toxicity Data Base and laboratory bench sheets voluntarily submitted by independent sources Although the data do not represent a random sample of laboratories or tests they do represent a widespread sampling of typical laboratories and practices
EPA required that reference toxicant tests included in its data base meet the following four criteria
1 Test records documented the test method organism test date laboratory reference toxicant and individual biological responses in the concentration series
2 Data for each replicate were provided as required in the published method using the current test method
3 The test used at least five toxicant concentrations and a control for the most commonly reported chronic toxicity test methodsmdash(1) 10000 fathead minnow larval survival and growth (2) 10020 Ceriodaphnia survival and reproduction and (3) 10060 inland silverside survival and growth For other chronic toxicity test methods the test used at least four toxicant concentrations and a control because the methods permitted in the recent past the use of only four concentrations
4 EPA personnel or an EPA contractor calculated the effect concentration verified that all test acceptability criteria (TAC) had been met and verified that the statistical flowchart had been followed correctly Thus all summary statistics and estimates were calculated from the replicate data and strictly followed the most current EPA test methods
June 30 2000 3-1
Understanding and Accounting for Method Variability in WET Applications Under the NPDES Program
Details of data quality assurance and test acceptance are provided in a separate document available at EPArsquos Office of Water docket located in the Office of Science and Technology [ldquoWhole Effluent Toxicity (WET) Data Test Acceptance and Quality Assurance Protocolrdquo] An attachment to that document provides a laboratory-by-laboratory listing of quality assurance flags test dates and toxicant concentrations as well as summary statistics by laboratory for the NOEC EC25 and LC50 estimates and test endpoints (survival growth reproduction etc) Laboratories are not identified by name
The data set of reference toxicant tests includes information from 75 laboratories for 23 methods for tests conducted between 1988 and 1999 This document addresses and provides specific guidance on the variability of methods promulgated by EPA in 40 CFR Part 136 (Table 3-1) The data are also used to develop between-laboratory interim estimates of method variability for the promulgated methods (Appendix A) The Agency identifies these CVs as ldquointerimrdquo EPA may revise some or all of these estimates based on between-laboratory studies to evaluate some of the promulgated test methods
The next section presents summary statistics for the promulgated methods Summary statistics for all methods in the data set appear in Appendix B For methods represented by a few laboratories summary statistics should not be considered representative of method performance For example EPArsquos Office of Water usually relies on acceptable data from at least six laboratories (USEPA 1996b) when it conducts a multi-laboratory study to quantify method performance The data used here have not been obtained under conditions as rigorous as those applied to a between-laboratory study and for that reason may overestimate variability particularly for the extremes
Coefficients of variation are used as descriptive statistics for NOECs in this document Because NOECs can take on only values that correspond to concentrations tested the distribution (and CV) of NOECs can be influenced by the selection of experimental concentrations as well as additional factors (eg within-test variability) that affect both NOECs and point estimates This makes CVs for NOECs more uncertain than the CVs for point estimates and the direction of this uncertainty is not uniformly toward larger or smaller CVs Despite these confounding issues CVs are used herein as the best available means of expressing the variability of interest in this document and for general comparisons among methods Readers should be cautioned however that small differences in CVs between NOECs and point estimates may be artifactual large differences are more likely to reflect real differences in variability (a definition of what is ldquosmallrdquo or ldquolargerdquo would require a detailed statistical analysis and would depend upon the experimental and statistical details surrounding each comparison) NOECs can only be a fixed number of discrete values the mean standard deviation and CV cannot be interpreted and applied as they are for a continuous variable such as the EC25 or EC50 For instance the typical reference toxicant test might result in only three observed NOEC values most of them at one or two concentrations The mean will fall between tested concentrations as will the stated confidence intervals thus these do not actually represent expected outcomes only approximations of the expected outcome
As an alternative to CVs ratios are used to quantify variability of EC25 EC50 and NOEC measurements in Appendix B Ratios of measurements have been used previously to quantify and compare variability of NOEC and EC50 (Chapman et al 1996b Dhaliwal et al 1997)
32 Variability of EC25 LC50 and NOEC
321 Within-Laboratory Variability of EC25 LC50 and NOEC
This section characterizes the within-test and within-laboratory variability of effect concentration estimates Tables 3-2 through 3-4 summarize variation across laboratories of the within-laboratory coefficients of variation (CVs) without respect to reference toxicant tested Tables showing more extensive summaries appear in Appendix B (Tables B-1 through B-3)
June 30 20003-2
Understanding and Accounting for Method Variability in WET Applications Under the NPDES Program
Table 3-1 Promulgated WET Methods Included in This Report
Test Method No Test Method
EPA Data Base
Toxicants Tests Labs
Freshwater Methods for Chronic Toxicitya
10000 Pimephales promelas Fathead Minnow Larval Survival and Growth Test
Cd Cr Cu KCl NaCl NaPCP SDS
205 19
10000 Pimephales promelas Fathead Minnow Embryo-Larval Survival and Teratogenicity Test
0 0
10020 Ceriodaphnia dubia Water Flea Survival and Reproduction Test
Cd Cu KCl NaCl NaPCP 393 33
10030 Selenastrum capricornutum b Green Alga Growth Test
Cu NaCl Zn 85 9
Marine amp Estuarine Methods for Chronic Toxicityc
10040 Cyprinodon variegatus Sheepshead Minnow Larval Survival and Growth Test
Cd KCl 57 5
10050 Cyprinodon variegatus Sheepshead Minnow Embryo-larval Survival and Teratogenicity Test
0 0
10060 Menidia beryllina Inland Silverside Larval Survival and Growth Test
Cr Cu KCl SDS 193 16
10070 Americamysis (Mysidopsis) bahia Mysid Survival Growth and Fecundity Test
Cr Cu KCl 130 10
10080 Arbacia punctulata Sea Urchin Fertilization Test 0 0
10090 Champia parvula Red Macroalga Reproduction Test
Cu SDS 23 2
Methods for Acute Toxicity de
20000 Fathead Minnow Survival Test Cd Cu KCl NaCl NaPCP 217 21
20020 Ceriodaphnia dubia Survival Test Cd Cu KCl NaCl NaPCP 241 23
20040 Sheepshead Minnow Survival Test SDS 65 3
20060 Inland Silverside Survival Test Cd KCl SDS 48 5
20070 Mysid (A bahia) Survival Test Cd Cu SDS 32 3
20110 Mysid (H costata) Survival Test Cd SDS 14 2
20190 Rainbow Trout Survival Test Cu Zn 10 1
20210 Daphnia magna Survival Test Cd 48 5
20220 Daphnia pulex Survival Test Cu NaCl SDS Cd Cu NaCl NaPCP
57 6
a See publications EPA6004-89-001 (USEPA 1989) and EPA6004-91-002 (USEPA 1994b)b The genus and species names for Selenastrum capricornutum have been changed to Raphidocelis subcapitata In this
document however Selenastrum capricornutum is used to avoid confusion See publication EPA6004-91-003 (USEPA 1994a) and EPA6004-87028 (USEPA 1988)
d See publications EPA6004-85013 (USEPA 1985) and EPA6004-90027F (USEPA 1993) e EPA did not assign method numbers for acute methods in EPA6004-90027F The numbers assigned here were created for
use in this document and in related materials and data bases Reference toxicant codes Cd cadmium NaCl sodium chloride Cr chromium NaPCP sodium pentachlorophenate Cu copper SDS sodium dodecyl sulfate KCl potassium chloride Zn zinc
June 30 2000 3-3
c
Understanding and Accounting for Method Variability in WET Applications Under the NPDES Program
Table 3-2 Quartiles (25th and 75th) and Median (50th) of the Within-Laboratory Values of CV for EC25 (Chronic Tests)
Test Methoda
Test Method
No Endpoint
b No of Labs
Percentiles of CV
25th 50th 75th
Fathead Minnow Larval Survival amp Growth 10000 G 19 021 026 038
Fathead Minnow Larval Survival amp Growth 10000 S 16 011 022 032
Ceriodaphnia (Cd) Survival amp Reproduction 10020 R 33 017 027 045
Ceriodaphnia (Cd) Survival amp Reproduction 10020 S 25 011 023 041
Green Alga (Selenastrum) Growth 10030 G 6 025 026 039
Sheepshead Minnow Larval Survival amp Growth 10040 G 5 009 013 014
Sheepshead Minnow Larval Survival amp Growth 10040 S 2 015 016 017
Inland Silverside Larval Survival amp Growth 10060 G 16 018 027 043
Inland Silverside Larval Survival amp Growth 10060 S 13 022 035 042
Mysid (Ab) Survival Growth amp Fecundity 10070 F 4 030 038 041
Mysid (Ab) Survival Growth amp Fecundity 10070 G 10 024 028 032
Mysid (Ab) Survival Growth amp Fecundity 10070 S 7 017 021 028
Red Macroalga (Champia parvula) Reproduction 10090 R 2 058 058 059 a Cd = Ceriodaphnia dubia Ab = Americamysis (Mysidopsis) bahia b G = growth S = survival R = reproduction F = fecundity
Table 3-3 Quartiles (25th and 75th) and Median (50th) of the Within-Laboratory Values of CV for LC50
Test Methoda Test
Method No Endpoint
b No of Labs
Percentiles of CV
25th 50th 75th
Freshwater Methods for Chronic Toxicityc
Fathead Minnow Larval Survival amp Growth 10000 S 19 015 023 031
Ceriodaphnia (Cd) Survival amp Reproduction 10020 S 33 010 016 029
Sheepshead Minnow Larval Survival amp Growth 10040 S 5 007 008 012
Inland Silverside Larval Survival amp Growth 10060 S 16 016 028 035
Mysid (Ab) Survival Growth amp Fecundity 10070 S 10 016 026 027
Methods for Acute Toxicityde
Fathead Minnow Larval Survival 20000 S 21 010 016 019
Ceriodaphnia (Cd) Survival 20020 S 23 011 019 029
Sheepshead Minnow Survival 20040 S 5 012 014 021
Inland Silverside Larval Survival 20060 S 5 015 016 021
Mysid (Ab) Survival 20070 S 3 017 025 026
Mysid (Hc) Survival 20110 S 2 027 030 034
Rainbow Trout Survival 20190 S 1 023 023 023
Daphnia (Dm) Survival 20210 S 5 007 022 024
Daphnia (Dp) Survival 20220 S 6 019 021 027 a Cd = Ceriodaphnia dubia Ab = Americamysis (Mysidopsis) bahia Hc = Holmesimysis costata Dm = Daphnia magna
Dp = Daphnia pulex b S = survival
See publications EPA6004-89-001 (USEPA 1989) and EPA6004-91-002 (USEPA 1994b)d See publications EPA6004-85-013 (USEPA 1985 and EPA6004-90027F (USEPA 1993) e EPA did not assign method numbers for acute methods in EPA6004-90027F The numbers assigned here were created for
use in this document and in related materials and data bases
June 30 2000 3-4
c
Understanding and Accounting for Method Variability in WET Applications Under the NPDES Program
Table 3-4 Quartiles (25th and 75th) and Median (50th) of the Within-Laboratory Values of CV for NOEC
Test Methoda
Test Metho
d No
Endpointb
No of Labs
Percentiles of CV
25th 50th 75th
Freshwater Methods for Chronic Toxicityc
Fathead Minnow Larval Survival amp Growth 10000 G 19 022 037 053
Fathead Minnow Larval Survival amp Growth 10000 S 19 026 039 048
Ceriodaphnia (Cd) Survival amp Reproduction 10020 R 33 025 033 049
Ceriodaphnia (Cd) Survival amp Reproduction 10020 S 33 021 030 043
Green Alga (Selenastrum) Growth 10030 G 9 040 046 056
Marine amp Estuarine Methods for Chronic Toxicityd
Sheepshead Minnow Larval Survival amp Growth 10040 G 5 034 040 044
Sheepshead Minnow Larval Survival amp Growth 10040 S 5 014 018 024
Inland Silverside Larval Survival amp Growth 10060 G 16 031 046 057
Inland Silverside Larval Survival amp Growth 10060 S 16 030 042 055
Mysid (Ab) Survival Growth amp Fecundity 10070 F 4 017 036 040
Mysid (Ab) Survival Growth amp Fecundity 10070 G 10 035 039 043
Mysid (Ab) Survival Growth amp Fecundity 10070 S 10 028 033 038
Red Macroalga (Champia parvula) Reprod 10090 R 2 085 100 116
Methods for Acute Toxicityef
Fathead Minnow Larval Survival 20000 S 21 018 022 034
Ceriodaphnia (Cd) Survival 20020 S 23 018 035 041
Sheepshead Minnow Survival 20040 S 3 0 031 033
Inland Silverside Larval Survival 20060 S 5 0 033 035
Mysid (Ab) Survival 20070 S 3 029 038 043
Mysid (Hc) Survival 20110 S 2 021 026 031
Rainbow Trout Survival 20190 S 1 035 035 035
Daphnia magna (Dm) Survival 20210 S 5 009 036 047
Daphnia pulex (Dp) Survival 20220 S 6 021 038 061 a Cd = Ceriodaphnia dubia Ab = Americamysis (Mysidopsis) bahia Hc = Holmesimysis costata Dm = Daphnia
magna Dp = Daphnia pulex b G = growth S = survival R = reproduction F = fecundity
See publications EPA6004-89-001 (USEPA 1989) and EPA60044-91-002 (USEPA 1994b)d See publication EPA6004-91-003 (USEPA 1994a) and EPA6004-87028 (USEPA 1988) e See publications EPA6004-85013 (USEPA 1985) and EPA6004-90027F (USEPA 1993)f EPA did not assign method numbers for acute methods in EPA6004-90027F The numbers assigned here were
created for use in this document and in related materials and data bases
Effect concentrations having a p-percent effect are symbolized as ECp and may be calculated for sublethal and lethal (survival) endpoints (USEPA 19931994a1994b) Effect concentrations commonly estimated for WET methods are LC50 EC50 IC25 and EC25 The symbol ECp is more general and may be used to represent an LCp ECp or ICp endpoint To simplify presentation of results in this document the term EC25 is used to represent the concentration at which a 25-percent effect has occurred for either lethal
June 30 2000 3-5
c
Understanding and Accounting for Method Variability in WET Applications Under the NPDES Program
or sublethal endpoints The term LC50 is used to represent the concentration at which a 50-percent effect has occurred for lethal endpoints The EC25 for survival is not routinely used in generating self-monitoring data and is presented here for comparison to the EC25 for sublethal endpoints (ie IC25) Estimates of EC25 LC50 and NOEC were calculated for this document as required in the EPA test methods (USEPA 1993 1994a 1994b) A CV is reported for NOEC measurements in this document See Appendix A for further details
The results in Tables 3-2 through 3-4 were obtained as follows using as an example the EC25 of the growth endpoint in Method 10000 (fathead minnow larval chronic test) on the first row of Table 3-2 The CV of the EC25 estimates was calculated for each laboratory This calculation resulted in 19 CVs (one per laboratory with each laboratory tested using one toxicant) The sample percentiles were calculated for this set of 19 CVs In Table 3-2 the column headed ldquo50thrdquo shows the 50th percentile (median value) of CV found across these 19 laboratories the 50th percentile value is 026 In the column headed ldquo75thrdquo the 75th percentile CV is reported as 038 When a method is represented by fewer than four laboratories the minimum and maximum CVs are shown in the columns headed ldquo25thrdquo and ldquo75thrdquo respectively Note that these CVs represent within-laboratory variability and that Tables 3-2 through 3-4 show the quartiles and median of the within-laboratory CVs These tables thus report the typical range of within-laboratory test method variation
Variation across laboratories in the CV for effect concentration estimates (Tables 3-2 through 3-4) may be summarized as follows ignoring methods represented by only one or two laboratories [Refer to the column headed ldquo75thrdquo (the 75th percentile)]
For the EC25 of the growth and reproduction endpoints in chronic toxicity tests 75 percent of laboratories have a CV no more than 014 to 045 depending on the method (Table 3-2) For the two most commonly used methods (10000 fathead minnow larval chronic test and 10020 Ceriodaphnia chronic test) 75 percent of the laboratories have CVs no more than 038 and 045 respectively
For the LC50 of the survival endpoint in chronic toxicity tests 75 percent of laboratories have a CV no more than 012 to 035 depending on the method For the two most commonly used methods (10000 and 10020) 75 percent of laboratories have CVs no more than 031 and 029 respectively (Table 3-3) For the LC50 in acute toxicity tests 75 percent of laboratories have a CV no more than 019 to 029 depending on the method For the two most commonly used methods (20000 and 20020) 75 percent of laboratories have CVs no more than 019 and 029 respectively
For the NOEC of growth or reproduction endpoints in chronic toxicity tests 75 percent of laboratories have a CV no more than 043 to 057 depending on the method For the two most commonly used methods (10000 and 10020) 75 percent of laboratories have CVs no more than 053 and 049 respectively (Table 3-4) For the NOEC of survival in chronic toxicity tests 75 percent of laboratories have a CV no more than 024 to 055 depending on the method For the two most commonly used methods (10000 and 10020) 75 percent of laboratories have CVs no more than 048 and 043 respectively For the NOEC of survival in acute toxicity tests 75 percent of laboratories have a CV no more than 034 to 061 depending on the method For the two most commonly used acute methods (20000 and 20020) 75 percent of laboratories have CVs no more than 034 and 041 respectively
Appendix B discusses the range of toxicant concentrations reported as the NOEC For chronic toxicity tests most laboratories report the NOEC to within two to three concentration intervals and half the laboratories report most NOECs within one to two concentration intervals for reference toxicants For acute toxicity tests most laboratories report NOECs at one or two concentrations This outcome agrees with EPArsquos expected performance for these methods The normal variation of the effect concentration estimate in reference toxicant tests has been reported for some EPA WET methods (USEPA 1994a 1994b) to be plus or minus one dilution concentration for the NOEC and less for LC50
June 30 2000 3-6
Understanding and Accounting for Method Variability in WET Applications Under the NPDES Program
322 Between-Laboratory Variability of EC25 LC50 and NOEC
The data set compiled for this document provided reasonable estimates of between-laboratory variability for only a few methods For many methods and toxicants there were too few laboratories in the data base Additional summaries of between-laboratory variability of WET methods are included in the TSD (USEPA 1991a Part 133) and the WET methods manuals (USEPA 1994a 1994b) EPA also intends to provide new data in a forthcoming EPA between-laboratory study of promulgated methods
Using the data set credible estimates of between-laboratory variability could be made for a few toxicants and methods having data for six or more laboratories (Table 3-5) The statistical methods are described in Appendix B Table 3-5 shows values of the square root of within-laboratory and between-laboratory variance components (ie standard deviations F) The standard deviations and mean are expressed in units of toxicant concentration (eg gL or mgL) Between-laboratory Fb estimates the standard deviation for laboratory means of EC25 LC50 and NOEC The ldquoMeanrdquo column in Table 3-5 shows the mean of the laboratory means not the mean for all tests Because the number of tests differed among laboratories these two means are different These data suggest that between-laboratory variability (Fb) is comparable to within-laboratory variability (Fw) for the methods listed in the table
In Table 3-5 the ratio of Fb to the mean is an estimate of the relative variability (CVb) of laboratory means around their combined mean The ratio of Fw to the mean may approach the value of the average within-laboratory CV when the sample of laboratories is large but to characterize within-laboratory CVs readers should use Tables 3-2 through 3-4
Table 3-5 Estimates of Within-Laboratory and Between-Laboratory Components of Variabilitya
Test Methodb
Test EC Estimate Toxicant
End-Pointc Tests Labs
Within-lab FFW
Between-lab FFb Mean CVw CVb
10000 EC25 NaCl G 73 6 067 044 263 025 017
10000 LC50 NaCl S 73 6 114 045 415 027 011
10000 NOEC N Cl G 73 6 072 035 218 033 016
10000 NOEC NaCl S 73 6 096 051 243 040 021
10020 EC25 NaCl R 292 23 029 027 092 032 029
10020 LC50 NaCl S 285 23 048 024 178 027 013
10020 NOEC NaCl G 292 23 028 018 074 038 024
10020 NOEC NaCl S 292 23 047 026 142 033 018
10060 EC25 Cu G 130 9 451 524 974 046 054
10060 LC50 Cu S 130 9 484 707 1270 038 056
10060 NOEC Cu G 130 9 518 444 801 065 055
10060 NOEC Cu S 130 9 342 395 654 052 060
20000 LC50 NaCl S 154 14 105 124 746 014 017
20020 LC50 NaCl S 167 15 036 038 197 018 019 a F = within-laboratory standard deviation Fb = between-laboratory standard deviationw
CV = within-laboratory coefficient of variation CVb = between-laboratory coefficient of variationwb EPA did not assign method numbers for acute methods in EPA6004-90027F The numbers assigned here
were created for use in this document and in related materials and data bases G = growth S = survival R = reproduction
June 30 2000 3-7
c
Understanding and Accounting for Method Variability in WET Applications Under the NPDES Program
33 Variability of Endpoint Measurements
This section characterizes the within-laboratory precision of endpoint measurements (eg growth reproduction and survival) Endpoint variability in methods for chronic toxicity is characterized here using sublethal endpoints The sublethal endpoint was designed to be more sensitive than the survival endpoint and it incorporates the effect of mortality (ie it incorporates biomass) For example for the chronic survival and growth fathead minnow larval test the total dry weight at each replicate is divided by the original number of larvae rather than the surviving number of larvae
EPA reports measures of test precision based on the control CV [(control standard deviation)(control mean)] and the ldquoPercent MSDrdquo [100timesMSD(control mean)] symbolized as PMSD Recall that MSD the ldquominimum significant differencerdquo is calculated as [d EMS (2r)] where ldquodrdquo is the critical value of Dunnettrsquos statistic when comparing ldquokrdquo treatments to a control EMS is the error mean square from the analysis of variance of the endpoint responses and ldquorrdquo is the number of replicates at each concentration (USEPA 1993 1994a 1994b) These measures of test precision quantify within-test variability or the sensitivity of each test to toxic effects on the biological endpoint
Measures of variability relative to the control mean are used for two reasons First a laboratory having consistently large mean endpoint values for the control will also tend to have larger values of MSD and control standard deviation Second PMSD is readily interpreted as the minimum percent difference between control and treatment that can be declared statistically significant in a WET test A significant effect occurs when (control mean - treatment mean) exceeds the MSD Dividing by the control mean and multiplying by 100 states this relationship in terms of the percent difference between control and treatment
To characterize the distribution of values of PMSD values from all laboratories and toxicants for a given method and endpoint were combined and sample percentiles reported Percentiles are also reported for the CV of the control which also indicates variability among replicates under non-toxic conditions and may be a useful indicator of uniformity of the test organisms The sample percentiles are reported in more detail in Appendix B the 10th and 90th percentiles are shown in Table 3-6 Method 10090 (red macroalga) is omitted from Table 3-6 because it would be inadvisable to characterize method variability using only 23 tests from only two laboratories
The 90th percentile may be used as an upper PMSD bound (ie a limit on the insensitivity of a test) The 10th percentile may be used as a lower PMSD bound for declaring a significant difference or a lower limit to test sensitivity The 90th percentile has been used in other WET programs (Chapter 5) The 95th
percentile is used as a practical upper limit for the variability of analytical results in well-controlled between-laboratory studies that use a standard protocol and specific quality assurance procedures (ASTM 1992 1998 USEPA 1993 1996a 1996b) The tests summarized here have not been subjected to the rigorous standardization and quality assurance of collaborative studies and the data have not been screened for outliers as specified by ASTM Practices D2777 and E691 (ATSM 1992 1998) These considerations justify using the sample 90th percentile to set an upper bound A lower bound is necessary to avoid creating a disincentive for improving test precision and to objectively specify a limit to the test sensitivity achieved in practice If no more than ten percent of tests are more precise than this lower bound then in practice the analytical method rarely detects toxic effects of this small magnitude
When comparing values in Table 3-6 to a test result it is important that the testrsquos MSD be calculated according to procedures described in the EPA method manuals (USEPA 1993 1994a 1994b) for Dunnettrsquos test for multiple comparisons with a control (see Section 641) An analysis of variance (ANOVA) is conducted using several treatments including the control EPA methods require excluding from the ANOVA those concentrations for which no organisms survived in any replicate For a sublethal endpoint concentrations are excluded from the analysis if they exceed the NOEC for survival The MSD is calculated
June 30 2000 3-8
c
Understanding and Accounting for Method Variability in WET Applications Under the NPDES Program
using the square root of the error mean square (rEMS) from the ANOVA and using Dunnettrsquos critical value (which depends on the number of replicates and concentrations used in the ANOVA)
Table 3-6 Range of Relative Variability for Endpoints of Promulgated WET Methods Defined by the 10th and 90th Percentiles from the Data Set of Reference Toxicant Testsa
Test Methodb Endpointc No of Labs
No of Tests
PMSD Control CVd
10th 90th 10th 90th
10000 Fathead Minnow G 19 205 94 35 0035 020
10020 Ceriodaphnia dubia R 33 393 11 37 0089 042
10030 Green Alga G 9 85 93 23 0034 017
10040 Sheepshead Minnow G 5 57 63 23 0034 013
10060 Inland Silverside G 18 193 12 35 0044 018
10070 Mysid G 10 130 12 32 0088 028
20000 Fathead Minnow S 20 217 42 30 0 0074
20020 Ceriodaphnia S 23 241 50 21 0 011
20040 Sheepshead Minnow S 5 65 0e 55 0 0
20060 Inland Silverside S 5 48 70 41 0 0079
20070 Mysid (A bahia) S 3 32 51 26 0 0081
20110 Mysid (H costata) S 2 14 18 47 0 0074
20210 Daphnia (D magna) S 5 48 53 23 0 011
20220 Daphnia (D pulex) S 6 57 58 23 0 011 a The precision of the data warrants only three significant figures When determining agreement with these values one may
round off values to two significant figures (eg values gt345000 and 35000 are rounded to 35) Method 10090 (red macroalga) is not reported because it is inadvisable to characterize method variability using only 23 tests from just two laboratories
b EPA did not assign method numbers for acute methods in EPA6004-90027F The numbers assigned here were created for use in this document and in related materials and data bases G = growth R = reproduction S = survival
d CVs were calculated using untransformed control means for each test e An MSD of zero will not occur when the EPA flow chart for statistical analysis is followed In this report MSD was
calculated for every test including those for which the flow chart would require a nonparametric hypothesis test EPA recommends using the value 42 (the 10th percentile shown for the fathead minnow acute test) in place of zero as the 10th
percentile PMSD (lower PMSD bound) for the sheepshead minnow acute test
The MSD was calculated for all test results reported here including those for which non-normality and heterogeneity of variance were indicated Thus this document presents MSD as an approximate index of test sensitivity Estimates of power are also approximate The MSD generally will be related to test sensitivity even when the assumptions for ANOVA and Dunnettrsquos test are not strictly satisfied
Table 3-7 shows the number of laboratories in the WET variability data set having tests exceeding the upper PMSD bound reported in Table 3-6 One-half to two-thirds of the laboratories never or infrequently exceeded the bound and roughly one in five exceeded it in at least 20 percent of their tests By definition of the 90th percentile about 10 percent of all the tests exceeded the bound
June 30 2000 3-9
Understanding and Accounting for Method Variability in WET Applications Under the NPDES Program
Table 3-7 Number of Laboratories Having a Given Percent of Tests Exceeding the PMSD Upper Bound for the Sublethal Endpoint
Test Method No Labs Endpointsa
Number of Labs with Various Percentages of Tests Exceeding the PMSD Upper Bound
0 0-10 10-20 20-50 50-100
10000 Fathead Minnow 19 G 8 2 7 2 0
10020 Ceriodaphnia dubia 33 R 15 7 5 6 0
10030 Green Alga 9 G 6 1 0 2 0
10040 Sheepshead Minnow 5 G 3 1 0 1 0
10060 Inland Silverside 16 G 6 5 1 4 0
10070 Mysid (growth) 10 G 5 2 0 3 0 a G = growth R = reproduction
34 Conclusions about Variability of WET Methods
341 Variability of EC25 LC50 NOEC
For EC25 the quartiles of the within-laboratory CVs ranged across the promulgated methods from 009 to 045 and the median CV ranged from 013 to 038 For LC50 the quartiles of the within-laboratory CVs ranged from 007 to 035 and the median CV ranged from 008 to 028 For NOEC the quartiles of the within-laboratory CVs ranged from 0 to 061 and the median CV ranged from 018 to 046 This summary applies to those methods represented by at least 20 tests and three laboratories
EPA concludes from Tables 3-2 through 3-4 that point estimates are substantially less variable than the NOEC for the same method and endpoint and that the LC50 for an acute toxicity test usually is less variable than the LC50 for a chronic toxicity test The estimated NOEC is more variable than ECp using current experimental designs because NOEC can take only those values equal to the concentrations tested while ECp interpolates between tested concentrations (there may be other more technical reasons as well) In principle NOEC could be estimated more accurately and precisely by changing the experimental design to use more concentrations at narrower dilution ratios and by using more replicates The greater variability of the NOEC underscores the desirability of using point estimates to characterize effluent toxicity
Tables 3-2 through 3-4 may be used as benchmarks for variability allowing comparison of one laboratoryrsquos CV for reference toxicant testing with CVs reported by experienced laboratories reporting tests that passed the TAC However CVs for methods represented by too few laboratories in the table may be atypical
The CVs in Tables 3-2 through 3-4 may be used as an adjunct to the control chart If the CV for reference toxicant tests is above the 75th percentile in Tables 3-2 through 3-4 variability likely can be reduced even if the individual EC25 or LC50 values fall within the control limits If a control chart is constructed using an unreasonably large standard deviation the control limits will be unreasonable If a high CV is not fully explained by an unusually small mean the standard deviation of EC25 or LC50 should be reduced to bring the CV within the normal range If the CV exceeds the 90th percentile (Appendix B) there is no question that variability is unacceptably large Detailed guidance is provided in Chapter 5 (Section 5311)
Tables 3-2 through 3-4 indicate the magnitude of the analytical variability that becomes part of the variability of effluent test results under certain conditions This occurs when effluent test results (NOECs LC50s or EC25s) fall between the lowest and highest concentrations tested Under other conditions these
3-10 June 30 2000
Understanding and Accounting for Method Variability in WET Applications Under the NPDES Program
CVs may not accurately represent analytical variability If tests give results consistently near or at the lowest or highest concentrations tested or if the tests often produce ldquoless thanrdquo or ldquogreater thanrdquo results Tables 3-2 through 3-4 will not accurately characterize the analytical CV for such tests To measure the analytical CV under such conditions reference toxicant tests would have to be designed to have the effect concentration at or near the lowest or highest concentration The CV and standard deviation measured under such conditions are unknown but are likely to differ from those for standard reference toxicant tests
The data set did not contain information supporting an analysis of the causes of between-laboratory variability Possible causes may include laboratory differences in concentration series incorrect or ambiguous calculation or reporting of concentrations (eg concentration of the metal ion versus the salt) laboratory differences in dilution water (eg water hardness or pH) laboratory differences in foods and feeding regimes and laboratory differences in cultures (genotypic and phenotypic differences in sensitivity to various toxicants)
The lack of a standard or common reference toxicant creates a problem for permittees and regulatory authorities attempting to evaluate and compare laboratories Real or apparent differences occur between laboratories in the mean values of EC25 LC50 and NOEC Some of this difference is random and reflects only the within-laboratory variance some may be systematic Systematic between-laboratory differences can be inferred reliably only when laboratories use the same test method use the same reference toxicants and dilution series use similar dilution waters and report a sufficient number of tests
342 Variability of Endpoint Measurements
EPA has selected the PMSD to characterize endpoint variability for WET test methods because it integrates variability from several concentrations (always including the control) and it represents the MSD used in the WET hypothesis test The control CV by itself does not fully represent the variability affecting a WET hypothesis test or point estimate The PMSD also represents the variability affecting point estimates because it is calculated using the EMS for the endpoint measurement (However the standard error of a point estimate of an effect concentration may be a complicated function of the EMS)
PMSD for sublethal endpoints ranged from 6 to 37 across the promulgated chronic methods For the fathead minnow chronic method PMSD ranged from 9 to 35 for the Ceriodaphnia chronic method PMSD ranged from 11 to 37 Thus most chronic tests were able to distinguish a reduction of 37 percent or smaller in the endpoint Further analysis in Chapter 5 shows that most tests were unable to distinguish consistently a 25-percent reduction For the survival endpoint of promulgated acute methods PMSD ranged from 0 to 55 For the two most commonly used acute methods (fathead minnow and Ceriodaphnia) PMSD ranged from 4 to 30 and from 5 to 21 respectively Thus PMSD varied markedly for some acute methods and not for others
As shown by the size of PMSD test sensitivity to detect substantial toxic effects is occasionally insufficient at some laboratories and routinely insufficient at a few laboratories Inadequate test sensitivity is not always signaled by control charts of EC25 LC50 and NOEC Laboratories should consider maintaining control charts for MSD or PMSD and should report MSD and the control mean with all WET tests
Some portion of MSDs in the WET variability data set could be considered exceptionally large if not outliers This observation underscores the importance of a careful review for each WET test including an examination of means and standard deviations for endpoint responses at each concentration the plotting of replicate data (not just concentration means) and when necessary a search for possible causes of excessive variability The tables and plots in the promulgated methods (USEPA 1994a 1994b) provide good examples
June 30 2000 3-11
Understanding and Accounting for Method Variability in WET Applications Under the NPDES Program
This page intentionally left blank
3-12 June 30 2000
40 VARIABILITY IN CONTEXT
EPA manages the regulation of WET in the same way it manages the regulation of chemical-specific pollutants in order to determine reasonable potential (RP) derive permit limits determine data quality control and evaluate self-monitoring data Many similarities between chemical-specific toxicant and WET controls can be found in the TSD (USEPA 1991a) Determining RP in both cases uses many of the same strategies Permit limit derivation makes similar exposure assumptions and relies on nearly identical toxicological data bases
Considering a value other than the best analytical estimate as a measure for WET or for specific chemical analytes is inappropriate All analytical results in either chemical-specific analyses or WET tests incorporate some estimated range of uncertainty While infrequently discussed for chemical methods uncertainty does play a role in the meaning of analytical results One end of the confidence interval likely will be less protective of aquatic resources than the other The derived limit and therefore final reported analytical results become the best estimate of the actual ecological need and assessment of the effect
Significant debate has occurred over assertions that WET data have too much inherent variability for reliable use in the NPDES program This debate has engendered considerable evaluation of WET precision Groups of scientists and individual researchers have repeatedly concluded that currently promulgated WET methods are technically sound and that the observed precision is within the range of precision of other analyses frequently required in NPDES permits (Grothe et al 1996) The findings of some of the significant sources of these conclusions are summarized below
41 Society of Environmental Toxicology and Chemistry Pellston WET Workshop
The 1995 Society of Environmental Toxicology and Chemistry (SETAC) Pellston Workshop on Whole Effluent Toxicity convened 47 experts in the discipline to assess applied methods and their application in the regulatory process Representation at the workshop was intentionally balanced among government business and academic participants These scientists published consensus conclusions and recommendashytions including the following
411 General Conclusions and Recommendations
Grothe et al (1996) state ldquoExisting WET testing methods (USEPA 1985 USEPA 1988 USEPA 1989) are technically sound but certain modifications would improve endpoint interpretation Such changes involve implementing improvements to currently used statistical procedures establishing acceptable limits for MSD values and adding confidence limits to WET test endpointsrdquo
ldquoA number of problems with WET tests are caused by misapplication of the tests misinterpretation of the data lack of competence of the laboratories conducting WET testing poor conditionhealth of test organisms and lack of training of laboratory personnel regulators and permittees More widespread use of WET related guidance provided in USEPArsquos TSD (1991a) would help alleviate some of these problems In addition an effective QAQC program will improve data quality and reduce test variabilityrdquo
ldquoIncrease training opportunities for regulators and permittees to improve the implementation of WET objectives and to promote national consistency in permitting and compliance issuesrdquo
June 30 2000 4-1
Understanding and Accounting for Method Variability in WET Applications Under the NPDES Program
ldquoImplement a broadly based and standardized QAQC program to improve WET testing performance and data qualityrdquo
ldquoQuantify the lsquoconfidencersquo around test endpoints to improve interpretation of WET test results Specific statistical methods that could improve precision are presented in Chapter 3 of this document and processes to reduce variability are discussed in Chapter 5 In addition WET tests should be performed using a dilution series of exposure concentrations to establish a dose-response relationshiprdquo
412 Conclusions about Data Precision
Ausley (1996) compared CVs of chemical analyses and aquatic toxicity tests conducted by North Carolina NPDES permittees Ausley found that CVs of reported values for chemical analytes (including metals organic analytes and non-metal inorganic analytes) ranged from 118 percent to 2917 percent Coefficients of variation for toxicity parameters (acute and chronic Ceriodaphnia dubia acute and chronic Pimephales promelas acute Daphnia pulex and acute Mysidopsis bahia) ranged from 148 percent to 676 percent From this review he concluded that ldquothe precision of toxicity analyses is within the range of that being reported for commonly analyzed and regulated chemical parametersrdquo Ausley highlighted the difficulty in comparing precision estimates of chemical analytes and WET analyses (particularly NOECs) noting that while chemical precision is often determined well above analytical detection WET precision is often based on the minimum detection level An assumption that WET precision will vary among toxicants is also logical To establish ldquoinherent variabilityrdquo considering toxicants that cause minimal variability in the analysis may be appropriate The high coefficients of variation for some chemical parameters reported by Ausley reflect the fact that in practice analytical precision can vary widely in individual studies in which the effects of a single (or a few) poorly operating laboratory can adversely affect precision estimates In practice this kind of data must be screened for quality prior to use to evaluate self-monitoring data or estimates of overall method quality
Ausleyrsquos results closely approximate analytical precision of chemical analytes referenced in the TSD (USEPA 1991a Chapter 12) The CVs for metals (aluminum cadmium chromium copper iron lead manganese mercury silver and zinc) ranged from 18 percent to 129 percent at the low end of the measurement detection range Between-laboratory CVs for organic analytes ranged from greater than 12 percent to 91 percent The CVs for non-metal analytes (alkalinity residual chlorine ammonia nitrogen Kjeldahl nitrogen nitrate nitrogen total phosphorus biological oxygen demand chemical oxygen demand and total organic carbon) ranged from 46 percent to 70 percent in between-laboratory studies of precision
Burton et al (1996) concluded that ldquoUSEPA-published methods are functional and appropriate in the context of effluent toxicity control programsrdquo They recommended developing limits on within-test variability a quality assurance and audit program and guidance for permittee procurement of WET analytical services
Denton and Norberg-King (1996) cited various studies that favorably compare WET methods with chemical analytical methods (Grothe and Kimerle 1985 Rue et al 1988 Morrison et al 1989 Grothe et al 1990) They proposed that improvements in test result consistency could be accomplished by limiting the range of within-test variability through controls of upper and lower statistical power (eg limits on test MSD) Three practices to control within-test variability most effectively are (1) controlling within-test sensitivity (2) following well-defined test methods and (3) maintaining communication within the regulatory community For example the permittee and regulatory authorities should discuss any facility-specific issues to fully characterize the appropriate permit conditions
June 30 2000 4-2
Understanding and Accounting for Method Variability in WET Applications Under the NPDES Program
42 Water Environment Research Foundation Study
Another publication ldquoWhole Effluent Toxicity Testing Program Evaluation of Practices and Implementationrdquo (DeGraeve et al 1998) presents the results of a survey of publicly owned treatment works and State regulatory programs about WET issues The Water Environment Research Foundation (WERF) sponsored this study Conclusions by DeGraeve et al (1998) include the following
ldquoThe project team believes that the results demonstrate that the test methods can be routinely completed successfully by well-trained competent WET testing laboratories and that the results considered collectively suggest that the test methods that are being used to measure WET are technically soundrdquo
ldquoThere is a need for better trainingguidance in WET-related issues for both the regulatory staff responsible for implementing WET requirements and for permittees responsible for meeting WET limitsrdquo
DeGraeve et al (1998) considered the conclusions of the SETAC Pellston WET publication concurring that between-laboratory CV values of toxicity test methods were low training of regulatory and permittee staff is needed nationally and strengthened quality assurance (QA)quality control (QC) practices could improve performance of analyses Unlike the SETAC Pellston WET conclusions they found that there are enough laboratories to meet the current market demand for analyses Like the SETAC effort DeGraeve et al (1998) concluded that a national center of expertise on WET issues would be beneficial to provide guidance to regulatory agencies permittees and laboratories
WERF also funded a project entitled ldquoWhole Effluent Toxicity Testing Methods Accounting for Variancerdquo (Warren-Hicks et al 1999) This study compared within- and between-laboratory results of reference toxicant test variation as measures of reproducibility and comparability respectively The authors concluded that some laboratories could consistently reproduce test results while others could not and inferred that test precision is a factor of laboratory experience and not inherent methodological weakness The authors recommended that national studies be conducted to evaluate within- and between-laboratory precision of promulgated WET test methods (EPA has already initiated this study) They also recommended that additional test acceptability criteria (TAC) such as upper and lower bounds of MSD be established and incorporated in the NPDES process The latter recommendation corroborates other researchersrsquo recommendations discussed above
43 Minimizing Variability by Adhering to WET Toxicity Test Methods
Specific factors that affect variability in WET analyses have been described in several papers (Burton et al 1996 Ausley 1996 Erickson et al 1998 Davis et al 1998) The most important initial consideration in developing precise data is a laboratoryrsquos experience and success in performing a specific analysis Most critical reviews of WET data precision emphasize this initial consideration Experienced professionals most likely will be able to develop the most consistent and reliable information and can interpret anomalous conditions in the testing or results
An additional factor in considering WET test method variability is whether the prescribed methods (eg the EPA toxicity test methods promulgated in 40 CFR Part 136) are being followed appropriately (see Chapter 5) If tests are submitted that do not meet specified TAC or are produced when laboratory QA testing indicates analyses are beyond control limits these results should not be used in the NPDES process Tests performed on effluent samples that have not met required temperature maxima or holding times should not be considered for regulatory purposes Rigorous QA practices are critical to the success of any analytical program Both the regulatory authority and permittee should strive to ensure that such practices are in place
June 30 2000 4-3
Understanding and Accounting for Method Variability in WET Applications Under the NPDES Program
for any program developing WET data whether by national laboratory accreditation State regulatory certification direct permittee oversight or specific contractual agreement with the laboratory
Comparisons of WET method precision with analytes commonly limited in NPDES permits clearly demonstrate that the promulgated WET methods are within the range of variability experienced in other analyses Several researchers also noted clear indications that method performance improves when prescribed methods are followed closely by experienced analysts (Grothe et al 1996 DeGraeve et al 1998)
A review of WET test results confirms that imprecise WET data are being reported As with any analytical technique inexperienced individuals can perform analyses incorrectly or fail to follow appropriate methods and quality assurance practices Using the training that is available for these methods and quality assurance techniques referenced by this document will help ensure that data of maximum reliability are used and that sound decisions are made based on those results The Western Coalition of Arid States conducted a study in 1997 (Moore et al 2000) which reported the results of 16 tests with a non-toxic test sample using the Ceriodaphnia dubia chronic test These results indicated that 43 percent of the tests showed toxicity EPA is in the process of reviewing the paper and the raw data
Persons interested in WET issues may consult another source of information developed by the SETAC Whole Effluent Toxicity Expert Advisory Panels This group established under a cooperative agreement with EPA provides scientific opinion and training on WET technical issues This information is available on the Internet at the SETAC web site httpwwwsetacorg Appendix D contains frequently asked questions with answers prepared by the SETAC WET Expert Advisory Panels The expert panels have identified and discussed various factors that affect WET variability
44 Conclusion
When the variability of WET analyses is viewed in the context of the NPDES program these techniques produce data that are as precise as those from chemical analyses As with any other analytical system lack of experience in performing the analyses adherence to prescribed QA practices or good laboratory practices will reduce the precision of the results Studies of these factors by independent researchers from both the regulatory and regulated communities support these conclusions While examples of poor-quality highly variable results from chemical analyses have also been publicized these results are frequently influenced by the shortcomings mentioned above Permittees that must generate and use WET data should become well-educated in data quality interpretation and permittees should require that QC practices be followed by laboratories generating the data Various sources of information presented in this chapter should assist permittees testing laboratories and regulatory authorities with this education process Examples of practices that can further reduce the imprecision of analyses are also discussed in Chapters 5 and 6 of this document Additional refinements of TAC can likewise improve test power to detect effects (or the lack thereof) and increase the statistical confidence in results
June 30 2000 4-4
50 GUIDANCE TO REGULATORY AUTHORITIES LABORATORIES AND PERMITTEES GENERATING AND EVALUATING
EFFECT CONCENTRATIONS
51 Steps for Minimizing Test Method Variability
This chapter provides the background and recommendations on WET test procedures related to sampling conducting the toxicity test methods and conducting the statistical methods Implementing these recommendations should decrease or minimize WET test method variability thereby increasing confidence to make regulatory decisions (see Figure 5-1) EPA stands behind the technical soundness of the current WET test methods The critical steps in minimizing WET test method variability are (1) obtaining a representative effluent sample (2) conducting the toxicity tests properly to generate the biological endpoints and (3) conducting the appropriate statistical analysis to obtain powerful and technically defensible effect concentrations Minimizing variability at each step increases the reliability of the WET test results For example factors that affect variability include sampling procedures sample representativeness deviations from standardized test conditions (eg temperature test duration feeding) test organisms source of dilution water and analyst experience and technique in conducting the toxicity tests properly (Burton et al 1996)
52 Collecting Representative Effluent Samples
The goal of effluent sampling is to obtain a representative sample that reflects real-world biological responses Factors affecting the representativeness of effluent samples may include the sampling location frequency and type (eg composite or grab) and sample volume container preservation methods and holding time Burton et al (1996) concluded that the above factors considerably influence test result variability
Effluent samples must be collected at a location that represents the entire regulated flow or discharge Typically the sampling site is designated in the discharge permit As with sampling for any parameter effluent samples should be collected from a location where the flow is turbulent and well-mixed Additionally effluent samples should be collected at a frequency that enables adequate characterization of the discharge over time (eg accounts for daily to seasonal changes and variations in effluent quality) Major facilities should conduct WET testing monthly or quarterly while minor facilities should conduct WET testing semi-annually or annually
Appropriate sample types should be collected to represent the effluent fully When the effluent is variable collecting composite samples may be necessary When the effluent is less variable grab samples may be sufficient (eg from long-term retention pond facilities)
Sample containers should be non-reactive so that they do not affect sample characteristics Table II of 40 CFR Part 136 requires that toxicity test samples be collected in glass or plastic containers as specified in the methods Sufficient sample volume should be collected for the type of test being conducted including the number of test dilutions When samples are collected in Cubitainersreg headspace should be minimized
Samples must be properly preserved Part 136 of 40 CFR requires that samples for WET testing be cooled to 4EC when shipped off-site and between test sample renewals Samples must be cooled during all phases of collection transportation and storage to minimize physicochemical changes Samples must be tested within the specified maximum holding times before significant changes occur such as volatilization or biological or chemical degradation If samples are not tested within specified maximum holding times the test is invalid and must be repeated by collecting a new effluent sample and conducting a new toxicity test to comply with the NPDES permit
June 30 2000 5-1
Understanding and Accounting for Method Variability in WET Applications Under the NPDES Program
Figure 5-1 Steps to minimize WET test method variability
53 Conducting the Biological Test Methods
Four main components of WET tests afford opportunities to control and minimize variability within tests and within and between laboratories (1) quality control (QC) procedures (2) experimental design (3) test power and (4) test acceptability criteria (TAC) beyond the minimum requirements specified in EPArsquos WET test methods
June 30 2000 5-2
Understanding and Accounting for Method Variability in WET Applications Under the NPDES Program
531 Quality Control Procedures
Quality assurance (QA) practices for toxicity tests address all aspects of the tests that affect data quality These practices include effluent sampling and handling test organism source and condition equipment condition test conditions instrument calibration replication use of reference toxicants recordkeeping and data evaluation The EPA WET toxicity testing manuals specify the minimum requirements for each aspect Regulatory authorities have the discretion to prepare and implement additional guidance beyond the minimum requirements specified in EPArsquos WET test methods
An integral part of the QA program is quality control (QC) The QC procedures are the more focused and routine activities conducted under the overall QA program An important QC component in WET testing is the requirement to conduct reference toxicant tests with effluent tests The WET test methods outline when reference toxicant tests are to be conducted (See sections on quality of test organisms in the manuals) Reference toxicant testing serves two purposes (1) determine the sensitivity of the test organisms over time and (2) assess the comparability of within- and between-laboratory test results Reference toxicant test results can be used to identify potential sources of variability such as test organism health differences among batches of organisms changes in laboratory water or food quality and performance by laboratory technicians In the QA section of each promulgated test method (USEPA 1993 1994a 1994b) EPA recommends sodium chloride potassium chloride cadmium chloride copper sulfate copper chloride sodium dodecyl sulfate and potassium dichromate as suitable reference toxicants The methods do not however specify a particular reference toxicant or the specific test concentrations for each test method
The current characterization of WET test method variability is limited by the ability to quantify sources of within- and between-laboratory variability because laboratories can use different reference toxicants and test concentrations for a particular method Future evaluations of method variability would be greatly enhanced by having data to analyze from multiple laboratories for the same reference toxicant the same dilution water at similar pH and hardness and the same test concentrations By standardizing reference toxicants testing laboratories could compare test results permittees and regulatory authorities could better compare and evaluate laboratories and the data could be used to further quantify within- and between-laboratory test precision Specification of the reference toxicant and test concentrations for a method across laboratories would provide a much larger and consistent data base to assess the comparability of within- and between-laboratory test results
Standardizing reference toxicants and test concentrations has been discussed in the literature For example the chronic methods manual for West Coast species (USEPA 1995) specifies the reference toxicant and test concentrations for each test species The Southern California Toxicity Assessment Group (SCTAG) is comprised of representatives from permittees testing laboratories regulatory authorities and academic institutions that met to discuss technical aspects of WET testing (eg standardization of reference toxicants control charts) The SCTAG (1996) prepared a report to standardize reference toxicants for the chronic freshwater test methods This report evaluated an extensive data base of reference toxicant data The report recommended specific reference toxicants and test concentrations for these methods The SCTAG (1997) also prepared a QAQC checklist to help toxicity testing laboratories establish and maintain appropriate data quality measures Regulatory authorities should review these publications when standardizing reference toxicants
The selection of reference toxicants and test concentrations should be based on specific criteria The following criteria recommended in the SCTAG report provide an excellent basis for selecting standardized reference toxicants
1 The toxicant should provide precise and reliable measures of toxicological sensitivity
2 Toxicant disposal should not be legally or environmentally problematic
June 30 2000 5-3
Understanding and Accounting for Method Variability in WET Applications Under the NPDES Program
3 The toxicant should produce a concentration-response effect for the test organism
4 The toxicant should be quantifiable
5 The toxicant should not pose an unacceptable health hazard to laboratory personnel
6 The toxicant should be readily available
Most recently Warren-Hicks et al (1999) recommended that national acceptance criteria be specified with upper and lower acceptance limits for reference toxicant test results which all laboratories would need to achieve to obtain accreditation Variability could decrease nationally if testing laboratories are provided with more detail on the evaluation and interpretation of reference toxicant control charts (APHA-AWWAshyWEF 1998) For example such guidance could describe how to evaluate test results within the warning limits Both Environment Canada (1990 2000) and APHA-AWWA-WEF (1998) have prepared guidance on evaluating control chart data The Environment Canada (2000) report specifies using zinc as an inorganic reference toxicant and phenol as an organic reference toxicant for many aquatic tests The report also specifies eight criteria for selecting specific reference toxicants
1 Previous use
2 Availability in a pure form
3 Solubility
4 Stability in solution
5 Stability during storage
6 Ease of analysis
7 Stable toxicity with normal changes in qualities of laboratory water
8 Ability to detect abnormal organisms
Regulatory authorities may want to evaluate the above reports and the SCTAG reference toxicant recommendations for the chronic freshwater test methods Regulatory authorities may also want to evaluate and recommend a standard reference toxicant and a specific concentration series for each acute and chronic test method using data from this guidance document
5311 Guidance Related to Quality Control Charts and Laboratory Audits
Ausley (1996) recommends some oversight of data quality such as evaluating tests in meeting QC criteria using randomization procedures and operating in allowed reference toxicant ranges to ensure that QC procedures are properly implemented Another integral component of QC is the maintenance of control charts for reference toxicants and effluents Laboratories should provide regular review of control charts EPA suggests keeping a control chart for each combination of test material test species test conditions and endpoints with a maximum of 20 test results Modern software makes accumulating data and reviewing key test statistics possible with relatively little effort Elementary methods can identify problems contributing to variability Laboratories should practice regular control charting of test PMSDs and control performance for all tests along with control charting of effect concentrations such as NOEC and point estimates for reference toxicants tests Successive tests should be compared occasionally to detect repeated patterns such as one replicatersquos being consistently higher or aberrant or a trend over time Time sequence plots of concentration means and standard deviations would be useful in this regard Occasionally a set of 5 to 20 tests in which block positions (see Appendix A in USEPA 1994b) have been recorded should be subjected to ANOVA for block or position effects If such effects are significant or large the laboratory should seek advice on randomizing the replicates and concentrations
June 30 2000 5-4
Understanding and Accounting for Method Variability in WET Applications Under the NPDES Program
If a laboratoryrsquos CV exceeds the 75th percentile CV from Tables 3-2 through 3-4 EPA recommends calculating warning and control limits based on the 75th and 90th percentiles respectively of CVs for the method and endpoint (Tables 3-2 and 3-3 and Appendix Tables B-1 and B-2) For example suppose the mean EC25 for a series of Ceriodaphnia chronic tests (Method 10020 with reproduction as the endpoint) conducted at one laboratory with reference toxicant is 134 gL NaCl Also suppose that the standard deviation of the EC25s for these tests is 085 The CV for this set of EC25s is thus 063 In Table 3-2 the 75th percentile of CVs for this testrsquos reproduction endpoint is 045 Calculate the standard deviation corresponding to the 75th percentile CV SA75 = 134 times 045 = 060 In Appendix Table B-1 the 90th
percentile of CVs is 062 for this method and endpoint Calculate SA90 = 134 times 062 = 083 Because the CV for this series of EC25s exceeds the 90th percentile reported in Table B-1 EPA recommends the following
bull Set control limits using SA90 = 083
bull Set warning limits using SA75 = 060
bull Promptly take actions to bring results within the control limits and
bull Attempt to bring results within the warning limits in 3-12 months
If the CV for the set of EC25s is less than the 90th percentile reported in Table B-1 use that CV to set control limits If the CV for the set of EC25s is less than the 75th percentile in Table 3-2 do not set warning limits using the latter value
In addition Burton et al (1996) encourage regulatory programs to have a laboratory audit component to document the existence and effectiveness of a QAQC program directed at toxicity testing including analyst training and experience Regulatory authorities should use the National Environment Laboratory Accreditation Program (NELAP) (USEPA 1999a) and routine performance audit inspections to evaluate individual laboratory performance Inspections should evaluate the laboratoryrsquos performance with QC control charts based on reference toxicants examine procedures for conducting the toxicity test procedures and examine procedures for analyzing test results
Regulatory authorities should develop a QC checklist to assist in evaluating and interpreting toxicity test results Appendix E presents examples of State WET implementation procedures related to reviewing reference toxicant data and information on additional QAQC criteria that have been developed and implemented Regulatory authorities should also provide additional guidance related to the interpretation of QC control charts This additional guidance could be that laboratories maintain control charts on within-test variability (eg PMSD) and use warning and control limits based on the 75th and 90th percentiles of CVs for the test method and endpoint
532 Experimental Design
Experimental design includes randomizing the experimental units (ie treatments organisms replicates) establishing the statistical significance level (ie alpha level) and specifying the minimum numbers of replicates test organisms and treatments Oris and Bailer (1993) recommend that test design and TAC be based not only on a minimum level of control performance but also on the ability to detect a particular level of effect (ie test power)
A Type I error (ie ldquofalse positiverdquo) results in the false conclusion that an effluent is toxic when it is not toxic A Type II error (ie ldquofalse negativerdquo) results in the false conclusion that an effluent is not toxic when it actually is toxic Power (1 - beta) is the probability of correctly detecting a true toxic effect (ie declaring an effluent toxic when it is in fact toxic) Acceptable values for alpha range from 001 to 010 (1 to 10 percent) The current EPA test methods recommend an alpha rate of 005 or 5 percent in the toxicity
June 30 2000 5-5
Understanding and Accounting for Method Variability in WET Applications Under the NPDES Program
testing manuals Currently EPA is preparing guidance on when an alpha rate of 001 or 1 percent would be considered acceptable (USEPA 2000a)
5321 False Positives in WET Testing
The hypothesis test procedures prescribed in EPArsquos WET methods provide adequate protection against incorrectly concluding that an effluent is toxic when it is not The expected maximum rate of such errors is the alpha level used in the hypothesis test The hypothesis test procedure is designed to provide an error rate no greater than alpha when the default assumptions are met The statistical flow chart provided with each EPA WET method identifies cases when default assumptions are not satisfied and therefore when data transformations or alternative statistical methods (eg a nonparametric test) should be used
Alpha and beta are related (ie as alpha increases beta decreases) assuming that the sample size (number of treatments number of replicates) size of difference to be detected and variance are held constant The alpha and beta error rates depend on satisfying the assumptions of the hypothesis test To ensure that statistical assumptions and methods are properly applied testing laboratories should review the statistical procedures used to produce WET test results and other factors such as biological and statistical quality assurance and verify that test conditions and test acceptability criteria were achieved
If a test is properly conducted and correctly interpreted identifying any particular outcome as a ldquofalse positiverdquo is impossible An effluent that is deemed toxic may require that the permittee conduct additional toxicity tests to determine if toxicity is re-occurring Even if no toxicity is demonstrated in follow-up tests that does not rule out that the original toxic event was a true toxic spike in the effluent False negatives however impact the environment by allowing the discharge of harmful toxicants without identification This may occur because the toxic effects are not identified as statistically significant due to lack of test sensitivity (see Sections 533 and 64)
Measurement error should not affect the protection against false positives provided by hypothesis tests and confidence intervals when they are appropriately applied Measurement error in the case of WET test treatment mean values likely consists largely of sampling errors (eg variability among organisms or containers) although errors in counting weighing and other procedures may also occur Such sources of imprecision are implicitly accounted for in WET test statistical inferences because the sample variance among the replicates within each treatment (dilution) is used for inference The test ldquosizerdquo 1 - alpha will protect adequately against false positives A larger variance among replicates however could make detecting real toxicity (ie false negatives) more difficult unless the number of replicates is increased to provide more test sensitivity and power which will reduce the rate of false negatives
5322 False Negatives in WET Testing
For a given alpha beta decreases (power increases) as the sample size increases and the variance decreases Decreasing alpha from 005 to 001 without otherwise changing the hypothesis test will reduce the ability of the test to detect toxicity that is will reduce the power of the test Thus as alpha for the hypothesis test is decreased there is an inevitable trade-off between the rate of false positives when toxicity is not present and the ability to detect toxicity when it is present (ie statistical power)
To limit within-test variability and thus increase power EPA developed a minimum significant difference (MSD) criterion that must be achieved in the chronic West Coast marine test methods (USEPA 1995) The MSD is a measure of the within-test variability and represents differences between treatments and the control that can be detected statistically Distributions of the MSD values of multiple tests for a specific reference toxicant and test method can be used to determine the level of test sensitivity achievable by a certain percentage of tests Denton and Norberg-King (1996) analyzed several chronic test methods to quantify the effect size based on the existing toxicity test method experimental design and MSD distributions
June 30 2000 5-6
Understanding and Accounting for Method Variability in WET Applications Under the NPDES Program
Denton and Norberg-King found when setting the beta error rate at 020 (power = 080) the effect size detected varies from at least a 15-percent reduction from the control response for the chronic red abalone larval development test to a 40-percent reduction from the control response for the chronic Ceriodaphnia dubia test In this document EPA has calculated power for each test method (see Section 533)
533 Test Power To Detect Toxic Effects
This section describes the statistical power and ability to detect toxic effects achieved by the current WET methods as inferred from the WET variability data set used to develop this document These inferences are approximate because assumptions of normality and homogeneity of variance were not always satisfied
Power can be characterized only by repeated testing Power is an attribute not of a single test but of a sequence of many tests conducted under similar conditions and with the same test design Therefore in this document EPA used the sample averages for each laboratoryrsquos data set to characterize each laboratory The following two parameters were required (1) the mean endpoint response in the control (growth reproduction survival) and (2) the mean value of the error mean square (EMS) for tests
EPA evaluated the ability to detect toxic effects using three approaches for each test method (1) number of replicates required to detect a 25-percent difference from the control with power of 080 (2) percent difference from the control that can be detected with power of 080 and (3) power to detect a 25shypercent difference from the control All calculations are based on a one-sided two-sample t-test at a level of 095 (alpha of 005) The power for a multiple comparison (Dunnettrsquos or Steelrsquos test) will be less than the power for this two-sample t-test
Table 5-1 summarizes the results for this evaluation Depending on the method between 30 percent and 80 percent of the laboratories were able to detect a 25-percent effect for the sublethal endpoint consistently Between 60 percent and 100 percent of the laboratories were able to detect a 33-percent effect
To examine whether the upper bounds presented in Table 3-6 provide adequate test precision EPA calculated an estimate of the power to detect a 25-percent effect on a sublethal endpoint when the PMSD equals the upper bound reported in Table 3-6 The upper bounds of the PMSD are shown in Table 3-6 in Chapter 3 At the lower PMSD bound the power always exceeded 098 Tests with PMSD equaling the upper bound are not often able to detect a 25-percent effect This finding does not mean that the upper bound is ineffective The PMSD varies between tests and each laboratory has a distribution of PMSDs To avoid exceeding this upper bound often a laboratory would have to achieve substantially lower PMSDs in most tests
5331 Attainment of the PMSD Related to Power
The power of the current experimental design could be reevaluated by comparing it to alternative designs that use increased number of replicates or number of test concentrations (Chapman et al 1996) In this document EPA found that about half of the laboratories in the data set were able routinely to detect a 25-percent difference between control and treatment About two-thirds of the laboratories could routinely detect a 33-percent difference (Table 5-2) For example mere attainment of the 90th percentile PMSD values shown in Table 3-6 will not ensure the ability to detect a 25-percent effect (Table 5-2) If every acceptable test has a PMSD below that upper bound however the average PMSD will be lowered Based on the within-laboratory variability of PMSD1 the average PMSD likely will be substantially lower than the upper bound in Table 3-6 if most tests conducted by a laboratory are to have acceptable PMSDs
The average CV for PMSD is one-third to one-half its mean in commonly used methods
June 30 2000
1
5-7
Understanding and Accounting for Method Variability in WET Applications Under the NPDES Program
Table 5-1 Tests for Chronic Toxicity Power and Ability To Detect a Toxic Effect on the Sublethal Endpoint
Test Method No
Labs
No Labs with Power
Power (Range)
No Labs Having Power at Least 08 To Detect
Effect of
Effect Detected with Power 08 as Percent of
Control Mean (Range)$$ 08 $$ 05 25 33
10000 Fathead Minnow 19 6 14 021 - 100 6 13 82 - 62
10020 Ceriodaphnia 33 10 29 038 - 100 10 19 14 - 45
10030 Green Alga 9 7 8 033 - 099 7 8 13 - 49
10040 Sheepshead Minnow 5 4 5 077 - 100 4 5 86 - 26
10060 Inland Silverside 16 7 13 023 - 097 7 12 17 - 59
10070 Mysid (growth) 10 5 8 021 - 091 5 8 21 - 70
Note Power was calculated for a two-sample one-sided t-test at alpha = 005 for a 25-percent difference from the control Effect size detected was calculated for the same test using power 080 Calculations used the average EMS from all tests at each laboratory and the minimum number of replicates reported for those tests Calculations assumed that the parametric mean and variance equal the corresponding sample estimates They also assumed approximate normality of means and homogeneity of variance Because these assumptions may be violated the results here are approximate By saying ldquodetect a 25-percent difference from controlrdquo this alternative hypothesis is intended (control mean - treatment mean) gt 025 times control mean
Table 5-2 Power To Detect a 25-Percent Difference from the Control at the 90th Percentile PMSD
Chronic Method Replicates 90th Percentiles
of PMSD
Three Treatments
Four Treatments
Five Treatments
alpha = 005
alpha = 0053
alpha = 005
alpha = 0054
alpha = 005
alpha = 0055
10000 Fathead Minnow 3 35 039 025 039 019 039 015
4 35 041 030 042 026 043 023
10020 Ceriodaphnia 10 37 039 031 041 030 043 030
10030 Green Alga 3 35 039 025 039 019 039 015
4 35 041 030 042 026 043 023
10040 Sheepshead Minnow 3 23 072 069 072 062 073 055
4 23 073 071 074 068 075 066
10060 Inland Silverside 3 23 072 069 072 062 073 055
4 23 073 071 074 068 075 066
10070 Mysid 8 32 048 041 050 040 052 040
Notes Values are rounded to two significant figures Number of treatments is the number of concentrations compared with the control in the hypothesis test The calculations assumed (1) the usual assumptions of the test are satisfied (approximate normality homogeneity of variances) and (2) equal replication in treatments and control Because these assumptions may be violated the results here are approximate Because the MSDmean implies a value for [root (error mean square)mean] the latter could be calculated from the MSD Dunnettrsquos critical value and the number of replicates and then used in a calculation of power Calculations apply to a one-sided two-sample t-test of equal means assuming equal variances and equal replication with hypotheses Hocontrol mean - treatment mean = 0 versus Hacontrol mean - treatment mean gt 025 times control mean The power achieved by Dunnettrsquos multiple comparison procedure will lie between the two-sample power at alpha = 005 and that for alpha = 005(no of treatments)
June 30 2000 5-8
Understanding and Accounting for Method Variability in WET Applications Under the NPDES Program
Testing laboratories and permittees can examine the EMS or MSD in Tables B-14 and B-15 (Appendix B) to estimate the ability of a WET test to detect toxic effects Some regulatory authorities may require a comparison between the control and the receiving water concentration which requires a two-sample one-sided t-test Others may require the multiple comparisons procedure described in the EPA WET methods (Dunnettrsquos or Steelrsquos tests one-sided with alpha of 005) The power of Dunnettrsquos procedure falls between the power of the one-sided two-sample t-test with alpha of 005 and alpha of 001 assuming that no more than five toxicant concentrations are compared to a control The power of Steelrsquos procedure will be related to and should usually increase with the power of Dunnettrsquos procedure and the t-tests Tables B-14 and B-15 in Appendix B also provide an appropriate guide to achieving power using a nonparametric test
Recently the State of Washington (1997) issued guidance specifying an acute and chronic statistical power standard to be achieved for compliance testing EPArsquos sediment toxicity testing manuals (USEPA 1994c USEPA 2000) include power curves for various numbers of experimental units CV ranges and associated alpha and beta levels Sheppard (1999) is a good source to provide a simple explanation of how power helps determine how large a sample should be Additional information on power may be obtained at httpwwwpsychologieuni-trierde8000projectsgpowerliteraturehtml
EPA recommends that regulatory authorities specify in their State WET implementation procedures that individual test results achieve a level of within-test sensitivity by using the upper and lower PMSD test sensitivity bounds (see Section 64) To achieve the test sensitivity bounds testing laboratories may need to minimize within-test variability (eg EMS) or increase the number of replicates tested or both If laboratories cannot achieve PMSD values of less than 25 percent for the toxicity test methods that require a minimum of only three replicates (Methods 10000 10040 10060) then the numbers of replicates may need to be increased Appendix B (Section B4) provides information related to the number of replicates needed and discusses the relationship between test power and effect size achieved The magnitude of the effect size achieved relates to the test sensitivity
54 Test Acceptability Criteria
EPA test methods have specific TAC that the effluent and reference toxicant tests must meet A test is considered invalid if the TACs are not met The recommended test conditions for each test method specify the minimum requirements and the TAC For example control survival must be 80 percent or greater and average control reproduction at least 15 young per surviving female in the chronic Ceriodaphnia dubia survival and reproduction test
The chronic West Coast marine methods (USEPA 1995) require additional TAC For example to limit the degree of within-test variability the methods specify a maximum allowable value for PMSD (see Section 532 on experimental design) Some States have additional TAC in their State WET implementation policies North Carolina (1998) for example requires that the chronic Ceriodaphnia dubia analyses meet an additional TAC of complete third brood neonate production by at least 80 percent of the control organisms and that the control reproduction CV be less than 40 percent
Additional TAC might be specified to minimize variability among replicates Variability of any toxicity test result is influenced by the number of replicates used number of organisms tested and variability among replicates at each test concentration and the control Variability among replicates has been quantified by treatment CV EMS or MSD The application of a maximum acceptable value for CV or MSD helps ensure adequate laboratory QAQC and increases the reliability of submitted data One benefit of requiring a maximum allowable within-test variability limit is that laboratories will improve culturing test handling and housekeeping which are usually incorporated into the laboratoriesrsquo standard operating procedures For example the CV requirement might be incorporated directly into the NPDES permit Sample EPA Region 6 permit language reads
June 30 2000 5-9
Understanding and Accounting for Method Variability in WET Applications Under the NPDES Program
1 The coefficient of variation between replicates shall be less than or equal to 40 percent in the control
2 The coefficient of variation between replicates shall be less than or equal to 40 percent at the instream waste concentration (IWC)
3 Test failure may not be construed or reported as invalid due to a CV of greater than 40 percent A repeat test shall be conducted within the required reporting period if any test is determined to be invalid
Occasionally statistical analyses indicate a test failure when as little as 15-percent mortality has occurred in a test dilution Permit language has been developed to address this occurrence as in the following example
If all TAC conditions are met and the percent survival of the test organism is greater than or equal to 80 percent (in a chronic test) or 90 percent (in an acute test) in the critical dilution concentration and all lower dilution concentrations the test shall be considered to be a valid test and the PERMITTEES shall report an NOEC of not less than the critical dilution for the discharge monitoring report (DMR) reporting requirements
Regulatory authorities may consider providing guidance or imposing additional TAC such as those implemented by EPA Region 6 or like some States have implemented (North Carolina 1998 Washington 1997) Appendix E provides additional examples of States that have implemented further guidance on WET QAQC procedures and TAC Warren-Hicks (1999) also recommended that additional national TAC be established for each test method (eg upper and lower bounds on the MSD) Therefore EPA recommends that regulatory authorities require that additional TACs be implemented in permits to minimize within-test variability and increase test sensitivity (see Section 64 and Appendix C for sample permit language)
55 Conducting the Statistical Analysis To Determine the Effect Concentration
EPA test methods currently recommend two statistical approaches to estimate a chemical or effluent concentration for each biological effect endpoint (eg survival growth and reproduction) One approach is to derive the NOEC by hypothesis testing which equates biological significance with statistical significance The second approach is to estimate an effect concentration that reduces the control response by 25 percent for chronic methods The expanded use of WET tests in the NPDES program has brought increased attention to the statistical analysis of toxicity test data A common goal for both regulatory authorities and permittees is to confirm that the effect concentrations were derived correctly using the appropriate analysis approaches Reliable effect concentrations lead to increased confidence in the data used for making regulatory decisions such as determining reasonable potential deriving a permit limit or monitoring trigger and generating self-monitoring test results
Another important consideration in conducting statistical analyses is the inconsistent use of statistical programs The proliferation of statistical packages has been helpful in data analysis however these packages also can result in the misapplication of the statistical methods APCA-AWWA-WEF (1998) cautions the user to confirm the results of each analysis with each package before accepting them The data user is responsible for evaluating all data submitted to the regulatory authorities
The 1995 SETAC Pellston Workshop discussed unresolved scientific issues and highlighted significant research needs associated with WET testing The attendees recommended the following
Immediately instigate studies to evaluate improvements in the statistical analysis of WET test data These studies should include but not necessarily be limited to the following activities
5-10 June 30 2000
Understanding and Accounting for Method Variability in WET Applications Under the NPDES Program
(a) investigate the implications of concurrent application of NOECMSD tests of bioequivalence and ECp estimators (Chapman et al 1996a)
In response to this recommendation EPA began projects to evaluate the bioequivalence approach and additional point estimate models for the WET program At present two test methods are being used for this evaluation (1) the chronic Ceriodaphnia dubia survival and reproduction tests and (2) the giant kelp germination and germ-tube length test with reference toxicants
The bioequivalence approach poses the following question Do the mean responses of the effluent concentration and the control differ by more than some amount For example the control response and the response at the critical effluent concentration (ie instream waste concentration) must differ by no more than a fixed value in order to accept the hypothesis of no significant difference (ie no toxicity) This approach could address the concern that an imprecise test might not detect toxicity when toxicity is present or that a small but statistically significant effect would detect toxicity that may not be biologically important Some researchers have suggested that the bioequivalence approach could provide a positive incentive for dischargers to produce test results with lower within-test variability to demonstrate that no toxicity occurs at a level greater than a biologically (bioequivalence approach) significant amount (Shukla et al 2000 Wang et al 2000)
Bailer et al (2000) evaluated the proposed regression-based estimators with the current EPA point estimate models They found that it appears reasonable to incorporate parametric estimation models in the WET program Bailer et al (2000) concluded that these models are appropriate for all response scales (ie dichotomous count and continuous) and can incorporate monotonicity without bias However confidence intervals still need to be developed for these parametric models
In this document EPA has not recommended either the bioequivalence or additional point estimate models to supplement the current statistical approaches as described in the testing manuals An independent peer-reviewed workshop should be convened to evaluate the benefits of these alternative statistical approaches to enhance the statistical approaches currently applied
56 Chapter Conclusions
In this chapter EPA provides guidance to permittees and testing laboratories on collecting representative effluent samples conducting the biological test methods and evaluating the statistical analyses EPA recommends that States implement the lower and upper PMSD test sensitivity bounds to achieve an acceptable level of test sensitivity and minimize within-test variability (see Section 64) EPA also provides guidance to permittees and testing laboratories on the number of replicates required to achieve the PMSD bounds Testing laboratories should maintain and evaluate both effluent and reference toxicant data using a measure of within-test variability such as the PMSD
Permittees and toxicity testing laboratories may need to increase replication in order to reduce PMSD below the upper bound Table B-15 can be used for initial planning of replication given knowledge of typical values of the error mean square (EMS) or MSD and the number of concentrations used in the multiple comparison hypothesis test To ensure that all PMSD values fall below the upper bound in Table 3-6 a laboratory would select the largest EMS value experienced in its past testing
EPA recommends that testing laboratories require a minimum of four replicates for the fathead minnow sheepshead minnow and inland silverside chronic test methods (Methods 10000 10040 and 10060 respectively) Four replicates are needed to execute the statistical flow chart when a nonparametric test is needed Three replicates are also sometimes insufficient to keep PMSD below the recommended upper bound In addition four replicates are needed to help achieve the upper PMSD bound
June 30 2000 5-11
Understanding and Accounting for Method Variability in WET Applications Under the NPDES Program
This page intentionally left blank
5-12 June 30 2000
60 GUIDANCE TO REGULATORY AUTHORITIES DETERMINING REASONABLE POTENTIAL AND DERIVING WET PERMIT CONDITIONS
EPA developed the TSD (USEPA 1991a) to support implementation of national policy to control the discharge of toxic pollutants The TSD presents a statistical approach for determining the need for and the method of deriving water quality-based effluent limits (WQBELs) based on aquatic life (including WET) human health and wildlife criteria This approach accounts for the uncertainty associated with small data sets and data variability by assuming a statistical distribution of effluent data (usually lognormal) and calculating a CV or using a default CV to describe data variability
61 Analytical and Sampling Variability in Calculations for Reasonable Potential and Permit Limits
Section 61 discusses use of the CV of sample measurements of toxicity to make a reasonable potential determination and to calculate permit limits Two points must be understood (1) this CV is to be calculated using toxic unit (TU) values (USEPA 1991a) (see Section 62) and (2) EPA strongly recommends that point estimates (not NOEC or LOEC values) be used to calculate the TU values (USEPA 1994a 1994b)
Water quality-based effluent limits are required when a discharge causes has reasonable potential to cause or contributes to an instream excursion above a water quality standard Throughout this document EPA uses the commonly understood shorthand reference ldquoreasonable potentialrdquo to refer to this standard for determining the need for a water quality-based effluent limit
611 ldquoAdjusting for Analytical Variabilityrdquo in Calculations for Reasonable Potential and Permit Limits
Adjustment approaches (see Appendix G3) have been suggested to ldquoadjust for analytical variabilityrdquo when deriving permit limits and determining the need for a WET limit in the first place EPA does not recommend these adjustment approaches (Appendix G3) and strongly reaffirms the statistical approach and methods for calculating permit limits provided in the TSD (USEPA 1991a) EPA recommends that regulatory authorities use the statistical approach and calculation methods in the TSD The TSD methods were designed to provide a reasonable degree of protection for water quality (ie to avoid exceedances of water quality criteria) while providing a reasonable degree of protection from the variability of effluent toxicity and analytical variability The various ldquoadjustmentrdquo approaches would undermine these objectives
The TSD limit calculation for a point source can be divided into two steps first convert the wasteload allocation (WLA) to a long-term average (LTA) and then convert the LTA to effluent limits (maximum daily average weekly and average monthly limits) WET limit calculations include an intermediate step in which the acute WLA is converted to a WLAac These calculations employ a facility-specific CV based upon effluent sampling data The TSD approach uses this CV in both steps
Adjustment approaches intended to account for analytical variability discussed in detail in Appendix G would inappropriately use different CVs in these two steps The first step would use an estimate of the CV of ldquotruerdquo effluent toxicity which is smaller than the CV for measured toxicities This approach would result in a larger calculated LTA The second step would use the CV for the measured toxicities which is the same CV used in both steps of the TSD approach
Use of such adjustment approaches would frequently result in setting an average monthly permit limit (AML) that exceeds the chronic WLA Appendix G demonstrates that such outcomes (ie the AML exceeds
June 30 2000 6-1
Understanding and Accounting for Method Variability in WET Applications Under the NPDES Program
the chronic WLA) generally can be expected to occur when various adjustment approaches are used Appendix G Table G-1 presents a numerical example of how an adjustment approach would allow calculation of an AML exceeding the chronic WLA (a four-day average value) even when sampling frequency for the calculation is set at the recommended minimum of four samples per month [It is acceptable for the maximum daily limit (MDL) which applies to a single sample to exceed the chronic WLA It is also acceptable for the AML to exceed the chronic WLA if the AML calculation is based on fewer than four samples per month Note however that the TSD recommends always assuming at least four samples per month when calculating the AML]
The TSD reasonable potential calculation first calculates the percentile represented by the maximum observed TU value For example the maximum of 10 reported TU values is identified with the 63rd
percentile Then the sample CV is used to project the 95th or 99th percentile TU value using a table of reasonable potential multiplying factors This value is combined with the appropriate mixing-zone dilution to project a maximum receiving water toxicity which is compared with the applicable water-quality criterion If an adjustment were applied to the reasonable potential calculation the CV would be adjusted downward and the maximum projected receiving water toxicity would be smaller This would make a determination of need for a permit limit less likely
Because of these considerations EPA strongly recommends that no adjustment be made to the CV or variance of toxicity either for reasonable potential or permit limit calculations The TSD statistical approaches already account for analytical variability appropriately EPA continues to recommend the TSD approach which ensures that effluent limits and thereby measured effluent toxicity or pollutant parameter concentrations are consistent with calculated WLAs
612 Analytical Variability and Self-monitoring Data
EPA determines compliance with permit limits on the basis of self-monitoring data and these data include some measure of analytical variability The influence of analytical variability is accounted for in the TSD statistical procedures used to set water-quality limits and determine the potential for toxicity as explained in Appendix G
The permittee is responsible for ensuring that measured discharge toxicity never exceeds the permit limits No special allowance is made for analytical variability in assessing compliance The maximum discharge toxicity should incorporate a margin of safety which will account for sampling and analytical variability In other words to avoid exceeding permit limits the facilityrsquos treatment system should be designed so that the maximum toxicity is somewhat lower than its permit limits
613 Precision of WET Measurements and Estimates of Effluent CV
Single measurements on effluent involve some uncertainties about the true concentration or toxicity related to representativeness of the sample including sample holding time and conditions and the analytical measurement system Like all analytical measurements WET measurements (NOEC EC25 LC50) are inexact That is the exact toxicity of an analyte in a sample can be specified only within some range This imprecision can be reduced by using a suitable number of organisms and replicates for each test (see Section 532 on experimental design)
The numbers of organisms and replicates required for EPA WET method test acceptability are specified as minimums Test precision will be approximately proportional to the square root of the number of replicates Thus doubling the number of replicates may decrease the MSD to approximately 70 percent of its former value Increased replication also tightens the confidence interval for a point estimate of the effect concentration (eg EC25 and LC50)
June 30 2000 6-2
Understanding and Accounting for Method Variability in WET Applications Under the NPDES Program
EPA strongly recommends that toxicity measurements of an effluent be obtained at least quarterly for three years to provide a good basis for determining the need for limits and for calculating limits One year should be regarded as the minimum duration needed to characterize effluent variability (due to seasonal stream flow or process fluctuations) and ten the minimum number of measurements unless scientific and technical knowledge supports a shorter period as representative of the distribution of pollutant types and concentrations of toxicity
Estimates based on multiple measurements involve the same uncertainties that apply to single measurements They also may involve larger uncertainties related to sampling error that is the chance that typical levels of toxicity or concentrations of pollutant may not be encountered during the sampling program The sampling program may not fully characterize effluent variability if too few samples are taken the sampling times and dates are not representative or the duration of the sampling program is not long enough to represent the full range of effluent variability When determining the need for limits and calculating limits the variance or the CV of toxicity measurements is key The larger the number of samples the more precise is the estimate Confidence intervals for the variance and CV can be calculated and carried through the calculations for reasonable potential and effluent limits (Appendix G) Even when assumptions are not strictly met confidence intervals provide a useful perspective on the uncertainty of the results and the need for more samples The minimum number of measurements recommended for calculating estimates of the CV for effluent toxicity is 10
614 Between-Laboratory Variability
Between-laboratory variability may increase the CV as discussed in Section 611 if the toxicity tests were conducted by more than one laboratory for a specific facility A concern to permittees is that this may increase the likelihood of making a finding of reasonable potential
Within-laboratory variability is the component of analytical variability that should be reflected in regulatory calculations If the data used for reasonable potential or permit limit calculations are effluent measurement data reported by at least two laboratories there are ways to appropriately estimate the variance to be used in TSD statistical calculations
For example
bull If the same laboratories continue to be used in the same proportion or frequency and the measurements from the individual laboratories represent different sampling dates the measurement data can be treated as if they were generated by a single laboratory This approach may increase the estimated variance and the AML which is not in the interest of the permittee Selecting one laboratory for future monitoring based on the variance of its reported reference toxicant test results should mitigate this problem
bull If only one laboratory has reported data on each sampling date and the other laboratories report over different time spans or over the same time span on alternating dates EPA recommends forming a pooled estimate of variance Calculate the sample variance (S2) of log(TU) for each laboratory separately and combine these using the formula
pooled variance of log(X) = [(N1 - 1)S12 + (N2 - 1)S2
2] [(N1 - 1) + (N2 - 1)]
An analogous formula is used for more than two laboratories The same result can be obtained by conducting a one-way analysis of variance on log(TU) (with laboratories treated as the groups or classes) and using the reported EMS
June 30 2000 6-3
Understanding and Accounting for Method Variability in WET Applications Under the NPDES Program
Changing a laboratory may change analytical (within-laboratory) variability of measurements and test sensitivity (ie PMSD values) That is the average effect concentration may change (eg Warren-Hicks et al 1999) Ideally the permittee will anticipate and plan for a change of testing laboratory Permittees should compare reference toxicant test data for current and candidate replacement laboratories selecting one with acceptable variability and a similar average effect concentration
62 Determining Reasonable Potential and Establishing Effluent Limits
Effluent characterization is an essential step in determining the need for an NPDES permit limit NPDES regulations under 40 CFR Part 12244(d)(1)(ii) specify that reasonable potential include ldquowhether a discharge causes has the reasonable potential to cause or contributes to an instream excursion above a State water quality standardrdquo Calculations for reasonable potential determination and for permit limits should follow EPA guidance in the TSD (USEPA 1991a) In particular the TSD statistical methods should be used Such calculations should use TUs for WET data not effect concentrations (percent whole effluent) Toxic units are defined (USEPA 1991a Chapter 131 page 6) as the reciprocal of the effect concentration times 100 where the effect concentration is expressed as a percentage of whole effluent thus TUa = 100 LC50 and TUc = 100ECp
When characterizing an effluent to determine whether a permit limit is necessary permit writers can use the available effluent WET data and a water-quality model to perform a reasonable potential analysis The TSD outlines the statistical approach This approach uses existing effluent data to project a maximum pollutant concentration or a maximum toxicity in the effluent (USEPA 1991a) The projected maximum concentration or toxicity is used as an input in the water quality model to determine whether the effluent has the reasonable potential to cause or contribute to an excursion of ambient water quality criteria If reasonable potential exists the permit writer must derive a WET permit limit for that facility1
The variability of the existing effluent data as measured by the CV has a significant effect on the projected maximum pollutant concentration or toxicity The higher the CV the higher the projected maximum and the more likely that there is reasonable potential and a limit is needed EPA recommends that regulatory authorities use all valid relevant and representative data in making reasonable potential determinations EPA is developing a national policy clarifying use of the TSD procedures for determining reasonable potential for WET Important components of this policy include specifying the minimum number of valid WET tests necessary to calculate facility-specific CVs2 as well as recommending a step-wise approach to determining the need for WET permit limits This approach reflects a strong preference by EPA and its stakeholders to rely on facility-specific WET testing based on adequate frequency and duration of effluent sampling for making reasonable potential determinations for toxicity
EPA recommends that point estimates be used to estimate effluent variability to determine the need for limits and to set permit limits This is recommended whether the self-monitoring test results will be determined using hypothesis tests or point estimates Point estimates have less analytical variability than NOECs using current experimental designs as shown in Chapter 3 Point estimates make the best use of the WET test data for purposes of estimating the CV LTA and RP factor and calculating the permit limit
1 When the State has narrative criteria for toxicity and the TIETRE identifies a specific chemical that is the source of toxicity the permit writer may include a chemical-specific limit for that parameter instead of a WET permit limit in accordance with 40 CFR Part 12244(d)(v)
2 If fewer than ten data points are available the regulatory authority must use a default CV As a result the need for a WET permit limit may be based on a default value rather than actual data
June 30 2000 6-4
Understanding and Accounting for Method Variability in WET Applications Under the NPDES Program
63 Development of a Total Maximum Daily Load for WET
Total maximum daily loads (TMDLs) may be indicated when there is acute or chronic toxicity in a waterbody leading to the listing of the waterbody as impaired under CWA Section 303(d) and when there are multiple sources of the toxicity EPA believes that TMDL calculations should be performed on the pollutants causing toxicity whenever possible In these situations EPA suggests that the first step of the analysis is to conduct ambient toxicity identification evaluations to identify the pollutant(s) and the source(s) causing the toxicity Once the pollutant(s) and source(s) causing toxicity have been identified for the waterbody then a TMDL should be developed for the individual pollutant(s)
64 Accounting for and Minimizing Variability In the Regulatory Decision Process
A common goal for the permittee and the regulatory authority is to have confidence in the test results from the biological and statistical procedures Both permittees and regulatory authorities would then have more confidence in taking regulatory actions such as evaluating multiple effluent samples to determine reasonable potential and derive permit conditions (eg permit limits monitoring triggers) If steps such as collecting a representative effluent sample to conducting the toxicity tests properly as discussed in Sections 52 through 54 and requiring additional TACs (Section 641) are used to reduce or minimize within-test variability then the reliability of the WET test results increases
641 Recommended Additional TACs Lower and Upper Bounds for PMSD
Reference toxicant data from a large number of tests and laboratories were used to generate PMSD values percentiles of these values are reported in Table 3-6 The MSD represents the smallest difference between the control mean and a treatment mean that leads to the statistical rejection of the null hypothesis (ie no toxicity) using Dunnettrsquos multiple comparison test MSD values are divided by the control mean and multiplied by 100 to produce a ldquopercent MSDrdquo (PMSD) value The PMSD allows comparison of different tests and represents the smallest significant difference from the control as a percentage of the control mean Thus it represents the smallest significant value of the relative difference [100 (control mean shytreatment mean)control mean] The MSD is often expressed as a percentage of the biological endpoint in the control response
The following formula is used to calculate MSD (as recommended by USEPA 1995)
MSD ds w (1n1) (1n)
where d = critical value for the Dunnettrsquos procedure
sw = the square root of the error mean square (EMS) n1 = number of experimental units in the control treatment n = the number of experimental units per treatment assuming an equal number at all other
treatments
Percent MSD is calculated as follows MSDPMSD times 100
control mean
EPA recommends that regulatory authorities implement both the lower and upper PMSD bound approach to minimize within-test variability when using hypothesis testing approaches to report an NOEC The implementation of the upper PMSD bound should also apply when using point estimate techniques There are five possible outcomes for regulatory decisions (see Figure 6-1) Two outcomes imply unqualified acceptance of the WET test statistical result
June 30 2000 6-5
Understanding and Accounting for Method Variability in WET Applications Under the NPDES Program
1 Unqualified PassndashThe testrsquos PMSD is within bounds and there is no significant difference between the means for the control and the instream waste concentration (IWC) treatment The regulatory authority would conclude that there is no toxicity at the IWC concentration
2 Unqualified FailndashThe testrsquos PMSD is larger than the lower bound (but not greater than the upper bound) in Table 3-6 and there is a significant difference between the means for the control and the IWC treatment The regulatory authority would conclude that there is toxicity at the IWC concentration
3 Lacks Test SensitivityndashThe testrsquos PMSD exceeds the upper bound in Table 3-6 and there is no significant difference between the means for the control and the IWC treatment The test is considered invalid A new effluent sample must be collected and another toxicity test must be conducted
4 Lacks Test SensitivityndashThe testrsquos PMSD exceeds the upper bound in Table 3-6 and there is a significant difference between the means for the control and the IWC treatment The test is considered valid The regulatory authority would conclude that there is toxicity at the IWC concentration
5 Very Small but Significant DifferencendashThe relative difference (see Section 642 below) between the means for the control and the IWC treatment is smaller than the lower bound in Table 3-6 and this difference is statistically significant The test is acceptable The NOEC is determined as described in Section 642 below
Test Unacceptable Lacks Sensitivity
Very Small Determine the NOEC
(Section 642)
PASS
FAIL
MIN
MAX (0c - 0IWC) = PMSD
Percent Minimum
Significant Difference
MIN MAX(0 - 0IWC)c
0 = control meanc
0IWC = instream waste concentration mean
Figure 6-1 Paradigm that incorporates the lower and upper percent minimum significant difference
Regulatory authorities should examine the sample permit language as provided in Appendix C for incorporation of the PMSD bound language in a NPDES permit
Note that ldquounqualified acceptancerdquo of a WET test result requires that all of the following must be achieved (1) collect the effluent sample properly (2) conduct the toxicity test methods as specified in the toxicity manuals (3) meet the required TACs (4) meet the proper water quality parameters (eg temperature pH) and (5) conduct the proper statistical calculations All these conditions must be reviewed and deemed acceptable before a test is evaluated for self-monitoring data and reporting
June 30 2000 6-6
Understanding and Accounting for Method Variability in WET Applications Under the NPDES Program
Figure 6-2 provides a decision tree that regulatory authorities can use when implementing the lower and upper PMSD bounds
Use Data for Calculating Reasonable Potential Limit Self-Monitoring Data
KEY PMSD = Percent minimum
significant difference MT = Monitoring trigger TAC = Test acceptability criteria WQ = Water quality
Verify TAC
Check WQ Parameters
amp Test Conditions
Calculate amp Report PMSD
Calculate Statistical Endpoints
Conduct Toxicity Tests
Evaluate Test Data
Continue Routine Testing
Conduct Additional Tests
Determine NOEC According to 643
Repeat Test with New Effluent Sample
Within PMSD Bounds
amp IS NOT Significant
at IWC
Within PMSD Bounds amp IS Significant
at IWC Exceeds Upper
PMSD Bound amp IS Significant
at IWC
Exceeds Upper PMSD
Bound amp IS NOT
Significant at IWC
Below Lower
PMSD Bound amp IS Significant
at IWC
5
1
4
2
3
Figure 6-2 Implementing applications of upper and lower PMSD bounds for effluent toxicity testing requirements
June 30 2000 6-7
Understanding and Accounting for Method Variability in WET Applications Under the NPDES Program
642 How to Determine the NOEC Using the Lower PMSD Bound
If the permit specifies that self-monitoring data are to be generated using hypothesis testing approaches then the analyst should report the NOEC as the following Find the smallest concentration for which (a) the treatment mean differs significantly from the control mean and (b) the relative difference (see example below) is not smaller than the 10th percentile in Table 3-6 Therefore the NOEC is the next smaller test concentration
In other words concentrations having a very small relative difference with control (smaller than the lower PMSD bound) would be treated as if they do not differ significantly from control (even if they do so) for the purpose of determining the NOEC
Table 6-1 illustrates the application of the lower PMSD bound for the reproduction endpoint of a Ceriodaphnia chronic test In this example the testrsquos PMSD was 99 smaller than the 10th percentile value of 11 found in Table 3-6 The IWC concentration differed significantly from the control The test falls under outcome number 5 a significant but very small difference at the IWC The first step is to calculate the relative differences from control (Table 6-1) as [(control mean - treatment mean) divided by (control mean)] times 100 The next step is to determine which relative differences exceed the PMSD lower bound 11 in this case (see the last column of Table 6-1) Finally the NOEC is determined as described above The NOEC is 125 percent effluent for this example
Table 6-1 Example of Applying the Lower PMSD Bound for the Chronic Ceriodaphnia Test with the Reproduction Endpoint
Concentration (percent effluent)
Reproduction (mean of ten replicates)
Relative Difference
from Control
Does Relative Difference Exceed 11
100 508 82 Yes
50 124 56 Yes
25 234 17 Yes
IWC = 125 253 10 No
625 261 74 No
Control 282 0 No
NOTE The lower PMSD bound for this method and endpoint is 11 (Table 3-6) In this example the NOEC is 625 percent effluent using the testrsquos (very small) PMSD Therefore the reported NOEC should be 125 percent effluent after applying the lower PMSD bound
Differs statistically from the control as determined by MSD = 28 neonates Thus treatment means that are less than 282 - 28 = 254 would be statistically significant These correspond to relative differences greater than 100 (28 282) = 99 percent
643 Justification for Implementing the Test Sensitivity Bounds
A lower bound is needed to avoid penalizing laboratories that achieve unusually high precision The 10th percentile PMSD represents a practical limit to the sensitivity of the test method because few laboratories are able to achieve such precision on a regular basis and most do not achieve it even occasionally Several independent researchers have evaluated and provide support for using the MSD approach as additional TAC for the toxicity test methods Thursby et al (1997) advocate and provide reasons for using an empirical data base of minimum significant differences to provide TAC using statistical performance assessment The State of California (Hunt et al 1996 Starrett et al 1993) and the West Coast marine toxicity test methods (USEPA 1995) have implemented an upper PMSD bound to minimize insensitive tests Also the State of North Carolina has implemented additional requirements for the Ceriodaphnia chronic tests that reduced method
June 30 2000 6-8
Understanding and Accounting for Method Variability in WET Applications Under the NPDES Program
variability North Carolinarsquos evaluation of these additional TACs and subsequent improvements in test sensitivity appears in Appendix F
The North Carolina data base affords the opportunity to evaluate the effectiveness of additional TAC and changes to the toxicity test procedures as they relate to the variability of WET test results (see Appendix F) For example for PMSD the median value decreased from 21 percent to 16 percent while the 90th percentile decreased from 39 percent to 31 percent indicating an overall increase in test sensitivity The range in median values across all laboratories before adopting additional TACs was 12 percent to 36 percent After adopting additional TACs the range in median values was 10 percent to 27 percent indicating a decrease in the overall spread between laboratories The range in control CVs within a laboratory was from 21 percent to 79 percent before adopting TACs compared to the range in control CVs within a laboratory after adopting TACs which was narrowed to 17 percent to 36 percent Overall laboratories are generating data with more consistency within and between laboratories after implementation of the additional TACs and additional method guidance provided by the State for the chronic Ceriodaphnia dubia test method
644 Guidance to Testing Laboratories on How to Achieve the Range of Performance for PMSD
EPA recommends that regulatory authorities use the upper bounds (90th percentiles for PMSD in Table 3-6) to identify tests that are insufficiently sensitive If PMSD exceeds this upper bound more often than occasionally the laboratory should thoroughly investigate ways to reduce variability There are three principal ways to reduce PMSD (1) decrease within-test variability (that is decrease the error mean square and therefore the standard deviation at each concentration) (2) increase the control mean and (3) increase the number of replicates The number of replicates required could be determined by trial-and-error calculations using the error mean square values obtained from a series of WET tests At least 20 tests are recommended The number ldquonrdquo in the formula for MSD (number of replicates) would be increased and MSD re-calculated for each error mean square value This approach uses a sample of tests specific to a particular laboratory and reveals the variation among tests This approach would demonstrate how many replicates would be needed to achieve the upper PMSD bound as required in Table 3-6
65 Additional Guidance That Regulatory Authorities Should Implement to Further Support the WET Program
As discussed in Section 53 regulatory authorities have the discretion to develop and implement additional WET program requirements and guidance to ensure that WET test method variability is reduced by specifying additional guidance beyond the minimum requirements of EPArsquos WET test methodrsquos QAQC and TACs Appendix E provides a snapshot of State approaches to implementing NPDES WET programs to minimize WET test variability
These State approaches include WET information to assist the regulated community with the following
bull Guidance regarding the evaluation of reference toxicant and effluent test results
bull Guidance regarding how the State reviews reference toxicant data for laboratory performance
bull Guidance regarding additional QAQC criteria the State has developed and implemented
bull Guidance regarding efforts the State has made to minimize test method variability
bull Description of how the State reviews or conducts performance laboratory audits
bull Description of specific implementation guidance that the State has developed to assist permit writers
bull Description of how the State provides or uses toxicity test training
June 30 2000 6-9
Understanding and Accounting for Method Variability in WET Applications Under the NPDES Program
States contemplating such changes should consult with EPA to ensure the changes will be appropriate in the context of the Statersquos overall NPDES WET program In addition States should implement a step-wise approach to address toxicity when the permit limit or monitoring trigger is exceeded in their State WET implementation plans
For example when an effluent is deemed toxic then the permittee should take appropriate steps to demonstrate the magnitude frequency and potential source(s) of the toxicity The components of the stepshywise approach could include increased frequency of toxicity testing to characterize the magnitude and frequency of toxicity If continued toxicity is demonstrated then the permittee could conduct a Toxicity Reduction EvaluationToxicity Identification Evaluation (TRETIE) with toxic effluent sample(s) (USEPA 1991b 1992) For example EPA Regions 9 and 10 have prepared WET implementation guidance to assist their States (Denton and Narvaez 1996) This guidance provides sample permit language for a step-wise approach to address toxic samples (see Appendix C)
66 Chapter Conclusions
The TSD statistical approach to reasonable potential determination and permit limit derivation considers combined effluent and analytical variability through the CV of measured effluent values Because determination of effluent variability is based on empirical measurements the variability estimated for effluent measurements includes the variability of pollutant levels sampling variability and a smaller component owed to method variability Steps should be taken to reduce these sources of variability EPA believes that the TSD statistical procedures are appropriately protective in considering both effluent and analytical variability in reasonable potential and effluent limit calculations
EPA recommends that regulatory authorities use a sampling program that conducts at least ten representative WET tests over a period of three years to represent the full range of effluent variability Regulatory authorities should use recommended procedures in the TSD to determine when numeric WET limits or WET monitoring triggers are needed Other permit conditions may include monitoring triggers such as increased toxicity testing TREsTIEs and follow-up actions initiated because a permit limit is exceeded or a monitoring trigger is not met Regulatory authorities should implement the additional test sensitivity requirements by requiring that each test result not exceed the upper PMSD bound In addition regulatory authorities should determine the appropriate NOEC for test results below the lower PMSD bound as described in Section 642 These efforts should lead to increased confidence in the effect concentrations that are generated to evaluate self-monitoring data
6-10 June 30 2000
70 CONCLUSIONS AND GUIDANCE TO LABORATORIES PERMITTEES AND REGULATORY AUTHORITIES
This document was prepared to address whole effluent toxicity (WET) test variability The document has three goals (1) quantify the variability of promulgated test methods and report a coefficient of variation (CV) as a measure of test method variability (2) evaluate the statistical methods described in the TSD for determining the need for and deriving WET permit conditions and (3) suggest guidance for regulatory authorities on approaches to address and minimize test method variability This document quantified the variability of toxicity test methods based on the end use of the data that is the effect concentrations (eg NOEC LC50 EC25) The within-laboratory variability of these effect concentrations was quantified by obtaining multiple test results under similar test conditions using the same reference toxicant The major conclusions of this document are discussed below
71 General Conclusions
bull EPArsquos Technical Support Document for Water Quality-based Toxics Control (referred to as the TSD) presents guidance for developing effluent limits based on three key components (1) water quality criteria (2) a calculated dilution factor used to derive a waste load allocation (WLA) from the criteria and (3) a statistical calculation procedure that uses a CV based on effluent data to calculate effluent limits from the WLA EPArsquos TSD statistical approach is appropriately protective regarding both effluent and analytical variability provided that the criteria and WLA are derived correctly It is inappropriate to adjust the TSD statistical methodology for determining when water quality-based effluent limits are needed and for calculating such limits (Section 6 and Appendix G)
bull EPArsquos analysis indicates that the TSD approach appropriately accounts for both effluent variability and method variability EPA does not believe a reasonable alternative approach is available to determine a factor that would discount the effects of method variability using the TSD procedures (Section 611 and Appendix G)
bull Interim CVs are identified for promulgated WET test methods [Appendix A Table A-1 (acute methods) and Table A-2 (chronic methods)] pending completion of between-laboratory studies which may affect these interim CV estimates
bull Comparisons of WET method precision with method precision for analytes commonly limited in the National Pollutant Discharge Elimination System (NPDES) permits clearly demonstrate that the variability of the promulgated WET methods is within the range of variability experienced in other types of analyses Several researchers also noted that method performance improves when prescribed methods are followed closely by experienced analysts (Section 43)
bull The hypothesis test procedures prescribed in EPArsquos WET methods will provide adequate protection against false conclusions that an effluent is toxic However the incidence of false negatives can be high because of high within-test variability making it difficult to detect toxicity when toxicity is truly present Therefore evaluating the power of current experimental designs is desirable EPA expects that regulatory authorities will make prompt and measurable progress toward the goal of requiring all WET tests to detect a toxic effect of 25 percent to 33 percent with power of 080 (Section 533 and Appendix B4)
bull Quality assurance problems became apparent when evaluating the data for this study especially for the metal reference toxicants and sodium dodecyl sulfate (SDS) Standardizing the choice of reference toxicant and the concentrations to be tested may be appropriate as well as establishing bounds on the range of acceptable effect concentrations for each test method As a result
June 30 2000 7-1
Understanding and Accounting for Method Variability in WET Applications Under the NPDES Program
quantifying between-laboratory variability will be difficult unless these issues can be resolved (Section 531 and Appendix G25)
bull The data analysis did not reveal the potential sources and causes of variability such as using different sources of test organisms dilution water and food To assess the sources of variability fully experimenters must carefully design new studies (Section 531)
72 Recommendations for Minimizing Variability and Its Effects
Three critical areas are identified to minimize WET test method variability
bull Obtaining a representative effluent sample
bull Conducting the toxicity tests properly to generate biological endpoints and
bull Calculating the appropriate statistical endpoints to have confidence in the effect concentration
This document provides guidance to toxicity testing laboratories permittees and regulatory authorities in conducting biological and statistical methods and evaluating test effect concentrations It also develops guidance for regulatory authorities on approaches to address and minimize test method variability The principal aspects of the guidance are presented in Table 3-6 and re-presented here
Range of Relative Variability for Endpoints of Promulgated WET Methods Defined by the 10th
and 90th Percentiles from the Data Set of Reference Toxicant Testsa
Test Methodb Endpointc No of Labs
No of Tests
PMSD Control CVd
10th 90th 10th 90th
10000 Fathead Minnow G 19 205 94 35 0035 020
10020 Ceriodaphnia dubia R 33 393 11 37 0089 042
10030 Green Alga G 9 85 93 23 0034 017
10040 Sheepshead Minnow G 5 57 63 23 0034 013
10060 Inland Silverside G 18 193 12 35 0044 018
10070 Mysid G 10 130 12 32 0088 028
20000 Fathead Minnow S 20 217 42 30 0 0074
20020 Ceriodaphnia S 23 241 50 21 0 011
20040 Sheepshead Minnow S 5 65 0e 55 0 0
20060 Inland Silverside S 5 48 70 41 0 0079
20070 Mysid (A bahia) S 3 32 51 26 0 0081
20110 Mysid (H costata) S 2 14 18 47 0 0074
20210 Daphnia (D magna) S 5 48 53 23 0 011
20220 Daphnia (D pulex) S 6 57 58 23 0 011 a The precision of the data warrants only three significant figures When determining agreement with these values one may
round off values to two significant figures (eg values gt345000 and 35000 are rounded to 35) Method 10090 (red macroalga) is not reported because it is inadvisable to characterize method variability using only 23 tests from just two laboratories
b EPA did not assign method numbers for acute methods in EPA6004-90027F The numbers assigned here were created for use in this document and in related materials and data bases G = growth R = reproduction S = survival
d CVs were calculated using untransformed control means for each test e An MSD of zero will not occur when the EPA flow chart for statistical analysis is followed In this report MSD was
calculated for every test including those for which the flow chart would require a nonparametric hypothesis test EPA recommends using the value 42 (the 10th percentile shown for the fathead minnow acute test) in place of zero as the 10th
percentile PMSD (lower PMSD bound) for the sheepshead minnow acute test
June 30 2000 7-2
c
Understanding and Accounting for Method Variability in WET Applications Under the NPDES Program
721 Guidance to Toxicity Testing Laboratories
bull Testing laboratories should maintain quality assurancequality control (QAQC) control charts for percent minimum significant difference (PMSD) along with the statistical endpoints such as NOEC LC50 and EC25 Testing laboratories should regularly plot the individual raw test data and the average treatment responses to examine possible causes of excessive variability (Section 5311)
bull The minimum number of replicates for the chronic toxicity tests should be four for the chronic fathead minnow sheepshead minnow and inland silverside test methods (Sections 5331 and 56)
bull Testing laboratories should take steps to ensure that the test PMSD does not exceed the upper bound provided in the table above (Sections 33 533 and 64 and Table 3-6) This may require ensuring more uniformity among test organisms andor using more replicates Tables are provided to aid in choosing the number of replicates (Tables B-14 and B-15)
bull Testing laboratories should examine the power tables to ensure that test results will meet the recommended test sensitivity criteria These tables can be used to make decisions about replication given the knowledge of typical values for error mean square (EMS) and number of tested concentrations (Section 533 and Tables B-9 through B-15)
722 Guidance to NPDES Permittees
bull Permittees should select and conduct all data analyses with one qualified toxicity testing laboratory to determine reasonable potential derive permit limits and generate self-monitoring test results Conducting all effluent testing consistently using one reference toxicant is also prudent (Section 614 and Appendix G25)
bull Permittees should generate WET data (n = 10) that have been accumulated over a year or more to fully characterize effluent variability over time The sampling dates and times should span a sufficient duration to represent the full range of effluent variability (Sections 613 and 62 and Appendix G24)
bull Permittees should examine testing laboratoriesrsquo QAQC control charts If the CV for reference toxicant tests is greater than the 75th percentile in Tables 3-2 through 3-4 variability can likely be reduced even if the individual EC25 and LC50 values fall within the control limits (Section 5311)
bull Permittees should examine toxicity test data to ensure that data being submitted to regulatory authorities meet specified effluent holding times temperature laboratory control limits and test acceptability criteria such as requirements for test sensitivity lower and upper PMSD bounds (Sections 52 through 54)
bull Permittees should anticipate and plan for a change if switching to a different testing laboratory The permittee should compare reference toxicant test data from the current laboratory with data from the candidate replacement laboratory in order to ensure acceptable variability and a similar average effect (Section 614)
June 30 2000 7-3
Understanding and Accounting for Method Variability in WET Applications Under the NPDES Program
73 Guidance to Regulatory Authorities
Guidance to Regulatory Authorities Related to Determining Reasonable Potential and Deriving Permit Limits
bull Regulatory authorities should use EPArsquos recommended statistical approach in deriving permit limitations The statistical approach outlined in the TSD represents an effective and appropriately protective approach to effluent limit development (Section 61 and Appendix G1)
bull Regulatory authorities should calculate the facility-specific CV using point estimate techniques to determine the need for and derive a permit limit even if the self-monitoring test results will be determined using hypothesis test procedures (Sections 341 and 62)
bull Regulatory authorities that need to cite a characteristic CV for a promulgated method may use Tables A-1 and A-2 in Appendix A which show the median CV from Tables 3-2 through 3-4 pending completion of between-laboratory studies
bull EPA recommends that regulatory authorities implement a step-wise approach to address toxicity This approach can determine the magnitude and frequency of toxicity and appropriate follow-up actions for test results that indicate exceedance of a monitoring trigger or a permit limit (Section 65)
Guidance to Regulatory Authorities Related to Collecting Effluent Samples Conducting the Toxicity Test and Evaluating the Effect Concentrations
bull Regulatory authorities should design a sampling program that collects representative effluent samples to fully characterize effluent variability for a specific facility over time At least 10 samples are needed to estimate a variance or CV with acceptable precision for a specific facility (Sections 613 and 62)
bull Regulatory authorities should ensure that statistical procedures and test methods have been properly applied to produce WET test results Evaluating other factors and data such as biological and statistical quality assurance and ensuring that test conditions and test acceptability criteria (TAC) have been met would be prudent (Sections 52 through 55)
bull Regulatory authorities should apply both the upper and lower bounds using the PMSD as an additional TAC (Section 64 and Table 3-6) The State of North Carolina implemented an effective WET program that required additional TAC and guidance for test methods that served to minimize test method variability (Appendix F)
bull Regulatory authorities should develop a QC checklist to assist in evaluating and interpreting toxicity test results (Section 5311) See Appendix E for examples of State WET implementation procedures
bull Regulatory authorities should consider participation in the National Environment Laboratory Accreditation Program and should conduct routine performance audit inspections to evaluate individual laboratory performance Inspections should evaluate the laboratoryrsquos performance with QC control charts based on reference toxicants examine procedures for conducting the toxicity test procedures and examine procedures for analyzing test results (Section 5311)
bull Regulatory authorities should incorporate revised technical guidance recently published by EPA captioned ldquoMethod Guidance and Recommendations for Whole Effluent Toxicity (WET) Testingrdquo
June 30 2000 7-4
Understanding and Accounting for Method Variability in WET Applications Under the NPDES Program
(40 CFR Part 136) (USEPA 2000a) The guidance addresses (1) error rate assumption adjustments (2) concentration-response relationships (3) incorporation of confidence intervals (4) acceptable dilution waters for testing (5) guidance on blocking by parentage for the chronic C dubia test method and (6) procedures for controlling pH drift
74 Future Directions
bull An independent peer-reviewed workshop should be convened to evaluate alternatives to the statistical approaches currently used in EPArsquos WET test methods Such a workshop might suggest alternatives regarding (1) WET statistical flowcharts (2) WET statistical methods used to estimate effect concentrations and (3) test data interpretation and review guidelines (Section 55)
bull Such a workshop might also evaluate additional QC requirements and recommendations regarding the specification of a reference toxicant and the concentrations to be tested for each test method (Section 531)
June 30 2000 7-5
Understanding and Accounting for Method Variability in WET Applications Under the NPDES Program
This page intentionally left blank
June 30 2000 7-6
80 BIBLIOGRAPHY
Anderson BS JW Hunt SL Turpen AR Coulon M Martin DL Denton and FH Palmer 1990 Procedures Manual for Conducting Toxicity Tests Developed by the Marine Bioassay Project California State Water Resources Control Board No 90-10WQ
Anderson SL and TJ Norberg-King 1991 Precision of short-term chronic toxicity tests in the real world Environ Toxicol Chem 10(2)143ndash145
APHA-AWWA-WEF 1998 Standard Methods for the Examination of Water and Wastewater (20th Edition) LS Clesceri AE Greenberg and A Eaton eds American Public Health Association American Water Works Association and Water Environment Federation Washington DC ISBN 0-87553-235shy7WB
American Society for Testing and Materials (ASTM) 1992 Standard Practice for Conducting an Interlaboratory Study To Determine the Precision of a Test Method E691-92
ASTM 1998 Standard Practice for Determination of Precision and Bias of Applicable Test Methods of Committee D-19 on Water D2777
Ausley LW 1996 Effluent toxicity testing variability In Whole Effluent Toxicity Testing An Evaluation of Methods and Prediction of Receiving System Impacts DR Grothe KL Dickson and DK Reed-Judkins eds Pensacola FL SETAC Press 157ndash171
Bailer AJ MR Hughes DL Denton and JT Oris 2000 An empirical comparison of effective concentration estimators for evaluating aquatic toxicity test responses Environ Toxicol Chem 19(1) 141-150
Biomonitoring Science Advisory Board (BSAB) 1994 West Coast Marine Species Chronic Protocol Variability Study Washington Department of Ecology Olympia WA
Burton GA A Raymon LA Ausley JA Black GM DeGraeve FA Fulk JF Heltshe WH Peltier JJ Pletl and JH Rodgers 1996 Session 4 Effluent toxicity test variability In Whole Effluent Toxicity Testing An Evaluation of Methods and Prediction of Receiving System Impacts DR Grothe KL Dickson and DK Reed-Judkins eds Pensacola FL SETAC Press 131ndash156
Chapman GA 1992 Sea Urchin (Strongylocentrotus purpuratus) Fertilization Test Method USEPA ERL-Narragansett Pacific Ecosystems Branch Newport OR
Chapman GA BS Anderson AJ Bailer RB Baird R Berger DT Burton DL Denton WL Goodfellow MA Heber LL McDonald TJ Norberg-King and PL Ruffier 1996a Discussion synopsis methods and appropriate endpoints In Whole Effluent Toxicity Testing An Evaluation of Methods and Prediction of Receiving System Impacts DR Grothe KL Dickson and DK Reed-Judkins eds Pensacola FL SETAC Press 51-82
Chapman PF M Crane J Wiles F Noppert and E McIndoe 1996b Improving the quality of statistics in regulatory ecotoxicity tests Ecotoxicol 5169-186
Chapman PM RS Caldwell and PF Chapman 1996c A warning NOECs are inappropriate for regulatory use Environ Toxicol Chem 1577ndash79
June 30 2000 8-1
Understanding and Accounting for Method Variability in WET Applications Under the NPDES Program
Collett D 1991 Modelling Binary Data London Chapman amp Hall
Commonwealth of Virginia 1993 Toxics Management Program Implementation Guidance
Davis RB AJ Bailer and JT Oris 1998 Effects of organism allocation on toxicity test results Environ Toxicol Chem 17(5) 928-931
DeGraeve GM JD Cooney BH Marsh TL Pollock NG Reichenbach JH Dean and MD Marcus 1991 Variability in the performance of the seven-day fathead minnow (Pimephales promelas) larval survival and growth test A within- and among-laboratory study Environ Toxicol Chem 10(9)1189ndash1203
DeGraeve GM JD Cooney BH Marsh TL Pollock and NG Reichenbach 1992 Variability in the performance of the 7-d Ceriodaphnia dubia survival and reproduction test A within- and among-laboratory study Environ Toxicol Chem 11(6)851ndash866
DeGraeve GM G Smith W Clement D McIntyre and T Forgette 1998 WET Testing Program Evaluation of Practices and Implementation Water Environment Research Foundation Project 94shyHHE-1 Alexandria VA
Denton DL and TJ Norberg-King 1996 Whole effluent toxicity statistics A regulatory perspective In Whole Effluent Toxicity Testing An Evaluation of Methods and Prediction of Receiving System Impacts DR Grothe KL Dickson and DK Reed-Judkins eds Pensacola FL SETAC Press 83ndash102
Denton DL and M Narvaez 1996 Regions 9 and 10 Guidance for Implementing Whole Effluent Toxicity Testing Programs U S Environmental Protection Agency Regions 9 and 10 May
Denton DL AL Suer BS Anderson and JW Hunt 1992 Precision of marine critical life stage tests with west coast species (abstract) In Society of Environmental Toxicology and Chemistry (SETAC) Abstracts 13th Annual Meeting November 8-12 1992 Cincinnati OH Pensacola FL SETAC Press 184
Dhaliwal BS RJ Dolan CW Batts JM Kelly RW Smith and S Johnson 1997 Warning replacing NOECs with point estimates may not solve regulatory contradictions Environ Toxicol Chem 16124ndash126
Dinnel PJ J Link and Q Stober 1987 Improved methodology for sea urchin sperm cell bioassay for marine waters Arch Environ Contam Toxicol 1623ndash32
Dunnett CW 1964 New tables for multiple comparisons with a control Biometrics 20482-491
Eagleson KW SW Tedder and LW Ausley 1986 Strategy for whole effluent toxicity evaluations in North Carolina In Aquatic Toxicology and Environmental Fate Ninth Volume ASTM STP 921 TM Poston R Purdy eds American Society for Testing and Materials Philadelphia PA 154-160
Environment Canada 1990 Guidance Document on Control of Toxicity Test Precision Using Reference Toxicants Ottawa Ontario Environmental Protection Conservation and Protection Report EPSIRM12
June 30 2000 8-2
Understanding and Accounting for Method Variability in WET Applications Under the NPDES Program
Environment Canada 2000 Guidance Document on Application and Interpretation of Single-species Tests in Environmental Toxicology Ottawa Ontario Environmental Technology Centre Method Development and Application Section Report EPS 1RM34
Erickson RJ LT Brooke MD Kahl F Vende SL Venter T Harting P Markee and RL Spehar 1998 Effects of laboratory test conditions on the toxicity of silver to aquatic organisms Environ Toxicol Chem 17(4) 572-578
Fulk FA 1996 Whole effluent toxicity testing variability A statistical perspective In Whole Effluent Toxicity Testing An Evaluation of Methods and Prediction of Receiving System Impacts DR Grothe KL Dickson and DK Reed-Judkins eds Pensacola FL SETAC Press 172ndash179
Grothe DR and RA Kimerle 1985 Inter- and intralaboratory variability in Daphnia magna effluent toxicity test results Environ Toxicol Chem 4(2)189ndash192
Grothe DR RA Kimerle and CD Malloch 1990 A perspective on biological assessments Water Environ Technol pp 1707ndash1710
Grothe DR KL Dickson and DK Reed-Judkins eds 1996 Whole Effluent Toxicity Testing An Evaluation of Methods and Prediction of Receiving System Impacts Pensacola FL SETAC Press
Hunt JW BS Anderson S Tudor MD Stephenson HM Puckett FH Palmer and MW Reeve 1996 Marine Bioassay Project Eighth Report Sacramento CA State Water Resources Control Board Report 85-102
Kahn HD and MB Rubin 1989 Use of statistical methods in industrial water pollution control regulations in the United States Environ Monitor Assess 12129ndash148
Moore TF SP Canton and M Grimes 2000 Investigation of the incidence of type I errors for chronic whole effluent toxicity testing using Ceriodaphnia dubia Environ Toxicol Chem 19(1)118-122
Morrison GE E Torelo R Comeleo R Walsh A Kuhn R Burgess M Tagliabue and W Green 1989 Interlaboratory precision of saltwater short-term chronic toxicity tests Res J Wat Pollut Control Fed 611707-1710
New Jersey Department of Environmental Protection 1994 The Use of Chronic Whole Effluent Toxicity Testing in the New Jersey Pollutant Discharge Elimination SystemmdashAn Assessment of Compliance Data
North Carolina Department of Environment and Natural Resources 1998 North Carolina Biological Laboratory CertificationCriteria Procedures Document Division of Water Quality Water Quality Section Raleigh NC
Oris JT and AJ Bailer 1993 Statistical analysis of the Ceriodaphnia toxicity test Sample size determination for reproductive effects Environ Toxicol Chem 12(1)85ndash90
Rosebrock MM NW Bedwell and LW Ausley 1994 Indicators of Ceriodaphnia dubia chronic toxicity test performance and sensitivity Poster presentation Society of Environmental Toxicology and Chemistry 15th Annual Meeting Denver CO
June 30 2000 8-3
Understanding and Accounting for Method Variability in WET Applications Under the NPDES Program
Rue WJ JA Fava and DR Grothe 1988 A review of inter- and intralaboratory effluent toxicity test method variability In Aquatic Toxicology and Hazard Assessment (10th Volume) WJ Adams GA Chapman and WG Landis eds ASTM STP 971
SAS Institute 1990 SASSTA Userrsquos Guide (4th Edition) Version 6 Cary NC
Sheppard CR 1999 How large should my sample be Some quick guides to sample size and the power of tests Mar Pollut Bull 38(6)439-477
Shukla R Q Wang FA Fulk C Deng and DL Denton 2000 Bioequivalence approach for whole effluent toxicity testing Environ Toxicol Chem 19(1)169-174
Southern California Toxicity Assessment Group (SCTAG) 1996 Reference Toxicant Standardization and Use in Toxicity Testing JR Gully RB Baird PJ Markle and JP Bottomley eds First Report Fountain Valley CA
SCTAG 1997 Laboratory Practices Checklist Toxicity Testing (3rd Edition) Fountain Valley CA
Starrett GL DL Denton and RW Smith 1993 Sensitivity of toxicity test protocols and the need for additional quality assurance requirements (abstract) In Society of Environmental Toxicology and Chemistry (SETAC) Abstracts 14th Annual Meeting November 14-18 1993 Houston TX Pensacola FL SETAC Press P106 p 183
Thursby GB J Heltshe and KJ Scott 1997 Revised approach to toxicity test acceptability criteria using a statistical performance assessment Environ Toxicol Chem 161322-1329
TOXISreg [computer software] Ojai CA EcoAnalysis Inc
TOXCALCreg [computer software] McKinleyville CA TidePool Scientific Software
USEPA 1985 Methods for Measuring the Acute Toxicity of Effluents to Freshwater and Marine Organisms (3rd Edition) W Peltier and CI Weber eds Environmental Monitoring Systems Laboratory Cincinnati OH EPA6004-85013
USEPA 1988 Short-term Methods for Estimating the Chronic Toxicity of Effects of Receiving Water to MarineEstuarine Organisms (1st Edition) CI Weber WB Horning DJ Klemm TW Neiheisel PA Lewis EL Robinson JR Menkedick FA Kessler eds Office of Research and Development Cincinnati OH EPA6004-87028
USEPA 1989 Short-term Methods for Estimating the Chronic Toxicity of Effluents and Receiving Waters to Freshwater Organisms (2nd Edition) CI Weber WH Peltier TJ Norberg-King WB Homing II FA Kessler JR Menkedick TW Neiheisel PA Lewis DJ Klemm QH Pickering EL Robinson JM Lazorchak LJ Wymer RW Freyberg eds Office of Research and Development Cincinnati OH EPA6004-89001
USEPA 1989a Generalized Methodology for Conducting Industrial Toxicity Reduction Evaluations (TREs) Office of Research and Development Cincinnati OH EPA600-2-88-070
USEPA 1989b Toxicity Reduction Evaluation Protocol for Municipal Wastewater Treatment Plants Office of Research and Development Washington DC EPA6002-88-062
June 30 2000 8-4
Understanding and Accounting for Method Variability in WET Applications Under the NPDES Program
USEPA 1989c Methods for Aquatic Toxicity Identification Evaluations Phase II Toxicity Identification Procedures Office of Research and Development Washington DC EPA6003-88-035
USEPA 1989d Methods for Aquatic Toxicity Identification Evaluations Phase III Toxicity Confirmation Procedures Office of Research and Development Washington DC EPA6003-88-036
USEPA1991a Technical Support Document for Water Quality-based Toxics Control Office of Water Washington DC EPA5052-90-001
USEPA 1991b Methods for Aquatic Toxicity Identification Evaluations Phase I Toxicity Characterization Procedures (2nd Edition) TJ Norberg-King DI Mount EJ Durhan GT Ankley LP Burkhard JR Amato MT Lukasewycz MK Schubauer-Berigan and L Anderson-Carnahan eds Office of Research and Development Washington DC EPA6006-91-003
USEPA 1992 Toxicity Identification Evaluation Characterization of Chronically Toxic Effluents Phase I TJ Norberg-King DI Mount JR Amato DA Jensen and JA Thompson eds Office of Research and Development Washington DC EPA6006-91-005F
USEPA 1993 Methods for Measuring the Acute Toxicity of Effluents and Receiving Waters to Freshwater and Marine Organisms (4th Edition) CI Weber ed Office of Research and Development Cincinnati OH EPA6004-90027F
USEPA 1993a Methods for Aquatic Toxicity Identification Evaluations Phase II Toxicity Identification Procedures for Samples Exhibiting Acute and Chronic Toxicity Office of Research and Development Washington DC EPA600R-92-080
USEPA 1993b Methods for Aquatic Toxicity Identification Evaluations Phase III Toxicity Identification Procedures for Acutely and Chronically Toxic Samples US Environmental Protection Agency Duluth MN EPA600R-92-081
USEPA 1994a Short-term Methods for Estimating the Chronic Toxicity of Effluents and Receiving Waters to Marine and Estuarine Organisms (2nd Edition) DJ Klemm GE Morrison TJ Norberg-King WH Peltier and MA Heber eds Office of Research and Development Cincinnati OH EPA6004shy91003
USEPA 1994b Short-term Methods for Estimating the Chronic Toxicity of Effluents and Receiving Waters to Freshwater Organisms (3rd Edition) PA Lewis DJ Klemm JM Lazorchak TJ Norberg-King WH Peltier and MA Heber eds Office of Research and Development Cincinnati OH EPA6004shy91002
USEPA 1994c Short-term Methods for Estimating the Sediment Toxicity of Effluents and Receiving Waters to Freshwater and Estuarine Organisms Office of Research and Development Duluth MN EPA600R-94-001
USEPA 1995 Short-term Methods for Estimating the Chronic Toxicity of Effluents and Receiving Waters to West Coast Marine and Estuarine Organisms GA Chapman DL Denton and JM Lazorchak eds Office of Research and Development Cincinnati OH EPA600R-95-136
USEPA 1996a NPDES Permit Writerrsquos Manual Office of Water Washington DC EPA833B-96-003
USEPA 1996b Guide to Method Flexibility and Approval of EPA Water Methods EPA821D-96-004
June 30 2000 8-5
Understanding and Accounting for Method Variability in WET Applications Under the NPDES Program
USEPA 1999a National Environmental Laboratory Accreditation Conference Constitution Bylaws and Standards Office of Research and Development Washington DC EPA600R-99-068
USEPA 1999b Toxicity Reduction Evaluation Guidance for Municipal Wastewater Treatment Plants (2nd
Edition) Office of Water Washington DC EPA833B-99-002
USEPA 1999c Errata for Effluent and Receiving Water Toxicity Test Manuals Acute Toxicity manuals Acute Toxicity of Effluents and Receiving Waters to Freshwater and Marine Organisms Short-Term methods for Estimating the Chronic Toxicity of Effluents and Receiving Waters to Freshwater Organisms and Short-Term Methods for Estimating the Chronic Toxicity of Effluents and Receiving Waters to Marine and Estuaraine Organisms Office of Research and Development Duluth MN
USEPA 2000a Method Guidance and Recommendations for Whole Effluent Toxicity (WET) Testing (40 CFR Part 136) Office of Water Office of Science and Technology Washington DC EPA821B-00shy004
USEPA 2000b Methods for Measuring the Toxicity and Bioaccumulation of Sediment-Associated Contaminants with Freshwater Invertebrates (2nd Edition) Office of Research and Development Duluth MN EPA600R-99064
Wang Q DL Denton and R Shukla 2000 Applications and statistical properties of minimum significant difference-based criterion testing in a toxicity testing program Environ Toxicol Chem 19(1)113-117
Warren-Hicks W BR Parkhurst D Moore and S Teed 1999 Whole Effluent Toxicity Testing Methods Accounting for Variance Water Environment Research Foundation Project 95-PQL-1 ISBN 1shy893664-01-5
Washington State Department of Ecology 1997 Laboratory Guidance and Whole Effluent Toxicity Test Review Criteria Publication No WQ-R-95-80
Washington State Department of Ecology 1998 Whole Effluent Toxicity (WET) Program Evaluation Publication No 98-03
Whitehouse P M Crane CJ Redshaw and C Turner 1996 Aquatic toxicity tests for the control of effluent discharges in the UK The influence of test precision Ecotoxicol 5155-168
June 30 2000 8-6

Understanding and Accounting for Method Variability in WET Applications Under the NPDES Program
This page intentionally left blank
June 30 2000 viii
ACKNOWLEDGEMENTS
This guidance was prepared through the cooperative efforts of the US Environshymental Protection Agencyrsquos (EPA) Office
of Wastewater Management and Office of Science and Technology in the Office of Water EPArsquos Office of Research and Development and EPArsquos Office of Enforcement and Compliance Assurance The Cadmus Group Inc provided support for the final document production
EPA Variability Workgroup
Debra Denton EPA Region 9 San Francisco CA John Fox EPA Office of Science and Technology
Washington DC Florence Fulk EPA Office of Research and
Development Cincinnati OH Kathryn Greenwald EPA Office of Enforcement
and Compliance Assurance Washington DC Madonna Narvaez EPA Region 10 Seattle WA Teresa Norberg-King EPA Office of Research and
Development Duluth MN Laura Phillips EPA Office of Wastewater
Management Washington DC
EPA Support Outside of the Variability Workgroup
Gregory Currey EPA Office of Wastewater Management Washington DC
Margarete Heber EPA Office of Wetlands Oceans and Watersheds Washington DC
Phillip Jennings EPA Region 6 Dallas TX Henry Kahn EPA Office of Science and
Technology Washington DC Marion Kelly EPA Office of Science and
Technology Washington DC James Pendergast EPA Office of Wetlands
Oceans and Watersheds Washington DC Stephen Sweeney EPA Office of General
Counsel Washington DC William Telliard EPA Office of Science and
Technology Washington DC Robert Wood EPA Office of Wastewater
Management Washington DC Marcus Zobrist EPA Region 2 New York NY
Contractor Support
The Cadmus Group Inc Durham NC
Karalyn Colopy Susan Conbere Blanche Dean Penelope Kellar
DynCorp Information and Enterprise Technology Inc Alexandria VA
Robert Brent
Science Applications International Corporation Columbia MD
Sidina Dedah Ruth Much Kathleen Stralka
Assistance from States
State Case Example and Chapter 4
EPA especially thanks Larry Ausley and Matt Matthews of the North Carolina Department of Environment and Natural Resources Division of Water Quality for preparing Chapter 4 (Variability in Context) and Appendix F (Improvements in Minimizing WET Test Variability by the State of North Carolina)
State-Specific WET Program Implementation
EPA appreciates the assistance and support from the following States in providing their State-specific approaches to the WET program implementation used for Appendix E (Examples of Selected State WET Implementation Programs) of this document
Betty Jane Boros-Russo State of New Jersey Kari Fleming State of Wisconsin Randall Marshall State of Washington Matt Matthews State of North Carolina Charlie Roth State of Kentucky
Additional Assistance
We also thank the EPA Regions States and laboratories that provided the WET toxicity data used to develop this guidance document
EPA Peer Review
Peer review was conducted following the EPArsquos Science Policy Council Handbook for Peer Review (January 1998) The anonymous review comments are gratefully acknowledged and the changes were incorporated as appropriate
June 30 2000 ix
Understanding and Accounting for Method Variability in WET Applications Under the NPDES Program
This page intentionally left blank
June 30 2000 x
EXECUTIVE SUMMARY
Background
The Federal Water Pollution Control Act commonly known as the Clean Water Act was enacted in 1972 with the objective of ldquorestoring the chemical physical and biological integrity of the Nationrsquos watersrdquo Among the US Environmental Protection Agencyrsquos (EPArsquos) efforts toward this objective is the National Pollutant Discharge Elimination System (NPDES) program This program is designed to control toxic discharges implement water quality standards and restore waters to ldquofishable and swimmablerdquo conditions Point sources that discharge pollutants must do so under the terms and conditions of an NPDES permit One approach EPA employs to control toxic pollutants under the NPDES permits program is using whole effluent toxicity (WET) controls
EPA is issuing this document to both address questions raised on WET test method variability and to satisfy a requirement of a July 1998 settlement agreement with litigants for the Western Coalition of Arid States (WestCAS) and Edison Electric Institute et al This document was developed by an EPA workgroup consisting of EPArsquos Office of Waterrsquos (OW) Headquarters Office of Enforcement and Compliance Assurance Office of Research and Development and Regional staff The document was externally peer reviewed in accordance with EPArsquos peer review guidelines The document addresses WET test method variability by identifying the potential sources of variance associated with WET testing discusses how to minimize it and finally describes how to address it within the NPDES permitting program The document cites both Agency and external ongoing research on this topic and scientific findings particularly technical information that support efforts to minimize WET test result variability
While the document provides recommendations on how to reduce or minimize WET test variability the document does not supersede current Agency guidance policy or regulation including EPArsquos promulgated test methods (40 CFR Part 136) which remain in effect EPA expects that implementation of the NPDES program and NPDES permits will continue to comply with regulatory requirements and follow applicable EPA guidance and policy
Why WET Testing
Whole effluent toxicity is the aggregate toxic effect of an aqueous sample (eg effluent receiving water) measured directly by an aquatic toxicity test Aquatic toxicity tests are laboratory experiments that measure the biological effect (eg growth survival and reproduction) of effluents or receiving waters on aquatic organisms In aquatic toxicity tests organisms of a particular species are held in test chambers and exposed to different concentrations of an aqueous sample for example a reference toxicant an effluent or a receiving water and observations are made at predetermined exposure periods At the end of the test the responses of test organisms are used to estimate the effects of the toxicant or effluent
Whole effluent toxicity test results are an integral tool in the assessment of water quality For the protection of aquatic life the integrated strategy includes the use of three control approaches the chemical-specific control approach the WET control approach and the biological criteriabioassessmentbioassay approach The primary advantage of using WET controls over individual chemical-specific controls is that WET integrates the effects of all chemical(s) in the aqueous sample Reliance solely on chemical-specific numeric criteria or biological criteria would result in only a partially effective State toxics control program These toxicity tests therefore must be performed using best laboratory practices and every effort must be made to enhance repeatability of the test method This document presents EPArsquos approaches to achieve the goals listed below
June 30 2000 xi
Understanding and Accounting for Method Variability in WET Applications Under the NPDES Program
Effect of This Guidance
This document clarifies several issues regarding WET variability and reaffirms EPArsquos guidance in the Technical Support Document for Water Quality-Based Toxics Control (TSD USEPA 1991a) This document provides NPDES regulatory authorities and all stakeholders including permittees with guidance and recommendations on how to address WET variability EPArsquos recommendations and conclusions are detailed in Chapter 7 and Appendix C provides sample NPDES permit language reflecting these recommendations
The most significant recommendation is to use and report the values for the percent minimum significant difference (PMSD) with all WET data results The minimum significant difference (MSD) represents the smallest difference between the control mean and a treatment mean that leads to the statistical rejection of the null hypothesis (ie no toxicity) at each concentration of the WET test dilution series The MSD provides an indication of within-test variability and test method sensitivity Using this information the regulatory authority and permittees can better evaluate WET test results
This document makes several other recommendations such as continue to use the TSD statistical approach without adjusting for test method variability obtain sufficient representative effluent samples verify effluent toxicity data against reference toxicant data maintain clear communication between the regulatory authority and permittee and maintain good laboratory checks and certification programs
Three Goals of This Document
This document describes three goals EPA has defined to address issues surrounding WET variability In addition the document is intended to satisfy the requirements of a settlement agreement to resolve litigation over rulemaking to standardize WET testing procedures
1 Quantify the variability of promulgated test methods and report a coefficient of variation (CV) as a measure of test method variability (see Chapter 3 and Appendix A)
2 Evaluate the statistical methods described in the Technical Support Document for Water Quality-Based Toxics Control (TSD) for determining the need for and deriving WET permit conditions (see Chapter 6 and Appendix G)
3 Suggest guidance for regulatory authorities on approaches to address and minimize test method variability (Chapter 6) In addition the document is intended to provide guidance to regulatory authorities permittees and testing laboratories on conducting the biological and statistical methods and evaluating test effect concentrations (Chapter 5)
Data Evaluated
EPA assembled a comprehensive data base to examine variability in the WET test methods from the EPA Regions several States and private laboratories which represent a widespread sampling of typical laboratories and laboratory practices EPA applied several criteria to the data before they were accepted including detailed sample information strict adherence to published EPA WET test methods and test acceptability criteria (TAC) The resulting data base contains data from 75 laboratories for 23 methods for tests concluded between 1988 and 1999
Approach Taken To Evaluate Test Method Variability
The variability that EPA is assessing is associated with replicate tests using reference toxicants and WET testing methods within analytical laboratories The focus of this guidance is not to quantify test variability between laboratories or to quantify the total variability of WET tests conducted on effluents Rather the purpose is to quantify method variability within laboratories (repeatability) to enable NPDES
June 30 2000 xii
Understanding and Accounting for Method Variability in WET Applications Under the NPDES Program
programs to distinguish between variability caused by the testing method and variability associated with toxicity of multiple effluent samples taken from the same facility
To quantify test method variability within and between laboratories using this data base EPA examined two key parameters (1) the effect concentrations [effect concentration (EC25) lethal concentration (LC50) no observed effect concentration (NOEC)] estimated by the test which are used to derive WET permit limits and evaluate self-monitoring data with those limits and (2) the minimum significant difference (MSD) which summarizes the variability of organism responses at each test concentration within an individual test The MSD represents the smallest difference that can be distinguished between the response of the control organisms and the response of the organisms exposed to the aqueous sample The MSD provides an indication of within-test variability and test method sensitivity
Principal Conclusions
The principal conclusions of this document follow
Evaluation of Test Method Variability
bull Comparisons of WET method precision with method precision for analytes commonly limited in NPDES permits clearly demonstrate that the variability of the promulgated WET methods is within the range of variability experienced in other types of analyses Several independent researchers and studies also have concluded that method performance improves when prescribed methods are followed closely by experienced analysts (Section 43)
bull This document provides interim CVs for promulgated WET methods in Appendix A Tables A-1 (acute methods) and A-2 (chronic methods) pending completion of between-laboratory studies which may affect these interim CV estimates
Evaluation of Approach To Incorporate Test Method Variability
bull EPArsquos TSD presents guidance for developing effluent limits that appropriately protect water quality regarding both effluent variability and analytical variability provided that the WET criteria and waste load allocation (WLA) are derived correctly (Section 6 and Appendix G)
bull EPArsquos analysis of data gathered in the development of this document indicates that the TSD approach appropriately accounts for both effluent variability and method variability EPA does not believe a reasonable alternative approach is available to determine a factor that would discount the effects of method variability using the TSD procedures because the approach would not ensure adequate protection of water quality (Section 611 and Appendix G)
Development of Guidance to Regulatory Authorities
bull EPA recommends that regulatory authorities implement the statistical approach as described in the TSD to evaluate effluent for reasonable potential and to derive WET limits or monitoring triggers (Section 61 and Appendix G)
bull EPA recommends that regulatory authorities calculate the facility-specific CVs using point estimate techniques to determine the need for and derive a permit limit for WET even if self-monitoring data are to be determined using hypothesis testing techniques for example to determine a ldquono effectrdquo concentration (ldquoNOECrdquo) This document describes such facility-specific calculations (Section 341 and 62)
June 30 2000 xiii
Understanding and Accounting for Method Variability in WET Applications Under the NPDES Program
Additional Recommendations and Guidance
This document also provides recommendations and guidance on minimizing variability in three specific areas in order to generate sound WET test results (1) obtaining a representative effluent sample (2) conducting the toxicity tests properly to generate the biological endpoints and (3) conducting the appropriate statistical analysis to obtain defensible effect concentrations (EC25 LC50 NOEC) If these recommendations are addressed the reliability of the test endpoint values should improve
bull Regulatory Authorities Design a sampling program that collects representative effluent samples to fully characterize effluent variability for a specific facility over time (Sections 613 and 62)
bull Regulatory Authorities Ensure proper application of WET statistical procedures and test methods (Sections 52 through 55)
bull Regulatory Authorities Incorporate both the upper and lower bounds using the percent minimum significant difference (PMSD) to control and to minimize within-test method variability and increase test sensitivity To achieve the PMSD upper bound either the replication should increase or within-test method variability should decrease or both (Section 64 and Table 3-6)
bull Testing Laboratories Encourage WET testing laboratories to maintain control charts for PMSD and the control mean and report the PMSD with all WET test results (Section 5311)
bull Regulatory Authorities Participate in the National Environment Laboratory Accreditation Program and routine performance audit inspections to evaluate laboratory performance (Section 5311)
bull Regulatory Authorities Incorporate EPArsquos guidance on error rate assumption adjustments concentration-response relationships confidence intervals acceptable dilution waters how to block by parentage for the chronic Ceriodaphnia dubia test and control of pH drift (USEPA 2000a)
June 30 2000 xiv
LIST OF ACRONYMS AND ABBREVIATIONS1
ACR acute-to-chronic ratio
AML average monthly limit
ANOVA analysis of variance
APHA-AWWA- American Public Health Association-American Water Works Association-Water WEF Environment Federation
ASTM American Society for Testing and Materials
BSAB Biomonitoring Science Advisory Board
CCC criteria continuous concentration
CFR Code of Federal Regulations
CMC criteria maximum concentration
CV coefficient of variation
CWA Clean Water Act
DMR discharge monitoring report
EMS error mean square [also referred to as mean square error (MSE)]
EPA US Environmental Protection Agency (also the Agency)
FR Federal Register
IC inhibition concentration
IWC instream waste concentration (sometimes referred to as receiving water concentration)
LC50 lethal concentration 50 percent
LOEC lowest observed effect concentration
LTA long-term average (LTAa = acute LTA LTAc = chronic LTA LTAac = acute-to-chronic LTA)
MDL maximum daily limit
MSD minimum significant difference
MSE mean square error [also referred to as error mean square (EMS)]
MZ mixing zone
NELAP National Environment Laboratory Accreditation Program
NOEC no observed effect concentration
NPDES National Pollutant Discharge Elimination System
NTRD National Toxicant Reference Database
PAI Performance Audit Inspections
PMSD percent minimum significant difference
Note These acronyms and abbreviations may have other meanings in other EPA programs or documents
June 30 2000
1
xv
Understanding and Accounting for Method Variability in WET Applications Under the NPDES Program
QA quality assurance
QC quality control
rMSE square root of the mean square error
RP reasonable potential
RWC receiving water concentration (sometimes referred to as instream waste concentration)
SCTAG Southern California Toxicity Assessment Group
SETAC Society of Environmental Toxicology and Chemistry
TAC test acceptability criteria
TIE toxicity identification evaluation
TMDL total maximum daily load
TRE toxicity reduction evaluation
TSD EPArsquos Technical Support Document for Water Quality-based Toxics Control (March 1991 EPA5052-90-001)
TU toxic unit (TUa = acute toxicity TUc = chronic toxicity)
VF variability factor
WET whole effluent toxicity
WLA waste load allocation
WQBEL water quality based effluent limit
June 30 2000 xvi
GLOSSARY
Acute Toxicity Test is a test to determine the concentration of effluent or ambient waters that causes an adverse effect (usually death) on a group of test organisms during a short-term exposure (eg 24 48 or 96 hours) Acute toxicity is measured using statistical procedures (eg point estimate techniques or a t-test)
Acute-to-Chronic Ratio (ACR) is the ratio of the acute toxicity of an effluent or a toxicant to its chronic toxicity It is used as a factor for estimating chronic toxicity on the basis of acute toxicity data or for estimating acute toxicity on the basis of chronic toxicity data
Ambient Toxicity is measured by a toxicity test on a sample collected from a receiving waterbody
ANOVA is analysis of variance
Average Monthly Limit (AML) is the calculated average monthly limit of waste load allocation assigned by a State or EPA for a particular facility
CCC are water quality criteria for chronic exposure (criteria continuous concentrations)
Chronic Toxicity Test is a short-term test in which sublethal effects (eg reduced growth or reproduction) are usually measured in addition to lethality Chronic toxicity is defined as TUc = 100NOEC or TUc = 100ECp or ICp
CMC are water quality criteria for acute exposures (criteria maximum concentration)
Coefficient of Variation (CV) is a standard statistical measure of the relative variation of a distribution or set of data defined as the standard deviation divided by the mean It is also called the relative standard deviation (RSD) The CV can be used as a measure of precision within (within-laboratory) and between (between-laboratory) laboratories or among replicates for each treatment concentration
Confidence Interval is the numerical interval constructed around a point estimate of a population parameter
Effect Concentration (EC) is a point estimate of the toxicant concentration that would cause an observable adverse effect (eg death immobilization or serious incapacitation) in a given percent of the test organisms calculated from a continuous model (eg Probit Model) EC25 is a point estimate of the toxicant concentration that would cause an observable adverse effect in 25 percent of the test organisms
Hypothesis Testing is a statistical technique (eg Dunnettrsquos test) for determining whether a tested concentration is statistically different from the control Endpoints determined from hypothesis testing are NOEC and LOEC The two hypotheses commonly tested in WET are
Null hypothesis (Ho) The effluent is not toxic Alternative hypothesis (Ha) The effluent is toxic
Inhibition Concentration (IC) is a point estimate of the toxicant concentration that would cause a given percent reduction in a non-lethal biological measurement (eg reproduction or growth) calculated from a continuous model (ie Interpolation Method) IC25 is a point estimate of the toxicant concentration that would cause a 25-percent reduction in a non-lethal biological measurement
Instream Waste Concentration (IWC) is the concentration of a toxicant in the receiving water after mixing The IWC is the inverse of the dilution factor It is sometimes referred to as the receiving water concentration (RWC)
June 30 2000 xvii
Understanding and Accounting for Method Variability in WET Applications Under the NPDES Program
LC50 (lethal concentration 50 percent) is the toxicant or effluent concentration that would cause death in 50 percent of the test organisms
Lowest Observed Effect Concentration (LOEC) is the lowest concentration of an effluent or toxicant that results in adverse effects on the test organisms (ie where the values for the observed endpoints are statistically different from the control)
Long-term Averages (LTAs) of pollutant concentration or effluent toxicity are calculated from waste load allocations (WLAs) typically assuming that the WLA is a 99th percentile value (or another upper bound value) based on the lognormal distribution One LTA is calculated for each WLA (typically an acute LTA and a chronic LTA for aquatic life protection) The LTA represents expected long-term average performance from the permitted facility required to achieve the associated WLA
Maximum Daily Limit (MDL) is the calculated maximum WLA assigned by a State or EPA for a particular facility
Minimum Significant Difference (MSD) is the magnitude of difference from control where the null hypothesis is rejected in a statistical test comparing a treatment with a control MSD is based on the number of replicates control performance and power of the test
Mean Square Error (MSE) is the average dispersion of the items around the treatment means It is an estimate of a common variance the within variation or variation among observations treated alike [Also referred to as error mean square (EMS)]
Mixing Zone is an area where an effluent discharge undergoes initial dilution and is extended to cover the secondary mixing in the ambient waterbody A mixing zone is an allocated impact zone where water quality criteria can be exceeded as long as acutely toxic conditions are prevented
No Observed Effect Concentration (NOEC) is the highest tested concentration of an effluent or toxicant that causes no observable adverse effect on the test organisms (ie the highest concentration of toxicant at which the values for the observed responses are not statistically different from the controls)
National Pollutant Discharge Elimination System (NPDES) program regulates discharges to the nationrsquos waters Discharge permits issued under the NPDES program are required by EPA regulation to contain where necessary effluent limits based on water quality criteria for the protection of aquatic life and human health
Power is the probability of correctly detecting an actual toxic effect (ie declaring an effluent toxic when in fact it is toxic)
Precision is a measure of reproducibility within a data set Precision can be measured both within a laboratory (within-laboratory) and between laboratories (between-laboratory) using the same test method and toxicant
Quality Assurance (QA) is a practice in toxicity testing that addresses all activities affecting the quality of the final effluent toxicity data QA includes practices such as effluent sampling and handling source and condition of test organisms equipment condition test conditions instrument calibration replication use of reference toxicants recordkeeping and data evaluation
Quality Control (QC) is the set of more focused routine day-to-day activities carried out as part of the overall QA program
Reasonable Potential (RP) is where an effluent is projected or calculated to cause an excursion above a water quality standard based on a number of factors
xviii June 30 2000
Understanding and Accounting for Method Variability in WET Applications Under the NPDES Program
Reference Toxicant Test is a check of the sensitivity of the test organisms and the suitability of the test methodology Reference toxicant data are part of a routine QAQC program to evaluate the performance of laboratory personnel and the robustness and sensitivity of the test organisms
Significant Difference is defined as a statistically significant difference (eg 95 percent confidence level) in the means of two distributions of sampling results
Statistic is a computed or estimated quantity such as the mean standard deviation or coefficient of variation
Test Acceptability Criteria (TAC) are specific criteria for determining whether toxicity test results are acceptable The effluent and reference toxicant must meet specific criteria as defined in the test method (eg for the Ceriodaphnia dubia survival and reproduction test the criteria are as follows the test must achieve at least 80 percent survival and an average of 15 young per surviving female in the controls)
Total Maximum Daily Load (TMDL) is a determination of the amount of a pollutant or property of a pollutant from point nonpoint and natural background sources including a margin of safety that may be discharged to a water quality-limited waterbody
t-Test (formally Studentrsquos t-Test) is a statistical analysis comparing two sets of replicate observations in the case of WET only two test concentrations (eg a control and 100 percent effluent) The purpose of this test is to determine if the means of the two sets of observations are different [eg if the 100-percent effluent concentration differs from the control (ie the test passes or fails)]
Type I Error (alpha) is the rejection of the null hypothesis (Ho) when it is in fact true (ie determining that the effluent is toxic when the effluent is not toxic)
Type II Error (beta) is the acceptance of the null hypothesis (Ho) when it is not true (ie determining that the effluent is not toxic when the effluent is toxic)
Toxicity Test is a procedure to determine the toxicity of a chemical or an effluent using living organisms A toxicity test measures the degree of effect of a specific chemical or effluent on exposed test organisms
Toxic Unit-Acute (TUa) is the reciprocal of the effluent concentration (ie TUa = 100LC50) that causes 50 percent of the organisms to die by the end of an acute toxicity test
Toxic Unit-Chronic (TUc) is the reciprocal of the effluent concentration (eg TUc = 100NOEC) that causes no observable effect (NOEC) on the test organisms by the end of a chronic toxicity test
Toxic Unit (TU) is a measure of toxicity in an effluent as determined by the acute toxicity units (TUa) or chronic toxicity units (TUc) measured Higher TUs indicate greater toxicity
Toxicity Identification Evaluation (TIE) is a set of procedures used to identify the specific chemicals causing effluent toxicity
Toxicity Reduction Evaluation (TRE) is a site-specific study conducted in a step-wise process designed to identify the causative agents of effluent toxicity isolate the source of toxicity evaluate the effectiveness of toxicity control options and then confirm the reduction in effluent toxicity
Variance is a measure of the dispersion in a set of values defined as the sum of the squared deviations divided by their total number
Whole Effluent Toxicity (WET) is the total toxic effect of an effluent measured directly with a toxicity test
Waste Load Allocation (WLA) is the portion of a receiving waterrsquos total maximum daily load that is allocated to one of its existing or future point sources of pollution
June 30 2000 xix
Understanding and Accounting for Method Variability in WET Applications Under the NPDES Program
This page intentionally left blank
June 30 2000 xx
10 INTRODUCTION
11 Background
The Federal Water Pollution Control Act commonly known as the Clean Water Act (CWA) was enacted in 1972 with the objective of ldquorestoring the chemical physical and biological integrity of the Nationrsquos watersrdquo Several goals and policies were established in the Act including the following
bull Eliminating the discharge of pollutants into navigable waters by 1985
bull Wherever attainable achieving an interim goal of water quality that provides for the protection and propagation of fish shellfish and wildlife and provides for recreation in and on the water by November 1 1983 and
bull Prohibiting the discharge of toxic pollutants in toxic amounts
In the 28 years since the CWA was enacted the US Environmental Protection Agency (EPA) and States authorized to administer EPArsquos National Pollutant Discharge Elimination System (NPDES) permitting program have made significant progress toward achieving these goals NPDES is designed to control toxic discharges implement a water quality standards program and restore waters to ldquofishable and swimmablerdquo conditions A point source that discharges pollutants to waters of the United States must do so under the terms and conditions of an NPDES permit In setting these terms and conditions EPA and the States have integrated their control of toxic pollutants through combined use of three approaches [Technical Support Document for Water Quality-based Toxics Control (USEPA 1991a referred to as the TSD)]
bull Chemical-specific controls
bull Whole effluent toxicity (WET) controls and
bull Biological criteriabioassessments and bioassays
The WET approach to protection of water quality is the primary subject of this document
In 1989 EPA defined whole effluent toxicity as ldquothe aggregate toxic effect of an effluent measured directly by an aquatic toxicity testrdquo [54 Federal Register (FR) 23868 at 23895 June 2 1989] Aquatic toxicity tests are laboratory experiments that measure the biological effect (eg growth survival and reproduction) of effluents or receiving waters on aquatic organisms In aquatic toxicity tests groups of organisms of a particular species are held in test chambers and exposed to different concentrations of an aqueous test sample for example a reference toxicant an effluent or a receiving water Observations are made at predetermined exposure periods At the end of the test the responses of test organisms are used to estimate the effects of the toxicant or effluent
In the early 1980s EPA published methods (USEPA 1985 1988 1989) for estimating the short-term acute and chronic toxicity of effluents and receiving waters to freshwater and marine organisms WET data gathered in the 1980s indicated that approximately 40 percent of NPDES facilities nationwide discharged an effluent with sufficient toxicity to cause water quality problems Further reductions in the toxicity of wastewater discharges were necessary to achieve compliance with narrative water quality standards expressed as ldquono toxics in toxic amountsrdquo In response to these findings EPA implemented a policy to reduce or eliminate toxic discharges The Policy for the Development of Water Quality-based Permit Limitations for Toxic Pollutants (49 FR 9016 March 9 1984) introduced EPArsquos integrated toxics control program To support this policy EPA developed the TSD (USEPA 1991a) The TSD provides guidance to
June 30 2000 1-1
Understanding and Accounting for Method Variability in WET Applications Under the NPDES Program
regulators in implementing WET testing requirements in NPDES permits In 1989 EPA promulgated regulations specifying procedures for determining when water quality-based effluent limitations are required in NPDES permits [40 CFR 12244(d)] On October 26 1995 EPA promulgated WET test methods (USEPA 1993 1994a and 1994b) and added them to the list of EPA methods approved under Section 304(h) of the CWA (40 CFR 136) for use in the NPDES program Although the rulemaking was challenged in court that challenge has been stayed pending completion of a settlement agreement The rulemaking remains in force and effect unless and until EPA takes further action
12 Effect of This Guidance
This document attempts to clarify several issues regarding WET variability and reaffirms EPArsquos earlier guidance and recommendations published in the TSD (USEPA 1991a) This document is intended to provide NPDES regulatory authorities and all stakeholders including permittees with guidance and recommendations on how to understand and account for measurement variability in WET testing The documentrsquos recommendations and conclusions are detailed in Section 7 Appendix C provides sample NPDES permit language reflecting these recommendations
The most significant recommendation is to use and report the values for the percent minimum significant difference (PMSD) with all WET data results The minimum significant difference (MSD) is the smallest difference that can be distinguished between the response of control organisms and the response of test organisms at each concentration of the WET test dilution series The MSD provides an indication of the within-test variability and test method sensitivity Using this information the regulatory authority and permittees can better evaluate WET test results
This document also recommends the following
bull Continue to use the EPA TSD statistical approach for NPDES permit limit development (no test method variability adjustments are needed)
bull Collect and evaluate a sufficient number of representative effluent samples
bull Verify effluent toxicity data carefully along with reference toxicant data
bull Maintain good communication between the regulatory authority and permittee throughout all phases of the permitting process
bull Implement the PMSD to evaluate both WET and reference toxicant data to minimize within-test method variability and increase test sensitivity
bull Maintain laboratory checks with good laboratory certification programs to encourage experienced laboratories and skilled analysts for the toxicity testing program for individual WET laboratory performance
13 Three Goals of This Document
EPA prepared this document to achieve the following three goals
1 Quantify the variability of promulgated test methods and report a coefficient of variation (CV) as a measure of test method variability (see Chapter 3 and Appendix A)
June 30 2000 1-2
Understanding and Accounting for Method Variability in WET Applications Under the NPDES Program
2 Evaluate the statistical methods described in the Technical Support Document for Water Quality-Based Toxics Control (TSD) for determining the need for and deriving WET permit conditions (see Chapter 6 and Appendix G)
3 Suggest guidance for regulatory authorities on approaches to address and minimize test method variability (Chapter 6) In addition the document is intended to provide guidance to regulatory authorities permittees and testing laboratories on conducting the biological and statistical methods and evaluating test effect concentrations (Chapter 5)
This document does not address effluent variability It does however discuss how handling effluent samples can affect tests Chapter 2 provides definitions of terms used and discusses the ways in which variability can be quantified Chapter 3 describes the variability of the effect concentration estimates (EC25 LC50 and NOEC) and the variability of endpoint measurements (survival growth and reproduction) Chapter 4 discusses WET variability in the context of chemical-specific method variability Chapter 5 provides guidance to permittees testing laboratories and regulatory authorities to minimize test method variability Chapter 6 provides guidance to regulatory authorities on how to determine reasonable potential (RP) and derive permit limits or monitoring triggers and evaluate self-monitoring data Chapter 7 presents EPArsquos principal conclusions Chapter 8 is a bibliography containing a list of documents cited herein and additional reading material
June 30 2000 1-3
Understanding and Accounting for Method Variability in WET Applications Under the NPDES Program
This page intentionally left blank
June 30 2000 1-4
20 DEFINITION AND MEASUREMENT OF METHOD VARIABILITY IN WET TESTING
The terms used to express toxicity test results are defined in this chapter and methods for quantifying WET test method variability are discussed Additional terms used throughout this document along with their definitions are provided in the Glossary as part of the front matter of this document
21 Terms and Definitions
Biological endpoints are the biological observations recorded when conducting toxicity tests These observations may include the number of surviving organisms or the number of young produced There are two basic types of biological endpoints responses recorded as responseno response (eg dead or alive) are quantal data responses recorded as a measured response (eg weight) or as a count (eg number of young produced) are considered continuous data For most WET tests the observations for each tested concentration are combined and then reported as an average or percentage to represent the biological endpoint For example the fathead minnow larval survival and growth chronic test method has two biological endpoints (ie percent survival and average dry weight for each test concentration)
Effect concentrations are concentrations of a test material (ie effluent referent toxicant receiving water) derived from the observed biological endpoints followed by data analysis using either hypothesis testing procedures or point estimate techniques Effect concentrations derived using point estimation techniques represent the concentration of a test material at which a predetermined level of effect occurs For example LC50 is the lethal concentration at which 50 percent of the organisms respond Effect concentrations commonly estimated for WET methods are LC50 EC50 (effect concentration at which a 50shypercent effect occurs) and IC25 (inhibition concentration at which a 25-percent effect occurs) Hypothesis test methods are used to determine the no observed effect concentration (NOEC) The NOEC represents the highest effect concentration in the test concentration response that is not significantly different from the control response Multiple statistical endpoints can be derived for each WET method For example the endpoints for the fathead minnow larval survival and growth chronic test can be reported as an EC25 for growth an NOEC for growth an LC50 (or EC50) for survival and an NOEC for survival
22 Defining WET Test Variability
As with any measurement process WET tests have a degree of variability associated with the test method performance Three measures of variability related to WET tests are within-test variability within-laboratory variability and between-laboratory variability
bull Within-test (intra-test) variability is the variability in test organism response within a concentration averaged across all concentrations of the test material in a single test
bull Within-laboratory (intra-laboratory) variability is the variability that is measured when tests are conducted using specific methods under reasonably constant conditions in the same laboratory Within-laboratory variability as used in this document includes within-test variability The American Society for Testing and Materials (ASTM) uses the term ldquorepeatabilityrdquo to describe within-laboratory variability Repeatability is estimated (as a sample variance or standard deviation) by repeating a test method under realistically constant conditions within a single laboratory
bull Between-laboratory (inter-laboratory) variability is the variability between laboratories It is measured by obtaining results from different laboratories using the same test method and the same
June 30 2000 2-1
Understanding and Accounting for Method Variability in WET Applications Under the NPDES Program
test material (eg reference toxicant) Between-laboratory variability as used in this document does not include the within-laboratory component of variance ASTM uses the term ldquoreproducibilityrdquo to describe between-laboratory variability Reproducibility is estimated by having nearly identical test samples (duplicates or splits) analyzed by multiple laboratories using similar standard methods Although reproducibility is generally synonymous with between-laboratory variability estimates of reproducibility may combine within-laboratory and between-laboratory components of variance making between-laboratory variability numerically larger than within-laboratory variability as defined above
For purposes of consistency EPA uses the terms within-laboratory and between-laboratory variability throughout this document
Numerous factors can affect the variability of any toxicity test method These factors include the number of test organisms the number of treatment replicates randomization techniques the source and health of the test organisms the type of food used laboratory environmental conditions and dilution water quality The experience of the analyst performing the test analyzing the data and interpreting the results may also affect variability (Grothe et al 1996 Fulk 1996)
23 Quantifying WET Test Variability
Historically information on the variability of toxicity tests has been developed using effect concentrations such as the NOEC EC25 EC50 and LC50 for survival fecundity and growth Variability measures should be quantified based on the end use of the data (ie effect concentrations) and be directly related to the WET permit requirement Typically the effect concentrations are the endpoints used for evaluating self-monitoring results The variability of the effect concentrations is quantified by obtaining multiple test results under similar test conditions using the same test material For example the sample standard deviation and mean for EC25 obtained from multiple monthly reference toxicant tests for the fathead minnow survival and growth chronic test conducted at one laboratory would quantify ldquowithinshylaboratoryrdquo variability for that laboratory EPA used this approach to evaluate data for the development of this document (see Chapter 3)
Examining variability for each effect concentration of each biological endpoint for each test method is essential The biological endpoints may be different for various toxicants and effluents One biological endpoint such as reproduction may be more sensitive to a certain toxicant than another endpoint such as survival That sensitivity may be reversed for a different toxicant Alternatively an endpoint may be more sensitive to one toxicant than another toxicant
Three other measures of variability (which are not addressed in this document) that have been applied to WET tests are
1 Determine the variability of the biological endpoint response For example the variance of the biological response (eg growth and survival) can be calculated This approach is useful but does not quantify variability of the WET test effect concentration which is important in the context of this document
2 Quantify the uncertainty of each test point estimate (eg the EC50 EC25 or LC50) using confidence intervals which reflect within-test variability
3 Use the standard deviation to quantify the uncertainty in the mean of the replicate response at each concentration within a particular test For example laboratories can compare the standard deviations of the average weight of fathead minnow larvae in four chronic tests at one test concentration such as 1 mgL sodium chloride These standard deviations may be pooled across
June 30 2000 2-2
Understanding and Accounting for Method Variability in WET Applications Under the NPDES Program
all the concentrations when data have been transformed (if necessary) to give similar variances at each concentration From the pooled variance one may calculate a minimum significant difference (MSD) value which is a useful indication of test sensitivity (see Chapters 3 and 5) In this document the standard deviation at each concentration was not evaluated as a measure of variability However the MSD was considered as a measure of WET test variability
June 30 2000 2-3
Understanding and Accounting for Method Variability in WET Applications Under the NPDES Program
This page intentionally left blank
June 30 2000 2-4
30 VARIABILITY OF WET TEST METHODS
Chapter 3 describes the variability of effect concentration estimates (EC25 LC50 and NOEC) and endpoint measurements (survival growth and reproduction) For definitive studies of the variability of WET methods readers should also refer to the TSD (USEPA 1991a Part 133) and to WET methods manuals (USEPA 1993 1994a 1994b) EPA will complete and report on a new between-laboratory study of promulgated methods in 2000 or 2001
31 Acquisition Selection and Quality Assurance of Data Presented in This Document
EPA solicited data for reference toxicant tests from laboratories that conduct WET tests and use reference toxicant testing as part of their quality control (QC) program Reference toxicant testing is required as specified in EPA toxicity test methods to document laboratory performance over time for laboratories conducting self-monitoring tests When laboratories are conducting effluent tests at least one reference toxicant test must be conducted each month using the same toxicant test concentrations dilution water and data analysis methods These reference toxicant tests must be conducted using the same test conditions (type of dilution water temperature test protocol and species) that are used for WET tests conducted by the laboratory
Reference toxicant tests were used to characterize method variability because in contrast to effluent samples fixed concentrations of known toxicants are used Only with this standardization is it possible to conclude that variability of the effect concentration estimates is derived from the sources discussed above rather than from changes in the toxicant
EPA received reference toxicant test data from several States private laboratory sources and the EPA Regions Data sources used for these analyses include the EPA National Toxicant Reference Database (NTRD) the EPA Region 9 Toxicity Data Base and laboratory bench sheets voluntarily submitted by independent sources Although the data do not represent a random sample of laboratories or tests they do represent a widespread sampling of typical laboratories and practices
EPA required that reference toxicant tests included in its data base meet the following four criteria
1 Test records documented the test method organism test date laboratory reference toxicant and individual biological responses in the concentration series
2 Data for each replicate were provided as required in the published method using the current test method
3 The test used at least five toxicant concentrations and a control for the most commonly reported chronic toxicity test methodsmdash(1) 10000 fathead minnow larval survival and growth (2) 10020 Ceriodaphnia survival and reproduction and (3) 10060 inland silverside survival and growth For other chronic toxicity test methods the test used at least four toxicant concentrations and a control because the methods permitted in the recent past the use of only four concentrations
4 EPA personnel or an EPA contractor calculated the effect concentration verified that all test acceptability criteria (TAC) had been met and verified that the statistical flowchart had been followed correctly Thus all summary statistics and estimates were calculated from the replicate data and strictly followed the most current EPA test methods
June 30 2000 3-1
Understanding and Accounting for Method Variability in WET Applications Under the NPDES Program
Details of data quality assurance and test acceptance are provided in a separate document available at EPArsquos Office of Water docket located in the Office of Science and Technology [ldquoWhole Effluent Toxicity (WET) Data Test Acceptance and Quality Assurance Protocolrdquo] An attachment to that document provides a laboratory-by-laboratory listing of quality assurance flags test dates and toxicant concentrations as well as summary statistics by laboratory for the NOEC EC25 and LC50 estimates and test endpoints (survival growth reproduction etc) Laboratories are not identified by name
The data set of reference toxicant tests includes information from 75 laboratories for 23 methods for tests conducted between 1988 and 1999 This document addresses and provides specific guidance on the variability of methods promulgated by EPA in 40 CFR Part 136 (Table 3-1) The data are also used to develop between-laboratory interim estimates of method variability for the promulgated methods (Appendix A) The Agency identifies these CVs as ldquointerimrdquo EPA may revise some or all of these estimates based on between-laboratory studies to evaluate some of the promulgated test methods
The next section presents summary statistics for the promulgated methods Summary statistics for all methods in the data set appear in Appendix B For methods represented by a few laboratories summary statistics should not be considered representative of method performance For example EPArsquos Office of Water usually relies on acceptable data from at least six laboratories (USEPA 1996b) when it conducts a multi-laboratory study to quantify method performance The data used here have not been obtained under conditions as rigorous as those applied to a between-laboratory study and for that reason may overestimate variability particularly for the extremes
Coefficients of variation are used as descriptive statistics for NOECs in this document Because NOECs can take on only values that correspond to concentrations tested the distribution (and CV) of NOECs can be influenced by the selection of experimental concentrations as well as additional factors (eg within-test variability) that affect both NOECs and point estimates This makes CVs for NOECs more uncertain than the CVs for point estimates and the direction of this uncertainty is not uniformly toward larger or smaller CVs Despite these confounding issues CVs are used herein as the best available means of expressing the variability of interest in this document and for general comparisons among methods Readers should be cautioned however that small differences in CVs between NOECs and point estimates may be artifactual large differences are more likely to reflect real differences in variability (a definition of what is ldquosmallrdquo or ldquolargerdquo would require a detailed statistical analysis and would depend upon the experimental and statistical details surrounding each comparison) NOECs can only be a fixed number of discrete values the mean standard deviation and CV cannot be interpreted and applied as they are for a continuous variable such as the EC25 or EC50 For instance the typical reference toxicant test might result in only three observed NOEC values most of them at one or two concentrations The mean will fall between tested concentrations as will the stated confidence intervals thus these do not actually represent expected outcomes only approximations of the expected outcome
As an alternative to CVs ratios are used to quantify variability of EC25 EC50 and NOEC measurements in Appendix B Ratios of measurements have been used previously to quantify and compare variability of NOEC and EC50 (Chapman et al 1996b Dhaliwal et al 1997)
32 Variability of EC25 LC50 and NOEC
321 Within-Laboratory Variability of EC25 LC50 and NOEC
This section characterizes the within-test and within-laboratory variability of effect concentration estimates Tables 3-2 through 3-4 summarize variation across laboratories of the within-laboratory coefficients of variation (CVs) without respect to reference toxicant tested Tables showing more extensive summaries appear in Appendix B (Tables B-1 through B-3)
June 30 20003-2
Understanding and Accounting for Method Variability in WET Applications Under the NPDES Program
Table 3-1 Promulgated WET Methods Included in This Report
Test Method No Test Method
EPA Data Base
Toxicants Tests Labs
Freshwater Methods for Chronic Toxicitya
10000 Pimephales promelas Fathead Minnow Larval Survival and Growth Test
Cd Cr Cu KCl NaCl NaPCP SDS
205 19
10000 Pimephales promelas Fathead Minnow Embryo-Larval Survival and Teratogenicity Test
0 0
10020 Ceriodaphnia dubia Water Flea Survival and Reproduction Test
Cd Cu KCl NaCl NaPCP 393 33
10030 Selenastrum capricornutum b Green Alga Growth Test
Cu NaCl Zn 85 9
Marine amp Estuarine Methods for Chronic Toxicityc
10040 Cyprinodon variegatus Sheepshead Minnow Larval Survival and Growth Test
Cd KCl 57 5
10050 Cyprinodon variegatus Sheepshead Minnow Embryo-larval Survival and Teratogenicity Test
0 0
10060 Menidia beryllina Inland Silverside Larval Survival and Growth Test
Cr Cu KCl SDS 193 16
10070 Americamysis (Mysidopsis) bahia Mysid Survival Growth and Fecundity Test
Cr Cu KCl 130 10
10080 Arbacia punctulata Sea Urchin Fertilization Test 0 0
10090 Champia parvula Red Macroalga Reproduction Test
Cu SDS 23 2
Methods for Acute Toxicity de
20000 Fathead Minnow Survival Test Cd Cu KCl NaCl NaPCP 217 21
20020 Ceriodaphnia dubia Survival Test Cd Cu KCl NaCl NaPCP 241 23
20040 Sheepshead Minnow Survival Test SDS 65 3
20060 Inland Silverside Survival Test Cd KCl SDS 48 5
20070 Mysid (A bahia) Survival Test Cd Cu SDS 32 3
20110 Mysid (H costata) Survival Test Cd SDS 14 2
20190 Rainbow Trout Survival Test Cu Zn 10 1
20210 Daphnia magna Survival Test Cd 48 5
20220 Daphnia pulex Survival Test Cu NaCl SDS Cd Cu NaCl NaPCP
57 6
a See publications EPA6004-89-001 (USEPA 1989) and EPA6004-91-002 (USEPA 1994b)b The genus and species names for Selenastrum capricornutum have been changed to Raphidocelis subcapitata In this
document however Selenastrum capricornutum is used to avoid confusion See publication EPA6004-91-003 (USEPA 1994a) and EPA6004-87028 (USEPA 1988)
d See publications EPA6004-85013 (USEPA 1985) and EPA6004-90027F (USEPA 1993) e EPA did not assign method numbers for acute methods in EPA6004-90027F The numbers assigned here were created for
use in this document and in related materials and data bases Reference toxicant codes Cd cadmium NaCl sodium chloride Cr chromium NaPCP sodium pentachlorophenate Cu copper SDS sodium dodecyl sulfate KCl potassium chloride Zn zinc
June 30 2000 3-3
c
Understanding and Accounting for Method Variability in WET Applications Under the NPDES Program
Table 3-2 Quartiles (25th and 75th) and Median (50th) of the Within-Laboratory Values of CV for EC25 (Chronic Tests)
Test Methoda
Test Method
No Endpoint
b No of Labs
Percentiles of CV
25th 50th 75th
Fathead Minnow Larval Survival amp Growth 10000 G 19 021 026 038
Fathead Minnow Larval Survival amp Growth 10000 S 16 011 022 032
Ceriodaphnia (Cd) Survival amp Reproduction 10020 R 33 017 027 045
Ceriodaphnia (Cd) Survival amp Reproduction 10020 S 25 011 023 041
Green Alga (Selenastrum) Growth 10030 G 6 025 026 039
Sheepshead Minnow Larval Survival amp Growth 10040 G 5 009 013 014
Sheepshead Minnow Larval Survival amp Growth 10040 S 2 015 016 017
Inland Silverside Larval Survival amp Growth 10060 G 16 018 027 043
Inland Silverside Larval Survival amp Growth 10060 S 13 022 035 042
Mysid (Ab) Survival Growth amp Fecundity 10070 F 4 030 038 041
Mysid (Ab) Survival Growth amp Fecundity 10070 G 10 024 028 032
Mysid (Ab) Survival Growth amp Fecundity 10070 S 7 017 021 028
Red Macroalga (Champia parvula) Reproduction 10090 R 2 058 058 059 a Cd = Ceriodaphnia dubia Ab = Americamysis (Mysidopsis) bahia b G = growth S = survival R = reproduction F = fecundity
Table 3-3 Quartiles (25th and 75th) and Median (50th) of the Within-Laboratory Values of CV for LC50
Test Methoda Test
Method No Endpoint
b No of Labs
Percentiles of CV
25th 50th 75th
Freshwater Methods for Chronic Toxicityc
Fathead Minnow Larval Survival amp Growth 10000 S 19 015 023 031
Ceriodaphnia (Cd) Survival amp Reproduction 10020 S 33 010 016 029
Sheepshead Minnow Larval Survival amp Growth 10040 S 5 007 008 012
Inland Silverside Larval Survival amp Growth 10060 S 16 016 028 035
Mysid (Ab) Survival Growth amp Fecundity 10070 S 10 016 026 027
Methods for Acute Toxicityde
Fathead Minnow Larval Survival 20000 S 21 010 016 019
Ceriodaphnia (Cd) Survival 20020 S 23 011 019 029
Sheepshead Minnow Survival 20040 S 5 012 014 021
Inland Silverside Larval Survival 20060 S 5 015 016 021
Mysid (Ab) Survival 20070 S 3 017 025 026
Mysid (Hc) Survival 20110 S 2 027 030 034
Rainbow Trout Survival 20190 S 1 023 023 023
Daphnia (Dm) Survival 20210 S 5 007 022 024
Daphnia (Dp) Survival 20220 S 6 019 021 027 a Cd = Ceriodaphnia dubia Ab = Americamysis (Mysidopsis) bahia Hc = Holmesimysis costata Dm = Daphnia magna
Dp = Daphnia pulex b S = survival
See publications EPA6004-89-001 (USEPA 1989) and EPA6004-91-002 (USEPA 1994b)d See publications EPA6004-85-013 (USEPA 1985 and EPA6004-90027F (USEPA 1993) e EPA did not assign method numbers for acute methods in EPA6004-90027F The numbers assigned here were created for
use in this document and in related materials and data bases
June 30 2000 3-4
c
Understanding and Accounting for Method Variability in WET Applications Under the NPDES Program
Table 3-4 Quartiles (25th and 75th) and Median (50th) of the Within-Laboratory Values of CV for NOEC
Test Methoda
Test Metho
d No
Endpointb
No of Labs
Percentiles of CV
25th 50th 75th
Freshwater Methods for Chronic Toxicityc
Fathead Minnow Larval Survival amp Growth 10000 G 19 022 037 053
Fathead Minnow Larval Survival amp Growth 10000 S 19 026 039 048
Ceriodaphnia (Cd) Survival amp Reproduction 10020 R 33 025 033 049
Ceriodaphnia (Cd) Survival amp Reproduction 10020 S 33 021 030 043
Green Alga (Selenastrum) Growth 10030 G 9 040 046 056
Marine amp Estuarine Methods for Chronic Toxicityd
Sheepshead Minnow Larval Survival amp Growth 10040 G 5 034 040 044
Sheepshead Minnow Larval Survival amp Growth 10040 S 5 014 018 024
Inland Silverside Larval Survival amp Growth 10060 G 16 031 046 057
Inland Silverside Larval Survival amp Growth 10060 S 16 030 042 055
Mysid (Ab) Survival Growth amp Fecundity 10070 F 4 017 036 040
Mysid (Ab) Survival Growth amp Fecundity 10070 G 10 035 039 043
Mysid (Ab) Survival Growth amp Fecundity 10070 S 10 028 033 038
Red Macroalga (Champia parvula) Reprod 10090 R 2 085 100 116
Methods for Acute Toxicityef
Fathead Minnow Larval Survival 20000 S 21 018 022 034
Ceriodaphnia (Cd) Survival 20020 S 23 018 035 041
Sheepshead Minnow Survival 20040 S 3 0 031 033
Inland Silverside Larval Survival 20060 S 5 0 033 035
Mysid (Ab) Survival 20070 S 3 029 038 043
Mysid (Hc) Survival 20110 S 2 021 026 031
Rainbow Trout Survival 20190 S 1 035 035 035
Daphnia magna (Dm) Survival 20210 S 5 009 036 047
Daphnia pulex (Dp) Survival 20220 S 6 021 038 061 a Cd = Ceriodaphnia dubia Ab = Americamysis (Mysidopsis) bahia Hc = Holmesimysis costata Dm = Daphnia
magna Dp = Daphnia pulex b G = growth S = survival R = reproduction F = fecundity
See publications EPA6004-89-001 (USEPA 1989) and EPA60044-91-002 (USEPA 1994b)d See publication EPA6004-91-003 (USEPA 1994a) and EPA6004-87028 (USEPA 1988) e See publications EPA6004-85013 (USEPA 1985) and EPA6004-90027F (USEPA 1993)f EPA did not assign method numbers for acute methods in EPA6004-90027F The numbers assigned here were
created for use in this document and in related materials and data bases
Effect concentrations having a p-percent effect are symbolized as ECp and may be calculated for sublethal and lethal (survival) endpoints (USEPA 19931994a1994b) Effect concentrations commonly estimated for WET methods are LC50 EC50 IC25 and EC25 The symbol ECp is more general and may be used to represent an LCp ECp or ICp endpoint To simplify presentation of results in this document the term EC25 is used to represent the concentration at which a 25-percent effect has occurred for either lethal
June 30 2000 3-5
c
Understanding and Accounting for Method Variability in WET Applications Under the NPDES Program
or sublethal endpoints The term LC50 is used to represent the concentration at which a 50-percent effect has occurred for lethal endpoints The EC25 for survival is not routinely used in generating self-monitoring data and is presented here for comparison to the EC25 for sublethal endpoints (ie IC25) Estimates of EC25 LC50 and NOEC were calculated for this document as required in the EPA test methods (USEPA 1993 1994a 1994b) A CV is reported for NOEC measurements in this document See Appendix A for further details
The results in Tables 3-2 through 3-4 were obtained as follows using as an example the EC25 of the growth endpoint in Method 10000 (fathead minnow larval chronic test) on the first row of Table 3-2 The CV of the EC25 estimates was calculated for each laboratory This calculation resulted in 19 CVs (one per laboratory with each laboratory tested using one toxicant) The sample percentiles were calculated for this set of 19 CVs In Table 3-2 the column headed ldquo50thrdquo shows the 50th percentile (median value) of CV found across these 19 laboratories the 50th percentile value is 026 In the column headed ldquo75thrdquo the 75th percentile CV is reported as 038 When a method is represented by fewer than four laboratories the minimum and maximum CVs are shown in the columns headed ldquo25thrdquo and ldquo75thrdquo respectively Note that these CVs represent within-laboratory variability and that Tables 3-2 through 3-4 show the quartiles and median of the within-laboratory CVs These tables thus report the typical range of within-laboratory test method variation
Variation across laboratories in the CV for effect concentration estimates (Tables 3-2 through 3-4) may be summarized as follows ignoring methods represented by only one or two laboratories [Refer to the column headed ldquo75thrdquo (the 75th percentile)]
For the EC25 of the growth and reproduction endpoints in chronic toxicity tests 75 percent of laboratories have a CV no more than 014 to 045 depending on the method (Table 3-2) For the two most commonly used methods (10000 fathead minnow larval chronic test and 10020 Ceriodaphnia chronic test) 75 percent of the laboratories have CVs no more than 038 and 045 respectively
For the LC50 of the survival endpoint in chronic toxicity tests 75 percent of laboratories have a CV no more than 012 to 035 depending on the method For the two most commonly used methods (10000 and 10020) 75 percent of laboratories have CVs no more than 031 and 029 respectively (Table 3-3) For the LC50 in acute toxicity tests 75 percent of laboratories have a CV no more than 019 to 029 depending on the method For the two most commonly used methods (20000 and 20020) 75 percent of laboratories have CVs no more than 019 and 029 respectively
For the NOEC of growth or reproduction endpoints in chronic toxicity tests 75 percent of laboratories have a CV no more than 043 to 057 depending on the method For the two most commonly used methods (10000 and 10020) 75 percent of laboratories have CVs no more than 053 and 049 respectively (Table 3-4) For the NOEC of survival in chronic toxicity tests 75 percent of laboratories have a CV no more than 024 to 055 depending on the method For the two most commonly used methods (10000 and 10020) 75 percent of laboratories have CVs no more than 048 and 043 respectively For the NOEC of survival in acute toxicity tests 75 percent of laboratories have a CV no more than 034 to 061 depending on the method For the two most commonly used acute methods (20000 and 20020) 75 percent of laboratories have CVs no more than 034 and 041 respectively
Appendix B discusses the range of toxicant concentrations reported as the NOEC For chronic toxicity tests most laboratories report the NOEC to within two to three concentration intervals and half the laboratories report most NOECs within one to two concentration intervals for reference toxicants For acute toxicity tests most laboratories report NOECs at one or two concentrations This outcome agrees with EPArsquos expected performance for these methods The normal variation of the effect concentration estimate in reference toxicant tests has been reported for some EPA WET methods (USEPA 1994a 1994b) to be plus or minus one dilution concentration for the NOEC and less for LC50
June 30 2000 3-6
Understanding and Accounting for Method Variability in WET Applications Under the NPDES Program
322 Between-Laboratory Variability of EC25 LC50 and NOEC
The data set compiled for this document provided reasonable estimates of between-laboratory variability for only a few methods For many methods and toxicants there were too few laboratories in the data base Additional summaries of between-laboratory variability of WET methods are included in the TSD (USEPA 1991a Part 133) and the WET methods manuals (USEPA 1994a 1994b) EPA also intends to provide new data in a forthcoming EPA between-laboratory study of promulgated methods
Using the data set credible estimates of between-laboratory variability could be made for a few toxicants and methods having data for six or more laboratories (Table 3-5) The statistical methods are described in Appendix B Table 3-5 shows values of the square root of within-laboratory and between-laboratory variance components (ie standard deviations F) The standard deviations and mean are expressed in units of toxicant concentration (eg gL or mgL) Between-laboratory Fb estimates the standard deviation for laboratory means of EC25 LC50 and NOEC The ldquoMeanrdquo column in Table 3-5 shows the mean of the laboratory means not the mean for all tests Because the number of tests differed among laboratories these two means are different These data suggest that between-laboratory variability (Fb) is comparable to within-laboratory variability (Fw) for the methods listed in the table
In Table 3-5 the ratio of Fb to the mean is an estimate of the relative variability (CVb) of laboratory means around their combined mean The ratio of Fw to the mean may approach the value of the average within-laboratory CV when the sample of laboratories is large but to characterize within-laboratory CVs readers should use Tables 3-2 through 3-4
Table 3-5 Estimates of Within-Laboratory and Between-Laboratory Components of Variabilitya
Test Methodb
Test EC Estimate Toxicant
End-Pointc Tests Labs
Within-lab FFW
Between-lab FFb Mean CVw CVb
10000 EC25 NaCl G 73 6 067 044 263 025 017
10000 LC50 NaCl S 73 6 114 045 415 027 011
10000 NOEC N Cl G 73 6 072 035 218 033 016
10000 NOEC NaCl S 73 6 096 051 243 040 021
10020 EC25 NaCl R 292 23 029 027 092 032 029
10020 LC50 NaCl S 285 23 048 024 178 027 013
10020 NOEC NaCl G 292 23 028 018 074 038 024
10020 NOEC NaCl S 292 23 047 026 142 033 018
10060 EC25 Cu G 130 9 451 524 974 046 054
10060 LC50 Cu S 130 9 484 707 1270 038 056
10060 NOEC Cu G 130 9 518 444 801 065 055
10060 NOEC Cu S 130 9 342 395 654 052 060
20000 LC50 NaCl S 154 14 105 124 746 014 017
20020 LC50 NaCl S 167 15 036 038 197 018 019 a F = within-laboratory standard deviation Fb = between-laboratory standard deviationw
CV = within-laboratory coefficient of variation CVb = between-laboratory coefficient of variationwb EPA did not assign method numbers for acute methods in EPA6004-90027F The numbers assigned here
were created for use in this document and in related materials and data bases G = growth S = survival R = reproduction
June 30 2000 3-7
c
Understanding and Accounting for Method Variability in WET Applications Under the NPDES Program
33 Variability of Endpoint Measurements
This section characterizes the within-laboratory precision of endpoint measurements (eg growth reproduction and survival) Endpoint variability in methods for chronic toxicity is characterized here using sublethal endpoints The sublethal endpoint was designed to be more sensitive than the survival endpoint and it incorporates the effect of mortality (ie it incorporates biomass) For example for the chronic survival and growth fathead minnow larval test the total dry weight at each replicate is divided by the original number of larvae rather than the surviving number of larvae
EPA reports measures of test precision based on the control CV [(control standard deviation)(control mean)] and the ldquoPercent MSDrdquo [100timesMSD(control mean)] symbolized as PMSD Recall that MSD the ldquominimum significant differencerdquo is calculated as [d EMS (2r)] where ldquodrdquo is the critical value of Dunnettrsquos statistic when comparing ldquokrdquo treatments to a control EMS is the error mean square from the analysis of variance of the endpoint responses and ldquorrdquo is the number of replicates at each concentration (USEPA 1993 1994a 1994b) These measures of test precision quantify within-test variability or the sensitivity of each test to toxic effects on the biological endpoint
Measures of variability relative to the control mean are used for two reasons First a laboratory having consistently large mean endpoint values for the control will also tend to have larger values of MSD and control standard deviation Second PMSD is readily interpreted as the minimum percent difference between control and treatment that can be declared statistically significant in a WET test A significant effect occurs when (control mean - treatment mean) exceeds the MSD Dividing by the control mean and multiplying by 100 states this relationship in terms of the percent difference between control and treatment
To characterize the distribution of values of PMSD values from all laboratories and toxicants for a given method and endpoint were combined and sample percentiles reported Percentiles are also reported for the CV of the control which also indicates variability among replicates under non-toxic conditions and may be a useful indicator of uniformity of the test organisms The sample percentiles are reported in more detail in Appendix B the 10th and 90th percentiles are shown in Table 3-6 Method 10090 (red macroalga) is omitted from Table 3-6 because it would be inadvisable to characterize method variability using only 23 tests from only two laboratories
The 90th percentile may be used as an upper PMSD bound (ie a limit on the insensitivity of a test) The 10th percentile may be used as a lower PMSD bound for declaring a significant difference or a lower limit to test sensitivity The 90th percentile has been used in other WET programs (Chapter 5) The 95th
percentile is used as a practical upper limit for the variability of analytical results in well-controlled between-laboratory studies that use a standard protocol and specific quality assurance procedures (ASTM 1992 1998 USEPA 1993 1996a 1996b) The tests summarized here have not been subjected to the rigorous standardization and quality assurance of collaborative studies and the data have not been screened for outliers as specified by ASTM Practices D2777 and E691 (ATSM 1992 1998) These considerations justify using the sample 90th percentile to set an upper bound A lower bound is necessary to avoid creating a disincentive for improving test precision and to objectively specify a limit to the test sensitivity achieved in practice If no more than ten percent of tests are more precise than this lower bound then in practice the analytical method rarely detects toxic effects of this small magnitude
When comparing values in Table 3-6 to a test result it is important that the testrsquos MSD be calculated according to procedures described in the EPA method manuals (USEPA 1993 1994a 1994b) for Dunnettrsquos test for multiple comparisons with a control (see Section 641) An analysis of variance (ANOVA) is conducted using several treatments including the control EPA methods require excluding from the ANOVA those concentrations for which no organisms survived in any replicate For a sublethal endpoint concentrations are excluded from the analysis if they exceed the NOEC for survival The MSD is calculated
June 30 2000 3-8
c
Understanding and Accounting for Method Variability in WET Applications Under the NPDES Program
using the square root of the error mean square (rEMS) from the ANOVA and using Dunnettrsquos critical value (which depends on the number of replicates and concentrations used in the ANOVA)
Table 3-6 Range of Relative Variability for Endpoints of Promulgated WET Methods Defined by the 10th and 90th Percentiles from the Data Set of Reference Toxicant Testsa
Test Methodb Endpointc No of Labs
No of Tests
PMSD Control CVd
10th 90th 10th 90th
10000 Fathead Minnow G 19 205 94 35 0035 020
10020 Ceriodaphnia dubia R 33 393 11 37 0089 042
10030 Green Alga G 9 85 93 23 0034 017
10040 Sheepshead Minnow G 5 57 63 23 0034 013
10060 Inland Silverside G 18 193 12 35 0044 018
10070 Mysid G 10 130 12 32 0088 028
20000 Fathead Minnow S 20 217 42 30 0 0074
20020 Ceriodaphnia S 23 241 50 21 0 011
20040 Sheepshead Minnow S 5 65 0e 55 0 0
20060 Inland Silverside S 5 48 70 41 0 0079
20070 Mysid (A bahia) S 3 32 51 26 0 0081
20110 Mysid (H costata) S 2 14 18 47 0 0074
20210 Daphnia (D magna) S 5 48 53 23 0 011
20220 Daphnia (D pulex) S 6 57 58 23 0 011 a The precision of the data warrants only three significant figures When determining agreement with these values one may
round off values to two significant figures (eg values gt345000 and 35000 are rounded to 35) Method 10090 (red macroalga) is not reported because it is inadvisable to characterize method variability using only 23 tests from just two laboratories
b EPA did not assign method numbers for acute methods in EPA6004-90027F The numbers assigned here were created for use in this document and in related materials and data bases G = growth R = reproduction S = survival
d CVs were calculated using untransformed control means for each test e An MSD of zero will not occur when the EPA flow chart for statistical analysis is followed In this report MSD was
calculated for every test including those for which the flow chart would require a nonparametric hypothesis test EPA recommends using the value 42 (the 10th percentile shown for the fathead minnow acute test) in place of zero as the 10th
percentile PMSD (lower PMSD bound) for the sheepshead minnow acute test
The MSD was calculated for all test results reported here including those for which non-normality and heterogeneity of variance were indicated Thus this document presents MSD as an approximate index of test sensitivity Estimates of power are also approximate The MSD generally will be related to test sensitivity even when the assumptions for ANOVA and Dunnettrsquos test are not strictly satisfied
Table 3-7 shows the number of laboratories in the WET variability data set having tests exceeding the upper PMSD bound reported in Table 3-6 One-half to two-thirds of the laboratories never or infrequently exceeded the bound and roughly one in five exceeded it in at least 20 percent of their tests By definition of the 90th percentile about 10 percent of all the tests exceeded the bound
June 30 2000 3-9
Understanding and Accounting for Method Variability in WET Applications Under the NPDES Program
Table 3-7 Number of Laboratories Having a Given Percent of Tests Exceeding the PMSD Upper Bound for the Sublethal Endpoint
Test Method No Labs Endpointsa
Number of Labs with Various Percentages of Tests Exceeding the PMSD Upper Bound
0 0-10 10-20 20-50 50-100
10000 Fathead Minnow 19 G 8 2 7 2 0
10020 Ceriodaphnia dubia 33 R 15 7 5 6 0
10030 Green Alga 9 G 6 1 0 2 0
10040 Sheepshead Minnow 5 G 3 1 0 1 0
10060 Inland Silverside 16 G 6 5 1 4 0
10070 Mysid (growth) 10 G 5 2 0 3 0 a G = growth R = reproduction
34 Conclusions about Variability of WET Methods
341 Variability of EC25 LC50 NOEC
For EC25 the quartiles of the within-laboratory CVs ranged across the promulgated methods from 009 to 045 and the median CV ranged from 013 to 038 For LC50 the quartiles of the within-laboratory CVs ranged from 007 to 035 and the median CV ranged from 008 to 028 For NOEC the quartiles of the within-laboratory CVs ranged from 0 to 061 and the median CV ranged from 018 to 046 This summary applies to those methods represented by at least 20 tests and three laboratories
EPA concludes from Tables 3-2 through 3-4 that point estimates are substantially less variable than the NOEC for the same method and endpoint and that the LC50 for an acute toxicity test usually is less variable than the LC50 for a chronic toxicity test The estimated NOEC is more variable than ECp using current experimental designs because NOEC can take only those values equal to the concentrations tested while ECp interpolates between tested concentrations (there may be other more technical reasons as well) In principle NOEC could be estimated more accurately and precisely by changing the experimental design to use more concentrations at narrower dilution ratios and by using more replicates The greater variability of the NOEC underscores the desirability of using point estimates to characterize effluent toxicity
Tables 3-2 through 3-4 may be used as benchmarks for variability allowing comparison of one laboratoryrsquos CV for reference toxicant testing with CVs reported by experienced laboratories reporting tests that passed the TAC However CVs for methods represented by too few laboratories in the table may be atypical
The CVs in Tables 3-2 through 3-4 may be used as an adjunct to the control chart If the CV for reference toxicant tests is above the 75th percentile in Tables 3-2 through 3-4 variability likely can be reduced even if the individual EC25 or LC50 values fall within the control limits If a control chart is constructed using an unreasonably large standard deviation the control limits will be unreasonable If a high CV is not fully explained by an unusually small mean the standard deviation of EC25 or LC50 should be reduced to bring the CV within the normal range If the CV exceeds the 90th percentile (Appendix B) there is no question that variability is unacceptably large Detailed guidance is provided in Chapter 5 (Section 5311)
Tables 3-2 through 3-4 indicate the magnitude of the analytical variability that becomes part of the variability of effluent test results under certain conditions This occurs when effluent test results (NOECs LC50s or EC25s) fall between the lowest and highest concentrations tested Under other conditions these
3-10 June 30 2000
Understanding and Accounting for Method Variability in WET Applications Under the NPDES Program
CVs may not accurately represent analytical variability If tests give results consistently near or at the lowest or highest concentrations tested or if the tests often produce ldquoless thanrdquo or ldquogreater thanrdquo results Tables 3-2 through 3-4 will not accurately characterize the analytical CV for such tests To measure the analytical CV under such conditions reference toxicant tests would have to be designed to have the effect concentration at or near the lowest or highest concentration The CV and standard deviation measured under such conditions are unknown but are likely to differ from those for standard reference toxicant tests
The data set did not contain information supporting an analysis of the causes of between-laboratory variability Possible causes may include laboratory differences in concentration series incorrect or ambiguous calculation or reporting of concentrations (eg concentration of the metal ion versus the salt) laboratory differences in dilution water (eg water hardness or pH) laboratory differences in foods and feeding regimes and laboratory differences in cultures (genotypic and phenotypic differences in sensitivity to various toxicants)
The lack of a standard or common reference toxicant creates a problem for permittees and regulatory authorities attempting to evaluate and compare laboratories Real or apparent differences occur between laboratories in the mean values of EC25 LC50 and NOEC Some of this difference is random and reflects only the within-laboratory variance some may be systematic Systematic between-laboratory differences can be inferred reliably only when laboratories use the same test method use the same reference toxicants and dilution series use similar dilution waters and report a sufficient number of tests
342 Variability of Endpoint Measurements
EPA has selected the PMSD to characterize endpoint variability for WET test methods because it integrates variability from several concentrations (always including the control) and it represents the MSD used in the WET hypothesis test The control CV by itself does not fully represent the variability affecting a WET hypothesis test or point estimate The PMSD also represents the variability affecting point estimates because it is calculated using the EMS for the endpoint measurement (However the standard error of a point estimate of an effect concentration may be a complicated function of the EMS)
PMSD for sublethal endpoints ranged from 6 to 37 across the promulgated chronic methods For the fathead minnow chronic method PMSD ranged from 9 to 35 for the Ceriodaphnia chronic method PMSD ranged from 11 to 37 Thus most chronic tests were able to distinguish a reduction of 37 percent or smaller in the endpoint Further analysis in Chapter 5 shows that most tests were unable to distinguish consistently a 25-percent reduction For the survival endpoint of promulgated acute methods PMSD ranged from 0 to 55 For the two most commonly used acute methods (fathead minnow and Ceriodaphnia) PMSD ranged from 4 to 30 and from 5 to 21 respectively Thus PMSD varied markedly for some acute methods and not for others
As shown by the size of PMSD test sensitivity to detect substantial toxic effects is occasionally insufficient at some laboratories and routinely insufficient at a few laboratories Inadequate test sensitivity is not always signaled by control charts of EC25 LC50 and NOEC Laboratories should consider maintaining control charts for MSD or PMSD and should report MSD and the control mean with all WET tests
Some portion of MSDs in the WET variability data set could be considered exceptionally large if not outliers This observation underscores the importance of a careful review for each WET test including an examination of means and standard deviations for endpoint responses at each concentration the plotting of replicate data (not just concentration means) and when necessary a search for possible causes of excessive variability The tables and plots in the promulgated methods (USEPA 1994a 1994b) provide good examples
June 30 2000 3-11
Understanding and Accounting for Method Variability in WET Applications Under the NPDES Program
This page intentionally left blank
3-12 June 30 2000
40 VARIABILITY IN CONTEXT
EPA manages the regulation of WET in the same way it manages the regulation of chemical-specific pollutants in order to determine reasonable potential (RP) derive permit limits determine data quality control and evaluate self-monitoring data Many similarities between chemical-specific toxicant and WET controls can be found in the TSD (USEPA 1991a) Determining RP in both cases uses many of the same strategies Permit limit derivation makes similar exposure assumptions and relies on nearly identical toxicological data bases
Considering a value other than the best analytical estimate as a measure for WET or for specific chemical analytes is inappropriate All analytical results in either chemical-specific analyses or WET tests incorporate some estimated range of uncertainty While infrequently discussed for chemical methods uncertainty does play a role in the meaning of analytical results One end of the confidence interval likely will be less protective of aquatic resources than the other The derived limit and therefore final reported analytical results become the best estimate of the actual ecological need and assessment of the effect
Significant debate has occurred over assertions that WET data have too much inherent variability for reliable use in the NPDES program This debate has engendered considerable evaluation of WET precision Groups of scientists and individual researchers have repeatedly concluded that currently promulgated WET methods are technically sound and that the observed precision is within the range of precision of other analyses frequently required in NPDES permits (Grothe et al 1996) The findings of some of the significant sources of these conclusions are summarized below
41 Society of Environmental Toxicology and Chemistry Pellston WET Workshop
The 1995 Society of Environmental Toxicology and Chemistry (SETAC) Pellston Workshop on Whole Effluent Toxicity convened 47 experts in the discipline to assess applied methods and their application in the regulatory process Representation at the workshop was intentionally balanced among government business and academic participants These scientists published consensus conclusions and recommendashytions including the following
411 General Conclusions and Recommendations
Grothe et al (1996) state ldquoExisting WET testing methods (USEPA 1985 USEPA 1988 USEPA 1989) are technically sound but certain modifications would improve endpoint interpretation Such changes involve implementing improvements to currently used statistical procedures establishing acceptable limits for MSD values and adding confidence limits to WET test endpointsrdquo
ldquoA number of problems with WET tests are caused by misapplication of the tests misinterpretation of the data lack of competence of the laboratories conducting WET testing poor conditionhealth of test organisms and lack of training of laboratory personnel regulators and permittees More widespread use of WET related guidance provided in USEPArsquos TSD (1991a) would help alleviate some of these problems In addition an effective QAQC program will improve data quality and reduce test variabilityrdquo
ldquoIncrease training opportunities for regulators and permittees to improve the implementation of WET objectives and to promote national consistency in permitting and compliance issuesrdquo
June 30 2000 4-1
Understanding and Accounting for Method Variability in WET Applications Under the NPDES Program
ldquoImplement a broadly based and standardized QAQC program to improve WET testing performance and data qualityrdquo
ldquoQuantify the lsquoconfidencersquo around test endpoints to improve interpretation of WET test results Specific statistical methods that could improve precision are presented in Chapter 3 of this document and processes to reduce variability are discussed in Chapter 5 In addition WET tests should be performed using a dilution series of exposure concentrations to establish a dose-response relationshiprdquo
412 Conclusions about Data Precision
Ausley (1996) compared CVs of chemical analyses and aquatic toxicity tests conducted by North Carolina NPDES permittees Ausley found that CVs of reported values for chemical analytes (including metals organic analytes and non-metal inorganic analytes) ranged from 118 percent to 2917 percent Coefficients of variation for toxicity parameters (acute and chronic Ceriodaphnia dubia acute and chronic Pimephales promelas acute Daphnia pulex and acute Mysidopsis bahia) ranged from 148 percent to 676 percent From this review he concluded that ldquothe precision of toxicity analyses is within the range of that being reported for commonly analyzed and regulated chemical parametersrdquo Ausley highlighted the difficulty in comparing precision estimates of chemical analytes and WET analyses (particularly NOECs) noting that while chemical precision is often determined well above analytical detection WET precision is often based on the minimum detection level An assumption that WET precision will vary among toxicants is also logical To establish ldquoinherent variabilityrdquo considering toxicants that cause minimal variability in the analysis may be appropriate The high coefficients of variation for some chemical parameters reported by Ausley reflect the fact that in practice analytical precision can vary widely in individual studies in which the effects of a single (or a few) poorly operating laboratory can adversely affect precision estimates In practice this kind of data must be screened for quality prior to use to evaluate self-monitoring data or estimates of overall method quality
Ausleyrsquos results closely approximate analytical precision of chemical analytes referenced in the TSD (USEPA 1991a Chapter 12) The CVs for metals (aluminum cadmium chromium copper iron lead manganese mercury silver and zinc) ranged from 18 percent to 129 percent at the low end of the measurement detection range Between-laboratory CVs for organic analytes ranged from greater than 12 percent to 91 percent The CVs for non-metal analytes (alkalinity residual chlorine ammonia nitrogen Kjeldahl nitrogen nitrate nitrogen total phosphorus biological oxygen demand chemical oxygen demand and total organic carbon) ranged from 46 percent to 70 percent in between-laboratory studies of precision
Burton et al (1996) concluded that ldquoUSEPA-published methods are functional and appropriate in the context of effluent toxicity control programsrdquo They recommended developing limits on within-test variability a quality assurance and audit program and guidance for permittee procurement of WET analytical services
Denton and Norberg-King (1996) cited various studies that favorably compare WET methods with chemical analytical methods (Grothe and Kimerle 1985 Rue et al 1988 Morrison et al 1989 Grothe et al 1990) They proposed that improvements in test result consistency could be accomplished by limiting the range of within-test variability through controls of upper and lower statistical power (eg limits on test MSD) Three practices to control within-test variability most effectively are (1) controlling within-test sensitivity (2) following well-defined test methods and (3) maintaining communication within the regulatory community For example the permittee and regulatory authorities should discuss any facility-specific issues to fully characterize the appropriate permit conditions
June 30 2000 4-2
Understanding and Accounting for Method Variability in WET Applications Under the NPDES Program
42 Water Environment Research Foundation Study
Another publication ldquoWhole Effluent Toxicity Testing Program Evaluation of Practices and Implementationrdquo (DeGraeve et al 1998) presents the results of a survey of publicly owned treatment works and State regulatory programs about WET issues The Water Environment Research Foundation (WERF) sponsored this study Conclusions by DeGraeve et al (1998) include the following
ldquoThe project team believes that the results demonstrate that the test methods can be routinely completed successfully by well-trained competent WET testing laboratories and that the results considered collectively suggest that the test methods that are being used to measure WET are technically soundrdquo
ldquoThere is a need for better trainingguidance in WET-related issues for both the regulatory staff responsible for implementing WET requirements and for permittees responsible for meeting WET limitsrdquo
DeGraeve et al (1998) considered the conclusions of the SETAC Pellston WET publication concurring that between-laboratory CV values of toxicity test methods were low training of regulatory and permittee staff is needed nationally and strengthened quality assurance (QA)quality control (QC) practices could improve performance of analyses Unlike the SETAC Pellston WET conclusions they found that there are enough laboratories to meet the current market demand for analyses Like the SETAC effort DeGraeve et al (1998) concluded that a national center of expertise on WET issues would be beneficial to provide guidance to regulatory agencies permittees and laboratories
WERF also funded a project entitled ldquoWhole Effluent Toxicity Testing Methods Accounting for Variancerdquo (Warren-Hicks et al 1999) This study compared within- and between-laboratory results of reference toxicant test variation as measures of reproducibility and comparability respectively The authors concluded that some laboratories could consistently reproduce test results while others could not and inferred that test precision is a factor of laboratory experience and not inherent methodological weakness The authors recommended that national studies be conducted to evaluate within- and between-laboratory precision of promulgated WET test methods (EPA has already initiated this study) They also recommended that additional test acceptability criteria (TAC) such as upper and lower bounds of MSD be established and incorporated in the NPDES process The latter recommendation corroborates other researchersrsquo recommendations discussed above
43 Minimizing Variability by Adhering to WET Toxicity Test Methods
Specific factors that affect variability in WET analyses have been described in several papers (Burton et al 1996 Ausley 1996 Erickson et al 1998 Davis et al 1998) The most important initial consideration in developing precise data is a laboratoryrsquos experience and success in performing a specific analysis Most critical reviews of WET data precision emphasize this initial consideration Experienced professionals most likely will be able to develop the most consistent and reliable information and can interpret anomalous conditions in the testing or results
An additional factor in considering WET test method variability is whether the prescribed methods (eg the EPA toxicity test methods promulgated in 40 CFR Part 136) are being followed appropriately (see Chapter 5) If tests are submitted that do not meet specified TAC or are produced when laboratory QA testing indicates analyses are beyond control limits these results should not be used in the NPDES process Tests performed on effluent samples that have not met required temperature maxima or holding times should not be considered for regulatory purposes Rigorous QA practices are critical to the success of any analytical program Both the regulatory authority and permittee should strive to ensure that such practices are in place
June 30 2000 4-3
Understanding and Accounting for Method Variability in WET Applications Under the NPDES Program
for any program developing WET data whether by national laboratory accreditation State regulatory certification direct permittee oversight or specific contractual agreement with the laboratory
Comparisons of WET method precision with analytes commonly limited in NPDES permits clearly demonstrate that the promulgated WET methods are within the range of variability experienced in other analyses Several researchers also noted clear indications that method performance improves when prescribed methods are followed closely by experienced analysts (Grothe et al 1996 DeGraeve et al 1998)
A review of WET test results confirms that imprecise WET data are being reported As with any analytical technique inexperienced individuals can perform analyses incorrectly or fail to follow appropriate methods and quality assurance practices Using the training that is available for these methods and quality assurance techniques referenced by this document will help ensure that data of maximum reliability are used and that sound decisions are made based on those results The Western Coalition of Arid States conducted a study in 1997 (Moore et al 2000) which reported the results of 16 tests with a non-toxic test sample using the Ceriodaphnia dubia chronic test These results indicated that 43 percent of the tests showed toxicity EPA is in the process of reviewing the paper and the raw data
Persons interested in WET issues may consult another source of information developed by the SETAC Whole Effluent Toxicity Expert Advisory Panels This group established under a cooperative agreement with EPA provides scientific opinion and training on WET technical issues This information is available on the Internet at the SETAC web site httpwwwsetacorg Appendix D contains frequently asked questions with answers prepared by the SETAC WET Expert Advisory Panels The expert panels have identified and discussed various factors that affect WET variability
44 Conclusion
When the variability of WET analyses is viewed in the context of the NPDES program these techniques produce data that are as precise as those from chemical analyses As with any other analytical system lack of experience in performing the analyses adherence to prescribed QA practices or good laboratory practices will reduce the precision of the results Studies of these factors by independent researchers from both the regulatory and regulated communities support these conclusions While examples of poor-quality highly variable results from chemical analyses have also been publicized these results are frequently influenced by the shortcomings mentioned above Permittees that must generate and use WET data should become well-educated in data quality interpretation and permittees should require that QC practices be followed by laboratories generating the data Various sources of information presented in this chapter should assist permittees testing laboratories and regulatory authorities with this education process Examples of practices that can further reduce the imprecision of analyses are also discussed in Chapters 5 and 6 of this document Additional refinements of TAC can likewise improve test power to detect effects (or the lack thereof) and increase the statistical confidence in results
June 30 2000 4-4
50 GUIDANCE TO REGULATORY AUTHORITIES LABORATORIES AND PERMITTEES GENERATING AND EVALUATING
EFFECT CONCENTRATIONS
51 Steps for Minimizing Test Method Variability
This chapter provides the background and recommendations on WET test procedures related to sampling conducting the toxicity test methods and conducting the statistical methods Implementing these recommendations should decrease or minimize WET test method variability thereby increasing confidence to make regulatory decisions (see Figure 5-1) EPA stands behind the technical soundness of the current WET test methods The critical steps in minimizing WET test method variability are (1) obtaining a representative effluent sample (2) conducting the toxicity tests properly to generate the biological endpoints and (3) conducting the appropriate statistical analysis to obtain powerful and technically defensible effect concentrations Minimizing variability at each step increases the reliability of the WET test results For example factors that affect variability include sampling procedures sample representativeness deviations from standardized test conditions (eg temperature test duration feeding) test organisms source of dilution water and analyst experience and technique in conducting the toxicity tests properly (Burton et al 1996)
52 Collecting Representative Effluent Samples
The goal of effluent sampling is to obtain a representative sample that reflects real-world biological responses Factors affecting the representativeness of effluent samples may include the sampling location frequency and type (eg composite or grab) and sample volume container preservation methods and holding time Burton et al (1996) concluded that the above factors considerably influence test result variability
Effluent samples must be collected at a location that represents the entire regulated flow or discharge Typically the sampling site is designated in the discharge permit As with sampling for any parameter effluent samples should be collected from a location where the flow is turbulent and well-mixed Additionally effluent samples should be collected at a frequency that enables adequate characterization of the discharge over time (eg accounts for daily to seasonal changes and variations in effluent quality) Major facilities should conduct WET testing monthly or quarterly while minor facilities should conduct WET testing semi-annually or annually
Appropriate sample types should be collected to represent the effluent fully When the effluent is variable collecting composite samples may be necessary When the effluent is less variable grab samples may be sufficient (eg from long-term retention pond facilities)
Sample containers should be non-reactive so that they do not affect sample characteristics Table II of 40 CFR Part 136 requires that toxicity test samples be collected in glass or plastic containers as specified in the methods Sufficient sample volume should be collected for the type of test being conducted including the number of test dilutions When samples are collected in Cubitainersreg headspace should be minimized
Samples must be properly preserved Part 136 of 40 CFR requires that samples for WET testing be cooled to 4EC when shipped off-site and between test sample renewals Samples must be cooled during all phases of collection transportation and storage to minimize physicochemical changes Samples must be tested within the specified maximum holding times before significant changes occur such as volatilization or biological or chemical degradation If samples are not tested within specified maximum holding times the test is invalid and must be repeated by collecting a new effluent sample and conducting a new toxicity test to comply with the NPDES permit
June 30 2000 5-1
Understanding and Accounting for Method Variability in WET Applications Under the NPDES Program
Figure 5-1 Steps to minimize WET test method variability
53 Conducting the Biological Test Methods
Four main components of WET tests afford opportunities to control and minimize variability within tests and within and between laboratories (1) quality control (QC) procedures (2) experimental design (3) test power and (4) test acceptability criteria (TAC) beyond the minimum requirements specified in EPArsquos WET test methods
June 30 2000 5-2
Understanding and Accounting for Method Variability in WET Applications Under the NPDES Program
531 Quality Control Procedures
Quality assurance (QA) practices for toxicity tests address all aspects of the tests that affect data quality These practices include effluent sampling and handling test organism source and condition equipment condition test conditions instrument calibration replication use of reference toxicants recordkeeping and data evaluation The EPA WET toxicity testing manuals specify the minimum requirements for each aspect Regulatory authorities have the discretion to prepare and implement additional guidance beyond the minimum requirements specified in EPArsquos WET test methods
An integral part of the QA program is quality control (QC) The QC procedures are the more focused and routine activities conducted under the overall QA program An important QC component in WET testing is the requirement to conduct reference toxicant tests with effluent tests The WET test methods outline when reference toxicant tests are to be conducted (See sections on quality of test organisms in the manuals) Reference toxicant testing serves two purposes (1) determine the sensitivity of the test organisms over time and (2) assess the comparability of within- and between-laboratory test results Reference toxicant test results can be used to identify potential sources of variability such as test organism health differences among batches of organisms changes in laboratory water or food quality and performance by laboratory technicians In the QA section of each promulgated test method (USEPA 1993 1994a 1994b) EPA recommends sodium chloride potassium chloride cadmium chloride copper sulfate copper chloride sodium dodecyl sulfate and potassium dichromate as suitable reference toxicants The methods do not however specify a particular reference toxicant or the specific test concentrations for each test method
The current characterization of WET test method variability is limited by the ability to quantify sources of within- and between-laboratory variability because laboratories can use different reference toxicants and test concentrations for a particular method Future evaluations of method variability would be greatly enhanced by having data to analyze from multiple laboratories for the same reference toxicant the same dilution water at similar pH and hardness and the same test concentrations By standardizing reference toxicants testing laboratories could compare test results permittees and regulatory authorities could better compare and evaluate laboratories and the data could be used to further quantify within- and between-laboratory test precision Specification of the reference toxicant and test concentrations for a method across laboratories would provide a much larger and consistent data base to assess the comparability of within- and between-laboratory test results
Standardizing reference toxicants and test concentrations has been discussed in the literature For example the chronic methods manual for West Coast species (USEPA 1995) specifies the reference toxicant and test concentrations for each test species The Southern California Toxicity Assessment Group (SCTAG) is comprised of representatives from permittees testing laboratories regulatory authorities and academic institutions that met to discuss technical aspects of WET testing (eg standardization of reference toxicants control charts) The SCTAG (1996) prepared a report to standardize reference toxicants for the chronic freshwater test methods This report evaluated an extensive data base of reference toxicant data The report recommended specific reference toxicants and test concentrations for these methods The SCTAG (1997) also prepared a QAQC checklist to help toxicity testing laboratories establish and maintain appropriate data quality measures Regulatory authorities should review these publications when standardizing reference toxicants
The selection of reference toxicants and test concentrations should be based on specific criteria The following criteria recommended in the SCTAG report provide an excellent basis for selecting standardized reference toxicants
1 The toxicant should provide precise and reliable measures of toxicological sensitivity
2 Toxicant disposal should not be legally or environmentally problematic
June 30 2000 5-3
Understanding and Accounting for Method Variability in WET Applications Under the NPDES Program
3 The toxicant should produce a concentration-response effect for the test organism
4 The toxicant should be quantifiable
5 The toxicant should not pose an unacceptable health hazard to laboratory personnel
6 The toxicant should be readily available
Most recently Warren-Hicks et al (1999) recommended that national acceptance criteria be specified with upper and lower acceptance limits for reference toxicant test results which all laboratories would need to achieve to obtain accreditation Variability could decrease nationally if testing laboratories are provided with more detail on the evaluation and interpretation of reference toxicant control charts (APHA-AWWAshyWEF 1998) For example such guidance could describe how to evaluate test results within the warning limits Both Environment Canada (1990 2000) and APHA-AWWA-WEF (1998) have prepared guidance on evaluating control chart data The Environment Canada (2000) report specifies using zinc as an inorganic reference toxicant and phenol as an organic reference toxicant for many aquatic tests The report also specifies eight criteria for selecting specific reference toxicants
1 Previous use
2 Availability in a pure form
3 Solubility
4 Stability in solution
5 Stability during storage
6 Ease of analysis
7 Stable toxicity with normal changes in qualities of laboratory water
8 Ability to detect abnormal organisms
Regulatory authorities may want to evaluate the above reports and the SCTAG reference toxicant recommendations for the chronic freshwater test methods Regulatory authorities may also want to evaluate and recommend a standard reference toxicant and a specific concentration series for each acute and chronic test method using data from this guidance document
5311 Guidance Related to Quality Control Charts and Laboratory Audits
Ausley (1996) recommends some oversight of data quality such as evaluating tests in meeting QC criteria using randomization procedures and operating in allowed reference toxicant ranges to ensure that QC procedures are properly implemented Another integral component of QC is the maintenance of control charts for reference toxicants and effluents Laboratories should provide regular review of control charts EPA suggests keeping a control chart for each combination of test material test species test conditions and endpoints with a maximum of 20 test results Modern software makes accumulating data and reviewing key test statistics possible with relatively little effort Elementary methods can identify problems contributing to variability Laboratories should practice regular control charting of test PMSDs and control performance for all tests along with control charting of effect concentrations such as NOEC and point estimates for reference toxicants tests Successive tests should be compared occasionally to detect repeated patterns such as one replicatersquos being consistently higher or aberrant or a trend over time Time sequence plots of concentration means and standard deviations would be useful in this regard Occasionally a set of 5 to 20 tests in which block positions (see Appendix A in USEPA 1994b) have been recorded should be subjected to ANOVA for block or position effects If such effects are significant or large the laboratory should seek advice on randomizing the replicates and concentrations
June 30 2000 5-4
Understanding and Accounting for Method Variability in WET Applications Under the NPDES Program
If a laboratoryrsquos CV exceeds the 75th percentile CV from Tables 3-2 through 3-4 EPA recommends calculating warning and control limits based on the 75th and 90th percentiles respectively of CVs for the method and endpoint (Tables 3-2 and 3-3 and Appendix Tables B-1 and B-2) For example suppose the mean EC25 for a series of Ceriodaphnia chronic tests (Method 10020 with reproduction as the endpoint) conducted at one laboratory with reference toxicant is 134 gL NaCl Also suppose that the standard deviation of the EC25s for these tests is 085 The CV for this set of EC25s is thus 063 In Table 3-2 the 75th percentile of CVs for this testrsquos reproduction endpoint is 045 Calculate the standard deviation corresponding to the 75th percentile CV SA75 = 134 times 045 = 060 In Appendix Table B-1 the 90th
percentile of CVs is 062 for this method and endpoint Calculate SA90 = 134 times 062 = 083 Because the CV for this series of EC25s exceeds the 90th percentile reported in Table B-1 EPA recommends the following
bull Set control limits using SA90 = 083
bull Set warning limits using SA75 = 060
bull Promptly take actions to bring results within the control limits and
bull Attempt to bring results within the warning limits in 3-12 months
If the CV for the set of EC25s is less than the 90th percentile reported in Table B-1 use that CV to set control limits If the CV for the set of EC25s is less than the 75th percentile in Table 3-2 do not set warning limits using the latter value
In addition Burton et al (1996) encourage regulatory programs to have a laboratory audit component to document the existence and effectiveness of a QAQC program directed at toxicity testing including analyst training and experience Regulatory authorities should use the National Environment Laboratory Accreditation Program (NELAP) (USEPA 1999a) and routine performance audit inspections to evaluate individual laboratory performance Inspections should evaluate the laboratoryrsquos performance with QC control charts based on reference toxicants examine procedures for conducting the toxicity test procedures and examine procedures for analyzing test results
Regulatory authorities should develop a QC checklist to assist in evaluating and interpreting toxicity test results Appendix E presents examples of State WET implementation procedures related to reviewing reference toxicant data and information on additional QAQC criteria that have been developed and implemented Regulatory authorities should also provide additional guidance related to the interpretation of QC control charts This additional guidance could be that laboratories maintain control charts on within-test variability (eg PMSD) and use warning and control limits based on the 75th and 90th percentiles of CVs for the test method and endpoint
532 Experimental Design
Experimental design includes randomizing the experimental units (ie treatments organisms replicates) establishing the statistical significance level (ie alpha level) and specifying the minimum numbers of replicates test organisms and treatments Oris and Bailer (1993) recommend that test design and TAC be based not only on a minimum level of control performance but also on the ability to detect a particular level of effect (ie test power)
A Type I error (ie ldquofalse positiverdquo) results in the false conclusion that an effluent is toxic when it is not toxic A Type II error (ie ldquofalse negativerdquo) results in the false conclusion that an effluent is not toxic when it actually is toxic Power (1 - beta) is the probability of correctly detecting a true toxic effect (ie declaring an effluent toxic when it is in fact toxic) Acceptable values for alpha range from 001 to 010 (1 to 10 percent) The current EPA test methods recommend an alpha rate of 005 or 5 percent in the toxicity
June 30 2000 5-5
Understanding and Accounting for Method Variability in WET Applications Under the NPDES Program
testing manuals Currently EPA is preparing guidance on when an alpha rate of 001 or 1 percent would be considered acceptable (USEPA 2000a)
5321 False Positives in WET Testing
The hypothesis test procedures prescribed in EPArsquos WET methods provide adequate protection against incorrectly concluding that an effluent is toxic when it is not The expected maximum rate of such errors is the alpha level used in the hypothesis test The hypothesis test procedure is designed to provide an error rate no greater than alpha when the default assumptions are met The statistical flow chart provided with each EPA WET method identifies cases when default assumptions are not satisfied and therefore when data transformations or alternative statistical methods (eg a nonparametric test) should be used
Alpha and beta are related (ie as alpha increases beta decreases) assuming that the sample size (number of treatments number of replicates) size of difference to be detected and variance are held constant The alpha and beta error rates depend on satisfying the assumptions of the hypothesis test To ensure that statistical assumptions and methods are properly applied testing laboratories should review the statistical procedures used to produce WET test results and other factors such as biological and statistical quality assurance and verify that test conditions and test acceptability criteria were achieved
If a test is properly conducted and correctly interpreted identifying any particular outcome as a ldquofalse positiverdquo is impossible An effluent that is deemed toxic may require that the permittee conduct additional toxicity tests to determine if toxicity is re-occurring Even if no toxicity is demonstrated in follow-up tests that does not rule out that the original toxic event was a true toxic spike in the effluent False negatives however impact the environment by allowing the discharge of harmful toxicants without identification This may occur because the toxic effects are not identified as statistically significant due to lack of test sensitivity (see Sections 533 and 64)
Measurement error should not affect the protection against false positives provided by hypothesis tests and confidence intervals when they are appropriately applied Measurement error in the case of WET test treatment mean values likely consists largely of sampling errors (eg variability among organisms or containers) although errors in counting weighing and other procedures may also occur Such sources of imprecision are implicitly accounted for in WET test statistical inferences because the sample variance among the replicates within each treatment (dilution) is used for inference The test ldquosizerdquo 1 - alpha will protect adequately against false positives A larger variance among replicates however could make detecting real toxicity (ie false negatives) more difficult unless the number of replicates is increased to provide more test sensitivity and power which will reduce the rate of false negatives
5322 False Negatives in WET Testing
For a given alpha beta decreases (power increases) as the sample size increases and the variance decreases Decreasing alpha from 005 to 001 without otherwise changing the hypothesis test will reduce the ability of the test to detect toxicity that is will reduce the power of the test Thus as alpha for the hypothesis test is decreased there is an inevitable trade-off between the rate of false positives when toxicity is not present and the ability to detect toxicity when it is present (ie statistical power)
To limit within-test variability and thus increase power EPA developed a minimum significant difference (MSD) criterion that must be achieved in the chronic West Coast marine test methods (USEPA 1995) The MSD is a measure of the within-test variability and represents differences between treatments and the control that can be detected statistically Distributions of the MSD values of multiple tests for a specific reference toxicant and test method can be used to determine the level of test sensitivity achievable by a certain percentage of tests Denton and Norberg-King (1996) analyzed several chronic test methods to quantify the effect size based on the existing toxicity test method experimental design and MSD distributions
June 30 2000 5-6
Understanding and Accounting for Method Variability in WET Applications Under the NPDES Program
Denton and Norberg-King found when setting the beta error rate at 020 (power = 080) the effect size detected varies from at least a 15-percent reduction from the control response for the chronic red abalone larval development test to a 40-percent reduction from the control response for the chronic Ceriodaphnia dubia test In this document EPA has calculated power for each test method (see Section 533)
533 Test Power To Detect Toxic Effects
This section describes the statistical power and ability to detect toxic effects achieved by the current WET methods as inferred from the WET variability data set used to develop this document These inferences are approximate because assumptions of normality and homogeneity of variance were not always satisfied
Power can be characterized only by repeated testing Power is an attribute not of a single test but of a sequence of many tests conducted under similar conditions and with the same test design Therefore in this document EPA used the sample averages for each laboratoryrsquos data set to characterize each laboratory The following two parameters were required (1) the mean endpoint response in the control (growth reproduction survival) and (2) the mean value of the error mean square (EMS) for tests
EPA evaluated the ability to detect toxic effects using three approaches for each test method (1) number of replicates required to detect a 25-percent difference from the control with power of 080 (2) percent difference from the control that can be detected with power of 080 and (3) power to detect a 25shypercent difference from the control All calculations are based on a one-sided two-sample t-test at a level of 095 (alpha of 005) The power for a multiple comparison (Dunnettrsquos or Steelrsquos test) will be less than the power for this two-sample t-test
Table 5-1 summarizes the results for this evaluation Depending on the method between 30 percent and 80 percent of the laboratories were able to detect a 25-percent effect for the sublethal endpoint consistently Between 60 percent and 100 percent of the laboratories were able to detect a 33-percent effect
To examine whether the upper bounds presented in Table 3-6 provide adequate test precision EPA calculated an estimate of the power to detect a 25-percent effect on a sublethal endpoint when the PMSD equals the upper bound reported in Table 3-6 The upper bounds of the PMSD are shown in Table 3-6 in Chapter 3 At the lower PMSD bound the power always exceeded 098 Tests with PMSD equaling the upper bound are not often able to detect a 25-percent effect This finding does not mean that the upper bound is ineffective The PMSD varies between tests and each laboratory has a distribution of PMSDs To avoid exceeding this upper bound often a laboratory would have to achieve substantially lower PMSDs in most tests
5331 Attainment of the PMSD Related to Power
The power of the current experimental design could be reevaluated by comparing it to alternative designs that use increased number of replicates or number of test concentrations (Chapman et al 1996) In this document EPA found that about half of the laboratories in the data set were able routinely to detect a 25-percent difference between control and treatment About two-thirds of the laboratories could routinely detect a 33-percent difference (Table 5-2) For example mere attainment of the 90th percentile PMSD values shown in Table 3-6 will not ensure the ability to detect a 25-percent effect (Table 5-2) If every acceptable test has a PMSD below that upper bound however the average PMSD will be lowered Based on the within-laboratory variability of PMSD1 the average PMSD likely will be substantially lower than the upper bound in Table 3-6 if most tests conducted by a laboratory are to have acceptable PMSDs
The average CV for PMSD is one-third to one-half its mean in commonly used methods
June 30 2000
1
5-7
Understanding and Accounting for Method Variability in WET Applications Under the NPDES Program
Table 5-1 Tests for Chronic Toxicity Power and Ability To Detect a Toxic Effect on the Sublethal Endpoint
Test Method No
Labs
No Labs with Power
Power (Range)
No Labs Having Power at Least 08 To Detect
Effect of
Effect Detected with Power 08 as Percent of
Control Mean (Range)$$ 08 $$ 05 25 33
10000 Fathead Minnow 19 6 14 021 - 100 6 13 82 - 62
10020 Ceriodaphnia 33 10 29 038 - 100 10 19 14 - 45
10030 Green Alga 9 7 8 033 - 099 7 8 13 - 49
10040 Sheepshead Minnow 5 4 5 077 - 100 4 5 86 - 26
10060 Inland Silverside 16 7 13 023 - 097 7 12 17 - 59
10070 Mysid (growth) 10 5 8 021 - 091 5 8 21 - 70
Note Power was calculated for a two-sample one-sided t-test at alpha = 005 for a 25-percent difference from the control Effect size detected was calculated for the same test using power 080 Calculations used the average EMS from all tests at each laboratory and the minimum number of replicates reported for those tests Calculations assumed that the parametric mean and variance equal the corresponding sample estimates They also assumed approximate normality of means and homogeneity of variance Because these assumptions may be violated the results here are approximate By saying ldquodetect a 25-percent difference from controlrdquo this alternative hypothesis is intended (control mean - treatment mean) gt 025 times control mean
Table 5-2 Power To Detect a 25-Percent Difference from the Control at the 90th Percentile PMSD
Chronic Method Replicates 90th Percentiles
of PMSD
Three Treatments
Four Treatments
Five Treatments
alpha = 005
alpha = 0053
alpha = 005
alpha = 0054
alpha = 005
alpha = 0055
10000 Fathead Minnow 3 35 039 025 039 019 039 015
4 35 041 030 042 026 043 023
10020 Ceriodaphnia 10 37 039 031 041 030 043 030
10030 Green Alga 3 35 039 025 039 019 039 015
4 35 041 030 042 026 043 023
10040 Sheepshead Minnow 3 23 072 069 072 062 073 055
4 23 073 071 074 068 075 066
10060 Inland Silverside 3 23 072 069 072 062 073 055
4 23 073 071 074 068 075 066
10070 Mysid 8 32 048 041 050 040 052 040
Notes Values are rounded to two significant figures Number of treatments is the number of concentrations compared with the control in the hypothesis test The calculations assumed (1) the usual assumptions of the test are satisfied (approximate normality homogeneity of variances) and (2) equal replication in treatments and control Because these assumptions may be violated the results here are approximate Because the MSDmean implies a value for [root (error mean square)mean] the latter could be calculated from the MSD Dunnettrsquos critical value and the number of replicates and then used in a calculation of power Calculations apply to a one-sided two-sample t-test of equal means assuming equal variances and equal replication with hypotheses Hocontrol mean - treatment mean = 0 versus Hacontrol mean - treatment mean gt 025 times control mean The power achieved by Dunnettrsquos multiple comparison procedure will lie between the two-sample power at alpha = 005 and that for alpha = 005(no of treatments)
June 30 2000 5-8
Understanding and Accounting for Method Variability in WET Applications Under the NPDES Program
Testing laboratories and permittees can examine the EMS or MSD in Tables B-14 and B-15 (Appendix B) to estimate the ability of a WET test to detect toxic effects Some regulatory authorities may require a comparison between the control and the receiving water concentration which requires a two-sample one-sided t-test Others may require the multiple comparisons procedure described in the EPA WET methods (Dunnettrsquos or Steelrsquos tests one-sided with alpha of 005) The power of Dunnettrsquos procedure falls between the power of the one-sided two-sample t-test with alpha of 005 and alpha of 001 assuming that no more than five toxicant concentrations are compared to a control The power of Steelrsquos procedure will be related to and should usually increase with the power of Dunnettrsquos procedure and the t-tests Tables B-14 and B-15 in Appendix B also provide an appropriate guide to achieving power using a nonparametric test
Recently the State of Washington (1997) issued guidance specifying an acute and chronic statistical power standard to be achieved for compliance testing EPArsquos sediment toxicity testing manuals (USEPA 1994c USEPA 2000) include power curves for various numbers of experimental units CV ranges and associated alpha and beta levels Sheppard (1999) is a good source to provide a simple explanation of how power helps determine how large a sample should be Additional information on power may be obtained at httpwwwpsychologieuni-trierde8000projectsgpowerliteraturehtml
EPA recommends that regulatory authorities specify in their State WET implementation procedures that individual test results achieve a level of within-test sensitivity by using the upper and lower PMSD test sensitivity bounds (see Section 64) To achieve the test sensitivity bounds testing laboratories may need to minimize within-test variability (eg EMS) or increase the number of replicates tested or both If laboratories cannot achieve PMSD values of less than 25 percent for the toxicity test methods that require a minimum of only three replicates (Methods 10000 10040 10060) then the numbers of replicates may need to be increased Appendix B (Section B4) provides information related to the number of replicates needed and discusses the relationship between test power and effect size achieved The magnitude of the effect size achieved relates to the test sensitivity
54 Test Acceptability Criteria
EPA test methods have specific TAC that the effluent and reference toxicant tests must meet A test is considered invalid if the TACs are not met The recommended test conditions for each test method specify the minimum requirements and the TAC For example control survival must be 80 percent or greater and average control reproduction at least 15 young per surviving female in the chronic Ceriodaphnia dubia survival and reproduction test
The chronic West Coast marine methods (USEPA 1995) require additional TAC For example to limit the degree of within-test variability the methods specify a maximum allowable value for PMSD (see Section 532 on experimental design) Some States have additional TAC in their State WET implementation policies North Carolina (1998) for example requires that the chronic Ceriodaphnia dubia analyses meet an additional TAC of complete third brood neonate production by at least 80 percent of the control organisms and that the control reproduction CV be less than 40 percent
Additional TAC might be specified to minimize variability among replicates Variability of any toxicity test result is influenced by the number of replicates used number of organisms tested and variability among replicates at each test concentration and the control Variability among replicates has been quantified by treatment CV EMS or MSD The application of a maximum acceptable value for CV or MSD helps ensure adequate laboratory QAQC and increases the reliability of submitted data One benefit of requiring a maximum allowable within-test variability limit is that laboratories will improve culturing test handling and housekeeping which are usually incorporated into the laboratoriesrsquo standard operating procedures For example the CV requirement might be incorporated directly into the NPDES permit Sample EPA Region 6 permit language reads
June 30 2000 5-9
Understanding and Accounting for Method Variability in WET Applications Under the NPDES Program
1 The coefficient of variation between replicates shall be less than or equal to 40 percent in the control
2 The coefficient of variation between replicates shall be less than or equal to 40 percent at the instream waste concentration (IWC)
3 Test failure may not be construed or reported as invalid due to a CV of greater than 40 percent A repeat test shall be conducted within the required reporting period if any test is determined to be invalid
Occasionally statistical analyses indicate a test failure when as little as 15-percent mortality has occurred in a test dilution Permit language has been developed to address this occurrence as in the following example
If all TAC conditions are met and the percent survival of the test organism is greater than or equal to 80 percent (in a chronic test) or 90 percent (in an acute test) in the critical dilution concentration and all lower dilution concentrations the test shall be considered to be a valid test and the PERMITTEES shall report an NOEC of not less than the critical dilution for the discharge monitoring report (DMR) reporting requirements
Regulatory authorities may consider providing guidance or imposing additional TAC such as those implemented by EPA Region 6 or like some States have implemented (North Carolina 1998 Washington 1997) Appendix E provides additional examples of States that have implemented further guidance on WET QAQC procedures and TAC Warren-Hicks (1999) also recommended that additional national TAC be established for each test method (eg upper and lower bounds on the MSD) Therefore EPA recommends that regulatory authorities require that additional TACs be implemented in permits to minimize within-test variability and increase test sensitivity (see Section 64 and Appendix C for sample permit language)
55 Conducting the Statistical Analysis To Determine the Effect Concentration
EPA test methods currently recommend two statistical approaches to estimate a chemical or effluent concentration for each biological effect endpoint (eg survival growth and reproduction) One approach is to derive the NOEC by hypothesis testing which equates biological significance with statistical significance The second approach is to estimate an effect concentration that reduces the control response by 25 percent for chronic methods The expanded use of WET tests in the NPDES program has brought increased attention to the statistical analysis of toxicity test data A common goal for both regulatory authorities and permittees is to confirm that the effect concentrations were derived correctly using the appropriate analysis approaches Reliable effect concentrations lead to increased confidence in the data used for making regulatory decisions such as determining reasonable potential deriving a permit limit or monitoring trigger and generating self-monitoring test results
Another important consideration in conducting statistical analyses is the inconsistent use of statistical programs The proliferation of statistical packages has been helpful in data analysis however these packages also can result in the misapplication of the statistical methods APCA-AWWA-WEF (1998) cautions the user to confirm the results of each analysis with each package before accepting them The data user is responsible for evaluating all data submitted to the regulatory authorities
The 1995 SETAC Pellston Workshop discussed unresolved scientific issues and highlighted significant research needs associated with WET testing The attendees recommended the following
Immediately instigate studies to evaluate improvements in the statistical analysis of WET test data These studies should include but not necessarily be limited to the following activities
5-10 June 30 2000
Understanding and Accounting for Method Variability in WET Applications Under the NPDES Program
(a) investigate the implications of concurrent application of NOECMSD tests of bioequivalence and ECp estimators (Chapman et al 1996a)
In response to this recommendation EPA began projects to evaluate the bioequivalence approach and additional point estimate models for the WET program At present two test methods are being used for this evaluation (1) the chronic Ceriodaphnia dubia survival and reproduction tests and (2) the giant kelp germination and germ-tube length test with reference toxicants
The bioequivalence approach poses the following question Do the mean responses of the effluent concentration and the control differ by more than some amount For example the control response and the response at the critical effluent concentration (ie instream waste concentration) must differ by no more than a fixed value in order to accept the hypothesis of no significant difference (ie no toxicity) This approach could address the concern that an imprecise test might not detect toxicity when toxicity is present or that a small but statistically significant effect would detect toxicity that may not be biologically important Some researchers have suggested that the bioequivalence approach could provide a positive incentive for dischargers to produce test results with lower within-test variability to demonstrate that no toxicity occurs at a level greater than a biologically (bioequivalence approach) significant amount (Shukla et al 2000 Wang et al 2000)
Bailer et al (2000) evaluated the proposed regression-based estimators with the current EPA point estimate models They found that it appears reasonable to incorporate parametric estimation models in the WET program Bailer et al (2000) concluded that these models are appropriate for all response scales (ie dichotomous count and continuous) and can incorporate monotonicity without bias However confidence intervals still need to be developed for these parametric models
In this document EPA has not recommended either the bioequivalence or additional point estimate models to supplement the current statistical approaches as described in the testing manuals An independent peer-reviewed workshop should be convened to evaluate the benefits of these alternative statistical approaches to enhance the statistical approaches currently applied
56 Chapter Conclusions
In this chapter EPA provides guidance to permittees and testing laboratories on collecting representative effluent samples conducting the biological test methods and evaluating the statistical analyses EPA recommends that States implement the lower and upper PMSD test sensitivity bounds to achieve an acceptable level of test sensitivity and minimize within-test variability (see Section 64) EPA also provides guidance to permittees and testing laboratories on the number of replicates required to achieve the PMSD bounds Testing laboratories should maintain and evaluate both effluent and reference toxicant data using a measure of within-test variability such as the PMSD
Permittees and toxicity testing laboratories may need to increase replication in order to reduce PMSD below the upper bound Table B-15 can be used for initial planning of replication given knowledge of typical values of the error mean square (EMS) or MSD and the number of concentrations used in the multiple comparison hypothesis test To ensure that all PMSD values fall below the upper bound in Table 3-6 a laboratory would select the largest EMS value experienced in its past testing
EPA recommends that testing laboratories require a minimum of four replicates for the fathead minnow sheepshead minnow and inland silverside chronic test methods (Methods 10000 10040 and 10060 respectively) Four replicates are needed to execute the statistical flow chart when a nonparametric test is needed Three replicates are also sometimes insufficient to keep PMSD below the recommended upper bound In addition four replicates are needed to help achieve the upper PMSD bound
June 30 2000 5-11
Understanding and Accounting for Method Variability in WET Applications Under the NPDES Program
This page intentionally left blank
5-12 June 30 2000
60 GUIDANCE TO REGULATORY AUTHORITIES DETERMINING REASONABLE POTENTIAL AND DERIVING WET PERMIT CONDITIONS
EPA developed the TSD (USEPA 1991a) to support implementation of national policy to control the discharge of toxic pollutants The TSD presents a statistical approach for determining the need for and the method of deriving water quality-based effluent limits (WQBELs) based on aquatic life (including WET) human health and wildlife criteria This approach accounts for the uncertainty associated with small data sets and data variability by assuming a statistical distribution of effluent data (usually lognormal) and calculating a CV or using a default CV to describe data variability
61 Analytical and Sampling Variability in Calculations for Reasonable Potential and Permit Limits
Section 61 discusses use of the CV of sample measurements of toxicity to make a reasonable potential determination and to calculate permit limits Two points must be understood (1) this CV is to be calculated using toxic unit (TU) values (USEPA 1991a) (see Section 62) and (2) EPA strongly recommends that point estimates (not NOEC or LOEC values) be used to calculate the TU values (USEPA 1994a 1994b)
Water quality-based effluent limits are required when a discharge causes has reasonable potential to cause or contributes to an instream excursion above a water quality standard Throughout this document EPA uses the commonly understood shorthand reference ldquoreasonable potentialrdquo to refer to this standard for determining the need for a water quality-based effluent limit
611 ldquoAdjusting for Analytical Variabilityrdquo in Calculations for Reasonable Potential and Permit Limits
Adjustment approaches (see Appendix G3) have been suggested to ldquoadjust for analytical variabilityrdquo when deriving permit limits and determining the need for a WET limit in the first place EPA does not recommend these adjustment approaches (Appendix G3) and strongly reaffirms the statistical approach and methods for calculating permit limits provided in the TSD (USEPA 1991a) EPA recommends that regulatory authorities use the statistical approach and calculation methods in the TSD The TSD methods were designed to provide a reasonable degree of protection for water quality (ie to avoid exceedances of water quality criteria) while providing a reasonable degree of protection from the variability of effluent toxicity and analytical variability The various ldquoadjustmentrdquo approaches would undermine these objectives
The TSD limit calculation for a point source can be divided into two steps first convert the wasteload allocation (WLA) to a long-term average (LTA) and then convert the LTA to effluent limits (maximum daily average weekly and average monthly limits) WET limit calculations include an intermediate step in which the acute WLA is converted to a WLAac These calculations employ a facility-specific CV based upon effluent sampling data The TSD approach uses this CV in both steps
Adjustment approaches intended to account for analytical variability discussed in detail in Appendix G would inappropriately use different CVs in these two steps The first step would use an estimate of the CV of ldquotruerdquo effluent toxicity which is smaller than the CV for measured toxicities This approach would result in a larger calculated LTA The second step would use the CV for the measured toxicities which is the same CV used in both steps of the TSD approach
Use of such adjustment approaches would frequently result in setting an average monthly permit limit (AML) that exceeds the chronic WLA Appendix G demonstrates that such outcomes (ie the AML exceeds
June 30 2000 6-1
Understanding and Accounting for Method Variability in WET Applications Under the NPDES Program
the chronic WLA) generally can be expected to occur when various adjustment approaches are used Appendix G Table G-1 presents a numerical example of how an adjustment approach would allow calculation of an AML exceeding the chronic WLA (a four-day average value) even when sampling frequency for the calculation is set at the recommended minimum of four samples per month [It is acceptable for the maximum daily limit (MDL) which applies to a single sample to exceed the chronic WLA It is also acceptable for the AML to exceed the chronic WLA if the AML calculation is based on fewer than four samples per month Note however that the TSD recommends always assuming at least four samples per month when calculating the AML]
The TSD reasonable potential calculation first calculates the percentile represented by the maximum observed TU value For example the maximum of 10 reported TU values is identified with the 63rd
percentile Then the sample CV is used to project the 95th or 99th percentile TU value using a table of reasonable potential multiplying factors This value is combined with the appropriate mixing-zone dilution to project a maximum receiving water toxicity which is compared with the applicable water-quality criterion If an adjustment were applied to the reasonable potential calculation the CV would be adjusted downward and the maximum projected receiving water toxicity would be smaller This would make a determination of need for a permit limit less likely
Because of these considerations EPA strongly recommends that no adjustment be made to the CV or variance of toxicity either for reasonable potential or permit limit calculations The TSD statistical approaches already account for analytical variability appropriately EPA continues to recommend the TSD approach which ensures that effluent limits and thereby measured effluent toxicity or pollutant parameter concentrations are consistent with calculated WLAs
612 Analytical Variability and Self-monitoring Data
EPA determines compliance with permit limits on the basis of self-monitoring data and these data include some measure of analytical variability The influence of analytical variability is accounted for in the TSD statistical procedures used to set water-quality limits and determine the potential for toxicity as explained in Appendix G
The permittee is responsible for ensuring that measured discharge toxicity never exceeds the permit limits No special allowance is made for analytical variability in assessing compliance The maximum discharge toxicity should incorporate a margin of safety which will account for sampling and analytical variability In other words to avoid exceeding permit limits the facilityrsquos treatment system should be designed so that the maximum toxicity is somewhat lower than its permit limits
613 Precision of WET Measurements and Estimates of Effluent CV
Single measurements on effluent involve some uncertainties about the true concentration or toxicity related to representativeness of the sample including sample holding time and conditions and the analytical measurement system Like all analytical measurements WET measurements (NOEC EC25 LC50) are inexact That is the exact toxicity of an analyte in a sample can be specified only within some range This imprecision can be reduced by using a suitable number of organisms and replicates for each test (see Section 532 on experimental design)
The numbers of organisms and replicates required for EPA WET method test acceptability are specified as minimums Test precision will be approximately proportional to the square root of the number of replicates Thus doubling the number of replicates may decrease the MSD to approximately 70 percent of its former value Increased replication also tightens the confidence interval for a point estimate of the effect concentration (eg EC25 and LC50)
June 30 2000 6-2
Understanding and Accounting for Method Variability in WET Applications Under the NPDES Program
EPA strongly recommends that toxicity measurements of an effluent be obtained at least quarterly for three years to provide a good basis for determining the need for limits and for calculating limits One year should be regarded as the minimum duration needed to characterize effluent variability (due to seasonal stream flow or process fluctuations) and ten the minimum number of measurements unless scientific and technical knowledge supports a shorter period as representative of the distribution of pollutant types and concentrations of toxicity
Estimates based on multiple measurements involve the same uncertainties that apply to single measurements They also may involve larger uncertainties related to sampling error that is the chance that typical levels of toxicity or concentrations of pollutant may not be encountered during the sampling program The sampling program may not fully characterize effluent variability if too few samples are taken the sampling times and dates are not representative or the duration of the sampling program is not long enough to represent the full range of effluent variability When determining the need for limits and calculating limits the variance or the CV of toxicity measurements is key The larger the number of samples the more precise is the estimate Confidence intervals for the variance and CV can be calculated and carried through the calculations for reasonable potential and effluent limits (Appendix G) Even when assumptions are not strictly met confidence intervals provide a useful perspective on the uncertainty of the results and the need for more samples The minimum number of measurements recommended for calculating estimates of the CV for effluent toxicity is 10
614 Between-Laboratory Variability
Between-laboratory variability may increase the CV as discussed in Section 611 if the toxicity tests were conducted by more than one laboratory for a specific facility A concern to permittees is that this may increase the likelihood of making a finding of reasonable potential
Within-laboratory variability is the component of analytical variability that should be reflected in regulatory calculations If the data used for reasonable potential or permit limit calculations are effluent measurement data reported by at least two laboratories there are ways to appropriately estimate the variance to be used in TSD statistical calculations
For example
bull If the same laboratories continue to be used in the same proportion or frequency and the measurements from the individual laboratories represent different sampling dates the measurement data can be treated as if they were generated by a single laboratory This approach may increase the estimated variance and the AML which is not in the interest of the permittee Selecting one laboratory for future monitoring based on the variance of its reported reference toxicant test results should mitigate this problem
bull If only one laboratory has reported data on each sampling date and the other laboratories report over different time spans or over the same time span on alternating dates EPA recommends forming a pooled estimate of variance Calculate the sample variance (S2) of log(TU) for each laboratory separately and combine these using the formula
pooled variance of log(X) = [(N1 - 1)S12 + (N2 - 1)S2
2] [(N1 - 1) + (N2 - 1)]
An analogous formula is used for more than two laboratories The same result can be obtained by conducting a one-way analysis of variance on log(TU) (with laboratories treated as the groups or classes) and using the reported EMS
June 30 2000 6-3
Understanding and Accounting for Method Variability in WET Applications Under the NPDES Program
Changing a laboratory may change analytical (within-laboratory) variability of measurements and test sensitivity (ie PMSD values) That is the average effect concentration may change (eg Warren-Hicks et al 1999) Ideally the permittee will anticipate and plan for a change of testing laboratory Permittees should compare reference toxicant test data for current and candidate replacement laboratories selecting one with acceptable variability and a similar average effect concentration
62 Determining Reasonable Potential and Establishing Effluent Limits
Effluent characterization is an essential step in determining the need for an NPDES permit limit NPDES regulations under 40 CFR Part 12244(d)(1)(ii) specify that reasonable potential include ldquowhether a discharge causes has the reasonable potential to cause or contributes to an instream excursion above a State water quality standardrdquo Calculations for reasonable potential determination and for permit limits should follow EPA guidance in the TSD (USEPA 1991a) In particular the TSD statistical methods should be used Such calculations should use TUs for WET data not effect concentrations (percent whole effluent) Toxic units are defined (USEPA 1991a Chapter 131 page 6) as the reciprocal of the effect concentration times 100 where the effect concentration is expressed as a percentage of whole effluent thus TUa = 100 LC50 and TUc = 100ECp
When characterizing an effluent to determine whether a permit limit is necessary permit writers can use the available effluent WET data and a water-quality model to perform a reasonable potential analysis The TSD outlines the statistical approach This approach uses existing effluent data to project a maximum pollutant concentration or a maximum toxicity in the effluent (USEPA 1991a) The projected maximum concentration or toxicity is used as an input in the water quality model to determine whether the effluent has the reasonable potential to cause or contribute to an excursion of ambient water quality criteria If reasonable potential exists the permit writer must derive a WET permit limit for that facility1
The variability of the existing effluent data as measured by the CV has a significant effect on the projected maximum pollutant concentration or toxicity The higher the CV the higher the projected maximum and the more likely that there is reasonable potential and a limit is needed EPA recommends that regulatory authorities use all valid relevant and representative data in making reasonable potential determinations EPA is developing a national policy clarifying use of the TSD procedures for determining reasonable potential for WET Important components of this policy include specifying the minimum number of valid WET tests necessary to calculate facility-specific CVs2 as well as recommending a step-wise approach to determining the need for WET permit limits This approach reflects a strong preference by EPA and its stakeholders to rely on facility-specific WET testing based on adequate frequency and duration of effluent sampling for making reasonable potential determinations for toxicity
EPA recommends that point estimates be used to estimate effluent variability to determine the need for limits and to set permit limits This is recommended whether the self-monitoring test results will be determined using hypothesis tests or point estimates Point estimates have less analytical variability than NOECs using current experimental designs as shown in Chapter 3 Point estimates make the best use of the WET test data for purposes of estimating the CV LTA and RP factor and calculating the permit limit
1 When the State has narrative criteria for toxicity and the TIETRE identifies a specific chemical that is the source of toxicity the permit writer may include a chemical-specific limit for that parameter instead of a WET permit limit in accordance with 40 CFR Part 12244(d)(v)
2 If fewer than ten data points are available the regulatory authority must use a default CV As a result the need for a WET permit limit may be based on a default value rather than actual data
June 30 2000 6-4
Understanding and Accounting for Method Variability in WET Applications Under the NPDES Program
63 Development of a Total Maximum Daily Load for WET
Total maximum daily loads (TMDLs) may be indicated when there is acute or chronic toxicity in a waterbody leading to the listing of the waterbody as impaired under CWA Section 303(d) and when there are multiple sources of the toxicity EPA believes that TMDL calculations should be performed on the pollutants causing toxicity whenever possible In these situations EPA suggests that the first step of the analysis is to conduct ambient toxicity identification evaluations to identify the pollutant(s) and the source(s) causing the toxicity Once the pollutant(s) and source(s) causing toxicity have been identified for the waterbody then a TMDL should be developed for the individual pollutant(s)
64 Accounting for and Minimizing Variability In the Regulatory Decision Process
A common goal for the permittee and the regulatory authority is to have confidence in the test results from the biological and statistical procedures Both permittees and regulatory authorities would then have more confidence in taking regulatory actions such as evaluating multiple effluent samples to determine reasonable potential and derive permit conditions (eg permit limits monitoring triggers) If steps such as collecting a representative effluent sample to conducting the toxicity tests properly as discussed in Sections 52 through 54 and requiring additional TACs (Section 641) are used to reduce or minimize within-test variability then the reliability of the WET test results increases
641 Recommended Additional TACs Lower and Upper Bounds for PMSD
Reference toxicant data from a large number of tests and laboratories were used to generate PMSD values percentiles of these values are reported in Table 3-6 The MSD represents the smallest difference between the control mean and a treatment mean that leads to the statistical rejection of the null hypothesis (ie no toxicity) using Dunnettrsquos multiple comparison test MSD values are divided by the control mean and multiplied by 100 to produce a ldquopercent MSDrdquo (PMSD) value The PMSD allows comparison of different tests and represents the smallest significant difference from the control as a percentage of the control mean Thus it represents the smallest significant value of the relative difference [100 (control mean shytreatment mean)control mean] The MSD is often expressed as a percentage of the biological endpoint in the control response
The following formula is used to calculate MSD (as recommended by USEPA 1995)
MSD ds w (1n1) (1n)
where d = critical value for the Dunnettrsquos procedure
sw = the square root of the error mean square (EMS) n1 = number of experimental units in the control treatment n = the number of experimental units per treatment assuming an equal number at all other
treatments
Percent MSD is calculated as follows MSDPMSD times 100
control mean
EPA recommends that regulatory authorities implement both the lower and upper PMSD bound approach to minimize within-test variability when using hypothesis testing approaches to report an NOEC The implementation of the upper PMSD bound should also apply when using point estimate techniques There are five possible outcomes for regulatory decisions (see Figure 6-1) Two outcomes imply unqualified acceptance of the WET test statistical result
June 30 2000 6-5
Understanding and Accounting for Method Variability in WET Applications Under the NPDES Program
1 Unqualified PassndashThe testrsquos PMSD is within bounds and there is no significant difference between the means for the control and the instream waste concentration (IWC) treatment The regulatory authority would conclude that there is no toxicity at the IWC concentration
2 Unqualified FailndashThe testrsquos PMSD is larger than the lower bound (but not greater than the upper bound) in Table 3-6 and there is a significant difference between the means for the control and the IWC treatment The regulatory authority would conclude that there is toxicity at the IWC concentration
3 Lacks Test SensitivityndashThe testrsquos PMSD exceeds the upper bound in Table 3-6 and there is no significant difference between the means for the control and the IWC treatment The test is considered invalid A new effluent sample must be collected and another toxicity test must be conducted
4 Lacks Test SensitivityndashThe testrsquos PMSD exceeds the upper bound in Table 3-6 and there is a significant difference between the means for the control and the IWC treatment The test is considered valid The regulatory authority would conclude that there is toxicity at the IWC concentration
5 Very Small but Significant DifferencendashThe relative difference (see Section 642 below) between the means for the control and the IWC treatment is smaller than the lower bound in Table 3-6 and this difference is statistically significant The test is acceptable The NOEC is determined as described in Section 642 below
Test Unacceptable Lacks Sensitivity
Very Small Determine the NOEC
(Section 642)
PASS
FAIL
MIN
MAX (0c - 0IWC) = PMSD
Percent Minimum
Significant Difference
MIN MAX(0 - 0IWC)c
0 = control meanc
0IWC = instream waste concentration mean
Figure 6-1 Paradigm that incorporates the lower and upper percent minimum significant difference
Regulatory authorities should examine the sample permit language as provided in Appendix C for incorporation of the PMSD bound language in a NPDES permit
Note that ldquounqualified acceptancerdquo of a WET test result requires that all of the following must be achieved (1) collect the effluent sample properly (2) conduct the toxicity test methods as specified in the toxicity manuals (3) meet the required TACs (4) meet the proper water quality parameters (eg temperature pH) and (5) conduct the proper statistical calculations All these conditions must be reviewed and deemed acceptable before a test is evaluated for self-monitoring data and reporting
June 30 2000 6-6
Understanding and Accounting for Method Variability in WET Applications Under the NPDES Program
Figure 6-2 provides a decision tree that regulatory authorities can use when implementing the lower and upper PMSD bounds
Use Data for Calculating Reasonable Potential Limit Self-Monitoring Data
KEY PMSD = Percent minimum
significant difference MT = Monitoring trigger TAC = Test acceptability criteria WQ = Water quality
Verify TAC
Check WQ Parameters
amp Test Conditions
Calculate amp Report PMSD
Calculate Statistical Endpoints
Conduct Toxicity Tests
Evaluate Test Data
Continue Routine Testing
Conduct Additional Tests
Determine NOEC According to 643
Repeat Test with New Effluent Sample
Within PMSD Bounds
amp IS NOT Significant
at IWC
Within PMSD Bounds amp IS Significant
at IWC Exceeds Upper
PMSD Bound amp IS Significant
at IWC
Exceeds Upper PMSD
Bound amp IS NOT
Significant at IWC
Below Lower
PMSD Bound amp IS Significant
at IWC
5
1
4
2
3
Figure 6-2 Implementing applications of upper and lower PMSD bounds for effluent toxicity testing requirements
June 30 2000 6-7
Understanding and Accounting for Method Variability in WET Applications Under the NPDES Program
642 How to Determine the NOEC Using the Lower PMSD Bound
If the permit specifies that self-monitoring data are to be generated using hypothesis testing approaches then the analyst should report the NOEC as the following Find the smallest concentration for which (a) the treatment mean differs significantly from the control mean and (b) the relative difference (see example below) is not smaller than the 10th percentile in Table 3-6 Therefore the NOEC is the next smaller test concentration
In other words concentrations having a very small relative difference with control (smaller than the lower PMSD bound) would be treated as if they do not differ significantly from control (even if they do so) for the purpose of determining the NOEC
Table 6-1 illustrates the application of the lower PMSD bound for the reproduction endpoint of a Ceriodaphnia chronic test In this example the testrsquos PMSD was 99 smaller than the 10th percentile value of 11 found in Table 3-6 The IWC concentration differed significantly from the control The test falls under outcome number 5 a significant but very small difference at the IWC The first step is to calculate the relative differences from control (Table 6-1) as [(control mean - treatment mean) divided by (control mean)] times 100 The next step is to determine which relative differences exceed the PMSD lower bound 11 in this case (see the last column of Table 6-1) Finally the NOEC is determined as described above The NOEC is 125 percent effluent for this example
Table 6-1 Example of Applying the Lower PMSD Bound for the Chronic Ceriodaphnia Test with the Reproduction Endpoint
Concentration (percent effluent)
Reproduction (mean of ten replicates)
Relative Difference
from Control
Does Relative Difference Exceed 11
100 508 82 Yes
50 124 56 Yes
25 234 17 Yes
IWC = 125 253 10 No
625 261 74 No
Control 282 0 No
NOTE The lower PMSD bound for this method and endpoint is 11 (Table 3-6) In this example the NOEC is 625 percent effluent using the testrsquos (very small) PMSD Therefore the reported NOEC should be 125 percent effluent after applying the lower PMSD bound
Differs statistically from the control as determined by MSD = 28 neonates Thus treatment means that are less than 282 - 28 = 254 would be statistically significant These correspond to relative differences greater than 100 (28 282) = 99 percent
643 Justification for Implementing the Test Sensitivity Bounds
A lower bound is needed to avoid penalizing laboratories that achieve unusually high precision The 10th percentile PMSD represents a practical limit to the sensitivity of the test method because few laboratories are able to achieve such precision on a regular basis and most do not achieve it even occasionally Several independent researchers have evaluated and provide support for using the MSD approach as additional TAC for the toxicity test methods Thursby et al (1997) advocate and provide reasons for using an empirical data base of minimum significant differences to provide TAC using statistical performance assessment The State of California (Hunt et al 1996 Starrett et al 1993) and the West Coast marine toxicity test methods (USEPA 1995) have implemented an upper PMSD bound to minimize insensitive tests Also the State of North Carolina has implemented additional requirements for the Ceriodaphnia chronic tests that reduced method
June 30 2000 6-8
Understanding and Accounting for Method Variability in WET Applications Under the NPDES Program
variability North Carolinarsquos evaluation of these additional TACs and subsequent improvements in test sensitivity appears in Appendix F
The North Carolina data base affords the opportunity to evaluate the effectiveness of additional TAC and changes to the toxicity test procedures as they relate to the variability of WET test results (see Appendix F) For example for PMSD the median value decreased from 21 percent to 16 percent while the 90th percentile decreased from 39 percent to 31 percent indicating an overall increase in test sensitivity The range in median values across all laboratories before adopting additional TACs was 12 percent to 36 percent After adopting additional TACs the range in median values was 10 percent to 27 percent indicating a decrease in the overall spread between laboratories The range in control CVs within a laboratory was from 21 percent to 79 percent before adopting TACs compared to the range in control CVs within a laboratory after adopting TACs which was narrowed to 17 percent to 36 percent Overall laboratories are generating data with more consistency within and between laboratories after implementation of the additional TACs and additional method guidance provided by the State for the chronic Ceriodaphnia dubia test method
644 Guidance to Testing Laboratories on How to Achieve the Range of Performance for PMSD
EPA recommends that regulatory authorities use the upper bounds (90th percentiles for PMSD in Table 3-6) to identify tests that are insufficiently sensitive If PMSD exceeds this upper bound more often than occasionally the laboratory should thoroughly investigate ways to reduce variability There are three principal ways to reduce PMSD (1) decrease within-test variability (that is decrease the error mean square and therefore the standard deviation at each concentration) (2) increase the control mean and (3) increase the number of replicates The number of replicates required could be determined by trial-and-error calculations using the error mean square values obtained from a series of WET tests At least 20 tests are recommended The number ldquonrdquo in the formula for MSD (number of replicates) would be increased and MSD re-calculated for each error mean square value This approach uses a sample of tests specific to a particular laboratory and reveals the variation among tests This approach would demonstrate how many replicates would be needed to achieve the upper PMSD bound as required in Table 3-6
65 Additional Guidance That Regulatory Authorities Should Implement to Further Support the WET Program
As discussed in Section 53 regulatory authorities have the discretion to develop and implement additional WET program requirements and guidance to ensure that WET test method variability is reduced by specifying additional guidance beyond the minimum requirements of EPArsquos WET test methodrsquos QAQC and TACs Appendix E provides a snapshot of State approaches to implementing NPDES WET programs to minimize WET test variability
These State approaches include WET information to assist the regulated community with the following
bull Guidance regarding the evaluation of reference toxicant and effluent test results
bull Guidance regarding how the State reviews reference toxicant data for laboratory performance
bull Guidance regarding additional QAQC criteria the State has developed and implemented
bull Guidance regarding efforts the State has made to minimize test method variability
bull Description of how the State reviews or conducts performance laboratory audits
bull Description of specific implementation guidance that the State has developed to assist permit writers
bull Description of how the State provides or uses toxicity test training
June 30 2000 6-9
Understanding and Accounting for Method Variability in WET Applications Under the NPDES Program
States contemplating such changes should consult with EPA to ensure the changes will be appropriate in the context of the Statersquos overall NPDES WET program In addition States should implement a step-wise approach to address toxicity when the permit limit or monitoring trigger is exceeded in their State WET implementation plans
For example when an effluent is deemed toxic then the permittee should take appropriate steps to demonstrate the magnitude frequency and potential source(s) of the toxicity The components of the stepshywise approach could include increased frequency of toxicity testing to characterize the magnitude and frequency of toxicity If continued toxicity is demonstrated then the permittee could conduct a Toxicity Reduction EvaluationToxicity Identification Evaluation (TRETIE) with toxic effluent sample(s) (USEPA 1991b 1992) For example EPA Regions 9 and 10 have prepared WET implementation guidance to assist their States (Denton and Narvaez 1996) This guidance provides sample permit language for a step-wise approach to address toxic samples (see Appendix C)
66 Chapter Conclusions
The TSD statistical approach to reasonable potential determination and permit limit derivation considers combined effluent and analytical variability through the CV of measured effluent values Because determination of effluent variability is based on empirical measurements the variability estimated for effluent measurements includes the variability of pollutant levels sampling variability and a smaller component owed to method variability Steps should be taken to reduce these sources of variability EPA believes that the TSD statistical procedures are appropriately protective in considering both effluent and analytical variability in reasonable potential and effluent limit calculations
EPA recommends that regulatory authorities use a sampling program that conducts at least ten representative WET tests over a period of three years to represent the full range of effluent variability Regulatory authorities should use recommended procedures in the TSD to determine when numeric WET limits or WET monitoring triggers are needed Other permit conditions may include monitoring triggers such as increased toxicity testing TREsTIEs and follow-up actions initiated because a permit limit is exceeded or a monitoring trigger is not met Regulatory authorities should implement the additional test sensitivity requirements by requiring that each test result not exceed the upper PMSD bound In addition regulatory authorities should determine the appropriate NOEC for test results below the lower PMSD bound as described in Section 642 These efforts should lead to increased confidence in the effect concentrations that are generated to evaluate self-monitoring data
6-10 June 30 2000
70 CONCLUSIONS AND GUIDANCE TO LABORATORIES PERMITTEES AND REGULATORY AUTHORITIES
This document was prepared to address whole effluent toxicity (WET) test variability The document has three goals (1) quantify the variability of promulgated test methods and report a coefficient of variation (CV) as a measure of test method variability (2) evaluate the statistical methods described in the TSD for determining the need for and deriving WET permit conditions and (3) suggest guidance for regulatory authorities on approaches to address and minimize test method variability This document quantified the variability of toxicity test methods based on the end use of the data that is the effect concentrations (eg NOEC LC50 EC25) The within-laboratory variability of these effect concentrations was quantified by obtaining multiple test results under similar test conditions using the same reference toxicant The major conclusions of this document are discussed below
71 General Conclusions
bull EPArsquos Technical Support Document for Water Quality-based Toxics Control (referred to as the TSD) presents guidance for developing effluent limits based on three key components (1) water quality criteria (2) a calculated dilution factor used to derive a waste load allocation (WLA) from the criteria and (3) a statistical calculation procedure that uses a CV based on effluent data to calculate effluent limits from the WLA EPArsquos TSD statistical approach is appropriately protective regarding both effluent and analytical variability provided that the criteria and WLA are derived correctly It is inappropriate to adjust the TSD statistical methodology for determining when water quality-based effluent limits are needed and for calculating such limits (Section 6 and Appendix G)
bull EPArsquos analysis indicates that the TSD approach appropriately accounts for both effluent variability and method variability EPA does not believe a reasonable alternative approach is available to determine a factor that would discount the effects of method variability using the TSD procedures (Section 611 and Appendix G)
bull Interim CVs are identified for promulgated WET test methods [Appendix A Table A-1 (acute methods) and Table A-2 (chronic methods)] pending completion of between-laboratory studies which may affect these interim CV estimates
bull Comparisons of WET method precision with method precision for analytes commonly limited in the National Pollutant Discharge Elimination System (NPDES) permits clearly demonstrate that the variability of the promulgated WET methods is within the range of variability experienced in other types of analyses Several researchers also noted that method performance improves when prescribed methods are followed closely by experienced analysts (Section 43)
bull The hypothesis test procedures prescribed in EPArsquos WET methods will provide adequate protection against false conclusions that an effluent is toxic However the incidence of false negatives can be high because of high within-test variability making it difficult to detect toxicity when toxicity is truly present Therefore evaluating the power of current experimental designs is desirable EPA expects that regulatory authorities will make prompt and measurable progress toward the goal of requiring all WET tests to detect a toxic effect of 25 percent to 33 percent with power of 080 (Section 533 and Appendix B4)
bull Quality assurance problems became apparent when evaluating the data for this study especially for the metal reference toxicants and sodium dodecyl sulfate (SDS) Standardizing the choice of reference toxicant and the concentrations to be tested may be appropriate as well as establishing bounds on the range of acceptable effect concentrations for each test method As a result
June 30 2000 7-1
Understanding and Accounting for Method Variability in WET Applications Under the NPDES Program
quantifying between-laboratory variability will be difficult unless these issues can be resolved (Section 531 and Appendix G25)
bull The data analysis did not reveal the potential sources and causes of variability such as using different sources of test organisms dilution water and food To assess the sources of variability fully experimenters must carefully design new studies (Section 531)
72 Recommendations for Minimizing Variability and Its Effects
Three critical areas are identified to minimize WET test method variability
bull Obtaining a representative effluent sample
bull Conducting the toxicity tests properly to generate biological endpoints and
bull Calculating the appropriate statistical endpoints to have confidence in the effect concentration
This document provides guidance to toxicity testing laboratories permittees and regulatory authorities in conducting biological and statistical methods and evaluating test effect concentrations It also develops guidance for regulatory authorities on approaches to address and minimize test method variability The principal aspects of the guidance are presented in Table 3-6 and re-presented here
Range of Relative Variability for Endpoints of Promulgated WET Methods Defined by the 10th
and 90th Percentiles from the Data Set of Reference Toxicant Testsa
Test Methodb Endpointc No of Labs
No of Tests
PMSD Control CVd
10th 90th 10th 90th
10000 Fathead Minnow G 19 205 94 35 0035 020
10020 Ceriodaphnia dubia R 33 393 11 37 0089 042
10030 Green Alga G 9 85 93 23 0034 017
10040 Sheepshead Minnow G 5 57 63 23 0034 013
10060 Inland Silverside G 18 193 12 35 0044 018
10070 Mysid G 10 130 12 32 0088 028
20000 Fathead Minnow S 20 217 42 30 0 0074
20020 Ceriodaphnia S 23 241 50 21 0 011
20040 Sheepshead Minnow S 5 65 0e 55 0 0
20060 Inland Silverside S 5 48 70 41 0 0079
20070 Mysid (A bahia) S 3 32 51 26 0 0081
20110 Mysid (H costata) S 2 14 18 47 0 0074
20210 Daphnia (D magna) S 5 48 53 23 0 011
20220 Daphnia (D pulex) S 6 57 58 23 0 011 a The precision of the data warrants only three significant figures When determining agreement with these values one may
round off values to two significant figures (eg values gt345000 and 35000 are rounded to 35) Method 10090 (red macroalga) is not reported because it is inadvisable to characterize method variability using only 23 tests from just two laboratories
b EPA did not assign method numbers for acute methods in EPA6004-90027F The numbers assigned here were created for use in this document and in related materials and data bases G = growth R = reproduction S = survival
d CVs were calculated using untransformed control means for each test e An MSD of zero will not occur when the EPA flow chart for statistical analysis is followed In this report MSD was
calculated for every test including those for which the flow chart would require a nonparametric hypothesis test EPA recommends using the value 42 (the 10th percentile shown for the fathead minnow acute test) in place of zero as the 10th
percentile PMSD (lower PMSD bound) for the sheepshead minnow acute test
June 30 2000 7-2
c
Understanding and Accounting for Method Variability in WET Applications Under the NPDES Program
721 Guidance to Toxicity Testing Laboratories
bull Testing laboratories should maintain quality assurancequality control (QAQC) control charts for percent minimum significant difference (PMSD) along with the statistical endpoints such as NOEC LC50 and EC25 Testing laboratories should regularly plot the individual raw test data and the average treatment responses to examine possible causes of excessive variability (Section 5311)
bull The minimum number of replicates for the chronic toxicity tests should be four for the chronic fathead minnow sheepshead minnow and inland silverside test methods (Sections 5331 and 56)
bull Testing laboratories should take steps to ensure that the test PMSD does not exceed the upper bound provided in the table above (Sections 33 533 and 64 and Table 3-6) This may require ensuring more uniformity among test organisms andor using more replicates Tables are provided to aid in choosing the number of replicates (Tables B-14 and B-15)
bull Testing laboratories should examine the power tables to ensure that test results will meet the recommended test sensitivity criteria These tables can be used to make decisions about replication given the knowledge of typical values for error mean square (EMS) and number of tested concentrations (Section 533 and Tables B-9 through B-15)
722 Guidance to NPDES Permittees
bull Permittees should select and conduct all data analyses with one qualified toxicity testing laboratory to determine reasonable potential derive permit limits and generate self-monitoring test results Conducting all effluent testing consistently using one reference toxicant is also prudent (Section 614 and Appendix G25)
bull Permittees should generate WET data (n = 10) that have been accumulated over a year or more to fully characterize effluent variability over time The sampling dates and times should span a sufficient duration to represent the full range of effluent variability (Sections 613 and 62 and Appendix G24)
bull Permittees should examine testing laboratoriesrsquo QAQC control charts If the CV for reference toxicant tests is greater than the 75th percentile in Tables 3-2 through 3-4 variability can likely be reduced even if the individual EC25 and LC50 values fall within the control limits (Section 5311)
bull Permittees should examine toxicity test data to ensure that data being submitted to regulatory authorities meet specified effluent holding times temperature laboratory control limits and test acceptability criteria such as requirements for test sensitivity lower and upper PMSD bounds (Sections 52 through 54)
bull Permittees should anticipate and plan for a change if switching to a different testing laboratory The permittee should compare reference toxicant test data from the current laboratory with data from the candidate replacement laboratory in order to ensure acceptable variability and a similar average effect (Section 614)
June 30 2000 7-3
Understanding and Accounting for Method Variability in WET Applications Under the NPDES Program
73 Guidance to Regulatory Authorities
Guidance to Regulatory Authorities Related to Determining Reasonable Potential and Deriving Permit Limits
bull Regulatory authorities should use EPArsquos recommended statistical approach in deriving permit limitations The statistical approach outlined in the TSD represents an effective and appropriately protective approach to effluent limit development (Section 61 and Appendix G1)
bull Regulatory authorities should calculate the facility-specific CV using point estimate techniques to determine the need for and derive a permit limit even if the self-monitoring test results will be determined using hypothesis test procedures (Sections 341 and 62)
bull Regulatory authorities that need to cite a characteristic CV for a promulgated method may use Tables A-1 and A-2 in Appendix A which show the median CV from Tables 3-2 through 3-4 pending completion of between-laboratory studies
bull EPA recommends that regulatory authorities implement a step-wise approach to address toxicity This approach can determine the magnitude and frequency of toxicity and appropriate follow-up actions for test results that indicate exceedance of a monitoring trigger or a permit limit (Section 65)
Guidance to Regulatory Authorities Related to Collecting Effluent Samples Conducting the Toxicity Test and Evaluating the Effect Concentrations
bull Regulatory authorities should design a sampling program that collects representative effluent samples to fully characterize effluent variability for a specific facility over time At least 10 samples are needed to estimate a variance or CV with acceptable precision for a specific facility (Sections 613 and 62)
bull Regulatory authorities should ensure that statistical procedures and test methods have been properly applied to produce WET test results Evaluating other factors and data such as biological and statistical quality assurance and ensuring that test conditions and test acceptability criteria (TAC) have been met would be prudent (Sections 52 through 55)
bull Regulatory authorities should apply both the upper and lower bounds using the PMSD as an additional TAC (Section 64 and Table 3-6) The State of North Carolina implemented an effective WET program that required additional TAC and guidance for test methods that served to minimize test method variability (Appendix F)
bull Regulatory authorities should develop a QC checklist to assist in evaluating and interpreting toxicity test results (Section 5311) See Appendix E for examples of State WET implementation procedures
bull Regulatory authorities should consider participation in the National Environment Laboratory Accreditation Program and should conduct routine performance audit inspections to evaluate individual laboratory performance Inspections should evaluate the laboratoryrsquos performance with QC control charts based on reference toxicants examine procedures for conducting the toxicity test procedures and examine procedures for analyzing test results (Section 5311)
bull Regulatory authorities should incorporate revised technical guidance recently published by EPA captioned ldquoMethod Guidance and Recommendations for Whole Effluent Toxicity (WET) Testingrdquo
June 30 2000 7-4
Understanding and Accounting for Method Variability in WET Applications Under the NPDES Program
(40 CFR Part 136) (USEPA 2000a) The guidance addresses (1) error rate assumption adjustments (2) concentration-response relationships (3) incorporation of confidence intervals (4) acceptable dilution waters for testing (5) guidance on blocking by parentage for the chronic C dubia test method and (6) procedures for controlling pH drift
74 Future Directions
bull An independent peer-reviewed workshop should be convened to evaluate alternatives to the statistical approaches currently used in EPArsquos WET test methods Such a workshop might suggest alternatives regarding (1) WET statistical flowcharts (2) WET statistical methods used to estimate effect concentrations and (3) test data interpretation and review guidelines (Section 55)
bull Such a workshop might also evaluate additional QC requirements and recommendations regarding the specification of a reference toxicant and the concentrations to be tested for each test method (Section 531)
June 30 2000 7-5
Understanding and Accounting for Method Variability in WET Applications Under the NPDES Program
This page intentionally left blank
June 30 2000 7-6
80 BIBLIOGRAPHY
Anderson BS JW Hunt SL Turpen AR Coulon M Martin DL Denton and FH Palmer 1990 Procedures Manual for Conducting Toxicity Tests Developed by the Marine Bioassay Project California State Water Resources Control Board No 90-10WQ
Anderson SL and TJ Norberg-King 1991 Precision of short-term chronic toxicity tests in the real world Environ Toxicol Chem 10(2)143ndash145
APHA-AWWA-WEF 1998 Standard Methods for the Examination of Water and Wastewater (20th Edition) LS Clesceri AE Greenberg and A Eaton eds American Public Health Association American Water Works Association and Water Environment Federation Washington DC ISBN 0-87553-235shy7WB
American Society for Testing and Materials (ASTM) 1992 Standard Practice for Conducting an Interlaboratory Study To Determine the Precision of a Test Method E691-92
ASTM 1998 Standard Practice for Determination of Precision and Bias of Applicable Test Methods of Committee D-19 on Water D2777
Ausley LW 1996 Effluent toxicity testing variability In Whole Effluent Toxicity Testing An Evaluation of Methods and Prediction of Receiving System Impacts DR Grothe KL Dickson and DK Reed-Judkins eds Pensacola FL SETAC Press 157ndash171
Bailer AJ MR Hughes DL Denton and JT Oris 2000 An empirical comparison of effective concentration estimators for evaluating aquatic toxicity test responses Environ Toxicol Chem 19(1) 141-150
Biomonitoring Science Advisory Board (BSAB) 1994 West Coast Marine Species Chronic Protocol Variability Study Washington Department of Ecology Olympia WA
Burton GA A Raymon LA Ausley JA Black GM DeGraeve FA Fulk JF Heltshe WH Peltier JJ Pletl and JH Rodgers 1996 Session 4 Effluent toxicity test variability In Whole Effluent Toxicity Testing An Evaluation of Methods and Prediction of Receiving System Impacts DR Grothe KL Dickson and DK Reed-Judkins eds Pensacola FL SETAC Press 131ndash156
Chapman GA 1992 Sea Urchin (Strongylocentrotus purpuratus) Fertilization Test Method USEPA ERL-Narragansett Pacific Ecosystems Branch Newport OR
Chapman GA BS Anderson AJ Bailer RB Baird R Berger DT Burton DL Denton WL Goodfellow MA Heber LL McDonald TJ Norberg-King and PL Ruffier 1996a Discussion synopsis methods and appropriate endpoints In Whole Effluent Toxicity Testing An Evaluation of Methods and Prediction of Receiving System Impacts DR Grothe KL Dickson and DK Reed-Judkins eds Pensacola FL SETAC Press 51-82
Chapman PF M Crane J Wiles F Noppert and E McIndoe 1996b Improving the quality of statistics in regulatory ecotoxicity tests Ecotoxicol 5169-186
Chapman PM RS Caldwell and PF Chapman 1996c A warning NOECs are inappropriate for regulatory use Environ Toxicol Chem 1577ndash79
June 30 2000 8-1
Understanding and Accounting for Method Variability in WET Applications Under the NPDES Program
Collett D 1991 Modelling Binary Data London Chapman amp Hall
Commonwealth of Virginia 1993 Toxics Management Program Implementation Guidance
Davis RB AJ Bailer and JT Oris 1998 Effects of organism allocation on toxicity test results Environ Toxicol Chem 17(5) 928-931
DeGraeve GM JD Cooney BH Marsh TL Pollock NG Reichenbach JH Dean and MD Marcus 1991 Variability in the performance of the seven-day fathead minnow (Pimephales promelas) larval survival and growth test A within- and among-laboratory study Environ Toxicol Chem 10(9)1189ndash1203
DeGraeve GM JD Cooney BH Marsh TL Pollock and NG Reichenbach 1992 Variability in the performance of the 7-d Ceriodaphnia dubia survival and reproduction test A within- and among-laboratory study Environ Toxicol Chem 11(6)851ndash866
DeGraeve GM G Smith W Clement D McIntyre and T Forgette 1998 WET Testing Program Evaluation of Practices and Implementation Water Environment Research Foundation Project 94shyHHE-1 Alexandria VA
Denton DL and TJ Norberg-King 1996 Whole effluent toxicity statistics A regulatory perspective In Whole Effluent Toxicity Testing An Evaluation of Methods and Prediction of Receiving System Impacts DR Grothe KL Dickson and DK Reed-Judkins eds Pensacola FL SETAC Press 83ndash102
Denton DL and M Narvaez 1996 Regions 9 and 10 Guidance for Implementing Whole Effluent Toxicity Testing Programs U S Environmental Protection Agency Regions 9 and 10 May
Denton DL AL Suer BS Anderson and JW Hunt 1992 Precision of marine critical life stage tests with west coast species (abstract) In Society of Environmental Toxicology and Chemistry (SETAC) Abstracts 13th Annual Meeting November 8-12 1992 Cincinnati OH Pensacola FL SETAC Press 184
Dhaliwal BS RJ Dolan CW Batts JM Kelly RW Smith and S Johnson 1997 Warning replacing NOECs with point estimates may not solve regulatory contradictions Environ Toxicol Chem 16124ndash126
Dinnel PJ J Link and Q Stober 1987 Improved methodology for sea urchin sperm cell bioassay for marine waters Arch Environ Contam Toxicol 1623ndash32
Dunnett CW 1964 New tables for multiple comparisons with a control Biometrics 20482-491
Eagleson KW SW Tedder and LW Ausley 1986 Strategy for whole effluent toxicity evaluations in North Carolina In Aquatic Toxicology and Environmental Fate Ninth Volume ASTM STP 921 TM Poston R Purdy eds American Society for Testing and Materials Philadelphia PA 154-160
Environment Canada 1990 Guidance Document on Control of Toxicity Test Precision Using Reference Toxicants Ottawa Ontario Environmental Protection Conservation and Protection Report EPSIRM12
June 30 2000 8-2
Understanding and Accounting for Method Variability in WET Applications Under the NPDES Program
Environment Canada 2000 Guidance Document on Application and Interpretation of Single-species Tests in Environmental Toxicology Ottawa Ontario Environmental Technology Centre Method Development and Application Section Report EPS 1RM34
Erickson RJ LT Brooke MD Kahl F Vende SL Venter T Harting P Markee and RL Spehar 1998 Effects of laboratory test conditions on the toxicity of silver to aquatic organisms Environ Toxicol Chem 17(4) 572-578
Fulk FA 1996 Whole effluent toxicity testing variability A statistical perspective In Whole Effluent Toxicity Testing An Evaluation of Methods and Prediction of Receiving System Impacts DR Grothe KL Dickson and DK Reed-Judkins eds Pensacola FL SETAC Press 172ndash179
Grothe DR and RA Kimerle 1985 Inter- and intralaboratory variability in Daphnia magna effluent toxicity test results Environ Toxicol Chem 4(2)189ndash192
Grothe DR RA Kimerle and CD Malloch 1990 A perspective on biological assessments Water Environ Technol pp 1707ndash1710
Grothe DR KL Dickson and DK Reed-Judkins eds 1996 Whole Effluent Toxicity Testing An Evaluation of Methods and Prediction of Receiving System Impacts Pensacola FL SETAC Press
Hunt JW BS Anderson S Tudor MD Stephenson HM Puckett FH Palmer and MW Reeve 1996 Marine Bioassay Project Eighth Report Sacramento CA State Water Resources Control Board Report 85-102
Kahn HD and MB Rubin 1989 Use of statistical methods in industrial water pollution control regulations in the United States Environ Monitor Assess 12129ndash148
Moore TF SP Canton and M Grimes 2000 Investigation of the incidence of type I errors for chronic whole effluent toxicity testing using Ceriodaphnia dubia Environ Toxicol Chem 19(1)118-122
Morrison GE E Torelo R Comeleo R Walsh A Kuhn R Burgess M Tagliabue and W Green 1989 Interlaboratory precision of saltwater short-term chronic toxicity tests Res J Wat Pollut Control Fed 611707-1710
New Jersey Department of Environmental Protection 1994 The Use of Chronic Whole Effluent Toxicity Testing in the New Jersey Pollutant Discharge Elimination SystemmdashAn Assessment of Compliance Data
North Carolina Department of Environment and Natural Resources 1998 North Carolina Biological Laboratory CertificationCriteria Procedures Document Division of Water Quality Water Quality Section Raleigh NC
Oris JT and AJ Bailer 1993 Statistical analysis of the Ceriodaphnia toxicity test Sample size determination for reproductive effects Environ Toxicol Chem 12(1)85ndash90
Rosebrock MM NW Bedwell and LW Ausley 1994 Indicators of Ceriodaphnia dubia chronic toxicity test performance and sensitivity Poster presentation Society of Environmental Toxicology and Chemistry 15th Annual Meeting Denver CO
June 30 2000 8-3
Understanding and Accounting for Method Variability in WET Applications Under the NPDES Program
Rue WJ JA Fava and DR Grothe 1988 A review of inter- and intralaboratory effluent toxicity test method variability In Aquatic Toxicology and Hazard Assessment (10th Volume) WJ Adams GA Chapman and WG Landis eds ASTM STP 971
SAS Institute 1990 SASSTA Userrsquos Guide (4th Edition) Version 6 Cary NC
Sheppard CR 1999 How large should my sample be Some quick guides to sample size and the power of tests Mar Pollut Bull 38(6)439-477
Shukla R Q Wang FA Fulk C Deng and DL Denton 2000 Bioequivalence approach for whole effluent toxicity testing Environ Toxicol Chem 19(1)169-174
Southern California Toxicity Assessment Group (SCTAG) 1996 Reference Toxicant Standardization and Use in Toxicity Testing JR Gully RB Baird PJ Markle and JP Bottomley eds First Report Fountain Valley CA
SCTAG 1997 Laboratory Practices Checklist Toxicity Testing (3rd Edition) Fountain Valley CA
Starrett GL DL Denton and RW Smith 1993 Sensitivity of toxicity test protocols and the need for additional quality assurance requirements (abstract) In Society of Environmental Toxicology and Chemistry (SETAC) Abstracts 14th Annual Meeting November 14-18 1993 Houston TX Pensacola FL SETAC Press P106 p 183
Thursby GB J Heltshe and KJ Scott 1997 Revised approach to toxicity test acceptability criteria using a statistical performance assessment Environ Toxicol Chem 161322-1329
TOXISreg [computer software] Ojai CA EcoAnalysis Inc
TOXCALCreg [computer software] McKinleyville CA TidePool Scientific Software
USEPA 1985 Methods for Measuring the Acute Toxicity of Effluents to Freshwater and Marine Organisms (3rd Edition) W Peltier and CI Weber eds Environmental Monitoring Systems Laboratory Cincinnati OH EPA6004-85013
USEPA 1988 Short-term Methods for Estimating the Chronic Toxicity of Effects of Receiving Water to MarineEstuarine Organisms (1st Edition) CI Weber WB Horning DJ Klemm TW Neiheisel PA Lewis EL Robinson JR Menkedick FA Kessler eds Office of Research and Development Cincinnati OH EPA6004-87028
USEPA 1989 Short-term Methods for Estimating the Chronic Toxicity of Effluents and Receiving Waters to Freshwater Organisms (2nd Edition) CI Weber WH Peltier TJ Norberg-King WB Homing II FA Kessler JR Menkedick TW Neiheisel PA Lewis DJ Klemm QH Pickering EL Robinson JM Lazorchak LJ Wymer RW Freyberg eds Office of Research and Development Cincinnati OH EPA6004-89001
USEPA 1989a Generalized Methodology for Conducting Industrial Toxicity Reduction Evaluations (TREs) Office of Research and Development Cincinnati OH EPA600-2-88-070
USEPA 1989b Toxicity Reduction Evaluation Protocol for Municipal Wastewater Treatment Plants Office of Research and Development Washington DC EPA6002-88-062
June 30 2000 8-4
Understanding and Accounting for Method Variability in WET Applications Under the NPDES Program
USEPA 1989c Methods for Aquatic Toxicity Identification Evaluations Phase II Toxicity Identification Procedures Office of Research and Development Washington DC EPA6003-88-035
USEPA 1989d Methods for Aquatic Toxicity Identification Evaluations Phase III Toxicity Confirmation Procedures Office of Research and Development Washington DC EPA6003-88-036
USEPA1991a Technical Support Document for Water Quality-based Toxics Control Office of Water Washington DC EPA5052-90-001
USEPA 1991b Methods for Aquatic Toxicity Identification Evaluations Phase I Toxicity Characterization Procedures (2nd Edition) TJ Norberg-King DI Mount EJ Durhan GT Ankley LP Burkhard JR Amato MT Lukasewycz MK Schubauer-Berigan and L Anderson-Carnahan eds Office of Research and Development Washington DC EPA6006-91-003
USEPA 1992 Toxicity Identification Evaluation Characterization of Chronically Toxic Effluents Phase I TJ Norberg-King DI Mount JR Amato DA Jensen and JA Thompson eds Office of Research and Development Washington DC EPA6006-91-005F
USEPA 1993 Methods for Measuring the Acute Toxicity of Effluents and Receiving Waters to Freshwater and Marine Organisms (4th Edition) CI Weber ed Office of Research and Development Cincinnati OH EPA6004-90027F
USEPA 1993a Methods for Aquatic Toxicity Identification Evaluations Phase II Toxicity Identification Procedures for Samples Exhibiting Acute and Chronic Toxicity Office of Research and Development Washington DC EPA600R-92-080
USEPA 1993b Methods for Aquatic Toxicity Identification Evaluations Phase III Toxicity Identification Procedures for Acutely and Chronically Toxic Samples US Environmental Protection Agency Duluth MN EPA600R-92-081
USEPA 1994a Short-term Methods for Estimating the Chronic Toxicity of Effluents and Receiving Waters to Marine and Estuarine Organisms (2nd Edition) DJ Klemm GE Morrison TJ Norberg-King WH Peltier and MA Heber eds Office of Research and Development Cincinnati OH EPA6004shy91003
USEPA 1994b Short-term Methods for Estimating the Chronic Toxicity of Effluents and Receiving Waters to Freshwater Organisms (3rd Edition) PA Lewis DJ Klemm JM Lazorchak TJ Norberg-King WH Peltier and MA Heber eds Office of Research and Development Cincinnati OH EPA6004shy91002
USEPA 1994c Short-term Methods for Estimating the Sediment Toxicity of Effluents and Receiving Waters to Freshwater and Estuarine Organisms Office of Research and Development Duluth MN EPA600R-94-001
USEPA 1995 Short-term Methods for Estimating the Chronic Toxicity of Effluents and Receiving Waters to West Coast Marine and Estuarine Organisms GA Chapman DL Denton and JM Lazorchak eds Office of Research and Development Cincinnati OH EPA600R-95-136
USEPA 1996a NPDES Permit Writerrsquos Manual Office of Water Washington DC EPA833B-96-003
USEPA 1996b Guide to Method Flexibility and Approval of EPA Water Methods EPA821D-96-004
June 30 2000 8-5
Understanding and Accounting for Method Variability in WET Applications Under the NPDES Program
USEPA 1999a National Environmental Laboratory Accreditation Conference Constitution Bylaws and Standards Office of Research and Development Washington DC EPA600R-99-068
USEPA 1999b Toxicity Reduction Evaluation Guidance for Municipal Wastewater Treatment Plants (2nd
Edition) Office of Water Washington DC EPA833B-99-002
USEPA 1999c Errata for Effluent and Receiving Water Toxicity Test Manuals Acute Toxicity manuals Acute Toxicity of Effluents and Receiving Waters to Freshwater and Marine Organisms Short-Term methods for Estimating the Chronic Toxicity of Effluents and Receiving Waters to Freshwater Organisms and Short-Term Methods for Estimating the Chronic Toxicity of Effluents and Receiving Waters to Marine and Estuaraine Organisms Office of Research and Development Duluth MN
USEPA 2000a Method Guidance and Recommendations for Whole Effluent Toxicity (WET) Testing (40 CFR Part 136) Office of Water Office of Science and Technology Washington DC EPA821B-00shy004
USEPA 2000b Methods for Measuring the Toxicity and Bioaccumulation of Sediment-Associated Contaminants with Freshwater Invertebrates (2nd Edition) Office of Research and Development Duluth MN EPA600R-99064
Wang Q DL Denton and R Shukla 2000 Applications and statistical properties of minimum significant difference-based criterion testing in a toxicity testing program Environ Toxicol Chem 19(1)113-117
Warren-Hicks W BR Parkhurst D Moore and S Teed 1999 Whole Effluent Toxicity Testing Methods Accounting for Variance Water Environment Research Foundation Project 95-PQL-1 ISBN 1shy893664-01-5
Washington State Department of Ecology 1997 Laboratory Guidance and Whole Effluent Toxicity Test Review Criteria Publication No WQ-R-95-80
Washington State Department of Ecology 1998 Whole Effluent Toxicity (WET) Program Evaluation Publication No 98-03
Whitehouse P M Crane CJ Redshaw and C Turner 1996 Aquatic toxicity tests for the control of effluent discharges in the UK The influence of test precision Ecotoxicol 5155-168
June 30 2000 8-6

Understanding and Accounting for Method Variability in WET Applications Under the NPDES Program
This page intentionally left blank
June 30 2000 x
EXECUTIVE SUMMARY
Background
The Federal Water Pollution Control Act commonly known as the Clean Water Act was enacted in 1972 with the objective of ldquorestoring the chemical physical and biological integrity of the Nationrsquos watersrdquo Among the US Environmental Protection Agencyrsquos (EPArsquos) efforts toward this objective is the National Pollutant Discharge Elimination System (NPDES) program This program is designed to control toxic discharges implement water quality standards and restore waters to ldquofishable and swimmablerdquo conditions Point sources that discharge pollutants must do so under the terms and conditions of an NPDES permit One approach EPA employs to control toxic pollutants under the NPDES permits program is using whole effluent toxicity (WET) controls
EPA is issuing this document to both address questions raised on WET test method variability and to satisfy a requirement of a July 1998 settlement agreement with litigants for the Western Coalition of Arid States (WestCAS) and Edison Electric Institute et al This document was developed by an EPA workgroup consisting of EPArsquos Office of Waterrsquos (OW) Headquarters Office of Enforcement and Compliance Assurance Office of Research and Development and Regional staff The document was externally peer reviewed in accordance with EPArsquos peer review guidelines The document addresses WET test method variability by identifying the potential sources of variance associated with WET testing discusses how to minimize it and finally describes how to address it within the NPDES permitting program The document cites both Agency and external ongoing research on this topic and scientific findings particularly technical information that support efforts to minimize WET test result variability
While the document provides recommendations on how to reduce or minimize WET test variability the document does not supersede current Agency guidance policy or regulation including EPArsquos promulgated test methods (40 CFR Part 136) which remain in effect EPA expects that implementation of the NPDES program and NPDES permits will continue to comply with regulatory requirements and follow applicable EPA guidance and policy
Why WET Testing
Whole effluent toxicity is the aggregate toxic effect of an aqueous sample (eg effluent receiving water) measured directly by an aquatic toxicity test Aquatic toxicity tests are laboratory experiments that measure the biological effect (eg growth survival and reproduction) of effluents or receiving waters on aquatic organisms In aquatic toxicity tests organisms of a particular species are held in test chambers and exposed to different concentrations of an aqueous sample for example a reference toxicant an effluent or a receiving water and observations are made at predetermined exposure periods At the end of the test the responses of test organisms are used to estimate the effects of the toxicant or effluent
Whole effluent toxicity test results are an integral tool in the assessment of water quality For the protection of aquatic life the integrated strategy includes the use of three control approaches the chemical-specific control approach the WET control approach and the biological criteriabioassessmentbioassay approach The primary advantage of using WET controls over individual chemical-specific controls is that WET integrates the effects of all chemical(s) in the aqueous sample Reliance solely on chemical-specific numeric criteria or biological criteria would result in only a partially effective State toxics control program These toxicity tests therefore must be performed using best laboratory practices and every effort must be made to enhance repeatability of the test method This document presents EPArsquos approaches to achieve the goals listed below
June 30 2000 xi
Understanding and Accounting for Method Variability in WET Applications Under the NPDES Program
Effect of This Guidance
This document clarifies several issues regarding WET variability and reaffirms EPArsquos guidance in the Technical Support Document for Water Quality-Based Toxics Control (TSD USEPA 1991a) This document provides NPDES regulatory authorities and all stakeholders including permittees with guidance and recommendations on how to address WET variability EPArsquos recommendations and conclusions are detailed in Chapter 7 and Appendix C provides sample NPDES permit language reflecting these recommendations
The most significant recommendation is to use and report the values for the percent minimum significant difference (PMSD) with all WET data results The minimum significant difference (MSD) represents the smallest difference between the control mean and a treatment mean that leads to the statistical rejection of the null hypothesis (ie no toxicity) at each concentration of the WET test dilution series The MSD provides an indication of within-test variability and test method sensitivity Using this information the regulatory authority and permittees can better evaluate WET test results
This document makes several other recommendations such as continue to use the TSD statistical approach without adjusting for test method variability obtain sufficient representative effluent samples verify effluent toxicity data against reference toxicant data maintain clear communication between the regulatory authority and permittee and maintain good laboratory checks and certification programs
Three Goals of This Document
This document describes three goals EPA has defined to address issues surrounding WET variability In addition the document is intended to satisfy the requirements of a settlement agreement to resolve litigation over rulemaking to standardize WET testing procedures
1 Quantify the variability of promulgated test methods and report a coefficient of variation (CV) as a measure of test method variability (see Chapter 3 and Appendix A)
2 Evaluate the statistical methods described in the Technical Support Document for Water Quality-Based Toxics Control (TSD) for determining the need for and deriving WET permit conditions (see Chapter 6 and Appendix G)
3 Suggest guidance for regulatory authorities on approaches to address and minimize test method variability (Chapter 6) In addition the document is intended to provide guidance to regulatory authorities permittees and testing laboratories on conducting the biological and statistical methods and evaluating test effect concentrations (Chapter 5)
Data Evaluated
EPA assembled a comprehensive data base to examine variability in the WET test methods from the EPA Regions several States and private laboratories which represent a widespread sampling of typical laboratories and laboratory practices EPA applied several criteria to the data before they were accepted including detailed sample information strict adherence to published EPA WET test methods and test acceptability criteria (TAC) The resulting data base contains data from 75 laboratories for 23 methods for tests concluded between 1988 and 1999
Approach Taken To Evaluate Test Method Variability
The variability that EPA is assessing is associated with replicate tests using reference toxicants and WET testing methods within analytical laboratories The focus of this guidance is not to quantify test variability between laboratories or to quantify the total variability of WET tests conducted on effluents Rather the purpose is to quantify method variability within laboratories (repeatability) to enable NPDES
June 30 2000 xii
Understanding and Accounting for Method Variability in WET Applications Under the NPDES Program
programs to distinguish between variability caused by the testing method and variability associated with toxicity of multiple effluent samples taken from the same facility
To quantify test method variability within and between laboratories using this data base EPA examined two key parameters (1) the effect concentrations [effect concentration (EC25) lethal concentration (LC50) no observed effect concentration (NOEC)] estimated by the test which are used to derive WET permit limits and evaluate self-monitoring data with those limits and (2) the minimum significant difference (MSD) which summarizes the variability of organism responses at each test concentration within an individual test The MSD represents the smallest difference that can be distinguished between the response of the control organisms and the response of the organisms exposed to the aqueous sample The MSD provides an indication of within-test variability and test method sensitivity
Principal Conclusions
The principal conclusions of this document follow
Evaluation of Test Method Variability
bull Comparisons of WET method precision with method precision for analytes commonly limited in NPDES permits clearly demonstrate that the variability of the promulgated WET methods is within the range of variability experienced in other types of analyses Several independent researchers and studies also have concluded that method performance improves when prescribed methods are followed closely by experienced analysts (Section 43)
bull This document provides interim CVs for promulgated WET methods in Appendix A Tables A-1 (acute methods) and A-2 (chronic methods) pending completion of between-laboratory studies which may affect these interim CV estimates
Evaluation of Approach To Incorporate Test Method Variability
bull EPArsquos TSD presents guidance for developing effluent limits that appropriately protect water quality regarding both effluent variability and analytical variability provided that the WET criteria and waste load allocation (WLA) are derived correctly (Section 6 and Appendix G)
bull EPArsquos analysis of data gathered in the development of this document indicates that the TSD approach appropriately accounts for both effluent variability and method variability EPA does not believe a reasonable alternative approach is available to determine a factor that would discount the effects of method variability using the TSD procedures because the approach would not ensure adequate protection of water quality (Section 611 and Appendix G)
Development of Guidance to Regulatory Authorities
bull EPA recommends that regulatory authorities implement the statistical approach as described in the TSD to evaluate effluent for reasonable potential and to derive WET limits or monitoring triggers (Section 61 and Appendix G)
bull EPA recommends that regulatory authorities calculate the facility-specific CVs using point estimate techniques to determine the need for and derive a permit limit for WET even if self-monitoring data are to be determined using hypothesis testing techniques for example to determine a ldquono effectrdquo concentration (ldquoNOECrdquo) This document describes such facility-specific calculations (Section 341 and 62)
June 30 2000 xiii
Understanding and Accounting for Method Variability in WET Applications Under the NPDES Program
Additional Recommendations and Guidance
This document also provides recommendations and guidance on minimizing variability in three specific areas in order to generate sound WET test results (1) obtaining a representative effluent sample (2) conducting the toxicity tests properly to generate the biological endpoints and (3) conducting the appropriate statistical analysis to obtain defensible effect concentrations (EC25 LC50 NOEC) If these recommendations are addressed the reliability of the test endpoint values should improve
bull Regulatory Authorities Design a sampling program that collects representative effluent samples to fully characterize effluent variability for a specific facility over time (Sections 613 and 62)
bull Regulatory Authorities Ensure proper application of WET statistical procedures and test methods (Sections 52 through 55)
bull Regulatory Authorities Incorporate both the upper and lower bounds using the percent minimum significant difference (PMSD) to control and to minimize within-test method variability and increase test sensitivity To achieve the PMSD upper bound either the replication should increase or within-test method variability should decrease or both (Section 64 and Table 3-6)
bull Testing Laboratories Encourage WET testing laboratories to maintain control charts for PMSD and the control mean and report the PMSD with all WET test results (Section 5311)
bull Regulatory Authorities Participate in the National Environment Laboratory Accreditation Program and routine performance audit inspections to evaluate laboratory performance (Section 5311)
bull Regulatory Authorities Incorporate EPArsquos guidance on error rate assumption adjustments concentration-response relationships confidence intervals acceptable dilution waters how to block by parentage for the chronic Ceriodaphnia dubia test and control of pH drift (USEPA 2000a)
June 30 2000 xiv
LIST OF ACRONYMS AND ABBREVIATIONS1
ACR acute-to-chronic ratio
AML average monthly limit
ANOVA analysis of variance
APHA-AWWA- American Public Health Association-American Water Works Association-Water WEF Environment Federation
ASTM American Society for Testing and Materials
BSAB Biomonitoring Science Advisory Board
CCC criteria continuous concentration
CFR Code of Federal Regulations
CMC criteria maximum concentration
CV coefficient of variation
CWA Clean Water Act
DMR discharge monitoring report
EMS error mean square [also referred to as mean square error (MSE)]
EPA US Environmental Protection Agency (also the Agency)
FR Federal Register
IC inhibition concentration
IWC instream waste concentration (sometimes referred to as receiving water concentration)
LC50 lethal concentration 50 percent
LOEC lowest observed effect concentration
LTA long-term average (LTAa = acute LTA LTAc = chronic LTA LTAac = acute-to-chronic LTA)
MDL maximum daily limit
MSD minimum significant difference
MSE mean square error [also referred to as error mean square (EMS)]
MZ mixing zone
NELAP National Environment Laboratory Accreditation Program
NOEC no observed effect concentration
NPDES National Pollutant Discharge Elimination System
NTRD National Toxicant Reference Database
PAI Performance Audit Inspections
PMSD percent minimum significant difference
Note These acronyms and abbreviations may have other meanings in other EPA programs or documents
June 30 2000
1
xv
Understanding and Accounting for Method Variability in WET Applications Under the NPDES Program
QA quality assurance
QC quality control
rMSE square root of the mean square error
RP reasonable potential
RWC receiving water concentration (sometimes referred to as instream waste concentration)
SCTAG Southern California Toxicity Assessment Group
SETAC Society of Environmental Toxicology and Chemistry
TAC test acceptability criteria
TIE toxicity identification evaluation
TMDL total maximum daily load
TRE toxicity reduction evaluation
TSD EPArsquos Technical Support Document for Water Quality-based Toxics Control (March 1991 EPA5052-90-001)
TU toxic unit (TUa = acute toxicity TUc = chronic toxicity)
VF variability factor
WET whole effluent toxicity
WLA waste load allocation
WQBEL water quality based effluent limit
June 30 2000 xvi
GLOSSARY
Acute Toxicity Test is a test to determine the concentration of effluent or ambient waters that causes an adverse effect (usually death) on a group of test organisms during a short-term exposure (eg 24 48 or 96 hours) Acute toxicity is measured using statistical procedures (eg point estimate techniques or a t-test)
Acute-to-Chronic Ratio (ACR) is the ratio of the acute toxicity of an effluent or a toxicant to its chronic toxicity It is used as a factor for estimating chronic toxicity on the basis of acute toxicity data or for estimating acute toxicity on the basis of chronic toxicity data
Ambient Toxicity is measured by a toxicity test on a sample collected from a receiving waterbody
ANOVA is analysis of variance
Average Monthly Limit (AML) is the calculated average monthly limit of waste load allocation assigned by a State or EPA for a particular facility
CCC are water quality criteria for chronic exposure (criteria continuous concentrations)
Chronic Toxicity Test is a short-term test in which sublethal effects (eg reduced growth or reproduction) are usually measured in addition to lethality Chronic toxicity is defined as TUc = 100NOEC or TUc = 100ECp or ICp
CMC are water quality criteria for acute exposures (criteria maximum concentration)
Coefficient of Variation (CV) is a standard statistical measure of the relative variation of a distribution or set of data defined as the standard deviation divided by the mean It is also called the relative standard deviation (RSD) The CV can be used as a measure of precision within (within-laboratory) and between (between-laboratory) laboratories or among replicates for each treatment concentration
Confidence Interval is the numerical interval constructed around a point estimate of a population parameter
Effect Concentration (EC) is a point estimate of the toxicant concentration that would cause an observable adverse effect (eg death immobilization or serious incapacitation) in a given percent of the test organisms calculated from a continuous model (eg Probit Model) EC25 is a point estimate of the toxicant concentration that would cause an observable adverse effect in 25 percent of the test organisms
Hypothesis Testing is a statistical technique (eg Dunnettrsquos test) for determining whether a tested concentration is statistically different from the control Endpoints determined from hypothesis testing are NOEC and LOEC The two hypotheses commonly tested in WET are
Null hypothesis (Ho) The effluent is not toxic Alternative hypothesis (Ha) The effluent is toxic
Inhibition Concentration (IC) is a point estimate of the toxicant concentration that would cause a given percent reduction in a non-lethal biological measurement (eg reproduction or growth) calculated from a continuous model (ie Interpolation Method) IC25 is a point estimate of the toxicant concentration that would cause a 25-percent reduction in a non-lethal biological measurement
Instream Waste Concentration (IWC) is the concentration of a toxicant in the receiving water after mixing The IWC is the inverse of the dilution factor It is sometimes referred to as the receiving water concentration (RWC)
June 30 2000 xvii
Understanding and Accounting for Method Variability in WET Applications Under the NPDES Program
LC50 (lethal concentration 50 percent) is the toxicant or effluent concentration that would cause death in 50 percent of the test organisms
Lowest Observed Effect Concentration (LOEC) is the lowest concentration of an effluent or toxicant that results in adverse effects on the test organisms (ie where the values for the observed endpoints are statistically different from the control)
Long-term Averages (LTAs) of pollutant concentration or effluent toxicity are calculated from waste load allocations (WLAs) typically assuming that the WLA is a 99th percentile value (or another upper bound value) based on the lognormal distribution One LTA is calculated for each WLA (typically an acute LTA and a chronic LTA for aquatic life protection) The LTA represents expected long-term average performance from the permitted facility required to achieve the associated WLA
Maximum Daily Limit (MDL) is the calculated maximum WLA assigned by a State or EPA for a particular facility
Minimum Significant Difference (MSD) is the magnitude of difference from control where the null hypothesis is rejected in a statistical test comparing a treatment with a control MSD is based on the number of replicates control performance and power of the test
Mean Square Error (MSE) is the average dispersion of the items around the treatment means It is an estimate of a common variance the within variation or variation among observations treated alike [Also referred to as error mean square (EMS)]
Mixing Zone is an area where an effluent discharge undergoes initial dilution and is extended to cover the secondary mixing in the ambient waterbody A mixing zone is an allocated impact zone where water quality criteria can be exceeded as long as acutely toxic conditions are prevented
No Observed Effect Concentration (NOEC) is the highest tested concentration of an effluent or toxicant that causes no observable adverse effect on the test organisms (ie the highest concentration of toxicant at which the values for the observed responses are not statistically different from the controls)
National Pollutant Discharge Elimination System (NPDES) program regulates discharges to the nationrsquos waters Discharge permits issued under the NPDES program are required by EPA regulation to contain where necessary effluent limits based on water quality criteria for the protection of aquatic life and human health
Power is the probability of correctly detecting an actual toxic effect (ie declaring an effluent toxic when in fact it is toxic)
Precision is a measure of reproducibility within a data set Precision can be measured both within a laboratory (within-laboratory) and between laboratories (between-laboratory) using the same test method and toxicant
Quality Assurance (QA) is a practice in toxicity testing that addresses all activities affecting the quality of the final effluent toxicity data QA includes practices such as effluent sampling and handling source and condition of test organisms equipment condition test conditions instrument calibration replication use of reference toxicants recordkeeping and data evaluation
Quality Control (QC) is the set of more focused routine day-to-day activities carried out as part of the overall QA program
Reasonable Potential (RP) is where an effluent is projected or calculated to cause an excursion above a water quality standard based on a number of factors
xviii June 30 2000
Understanding and Accounting for Method Variability in WET Applications Under the NPDES Program
Reference Toxicant Test is a check of the sensitivity of the test organisms and the suitability of the test methodology Reference toxicant data are part of a routine QAQC program to evaluate the performance of laboratory personnel and the robustness and sensitivity of the test organisms
Significant Difference is defined as a statistically significant difference (eg 95 percent confidence level) in the means of two distributions of sampling results
Statistic is a computed or estimated quantity such as the mean standard deviation or coefficient of variation
Test Acceptability Criteria (TAC) are specific criteria for determining whether toxicity test results are acceptable The effluent and reference toxicant must meet specific criteria as defined in the test method (eg for the Ceriodaphnia dubia survival and reproduction test the criteria are as follows the test must achieve at least 80 percent survival and an average of 15 young per surviving female in the controls)
Total Maximum Daily Load (TMDL) is a determination of the amount of a pollutant or property of a pollutant from point nonpoint and natural background sources including a margin of safety that may be discharged to a water quality-limited waterbody
t-Test (formally Studentrsquos t-Test) is a statistical analysis comparing two sets of replicate observations in the case of WET only two test concentrations (eg a control and 100 percent effluent) The purpose of this test is to determine if the means of the two sets of observations are different [eg if the 100-percent effluent concentration differs from the control (ie the test passes or fails)]
Type I Error (alpha) is the rejection of the null hypothesis (Ho) when it is in fact true (ie determining that the effluent is toxic when the effluent is not toxic)
Type II Error (beta) is the acceptance of the null hypothesis (Ho) when it is not true (ie determining that the effluent is not toxic when the effluent is toxic)
Toxicity Test is a procedure to determine the toxicity of a chemical or an effluent using living organisms A toxicity test measures the degree of effect of a specific chemical or effluent on exposed test organisms
Toxic Unit-Acute (TUa) is the reciprocal of the effluent concentration (ie TUa = 100LC50) that causes 50 percent of the organisms to die by the end of an acute toxicity test
Toxic Unit-Chronic (TUc) is the reciprocal of the effluent concentration (eg TUc = 100NOEC) that causes no observable effect (NOEC) on the test organisms by the end of a chronic toxicity test
Toxic Unit (TU) is a measure of toxicity in an effluent as determined by the acute toxicity units (TUa) or chronic toxicity units (TUc) measured Higher TUs indicate greater toxicity
Toxicity Identification Evaluation (TIE) is a set of procedures used to identify the specific chemicals causing effluent toxicity
Toxicity Reduction Evaluation (TRE) is a site-specific study conducted in a step-wise process designed to identify the causative agents of effluent toxicity isolate the source of toxicity evaluate the effectiveness of toxicity control options and then confirm the reduction in effluent toxicity
Variance is a measure of the dispersion in a set of values defined as the sum of the squared deviations divided by their total number
Whole Effluent Toxicity (WET) is the total toxic effect of an effluent measured directly with a toxicity test
Waste Load Allocation (WLA) is the portion of a receiving waterrsquos total maximum daily load that is allocated to one of its existing or future point sources of pollution
June 30 2000 xix
Understanding and Accounting for Method Variability in WET Applications Under the NPDES Program
This page intentionally left blank
June 30 2000 xx
10 INTRODUCTION
11 Background
The Federal Water Pollution Control Act commonly known as the Clean Water Act (CWA) was enacted in 1972 with the objective of ldquorestoring the chemical physical and biological integrity of the Nationrsquos watersrdquo Several goals and policies were established in the Act including the following
bull Eliminating the discharge of pollutants into navigable waters by 1985
bull Wherever attainable achieving an interim goal of water quality that provides for the protection and propagation of fish shellfish and wildlife and provides for recreation in and on the water by November 1 1983 and
bull Prohibiting the discharge of toxic pollutants in toxic amounts
In the 28 years since the CWA was enacted the US Environmental Protection Agency (EPA) and States authorized to administer EPArsquos National Pollutant Discharge Elimination System (NPDES) permitting program have made significant progress toward achieving these goals NPDES is designed to control toxic discharges implement a water quality standards program and restore waters to ldquofishable and swimmablerdquo conditions A point source that discharges pollutants to waters of the United States must do so under the terms and conditions of an NPDES permit In setting these terms and conditions EPA and the States have integrated their control of toxic pollutants through combined use of three approaches [Technical Support Document for Water Quality-based Toxics Control (USEPA 1991a referred to as the TSD)]
bull Chemical-specific controls
bull Whole effluent toxicity (WET) controls and
bull Biological criteriabioassessments and bioassays
The WET approach to protection of water quality is the primary subject of this document
In 1989 EPA defined whole effluent toxicity as ldquothe aggregate toxic effect of an effluent measured directly by an aquatic toxicity testrdquo [54 Federal Register (FR) 23868 at 23895 June 2 1989] Aquatic toxicity tests are laboratory experiments that measure the biological effect (eg growth survival and reproduction) of effluents or receiving waters on aquatic organisms In aquatic toxicity tests groups of organisms of a particular species are held in test chambers and exposed to different concentrations of an aqueous test sample for example a reference toxicant an effluent or a receiving water Observations are made at predetermined exposure periods At the end of the test the responses of test organisms are used to estimate the effects of the toxicant or effluent
In the early 1980s EPA published methods (USEPA 1985 1988 1989) for estimating the short-term acute and chronic toxicity of effluents and receiving waters to freshwater and marine organisms WET data gathered in the 1980s indicated that approximately 40 percent of NPDES facilities nationwide discharged an effluent with sufficient toxicity to cause water quality problems Further reductions in the toxicity of wastewater discharges were necessary to achieve compliance with narrative water quality standards expressed as ldquono toxics in toxic amountsrdquo In response to these findings EPA implemented a policy to reduce or eliminate toxic discharges The Policy for the Development of Water Quality-based Permit Limitations for Toxic Pollutants (49 FR 9016 March 9 1984) introduced EPArsquos integrated toxics control program To support this policy EPA developed the TSD (USEPA 1991a) The TSD provides guidance to
June 30 2000 1-1
Understanding and Accounting for Method Variability in WET Applications Under the NPDES Program
regulators in implementing WET testing requirements in NPDES permits In 1989 EPA promulgated regulations specifying procedures for determining when water quality-based effluent limitations are required in NPDES permits [40 CFR 12244(d)] On October 26 1995 EPA promulgated WET test methods (USEPA 1993 1994a and 1994b) and added them to the list of EPA methods approved under Section 304(h) of the CWA (40 CFR 136) for use in the NPDES program Although the rulemaking was challenged in court that challenge has been stayed pending completion of a settlement agreement The rulemaking remains in force and effect unless and until EPA takes further action
12 Effect of This Guidance
This document attempts to clarify several issues regarding WET variability and reaffirms EPArsquos earlier guidance and recommendations published in the TSD (USEPA 1991a) This document is intended to provide NPDES regulatory authorities and all stakeholders including permittees with guidance and recommendations on how to understand and account for measurement variability in WET testing The documentrsquos recommendations and conclusions are detailed in Section 7 Appendix C provides sample NPDES permit language reflecting these recommendations
The most significant recommendation is to use and report the values for the percent minimum significant difference (PMSD) with all WET data results The minimum significant difference (MSD) is the smallest difference that can be distinguished between the response of control organisms and the response of test organisms at each concentration of the WET test dilution series The MSD provides an indication of the within-test variability and test method sensitivity Using this information the regulatory authority and permittees can better evaluate WET test results
This document also recommends the following
bull Continue to use the EPA TSD statistical approach for NPDES permit limit development (no test method variability adjustments are needed)
bull Collect and evaluate a sufficient number of representative effluent samples
bull Verify effluent toxicity data carefully along with reference toxicant data
bull Maintain good communication between the regulatory authority and permittee throughout all phases of the permitting process
bull Implement the PMSD to evaluate both WET and reference toxicant data to minimize within-test method variability and increase test sensitivity
bull Maintain laboratory checks with good laboratory certification programs to encourage experienced laboratories and skilled analysts for the toxicity testing program for individual WET laboratory performance
13 Three Goals of This Document
EPA prepared this document to achieve the following three goals
1 Quantify the variability of promulgated test methods and report a coefficient of variation (CV) as a measure of test method variability (see Chapter 3 and Appendix A)
June 30 2000 1-2
Understanding and Accounting for Method Variability in WET Applications Under the NPDES Program
2 Evaluate the statistical methods described in the Technical Support Document for Water Quality-Based Toxics Control (TSD) for determining the need for and deriving WET permit conditions (see Chapter 6 and Appendix G)
3 Suggest guidance for regulatory authorities on approaches to address and minimize test method variability (Chapter 6) In addition the document is intended to provide guidance to regulatory authorities permittees and testing laboratories on conducting the biological and statistical methods and evaluating test effect concentrations (Chapter 5)
This document does not address effluent variability It does however discuss how handling effluent samples can affect tests Chapter 2 provides definitions of terms used and discusses the ways in which variability can be quantified Chapter 3 describes the variability of the effect concentration estimates (EC25 LC50 and NOEC) and the variability of endpoint measurements (survival growth and reproduction) Chapter 4 discusses WET variability in the context of chemical-specific method variability Chapter 5 provides guidance to permittees testing laboratories and regulatory authorities to minimize test method variability Chapter 6 provides guidance to regulatory authorities on how to determine reasonable potential (RP) and derive permit limits or monitoring triggers and evaluate self-monitoring data Chapter 7 presents EPArsquos principal conclusions Chapter 8 is a bibliography containing a list of documents cited herein and additional reading material
June 30 2000 1-3
Understanding and Accounting for Method Variability in WET Applications Under the NPDES Program
This page intentionally left blank
June 30 2000 1-4
20 DEFINITION AND MEASUREMENT OF METHOD VARIABILITY IN WET TESTING
The terms used to express toxicity test results are defined in this chapter and methods for quantifying WET test method variability are discussed Additional terms used throughout this document along with their definitions are provided in the Glossary as part of the front matter of this document
21 Terms and Definitions
Biological endpoints are the biological observations recorded when conducting toxicity tests These observations may include the number of surviving organisms or the number of young produced There are two basic types of biological endpoints responses recorded as responseno response (eg dead or alive) are quantal data responses recorded as a measured response (eg weight) or as a count (eg number of young produced) are considered continuous data For most WET tests the observations for each tested concentration are combined and then reported as an average or percentage to represent the biological endpoint For example the fathead minnow larval survival and growth chronic test method has two biological endpoints (ie percent survival and average dry weight for each test concentration)
Effect concentrations are concentrations of a test material (ie effluent referent toxicant receiving water) derived from the observed biological endpoints followed by data analysis using either hypothesis testing procedures or point estimate techniques Effect concentrations derived using point estimation techniques represent the concentration of a test material at which a predetermined level of effect occurs For example LC50 is the lethal concentration at which 50 percent of the organisms respond Effect concentrations commonly estimated for WET methods are LC50 EC50 (effect concentration at which a 50shypercent effect occurs) and IC25 (inhibition concentration at which a 25-percent effect occurs) Hypothesis test methods are used to determine the no observed effect concentration (NOEC) The NOEC represents the highest effect concentration in the test concentration response that is not significantly different from the control response Multiple statistical endpoints can be derived for each WET method For example the endpoints for the fathead minnow larval survival and growth chronic test can be reported as an EC25 for growth an NOEC for growth an LC50 (or EC50) for survival and an NOEC for survival
22 Defining WET Test Variability
As with any measurement process WET tests have a degree of variability associated with the test method performance Three measures of variability related to WET tests are within-test variability within-laboratory variability and between-laboratory variability
bull Within-test (intra-test) variability is the variability in test organism response within a concentration averaged across all concentrations of the test material in a single test
bull Within-laboratory (intra-laboratory) variability is the variability that is measured when tests are conducted using specific methods under reasonably constant conditions in the same laboratory Within-laboratory variability as used in this document includes within-test variability The American Society for Testing and Materials (ASTM) uses the term ldquorepeatabilityrdquo to describe within-laboratory variability Repeatability is estimated (as a sample variance or standard deviation) by repeating a test method under realistically constant conditions within a single laboratory
bull Between-laboratory (inter-laboratory) variability is the variability between laboratories It is measured by obtaining results from different laboratories using the same test method and the same
June 30 2000 2-1
Understanding and Accounting for Method Variability in WET Applications Under the NPDES Program
test material (eg reference toxicant) Between-laboratory variability as used in this document does not include the within-laboratory component of variance ASTM uses the term ldquoreproducibilityrdquo to describe between-laboratory variability Reproducibility is estimated by having nearly identical test samples (duplicates or splits) analyzed by multiple laboratories using similar standard methods Although reproducibility is generally synonymous with between-laboratory variability estimates of reproducibility may combine within-laboratory and between-laboratory components of variance making between-laboratory variability numerically larger than within-laboratory variability as defined above
For purposes of consistency EPA uses the terms within-laboratory and between-laboratory variability throughout this document
Numerous factors can affect the variability of any toxicity test method These factors include the number of test organisms the number of treatment replicates randomization techniques the source and health of the test organisms the type of food used laboratory environmental conditions and dilution water quality The experience of the analyst performing the test analyzing the data and interpreting the results may also affect variability (Grothe et al 1996 Fulk 1996)
23 Quantifying WET Test Variability
Historically information on the variability of toxicity tests has been developed using effect concentrations such as the NOEC EC25 EC50 and LC50 for survival fecundity and growth Variability measures should be quantified based on the end use of the data (ie effect concentrations) and be directly related to the WET permit requirement Typically the effect concentrations are the endpoints used for evaluating self-monitoring results The variability of the effect concentrations is quantified by obtaining multiple test results under similar test conditions using the same test material For example the sample standard deviation and mean for EC25 obtained from multiple monthly reference toxicant tests for the fathead minnow survival and growth chronic test conducted at one laboratory would quantify ldquowithinshylaboratoryrdquo variability for that laboratory EPA used this approach to evaluate data for the development of this document (see Chapter 3)
Examining variability for each effect concentration of each biological endpoint for each test method is essential The biological endpoints may be different for various toxicants and effluents One biological endpoint such as reproduction may be more sensitive to a certain toxicant than another endpoint such as survival That sensitivity may be reversed for a different toxicant Alternatively an endpoint may be more sensitive to one toxicant than another toxicant
Three other measures of variability (which are not addressed in this document) that have been applied to WET tests are
1 Determine the variability of the biological endpoint response For example the variance of the biological response (eg growth and survival) can be calculated This approach is useful but does not quantify variability of the WET test effect concentration which is important in the context of this document
2 Quantify the uncertainty of each test point estimate (eg the EC50 EC25 or LC50) using confidence intervals which reflect within-test variability
3 Use the standard deviation to quantify the uncertainty in the mean of the replicate response at each concentration within a particular test For example laboratories can compare the standard deviations of the average weight of fathead minnow larvae in four chronic tests at one test concentration such as 1 mgL sodium chloride These standard deviations may be pooled across
June 30 2000 2-2
Understanding and Accounting for Method Variability in WET Applications Under the NPDES Program
all the concentrations when data have been transformed (if necessary) to give similar variances at each concentration From the pooled variance one may calculate a minimum significant difference (MSD) value which is a useful indication of test sensitivity (see Chapters 3 and 5) In this document the standard deviation at each concentration was not evaluated as a measure of variability However the MSD was considered as a measure of WET test variability
June 30 2000 2-3
Understanding and Accounting for Method Variability in WET Applications Under the NPDES Program
This page intentionally left blank
June 30 2000 2-4
30 VARIABILITY OF WET TEST METHODS
Chapter 3 describes the variability of effect concentration estimates (EC25 LC50 and NOEC) and endpoint measurements (survival growth and reproduction) For definitive studies of the variability of WET methods readers should also refer to the TSD (USEPA 1991a Part 133) and to WET methods manuals (USEPA 1993 1994a 1994b) EPA will complete and report on a new between-laboratory study of promulgated methods in 2000 or 2001
31 Acquisition Selection and Quality Assurance of Data Presented in This Document
EPA solicited data for reference toxicant tests from laboratories that conduct WET tests and use reference toxicant testing as part of their quality control (QC) program Reference toxicant testing is required as specified in EPA toxicity test methods to document laboratory performance over time for laboratories conducting self-monitoring tests When laboratories are conducting effluent tests at least one reference toxicant test must be conducted each month using the same toxicant test concentrations dilution water and data analysis methods These reference toxicant tests must be conducted using the same test conditions (type of dilution water temperature test protocol and species) that are used for WET tests conducted by the laboratory
Reference toxicant tests were used to characterize method variability because in contrast to effluent samples fixed concentrations of known toxicants are used Only with this standardization is it possible to conclude that variability of the effect concentration estimates is derived from the sources discussed above rather than from changes in the toxicant
EPA received reference toxicant test data from several States private laboratory sources and the EPA Regions Data sources used for these analyses include the EPA National Toxicant Reference Database (NTRD) the EPA Region 9 Toxicity Data Base and laboratory bench sheets voluntarily submitted by independent sources Although the data do not represent a random sample of laboratories or tests they do represent a widespread sampling of typical laboratories and practices
EPA required that reference toxicant tests included in its data base meet the following four criteria
1 Test records documented the test method organism test date laboratory reference toxicant and individual biological responses in the concentration series
2 Data for each replicate were provided as required in the published method using the current test method
3 The test used at least five toxicant concentrations and a control for the most commonly reported chronic toxicity test methodsmdash(1) 10000 fathead minnow larval survival and growth (2) 10020 Ceriodaphnia survival and reproduction and (3) 10060 inland silverside survival and growth For other chronic toxicity test methods the test used at least four toxicant concentrations and a control because the methods permitted in the recent past the use of only four concentrations
4 EPA personnel or an EPA contractor calculated the effect concentration verified that all test acceptability criteria (TAC) had been met and verified that the statistical flowchart had been followed correctly Thus all summary statistics and estimates were calculated from the replicate data and strictly followed the most current EPA test methods
June 30 2000 3-1
Understanding and Accounting for Method Variability in WET Applications Under the NPDES Program
Details of data quality assurance and test acceptance are provided in a separate document available at EPArsquos Office of Water docket located in the Office of Science and Technology [ldquoWhole Effluent Toxicity (WET) Data Test Acceptance and Quality Assurance Protocolrdquo] An attachment to that document provides a laboratory-by-laboratory listing of quality assurance flags test dates and toxicant concentrations as well as summary statistics by laboratory for the NOEC EC25 and LC50 estimates and test endpoints (survival growth reproduction etc) Laboratories are not identified by name
The data set of reference toxicant tests includes information from 75 laboratories for 23 methods for tests conducted between 1988 and 1999 This document addresses and provides specific guidance on the variability of methods promulgated by EPA in 40 CFR Part 136 (Table 3-1) The data are also used to develop between-laboratory interim estimates of method variability for the promulgated methods (Appendix A) The Agency identifies these CVs as ldquointerimrdquo EPA may revise some or all of these estimates based on between-laboratory studies to evaluate some of the promulgated test methods
The next section presents summary statistics for the promulgated methods Summary statistics for all methods in the data set appear in Appendix B For methods represented by a few laboratories summary statistics should not be considered representative of method performance For example EPArsquos Office of Water usually relies on acceptable data from at least six laboratories (USEPA 1996b) when it conducts a multi-laboratory study to quantify method performance The data used here have not been obtained under conditions as rigorous as those applied to a between-laboratory study and for that reason may overestimate variability particularly for the extremes
Coefficients of variation are used as descriptive statistics for NOECs in this document Because NOECs can take on only values that correspond to concentrations tested the distribution (and CV) of NOECs can be influenced by the selection of experimental concentrations as well as additional factors (eg within-test variability) that affect both NOECs and point estimates This makes CVs for NOECs more uncertain than the CVs for point estimates and the direction of this uncertainty is not uniformly toward larger or smaller CVs Despite these confounding issues CVs are used herein as the best available means of expressing the variability of interest in this document and for general comparisons among methods Readers should be cautioned however that small differences in CVs between NOECs and point estimates may be artifactual large differences are more likely to reflect real differences in variability (a definition of what is ldquosmallrdquo or ldquolargerdquo would require a detailed statistical analysis and would depend upon the experimental and statistical details surrounding each comparison) NOECs can only be a fixed number of discrete values the mean standard deviation and CV cannot be interpreted and applied as they are for a continuous variable such as the EC25 or EC50 For instance the typical reference toxicant test might result in only three observed NOEC values most of them at one or two concentrations The mean will fall between tested concentrations as will the stated confidence intervals thus these do not actually represent expected outcomes only approximations of the expected outcome
As an alternative to CVs ratios are used to quantify variability of EC25 EC50 and NOEC measurements in Appendix B Ratios of measurements have been used previously to quantify and compare variability of NOEC and EC50 (Chapman et al 1996b Dhaliwal et al 1997)
32 Variability of EC25 LC50 and NOEC
321 Within-Laboratory Variability of EC25 LC50 and NOEC
This section characterizes the within-test and within-laboratory variability of effect concentration estimates Tables 3-2 through 3-4 summarize variation across laboratories of the within-laboratory coefficients of variation (CVs) without respect to reference toxicant tested Tables showing more extensive summaries appear in Appendix B (Tables B-1 through B-3)
June 30 20003-2
Understanding and Accounting for Method Variability in WET Applications Under the NPDES Program
Table 3-1 Promulgated WET Methods Included in This Report
Test Method No Test Method
EPA Data Base
Toxicants Tests Labs
Freshwater Methods for Chronic Toxicitya
10000 Pimephales promelas Fathead Minnow Larval Survival and Growth Test
Cd Cr Cu KCl NaCl NaPCP SDS
205 19
10000 Pimephales promelas Fathead Minnow Embryo-Larval Survival and Teratogenicity Test
0 0
10020 Ceriodaphnia dubia Water Flea Survival and Reproduction Test
Cd Cu KCl NaCl NaPCP 393 33
10030 Selenastrum capricornutum b Green Alga Growth Test
Cu NaCl Zn 85 9
Marine amp Estuarine Methods for Chronic Toxicityc
10040 Cyprinodon variegatus Sheepshead Minnow Larval Survival and Growth Test
Cd KCl 57 5
10050 Cyprinodon variegatus Sheepshead Minnow Embryo-larval Survival and Teratogenicity Test
0 0
10060 Menidia beryllina Inland Silverside Larval Survival and Growth Test
Cr Cu KCl SDS 193 16
10070 Americamysis (Mysidopsis) bahia Mysid Survival Growth and Fecundity Test
Cr Cu KCl 130 10
10080 Arbacia punctulata Sea Urchin Fertilization Test 0 0
10090 Champia parvula Red Macroalga Reproduction Test
Cu SDS 23 2
Methods for Acute Toxicity de
20000 Fathead Minnow Survival Test Cd Cu KCl NaCl NaPCP 217 21
20020 Ceriodaphnia dubia Survival Test Cd Cu KCl NaCl NaPCP 241 23
20040 Sheepshead Minnow Survival Test SDS 65 3
20060 Inland Silverside Survival Test Cd KCl SDS 48 5
20070 Mysid (A bahia) Survival Test Cd Cu SDS 32 3
20110 Mysid (H costata) Survival Test Cd SDS 14 2
20190 Rainbow Trout Survival Test Cu Zn 10 1
20210 Daphnia magna Survival Test Cd 48 5
20220 Daphnia pulex Survival Test Cu NaCl SDS Cd Cu NaCl NaPCP
57 6
a See publications EPA6004-89-001 (USEPA 1989) and EPA6004-91-002 (USEPA 1994b)b The genus and species names for Selenastrum capricornutum have been changed to Raphidocelis subcapitata In this
document however Selenastrum capricornutum is used to avoid confusion See publication EPA6004-91-003 (USEPA 1994a) and EPA6004-87028 (USEPA 1988)
d See publications EPA6004-85013 (USEPA 1985) and EPA6004-90027F (USEPA 1993) e EPA did not assign method numbers for acute methods in EPA6004-90027F The numbers assigned here were created for
use in this document and in related materials and data bases Reference toxicant codes Cd cadmium NaCl sodium chloride Cr chromium NaPCP sodium pentachlorophenate Cu copper SDS sodium dodecyl sulfate KCl potassium chloride Zn zinc
June 30 2000 3-3
c
Understanding and Accounting for Method Variability in WET Applications Under the NPDES Program
Table 3-2 Quartiles (25th and 75th) and Median (50th) of the Within-Laboratory Values of CV for EC25 (Chronic Tests)
Test Methoda
Test Method
No Endpoint
b No of Labs
Percentiles of CV
25th 50th 75th
Fathead Minnow Larval Survival amp Growth 10000 G 19 021 026 038
Fathead Minnow Larval Survival amp Growth 10000 S 16 011 022 032
Ceriodaphnia (Cd) Survival amp Reproduction 10020 R 33 017 027 045
Ceriodaphnia (Cd) Survival amp Reproduction 10020 S 25 011 023 041
Green Alga (Selenastrum) Growth 10030 G 6 025 026 039
Sheepshead Minnow Larval Survival amp Growth 10040 G 5 009 013 014
Sheepshead Minnow Larval Survival amp Growth 10040 S 2 015 016 017
Inland Silverside Larval Survival amp Growth 10060 G 16 018 027 043
Inland Silverside Larval Survival amp Growth 10060 S 13 022 035 042
Mysid (Ab) Survival Growth amp Fecundity 10070 F 4 030 038 041
Mysid (Ab) Survival Growth amp Fecundity 10070 G 10 024 028 032
Mysid (Ab) Survival Growth amp Fecundity 10070 S 7 017 021 028
Red Macroalga (Champia parvula) Reproduction 10090 R 2 058 058 059 a Cd = Ceriodaphnia dubia Ab = Americamysis (Mysidopsis) bahia b G = growth S = survival R = reproduction F = fecundity
Table 3-3 Quartiles (25th and 75th) and Median (50th) of the Within-Laboratory Values of CV for LC50
Test Methoda Test
Method No Endpoint
b No of Labs
Percentiles of CV
25th 50th 75th
Freshwater Methods for Chronic Toxicityc
Fathead Minnow Larval Survival amp Growth 10000 S 19 015 023 031
Ceriodaphnia (Cd) Survival amp Reproduction 10020 S 33 010 016 029
Sheepshead Minnow Larval Survival amp Growth 10040 S 5 007 008 012
Inland Silverside Larval Survival amp Growth 10060 S 16 016 028 035
Mysid (Ab) Survival Growth amp Fecundity 10070 S 10 016 026 027
Methods for Acute Toxicityde
Fathead Minnow Larval Survival 20000 S 21 010 016 019
Ceriodaphnia (Cd) Survival 20020 S 23 011 019 029
Sheepshead Minnow Survival 20040 S 5 012 014 021
Inland Silverside Larval Survival 20060 S 5 015 016 021
Mysid (Ab) Survival 20070 S 3 017 025 026
Mysid (Hc) Survival 20110 S 2 027 030 034
Rainbow Trout Survival 20190 S 1 023 023 023
Daphnia (Dm) Survival 20210 S 5 007 022 024
Daphnia (Dp) Survival 20220 S 6 019 021 027 a Cd = Ceriodaphnia dubia Ab = Americamysis (Mysidopsis) bahia Hc = Holmesimysis costata Dm = Daphnia magna
Dp = Daphnia pulex b S = survival
See publications EPA6004-89-001 (USEPA 1989) and EPA6004-91-002 (USEPA 1994b)d See publications EPA6004-85-013 (USEPA 1985 and EPA6004-90027F (USEPA 1993) e EPA did not assign method numbers for acute methods in EPA6004-90027F The numbers assigned here were created for
use in this document and in related materials and data bases
June 30 2000 3-4
c
Understanding and Accounting for Method Variability in WET Applications Under the NPDES Program
Table 3-4 Quartiles (25th and 75th) and Median (50th) of the Within-Laboratory Values of CV for NOEC
Test Methoda
Test Metho
d No
Endpointb
No of Labs
Percentiles of CV
25th 50th 75th
Freshwater Methods for Chronic Toxicityc
Fathead Minnow Larval Survival amp Growth 10000 G 19 022 037 053
Fathead Minnow Larval Survival amp Growth 10000 S 19 026 039 048
Ceriodaphnia (Cd) Survival amp Reproduction 10020 R 33 025 033 049
Ceriodaphnia (Cd) Survival amp Reproduction 10020 S 33 021 030 043
Green Alga (Selenastrum) Growth 10030 G 9 040 046 056
Marine amp Estuarine Methods for Chronic Toxicityd
Sheepshead Minnow Larval Survival amp Growth 10040 G 5 034 040 044
Sheepshead Minnow Larval Survival amp Growth 10040 S 5 014 018 024
Inland Silverside Larval Survival amp Growth 10060 G 16 031 046 057
Inland Silverside Larval Survival amp Growth 10060 S 16 030 042 055
Mysid (Ab) Survival Growth amp Fecundity 10070 F 4 017 036 040
Mysid (Ab) Survival Growth amp Fecundity 10070 G 10 035 039 043
Mysid (Ab) Survival Growth amp Fecundity 10070 S 10 028 033 038
Red Macroalga (Champia parvula) Reprod 10090 R 2 085 100 116
Methods for Acute Toxicityef
Fathead Minnow Larval Survival 20000 S 21 018 022 034
Ceriodaphnia (Cd) Survival 20020 S 23 018 035 041
Sheepshead Minnow Survival 20040 S 3 0 031 033
Inland Silverside Larval Survival 20060 S 5 0 033 035
Mysid (Ab) Survival 20070 S 3 029 038 043
Mysid (Hc) Survival 20110 S 2 021 026 031
Rainbow Trout Survival 20190 S 1 035 035 035
Daphnia magna (Dm) Survival 20210 S 5 009 036 047
Daphnia pulex (Dp) Survival 20220 S 6 021 038 061 a Cd = Ceriodaphnia dubia Ab = Americamysis (Mysidopsis) bahia Hc = Holmesimysis costata Dm = Daphnia
magna Dp = Daphnia pulex b G = growth S = survival R = reproduction F = fecundity
See publications EPA6004-89-001 (USEPA 1989) and EPA60044-91-002 (USEPA 1994b)d See publication EPA6004-91-003 (USEPA 1994a) and EPA6004-87028 (USEPA 1988) e See publications EPA6004-85013 (USEPA 1985) and EPA6004-90027F (USEPA 1993)f EPA did not assign method numbers for acute methods in EPA6004-90027F The numbers assigned here were
created for use in this document and in related materials and data bases
Effect concentrations having a p-percent effect are symbolized as ECp and may be calculated for sublethal and lethal (survival) endpoints (USEPA 19931994a1994b) Effect concentrations commonly estimated for WET methods are LC50 EC50 IC25 and EC25 The symbol ECp is more general and may be used to represent an LCp ECp or ICp endpoint To simplify presentation of results in this document the term EC25 is used to represent the concentration at which a 25-percent effect has occurred for either lethal
June 30 2000 3-5
c
Understanding and Accounting for Method Variability in WET Applications Under the NPDES Program
or sublethal endpoints The term LC50 is used to represent the concentration at which a 50-percent effect has occurred for lethal endpoints The EC25 for survival is not routinely used in generating self-monitoring data and is presented here for comparison to the EC25 for sublethal endpoints (ie IC25) Estimates of EC25 LC50 and NOEC were calculated for this document as required in the EPA test methods (USEPA 1993 1994a 1994b) A CV is reported for NOEC measurements in this document See Appendix A for further details
The results in Tables 3-2 through 3-4 were obtained as follows using as an example the EC25 of the growth endpoint in Method 10000 (fathead minnow larval chronic test) on the first row of Table 3-2 The CV of the EC25 estimates was calculated for each laboratory This calculation resulted in 19 CVs (one per laboratory with each laboratory tested using one toxicant) The sample percentiles were calculated for this set of 19 CVs In Table 3-2 the column headed ldquo50thrdquo shows the 50th percentile (median value) of CV found across these 19 laboratories the 50th percentile value is 026 In the column headed ldquo75thrdquo the 75th percentile CV is reported as 038 When a method is represented by fewer than four laboratories the minimum and maximum CVs are shown in the columns headed ldquo25thrdquo and ldquo75thrdquo respectively Note that these CVs represent within-laboratory variability and that Tables 3-2 through 3-4 show the quartiles and median of the within-laboratory CVs These tables thus report the typical range of within-laboratory test method variation
Variation across laboratories in the CV for effect concentration estimates (Tables 3-2 through 3-4) may be summarized as follows ignoring methods represented by only one or two laboratories [Refer to the column headed ldquo75thrdquo (the 75th percentile)]
For the EC25 of the growth and reproduction endpoints in chronic toxicity tests 75 percent of laboratories have a CV no more than 014 to 045 depending on the method (Table 3-2) For the two most commonly used methods (10000 fathead minnow larval chronic test and 10020 Ceriodaphnia chronic test) 75 percent of the laboratories have CVs no more than 038 and 045 respectively
For the LC50 of the survival endpoint in chronic toxicity tests 75 percent of laboratories have a CV no more than 012 to 035 depending on the method For the two most commonly used methods (10000 and 10020) 75 percent of laboratories have CVs no more than 031 and 029 respectively (Table 3-3) For the LC50 in acute toxicity tests 75 percent of laboratories have a CV no more than 019 to 029 depending on the method For the two most commonly used methods (20000 and 20020) 75 percent of laboratories have CVs no more than 019 and 029 respectively
For the NOEC of growth or reproduction endpoints in chronic toxicity tests 75 percent of laboratories have a CV no more than 043 to 057 depending on the method For the two most commonly used methods (10000 and 10020) 75 percent of laboratories have CVs no more than 053 and 049 respectively (Table 3-4) For the NOEC of survival in chronic toxicity tests 75 percent of laboratories have a CV no more than 024 to 055 depending on the method For the two most commonly used methods (10000 and 10020) 75 percent of laboratories have CVs no more than 048 and 043 respectively For the NOEC of survival in acute toxicity tests 75 percent of laboratories have a CV no more than 034 to 061 depending on the method For the two most commonly used acute methods (20000 and 20020) 75 percent of laboratories have CVs no more than 034 and 041 respectively
Appendix B discusses the range of toxicant concentrations reported as the NOEC For chronic toxicity tests most laboratories report the NOEC to within two to three concentration intervals and half the laboratories report most NOECs within one to two concentration intervals for reference toxicants For acute toxicity tests most laboratories report NOECs at one or two concentrations This outcome agrees with EPArsquos expected performance for these methods The normal variation of the effect concentration estimate in reference toxicant tests has been reported for some EPA WET methods (USEPA 1994a 1994b) to be plus or minus one dilution concentration for the NOEC and less for LC50
June 30 2000 3-6
Understanding and Accounting for Method Variability in WET Applications Under the NPDES Program
322 Between-Laboratory Variability of EC25 LC50 and NOEC
The data set compiled for this document provided reasonable estimates of between-laboratory variability for only a few methods For many methods and toxicants there were too few laboratories in the data base Additional summaries of between-laboratory variability of WET methods are included in the TSD (USEPA 1991a Part 133) and the WET methods manuals (USEPA 1994a 1994b) EPA also intends to provide new data in a forthcoming EPA between-laboratory study of promulgated methods
Using the data set credible estimates of between-laboratory variability could be made for a few toxicants and methods having data for six or more laboratories (Table 3-5) The statistical methods are described in Appendix B Table 3-5 shows values of the square root of within-laboratory and between-laboratory variance components (ie standard deviations F) The standard deviations and mean are expressed in units of toxicant concentration (eg gL or mgL) Between-laboratory Fb estimates the standard deviation for laboratory means of EC25 LC50 and NOEC The ldquoMeanrdquo column in Table 3-5 shows the mean of the laboratory means not the mean for all tests Because the number of tests differed among laboratories these two means are different These data suggest that between-laboratory variability (Fb) is comparable to within-laboratory variability (Fw) for the methods listed in the table
In Table 3-5 the ratio of Fb to the mean is an estimate of the relative variability (CVb) of laboratory means around their combined mean The ratio of Fw to the mean may approach the value of the average within-laboratory CV when the sample of laboratories is large but to characterize within-laboratory CVs readers should use Tables 3-2 through 3-4
Table 3-5 Estimates of Within-Laboratory and Between-Laboratory Components of Variabilitya
Test Methodb
Test EC Estimate Toxicant
End-Pointc Tests Labs
Within-lab FFW
Between-lab FFb Mean CVw CVb
10000 EC25 NaCl G 73 6 067 044 263 025 017
10000 LC50 NaCl S 73 6 114 045 415 027 011
10000 NOEC N Cl G 73 6 072 035 218 033 016
10000 NOEC NaCl S 73 6 096 051 243 040 021
10020 EC25 NaCl R 292 23 029 027 092 032 029
10020 LC50 NaCl S 285 23 048 024 178 027 013
10020 NOEC NaCl G 292 23 028 018 074 038 024
10020 NOEC NaCl S 292 23 047 026 142 033 018
10060 EC25 Cu G 130 9 451 524 974 046 054
10060 LC50 Cu S 130 9 484 707 1270 038 056
10060 NOEC Cu G 130 9 518 444 801 065 055
10060 NOEC Cu S 130 9 342 395 654 052 060
20000 LC50 NaCl S 154 14 105 124 746 014 017
20020 LC50 NaCl S 167 15 036 038 197 018 019 a F = within-laboratory standard deviation Fb = between-laboratory standard deviationw
CV = within-laboratory coefficient of variation CVb = between-laboratory coefficient of variationwb EPA did not assign method numbers for acute methods in EPA6004-90027F The numbers assigned here
were created for use in this document and in related materials and data bases G = growth S = survival R = reproduction
June 30 2000 3-7
c
Understanding and Accounting for Method Variability in WET Applications Under the NPDES Program
33 Variability of Endpoint Measurements
This section characterizes the within-laboratory precision of endpoint measurements (eg growth reproduction and survival) Endpoint variability in methods for chronic toxicity is characterized here using sublethal endpoints The sublethal endpoint was designed to be more sensitive than the survival endpoint and it incorporates the effect of mortality (ie it incorporates biomass) For example for the chronic survival and growth fathead minnow larval test the total dry weight at each replicate is divided by the original number of larvae rather than the surviving number of larvae
EPA reports measures of test precision based on the control CV [(control standard deviation)(control mean)] and the ldquoPercent MSDrdquo [100timesMSD(control mean)] symbolized as PMSD Recall that MSD the ldquominimum significant differencerdquo is calculated as [d EMS (2r)] where ldquodrdquo is the critical value of Dunnettrsquos statistic when comparing ldquokrdquo treatments to a control EMS is the error mean square from the analysis of variance of the endpoint responses and ldquorrdquo is the number of replicates at each concentration (USEPA 1993 1994a 1994b) These measures of test precision quantify within-test variability or the sensitivity of each test to toxic effects on the biological endpoint
Measures of variability relative to the control mean are used for two reasons First a laboratory having consistently large mean endpoint values for the control will also tend to have larger values of MSD and control standard deviation Second PMSD is readily interpreted as the minimum percent difference between control and treatment that can be declared statistically significant in a WET test A significant effect occurs when (control mean - treatment mean) exceeds the MSD Dividing by the control mean and multiplying by 100 states this relationship in terms of the percent difference between control and treatment
To characterize the distribution of values of PMSD values from all laboratories and toxicants for a given method and endpoint were combined and sample percentiles reported Percentiles are also reported for the CV of the control which also indicates variability among replicates under non-toxic conditions and may be a useful indicator of uniformity of the test organisms The sample percentiles are reported in more detail in Appendix B the 10th and 90th percentiles are shown in Table 3-6 Method 10090 (red macroalga) is omitted from Table 3-6 because it would be inadvisable to characterize method variability using only 23 tests from only two laboratories
The 90th percentile may be used as an upper PMSD bound (ie a limit on the insensitivity of a test) The 10th percentile may be used as a lower PMSD bound for declaring a significant difference or a lower limit to test sensitivity The 90th percentile has been used in other WET programs (Chapter 5) The 95th
percentile is used as a practical upper limit for the variability of analytical results in well-controlled between-laboratory studies that use a standard protocol and specific quality assurance procedures (ASTM 1992 1998 USEPA 1993 1996a 1996b) The tests summarized here have not been subjected to the rigorous standardization and quality assurance of collaborative studies and the data have not been screened for outliers as specified by ASTM Practices D2777 and E691 (ATSM 1992 1998) These considerations justify using the sample 90th percentile to set an upper bound A lower bound is necessary to avoid creating a disincentive for improving test precision and to objectively specify a limit to the test sensitivity achieved in practice If no more than ten percent of tests are more precise than this lower bound then in practice the analytical method rarely detects toxic effects of this small magnitude
When comparing values in Table 3-6 to a test result it is important that the testrsquos MSD be calculated according to procedures described in the EPA method manuals (USEPA 1993 1994a 1994b) for Dunnettrsquos test for multiple comparisons with a control (see Section 641) An analysis of variance (ANOVA) is conducted using several treatments including the control EPA methods require excluding from the ANOVA those concentrations for which no organisms survived in any replicate For a sublethal endpoint concentrations are excluded from the analysis if they exceed the NOEC for survival The MSD is calculated
June 30 2000 3-8
c
Understanding and Accounting for Method Variability in WET Applications Under the NPDES Program
using the square root of the error mean square (rEMS) from the ANOVA and using Dunnettrsquos critical value (which depends on the number of replicates and concentrations used in the ANOVA)
Table 3-6 Range of Relative Variability for Endpoints of Promulgated WET Methods Defined by the 10th and 90th Percentiles from the Data Set of Reference Toxicant Testsa
Test Methodb Endpointc No of Labs
No of Tests
PMSD Control CVd
10th 90th 10th 90th
10000 Fathead Minnow G 19 205 94 35 0035 020
10020 Ceriodaphnia dubia R 33 393 11 37 0089 042
10030 Green Alga G 9 85 93 23 0034 017
10040 Sheepshead Minnow G 5 57 63 23 0034 013
10060 Inland Silverside G 18 193 12 35 0044 018
10070 Mysid G 10 130 12 32 0088 028
20000 Fathead Minnow S 20 217 42 30 0 0074
20020 Ceriodaphnia S 23 241 50 21 0 011
20040 Sheepshead Minnow S 5 65 0e 55 0 0
20060 Inland Silverside S 5 48 70 41 0 0079
20070 Mysid (A bahia) S 3 32 51 26 0 0081
20110 Mysid (H costata) S 2 14 18 47 0 0074
20210 Daphnia (D magna) S 5 48 53 23 0 011
20220 Daphnia (D pulex) S 6 57 58 23 0 011 a The precision of the data warrants only three significant figures When determining agreement with these values one may
round off values to two significant figures (eg values gt345000 and 35000 are rounded to 35) Method 10090 (red macroalga) is not reported because it is inadvisable to characterize method variability using only 23 tests from just two laboratories
b EPA did not assign method numbers for acute methods in EPA6004-90027F The numbers assigned here were created for use in this document and in related materials and data bases G = growth R = reproduction S = survival
d CVs were calculated using untransformed control means for each test e An MSD of zero will not occur when the EPA flow chart for statistical analysis is followed In this report MSD was
calculated for every test including those for which the flow chart would require a nonparametric hypothesis test EPA recommends using the value 42 (the 10th percentile shown for the fathead minnow acute test) in place of zero as the 10th
percentile PMSD (lower PMSD bound) for the sheepshead minnow acute test
The MSD was calculated for all test results reported here including those for which non-normality and heterogeneity of variance were indicated Thus this document presents MSD as an approximate index of test sensitivity Estimates of power are also approximate The MSD generally will be related to test sensitivity even when the assumptions for ANOVA and Dunnettrsquos test are not strictly satisfied
Table 3-7 shows the number of laboratories in the WET variability data set having tests exceeding the upper PMSD bound reported in Table 3-6 One-half to two-thirds of the laboratories never or infrequently exceeded the bound and roughly one in five exceeded it in at least 20 percent of their tests By definition of the 90th percentile about 10 percent of all the tests exceeded the bound
June 30 2000 3-9
Understanding and Accounting for Method Variability in WET Applications Under the NPDES Program
Table 3-7 Number of Laboratories Having a Given Percent of Tests Exceeding the PMSD Upper Bound for the Sublethal Endpoint
Test Method No Labs Endpointsa
Number of Labs with Various Percentages of Tests Exceeding the PMSD Upper Bound
0 0-10 10-20 20-50 50-100
10000 Fathead Minnow 19 G 8 2 7 2 0
10020 Ceriodaphnia dubia 33 R 15 7 5 6 0
10030 Green Alga 9 G 6 1 0 2 0
10040 Sheepshead Minnow 5 G 3 1 0 1 0
10060 Inland Silverside 16 G 6 5 1 4 0
10070 Mysid (growth) 10 G 5 2 0 3 0 a G = growth R = reproduction
34 Conclusions about Variability of WET Methods
341 Variability of EC25 LC50 NOEC
For EC25 the quartiles of the within-laboratory CVs ranged across the promulgated methods from 009 to 045 and the median CV ranged from 013 to 038 For LC50 the quartiles of the within-laboratory CVs ranged from 007 to 035 and the median CV ranged from 008 to 028 For NOEC the quartiles of the within-laboratory CVs ranged from 0 to 061 and the median CV ranged from 018 to 046 This summary applies to those methods represented by at least 20 tests and three laboratories
EPA concludes from Tables 3-2 through 3-4 that point estimates are substantially less variable than the NOEC for the same method and endpoint and that the LC50 for an acute toxicity test usually is less variable than the LC50 for a chronic toxicity test The estimated NOEC is more variable than ECp using current experimental designs because NOEC can take only those values equal to the concentrations tested while ECp interpolates between tested concentrations (there may be other more technical reasons as well) In principle NOEC could be estimated more accurately and precisely by changing the experimental design to use more concentrations at narrower dilution ratios and by using more replicates The greater variability of the NOEC underscores the desirability of using point estimates to characterize effluent toxicity
Tables 3-2 through 3-4 may be used as benchmarks for variability allowing comparison of one laboratoryrsquos CV for reference toxicant testing with CVs reported by experienced laboratories reporting tests that passed the TAC However CVs for methods represented by too few laboratories in the table may be atypical
The CVs in Tables 3-2 through 3-4 may be used as an adjunct to the control chart If the CV for reference toxicant tests is above the 75th percentile in Tables 3-2 through 3-4 variability likely can be reduced even if the individual EC25 or LC50 values fall within the control limits If a control chart is constructed using an unreasonably large standard deviation the control limits will be unreasonable If a high CV is not fully explained by an unusually small mean the standard deviation of EC25 or LC50 should be reduced to bring the CV within the normal range If the CV exceeds the 90th percentile (Appendix B) there is no question that variability is unacceptably large Detailed guidance is provided in Chapter 5 (Section 5311)
Tables 3-2 through 3-4 indicate the magnitude of the analytical variability that becomes part of the variability of effluent test results under certain conditions This occurs when effluent test results (NOECs LC50s or EC25s) fall between the lowest and highest concentrations tested Under other conditions these
3-10 June 30 2000
Understanding and Accounting for Method Variability in WET Applications Under the NPDES Program
CVs may not accurately represent analytical variability If tests give results consistently near or at the lowest or highest concentrations tested or if the tests often produce ldquoless thanrdquo or ldquogreater thanrdquo results Tables 3-2 through 3-4 will not accurately characterize the analytical CV for such tests To measure the analytical CV under such conditions reference toxicant tests would have to be designed to have the effect concentration at or near the lowest or highest concentration The CV and standard deviation measured under such conditions are unknown but are likely to differ from those for standard reference toxicant tests
The data set did not contain information supporting an analysis of the causes of between-laboratory variability Possible causes may include laboratory differences in concentration series incorrect or ambiguous calculation or reporting of concentrations (eg concentration of the metal ion versus the salt) laboratory differences in dilution water (eg water hardness or pH) laboratory differences in foods and feeding regimes and laboratory differences in cultures (genotypic and phenotypic differences in sensitivity to various toxicants)
The lack of a standard or common reference toxicant creates a problem for permittees and regulatory authorities attempting to evaluate and compare laboratories Real or apparent differences occur between laboratories in the mean values of EC25 LC50 and NOEC Some of this difference is random and reflects only the within-laboratory variance some may be systematic Systematic between-laboratory differences can be inferred reliably only when laboratories use the same test method use the same reference toxicants and dilution series use similar dilution waters and report a sufficient number of tests
342 Variability of Endpoint Measurements
EPA has selected the PMSD to characterize endpoint variability for WET test methods because it integrates variability from several concentrations (always including the control) and it represents the MSD used in the WET hypothesis test The control CV by itself does not fully represent the variability affecting a WET hypothesis test or point estimate The PMSD also represents the variability affecting point estimates because it is calculated using the EMS for the endpoint measurement (However the standard error of a point estimate of an effect concentration may be a complicated function of the EMS)
PMSD for sublethal endpoints ranged from 6 to 37 across the promulgated chronic methods For the fathead minnow chronic method PMSD ranged from 9 to 35 for the Ceriodaphnia chronic method PMSD ranged from 11 to 37 Thus most chronic tests were able to distinguish a reduction of 37 percent or smaller in the endpoint Further analysis in Chapter 5 shows that most tests were unable to distinguish consistently a 25-percent reduction For the survival endpoint of promulgated acute methods PMSD ranged from 0 to 55 For the two most commonly used acute methods (fathead minnow and Ceriodaphnia) PMSD ranged from 4 to 30 and from 5 to 21 respectively Thus PMSD varied markedly for some acute methods and not for others
As shown by the size of PMSD test sensitivity to detect substantial toxic effects is occasionally insufficient at some laboratories and routinely insufficient at a few laboratories Inadequate test sensitivity is not always signaled by control charts of EC25 LC50 and NOEC Laboratories should consider maintaining control charts for MSD or PMSD and should report MSD and the control mean with all WET tests
Some portion of MSDs in the WET variability data set could be considered exceptionally large if not outliers This observation underscores the importance of a careful review for each WET test including an examination of means and standard deviations for endpoint responses at each concentration the plotting of replicate data (not just concentration means) and when necessary a search for possible causes of excessive variability The tables and plots in the promulgated methods (USEPA 1994a 1994b) provide good examples
June 30 2000 3-11
Understanding and Accounting for Method Variability in WET Applications Under the NPDES Program
This page intentionally left blank
3-12 June 30 2000
40 VARIABILITY IN CONTEXT
EPA manages the regulation of WET in the same way it manages the regulation of chemical-specific pollutants in order to determine reasonable potential (RP) derive permit limits determine data quality control and evaluate self-monitoring data Many similarities between chemical-specific toxicant and WET controls can be found in the TSD (USEPA 1991a) Determining RP in both cases uses many of the same strategies Permit limit derivation makes similar exposure assumptions and relies on nearly identical toxicological data bases
Considering a value other than the best analytical estimate as a measure for WET or for specific chemical analytes is inappropriate All analytical results in either chemical-specific analyses or WET tests incorporate some estimated range of uncertainty While infrequently discussed for chemical methods uncertainty does play a role in the meaning of analytical results One end of the confidence interval likely will be less protective of aquatic resources than the other The derived limit and therefore final reported analytical results become the best estimate of the actual ecological need and assessment of the effect
Significant debate has occurred over assertions that WET data have too much inherent variability for reliable use in the NPDES program This debate has engendered considerable evaluation of WET precision Groups of scientists and individual researchers have repeatedly concluded that currently promulgated WET methods are technically sound and that the observed precision is within the range of precision of other analyses frequently required in NPDES permits (Grothe et al 1996) The findings of some of the significant sources of these conclusions are summarized below
41 Society of Environmental Toxicology and Chemistry Pellston WET Workshop
The 1995 Society of Environmental Toxicology and Chemistry (SETAC) Pellston Workshop on Whole Effluent Toxicity convened 47 experts in the discipline to assess applied methods and their application in the regulatory process Representation at the workshop was intentionally balanced among government business and academic participants These scientists published consensus conclusions and recommendashytions including the following
411 General Conclusions and Recommendations
Grothe et al (1996) state ldquoExisting WET testing methods (USEPA 1985 USEPA 1988 USEPA 1989) are technically sound but certain modifications would improve endpoint interpretation Such changes involve implementing improvements to currently used statistical procedures establishing acceptable limits for MSD values and adding confidence limits to WET test endpointsrdquo
ldquoA number of problems with WET tests are caused by misapplication of the tests misinterpretation of the data lack of competence of the laboratories conducting WET testing poor conditionhealth of test organisms and lack of training of laboratory personnel regulators and permittees More widespread use of WET related guidance provided in USEPArsquos TSD (1991a) would help alleviate some of these problems In addition an effective QAQC program will improve data quality and reduce test variabilityrdquo
ldquoIncrease training opportunities for regulators and permittees to improve the implementation of WET objectives and to promote national consistency in permitting and compliance issuesrdquo
June 30 2000 4-1
Understanding and Accounting for Method Variability in WET Applications Under the NPDES Program
ldquoImplement a broadly based and standardized QAQC program to improve WET testing performance and data qualityrdquo
ldquoQuantify the lsquoconfidencersquo around test endpoints to improve interpretation of WET test results Specific statistical methods that could improve precision are presented in Chapter 3 of this document and processes to reduce variability are discussed in Chapter 5 In addition WET tests should be performed using a dilution series of exposure concentrations to establish a dose-response relationshiprdquo
412 Conclusions about Data Precision
Ausley (1996) compared CVs of chemical analyses and aquatic toxicity tests conducted by North Carolina NPDES permittees Ausley found that CVs of reported values for chemical analytes (including metals organic analytes and non-metal inorganic analytes) ranged from 118 percent to 2917 percent Coefficients of variation for toxicity parameters (acute and chronic Ceriodaphnia dubia acute and chronic Pimephales promelas acute Daphnia pulex and acute Mysidopsis bahia) ranged from 148 percent to 676 percent From this review he concluded that ldquothe precision of toxicity analyses is within the range of that being reported for commonly analyzed and regulated chemical parametersrdquo Ausley highlighted the difficulty in comparing precision estimates of chemical analytes and WET analyses (particularly NOECs) noting that while chemical precision is often determined well above analytical detection WET precision is often based on the minimum detection level An assumption that WET precision will vary among toxicants is also logical To establish ldquoinherent variabilityrdquo considering toxicants that cause minimal variability in the analysis may be appropriate The high coefficients of variation for some chemical parameters reported by Ausley reflect the fact that in practice analytical precision can vary widely in individual studies in which the effects of a single (or a few) poorly operating laboratory can adversely affect precision estimates In practice this kind of data must be screened for quality prior to use to evaluate self-monitoring data or estimates of overall method quality
Ausleyrsquos results closely approximate analytical precision of chemical analytes referenced in the TSD (USEPA 1991a Chapter 12) The CVs for metals (aluminum cadmium chromium copper iron lead manganese mercury silver and zinc) ranged from 18 percent to 129 percent at the low end of the measurement detection range Between-laboratory CVs for organic analytes ranged from greater than 12 percent to 91 percent The CVs for non-metal analytes (alkalinity residual chlorine ammonia nitrogen Kjeldahl nitrogen nitrate nitrogen total phosphorus biological oxygen demand chemical oxygen demand and total organic carbon) ranged from 46 percent to 70 percent in between-laboratory studies of precision
Burton et al (1996) concluded that ldquoUSEPA-published methods are functional and appropriate in the context of effluent toxicity control programsrdquo They recommended developing limits on within-test variability a quality assurance and audit program and guidance for permittee procurement of WET analytical services
Denton and Norberg-King (1996) cited various studies that favorably compare WET methods with chemical analytical methods (Grothe and Kimerle 1985 Rue et al 1988 Morrison et al 1989 Grothe et al 1990) They proposed that improvements in test result consistency could be accomplished by limiting the range of within-test variability through controls of upper and lower statistical power (eg limits on test MSD) Three practices to control within-test variability most effectively are (1) controlling within-test sensitivity (2) following well-defined test methods and (3) maintaining communication within the regulatory community For example the permittee and regulatory authorities should discuss any facility-specific issues to fully characterize the appropriate permit conditions
June 30 2000 4-2
Understanding and Accounting for Method Variability in WET Applications Under the NPDES Program
42 Water Environment Research Foundation Study
Another publication ldquoWhole Effluent Toxicity Testing Program Evaluation of Practices and Implementationrdquo (DeGraeve et al 1998) presents the results of a survey of publicly owned treatment works and State regulatory programs about WET issues The Water Environment Research Foundation (WERF) sponsored this study Conclusions by DeGraeve et al (1998) include the following
ldquoThe project team believes that the results demonstrate that the test methods can be routinely completed successfully by well-trained competent WET testing laboratories and that the results considered collectively suggest that the test methods that are being used to measure WET are technically soundrdquo
ldquoThere is a need for better trainingguidance in WET-related issues for both the regulatory staff responsible for implementing WET requirements and for permittees responsible for meeting WET limitsrdquo
DeGraeve et al (1998) considered the conclusions of the SETAC Pellston WET publication concurring that between-laboratory CV values of toxicity test methods were low training of regulatory and permittee staff is needed nationally and strengthened quality assurance (QA)quality control (QC) practices could improve performance of analyses Unlike the SETAC Pellston WET conclusions they found that there are enough laboratories to meet the current market demand for analyses Like the SETAC effort DeGraeve et al (1998) concluded that a national center of expertise on WET issues would be beneficial to provide guidance to regulatory agencies permittees and laboratories
WERF also funded a project entitled ldquoWhole Effluent Toxicity Testing Methods Accounting for Variancerdquo (Warren-Hicks et al 1999) This study compared within- and between-laboratory results of reference toxicant test variation as measures of reproducibility and comparability respectively The authors concluded that some laboratories could consistently reproduce test results while others could not and inferred that test precision is a factor of laboratory experience and not inherent methodological weakness The authors recommended that national studies be conducted to evaluate within- and between-laboratory precision of promulgated WET test methods (EPA has already initiated this study) They also recommended that additional test acceptability criteria (TAC) such as upper and lower bounds of MSD be established and incorporated in the NPDES process The latter recommendation corroborates other researchersrsquo recommendations discussed above
43 Minimizing Variability by Adhering to WET Toxicity Test Methods
Specific factors that affect variability in WET analyses have been described in several papers (Burton et al 1996 Ausley 1996 Erickson et al 1998 Davis et al 1998) The most important initial consideration in developing precise data is a laboratoryrsquos experience and success in performing a specific analysis Most critical reviews of WET data precision emphasize this initial consideration Experienced professionals most likely will be able to develop the most consistent and reliable information and can interpret anomalous conditions in the testing or results
An additional factor in considering WET test method variability is whether the prescribed methods (eg the EPA toxicity test methods promulgated in 40 CFR Part 136) are being followed appropriately (see Chapter 5) If tests are submitted that do not meet specified TAC or are produced when laboratory QA testing indicates analyses are beyond control limits these results should not be used in the NPDES process Tests performed on effluent samples that have not met required temperature maxima or holding times should not be considered for regulatory purposes Rigorous QA practices are critical to the success of any analytical program Both the regulatory authority and permittee should strive to ensure that such practices are in place
June 30 2000 4-3
Understanding and Accounting for Method Variability in WET Applications Under the NPDES Program
for any program developing WET data whether by national laboratory accreditation State regulatory certification direct permittee oversight or specific contractual agreement with the laboratory
Comparisons of WET method precision with analytes commonly limited in NPDES permits clearly demonstrate that the promulgated WET methods are within the range of variability experienced in other analyses Several researchers also noted clear indications that method performance improves when prescribed methods are followed closely by experienced analysts (Grothe et al 1996 DeGraeve et al 1998)
A review of WET test results confirms that imprecise WET data are being reported As with any analytical technique inexperienced individuals can perform analyses incorrectly or fail to follow appropriate methods and quality assurance practices Using the training that is available for these methods and quality assurance techniques referenced by this document will help ensure that data of maximum reliability are used and that sound decisions are made based on those results The Western Coalition of Arid States conducted a study in 1997 (Moore et al 2000) which reported the results of 16 tests with a non-toxic test sample using the Ceriodaphnia dubia chronic test These results indicated that 43 percent of the tests showed toxicity EPA is in the process of reviewing the paper and the raw data
Persons interested in WET issues may consult another source of information developed by the SETAC Whole Effluent Toxicity Expert Advisory Panels This group established under a cooperative agreement with EPA provides scientific opinion and training on WET technical issues This information is available on the Internet at the SETAC web site httpwwwsetacorg Appendix D contains frequently asked questions with answers prepared by the SETAC WET Expert Advisory Panels The expert panels have identified and discussed various factors that affect WET variability
44 Conclusion
When the variability of WET analyses is viewed in the context of the NPDES program these techniques produce data that are as precise as those from chemical analyses As with any other analytical system lack of experience in performing the analyses adherence to prescribed QA practices or good laboratory practices will reduce the precision of the results Studies of these factors by independent researchers from both the regulatory and regulated communities support these conclusions While examples of poor-quality highly variable results from chemical analyses have also been publicized these results are frequently influenced by the shortcomings mentioned above Permittees that must generate and use WET data should become well-educated in data quality interpretation and permittees should require that QC practices be followed by laboratories generating the data Various sources of information presented in this chapter should assist permittees testing laboratories and regulatory authorities with this education process Examples of practices that can further reduce the imprecision of analyses are also discussed in Chapters 5 and 6 of this document Additional refinements of TAC can likewise improve test power to detect effects (or the lack thereof) and increase the statistical confidence in results
June 30 2000 4-4
50 GUIDANCE TO REGULATORY AUTHORITIES LABORATORIES AND PERMITTEES GENERATING AND EVALUATING
EFFECT CONCENTRATIONS
51 Steps for Minimizing Test Method Variability
This chapter provides the background and recommendations on WET test procedures related to sampling conducting the toxicity test methods and conducting the statistical methods Implementing these recommendations should decrease or minimize WET test method variability thereby increasing confidence to make regulatory decisions (see Figure 5-1) EPA stands behind the technical soundness of the current WET test methods The critical steps in minimizing WET test method variability are (1) obtaining a representative effluent sample (2) conducting the toxicity tests properly to generate the biological endpoints and (3) conducting the appropriate statistical analysis to obtain powerful and technically defensible effect concentrations Minimizing variability at each step increases the reliability of the WET test results For example factors that affect variability include sampling procedures sample representativeness deviations from standardized test conditions (eg temperature test duration feeding) test organisms source of dilution water and analyst experience and technique in conducting the toxicity tests properly (Burton et al 1996)
52 Collecting Representative Effluent Samples
The goal of effluent sampling is to obtain a representative sample that reflects real-world biological responses Factors affecting the representativeness of effluent samples may include the sampling location frequency and type (eg composite or grab) and sample volume container preservation methods and holding time Burton et al (1996) concluded that the above factors considerably influence test result variability
Effluent samples must be collected at a location that represents the entire regulated flow or discharge Typically the sampling site is designated in the discharge permit As with sampling for any parameter effluent samples should be collected from a location where the flow is turbulent and well-mixed Additionally effluent samples should be collected at a frequency that enables adequate characterization of the discharge over time (eg accounts for daily to seasonal changes and variations in effluent quality) Major facilities should conduct WET testing monthly or quarterly while minor facilities should conduct WET testing semi-annually or annually
Appropriate sample types should be collected to represent the effluent fully When the effluent is variable collecting composite samples may be necessary When the effluent is less variable grab samples may be sufficient (eg from long-term retention pond facilities)
Sample containers should be non-reactive so that they do not affect sample characteristics Table II of 40 CFR Part 136 requires that toxicity test samples be collected in glass or plastic containers as specified in the methods Sufficient sample volume should be collected for the type of test being conducted including the number of test dilutions When samples are collected in Cubitainersreg headspace should be minimized
Samples must be properly preserved Part 136 of 40 CFR requires that samples for WET testing be cooled to 4EC when shipped off-site and between test sample renewals Samples must be cooled during all phases of collection transportation and storage to minimize physicochemical changes Samples must be tested within the specified maximum holding times before significant changes occur such as volatilization or biological or chemical degradation If samples are not tested within specified maximum holding times the test is invalid and must be repeated by collecting a new effluent sample and conducting a new toxicity test to comply with the NPDES permit
June 30 2000 5-1
Understanding and Accounting for Method Variability in WET Applications Under the NPDES Program
Figure 5-1 Steps to minimize WET test method variability
53 Conducting the Biological Test Methods
Four main components of WET tests afford opportunities to control and minimize variability within tests and within and between laboratories (1) quality control (QC) procedures (2) experimental design (3) test power and (4) test acceptability criteria (TAC) beyond the minimum requirements specified in EPArsquos WET test methods
June 30 2000 5-2
Understanding and Accounting for Method Variability in WET Applications Under the NPDES Program
531 Quality Control Procedures
Quality assurance (QA) practices for toxicity tests address all aspects of the tests that affect data quality These practices include effluent sampling and handling test organism source and condition equipment condition test conditions instrument calibration replication use of reference toxicants recordkeeping and data evaluation The EPA WET toxicity testing manuals specify the minimum requirements for each aspect Regulatory authorities have the discretion to prepare and implement additional guidance beyond the minimum requirements specified in EPArsquos WET test methods
An integral part of the QA program is quality control (QC) The QC procedures are the more focused and routine activities conducted under the overall QA program An important QC component in WET testing is the requirement to conduct reference toxicant tests with effluent tests The WET test methods outline when reference toxicant tests are to be conducted (See sections on quality of test organisms in the manuals) Reference toxicant testing serves two purposes (1) determine the sensitivity of the test organisms over time and (2) assess the comparability of within- and between-laboratory test results Reference toxicant test results can be used to identify potential sources of variability such as test organism health differences among batches of organisms changes in laboratory water or food quality and performance by laboratory technicians In the QA section of each promulgated test method (USEPA 1993 1994a 1994b) EPA recommends sodium chloride potassium chloride cadmium chloride copper sulfate copper chloride sodium dodecyl sulfate and potassium dichromate as suitable reference toxicants The methods do not however specify a particular reference toxicant or the specific test concentrations for each test method
The current characterization of WET test method variability is limited by the ability to quantify sources of within- and between-laboratory variability because laboratories can use different reference toxicants and test concentrations for a particular method Future evaluations of method variability would be greatly enhanced by having data to analyze from multiple laboratories for the same reference toxicant the same dilution water at similar pH and hardness and the same test concentrations By standardizing reference toxicants testing laboratories could compare test results permittees and regulatory authorities could better compare and evaluate laboratories and the data could be used to further quantify within- and between-laboratory test precision Specification of the reference toxicant and test concentrations for a method across laboratories would provide a much larger and consistent data base to assess the comparability of within- and between-laboratory test results
Standardizing reference toxicants and test concentrations has been discussed in the literature For example the chronic methods manual for West Coast species (USEPA 1995) specifies the reference toxicant and test concentrations for each test species The Southern California Toxicity Assessment Group (SCTAG) is comprised of representatives from permittees testing laboratories regulatory authorities and academic institutions that met to discuss technical aspects of WET testing (eg standardization of reference toxicants control charts) The SCTAG (1996) prepared a report to standardize reference toxicants for the chronic freshwater test methods This report evaluated an extensive data base of reference toxicant data The report recommended specific reference toxicants and test concentrations for these methods The SCTAG (1997) also prepared a QAQC checklist to help toxicity testing laboratories establish and maintain appropriate data quality measures Regulatory authorities should review these publications when standardizing reference toxicants
The selection of reference toxicants and test concentrations should be based on specific criteria The following criteria recommended in the SCTAG report provide an excellent basis for selecting standardized reference toxicants
1 The toxicant should provide precise and reliable measures of toxicological sensitivity
2 Toxicant disposal should not be legally or environmentally problematic
June 30 2000 5-3
Understanding and Accounting for Method Variability in WET Applications Under the NPDES Program
3 The toxicant should produce a concentration-response effect for the test organism
4 The toxicant should be quantifiable
5 The toxicant should not pose an unacceptable health hazard to laboratory personnel
6 The toxicant should be readily available
Most recently Warren-Hicks et al (1999) recommended that national acceptance criteria be specified with upper and lower acceptance limits for reference toxicant test results which all laboratories would need to achieve to obtain accreditation Variability could decrease nationally if testing laboratories are provided with more detail on the evaluation and interpretation of reference toxicant control charts (APHA-AWWAshyWEF 1998) For example such guidance could describe how to evaluate test results within the warning limits Both Environment Canada (1990 2000) and APHA-AWWA-WEF (1998) have prepared guidance on evaluating control chart data The Environment Canada (2000) report specifies using zinc as an inorganic reference toxicant and phenol as an organic reference toxicant for many aquatic tests The report also specifies eight criteria for selecting specific reference toxicants
1 Previous use
2 Availability in a pure form
3 Solubility
4 Stability in solution
5 Stability during storage
6 Ease of analysis
7 Stable toxicity with normal changes in qualities of laboratory water
8 Ability to detect abnormal organisms
Regulatory authorities may want to evaluate the above reports and the SCTAG reference toxicant recommendations for the chronic freshwater test methods Regulatory authorities may also want to evaluate and recommend a standard reference toxicant and a specific concentration series for each acute and chronic test method using data from this guidance document
5311 Guidance Related to Quality Control Charts and Laboratory Audits
Ausley (1996) recommends some oversight of data quality such as evaluating tests in meeting QC criteria using randomization procedures and operating in allowed reference toxicant ranges to ensure that QC procedures are properly implemented Another integral component of QC is the maintenance of control charts for reference toxicants and effluents Laboratories should provide regular review of control charts EPA suggests keeping a control chart for each combination of test material test species test conditions and endpoints with a maximum of 20 test results Modern software makes accumulating data and reviewing key test statistics possible with relatively little effort Elementary methods can identify problems contributing to variability Laboratories should practice regular control charting of test PMSDs and control performance for all tests along with control charting of effect concentrations such as NOEC and point estimates for reference toxicants tests Successive tests should be compared occasionally to detect repeated patterns such as one replicatersquos being consistently higher or aberrant or a trend over time Time sequence plots of concentration means and standard deviations would be useful in this regard Occasionally a set of 5 to 20 tests in which block positions (see Appendix A in USEPA 1994b) have been recorded should be subjected to ANOVA for block or position effects If such effects are significant or large the laboratory should seek advice on randomizing the replicates and concentrations
June 30 2000 5-4
Understanding and Accounting for Method Variability in WET Applications Under the NPDES Program
If a laboratoryrsquos CV exceeds the 75th percentile CV from Tables 3-2 through 3-4 EPA recommends calculating warning and control limits based on the 75th and 90th percentiles respectively of CVs for the method and endpoint (Tables 3-2 and 3-3 and Appendix Tables B-1 and B-2) For example suppose the mean EC25 for a series of Ceriodaphnia chronic tests (Method 10020 with reproduction as the endpoint) conducted at one laboratory with reference toxicant is 134 gL NaCl Also suppose that the standard deviation of the EC25s for these tests is 085 The CV for this set of EC25s is thus 063 In Table 3-2 the 75th percentile of CVs for this testrsquos reproduction endpoint is 045 Calculate the standard deviation corresponding to the 75th percentile CV SA75 = 134 times 045 = 060 In Appendix Table B-1 the 90th
percentile of CVs is 062 for this method and endpoint Calculate SA90 = 134 times 062 = 083 Because the CV for this series of EC25s exceeds the 90th percentile reported in Table B-1 EPA recommends the following
bull Set control limits using SA90 = 083
bull Set warning limits using SA75 = 060
bull Promptly take actions to bring results within the control limits and
bull Attempt to bring results within the warning limits in 3-12 months
If the CV for the set of EC25s is less than the 90th percentile reported in Table B-1 use that CV to set control limits If the CV for the set of EC25s is less than the 75th percentile in Table 3-2 do not set warning limits using the latter value
In addition Burton et al (1996) encourage regulatory programs to have a laboratory audit component to document the existence and effectiveness of a QAQC program directed at toxicity testing including analyst training and experience Regulatory authorities should use the National Environment Laboratory Accreditation Program (NELAP) (USEPA 1999a) and routine performance audit inspections to evaluate individual laboratory performance Inspections should evaluate the laboratoryrsquos performance with QC control charts based on reference toxicants examine procedures for conducting the toxicity test procedures and examine procedures for analyzing test results
Regulatory authorities should develop a QC checklist to assist in evaluating and interpreting toxicity test results Appendix E presents examples of State WET implementation procedures related to reviewing reference toxicant data and information on additional QAQC criteria that have been developed and implemented Regulatory authorities should also provide additional guidance related to the interpretation of QC control charts This additional guidance could be that laboratories maintain control charts on within-test variability (eg PMSD) and use warning and control limits based on the 75th and 90th percentiles of CVs for the test method and endpoint
532 Experimental Design
Experimental design includes randomizing the experimental units (ie treatments organisms replicates) establishing the statistical significance level (ie alpha level) and specifying the minimum numbers of replicates test organisms and treatments Oris and Bailer (1993) recommend that test design and TAC be based not only on a minimum level of control performance but also on the ability to detect a particular level of effect (ie test power)
A Type I error (ie ldquofalse positiverdquo) results in the false conclusion that an effluent is toxic when it is not toxic A Type II error (ie ldquofalse negativerdquo) results in the false conclusion that an effluent is not toxic when it actually is toxic Power (1 - beta) is the probability of correctly detecting a true toxic effect (ie declaring an effluent toxic when it is in fact toxic) Acceptable values for alpha range from 001 to 010 (1 to 10 percent) The current EPA test methods recommend an alpha rate of 005 or 5 percent in the toxicity
June 30 2000 5-5
Understanding and Accounting for Method Variability in WET Applications Under the NPDES Program
testing manuals Currently EPA is preparing guidance on when an alpha rate of 001 or 1 percent would be considered acceptable (USEPA 2000a)
5321 False Positives in WET Testing
The hypothesis test procedures prescribed in EPArsquos WET methods provide adequate protection against incorrectly concluding that an effluent is toxic when it is not The expected maximum rate of such errors is the alpha level used in the hypothesis test The hypothesis test procedure is designed to provide an error rate no greater than alpha when the default assumptions are met The statistical flow chart provided with each EPA WET method identifies cases when default assumptions are not satisfied and therefore when data transformations or alternative statistical methods (eg a nonparametric test) should be used
Alpha and beta are related (ie as alpha increases beta decreases) assuming that the sample size (number of treatments number of replicates) size of difference to be detected and variance are held constant The alpha and beta error rates depend on satisfying the assumptions of the hypothesis test To ensure that statistical assumptions and methods are properly applied testing laboratories should review the statistical procedures used to produce WET test results and other factors such as biological and statistical quality assurance and verify that test conditions and test acceptability criteria were achieved
If a test is properly conducted and correctly interpreted identifying any particular outcome as a ldquofalse positiverdquo is impossible An effluent that is deemed toxic may require that the permittee conduct additional toxicity tests to determine if toxicity is re-occurring Even if no toxicity is demonstrated in follow-up tests that does not rule out that the original toxic event was a true toxic spike in the effluent False negatives however impact the environment by allowing the discharge of harmful toxicants without identification This may occur because the toxic effects are not identified as statistically significant due to lack of test sensitivity (see Sections 533 and 64)
Measurement error should not affect the protection against false positives provided by hypothesis tests and confidence intervals when they are appropriately applied Measurement error in the case of WET test treatment mean values likely consists largely of sampling errors (eg variability among organisms or containers) although errors in counting weighing and other procedures may also occur Such sources of imprecision are implicitly accounted for in WET test statistical inferences because the sample variance among the replicates within each treatment (dilution) is used for inference The test ldquosizerdquo 1 - alpha will protect adequately against false positives A larger variance among replicates however could make detecting real toxicity (ie false negatives) more difficult unless the number of replicates is increased to provide more test sensitivity and power which will reduce the rate of false negatives
5322 False Negatives in WET Testing
For a given alpha beta decreases (power increases) as the sample size increases and the variance decreases Decreasing alpha from 005 to 001 without otherwise changing the hypothesis test will reduce the ability of the test to detect toxicity that is will reduce the power of the test Thus as alpha for the hypothesis test is decreased there is an inevitable trade-off between the rate of false positives when toxicity is not present and the ability to detect toxicity when it is present (ie statistical power)
To limit within-test variability and thus increase power EPA developed a minimum significant difference (MSD) criterion that must be achieved in the chronic West Coast marine test methods (USEPA 1995) The MSD is a measure of the within-test variability and represents differences between treatments and the control that can be detected statistically Distributions of the MSD values of multiple tests for a specific reference toxicant and test method can be used to determine the level of test sensitivity achievable by a certain percentage of tests Denton and Norberg-King (1996) analyzed several chronic test methods to quantify the effect size based on the existing toxicity test method experimental design and MSD distributions
June 30 2000 5-6
Understanding and Accounting for Method Variability in WET Applications Under the NPDES Program
Denton and Norberg-King found when setting the beta error rate at 020 (power = 080) the effect size detected varies from at least a 15-percent reduction from the control response for the chronic red abalone larval development test to a 40-percent reduction from the control response for the chronic Ceriodaphnia dubia test In this document EPA has calculated power for each test method (see Section 533)
533 Test Power To Detect Toxic Effects
This section describes the statistical power and ability to detect toxic effects achieved by the current WET methods as inferred from the WET variability data set used to develop this document These inferences are approximate because assumptions of normality and homogeneity of variance were not always satisfied
Power can be characterized only by repeated testing Power is an attribute not of a single test but of a sequence of many tests conducted under similar conditions and with the same test design Therefore in this document EPA used the sample averages for each laboratoryrsquos data set to characterize each laboratory The following two parameters were required (1) the mean endpoint response in the control (growth reproduction survival) and (2) the mean value of the error mean square (EMS) for tests
EPA evaluated the ability to detect toxic effects using three approaches for each test method (1) number of replicates required to detect a 25-percent difference from the control with power of 080 (2) percent difference from the control that can be detected with power of 080 and (3) power to detect a 25shypercent difference from the control All calculations are based on a one-sided two-sample t-test at a level of 095 (alpha of 005) The power for a multiple comparison (Dunnettrsquos or Steelrsquos test) will be less than the power for this two-sample t-test
Table 5-1 summarizes the results for this evaluation Depending on the method between 30 percent and 80 percent of the laboratories were able to detect a 25-percent effect for the sublethal endpoint consistently Between 60 percent and 100 percent of the laboratories were able to detect a 33-percent effect
To examine whether the upper bounds presented in Table 3-6 provide adequate test precision EPA calculated an estimate of the power to detect a 25-percent effect on a sublethal endpoint when the PMSD equals the upper bound reported in Table 3-6 The upper bounds of the PMSD are shown in Table 3-6 in Chapter 3 At the lower PMSD bound the power always exceeded 098 Tests with PMSD equaling the upper bound are not often able to detect a 25-percent effect This finding does not mean that the upper bound is ineffective The PMSD varies between tests and each laboratory has a distribution of PMSDs To avoid exceeding this upper bound often a laboratory would have to achieve substantially lower PMSDs in most tests
5331 Attainment of the PMSD Related to Power
The power of the current experimental design could be reevaluated by comparing it to alternative designs that use increased number of replicates or number of test concentrations (Chapman et al 1996) In this document EPA found that about half of the laboratories in the data set were able routinely to detect a 25-percent difference between control and treatment About two-thirds of the laboratories could routinely detect a 33-percent difference (Table 5-2) For example mere attainment of the 90th percentile PMSD values shown in Table 3-6 will not ensure the ability to detect a 25-percent effect (Table 5-2) If every acceptable test has a PMSD below that upper bound however the average PMSD will be lowered Based on the within-laboratory variability of PMSD1 the average PMSD likely will be substantially lower than the upper bound in Table 3-6 if most tests conducted by a laboratory are to have acceptable PMSDs
The average CV for PMSD is one-third to one-half its mean in commonly used methods
June 30 2000
1
5-7
Understanding and Accounting for Method Variability in WET Applications Under the NPDES Program
Table 5-1 Tests for Chronic Toxicity Power and Ability To Detect a Toxic Effect on the Sublethal Endpoint
Test Method No
Labs
No Labs with Power
Power (Range)
No Labs Having Power at Least 08 To Detect
Effect of
Effect Detected with Power 08 as Percent of
Control Mean (Range)$$ 08 $$ 05 25 33
10000 Fathead Minnow 19 6 14 021 - 100 6 13 82 - 62
10020 Ceriodaphnia 33 10 29 038 - 100 10 19 14 - 45
10030 Green Alga 9 7 8 033 - 099 7 8 13 - 49
10040 Sheepshead Minnow 5 4 5 077 - 100 4 5 86 - 26
10060 Inland Silverside 16 7 13 023 - 097 7 12 17 - 59
10070 Mysid (growth) 10 5 8 021 - 091 5 8 21 - 70
Note Power was calculated for a two-sample one-sided t-test at alpha = 005 for a 25-percent difference from the control Effect size detected was calculated for the same test using power 080 Calculations used the average EMS from all tests at each laboratory and the minimum number of replicates reported for those tests Calculations assumed that the parametric mean and variance equal the corresponding sample estimates They also assumed approximate normality of means and homogeneity of variance Because these assumptions may be violated the results here are approximate By saying ldquodetect a 25-percent difference from controlrdquo this alternative hypothesis is intended (control mean - treatment mean) gt 025 times control mean
Table 5-2 Power To Detect a 25-Percent Difference from the Control at the 90th Percentile PMSD
Chronic Method Replicates 90th Percentiles
of PMSD
Three Treatments
Four Treatments
Five Treatments
alpha = 005
alpha = 0053
alpha = 005
alpha = 0054
alpha = 005
alpha = 0055
10000 Fathead Minnow 3 35 039 025 039 019 039 015
4 35 041 030 042 026 043 023
10020 Ceriodaphnia 10 37 039 031 041 030 043 030
10030 Green Alga 3 35 039 025 039 019 039 015
4 35 041 030 042 026 043 023
10040 Sheepshead Minnow 3 23 072 069 072 062 073 055
4 23 073 071 074 068 075 066
10060 Inland Silverside 3 23 072 069 072 062 073 055
4 23 073 071 074 068 075 066
10070 Mysid 8 32 048 041 050 040 052 040
Notes Values are rounded to two significant figures Number of treatments is the number of concentrations compared with the control in the hypothesis test The calculations assumed (1) the usual assumptions of the test are satisfied (approximate normality homogeneity of variances) and (2) equal replication in treatments and control Because these assumptions may be violated the results here are approximate Because the MSDmean implies a value for [root (error mean square)mean] the latter could be calculated from the MSD Dunnettrsquos critical value and the number of replicates and then used in a calculation of power Calculations apply to a one-sided two-sample t-test of equal means assuming equal variances and equal replication with hypotheses Hocontrol mean - treatment mean = 0 versus Hacontrol mean - treatment mean gt 025 times control mean The power achieved by Dunnettrsquos multiple comparison procedure will lie between the two-sample power at alpha = 005 and that for alpha = 005(no of treatments)
June 30 2000 5-8
Understanding and Accounting for Method Variability in WET Applications Under the NPDES Program
Testing laboratories and permittees can examine the EMS or MSD in Tables B-14 and B-15 (Appendix B) to estimate the ability of a WET test to detect toxic effects Some regulatory authorities may require a comparison between the control and the receiving water concentration which requires a two-sample one-sided t-test Others may require the multiple comparisons procedure described in the EPA WET methods (Dunnettrsquos or Steelrsquos tests one-sided with alpha of 005) The power of Dunnettrsquos procedure falls between the power of the one-sided two-sample t-test with alpha of 005 and alpha of 001 assuming that no more than five toxicant concentrations are compared to a control The power of Steelrsquos procedure will be related to and should usually increase with the power of Dunnettrsquos procedure and the t-tests Tables B-14 and B-15 in Appendix B also provide an appropriate guide to achieving power using a nonparametric test
Recently the State of Washington (1997) issued guidance specifying an acute and chronic statistical power standard to be achieved for compliance testing EPArsquos sediment toxicity testing manuals (USEPA 1994c USEPA 2000) include power curves for various numbers of experimental units CV ranges and associated alpha and beta levels Sheppard (1999) is a good source to provide a simple explanation of how power helps determine how large a sample should be Additional information on power may be obtained at httpwwwpsychologieuni-trierde8000projectsgpowerliteraturehtml
EPA recommends that regulatory authorities specify in their State WET implementation procedures that individual test results achieve a level of within-test sensitivity by using the upper and lower PMSD test sensitivity bounds (see Section 64) To achieve the test sensitivity bounds testing laboratories may need to minimize within-test variability (eg EMS) or increase the number of replicates tested or both If laboratories cannot achieve PMSD values of less than 25 percent for the toxicity test methods that require a minimum of only three replicates (Methods 10000 10040 10060) then the numbers of replicates may need to be increased Appendix B (Section B4) provides information related to the number of replicates needed and discusses the relationship between test power and effect size achieved The magnitude of the effect size achieved relates to the test sensitivity
54 Test Acceptability Criteria
EPA test methods have specific TAC that the effluent and reference toxicant tests must meet A test is considered invalid if the TACs are not met The recommended test conditions for each test method specify the minimum requirements and the TAC For example control survival must be 80 percent or greater and average control reproduction at least 15 young per surviving female in the chronic Ceriodaphnia dubia survival and reproduction test
The chronic West Coast marine methods (USEPA 1995) require additional TAC For example to limit the degree of within-test variability the methods specify a maximum allowable value for PMSD (see Section 532 on experimental design) Some States have additional TAC in their State WET implementation policies North Carolina (1998) for example requires that the chronic Ceriodaphnia dubia analyses meet an additional TAC of complete third brood neonate production by at least 80 percent of the control organisms and that the control reproduction CV be less than 40 percent
Additional TAC might be specified to minimize variability among replicates Variability of any toxicity test result is influenced by the number of replicates used number of organisms tested and variability among replicates at each test concentration and the control Variability among replicates has been quantified by treatment CV EMS or MSD The application of a maximum acceptable value for CV or MSD helps ensure adequate laboratory QAQC and increases the reliability of submitted data One benefit of requiring a maximum allowable within-test variability limit is that laboratories will improve culturing test handling and housekeeping which are usually incorporated into the laboratoriesrsquo standard operating procedures For example the CV requirement might be incorporated directly into the NPDES permit Sample EPA Region 6 permit language reads
June 30 2000 5-9
Understanding and Accounting for Method Variability in WET Applications Under the NPDES Program
1 The coefficient of variation between replicates shall be less than or equal to 40 percent in the control
2 The coefficient of variation between replicates shall be less than or equal to 40 percent at the instream waste concentration (IWC)
3 Test failure may not be construed or reported as invalid due to a CV of greater than 40 percent A repeat test shall be conducted within the required reporting period if any test is determined to be invalid
Occasionally statistical analyses indicate a test failure when as little as 15-percent mortality has occurred in a test dilution Permit language has been developed to address this occurrence as in the following example
If all TAC conditions are met and the percent survival of the test organism is greater than or equal to 80 percent (in a chronic test) or 90 percent (in an acute test) in the critical dilution concentration and all lower dilution concentrations the test shall be considered to be a valid test and the PERMITTEES shall report an NOEC of not less than the critical dilution for the discharge monitoring report (DMR) reporting requirements
Regulatory authorities may consider providing guidance or imposing additional TAC such as those implemented by EPA Region 6 or like some States have implemented (North Carolina 1998 Washington 1997) Appendix E provides additional examples of States that have implemented further guidance on WET QAQC procedures and TAC Warren-Hicks (1999) also recommended that additional national TAC be established for each test method (eg upper and lower bounds on the MSD) Therefore EPA recommends that regulatory authorities require that additional TACs be implemented in permits to minimize within-test variability and increase test sensitivity (see Section 64 and Appendix C for sample permit language)
55 Conducting the Statistical Analysis To Determine the Effect Concentration
EPA test methods currently recommend two statistical approaches to estimate a chemical or effluent concentration for each biological effect endpoint (eg survival growth and reproduction) One approach is to derive the NOEC by hypothesis testing which equates biological significance with statistical significance The second approach is to estimate an effect concentration that reduces the control response by 25 percent for chronic methods The expanded use of WET tests in the NPDES program has brought increased attention to the statistical analysis of toxicity test data A common goal for both regulatory authorities and permittees is to confirm that the effect concentrations were derived correctly using the appropriate analysis approaches Reliable effect concentrations lead to increased confidence in the data used for making regulatory decisions such as determining reasonable potential deriving a permit limit or monitoring trigger and generating self-monitoring test results
Another important consideration in conducting statistical analyses is the inconsistent use of statistical programs The proliferation of statistical packages has been helpful in data analysis however these packages also can result in the misapplication of the statistical methods APCA-AWWA-WEF (1998) cautions the user to confirm the results of each analysis with each package before accepting them The data user is responsible for evaluating all data submitted to the regulatory authorities
The 1995 SETAC Pellston Workshop discussed unresolved scientific issues and highlighted significant research needs associated with WET testing The attendees recommended the following
Immediately instigate studies to evaluate improvements in the statistical analysis of WET test data These studies should include but not necessarily be limited to the following activities
5-10 June 30 2000
Understanding and Accounting for Method Variability in WET Applications Under the NPDES Program
(a) investigate the implications of concurrent application of NOECMSD tests of bioequivalence and ECp estimators (Chapman et al 1996a)
In response to this recommendation EPA began projects to evaluate the bioequivalence approach and additional point estimate models for the WET program At present two test methods are being used for this evaluation (1) the chronic Ceriodaphnia dubia survival and reproduction tests and (2) the giant kelp germination and germ-tube length test with reference toxicants
The bioequivalence approach poses the following question Do the mean responses of the effluent concentration and the control differ by more than some amount For example the control response and the response at the critical effluent concentration (ie instream waste concentration) must differ by no more than a fixed value in order to accept the hypothesis of no significant difference (ie no toxicity) This approach could address the concern that an imprecise test might not detect toxicity when toxicity is present or that a small but statistically significant effect would detect toxicity that may not be biologically important Some researchers have suggested that the bioequivalence approach could provide a positive incentive for dischargers to produce test results with lower within-test variability to demonstrate that no toxicity occurs at a level greater than a biologically (bioequivalence approach) significant amount (Shukla et al 2000 Wang et al 2000)
Bailer et al (2000) evaluated the proposed regression-based estimators with the current EPA point estimate models They found that it appears reasonable to incorporate parametric estimation models in the WET program Bailer et al (2000) concluded that these models are appropriate for all response scales (ie dichotomous count and continuous) and can incorporate monotonicity without bias However confidence intervals still need to be developed for these parametric models
In this document EPA has not recommended either the bioequivalence or additional point estimate models to supplement the current statistical approaches as described in the testing manuals An independent peer-reviewed workshop should be convened to evaluate the benefits of these alternative statistical approaches to enhance the statistical approaches currently applied
56 Chapter Conclusions
In this chapter EPA provides guidance to permittees and testing laboratories on collecting representative effluent samples conducting the biological test methods and evaluating the statistical analyses EPA recommends that States implement the lower and upper PMSD test sensitivity bounds to achieve an acceptable level of test sensitivity and minimize within-test variability (see Section 64) EPA also provides guidance to permittees and testing laboratories on the number of replicates required to achieve the PMSD bounds Testing laboratories should maintain and evaluate both effluent and reference toxicant data using a measure of within-test variability such as the PMSD
Permittees and toxicity testing laboratories may need to increase replication in order to reduce PMSD below the upper bound Table B-15 can be used for initial planning of replication given knowledge of typical values of the error mean square (EMS) or MSD and the number of concentrations used in the multiple comparison hypothesis test To ensure that all PMSD values fall below the upper bound in Table 3-6 a laboratory would select the largest EMS value experienced in its past testing
EPA recommends that testing laboratories require a minimum of four replicates for the fathead minnow sheepshead minnow and inland silverside chronic test methods (Methods 10000 10040 and 10060 respectively) Four replicates are needed to execute the statistical flow chart when a nonparametric test is needed Three replicates are also sometimes insufficient to keep PMSD below the recommended upper bound In addition four replicates are needed to help achieve the upper PMSD bound
June 30 2000 5-11
Understanding and Accounting for Method Variability in WET Applications Under the NPDES Program
This page intentionally left blank
5-12 June 30 2000
60 GUIDANCE TO REGULATORY AUTHORITIES DETERMINING REASONABLE POTENTIAL AND DERIVING WET PERMIT CONDITIONS
EPA developed the TSD (USEPA 1991a) to support implementation of national policy to control the discharge of toxic pollutants The TSD presents a statistical approach for determining the need for and the method of deriving water quality-based effluent limits (WQBELs) based on aquatic life (including WET) human health and wildlife criteria This approach accounts for the uncertainty associated with small data sets and data variability by assuming a statistical distribution of effluent data (usually lognormal) and calculating a CV or using a default CV to describe data variability
61 Analytical and Sampling Variability in Calculations for Reasonable Potential and Permit Limits
Section 61 discusses use of the CV of sample measurements of toxicity to make a reasonable potential determination and to calculate permit limits Two points must be understood (1) this CV is to be calculated using toxic unit (TU) values (USEPA 1991a) (see Section 62) and (2) EPA strongly recommends that point estimates (not NOEC or LOEC values) be used to calculate the TU values (USEPA 1994a 1994b)
Water quality-based effluent limits are required when a discharge causes has reasonable potential to cause or contributes to an instream excursion above a water quality standard Throughout this document EPA uses the commonly understood shorthand reference ldquoreasonable potentialrdquo to refer to this standard for determining the need for a water quality-based effluent limit
611 ldquoAdjusting for Analytical Variabilityrdquo in Calculations for Reasonable Potential and Permit Limits
Adjustment approaches (see Appendix G3) have been suggested to ldquoadjust for analytical variabilityrdquo when deriving permit limits and determining the need for a WET limit in the first place EPA does not recommend these adjustment approaches (Appendix G3) and strongly reaffirms the statistical approach and methods for calculating permit limits provided in the TSD (USEPA 1991a) EPA recommends that regulatory authorities use the statistical approach and calculation methods in the TSD The TSD methods were designed to provide a reasonable degree of protection for water quality (ie to avoid exceedances of water quality criteria) while providing a reasonable degree of protection from the variability of effluent toxicity and analytical variability The various ldquoadjustmentrdquo approaches would undermine these objectives
The TSD limit calculation for a point source can be divided into two steps first convert the wasteload allocation (WLA) to a long-term average (LTA) and then convert the LTA to effluent limits (maximum daily average weekly and average monthly limits) WET limit calculations include an intermediate step in which the acute WLA is converted to a WLAac These calculations employ a facility-specific CV based upon effluent sampling data The TSD approach uses this CV in both steps
Adjustment approaches intended to account for analytical variability discussed in detail in Appendix G would inappropriately use different CVs in these two steps The first step would use an estimate of the CV of ldquotruerdquo effluent toxicity which is smaller than the CV for measured toxicities This approach would result in a larger calculated LTA The second step would use the CV for the measured toxicities which is the same CV used in both steps of the TSD approach
Use of such adjustment approaches would frequently result in setting an average monthly permit limit (AML) that exceeds the chronic WLA Appendix G demonstrates that such outcomes (ie the AML exceeds
June 30 2000 6-1
Understanding and Accounting for Method Variability in WET Applications Under the NPDES Program
the chronic WLA) generally can be expected to occur when various adjustment approaches are used Appendix G Table G-1 presents a numerical example of how an adjustment approach would allow calculation of an AML exceeding the chronic WLA (a four-day average value) even when sampling frequency for the calculation is set at the recommended minimum of four samples per month [It is acceptable for the maximum daily limit (MDL) which applies to a single sample to exceed the chronic WLA It is also acceptable for the AML to exceed the chronic WLA if the AML calculation is based on fewer than four samples per month Note however that the TSD recommends always assuming at least four samples per month when calculating the AML]
The TSD reasonable potential calculation first calculates the percentile represented by the maximum observed TU value For example the maximum of 10 reported TU values is identified with the 63rd
percentile Then the sample CV is used to project the 95th or 99th percentile TU value using a table of reasonable potential multiplying factors This value is combined with the appropriate mixing-zone dilution to project a maximum receiving water toxicity which is compared with the applicable water-quality criterion If an adjustment were applied to the reasonable potential calculation the CV would be adjusted downward and the maximum projected receiving water toxicity would be smaller This would make a determination of need for a permit limit less likely
Because of these considerations EPA strongly recommends that no adjustment be made to the CV or variance of toxicity either for reasonable potential or permit limit calculations The TSD statistical approaches already account for analytical variability appropriately EPA continues to recommend the TSD approach which ensures that effluent limits and thereby measured effluent toxicity or pollutant parameter concentrations are consistent with calculated WLAs
612 Analytical Variability and Self-monitoring Data
EPA determines compliance with permit limits on the basis of self-monitoring data and these data include some measure of analytical variability The influence of analytical variability is accounted for in the TSD statistical procedures used to set water-quality limits and determine the potential for toxicity as explained in Appendix G
The permittee is responsible for ensuring that measured discharge toxicity never exceeds the permit limits No special allowance is made for analytical variability in assessing compliance The maximum discharge toxicity should incorporate a margin of safety which will account for sampling and analytical variability In other words to avoid exceeding permit limits the facilityrsquos treatment system should be designed so that the maximum toxicity is somewhat lower than its permit limits
613 Precision of WET Measurements and Estimates of Effluent CV
Single measurements on effluent involve some uncertainties about the true concentration or toxicity related to representativeness of the sample including sample holding time and conditions and the analytical measurement system Like all analytical measurements WET measurements (NOEC EC25 LC50) are inexact That is the exact toxicity of an analyte in a sample can be specified only within some range This imprecision can be reduced by using a suitable number of organisms and replicates for each test (see Section 532 on experimental design)
The numbers of organisms and replicates required for EPA WET method test acceptability are specified as minimums Test precision will be approximately proportional to the square root of the number of replicates Thus doubling the number of replicates may decrease the MSD to approximately 70 percent of its former value Increased replication also tightens the confidence interval for a point estimate of the effect concentration (eg EC25 and LC50)
June 30 2000 6-2
Understanding and Accounting for Method Variability in WET Applications Under the NPDES Program
EPA strongly recommends that toxicity measurements of an effluent be obtained at least quarterly for three years to provide a good basis for determining the need for limits and for calculating limits One year should be regarded as the minimum duration needed to characterize effluent variability (due to seasonal stream flow or process fluctuations) and ten the minimum number of measurements unless scientific and technical knowledge supports a shorter period as representative of the distribution of pollutant types and concentrations of toxicity
Estimates based on multiple measurements involve the same uncertainties that apply to single measurements They also may involve larger uncertainties related to sampling error that is the chance that typical levels of toxicity or concentrations of pollutant may not be encountered during the sampling program The sampling program may not fully characterize effluent variability if too few samples are taken the sampling times and dates are not representative or the duration of the sampling program is not long enough to represent the full range of effluent variability When determining the need for limits and calculating limits the variance or the CV of toxicity measurements is key The larger the number of samples the more precise is the estimate Confidence intervals for the variance and CV can be calculated and carried through the calculations for reasonable potential and effluent limits (Appendix G) Even when assumptions are not strictly met confidence intervals provide a useful perspective on the uncertainty of the results and the need for more samples The minimum number of measurements recommended for calculating estimates of the CV for effluent toxicity is 10
614 Between-Laboratory Variability
Between-laboratory variability may increase the CV as discussed in Section 611 if the toxicity tests were conducted by more than one laboratory for a specific facility A concern to permittees is that this may increase the likelihood of making a finding of reasonable potential
Within-laboratory variability is the component of analytical variability that should be reflected in regulatory calculations If the data used for reasonable potential or permit limit calculations are effluent measurement data reported by at least two laboratories there are ways to appropriately estimate the variance to be used in TSD statistical calculations
For example
bull If the same laboratories continue to be used in the same proportion or frequency and the measurements from the individual laboratories represent different sampling dates the measurement data can be treated as if they were generated by a single laboratory This approach may increase the estimated variance and the AML which is not in the interest of the permittee Selecting one laboratory for future monitoring based on the variance of its reported reference toxicant test results should mitigate this problem
bull If only one laboratory has reported data on each sampling date and the other laboratories report over different time spans or over the same time span on alternating dates EPA recommends forming a pooled estimate of variance Calculate the sample variance (S2) of log(TU) for each laboratory separately and combine these using the formula
pooled variance of log(X) = [(N1 - 1)S12 + (N2 - 1)S2
2] [(N1 - 1) + (N2 - 1)]
An analogous formula is used for more than two laboratories The same result can be obtained by conducting a one-way analysis of variance on log(TU) (with laboratories treated as the groups or classes) and using the reported EMS
June 30 2000 6-3
Understanding and Accounting for Method Variability in WET Applications Under the NPDES Program
Changing a laboratory may change analytical (within-laboratory) variability of measurements and test sensitivity (ie PMSD values) That is the average effect concentration may change (eg Warren-Hicks et al 1999) Ideally the permittee will anticipate and plan for a change of testing laboratory Permittees should compare reference toxicant test data for current and candidate replacement laboratories selecting one with acceptable variability and a similar average effect concentration
62 Determining Reasonable Potential and Establishing Effluent Limits
Effluent characterization is an essential step in determining the need for an NPDES permit limit NPDES regulations under 40 CFR Part 12244(d)(1)(ii) specify that reasonable potential include ldquowhether a discharge causes has the reasonable potential to cause or contributes to an instream excursion above a State water quality standardrdquo Calculations for reasonable potential determination and for permit limits should follow EPA guidance in the TSD (USEPA 1991a) In particular the TSD statistical methods should be used Such calculations should use TUs for WET data not effect concentrations (percent whole effluent) Toxic units are defined (USEPA 1991a Chapter 131 page 6) as the reciprocal of the effect concentration times 100 where the effect concentration is expressed as a percentage of whole effluent thus TUa = 100 LC50 and TUc = 100ECp
When characterizing an effluent to determine whether a permit limit is necessary permit writers can use the available effluent WET data and a water-quality model to perform a reasonable potential analysis The TSD outlines the statistical approach This approach uses existing effluent data to project a maximum pollutant concentration or a maximum toxicity in the effluent (USEPA 1991a) The projected maximum concentration or toxicity is used as an input in the water quality model to determine whether the effluent has the reasonable potential to cause or contribute to an excursion of ambient water quality criteria If reasonable potential exists the permit writer must derive a WET permit limit for that facility1
The variability of the existing effluent data as measured by the CV has a significant effect on the projected maximum pollutant concentration or toxicity The higher the CV the higher the projected maximum and the more likely that there is reasonable potential and a limit is needed EPA recommends that regulatory authorities use all valid relevant and representative data in making reasonable potential determinations EPA is developing a national policy clarifying use of the TSD procedures for determining reasonable potential for WET Important components of this policy include specifying the minimum number of valid WET tests necessary to calculate facility-specific CVs2 as well as recommending a step-wise approach to determining the need for WET permit limits This approach reflects a strong preference by EPA and its stakeholders to rely on facility-specific WET testing based on adequate frequency and duration of effluent sampling for making reasonable potential determinations for toxicity
EPA recommends that point estimates be used to estimate effluent variability to determine the need for limits and to set permit limits This is recommended whether the self-monitoring test results will be determined using hypothesis tests or point estimates Point estimates have less analytical variability than NOECs using current experimental designs as shown in Chapter 3 Point estimates make the best use of the WET test data for purposes of estimating the CV LTA and RP factor and calculating the permit limit
1 When the State has narrative criteria for toxicity and the TIETRE identifies a specific chemical that is the source of toxicity the permit writer may include a chemical-specific limit for that parameter instead of a WET permit limit in accordance with 40 CFR Part 12244(d)(v)
2 If fewer than ten data points are available the regulatory authority must use a default CV As a result the need for a WET permit limit may be based on a default value rather than actual data
June 30 2000 6-4
Understanding and Accounting for Method Variability in WET Applications Under the NPDES Program
63 Development of a Total Maximum Daily Load for WET
Total maximum daily loads (TMDLs) may be indicated when there is acute or chronic toxicity in a waterbody leading to the listing of the waterbody as impaired under CWA Section 303(d) and when there are multiple sources of the toxicity EPA believes that TMDL calculations should be performed on the pollutants causing toxicity whenever possible In these situations EPA suggests that the first step of the analysis is to conduct ambient toxicity identification evaluations to identify the pollutant(s) and the source(s) causing the toxicity Once the pollutant(s) and source(s) causing toxicity have been identified for the waterbody then a TMDL should be developed for the individual pollutant(s)
64 Accounting for and Minimizing Variability In the Regulatory Decision Process
A common goal for the permittee and the regulatory authority is to have confidence in the test results from the biological and statistical procedures Both permittees and regulatory authorities would then have more confidence in taking regulatory actions such as evaluating multiple effluent samples to determine reasonable potential and derive permit conditions (eg permit limits monitoring triggers) If steps such as collecting a representative effluent sample to conducting the toxicity tests properly as discussed in Sections 52 through 54 and requiring additional TACs (Section 641) are used to reduce or minimize within-test variability then the reliability of the WET test results increases
641 Recommended Additional TACs Lower and Upper Bounds for PMSD
Reference toxicant data from a large number of tests and laboratories were used to generate PMSD values percentiles of these values are reported in Table 3-6 The MSD represents the smallest difference between the control mean and a treatment mean that leads to the statistical rejection of the null hypothesis (ie no toxicity) using Dunnettrsquos multiple comparison test MSD values are divided by the control mean and multiplied by 100 to produce a ldquopercent MSDrdquo (PMSD) value The PMSD allows comparison of different tests and represents the smallest significant difference from the control as a percentage of the control mean Thus it represents the smallest significant value of the relative difference [100 (control mean shytreatment mean)control mean] The MSD is often expressed as a percentage of the biological endpoint in the control response
The following formula is used to calculate MSD (as recommended by USEPA 1995)
MSD ds w (1n1) (1n)
where d = critical value for the Dunnettrsquos procedure
sw = the square root of the error mean square (EMS) n1 = number of experimental units in the control treatment n = the number of experimental units per treatment assuming an equal number at all other
treatments
Percent MSD is calculated as follows MSDPMSD times 100
control mean
EPA recommends that regulatory authorities implement both the lower and upper PMSD bound approach to minimize within-test variability when using hypothesis testing approaches to report an NOEC The implementation of the upper PMSD bound should also apply when using point estimate techniques There are five possible outcomes for regulatory decisions (see Figure 6-1) Two outcomes imply unqualified acceptance of the WET test statistical result
June 30 2000 6-5
Understanding and Accounting for Method Variability in WET Applications Under the NPDES Program
1 Unqualified PassndashThe testrsquos PMSD is within bounds and there is no significant difference between the means for the control and the instream waste concentration (IWC) treatment The regulatory authority would conclude that there is no toxicity at the IWC concentration
2 Unqualified FailndashThe testrsquos PMSD is larger than the lower bound (but not greater than the upper bound) in Table 3-6 and there is a significant difference between the means for the control and the IWC treatment The regulatory authority would conclude that there is toxicity at the IWC concentration
3 Lacks Test SensitivityndashThe testrsquos PMSD exceeds the upper bound in Table 3-6 and there is no significant difference between the means for the control and the IWC treatment The test is considered invalid A new effluent sample must be collected and another toxicity test must be conducted
4 Lacks Test SensitivityndashThe testrsquos PMSD exceeds the upper bound in Table 3-6 and there is a significant difference between the means for the control and the IWC treatment The test is considered valid The regulatory authority would conclude that there is toxicity at the IWC concentration
5 Very Small but Significant DifferencendashThe relative difference (see Section 642 below) between the means for the control and the IWC treatment is smaller than the lower bound in Table 3-6 and this difference is statistically significant The test is acceptable The NOEC is determined as described in Section 642 below
Test Unacceptable Lacks Sensitivity
Very Small Determine the NOEC
(Section 642)
PASS
FAIL
MIN
MAX (0c - 0IWC) = PMSD
Percent Minimum
Significant Difference
MIN MAX(0 - 0IWC)c
0 = control meanc
0IWC = instream waste concentration mean
Figure 6-1 Paradigm that incorporates the lower and upper percent minimum significant difference
Regulatory authorities should examine the sample permit language as provided in Appendix C for incorporation of the PMSD bound language in a NPDES permit
Note that ldquounqualified acceptancerdquo of a WET test result requires that all of the following must be achieved (1) collect the effluent sample properly (2) conduct the toxicity test methods as specified in the toxicity manuals (3) meet the required TACs (4) meet the proper water quality parameters (eg temperature pH) and (5) conduct the proper statistical calculations All these conditions must be reviewed and deemed acceptable before a test is evaluated for self-monitoring data and reporting
June 30 2000 6-6
Understanding and Accounting for Method Variability in WET Applications Under the NPDES Program
Figure 6-2 provides a decision tree that regulatory authorities can use when implementing the lower and upper PMSD bounds
Use Data for Calculating Reasonable Potential Limit Self-Monitoring Data
KEY PMSD = Percent minimum
significant difference MT = Monitoring trigger TAC = Test acceptability criteria WQ = Water quality
Verify TAC
Check WQ Parameters
amp Test Conditions
Calculate amp Report PMSD
Calculate Statistical Endpoints
Conduct Toxicity Tests
Evaluate Test Data
Continue Routine Testing
Conduct Additional Tests
Determine NOEC According to 643
Repeat Test with New Effluent Sample
Within PMSD Bounds
amp IS NOT Significant
at IWC
Within PMSD Bounds amp IS Significant
at IWC Exceeds Upper
PMSD Bound amp IS Significant
at IWC
Exceeds Upper PMSD
Bound amp IS NOT
Significant at IWC
Below Lower
PMSD Bound amp IS Significant
at IWC
5
1
4
2
3
Figure 6-2 Implementing applications of upper and lower PMSD bounds for effluent toxicity testing requirements
June 30 2000 6-7
Understanding and Accounting for Method Variability in WET Applications Under the NPDES Program
642 How to Determine the NOEC Using the Lower PMSD Bound
If the permit specifies that self-monitoring data are to be generated using hypothesis testing approaches then the analyst should report the NOEC as the following Find the smallest concentration for which (a) the treatment mean differs significantly from the control mean and (b) the relative difference (see example below) is not smaller than the 10th percentile in Table 3-6 Therefore the NOEC is the next smaller test concentration
In other words concentrations having a very small relative difference with control (smaller than the lower PMSD bound) would be treated as if they do not differ significantly from control (even if they do so) for the purpose of determining the NOEC
Table 6-1 illustrates the application of the lower PMSD bound for the reproduction endpoint of a Ceriodaphnia chronic test In this example the testrsquos PMSD was 99 smaller than the 10th percentile value of 11 found in Table 3-6 The IWC concentration differed significantly from the control The test falls under outcome number 5 a significant but very small difference at the IWC The first step is to calculate the relative differences from control (Table 6-1) as [(control mean - treatment mean) divided by (control mean)] times 100 The next step is to determine which relative differences exceed the PMSD lower bound 11 in this case (see the last column of Table 6-1) Finally the NOEC is determined as described above The NOEC is 125 percent effluent for this example
Table 6-1 Example of Applying the Lower PMSD Bound for the Chronic Ceriodaphnia Test with the Reproduction Endpoint
Concentration (percent effluent)
Reproduction (mean of ten replicates)
Relative Difference
from Control
Does Relative Difference Exceed 11
100 508 82 Yes
50 124 56 Yes
25 234 17 Yes
IWC = 125 253 10 No
625 261 74 No
Control 282 0 No
NOTE The lower PMSD bound for this method and endpoint is 11 (Table 3-6) In this example the NOEC is 625 percent effluent using the testrsquos (very small) PMSD Therefore the reported NOEC should be 125 percent effluent after applying the lower PMSD bound
Differs statistically from the control as determined by MSD = 28 neonates Thus treatment means that are less than 282 - 28 = 254 would be statistically significant These correspond to relative differences greater than 100 (28 282) = 99 percent
643 Justification for Implementing the Test Sensitivity Bounds
A lower bound is needed to avoid penalizing laboratories that achieve unusually high precision The 10th percentile PMSD represents a practical limit to the sensitivity of the test method because few laboratories are able to achieve such precision on a regular basis and most do not achieve it even occasionally Several independent researchers have evaluated and provide support for using the MSD approach as additional TAC for the toxicity test methods Thursby et al (1997) advocate and provide reasons for using an empirical data base of minimum significant differences to provide TAC using statistical performance assessment The State of California (Hunt et al 1996 Starrett et al 1993) and the West Coast marine toxicity test methods (USEPA 1995) have implemented an upper PMSD bound to minimize insensitive tests Also the State of North Carolina has implemented additional requirements for the Ceriodaphnia chronic tests that reduced method
June 30 2000 6-8
Understanding and Accounting for Method Variability in WET Applications Under the NPDES Program
variability North Carolinarsquos evaluation of these additional TACs and subsequent improvements in test sensitivity appears in Appendix F
The North Carolina data base affords the opportunity to evaluate the effectiveness of additional TAC and changes to the toxicity test procedures as they relate to the variability of WET test results (see Appendix F) For example for PMSD the median value decreased from 21 percent to 16 percent while the 90th percentile decreased from 39 percent to 31 percent indicating an overall increase in test sensitivity The range in median values across all laboratories before adopting additional TACs was 12 percent to 36 percent After adopting additional TACs the range in median values was 10 percent to 27 percent indicating a decrease in the overall spread between laboratories The range in control CVs within a laboratory was from 21 percent to 79 percent before adopting TACs compared to the range in control CVs within a laboratory after adopting TACs which was narrowed to 17 percent to 36 percent Overall laboratories are generating data with more consistency within and between laboratories after implementation of the additional TACs and additional method guidance provided by the State for the chronic Ceriodaphnia dubia test method
644 Guidance to Testing Laboratories on How to Achieve the Range of Performance for PMSD
EPA recommends that regulatory authorities use the upper bounds (90th percentiles for PMSD in Table 3-6) to identify tests that are insufficiently sensitive If PMSD exceeds this upper bound more often than occasionally the laboratory should thoroughly investigate ways to reduce variability There are three principal ways to reduce PMSD (1) decrease within-test variability (that is decrease the error mean square and therefore the standard deviation at each concentration) (2) increase the control mean and (3) increase the number of replicates The number of replicates required could be determined by trial-and-error calculations using the error mean square values obtained from a series of WET tests At least 20 tests are recommended The number ldquonrdquo in the formula for MSD (number of replicates) would be increased and MSD re-calculated for each error mean square value This approach uses a sample of tests specific to a particular laboratory and reveals the variation among tests This approach would demonstrate how many replicates would be needed to achieve the upper PMSD bound as required in Table 3-6
65 Additional Guidance That Regulatory Authorities Should Implement to Further Support the WET Program
As discussed in Section 53 regulatory authorities have the discretion to develop and implement additional WET program requirements and guidance to ensure that WET test method variability is reduced by specifying additional guidance beyond the minimum requirements of EPArsquos WET test methodrsquos QAQC and TACs Appendix E provides a snapshot of State approaches to implementing NPDES WET programs to minimize WET test variability
These State approaches include WET information to assist the regulated community with the following
bull Guidance regarding the evaluation of reference toxicant and effluent test results
bull Guidance regarding how the State reviews reference toxicant data for laboratory performance
bull Guidance regarding additional QAQC criteria the State has developed and implemented
bull Guidance regarding efforts the State has made to minimize test method variability
bull Description of how the State reviews or conducts performance laboratory audits
bull Description of specific implementation guidance that the State has developed to assist permit writers
bull Description of how the State provides or uses toxicity test training
June 30 2000 6-9
Understanding and Accounting for Method Variability in WET Applications Under the NPDES Program
States contemplating such changes should consult with EPA to ensure the changes will be appropriate in the context of the Statersquos overall NPDES WET program In addition States should implement a step-wise approach to address toxicity when the permit limit or monitoring trigger is exceeded in their State WET implementation plans
For example when an effluent is deemed toxic then the permittee should take appropriate steps to demonstrate the magnitude frequency and potential source(s) of the toxicity The components of the stepshywise approach could include increased frequency of toxicity testing to characterize the magnitude and frequency of toxicity If continued toxicity is demonstrated then the permittee could conduct a Toxicity Reduction EvaluationToxicity Identification Evaluation (TRETIE) with toxic effluent sample(s) (USEPA 1991b 1992) For example EPA Regions 9 and 10 have prepared WET implementation guidance to assist their States (Denton and Narvaez 1996) This guidance provides sample permit language for a step-wise approach to address toxic samples (see Appendix C)
66 Chapter Conclusions
The TSD statistical approach to reasonable potential determination and permit limit derivation considers combined effluent and analytical variability through the CV of measured effluent values Because determination of effluent variability is based on empirical measurements the variability estimated for effluent measurements includes the variability of pollutant levels sampling variability and a smaller component owed to method variability Steps should be taken to reduce these sources of variability EPA believes that the TSD statistical procedures are appropriately protective in considering both effluent and analytical variability in reasonable potential and effluent limit calculations
EPA recommends that regulatory authorities use a sampling program that conducts at least ten representative WET tests over a period of three years to represent the full range of effluent variability Regulatory authorities should use recommended procedures in the TSD to determine when numeric WET limits or WET monitoring triggers are needed Other permit conditions may include monitoring triggers such as increased toxicity testing TREsTIEs and follow-up actions initiated because a permit limit is exceeded or a monitoring trigger is not met Regulatory authorities should implement the additional test sensitivity requirements by requiring that each test result not exceed the upper PMSD bound In addition regulatory authorities should determine the appropriate NOEC for test results below the lower PMSD bound as described in Section 642 These efforts should lead to increased confidence in the effect concentrations that are generated to evaluate self-monitoring data
6-10 June 30 2000
70 CONCLUSIONS AND GUIDANCE TO LABORATORIES PERMITTEES AND REGULATORY AUTHORITIES
This document was prepared to address whole effluent toxicity (WET) test variability The document has three goals (1) quantify the variability of promulgated test methods and report a coefficient of variation (CV) as a measure of test method variability (2) evaluate the statistical methods described in the TSD for determining the need for and deriving WET permit conditions and (3) suggest guidance for regulatory authorities on approaches to address and minimize test method variability This document quantified the variability of toxicity test methods based on the end use of the data that is the effect concentrations (eg NOEC LC50 EC25) The within-laboratory variability of these effect concentrations was quantified by obtaining multiple test results under similar test conditions using the same reference toxicant The major conclusions of this document are discussed below
71 General Conclusions
bull EPArsquos Technical Support Document for Water Quality-based Toxics Control (referred to as the TSD) presents guidance for developing effluent limits based on three key components (1) water quality criteria (2) a calculated dilution factor used to derive a waste load allocation (WLA) from the criteria and (3) a statistical calculation procedure that uses a CV based on effluent data to calculate effluent limits from the WLA EPArsquos TSD statistical approach is appropriately protective regarding both effluent and analytical variability provided that the criteria and WLA are derived correctly It is inappropriate to adjust the TSD statistical methodology for determining when water quality-based effluent limits are needed and for calculating such limits (Section 6 and Appendix G)
bull EPArsquos analysis indicates that the TSD approach appropriately accounts for both effluent variability and method variability EPA does not believe a reasonable alternative approach is available to determine a factor that would discount the effects of method variability using the TSD procedures (Section 611 and Appendix G)
bull Interim CVs are identified for promulgated WET test methods [Appendix A Table A-1 (acute methods) and Table A-2 (chronic methods)] pending completion of between-laboratory studies which may affect these interim CV estimates
bull Comparisons of WET method precision with method precision for analytes commonly limited in the National Pollutant Discharge Elimination System (NPDES) permits clearly demonstrate that the variability of the promulgated WET methods is within the range of variability experienced in other types of analyses Several researchers also noted that method performance improves when prescribed methods are followed closely by experienced analysts (Section 43)
bull The hypothesis test procedures prescribed in EPArsquos WET methods will provide adequate protection against false conclusions that an effluent is toxic However the incidence of false negatives can be high because of high within-test variability making it difficult to detect toxicity when toxicity is truly present Therefore evaluating the power of current experimental designs is desirable EPA expects that regulatory authorities will make prompt and measurable progress toward the goal of requiring all WET tests to detect a toxic effect of 25 percent to 33 percent with power of 080 (Section 533 and Appendix B4)
bull Quality assurance problems became apparent when evaluating the data for this study especially for the metal reference toxicants and sodium dodecyl sulfate (SDS) Standardizing the choice of reference toxicant and the concentrations to be tested may be appropriate as well as establishing bounds on the range of acceptable effect concentrations for each test method As a result
June 30 2000 7-1
Understanding and Accounting for Method Variability in WET Applications Under the NPDES Program
quantifying between-laboratory variability will be difficult unless these issues can be resolved (Section 531 and Appendix G25)
bull The data analysis did not reveal the potential sources and causes of variability such as using different sources of test organisms dilution water and food To assess the sources of variability fully experimenters must carefully design new studies (Section 531)
72 Recommendations for Minimizing Variability and Its Effects
Three critical areas are identified to minimize WET test method variability
bull Obtaining a representative effluent sample
bull Conducting the toxicity tests properly to generate biological endpoints and
bull Calculating the appropriate statistical endpoints to have confidence in the effect concentration
This document provides guidance to toxicity testing laboratories permittees and regulatory authorities in conducting biological and statistical methods and evaluating test effect concentrations It also develops guidance for regulatory authorities on approaches to address and minimize test method variability The principal aspects of the guidance are presented in Table 3-6 and re-presented here
Range of Relative Variability for Endpoints of Promulgated WET Methods Defined by the 10th
and 90th Percentiles from the Data Set of Reference Toxicant Testsa
Test Methodb Endpointc No of Labs
No of Tests
PMSD Control CVd
10th 90th 10th 90th
10000 Fathead Minnow G 19 205 94 35 0035 020
10020 Ceriodaphnia dubia R 33 393 11 37 0089 042
10030 Green Alga G 9 85 93 23 0034 017
10040 Sheepshead Minnow G 5 57 63 23 0034 013
10060 Inland Silverside G 18 193 12 35 0044 018
10070 Mysid G 10 130 12 32 0088 028
20000 Fathead Minnow S 20 217 42 30 0 0074
20020 Ceriodaphnia S 23 241 50 21 0 011
20040 Sheepshead Minnow S 5 65 0e 55 0 0
20060 Inland Silverside S 5 48 70 41 0 0079
20070 Mysid (A bahia) S 3 32 51 26 0 0081
20110 Mysid (H costata) S 2 14 18 47 0 0074
20210 Daphnia (D magna) S 5 48 53 23 0 011
20220 Daphnia (D pulex) S 6 57 58 23 0 011 a The precision of the data warrants only three significant figures When determining agreement with these values one may
round off values to two significant figures (eg values gt345000 and 35000 are rounded to 35) Method 10090 (red macroalga) is not reported because it is inadvisable to characterize method variability using only 23 tests from just two laboratories
b EPA did not assign method numbers for acute methods in EPA6004-90027F The numbers assigned here were created for use in this document and in related materials and data bases G = growth R = reproduction S = survival
d CVs were calculated using untransformed control means for each test e An MSD of zero will not occur when the EPA flow chart for statistical analysis is followed In this report MSD was
calculated for every test including those for which the flow chart would require a nonparametric hypothesis test EPA recommends using the value 42 (the 10th percentile shown for the fathead minnow acute test) in place of zero as the 10th
percentile PMSD (lower PMSD bound) for the sheepshead minnow acute test
June 30 2000 7-2
c
Understanding and Accounting for Method Variability in WET Applications Under the NPDES Program
721 Guidance to Toxicity Testing Laboratories
bull Testing laboratories should maintain quality assurancequality control (QAQC) control charts for percent minimum significant difference (PMSD) along with the statistical endpoints such as NOEC LC50 and EC25 Testing laboratories should regularly plot the individual raw test data and the average treatment responses to examine possible causes of excessive variability (Section 5311)
bull The minimum number of replicates for the chronic toxicity tests should be four for the chronic fathead minnow sheepshead minnow and inland silverside test methods (Sections 5331 and 56)
bull Testing laboratories should take steps to ensure that the test PMSD does not exceed the upper bound provided in the table above (Sections 33 533 and 64 and Table 3-6) This may require ensuring more uniformity among test organisms andor using more replicates Tables are provided to aid in choosing the number of replicates (Tables B-14 and B-15)
bull Testing laboratories should examine the power tables to ensure that test results will meet the recommended test sensitivity criteria These tables can be used to make decisions about replication given the knowledge of typical values for error mean square (EMS) and number of tested concentrations (Section 533 and Tables B-9 through B-15)
722 Guidance to NPDES Permittees
bull Permittees should select and conduct all data analyses with one qualified toxicity testing laboratory to determine reasonable potential derive permit limits and generate self-monitoring test results Conducting all effluent testing consistently using one reference toxicant is also prudent (Section 614 and Appendix G25)
bull Permittees should generate WET data (n = 10) that have been accumulated over a year or more to fully characterize effluent variability over time The sampling dates and times should span a sufficient duration to represent the full range of effluent variability (Sections 613 and 62 and Appendix G24)
bull Permittees should examine testing laboratoriesrsquo QAQC control charts If the CV for reference toxicant tests is greater than the 75th percentile in Tables 3-2 through 3-4 variability can likely be reduced even if the individual EC25 and LC50 values fall within the control limits (Section 5311)
bull Permittees should examine toxicity test data to ensure that data being submitted to regulatory authorities meet specified effluent holding times temperature laboratory control limits and test acceptability criteria such as requirements for test sensitivity lower and upper PMSD bounds (Sections 52 through 54)
bull Permittees should anticipate and plan for a change if switching to a different testing laboratory The permittee should compare reference toxicant test data from the current laboratory with data from the candidate replacement laboratory in order to ensure acceptable variability and a similar average effect (Section 614)
June 30 2000 7-3
Understanding and Accounting for Method Variability in WET Applications Under the NPDES Program
73 Guidance to Regulatory Authorities
Guidance to Regulatory Authorities Related to Determining Reasonable Potential and Deriving Permit Limits
bull Regulatory authorities should use EPArsquos recommended statistical approach in deriving permit limitations The statistical approach outlined in the TSD represents an effective and appropriately protective approach to effluent limit development (Section 61 and Appendix G1)
bull Regulatory authorities should calculate the facility-specific CV using point estimate techniques to determine the need for and derive a permit limit even if the self-monitoring test results will be determined using hypothesis test procedures (Sections 341 and 62)
bull Regulatory authorities that need to cite a characteristic CV for a promulgated method may use Tables A-1 and A-2 in Appendix A which show the median CV from Tables 3-2 through 3-4 pending completion of between-laboratory studies
bull EPA recommends that regulatory authorities implement a step-wise approach to address toxicity This approach can determine the magnitude and frequency of toxicity and appropriate follow-up actions for test results that indicate exceedance of a monitoring trigger or a permit limit (Section 65)
Guidance to Regulatory Authorities Related to Collecting Effluent Samples Conducting the Toxicity Test and Evaluating the Effect Concentrations
bull Regulatory authorities should design a sampling program that collects representative effluent samples to fully characterize effluent variability for a specific facility over time At least 10 samples are needed to estimate a variance or CV with acceptable precision for a specific facility (Sections 613 and 62)
bull Regulatory authorities should ensure that statistical procedures and test methods have been properly applied to produce WET test results Evaluating other factors and data such as biological and statistical quality assurance and ensuring that test conditions and test acceptability criteria (TAC) have been met would be prudent (Sections 52 through 55)
bull Regulatory authorities should apply both the upper and lower bounds using the PMSD as an additional TAC (Section 64 and Table 3-6) The State of North Carolina implemented an effective WET program that required additional TAC and guidance for test methods that served to minimize test method variability (Appendix F)
bull Regulatory authorities should develop a QC checklist to assist in evaluating and interpreting toxicity test results (Section 5311) See Appendix E for examples of State WET implementation procedures
bull Regulatory authorities should consider participation in the National Environment Laboratory Accreditation Program and should conduct routine performance audit inspections to evaluate individual laboratory performance Inspections should evaluate the laboratoryrsquos performance with QC control charts based on reference toxicants examine procedures for conducting the toxicity test procedures and examine procedures for analyzing test results (Section 5311)
bull Regulatory authorities should incorporate revised technical guidance recently published by EPA captioned ldquoMethod Guidance and Recommendations for Whole Effluent Toxicity (WET) Testingrdquo
June 30 2000 7-4
Understanding and Accounting for Method Variability in WET Applications Under the NPDES Program
(40 CFR Part 136) (USEPA 2000a) The guidance addresses (1) error rate assumption adjustments (2) concentration-response relationships (3) incorporation of confidence intervals (4) acceptable dilution waters for testing (5) guidance on blocking by parentage for the chronic C dubia test method and (6) procedures for controlling pH drift
74 Future Directions
bull An independent peer-reviewed workshop should be convened to evaluate alternatives to the statistical approaches currently used in EPArsquos WET test methods Such a workshop might suggest alternatives regarding (1) WET statistical flowcharts (2) WET statistical methods used to estimate effect concentrations and (3) test data interpretation and review guidelines (Section 55)
bull Such a workshop might also evaluate additional QC requirements and recommendations regarding the specification of a reference toxicant and the concentrations to be tested for each test method (Section 531)
June 30 2000 7-5
Understanding and Accounting for Method Variability in WET Applications Under the NPDES Program
This page intentionally left blank
June 30 2000 7-6
80 BIBLIOGRAPHY
Anderson BS JW Hunt SL Turpen AR Coulon M Martin DL Denton and FH Palmer 1990 Procedures Manual for Conducting Toxicity Tests Developed by the Marine Bioassay Project California State Water Resources Control Board No 90-10WQ
Anderson SL and TJ Norberg-King 1991 Precision of short-term chronic toxicity tests in the real world Environ Toxicol Chem 10(2)143ndash145
APHA-AWWA-WEF 1998 Standard Methods for the Examination of Water and Wastewater (20th Edition) LS Clesceri AE Greenberg and A Eaton eds American Public Health Association American Water Works Association and Water Environment Federation Washington DC ISBN 0-87553-235shy7WB
American Society for Testing and Materials (ASTM) 1992 Standard Practice for Conducting an Interlaboratory Study To Determine the Precision of a Test Method E691-92
ASTM 1998 Standard Practice for Determination of Precision and Bias of Applicable Test Methods of Committee D-19 on Water D2777
Ausley LW 1996 Effluent toxicity testing variability In Whole Effluent Toxicity Testing An Evaluation of Methods and Prediction of Receiving System Impacts DR Grothe KL Dickson and DK Reed-Judkins eds Pensacola FL SETAC Press 157ndash171
Bailer AJ MR Hughes DL Denton and JT Oris 2000 An empirical comparison of effective concentration estimators for evaluating aquatic toxicity test responses Environ Toxicol Chem 19(1) 141-150
Biomonitoring Science Advisory Board (BSAB) 1994 West Coast Marine Species Chronic Protocol Variability Study Washington Department of Ecology Olympia WA
Burton GA A Raymon LA Ausley JA Black GM DeGraeve FA Fulk JF Heltshe WH Peltier JJ Pletl and JH Rodgers 1996 Session 4 Effluent toxicity test variability In Whole Effluent Toxicity Testing An Evaluation of Methods and Prediction of Receiving System Impacts DR Grothe KL Dickson and DK Reed-Judkins eds Pensacola FL SETAC Press 131ndash156
Chapman GA 1992 Sea Urchin (Strongylocentrotus purpuratus) Fertilization Test Method USEPA ERL-Narragansett Pacific Ecosystems Branch Newport OR
Chapman GA BS Anderson AJ Bailer RB Baird R Berger DT Burton DL Denton WL Goodfellow MA Heber LL McDonald TJ Norberg-King and PL Ruffier 1996a Discussion synopsis methods and appropriate endpoints In Whole Effluent Toxicity Testing An Evaluation of Methods and Prediction of Receiving System Impacts DR Grothe KL Dickson and DK Reed-Judkins eds Pensacola FL SETAC Press 51-82
Chapman PF M Crane J Wiles F Noppert and E McIndoe 1996b Improving the quality of statistics in regulatory ecotoxicity tests Ecotoxicol 5169-186
Chapman PM RS Caldwell and PF Chapman 1996c A warning NOECs are inappropriate for regulatory use Environ Toxicol Chem 1577ndash79
June 30 2000 8-1
Understanding and Accounting for Method Variability in WET Applications Under the NPDES Program
Collett D 1991 Modelling Binary Data London Chapman amp Hall
Commonwealth of Virginia 1993 Toxics Management Program Implementation Guidance
Davis RB AJ Bailer and JT Oris 1998 Effects of organism allocation on toxicity test results Environ Toxicol Chem 17(5) 928-931
DeGraeve GM JD Cooney BH Marsh TL Pollock NG Reichenbach JH Dean and MD Marcus 1991 Variability in the performance of the seven-day fathead minnow (Pimephales promelas) larval survival and growth test A within- and among-laboratory study Environ Toxicol Chem 10(9)1189ndash1203
DeGraeve GM JD Cooney BH Marsh TL Pollock and NG Reichenbach 1992 Variability in the performance of the 7-d Ceriodaphnia dubia survival and reproduction test A within- and among-laboratory study Environ Toxicol Chem 11(6)851ndash866
DeGraeve GM G Smith W Clement D McIntyre and T Forgette 1998 WET Testing Program Evaluation of Practices and Implementation Water Environment Research Foundation Project 94shyHHE-1 Alexandria VA
Denton DL and TJ Norberg-King 1996 Whole effluent toxicity statistics A regulatory perspective In Whole Effluent Toxicity Testing An Evaluation of Methods and Prediction of Receiving System Impacts DR Grothe KL Dickson and DK Reed-Judkins eds Pensacola FL SETAC Press 83ndash102
Denton DL and M Narvaez 1996 Regions 9 and 10 Guidance for Implementing Whole Effluent Toxicity Testing Programs U S Environmental Protection Agency Regions 9 and 10 May
Denton DL AL Suer BS Anderson and JW Hunt 1992 Precision of marine critical life stage tests with west coast species (abstract) In Society of Environmental Toxicology and Chemistry (SETAC) Abstracts 13th Annual Meeting November 8-12 1992 Cincinnati OH Pensacola FL SETAC Press 184
Dhaliwal BS RJ Dolan CW Batts JM Kelly RW Smith and S Johnson 1997 Warning replacing NOECs with point estimates may not solve regulatory contradictions Environ Toxicol Chem 16124ndash126
Dinnel PJ J Link and Q Stober 1987 Improved methodology for sea urchin sperm cell bioassay for marine waters Arch Environ Contam Toxicol 1623ndash32
Dunnett CW 1964 New tables for multiple comparisons with a control Biometrics 20482-491
Eagleson KW SW Tedder and LW Ausley 1986 Strategy for whole effluent toxicity evaluations in North Carolina In Aquatic Toxicology and Environmental Fate Ninth Volume ASTM STP 921 TM Poston R Purdy eds American Society for Testing and Materials Philadelphia PA 154-160
Environment Canada 1990 Guidance Document on Control of Toxicity Test Precision Using Reference Toxicants Ottawa Ontario Environmental Protection Conservation and Protection Report EPSIRM12
June 30 2000 8-2
Understanding and Accounting for Method Variability in WET Applications Under the NPDES Program
Environment Canada 2000 Guidance Document on Application and Interpretation of Single-species Tests in Environmental Toxicology Ottawa Ontario Environmental Technology Centre Method Development and Application Section Report EPS 1RM34
Erickson RJ LT Brooke MD Kahl F Vende SL Venter T Harting P Markee and RL Spehar 1998 Effects of laboratory test conditions on the toxicity of silver to aquatic organisms Environ Toxicol Chem 17(4) 572-578
Fulk FA 1996 Whole effluent toxicity testing variability A statistical perspective In Whole Effluent Toxicity Testing An Evaluation of Methods and Prediction of Receiving System Impacts DR Grothe KL Dickson and DK Reed-Judkins eds Pensacola FL SETAC Press 172ndash179
Grothe DR and RA Kimerle 1985 Inter- and intralaboratory variability in Daphnia magna effluent toxicity test results Environ Toxicol Chem 4(2)189ndash192
Grothe DR RA Kimerle and CD Malloch 1990 A perspective on biological assessments Water Environ Technol pp 1707ndash1710
Grothe DR KL Dickson and DK Reed-Judkins eds 1996 Whole Effluent Toxicity Testing An Evaluation of Methods and Prediction of Receiving System Impacts Pensacola FL SETAC Press
Hunt JW BS Anderson S Tudor MD Stephenson HM Puckett FH Palmer and MW Reeve 1996 Marine Bioassay Project Eighth Report Sacramento CA State Water Resources Control Board Report 85-102
Kahn HD and MB Rubin 1989 Use of statistical methods in industrial water pollution control regulations in the United States Environ Monitor Assess 12129ndash148
Moore TF SP Canton and M Grimes 2000 Investigation of the incidence of type I errors for chronic whole effluent toxicity testing using Ceriodaphnia dubia Environ Toxicol Chem 19(1)118-122
Morrison GE E Torelo R Comeleo R Walsh A Kuhn R Burgess M Tagliabue and W Green 1989 Interlaboratory precision of saltwater short-term chronic toxicity tests Res J Wat Pollut Control Fed 611707-1710
New Jersey Department of Environmental Protection 1994 The Use of Chronic Whole Effluent Toxicity Testing in the New Jersey Pollutant Discharge Elimination SystemmdashAn Assessment of Compliance Data
North Carolina Department of Environment and Natural Resources 1998 North Carolina Biological Laboratory CertificationCriteria Procedures Document Division of Water Quality Water Quality Section Raleigh NC
Oris JT and AJ Bailer 1993 Statistical analysis of the Ceriodaphnia toxicity test Sample size determination for reproductive effects Environ Toxicol Chem 12(1)85ndash90
Rosebrock MM NW Bedwell and LW Ausley 1994 Indicators of Ceriodaphnia dubia chronic toxicity test performance and sensitivity Poster presentation Society of Environmental Toxicology and Chemistry 15th Annual Meeting Denver CO
June 30 2000 8-3
Understanding and Accounting for Method Variability in WET Applications Under the NPDES Program
Rue WJ JA Fava and DR Grothe 1988 A review of inter- and intralaboratory effluent toxicity test method variability In Aquatic Toxicology and Hazard Assessment (10th Volume) WJ Adams GA Chapman and WG Landis eds ASTM STP 971
SAS Institute 1990 SASSTA Userrsquos Guide (4th Edition) Version 6 Cary NC
Sheppard CR 1999 How large should my sample be Some quick guides to sample size and the power of tests Mar Pollut Bull 38(6)439-477
Shukla R Q Wang FA Fulk C Deng and DL Denton 2000 Bioequivalence approach for whole effluent toxicity testing Environ Toxicol Chem 19(1)169-174
Southern California Toxicity Assessment Group (SCTAG) 1996 Reference Toxicant Standardization and Use in Toxicity Testing JR Gully RB Baird PJ Markle and JP Bottomley eds First Report Fountain Valley CA
SCTAG 1997 Laboratory Practices Checklist Toxicity Testing (3rd Edition) Fountain Valley CA
Starrett GL DL Denton and RW Smith 1993 Sensitivity of toxicity test protocols and the need for additional quality assurance requirements (abstract) In Society of Environmental Toxicology and Chemistry (SETAC) Abstracts 14th Annual Meeting November 14-18 1993 Houston TX Pensacola FL SETAC Press P106 p 183
Thursby GB J Heltshe and KJ Scott 1997 Revised approach to toxicity test acceptability criteria using a statistical performance assessment Environ Toxicol Chem 161322-1329
TOXISreg [computer software] Ojai CA EcoAnalysis Inc
TOXCALCreg [computer software] McKinleyville CA TidePool Scientific Software
USEPA 1985 Methods for Measuring the Acute Toxicity of Effluents to Freshwater and Marine Organisms (3rd Edition) W Peltier and CI Weber eds Environmental Monitoring Systems Laboratory Cincinnati OH EPA6004-85013
USEPA 1988 Short-term Methods for Estimating the Chronic Toxicity of Effects of Receiving Water to MarineEstuarine Organisms (1st Edition) CI Weber WB Horning DJ Klemm TW Neiheisel PA Lewis EL Robinson JR Menkedick FA Kessler eds Office of Research and Development Cincinnati OH EPA6004-87028
USEPA 1989 Short-term Methods for Estimating the Chronic Toxicity of Effluents and Receiving Waters to Freshwater Organisms (2nd Edition) CI Weber WH Peltier TJ Norberg-King WB Homing II FA Kessler JR Menkedick TW Neiheisel PA Lewis DJ Klemm QH Pickering EL Robinson JM Lazorchak LJ Wymer RW Freyberg eds Office of Research and Development Cincinnati OH EPA6004-89001
USEPA 1989a Generalized Methodology for Conducting Industrial Toxicity Reduction Evaluations (TREs) Office of Research and Development Cincinnati OH EPA600-2-88-070
USEPA 1989b Toxicity Reduction Evaluation Protocol for Municipal Wastewater Treatment Plants Office of Research and Development Washington DC EPA6002-88-062
June 30 2000 8-4
Understanding and Accounting for Method Variability in WET Applications Under the NPDES Program
USEPA 1989c Methods for Aquatic Toxicity Identification Evaluations Phase II Toxicity Identification Procedures Office of Research and Development Washington DC EPA6003-88-035
USEPA 1989d Methods for Aquatic Toxicity Identification Evaluations Phase III Toxicity Confirmation Procedures Office of Research and Development Washington DC EPA6003-88-036
USEPA1991a Technical Support Document for Water Quality-based Toxics Control Office of Water Washington DC EPA5052-90-001
USEPA 1991b Methods for Aquatic Toxicity Identification Evaluations Phase I Toxicity Characterization Procedures (2nd Edition) TJ Norberg-King DI Mount EJ Durhan GT Ankley LP Burkhard JR Amato MT Lukasewycz MK Schubauer-Berigan and L Anderson-Carnahan eds Office of Research and Development Washington DC EPA6006-91-003
USEPA 1992 Toxicity Identification Evaluation Characterization of Chronically Toxic Effluents Phase I TJ Norberg-King DI Mount JR Amato DA Jensen and JA Thompson eds Office of Research and Development Washington DC EPA6006-91-005F
USEPA 1993 Methods for Measuring the Acute Toxicity of Effluents and Receiving Waters to Freshwater and Marine Organisms (4th Edition) CI Weber ed Office of Research and Development Cincinnati OH EPA6004-90027F
USEPA 1993a Methods for Aquatic Toxicity Identification Evaluations Phase II Toxicity Identification Procedures for Samples Exhibiting Acute and Chronic Toxicity Office of Research and Development Washington DC EPA600R-92-080
USEPA 1993b Methods for Aquatic Toxicity Identification Evaluations Phase III Toxicity Identification Procedures for Acutely and Chronically Toxic Samples US Environmental Protection Agency Duluth MN EPA600R-92-081
USEPA 1994a Short-term Methods for Estimating the Chronic Toxicity of Effluents and Receiving Waters to Marine and Estuarine Organisms (2nd Edition) DJ Klemm GE Morrison TJ Norberg-King WH Peltier and MA Heber eds Office of Research and Development Cincinnati OH EPA6004shy91003
USEPA 1994b Short-term Methods for Estimating the Chronic Toxicity of Effluents and Receiving Waters to Freshwater Organisms (3rd Edition) PA Lewis DJ Klemm JM Lazorchak TJ Norberg-King WH Peltier and MA Heber eds Office of Research and Development Cincinnati OH EPA6004shy91002
USEPA 1994c Short-term Methods for Estimating the Sediment Toxicity of Effluents and Receiving Waters to Freshwater and Estuarine Organisms Office of Research and Development Duluth MN EPA600R-94-001
USEPA 1995 Short-term Methods for Estimating the Chronic Toxicity of Effluents and Receiving Waters to West Coast Marine and Estuarine Organisms GA Chapman DL Denton and JM Lazorchak eds Office of Research and Development Cincinnati OH EPA600R-95-136
USEPA 1996a NPDES Permit Writerrsquos Manual Office of Water Washington DC EPA833B-96-003
USEPA 1996b Guide to Method Flexibility and Approval of EPA Water Methods EPA821D-96-004
June 30 2000 8-5
Understanding and Accounting for Method Variability in WET Applications Under the NPDES Program
USEPA 1999a National Environmental Laboratory Accreditation Conference Constitution Bylaws and Standards Office of Research and Development Washington DC EPA600R-99-068
USEPA 1999b Toxicity Reduction Evaluation Guidance for Municipal Wastewater Treatment Plants (2nd
Edition) Office of Water Washington DC EPA833B-99-002
USEPA 1999c Errata for Effluent and Receiving Water Toxicity Test Manuals Acute Toxicity manuals Acute Toxicity of Effluents and Receiving Waters to Freshwater and Marine Organisms Short-Term methods for Estimating the Chronic Toxicity of Effluents and Receiving Waters to Freshwater Organisms and Short-Term Methods for Estimating the Chronic Toxicity of Effluents and Receiving Waters to Marine and Estuaraine Organisms Office of Research and Development Duluth MN
USEPA 2000a Method Guidance and Recommendations for Whole Effluent Toxicity (WET) Testing (40 CFR Part 136) Office of Water Office of Science and Technology Washington DC EPA821B-00shy004
USEPA 2000b Methods for Measuring the Toxicity and Bioaccumulation of Sediment-Associated Contaminants with Freshwater Invertebrates (2nd Edition) Office of Research and Development Duluth MN EPA600R-99064
Wang Q DL Denton and R Shukla 2000 Applications and statistical properties of minimum significant difference-based criterion testing in a toxicity testing program Environ Toxicol Chem 19(1)113-117
Warren-Hicks W BR Parkhurst D Moore and S Teed 1999 Whole Effluent Toxicity Testing Methods Accounting for Variance Water Environment Research Foundation Project 95-PQL-1 ISBN 1shy893664-01-5
Washington State Department of Ecology 1997 Laboratory Guidance and Whole Effluent Toxicity Test Review Criteria Publication No WQ-R-95-80
Washington State Department of Ecology 1998 Whole Effluent Toxicity (WET) Program Evaluation Publication No 98-03
Whitehouse P M Crane CJ Redshaw and C Turner 1996 Aquatic toxicity tests for the control of effluent discharges in the UK The influence of test precision Ecotoxicol 5155-168
June 30 2000 8-6