Underrepresented Undergraduates' Persistence in STEM - STEPUP
34
1 DRAFT: DO NOT CITE WITHOUT AUTHORS’ PERMISSION Underrepresented Undergraduates’ Persistence in STEM Fields Gregory S. Kienzl 1 Casey E. George-Jackson William T. Trent Educational Policy Studies University of Illinois at Urbana-Champaign 1 Corresponding author: [email protected] We would like to thank the Sloan Foundation for their generous support of this project and the Mellon Foundation for allowing us access to their data. All errors or omissions are our responsibility.
Transcript of Underrepresented Undergraduates' Persistence in STEM - STEPUP
1
DRAFT: DO NOT CITE WITHOUT AUTHORS’ PERMISSION
Underrepresented Undergraduates’ Persistence in STEM Fields
Gregory S. Kienzl1
Casey E. George-Jackson William T. Trent
Educational Policy Studies University of Illinois at Urbana-Champaign
1 Corresponding author: [email protected] We would like to thank the Sloan Foundation for their generous support of this project and the Mellon Foundation for allowing us access to their data. All errors or omissions are our responsibility.

2
Abstract
This study uses longitudinal data from three, large public research universities in the Midwest to
better understand the educational outcomes of women and minority students as they move through
the STEM pipeline. Descriptive statistics and conditional probabilities analysis offer insight into
differential rates of persistence and degree attainment in the STEM fields.
3
Introduction
Although the number of women and minorities (hereafter, “underrepresented”) students in
the science, technology, engineering and mathematics (STEM) pipeline has slowly increased over
the past three decades, disparities still exists between well-represented (defined in this study as
White and Asian men) and underrepresented populations in these fields (Oakes, 1990; Stake &
Mares, 2001). The factors that contribute to the challenges of access and completion, however,
continue to confound educators, researchers, college administrators, and policymakers. While some
have argued for interventions in the early and middle grades (Hewson, Kahle, Scantlebury &
Davies, 2001), public research universities represent a significant conduit in the STEM pipeline and
are worth further examination.
As shown by Camp (1997), Sax (2000), and Seymour (2002), women’s underrepresentation
in these fields at the undergraduate level also has long-term, negative reverberations in terms of
potential graduate program enrollments and professional and academic careers in STEM fields. The
same holds true for minority students. Underrepresentation of these groups is not only an ethical
concern but is also of particular concern to policy-makers and business leaders (U.S. Department of
Education, 2006). Thus, to better understand the preparation of a skilled, scientific workforce, it is
important to consider the patterns of those who move through the STEM education pipeline, as well
as the impact and responsibility of large, research-intensive, public universities in educating
undergraduates in these fields.
L iterature Review
Research on persistence of undergraduate students has determined that a number of factors
explain minority and female students’ success in the sciences. May and Chubin (2003) categorized
these factors as “pre-college preparation, recruitment programs, admissions policies, financial
4
assistance, academic intervention programs, and graduate school preparation and admission” (p.
27). A number of these factors, including support systems at the college-level, have been found to
be important for the general retention and persistence of minority students, not just those in STEM
fields (Carter, 2006). Continuing research on persistence of underrepresented students is necessary,
particularly in the STEM fields, because through the process of “uncovering differences in
persistence patterns across diverse groups, we can illuminate factors that inhibit equal opportunity
as well as policy factors that might be able to improve opportunity” (Carter, 2006, p. 34).
Persistence also remains perhaps one of the most important topics to be studied within the issue of
underrepresentation in STEM fields: “You can’t play if you don’t stay, and leaving science or
premed for education or history usually means leaving science or premed forever” (Elliott et al.,
1996, p. 700).
Below is a brief discussion of the factors that help to explain and predict persistence in
STEM fields, as well as college majors in general. This discussion is not intended to be exhaustive,
and other factors found in the literature can also be of equal importance in understanding
persistence, including students’ interest in and attitudes towards science (Hanson, 2004; Leppel,
2001; Levine & Wycokoff, 1991), perceived barriers to persistence (Brainard & Carlin, 1998),
institutional effects (Elliott et al., 1996; Smyth & McArdle, 2004; Sonnert, Fox and Adkins, 2007),
departmental effects (Etkowitz et al., 1994; Serex & Townsend, 1999), and intervention programs
(Brainard & Carlin, 1998; Carter, 2006; Clewell & Campbell, 2002; Elliott et al., 1996).
Background Characteristics and Factors
Several studies have examined participation in STEM fields by individual background
characteristics and factors. For instance, examining a cohort of students at 23 selective colleges and
universities found that “Asians, also after accounting for effects of different gender distributions,
were 2.6 times more likely than underrepresented minorities and 1.4 times more likely than Whites
5
to persist in SME [Science, Math, and Engineering]” (Smyth & McArdle, 2004, p. 371). However,
research using data from 175 institutions found that “race and gender had no bearing on
persistence” (Tan, 2002, p. 9). Having family members and teachers that support a student’s
interests in and pursuit of science in high school may give students the confidence and support to
persist in these fields during college, which was found to be true for African American students who
persisted in biology at a predominately white institution (Russell & Atwater, 2005). Gender
differences have been found to exist in the motivations to persist in STEM fields as “the kinds of
contributions and discoveries that scientists and engineers make” (Grandy, 1998, p. 602) tend to be
more important for men than women.
Academic Preparation and Performance
Similar to research on factors that lead to declaring a STEM major in college, academic
preparation and performance in college are equally important to consider in regards to persistence in
STEM fields. Academic preparation, as measured by standardized test scores and performance in
high school math and science courses, are predictors of performance in college-level math and
science courses, and for persistence in STEM fields (Elliott et al., 1996). In studying persistence in
STEM fields at four Ivy League universities, Elliott et al. (1996) determined that academic
preparation and performance as “preadmissions variables accounted for a significant fraction of the
variance of persistence decisions and ethnicity did not” (Elliott et al., 1996, p. 695). This finding is
important to discredit notions that certain populations of students are unable to remain in STEM
fields based on their attributes, and provides evidence that factors other than one’s race or gender
are the reasons for differential persistence in the STEM fields. In addition, standardized test scores
6
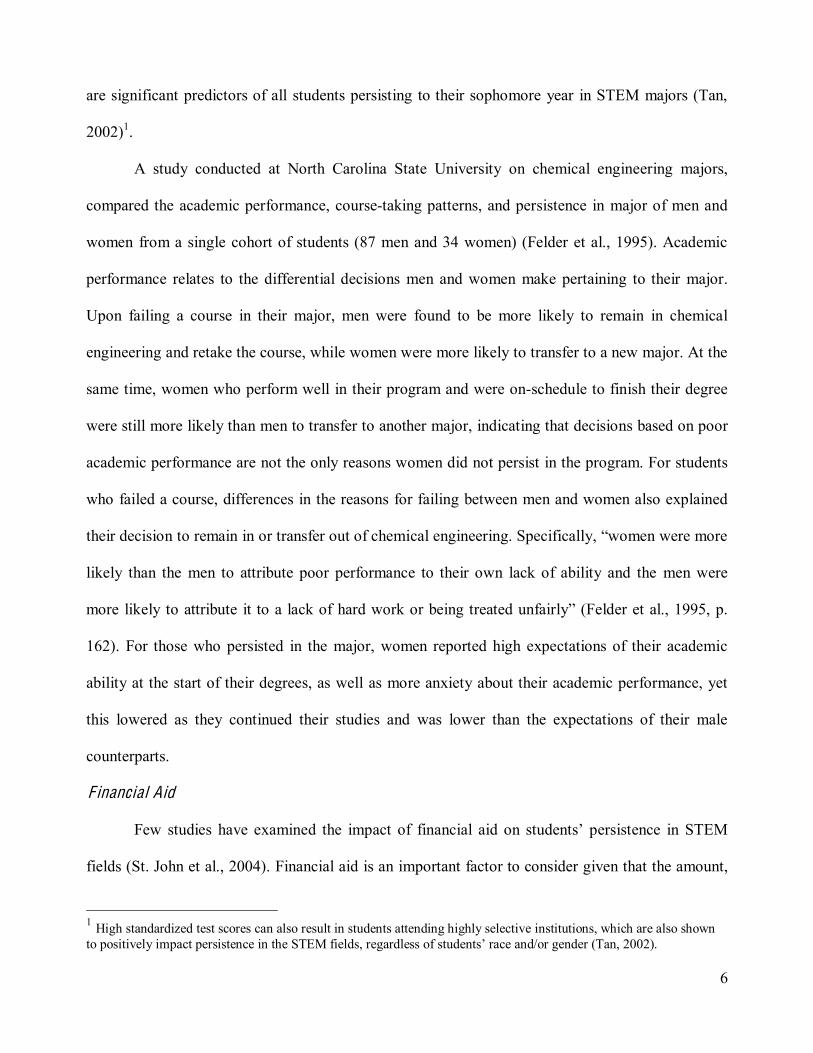
are significant predictors of all students persisting to their sophomore year in STEM majors (Tan,
2002)1.
A study conducted at North Carolina State University on chemical engineering majors,
compared the academic performance, course-taking patterns, and persistence in major of men and
women from a single cohort of students (87 men and 34 women) (Felder et al., 1995). Academic
performance relates to the differential decisions men and women make pertaining to their major.
Upon failing a course in their major, men were found to be more likely to remain in chemical
engineering and retake the course, while women were more likely to transfer to a new major. At the
same time, women who perform well in their program and were on-schedule to finish their degree
were still more likely than men to transfer to another major, indicating that decisions based on poor
academic performance are not the only reasons women did not persist in the program. For students
who failed a course, differences in the reasons for failing between men and women also explained
their decision to remain in or transfer out of chemical engineering. Specifically, “women were more
likely than the men to attribute poor performance to their own lack of ability and the men were
more likely to attribute it to a lack of hard work or being treated unfairly” (Felder et al., 1995, p.
162). For those who persisted in the major, women reported high expectations of their academic
ability at the start of their degrees, as well as more anxiety about their academic performance, yet
this lowered as they continued their studies and was lower than the expectations of their male
counterparts.
F inancial Aid
Few studies have examined the impact of financial aid on students’ persistence in STEM
fields (St. John et al., 2004). Financial aid is an important factor to consider given that the amount,
1 High standardized test scores can also result in students attending highly selective institutions, which are also shown to positively impact persistence in the STEM fields, regardless of students’ race and/or gender (Tan, 2002).
7
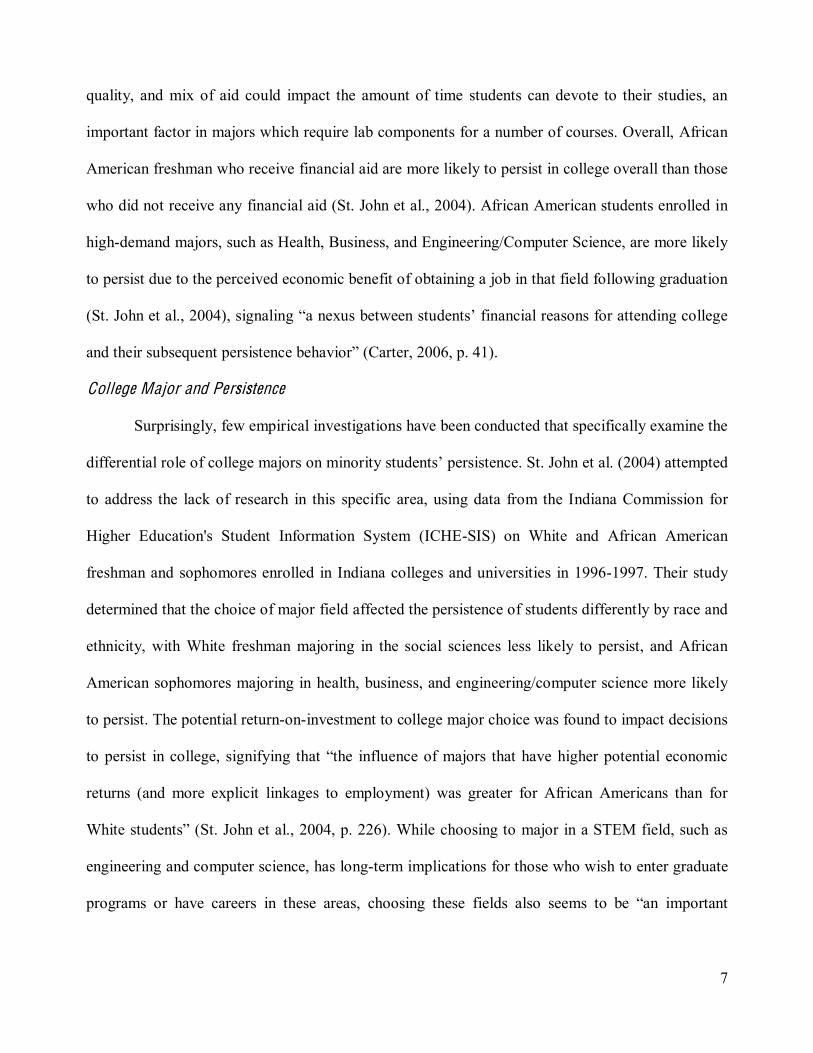
quality, and mix of aid could impact the amount of time students can devote to their studies, an
important factor in majors which require lab components for a number of courses. Overall, African
American freshman who receive financial aid are more likely to persist in college overall than those
who did not receive any financial aid (St. John et al., 2004). African American students enrolled in
high-demand majors, such as Health, Business, and Engineering/Computer Science, are more likely
to persist due to the perceived economic benefit of obtaining a job in that field following graduation
(St. John et al., 2004), signaling “a nexus between students’ financial reasons for attending college
and their subsequent persistence behavior” (Carter, 2006, p. 41).
College Major and Persistence
Surprisingly, few empirical investigations have been conducted that specifically examine the
differential role of college majors on minority students’ persistence. St. John et al. (2004) attempted
to address the lack of research in this specific area, using data from the Indiana Commission for
Higher Education's Student Information System (ICHE-SIS) on White and African American
freshman and sophomores enrolled in Indiana colleges and universities in 1996-1997. Their study
determined that the choice of major field affected the persistence of students differently by race and
ethnicity, with White freshman majoring in the social sciences less likely to persist, and African
American sophomores majoring in health, business, and engineering/computer science more likely
to persist. The potential return-on-investment to college major choice was found to impact decisions
to persist in college, signifying that “the influence of majors that have higher potential economic
returns (and more explicit linkages to employment) was greater for African Americans than for
White students” (St. John et al., 2004, p. 226). While choosing to major in a STEM field, such as
engineering and computer science, has long-term implications for those who wish to enter graduate
programs or have careers in these areas, choosing these fields also seems to be “an important
8
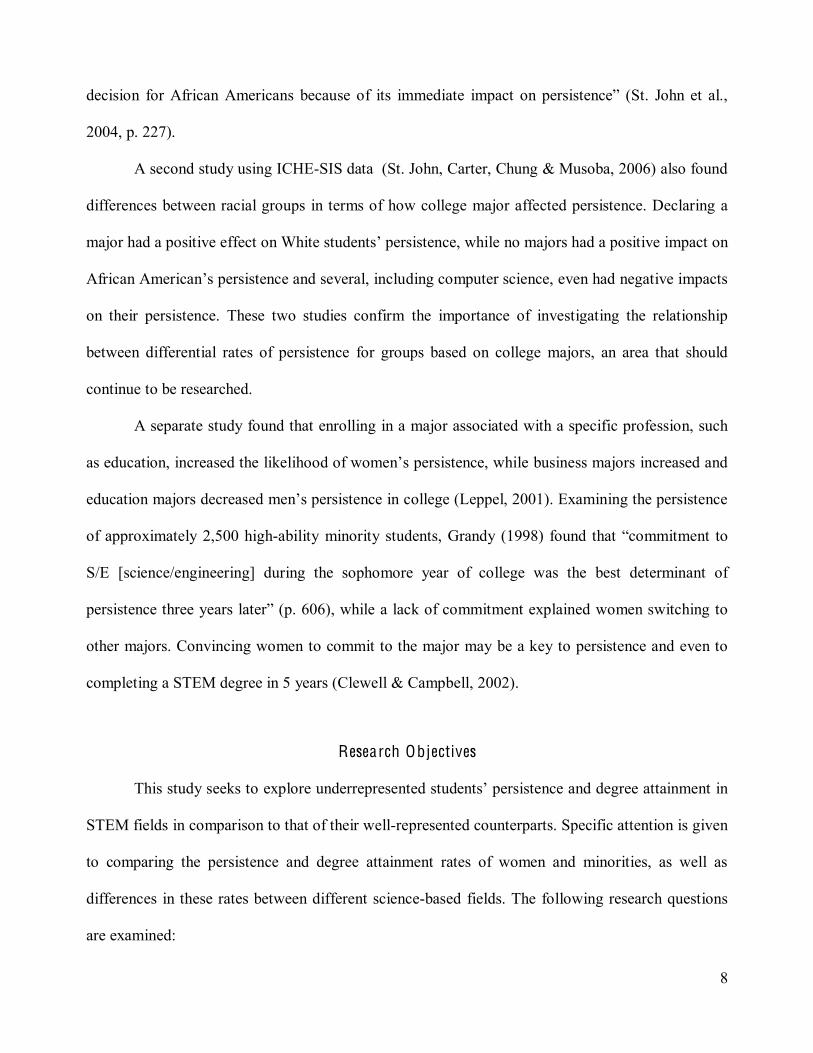
decision for African Americans because of its immediate impact on persistence” (St. John et al.,
2004, p. 227).
A second study using ICHE-SIS data (St. John, Carter, Chung & Musoba, 2006) also found
differences between racial groups in terms of how college major affected persistence. Declaring a
major had a positive effect on White students’ persistence, while no majors had a positive impact on
African American’s persistence and several, including computer science, even had negative impacts
on their persistence. These two studies confirm the importance of investigating the relationship
between differential rates of persistence for groups based on college majors, an area that should
continue to be researched.
A separate study found that enrolling in a major associated with a specific profession, such
as education, increased the likelihood of women’s persistence, while business majors increased and
education majors decreased men’s persistence in college (Leppel, 2001). Examining the persistence
of approximately 2,500 high-ability minority students, Grandy (1998) found that “commitment to
S/E [science/engineering] during the sophomore year of college was the best determinant of
persistence three years later” (p. 606), while a lack of commitment explained women switching to
other majors. Convincing women to commit to the major may be a key to persistence and even to
completing a STEM degree in 5 years (Clewell & Campbell, 2002).
Research Objectives
This study seeks to explore underrepresented students’ persistence and degree attainment in
STEM fields in comparison to that of their well-represented counterparts. Specific attention is given
to comparing the persistence and degree attainment rates of women and minorities, as well as
differences in these rates between different science-based fields. The following research questions
are examined:
9
1. Based on initial major of choice, what are the persistence and graduation rates of
underrepresented undergraduate students as compared to students form traditionally well-
represented groups?
2. What is the conditional probability that a student will complete their degree in a specific
length of time?
3. How might patterns of students’ persistence and graduation rates differ within STEM fields?
Data
This study uses information on a single cohort of first-time freshmen who matriculated to
three large, research-intensive universities in fall 1999. These universities are located in states that
are in geographic proximity to one another. The academic careers of this cohort are tracked for a
period of six years, allowing for persistence and educational outcomes across time to be examined.
Of particular interest in this study are students’ initial major, last major, and degree attainment
status. Information on students’ social backgrounds is also included in the dataset.
The data were originally compiled as part of a larger collection of several institutions' data
coordinated by the Andrew W. Mellon Foundation, collectively referred to as the Public University
Database. The cohort used in the analysis consists of over 16,377 first-time, full-time, domestic
freshman who began college in fall 1999.
M ethodology
The first research question is answered using a simplified version of event history analysis
(Allison, 1994; DesJardins, 2003; Scott & Kennedy, 2005; Singer & Willett, 2003) for discrete
time. The models preserve the time-to-event dimension of a typical event history analysis, but do
10
not include additional time-invariant and -varying controls besides gender and race/ethnicity.2 The
estimates for each STEM field are generated separately, i.e., the models condition on one of the four
initial major fields.
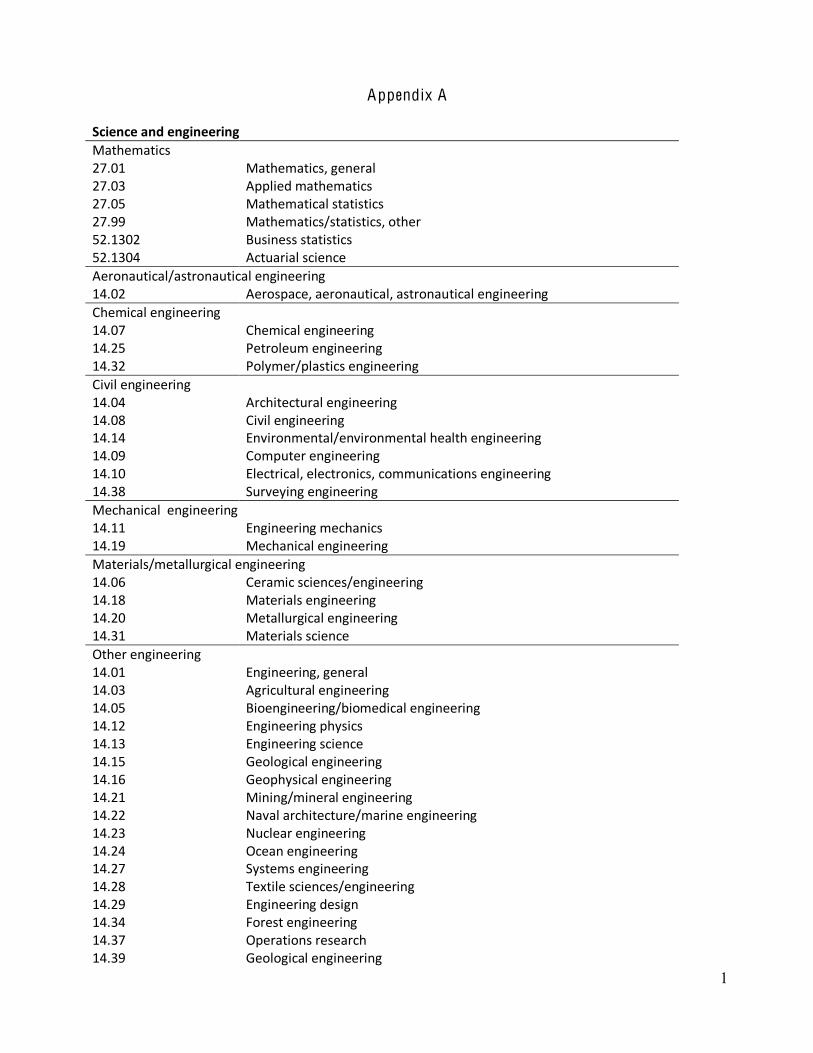
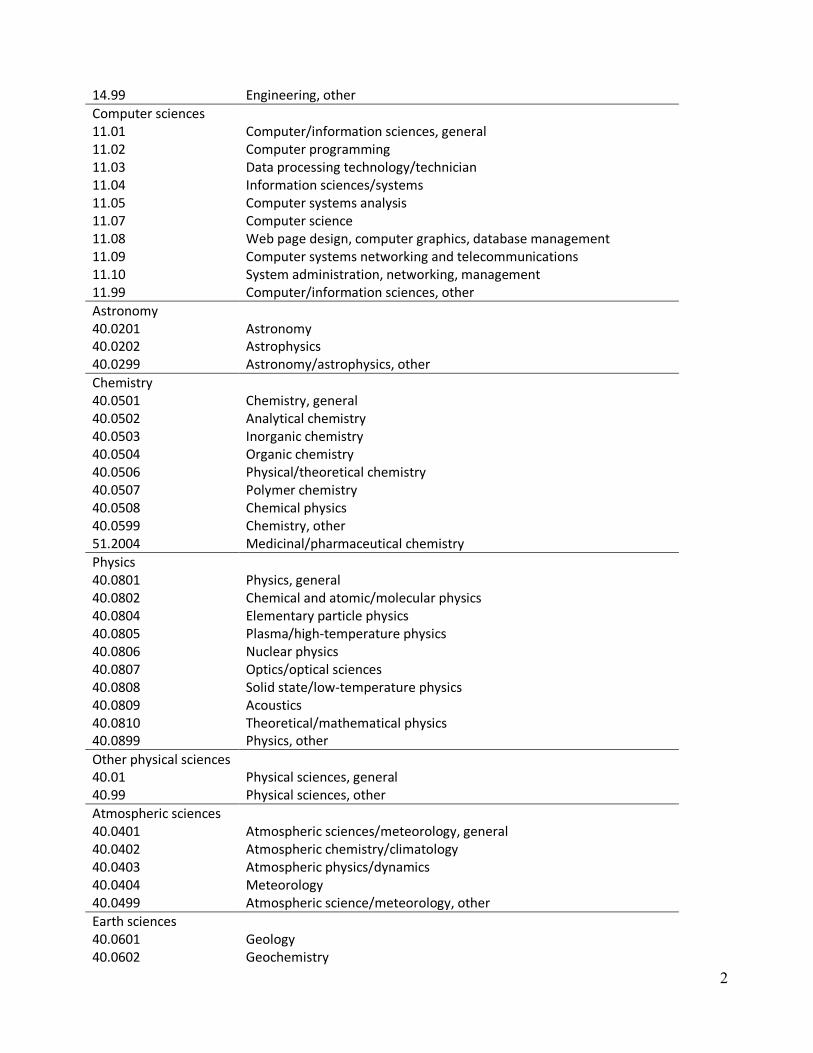
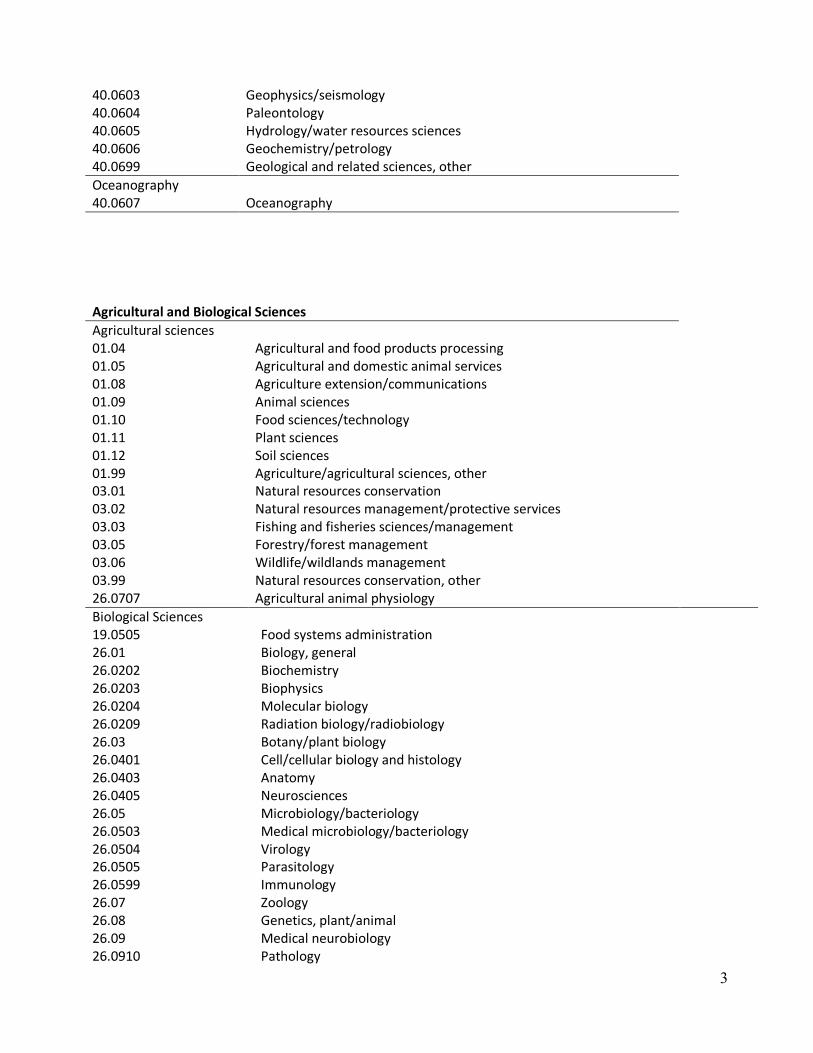
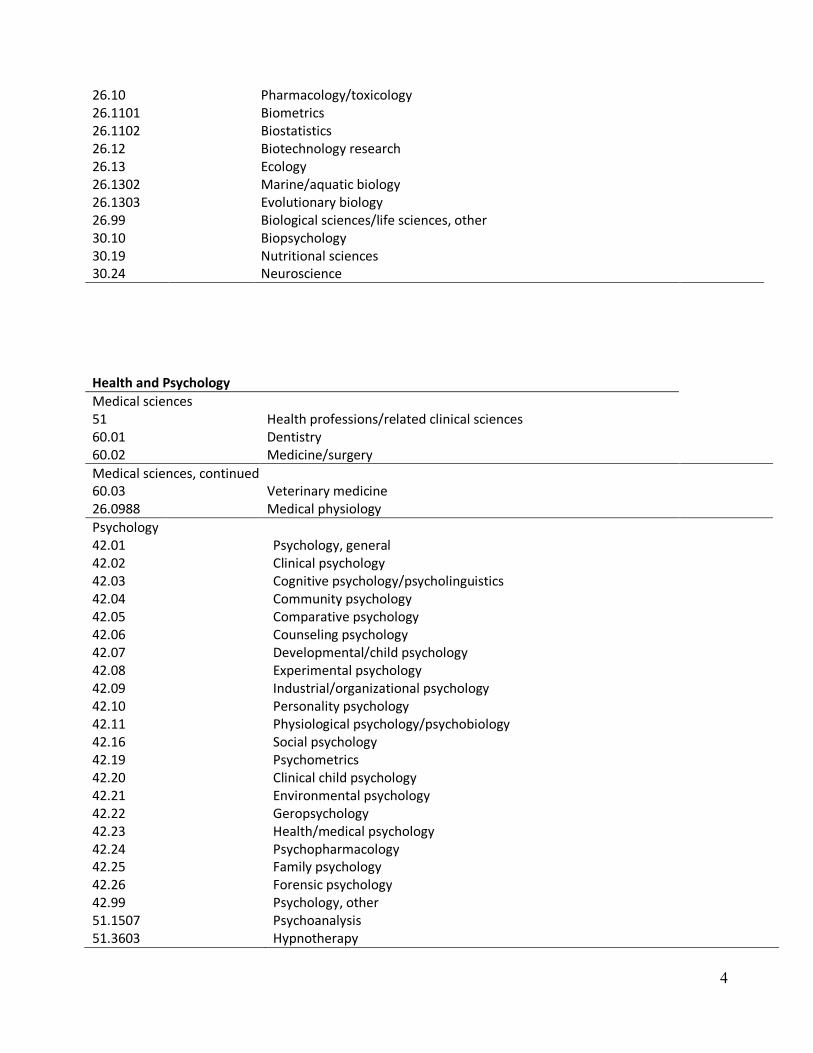
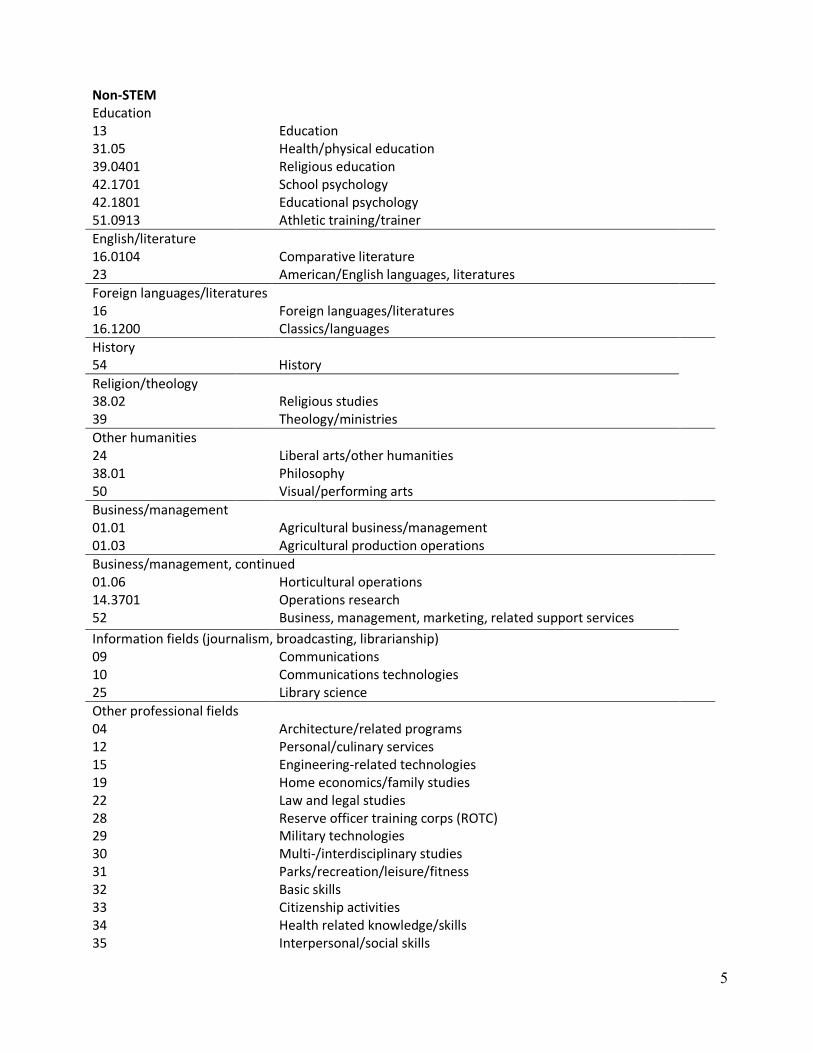
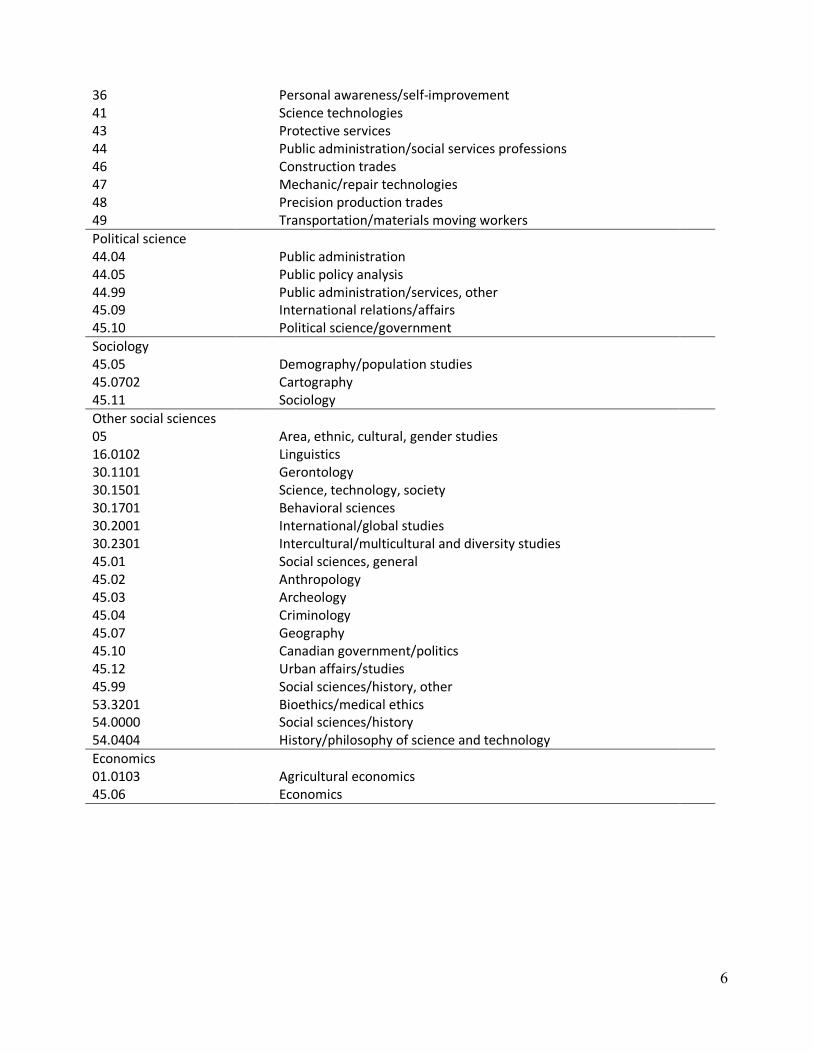
In order to compare various science-oriented fields, rather than simply focus on high-status
STEM majors (e.g., engineering, computer science), a four-category taxonomy was used to
differentiate between different categories of majors using the Classification of Instructional
Programs (CIP) codes (see Appendix A). These categories are largely based on those used by the
National Science Foundation (2008) in Science and Engineering Indicators, with some
modifications. Majors were categorized as Science and Engineering, Agricultural and Biological
Sciences, Health and Psychology, and Non-STEM fields and the models rerun to determine if who
opts into each fields differs between these categories.
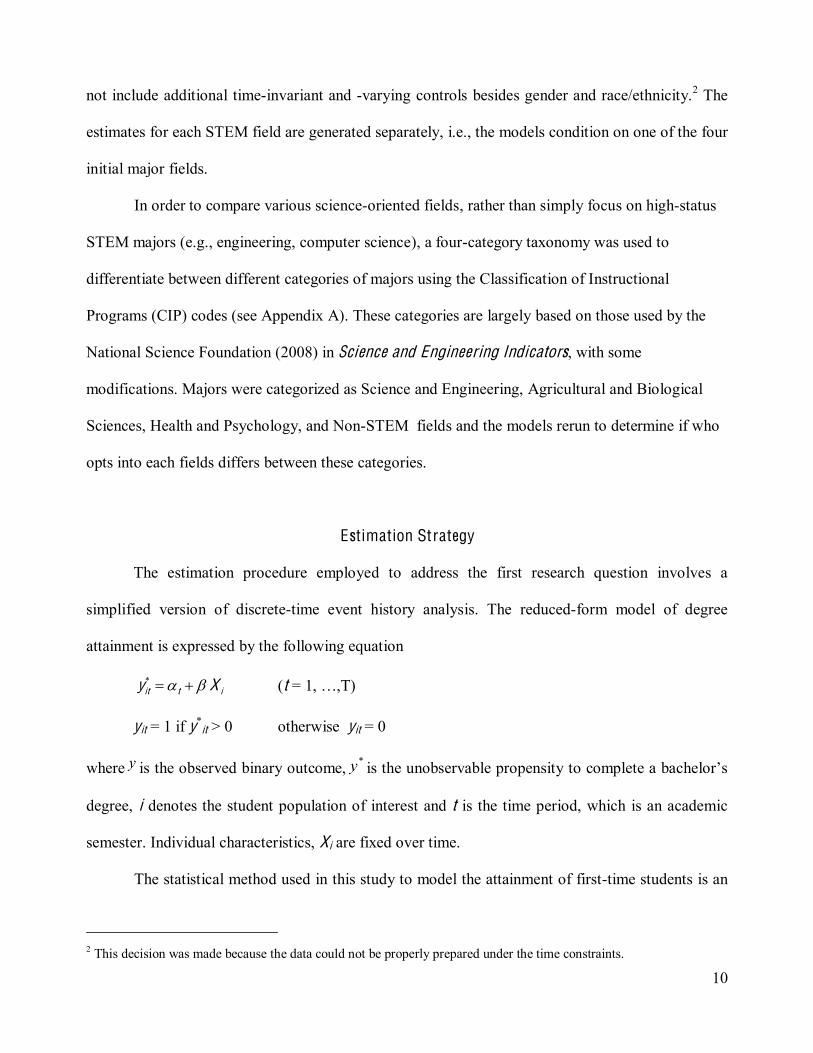
Estimation Strategy
The estimation procedure employed to address the first research question involves a
simplified version of discrete-time event history analysis. The reduced-form model of degree
attainment is expressed by the following equation
*it t iy X (t = 1, …,T)
yit = 1 if y*it > 0 otherwise yit = 0
where is the observed binary outcome, is the unobservable propensity to complete a bachelor’s
degree, i denotes the student population of interest and t is the time period, which is an academic
semester. Individual characteristics, Xi are fixed over time.
The statistical method used in this study to model the attainment of first-time students is an
2 This decision was made because the data could not be properly prepared under the time constraints.
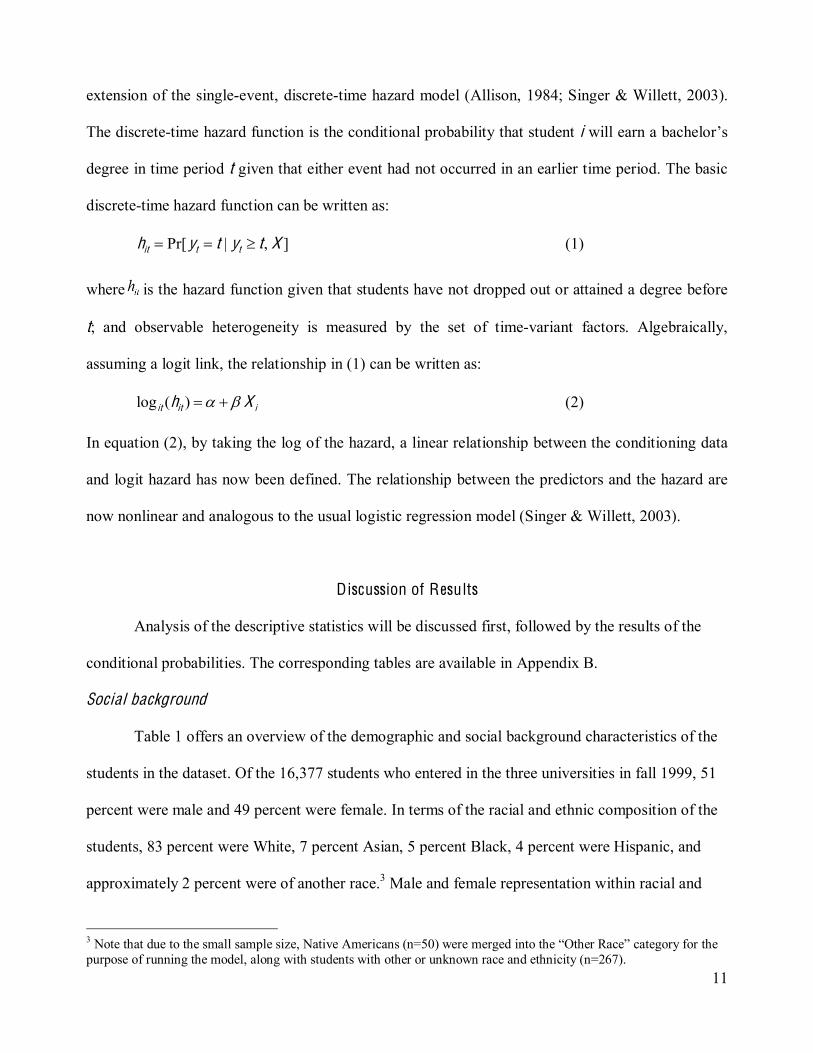
11
extension of the single-event, discrete-time hazard model (Allison, 1984; Singer & Willett, 2003).
The discrete-time hazard function is the conditional probability that student i will earn a bachelor’s
degree in time period t given that either event had not occurred in an earlier time period. The basic
discrete-time hazard function can be written as:
Pr[ | , ]it t th y t y t X (1)
where is the hazard function given that students have not dropped out or attained a degree before
t; and observable heterogeneity is measured by the set of time-variant factors. Algebraically,
assuming a logit link, the relationship in (1) can be written as:
log ( )it it ih X (2)
In equation (2), by taking the log of the hazard, a linear relationship between the conditioning data
and logit hazard has now been defined. The relationship between the predictors and the hazard are
now nonlinear and analogous to the usual logistic regression model (Singer & Willett, 2003).
Discussion of Results
Analysis of the descriptive statistics will be discussed first, followed by the results of the
conditional probabilities. The corresponding tables are available in Appendix B.
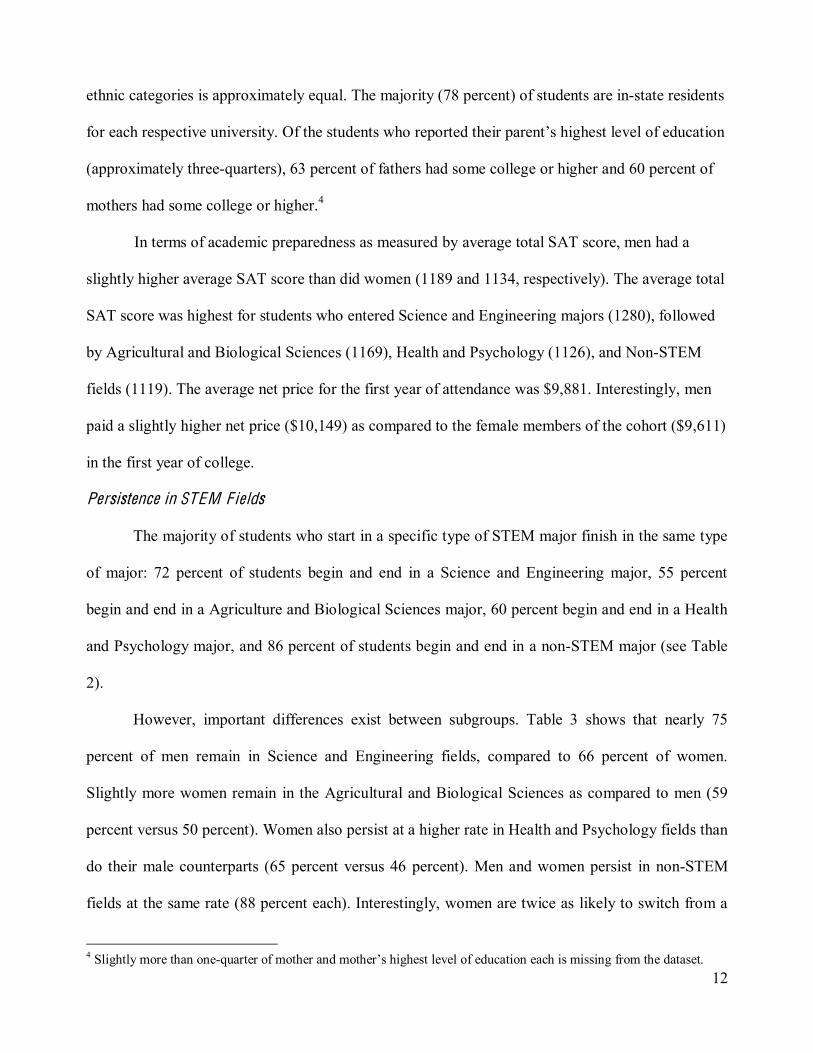
Social background
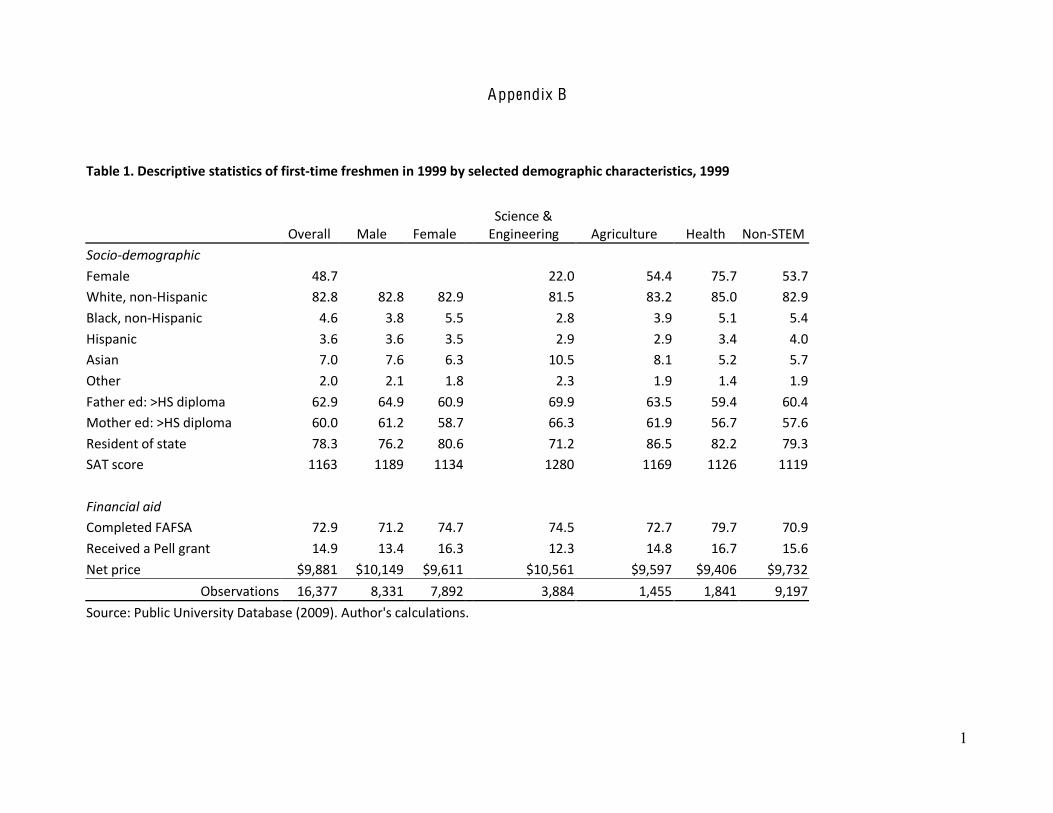
Table 1 offers an overview of the demographic and social background characteristics of the
students in the dataset. Of the 16,377 students who entered in the three universities in fall 1999, 51
percent were male and 49 percent were female. In terms of the racial and ethnic composition of the
students, 83 percent were White, 7 percent Asian, 5 percent Black, 4 percent were Hispanic, and
approximately 2 percent were of another race.3 Male and female representation within racial and
3 Note that due to the small sample size, Native Americans (n=50) were merged into the “Other Race” category for the purpose of running the model, along with students with other or unknown race and ethnicity (n=267).
12
ethnic categories is approximately equal. The majority (78 percent) of students are in-state residents
for each respective university. Of the students who reported their parent’s highest level of education
(approximately three-quarters), 63 percent of fathers had some college or higher and 60 percent of
mothers had some college or higher.4
In terms of academic preparedness as measured by average total SAT score, men had a
slightly higher average SAT score than did women (1189 and 1134, respectively). The average total
SAT score was highest for students who entered Science and Engineering majors (1280), followed
by Agricultural and Biological Sciences (1169), Health and Psychology (1126), and Non-STEM
fields (1119). The average net price for the first year of attendance was $9,881. Interestingly, men
paid a slightly higher net price ($10,149) as compared to the female members of the cohort ($9,611)
in the first year of college.
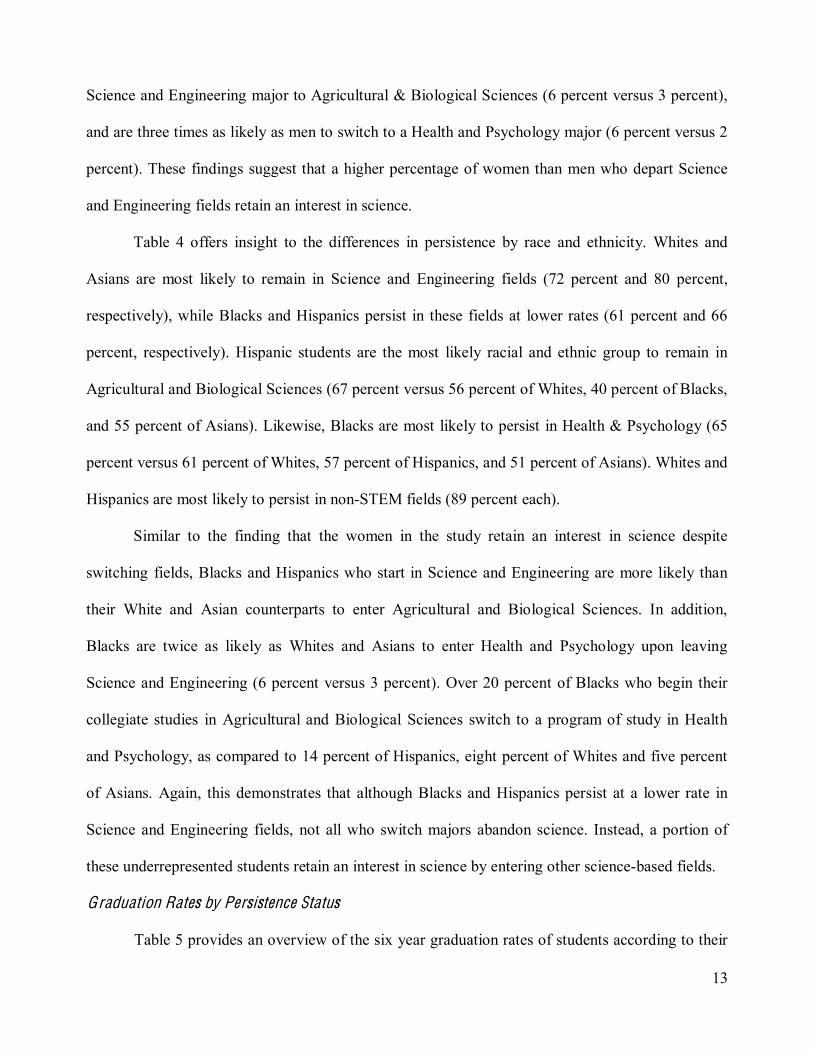
Persistence in STEM F ields
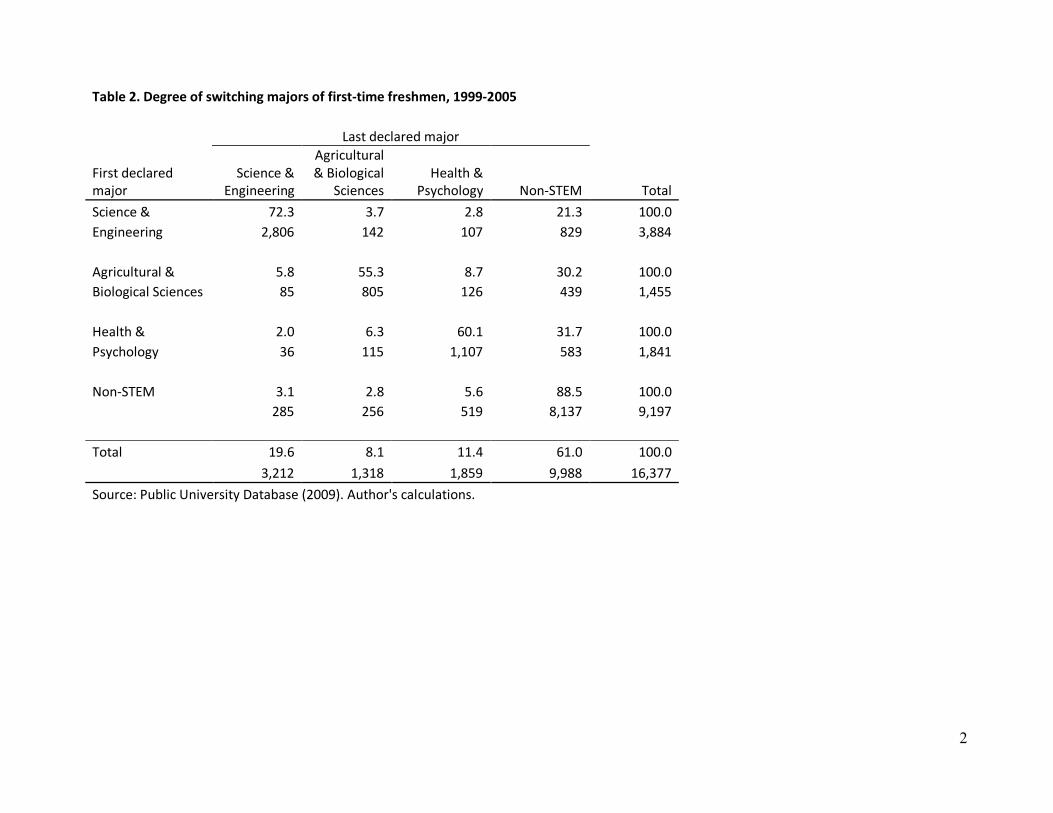
The majority of students who start in a specific type of STEM major finish in the same type
of major: 72 percent of students begin and end in a Science and Engineering major, 55 percent
begin and end in a Agriculture and Biological Sciences major, 60 percent begin and end in a Health
and Psychology major, and 86 percent of students begin and end in a non-STEM major (see Table
2).
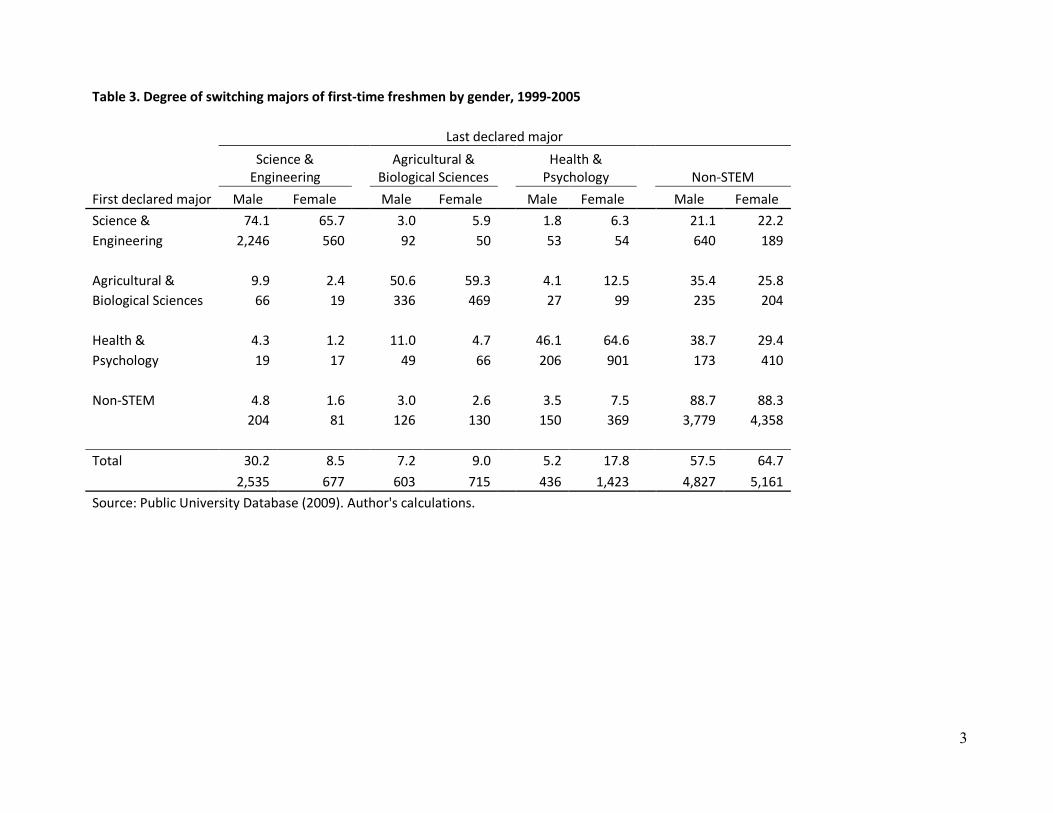
However, important differences exist between subgroups. Table 3 shows that nearly 75
percent of men remain in Science and Engineering fields, compared to 66 percent of women.
Slightly more women remain in the Agricultural and Biological Sciences as compared to men (59
percent versus 50 percent). Women also persist at a higher rate in Health and Psychology fields than
do their male counterparts (65 percent versus 46 percent). Men and women persist in non-STEM
fields at the same rate (88 percent each). Interestingly, women are twice as likely to switch from a
4 Slightly more than one-quarter of mother and mother’s highest level of education each is missing from the dataset.
13
Science and Engineering major to Agricultural & Biological Sciences (6 percent versus 3 percent),
and are three times as likely as men to switch to a Health and Psychology major (6 percent versus 2
percent). These findings suggest that a higher percentage of women than men who depart Science
and Engineering fields retain an interest in science.
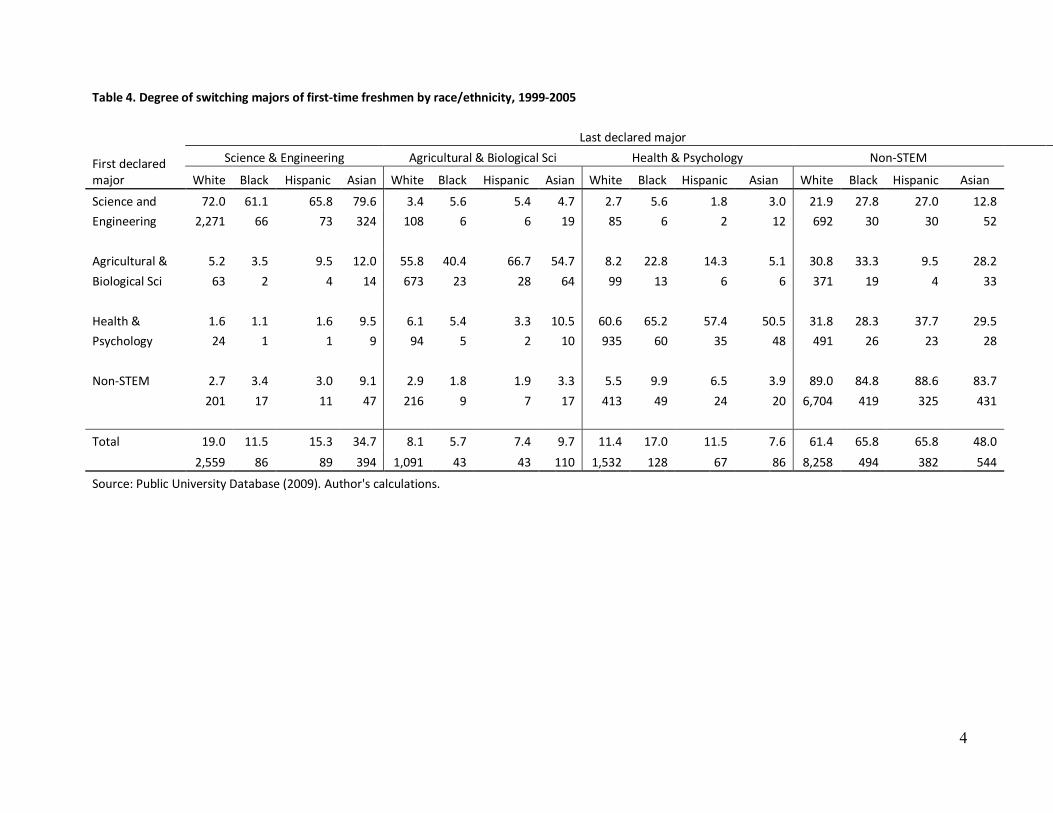
Table 4 offers insight to the differences in persistence by race and ethnicity. Whites and
Asians are most likely to remain in Science and Engineering fields (72 percent and 80 percent,
respectively), while Blacks and Hispanics persist in these fields at lower rates (61 percent and 66
percent, respectively). Hispanic students are the most likely racial and ethnic group to remain in
Agricultural and Biological Sciences (67 percent versus 56 percent of Whites, 40 percent of Blacks,
and 55 percent of Asians). Likewise, Blacks are most likely to persist in Health & Psychology (65
percent versus 61 percent of Whites, 57 percent of Hispanics, and 51 percent of Asians). Whites and
Hispanics are most likely to persist in non-STEM fields (89 percent each).
Similar to the finding that the women in the study retain an interest in science despite
switching fields, Blacks and Hispanics who start in Science and Engineering are more likely than
their White and Asian counterparts to enter Agricultural and Biological Sciences. In addition,
Blacks are twice as likely as Whites and Asians to enter Health and Psychology upon leaving
Science and Engineering (6 percent versus 3 percent). Over 20 percent of Blacks who begin their
collegiate studies in Agricultural and Biological Sciences switch to a program of study in Health
and Psychology, as compared to 14 percent of Hispanics, eight percent of Whites and five percent
of Asians. Again, this demonstrates that although Blacks and Hispanics persist at a lower rate in
Science and Engineering fields, not all who switch majors abandon science. Instead, a portion of
these underrepresented students retain an interest in science by entering other science-based fields.
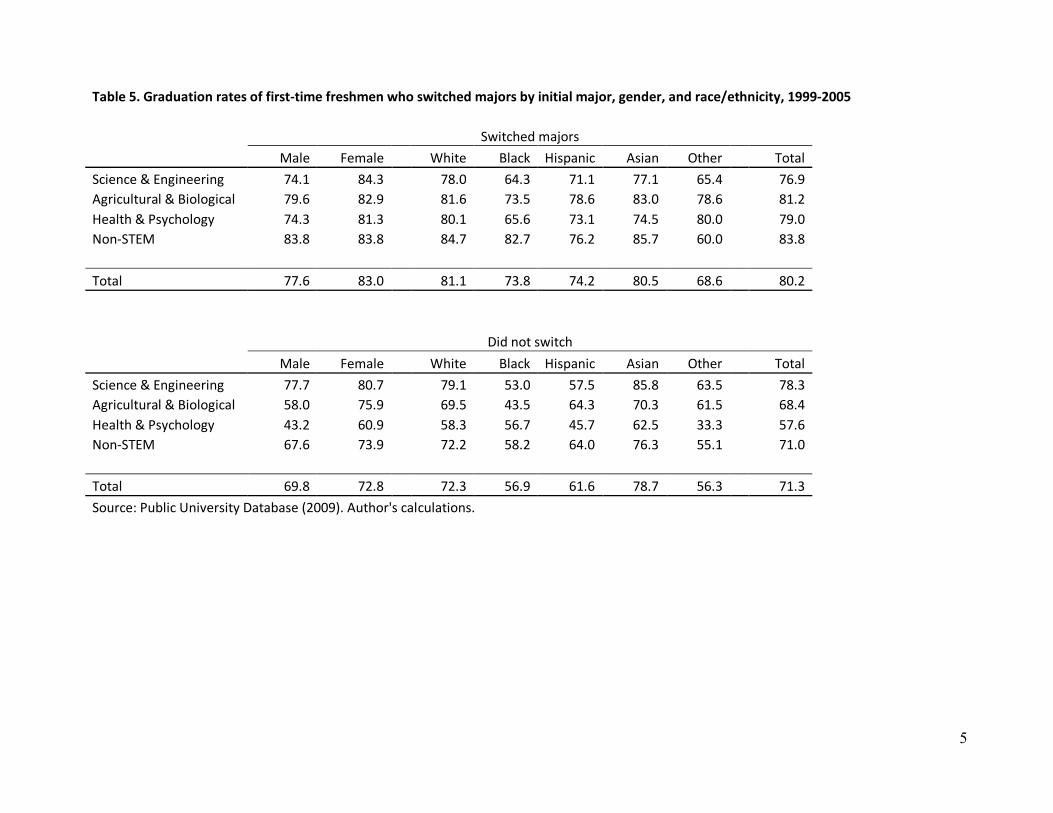
Graduation Rates by Persistence Status
Table 5 provides an overview of the six year graduation rates of students according to their
14
major field persistence status. Surprisingly, students who switched from their freshman year major
were more likely to graduate as compared to students who did not switch from their first declared
major (80 percent versus 71 percent). This observation holds true across all subgroups of interest,
although the graduation rate gaps between switchers and non-switchers varies greatly. The
difference in graduation rates for Asian students who persisted in their original major versus those
who switched is only 2 percent, as compared to 8 percent for Whites, 17 percent for Blacks, and 13
percent for Hispanics. Men who began in Health and Psychology and who did not switch majors
were least likely to graduate compared to men in other fields (43 percent). Women who persisted in
Science and Engineering have higher graduation rates than males who persisted in these fields (81
percent versus 78 percent). Hispanics who persist in Agricultural and Biological Sciences, and
Blacks who persist in Health and Psychology have comparable graduation rates as their White
colleagues in the same fields.
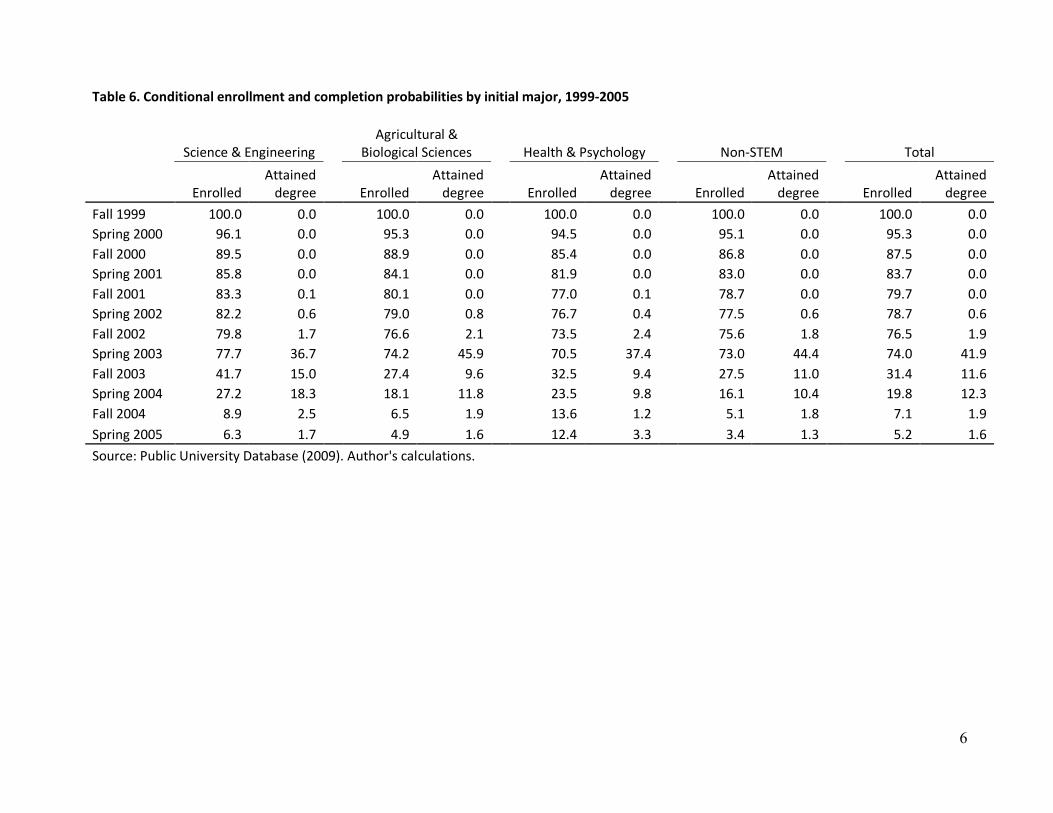
Conditional Probabilities Results
As described above, the conditional probabilities analysis used in this study reflect the
enrollments of students and degrees attained. As a reminder, a discrete-time hazard is the
conditional probability that individual i will experience a particular event or outcome in time period
t, given that he or she did not experience the same outcome in an earlier time period. Overall, 42
percent of students who began their studies in Fall 1999 earned their bachelor’s degree in Spring
2003 (see Table 6). Approximately an additional 25 percent earn their degree in the following year,
or by Spring 2004. Nearly half of students enrolled in Agricultural and Biological Sciences and
Non-STEM fields graduated in Spring 2003, or four years after matriculation, while 37 percent of
students in Science and Engineering and Health and Psychology graduate in the same time period.
An additional 33 percent of Science and Engineering majors graduate by the end of their fifth year,
as compared to 21 percent of Agricultural and Biological Science majors, 19 percent of Health and
15
Psychology majors, and 21 percent of Non-STEM majors.
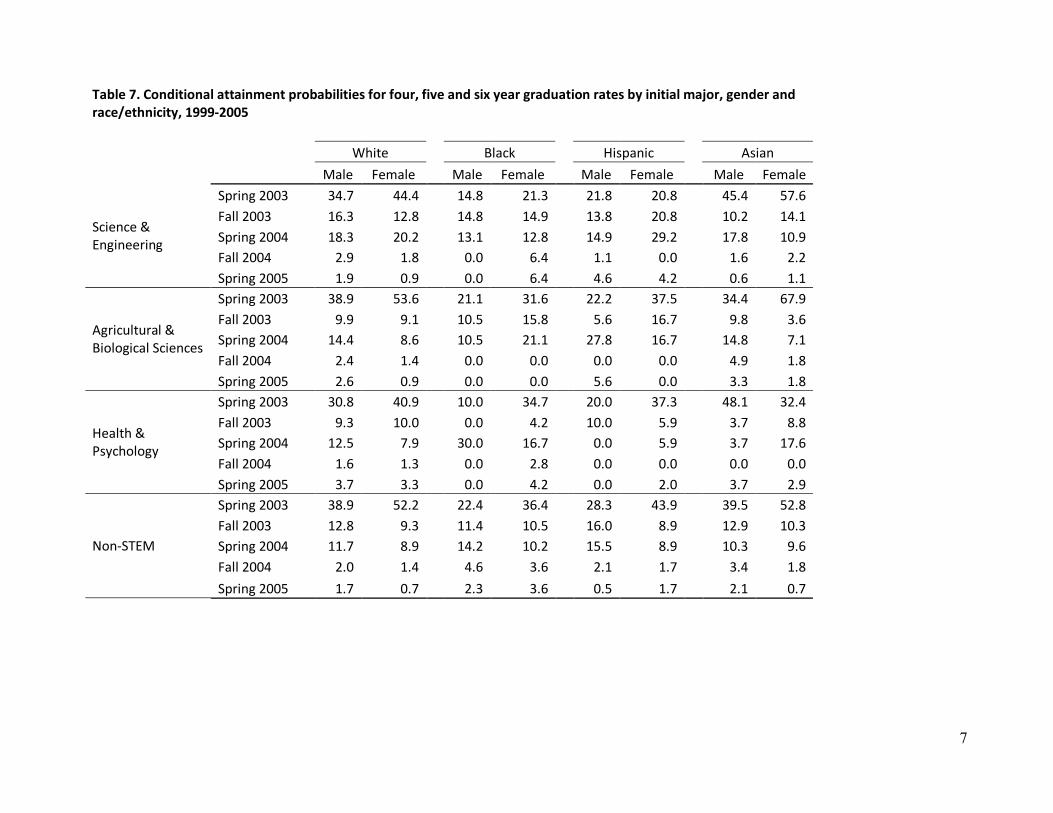
Table 7 shows that within Science and Engineering majors, a larger percentage of White,
Black, and Asian females complete their degrees in four years than do their male counterparts (45
percent of White females versus 35 percent of White males; 21 percent of Black females versus 15
percent of Black males, 58 percent of Asian females versus 45 percent of Asian males).
Approximately the same percentage of Hispanic males and females in Science and Engineering
majors complete their degrees in four years (21 percent of females versus 22 percent of males). In
addition, 77 percent of White females finish within five years of matriculation, as compared to 70
percent of White males. A greater five-year graduation gap exists for Hispanic students in Science
and Engineering majors, with 71 percent of Hispanic females completing their degrees in five years
as compared to only 51 percent of Hispanic males. Although there are fewer females pursuing these
majors, a higher percentage of them complete their bachelor’s degrees in a shorter time period than
their male counterparts.
A similar pattern of conditional probabilities exist in the Agricultural and Biological
Sciences. Within each racial and ethnic category, females are more likely to graduate in four years
as compared to their male counterparts (54 percent of White females versus 39 percent of White
males; 32 percent of Black females versus 21 percent of Black males; 38 percent of Hispanic
females versus 22 percent of Hispanic males; 68 percent of Asian females versus 34 percent of
Asian males). A higher percentage of females in each racial and ethnic group are likely to graduate
in five years as compared to their male counterparts enrolled in these fields. Similar findings exist
when examining the conditional probabilities of obtaining a bachelor’s degree in Health and
Psychology. Females across all racial and ethnic groups are also more likely to complete a degree in
non-STEM fields in four and five year periods, although the difference between probabilities by
gender is smaller within these majors.
16
Policy and Program Implications
A better understanding of the key factors that affect underrepresented students’ perseverance
and degree completion in the STEM fields will help policymakers and postsecondary administrators
design programs to promote persistence and completion so that students can benefit more fully from
their education in terms of potentially entering graduate programs in related fields, earning higher
incomes, experiencing greater social mobility, and benefiting from enhanced professional
opportunities. In addition, the use of a comprehensive, longitudinal dataset that combines data from
multiple institutions allows for information to be obtained on persistence and degree attainment
patterns of underrepresented students at large, research-intensive public universities.
The findings of this study, while exploratory, points to important differences between
traditionally underrepresented and well-represented groups in the STEM fields. Women and
minorities do retain an interest in science even though many depart high-profile majors, such as
computer science and engineering. This is evidenced by their switching into other science-based
fields, such as the agricultural and health sciences. This finding, along with an expanded notion of
what constitutes STEM fields, challenges the notion that a departure from the high-profile STEM
fields is a loss to the science community, or that women and minorities are simply not interested in
science. By following which fields students enter into upon switching majors, what may be initially
perceived to be a negative outcome may actually be participation—and eventually success—in
another science-based field.
In addition, women’s shorter time-to-degree across a wide variety of science-based fields as
compared to men has important implications for when members of these groups are eligible to enter
graduate programs and STEM careers. This finding is encouraging, and is likely impacted by the
many intervention programs that are offered on college campuses, such as the three large, research-
intensive, public universities in this study. Brainard & Carlin (1998) note the importance of support
17
systems in helping students negotiate, manage, and overcome the perceived barriers to their success.
While not observable in the database, some of the success of women and minority women is likely
to be attributed to such programs.
Despite these positive findings, there is still evidence that issues of access to the STEM
fields exist for women and minorities. While students self-select into their major field of choice,
institutions may use mechanisms like grants to increase the likelihood of underrepresented students
initially choosing a STEM major (Kienzl, George-Jackson, and Trent, 2009).
Limitations and Future Research
A number of limitations exist in this study. First, the data are drawn from a single cohort of
students attending three institutions, which limits the generalizability of these findings. Selection
bias is present in the dataset due to the data comprising only of students who attended these three
universities and does not include data on students who applied or who were admitted but did not
enroll. In addition, students may be self-selecting into specific majors based on interests,
motivations, and orientations to future careers; all of which are unobservable in the dataset.
Some of these limitations will be addressed as this research moves forward. Recognizing
that some factors, such as overall academic performance or academic performance in a specific
course may prompt students to switch majors, transcript data will be examined in a future study to
identify potential “gatekeeping” courses. In addition, regression analysis will offer insight into how
other factors, such as parent’s level of education, amount or type of financial aid, and residency
status, might explain students’ persistence in a major, as well as time-to-degree. Of equal
importance will be to investigate at what point in the degree program movements between majors
occur, with consideration given to overall academic performance and financial aid status, as these
factors may contribute to a change in major field of choice. Given what is known from the literature
18
review, it is expected that financial aid information will help explain persistence and degree
attainment patterns. Of the 16,377 students in the database, over 10,000 filed for FAFSA, offering a
wealth of information regarding the type, amount, and mix of financial aid received throughout the
course of their undergraduate studies. The authors hope to further the discussion of the impact of
financial aid on college persistence, major field persistence, and degree attainment.
In continuing these lines of research, the authors hope to continue to contribute to the
understanding of underrepresented students’ persistence and educational outcomes as they pertain to
the STEM fields, but also to investigate the impact of large, research-intensive, public universities
on the production of female and minority STEM graduates, particularly as these institutions “are the
primary producers of the nation’s scientific brain trust” (Fields, 1998, p. 16). This study, and future
studies, has implications not only for institutional programs and policies that meet social and
practical concerns, but also state and federal policies regarding the preparation of a skilled,
scientific workforce.
19
References
Allison, P. (1984). Event history analysis: Regression for longitudinal data (Sage University paper series on quantitative applications in the social sciences, Number 07-046). Beverly Hills, CA: Sage.
Brainard, S.G., & Carlin, L. (1998). A longitudinal study of undergraduate women in engineering
and science. Proceedings of the 1997 Frontiers in Education Conference, November 5-8, 1997, Pittsburgh, PA. Retrieved June 10, 2008, from http://www.iwitts.com/html/brainard.pdf
Camp, T. (1997). The incredible shrinking pipeline. Communications of the ACM, 40(10), 103-110. Carter, D.F. (2006). Key issues in the persistence of underrepresented minority students. New
Directions for Institutional Research. 130, 33-46. Clewell, B.C., & Campbell, P.B. (2002). Taking stock: Where we’ve been, where we are, where
we’re going. Journal of Women and Minorities in Science and Engineering, 8, 255-284.
DesJardins, S.L. (2003). Event history methods: Conceptual issues and an application to student departure from college. In J. C. Smart (Ed.), Higher education: Handbook of theory and research, Vol. 18 (pp.421–471). Dordrecht, Netherlands: Springer.
Elliot, R, Strenta, A.C., Adair, R., Matier, M., & Scott, J. (1996). The role of ethnicity in choosing
and leaving science in highly selective institutions. Research in Higher Education, 37(6), 681-709.
Etkowitz, H., Kemelogor, C., Neuschatz, M., Uzzi, B., & Alonzo, J. (1994). The paradox of critical
mass for women in science (change in workplace structure needed to integrate women successfully into academic science departments). Science, 266(5182), 51-54.
Felder, R.M., Felder, G.N., Mauney, M., Hamrin, C.E., & Dietz, E.J. (1995). A longitudinal study
of engineering student performance and retention: Gender differences in student performance and attitudes. Journal of Engineering Education, 84(2), 151-163.
Grandy, J. (1998). Persistence in science of high ability minority students. The Journal of Higher
Education, 69(6), 589-620. Hanson, S.L. (2004). African American women in science: Experiences from high school through
the post-secondary years and beyond. National Women’s Study Association Journal, 16(1), 96-115.
Hewson, P.W., Kahle, J.B., Scantlebury, K. & Davies, D. (2001). Equitable science education in
urban middle schools: Do reform efforts make a difference? Journal of Research in Science Teaching, 38(10), 1130–1144.
Kienzl, Gregory S., George-Jackson, Casey E., & Trent, William T. (2009). Underrepresented
20
Students Entering STEM F ields. American Educational Research Association. April 13-17, 2009. San Diego, CA.
Leppel, K. (2001). The impact of major on college persistence among freshmen. Higher Education,
41(3), 327-342. Levine, J., & Wycokoff, J. (1991). Predicting Persistence and Success in Baccalaureate
Engineering. Education, 111(4), 461-468. May, G.S & Chubin, D.E. (2003) A retrospective on undergraduate engineering success for underrepresented minority students. Journal of Engineering Education, 92(1), 27-40. Oakes, J. (1990). Opportunities, achievement, and choice: Women and minority students in science
and mathematics. Review of Research in Education, 16, 153–222. National Science Foundation (2008) Science and Engineering Indicators. Retrieved February 19,
2009, from http://www.nsf.gov/statistics/seind08/c2/c2s3.htm#c2s31 Russell, M.L., & Atwater, M.M. (2005). Traveling the road to success: A discourse on persistence
throughout the science pipeline with African American students at Predominately White Institutions. Journal of Research in Science Teaching, 42(6), 691-715.
Sax, L.J. (2000). Undergraduate science majors: Gender differences in who goes to graduate school.
The Review of Higher Education, 24(2), 153–172. Scott, M. & Kennedy, B. (2005). Pitfalls in pathways: Some perspectives on competing risks event
history analysis in education research. Journal of Educational and Behavioral Statistics, 30(4), 413–442.
Serex, C.P., & Townsend, B.K. (1999). Student perceptions of chilling practices in sex-atypical
majors. Research in Higher Education, 40(5), 527-538. Seymour, E. (2002). Tracking the processes of change in U.S. undergraduate education in science,
mathematics, engineering, and technology. Science Education, 86, 79–105. Singer, J. & Willett, J. (2003). Applied longitudinal data analysis: Modeling change and event
occurrence. New York: Oxford University Press. Smyth, F. L., & McArdle, J. J. (2004). Ethnic and Gender Differences in Science Graduation at
Selective Colleges with Implications for Admission Policy and College Choice. Research in Higher Education, 45(4), 353-381.
Sonnert, G., Fox, M. F., & Adkins, K. (2007). Undergraduate Women in Science and Engineering:
Effects of Faculty, Fields, and Institutions Over Time. Social Science Quarterly, 88(5), 1333-1356.
St. John, E.P., Carter, D.F., Chung, C.G., and Musoba, G.D. (2006). “Diversity and persistence
21
in Indiana Higher Education: The impact of preparation, major choices, and student aid.” In E.P. St. John (Ed.). Readings on Equal Education, Vol. 21: Public Policy and Educational Opportunity: School Reforms, Postsecondary Encouragement, and State Policies on Higher Education. New York: AMS Press.
St. John, E. P., Hu, S., Simmons, A., Carter, D. F., & Weber, J. (2004). What Difference Does a
Major Make? The Influence of College Major Field on Persistence by African American and White Students. Research in Higher Education, 45(3), 209-232.
Stake, J.E. & Mares, K.R. (2001). Science enrichment programs for gifted high school girls and
boys: Predictors of program impact on science confidence and motivation. Journal of Research in Science Teaching, 38(10), 1065–1088.
Tan, D.L. (2002). Majors in science, technology, engineering, and mathematics: Gender and ethnic
differences in persistence and graduation. 42nd Annual Association for Institutional Research (AIR) Forum. June 3-6, 2002, Toronto, Canada.
U.S. Department of Education. (2006). A test of leadership: Charting the future of U .S. higher
education. Washington, DC: Author. Retrieved September 28, 2006, from http://www.ed.gov/about/bdscomm/list/hiedfuture/reports/pre-pub-report.pdf.
1
Appendix A
Science and engineering Mathematics
27.01 Mathematics, general 27.03 Applied mathematics 27.05 Mathematical statistics 27.99 Mathematics/statistics, other 52.1302 Business statistics 52.1304 Actuarial science Aeronautical/astronautical engineering 14.02 Aerospace, aeronautical, astronautical engineering Chemical engineering
14.07 Chemical engineering 14.25 Petroleum engineering 14.32 Polymer/plastics engineering Civil engineering
14.04 Architectural engineering 14.08 Civil engineering 14.14 Environmental/environmental health engineering 14.09 Computer engineering 14.10 Electrical, electronics, communications engineering 14.38 Surveying engineering Mechanical engineering 14.11 Engineering mechanics 14.19 Mechanical engineering Materials/metallurgical engineering 14.06 Ceramic sciences/engineering 14.18 Materials engineering 14.20 Metallurgical engineering 14.31 Materials science Other engineering
14.01 Engineering, general 14.03 Agricultural engineering 14.05 Bioengineering/biomedical engineering 14.12 Engineering physics 14.13 Engineering science 14.15 Geological engineering 14.16 Geophysical engineering 14.21 Mining/mineral engineering 14.22 Naval architecture/marine engineering 14.23 Nuclear engineering 14.24 Ocean engineering 14.27 Systems engineering 14.28 Textile sciences/engineering 14.29 Engineering design 14.34 Forest engineering 14.37 Operations research 14.39 Geological engineering
2
14.99 Engineering, other Computer sciences 11.01 Computer/information sciences, general 11.02 Computer programming 11.03 Data processing technology/technician 11.04 Information sciences/systems 11.05 Computer systems analysis 11.07 Computer science 11.08 Web page design, computer graphics, database management 11.09 Computer systems networking and telecommunications 11.10 System administration, networking, management 11.99 Computer/information sciences, other Astronomy
40.0201 Astronomy 40.0202 Astrophysics 40.0299 Astronomy/astrophysics, other Chemistry
40.0501 Chemistry, general 40.0502 Analytical chemistry 40.0503 Inorganic chemistry 40.0504 Organic chemistry 40.0506 Physical/theoretical chemistry 40.0507 Polymer chemistry 40.0508 Chemical physics 40.0599 Chemistry, other 51.2004 Medicinal/pharmaceutical chemistry Physics
40.0801 Physics, general 40.0802 Chemical and atomic/molecular physics 40.0804 Elementary particle physics 40.0805 Plasma/high‐temperature physics 40.0806 Nuclear physics 40.0807 Optics/optical sciences 40.0808 Solid state/low‐temperature physics 40.0809 Acoustics 40.0810 Theoretical/mathematical physics 40.0899 Physics, other Other physical sciences
40.01 Physical sciences, general 40.99 Physical sciences, other Atmospheric sciences
40.0401 Atmospheric sciences/meteorology, general 40.0402 Atmospheric chemistry/climatology 40.0403 Atmospheric physics/dynamics 40.0404 Meteorology 40.0499 Atmospheric science/meteorology, other Earth sciences
40.0601 Geology 40.0602 Geochemistry
3
40.0603 Geophysics/seismology 40.0604 Paleontology 40.0605 Hydrology/water resources sciences 40.0606 Geochemistry/petrology 40.0699 Geological and related sciences, other Oceanography
40.0607 Oceanography
Agricultural and Biological Sciences Agricultural sciences 01.04 Agricultural and food products processing 01.05 Agricultural and domestic animal services 01.08 Agriculture extension/communications 01.09 Animal sciences 01.10 Food sciences/technology 01.11 Plant sciences 01.12 Soil sciences 01.99 Agriculture/agricultural sciences, other 03.01 Natural resources conservation 03.02 Natural resources management/protective services 03.03 Fishing and fisheries sciences/management 03.05 Forestry/forest management 03.06 Wildlife/wildlands management 03.99 Natural resources conservation, other 26.0707 Agricultural animal physiology Biological Sciences 19.0505 Food systems administration 26.01 Biology, general 26.0202 Biochemistry 26.0203 Biophysics 26.0204 Molecular biology 26.0209 Radiation biology/radiobiology 26.03 Botany/plant biology 26.0401 Cell/cellular biology and histology 26.0403 Anatomy 26.0405 Neurosciences 26.05 Microbiology/bacteriology 26.0503 Medical microbiology/bacteriology 26.0504 Virology 26.0505 Parasitology 26.0599 Immunology 26.07 Zoology 26.08 Genetics, plant/animal 26.09 Medical neurobiology 26.0910 Pathology
4
26.10 Pharmacology/toxicology 26.1101 Biometrics 26.1102 Biostatistics 26.12 Biotechnology research 26.13 Ecology 26.1302 Marine/aquatic biology 26.1303 Evolutionary biology 26.99 Biological sciences/life sciences, other 30.10 Biopsychology 30.19 Nutritional sciences 30.24 Neuroscience
Health and Psychology Medical sciences 51 Health professions/related clinical sciences 60.01 Dentistry 60.02 Medicine/surgery Medical sciences, continued 60.03 Veterinary medicine 26.0988 Medical physiology Psychology
42.01 Psychology, general 42.02 Clinical psychology 42.03 Cognitive psychology/psycholinguistics 42.04 Community psychology 42.05 Comparative psychology 42.06 Counseling psychology 42.07 Developmental/child psychology 42.08 Experimental psychology 42.09 Industrial/organizational psychology 42.10 Personality psychology 42.11 Physiological psychology/psychobiology 42.16 Social psychology 42.19 Psychometrics 42.20 Clinical child psychology 42.21 Environmental psychology 42.22 Geropsychology 42.23 Health/medical psychology 42.24 Psychopharmacology 42.25 Family psychology 42.26 Forensic psychology 42.99 Psychology, other 51.1507 Psychoanalysis 51.3603 Hypnotherapy
5
Non‐STEM Education 13 Education
31.05 Health/physical education 39.0401 Religious education 42.1701 School psychology 42.1801 Educational psychology 51.0913 Athletic training/trainer English/literature
16.0104 Comparative literature 23 American/English languages, literatures Foreign languages/literatures 16 Foreign languages/literatures 16.1200 Classics/languages History
54 History Religion/theology
38.02 Religious studies 39 Theology/ministries Other humanities
24 Liberal arts/other humanities 38.01 Philosophy 50 Visual/performing arts Business/management
01.01 Agricultural business/management 01.03 Agricultural production operations Business/management, continued 01.06 Horticultural operations 14.3701 Operations research 52 Business, management, marketing, related support services
Information fields (journalism, broadcasting, librarianship) 09 Communications 10 Communications technologies 25 Library science Other professional fields 04 Architecture/related programs 12 Personal/culinary services 15 Engineering‐related technologies 19 Home economics/family studies 22 Law and legal studies 28 Reserve officer training corps (ROTC) 29 Military technologies 30 Multi‐/interdisciplinary studies 31 Parks/recreation/leisure/fitness 32 Basic skills 33 Citizenship activities 34 Health related knowledge/skills 35 Interpersonal/social skills
6
36 Personal awareness/self‐improvement 41 Science technologies 43 Protective services 44 Public administration/social services professions 46 Construction trades 47 Mechanic/repair technologies 48 Precision production trades 49 Transportation/materials moving workers Political science
44.04 Public administration 44.05 Public policy analysis 44.99 Public administration/services, other 45.09 International relations/affairs 45.10 Political science/government Sociology
45.05 Demography/population studies 45.0702 Cartography 45.11 Sociology Other social sciences
05 Area, ethnic, cultural, gender studies 16.0102 Linguistics 30.1101 Gerontology 30.1501 Science, technology, society 30.1701 Behavioral sciences 30.2001 International/global studies 30.2301 Intercultural/multicultural and diversity studies 45.01 Social sciences, general 45.02 Anthropology 45.03 Archeology 45.04 Criminology 45.07 Geography 45.10 Canadian government/politics 45.12 Urban affairs/studies 45.99 Social sciences/history, other 53.3201 Bioethics/medical ethics 54.0000 Social sciences/history 54.0404 History/philosophy of science and technology Economics
01.0103 Agricultural economics 45.06 Economics
1
Appendix B
Table 1. Descriptive statistics of first‐time freshmen in 1999 by selected demographic characteristics, 1999
Overall Male Female Science & Engineering Agriculture Health Non‐STEM
Socio‐demographic Female 48.7
22.0 54.4 75.7 53.7
White, non‐Hispanic 82.8 82.8 82.9
81.5 83.2 85.0 82.9
Black, non‐Hispanic 4.6 3.8 5.5
2.8 3.9 5.1 5.4
Hispanic 3.6 3.6 3.5
2.9 2.9 3.4 4.0 Asian 7.0 7.6 6.3
10.5 8.1 5.2 5.7
Other 2.0 2.1 1.8
2.3 1.9 1.4 1.9
Father ed: >HS diploma 62.9 64.9 60.9
69.9 63.5 59.4 60.4 Mother ed: >HS diploma 60.0 61.2 58.7
66.3 61.9 56.7 57.6
Resident of state 78.3 76.2 80.6
71.2 86.5 82.2 79.3 SAT score 1163 1189 1134
1280 1169 1126 1119
Financial aid Completed FAFSA 72.9 71.2 74.7
74.5 72.7 79.7 70.9
Received a Pell grant 14.9 13.4 16.3
12.3 14.8 16.7 15.6
Net price $9,881 $10,149 $9,611 $10,561 $9,597 $9,406 $9,732
Observations 16,377 8,331 7,892 3,884 1,455 1,841 9,197
Source: Public University Database (2009). Author's calculations.
2
Table 2. Degree of switching majors of first‐time freshmen, 1999‐2005
Last declared major
First declared major
Science & Engineering
Agricultural & Biological
Sciences Health &
Psychology Non‐STEM Total Science & 72.3 3.7 2.8 21.3 100.0 Engineering 2,806 142 107 829 3,884
Agricultural & 5.8 55.3 8.7 30.2 100.0 Biological Sciences 85 805 126 439 1,455
Health & 2.0 6.3 60.1 31.7 100.0 Psychology 36 115 1,107 583 1,841
Non‐STEM 3.1 2.8 5.6 88.5 100.0
285 256 519 8,137 9,197
Total 19.6 8.1 11.4 61.0 100.0 3,212 1,318 1,859 9,988 16,377 Source: Public University Database (2009). Author's calculations.
3
Table 3. Degree of switching majors of first‐time freshmen by gender, 1999‐2005
Last declared major
First declared major
Science & Engineering
Agricultural & Biological Sciences
Health & Psychology
Non‐STEM
Male Female Male Female Male Female Male Female Science & 74.1 65.7
3.0 5.9
1.8 6.3
21.1 22.2
Engineering 2,246 560
92 50
53 54
640 189
Agricultural & 9.9 2.4
50.6 59.3
4.1 12.5
35.4 25.8 Biological Sciences 66 19
336 469
27 99
235 204
Health & 4.3 1.2
11.0 4.7
46.1 64.6
38.7 29.4
Psychology 19 17
49 66
206 901
173 410
Non‐STEM 4.8 1.6
3.0 2.6
3.5 7.5
88.7 88.3
204 81
126 130
150 369
3,779 4,358
Total 30.2 8.5
7.2 9.0
5.2 17.8
57.5 64.7
2,535 677 603 715 436 1,423 4,827 5,161 Source: Public University Database (2009). Author's calculations.
4
Table 4. Degree of switching majors of first‐time freshmen by race/ethnicity, 1999‐2005
Last declared major
First declared major
Science & Engineering Agricultural & Biological Sci Health & Psychology Non‐STEM White Black Hispanic Asian White Black Hispanic Asian White Black Hispanic Asian White Black Hispanic Asian
Science and 72.0 61.1 65.8 79.6 3.4 5.6 5.4 4.7 2.7 5.6 1.8 3.0 21.9 27.8 27.0 12.8 Engineering 2,271 66 73 324 108 6 6 19 85 6 2 12 692 30 30 52
Agricultural & 5.2 3.5 9.5 12.0 55.8 40.4 66.7 54.7 8.2 22.8 14.3 5.1 30.8 33.3 9.5 28.2 Biological Sci 63 2 4 14 673 23 28 64 99 13 6 6 371 19 4 33
Health & 1.6 1.1 1.6 9.5 6.1 5.4 3.3 10.5 60.6 65.2 57.4 50.5 31.8 28.3 37.7 29.5 Psychology 24 1 1 9 94 5 2 10 935 60 35 48 491 26 23 28
Non‐STEM 2.7 3.4 3.0 9.1 2.9 1.8 1.9 3.3 5.5 9.9 6.5 3.9 89.0 84.8 88.6 83.7
201 17 11 47 216 9 7 17 413 49 24 20 6,704 419 325 431
Total 19.0 11.5 15.3 34.7 8.1 5.7 7.4 9.7 11.4 17.0 11.5 7.6 61.4 65.8 65.8 48.0 2,559 86 89 394 1,091 43 43 110 1,532 128 67 86 8,258 494 382 544 Source: Public University Database (2009). Author's calculations.
5
Table 5. Graduation rates of first‐time freshmen who switched majors by initial major, gender, and race/ethnicity, 1999‐2005
Switched majors Male Female White Black Hispanic Asian Other Total Science & Engineering 74.1 84.3
78.0 64.3 71.1 77.1 65.4
76.9
Agricultural & Biological 79.6 82.9
81.6 73.5 78.6 83.0 78.6
81.2 Health & Psychology 74.3 81.3
80.1 65.6 73.1 74.5 80.0
79.0
Non‐STEM 83.8 83.8
84.7 82.7 76.2 85.7 60.0
83.8 Total 77.6 83.0 81.1 73.8 74.2 80.5 68.6 80.2
Did not switch Male Female White Black Hispanic Asian Other Total Science & Engineering 77.7 80.7
79.1 53.0 57.5 85.8 63.5
78.3
Agricultural & Biological 58.0 75.9
69.5 43.5 64.3 70.3 61.5
68.4 Health & Psychology 43.2 60.9
58.3 56.7 45.7 62.5 33.3
57.6
Non‐STEM 67.6 73.9
72.2 58.2 64.0 76.3 55.1
71.0 Total 69.8 72.8 72.3 56.9 61.6 78.7 56.3 71.3 Source: Public University Database (2009). Author's calculations.
6
Table 6. Conditional enrollment and completion probabilities by initial major, 1999‐2005
Science & Engineering
Agricultural & Biological Sciences
Health & Psychology
Non‐STEM
Total
Enrolled Attained degree Enrolled
Attained degree Enrolled
Attained degree Enrolled
Attained degree Enrolled
Attained degree
Fall 1999 100.0 0.0
100.0 0.0
100.0 0.0
100.0 0.0
100.0 0.0 Spring 2000 96.1 0.0
95.3 0.0
94.5 0.0
95.1 0.0
95.3 0.0
Fall 2000 89.5 0.0
88.9 0.0
85.4 0.0
86.8 0.0
87.5 0.0 Spring 2001 85.8 0.0
84.1 0.0
81.9 0.0
83.0 0.0
83.7 0.0
Fall 2001 83.3 0.1
80.1 0.0
77.0 0.1
78.7 0.0
79.7 0.0 Spring 2002 82.2 0.6
79.0 0.8
76.7 0.4
77.5 0.6
78.7 0.6
Fall 2002 79.8 1.7
76.6 2.1
73.5 2.4
75.6 1.8
76.5 1.9 Spring 2003 77.7 36.7
74.2 45.9
70.5 37.4
73.0 44.4
74.0 41.9
Fall 2003 41.7 15.0
27.4 9.6
32.5 9.4
27.5 11.0
31.4 11.6 Spring 2004 27.2 18.3
18.1 11.8
23.5 9.8
16.1 10.4
19.8 12.3
Fall 2004 8.9 2.5
6.5 1.9
13.6 1.2
5.1 1.8
7.1 1.9 Spring 2005 6.3 1.7 4.9 1.6 12.4 3.3 3.4 1.3 5.2 1.6
Source: Public University Database (2009). Author's calculations.
7
Table 7. Conditional attainment probabilities for four, five and six year graduation rates by initial major, gender and race/ethnicity, 1999‐2005
White
Black
Hispanic
Asian
Male Female Male Female Male Female Male Female
Science & Engineering
Spring 2003 34.7 44.4
14.8 21.3
21.8 20.8
45.4 57.6 Fall 2003 16.3 12.8
14.8 14.9
13.8 20.8
10.2 14.1
Spring 2004 18.3 20.2
13.1 12.8
14.9 29.2
17.8 10.9 Fall 2004 2.9 1.8
0.0 6.4
1.1 0.0
1.6 2.2
Spring 2005 1.9 0.9 0.0 6.4 4.6 4.2 0.6 1.1
Agricultural & Biological Sciences
Spring 2003 38.9 53.6
21.1 31.6
22.2 37.5
34.4 67.9 Fall 2003 9.9 9.1
10.5 15.8
5.6 16.7
9.8 3.6
Spring 2004 14.4 8.6
10.5 21.1
27.8 16.7
14.8 7.1 Fall 2004 2.4 1.4
0.0 0.0
0.0 0.0
4.9 1.8
Spring 2005 2.6 0.9 0.0 0.0 5.6 0.0 3.3 1.8
Health & Psychology
Spring 2003 30.8 40.9
10.0 34.7
20.0 37.3
48.1 32.4 Fall 2003 9.3 10.0
0.0 4.2
10.0 5.9
3.7 8.8
Spring 2004 12.5 7.9
30.0 16.7
0.0 5.9
3.7 17.6 Fall 2004 1.6 1.3
0.0 2.8
0.0 0.0
0.0 0.0
Spring 2005 3.7 3.3 0.0 4.2 0.0 2.0 3.7 2.9
Non‐STEM
Spring 2003 38.9 52.2
22.4 36.4
28.3 43.9
39.5 52.8 Fall 2003 12.8 9.3
11.4 10.5
16.0 8.9
12.9 10.3
Spring 2004 11.7 8.9
14.2 10.2
15.5 8.9
10.3 9.6 Fall 2004 2.0 1.4
4.6 3.6
2.1 1.7
3.4 1.8
Spring 2005 1.7 0.7 2.3 3.6 0.5 1.7 2.1 0.7