Underground Advisory Panel
49
Transport for London UNDERGROUND ADVISORY PANEL Meeting No. 19 to be held on Wednesday 13 th December 2006 at 1400 hrs In the Boardroom, 14 th Floor, Windsor House, 42-50 Victoria Street, London SW1H OTL AGENDA 1. Apologies for Absence - 2. Minutes of Meeting No 18 held on 4 October 2006 - 3. Matters Arising and Outstanding Items - 4. Managing Director’s Report Tim O’Toole 5. Connect update & operational impacts (presentation) Stuart Harvey Bob Thorogood 6. 2006/7 Closure programme (presentation) Richard Parry 7. Design Management in LU (presentation) Richard Parry 8. Crime and Disorder Strategy Jeroen Weimar 9. Any Other Business Date of next meeting: Thursday 1 st February 2007 at 1000hrs
Transcript of Underground Advisory Panel
Transport for London
UNDERGROUND ADVISORY PANEL
Meeting No. 19 to be held on Wednesday 13th December 2006 at 1400 hrs In the Boardroom, 14th Floor, Windsor House,
42-50 Victoria Street, London SW1H OTL
AGENDA
1. Apologies for Absence - 2. Minutes of Meeting No 18 held on 4 October 2006 - 3. Matters Arising and Outstanding Items - 4. Managing Director’s Report Tim O’Toole 5. Connect update & operational impacts (presentation) Stuart Harvey
Bob Thorogood 6. 2006/7 Closure programme (presentation) Richard Parry 7. Design Management in LU (presentation) Richard Parry 8. Crime and Disorder Strategy Jeroen Weimar 9. Any Other Business Date of next meeting: Thursday 1st February 2007 at 1000hrs
UAP Minutes 16/10/06 – 24/10/06 Page 1 of 4
Transport for London
MINUTES OF THE UNDERGROUND ADVISORY PANEL MEETING No 18
held at 2.00pm on Wednesday 4 October 2006 in Windsor House Present: Panel Members: Peter Hendy (Chair) Stephen Glaister (Vice Chair) Kirsten Hearn (Board Member) Tim O'Toole (Managing Director, LUL) Jay Walder (Managing Director, Finance and Planning) Board Advisers: Lord Toby Harris (from minute 20/10/06) Bryan Heiser TfL Officers: Richard Browning (Head of Group Business Planning & Performance TfL) Howard Carter (General Counsel) Michael Colella (Acting Head of Group Business Planning) Stephen Critchley (Chief Finance Officer) Valerie Todd (Interim Managing Director, Group Services) LUL Officers: Sarah Atkins (Head of LU Legal) Mike Brown (Chief Operating Officer) Barry Hutton (Head of Business Planning & Performance) Richard Parry (Director of Strategy & Service Development) David Waboso (Director of Engineering) Secretary: Horatio Chishimba (TfL Secretariat) Gladys Williams (TfL Secretariat)
ACTION
16/10/06 Apologies for Absence
Apologies for absence were received from Murziline Parchment, Tony West and Honor Chapman.
17/10/06 Declaration of interests
None declared.
18/10/06 Minutes of Meeting No 17
The minutes of the Underground Advisory Panel held on 6 June 2006 were approved and signed by the Chairman.
UAP Minutes 16/10/06 – 24/10/06 Page 2 of 4
19/10/06 Matters Arising and Outstanding Items
Closure Procedures – 13/06/06: The November Surface Advisory Panel meeting would receive a paper on TfL’s arrangements for ensuring that bus contractors, engaged to support closures, complied with TfL legal and contractual requirements.
Claire Kavanagh
Lift in Kings Cross Western Ticket Hall – 15/06/06: Mike Brown confirmed that the lift in the western ticket hall had been working on the day of opening of the ticket hall but that a member of staff had not been available to operate the lift. Mike Brown apologised to Bryan Heiser who, as a result the non-availability of staff, could not attend the opening event. The Panel was informed that the action had been taken to address the staffing issue.
The Panel noted the status of actions in the report.
20/10/06 Business Plan
Members received a presentation on the Business Plan from Tim O’Toole and co-presented by David Waboso, Mike Brown and Richard Parry.
Tim O’Toole gave a background briefing to the 2007/08 business plan which was the delivery vehicle for LU’s strategy. The Plan reached beyond asset improvements to LU’s organisational capability to deliver its vision.
The Plan would see an unprecedented investment programme, the largest programme for 70 years and most programmes would be delivered through PPP and PFI contracts. Delivery of programmes in time for the Olympics was another challenge that had been taken into account in preparing the Business Plan.
To cater for an expected population and employment growth in London a number of projects had been earmarked for the planning period. LU’s strategy in response to the challenges comprised:
• A clear vision for customer service;
• A strategy grounded on a reliable service and LU’s rich heritage and tradition of customer care; and
• Strategic goals that supported and delivered the Mayor’s vision for London
Mike Brown explained the strategic framework required to deliver a world class tube for a world class city. This included:
Customer Service: Ensuring customers were consistently
UAP Minutes 16/10/06 – 24/10/06 Page 3 of 4
satisfied with every aspect of their last journey;
Infrastructure: Specifying the requirements for, and actively assuring the sustained transformation of LU’s assets.
David Waboso informed the Panel of the importance of stressing that existing supply trains, signals, tracks etc. were well maintained and the importance of getting them into a good state before they were upgraded. Systems integration was vital in charting progress made to-date and LU was working with the Infracos within budget and time scale restraints to keep improvement going. He informed the Panel that LU continued to perform well on safety and aimed to have a simplified technical assurance regime.
PFI Contracts: Richard Parry outlined some components needed to manage the huge contracts and also how to ensure that LU had the correct skills set to manage issues in relation to claims and risk management.
Stephen Glaister commended the progress made to-date and stressed the importance of advising the general public of transport related issues. Tim O’Toole confirmed that the reduction and simplification of the working reference manual would be of interest to the general public.
In conclusion, Tim O’Toole informed the Panel that LU’s strategy was consistent with the Mayor’s requirements and that a number of areas would be mapped over the period and move towards getting delivery in shape in the next 18 months. Tim O’Toole would provide the Panel with an update at that time.
21/10/06 Managing Director’s Report
Tim O’Toole introduced the report and informed the Panel that the focus for the highlighted performance headlines for Period 5 ended 19 August 2006:
• Demand remained strong with annual passenger forecast to exceed 1 billion for the first time;
• The Central line was named Best London Suburban Operator at the National Rail Awards 2006 – London Underground’s first success at the awards;
• Only the Central and East London lines performed within their overall excess journey time targets;
• There had been an adverse trend in SPAD (Signal Passed at Danger) following two years of improvement;
• The below budget net cost was due to improved revenue, Infraco performance abatements, lower capital expenditure and non-materialisation of risk;
UAP Minutes 16/10/06 – 24/10/06 Page 4 of 4
• Most lines had recorded an increased number of signals and points failures;
• Low staff turnover had limited LU’s ability to achieve staff changes in workforce composition. A process was in place to facilitate a managed reduction in temporary staff numbers.
• A third of the District line train fleet had been refurbished and customer feedback had been positive.
The Panel noted the content of the Managing Director’s report.
22/10/06 Strategic Workstreams
Members noted the issues on Strategic Workstreams which had been incorporated into the Managing Director’s report - minute 21/10/06.
23/10/06 Amendments to the LU and DLR Byelaws
Howard Carter introduced the report which informed the Panel that TfL was in the process of revising the Byelaws applicable to LU and DLR to make them consistent with those applying elsewhere on the national railways. The report before the Panel outlined the main changes to the byelaws and Tim O’Toole invited comments from Members.
There being no comments from Members, the Panel noted:
(a) the proposed changes to the LU and DLR Byelaws; and,
(b) that following consideration of consultation responses the Byelaws would be submitted to the October 2006 Board meeting for approval.
24/10/06 Any Other Business
There being no further business the meeting closed.
Signed:_____________________________________________ (Chair)
Page 1 of 1
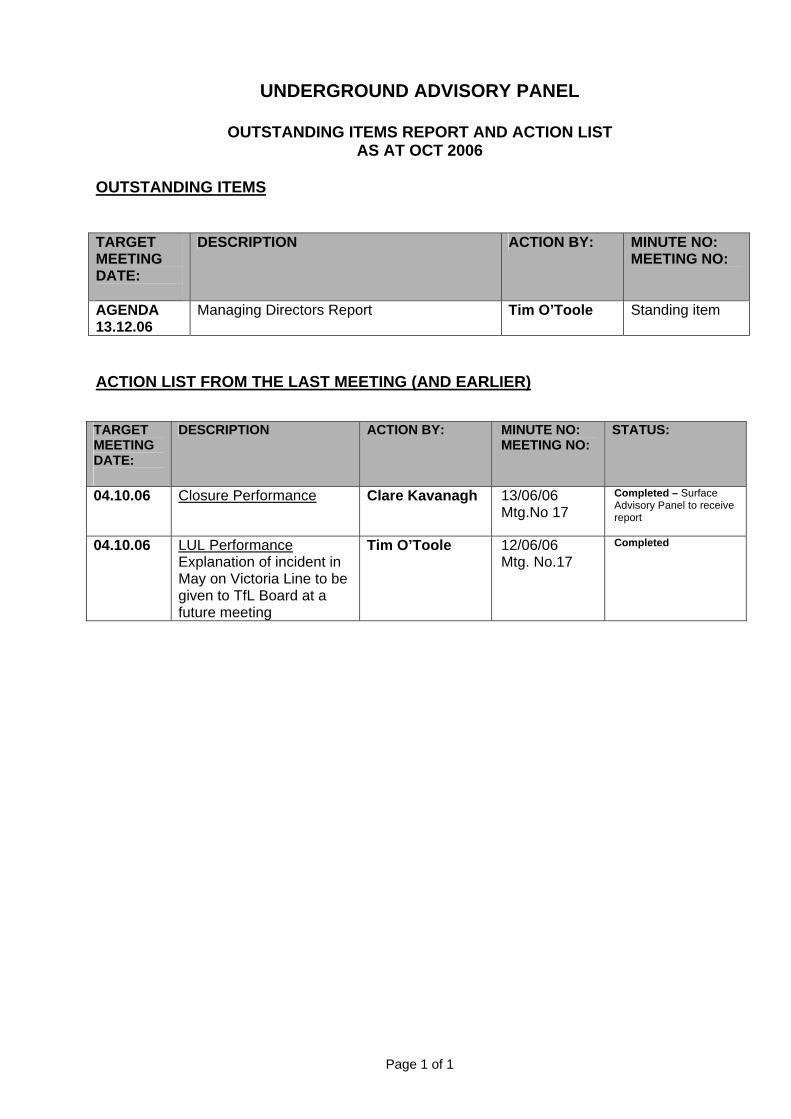
UNDERGROUND ADVISORY PANEL
OUTSTANDING ITEMS REPORT AND ACTION LIST AS AT OCT 2006
OUTSTANDING ITEMS TARGET MEETING DATE:
DESCRIPTION ACTION BY: MINUTE NO: MEETING NO:
AGENDA 13.12.06
Managing Directors Report
Tim O’Toole
Standing item
ACTION LIST FROM THE LAST MEETING (AND EARLIER) TARGET MEETING DATE:
DESCRIPTION ACTION BY: MINUTE NO: MEETING NO:
STATUS:
04.10.06 Closure Performance Clare Kavanagh 13/06/06 Mtg.No 17
Completed – Surface Advisory Panel to receive report
04.10.06 LUL Performance Explanation of incident in May on Victoria Line to be given to TfL Board at a future meeting
Tim O’Toole 12/06/06 Mtg. No.17
Completed
To Period 7 2006/07, ended 14 October 2006
London Underground Limited
Managing Director's Performance ReportTo the Underground Advisory Panel
30 November 2006
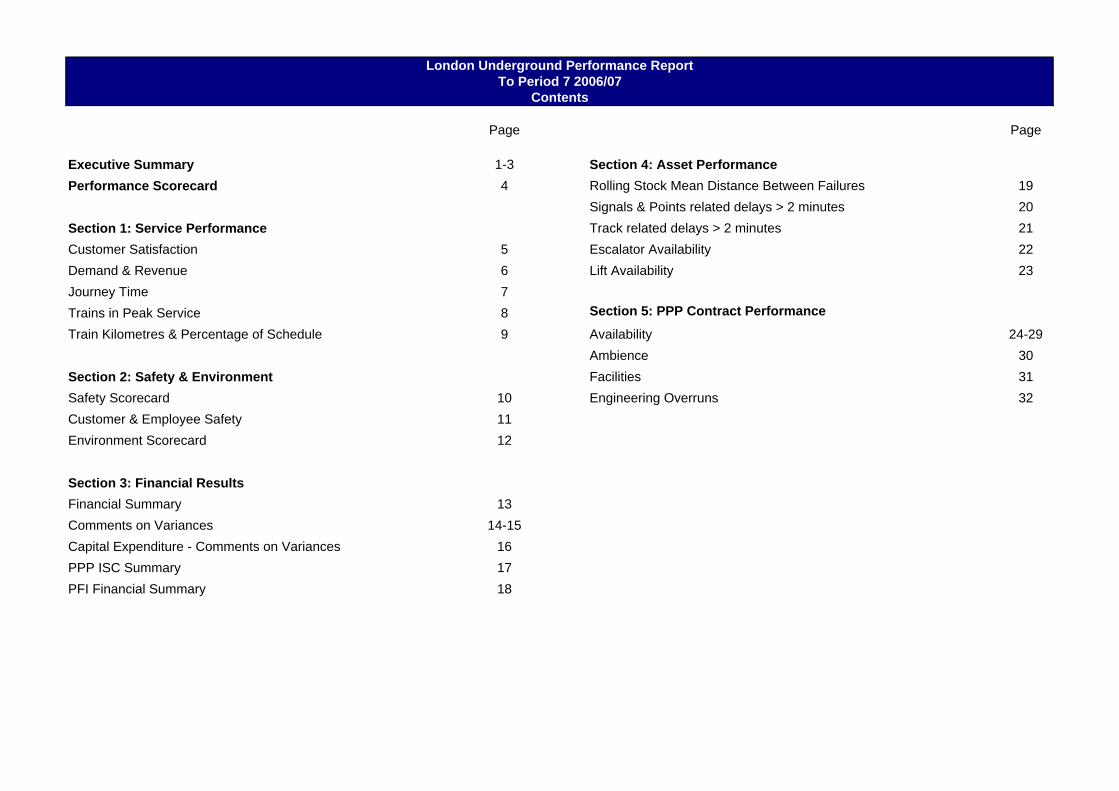
Page Page
Executive Summary 1-3 Section 4: Asset PerformancePerformance Scorecard 4 Rolling Stock Mean Distance Between Failures 19
Signals & Points related delays > 2 minutes 20Section 1: Service Performance Track related delays > 2 minutes 21Customer Satisfaction 5 Escalator Availability 22Demand & Revenue 6 Lift Availability 23Journey Time 7Trains in Peak Service 8 Section 5: PPP Contract Performance
Train Kilometres & Percentage of Schedule 9 Availability 24-29Ambience 30
Section 2: Safety & Environment Facilities 31Safety Scorecard 10 Engineering Overruns 32Customer & Employee Safety 11Environment Scorecard 12
Section 3: Financial ResultsFinancial Summary 13Comments on Variances 14-15Capital Expenditure - Comments on Variances 16PPP ISC Summary 17PFI Financial Summary 18
London Underground Performance ReportTo Period 7 2006/07
Contents
Page 1
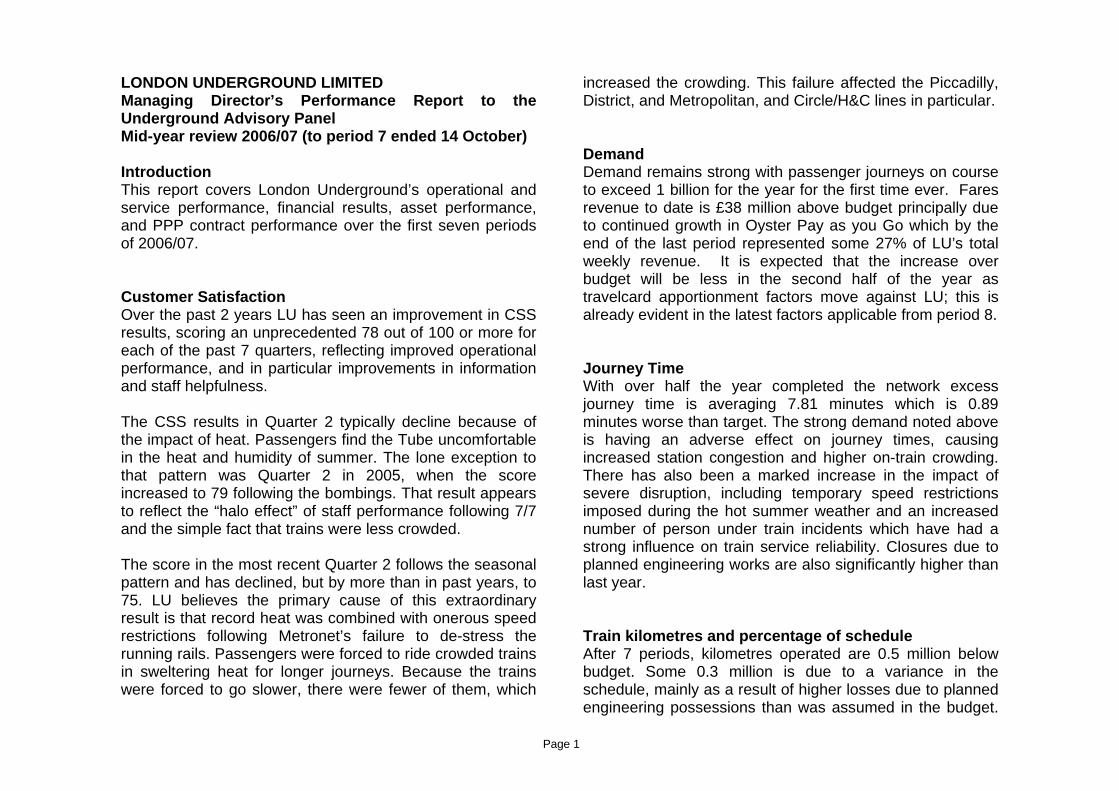
LONDON UNDERGROUND LIMITED Managing Director’s Performance Report to the Underground Advisory Panel Mid-year review 2006/07 (to period 7 ended 14 October) Introduction This report covers London Underground’s operational and service performance, financial results, asset performance, and PPP contract performance over the first seven periods of 2006/07. Customer Satisfaction Over the past 2 years LU has seen an improvement in CSS results, scoring an unprecedented 78 out of 100 or more for each of the past 7 quarters, reflecting improved operational performance, and in particular improvements in information and staff helpfulness. The CSS results in Quarter 2 typically decline because of the impact of heat. Passengers find the Tube uncomfortable in the heat and humidity of summer. The lone exception to that pattern was Quarter 2 in 2005, when the score increased to 79 following the bombings. That result appears to reflect the “halo effect” of staff performance following 7/7 and the simple fact that trains were less crowded. The score in the most recent Quarter 2 follows the seasonal pattern and has declined, but by more than in past years, to 75. LU believes the primary cause of this extraordinary result is that record heat was combined with onerous speed restrictions following Metronet’s failure to de-stress the running rails. Passengers were forced to ride crowded trains in sweltering heat for longer journeys. Because the trains were forced to go slower, there were fewer of them, which
increased the crowding. This failure affected the Piccadilly, District, and Metropolitan, and Circle/H&C lines in particular. Demand Demand remains strong with passenger journeys on course to exceed 1 billion for the year for the first time ever. Fares revenue to date is £38 million above budget principally due to continued growth in Oyster Pay as you Go which by the end of the last period represented some 27% of LU’s total weekly revenue. It is expected that the increase over budget will be less in the second half of the year as travelcard apportionment factors move against LU; this is already evident in the latest factors applicable from period 8. Journey Time With over half the year completed the network excess journey time is averaging 7.81 minutes which is 0.89 minutes worse than target. The strong demand noted above is having an adverse effect on journey times, causing increased station congestion and higher on-train crowding. There has also been a marked increase in the impact of severe disruption, including temporary speed restrictions imposed during the hot summer weather and an increased number of person under train incidents which have had a strong influence on train service reliability. Closures due to planned engineering works are also significantly higher than last year. Train kilometres and percentage of schedule After 7 periods, kilometres operated are 0.5 million below budget. Some 0.3 million is due to a variance in the schedule, mainly as a result of higher losses due to planned engineering possessions than was assumed in the budget.
Page 2
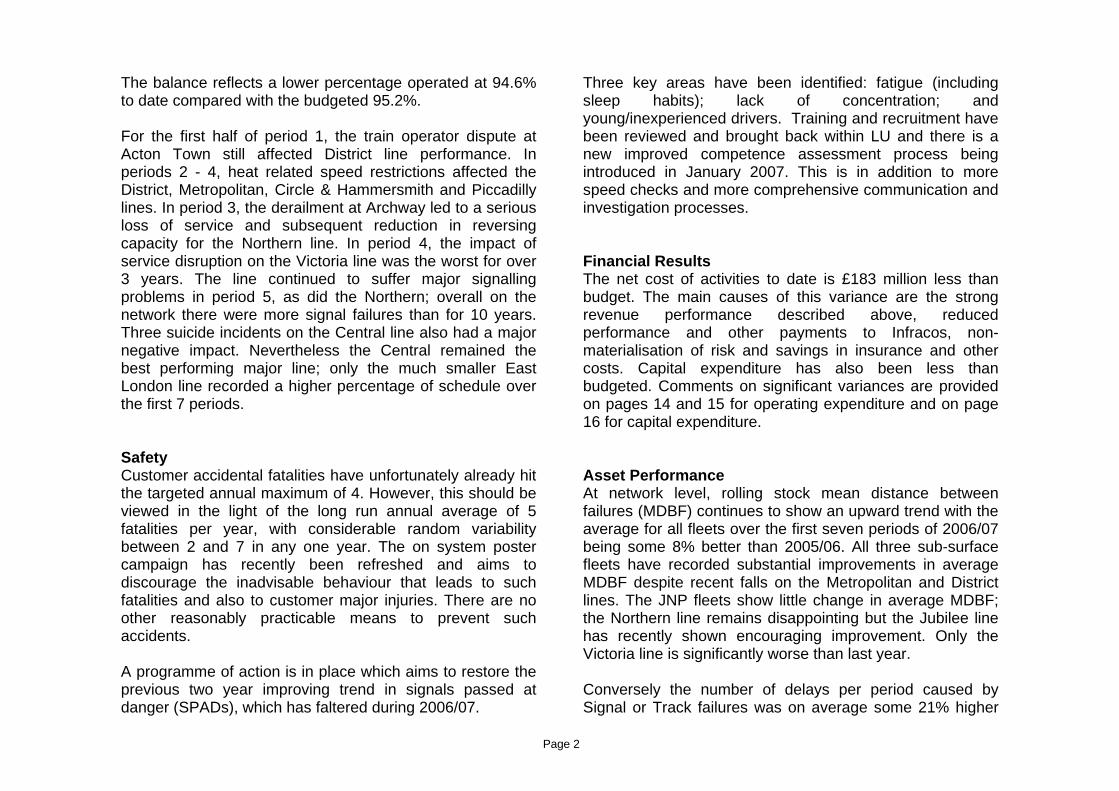
The balance reflects a lower percentage operated at 94.6% to date compared with the budgeted 95.2%. For the first half of period 1, the train operator dispute at Acton Town still affected District line performance. In periods 2 - 4, heat related speed restrictions affected the District, Metropolitan, Circle & Hammersmith and Piccadilly lines. In period 3, the derailment at Archway led to a serious loss of service and subsequent reduction in reversing capacity for the Northern line. In period 4, the impact of service disruption on the Victoria line was the worst for over 3 years. The line continued to suffer major signalling problems in period 5, as did the Northern; overall on the network there were more signal failures than for 10 years. Three suicide incidents on the Central line also had a major negative impact. Nevertheless the Central remained the best performing major line; only the much smaller East London line recorded a higher percentage of schedule over the first 7 periods. Safety Customer accidental fatalities have unfortunately already hit the targeted annual maximum of 4. However, this should be viewed in the light of the long run annual average of 5 fatalities per year, with considerable random variability between 2 and 7 in any one year. The on system poster campaign has recently been refreshed and aims to discourage the inadvisable behaviour that leads to such fatalities and also to customer major injuries. There are no other reasonably practicable means to prevent such accidents. A programme of action is in place which aims to restore the previous two year improving trend in signals passed at danger (SPADs), which has faltered during 2006/07.
Three key areas have been identified: fatigue (including sleep habits); lack of concentration; and young/inexperienced drivers. Training and recruitment have been reviewed and brought back within LU and there is a new improved competence assessment process being introduced in January 2007. This is in addition to more speed checks and more comprehensive communication and investigation processes. Financial Results The net cost of activities to date is £183 million less than budget. The main causes of this variance are the strong revenue performance described above, reduced performance and other payments to Infracos, non-materialisation of risk and savings in insurance and other costs. Capital expenditure has also been less than budgeted. Comments on significant variances are provided on pages 14 and 15 for operating expenditure and on page 16 for capital expenditure. Asset Performance At network level, rolling stock mean distance between failures (MDBF) continues to show an upward trend with the average for all fleets over the first seven periods of 2006/07 being some 8% better than 2005/06. All three sub-surface fleets have recorded substantial improvements in average MDBF despite recent falls on the Metropolitan and District lines. The JNP fleets show little change in average MDBF; the Northern line remains disappointing but the Jubilee line has recently shown encouraging improvement. Only the Victoria line is significantly worse than last year. Conversely the number of delays per period caused by Signal or Track failures was on average some 21% higher
Page 3
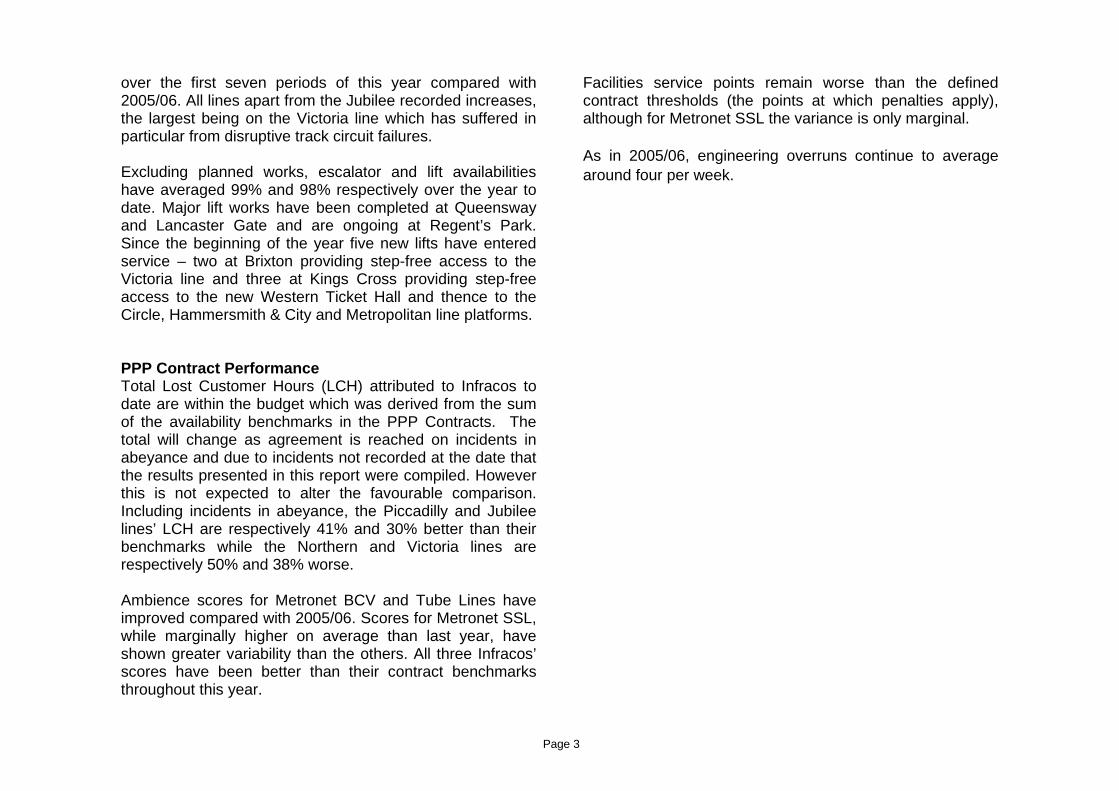
over the first seven periods of this year compared with 2005/06. All lines apart from the Jubilee recorded increases, the largest being on the Victoria line which has suffered in particular from disruptive track circuit failures. Excluding planned works, escalator and lift availabilities have averaged 99% and 98% respectively over the year to date. Major lift works have been completed at Queensway and Lancaster Gate and are ongoing at Regent’s Park. Since the beginning of the year five new lifts have entered service – two at Brixton providing step-free access to the Victoria line and three at Kings Cross providing step-free access to the new Western Ticket Hall and thence to the Circle, Hammersmith & City and Metropolitan line platforms. PPP Contract Performance Total Lost Customer Hours (LCH) attributed to Infracos to date are within the budget which was derived from the sum of the availability benchmarks in the PPP Contracts. The total will change as agreement is reached on incidents in abeyance and due to incidents not recorded at the date that the results presented in this report were compiled. However this is not expected to alter the favourable comparison. Including incidents in abeyance, the Piccadilly and Jubilee lines’ LCH are respectively 41% and 30% better than their benchmarks while the Northern and Victoria lines are respectively 50% and 38% worse. Ambience scores for Metronet BCV and Tube Lines have improved compared with 2005/06. Scores for Metronet SSL, while marginally higher on average than last year, have shown greater variability than the others. All three Infracos’ scores have been better than their contract benchmarks throughout this year.
Facilities service points remain worse than the defined contract thresholds (the points at which penalties apply), although for Metronet SSL the variance is only marginal. As in 2005/06, engineering overruns continue to average around four per week.
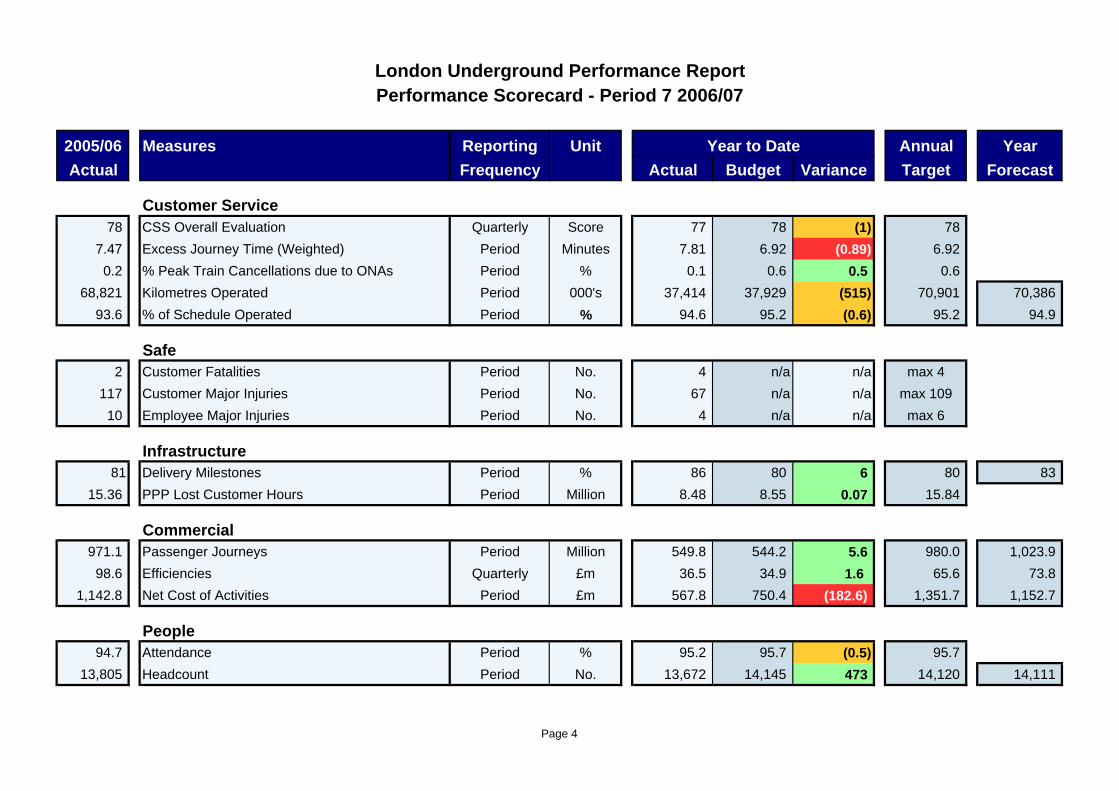
2005/06 Measures Reporting Unit Annual YearActual Frequency Actual Budget Variance Target Forecast
Customer Service78 CSS Overall Evaluation Quarterly Score 77 78 (1) 78
7.47 Excess Journey Time (Weighted) Period Minutes 7.81 6.92 (0.89) 6.92 0.2 % Peak Train Cancellations due to ONAs Period % 0.1 0.6 0.5 0.6
68,821 Kilometres Operated Period 000's 37,414 37,929 (515) 70,901 70,386 93.6 % of Schedule Operated Period % 94.6 95.2 (0.6) 95.2 94.9
Safe2 Customer Fatalities Period No. 4 n/a n/a max 4
117 Customer Major Injuries Period No. 67 n/a n/a max 10910 Employee Major Injuries Period No. 4 n/a n/a max 6
Infrastructure81 Delivery Milestones Period % 86 80 6 80 83
15.36 PPP Lost Customer Hours Period Million 8.48 8.55 0.07 15.84
Commercial971.1 Passenger Journeys Period Million 549.8 544.2 5.6 980.0 1,023.9
98.6 Efficiencies Quarterly £m 36.5 34.9 1.6 65.6 73.8 1,142.8 Net Cost of Activities Period £m 567.8 750.4 (182.6) 1,351.7 1,152.7
People94.7 Attendance Period % 95.2 95.7 (0.5) 95.7
13,805 Headcount Period No. 13,672 14,145 473 14,120 14,111
London Underground Performance ReportPerformance Scorecard - Period 7 2006/07
Year to Date
Page 4
Service PerformanceSection 1
Customer Satisfaction Survey: System Service Group Scores
2005/06 2005/06 2005/06 2006/07 2006/07Qtr 2 Qtr 3 Qtr 4 Qtr 1 Qtr 2
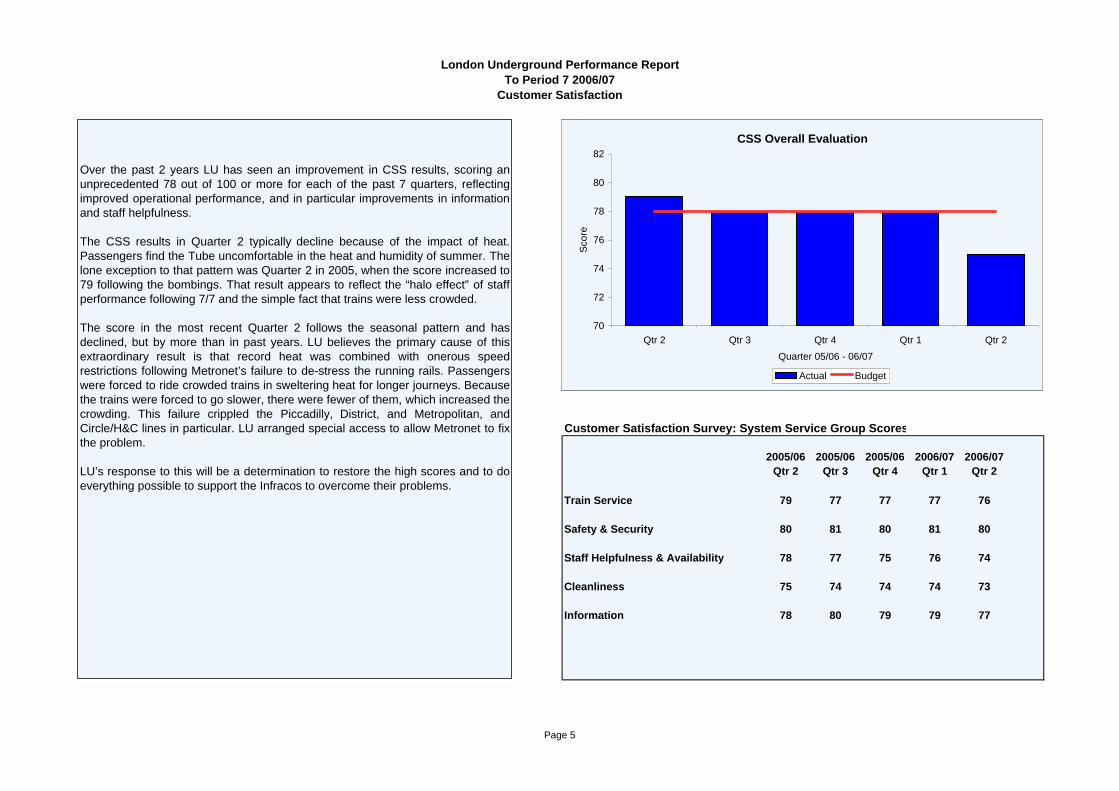
Train Service 79 77 77 77 76
Safety & Security 80 81 80 81 80
Staff Helpfulness & Availability 78 77 75 76 74
Cleanliness 75 74 74 74 73
Information 78 80 79 79 77
Customer Satisfaction
London Underground Performance ReportTo Period 7 2006/07
Over the past 2 years LU has seen an improvement in CSS results, scoring anunprecedented 78 out of 100 or more for each of the past 7 quarters, reflectingimproved operational performance, and in particular improvements in informationand staff helpfulness.
The CSS results in Quarter 2 typically decline because of the impact of heat.Passengers find the Tube uncomfortable in the heat and humidity of summer. Thelone exception to that pattern was Quarter 2 in 2005, when the score increased to79 following the bombings. That result appears to reflect the “halo effect” of staffperformance following 7/7 and the simple fact that trains were less crowded.
The score in the most recent Quarter 2 follows the seasonal pattern and hasdeclined, but by more than in past years. LU believes the primary cause of thisextraordinary result is that record heat was combined with onerous speedrestrictions following Metronet’s failure to de-stress the running rails. Passengerswere forced to ride crowded trains in sweltering heat for longer journeys. Becausethe trains were forced to go slower, there were fewer of them, which increased thecrowding. This failure crippled the Piccadilly, District, and Metropolitan, andCircle/H&C lines in particular. LU arranged special access to allow Metronet to fixthe problem.
LU’s response to this will be a determination to restore the high scores and to doeverything possible to support the Infracos to overcome their problems.
CSS Overall Evaluation
70
72
74
76
78
80
82
Qtr 2 Qtr 3 Qtr 4 Qtr 1 Qtr 2Quarter 05/06 - 06/07
Scor
e
Actual Budget
Page 5
Demand and Revenue
London Underground Performance ReportTo Period 7 2006/07
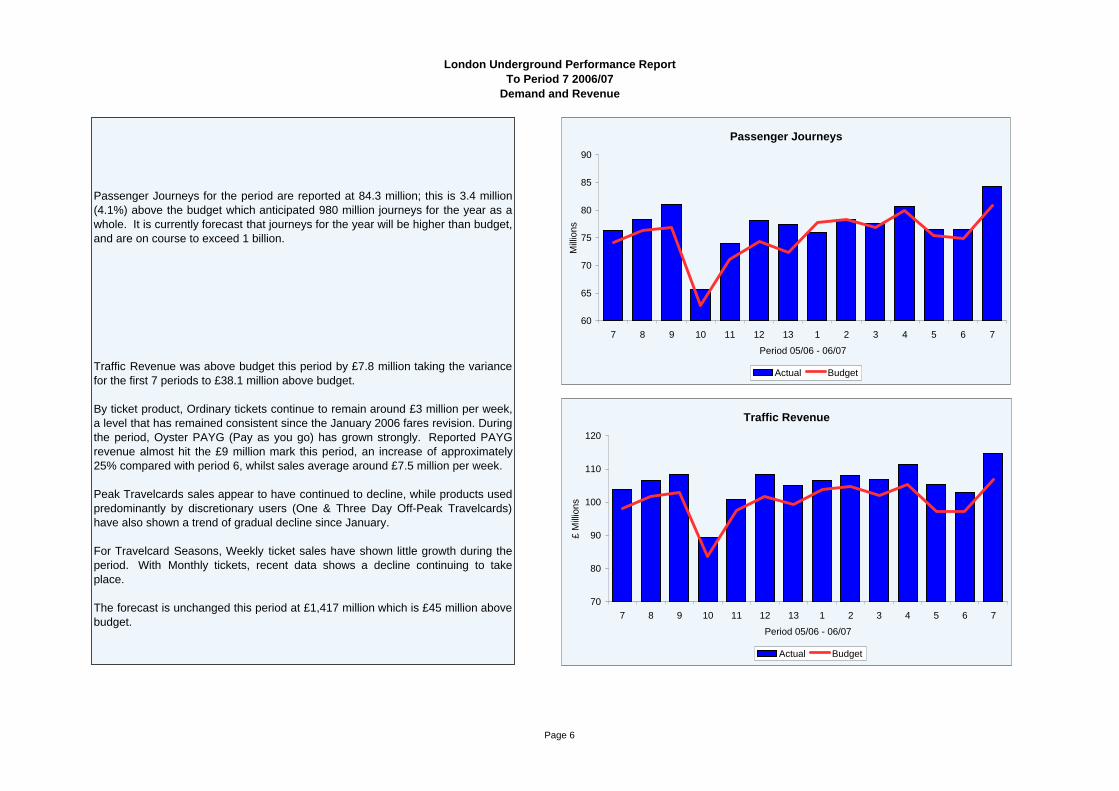
Passenger Journeys for the period are reported at 84.3 million; this is 3.4 million(4.1%) above the budget which anticipated 980 million journeys for the year as awhole. It is currently forecast that journeys for the year will be higher than budget,and are on course to exceed 1 billion.
Traffic Revenue was above budget this period by £7.8 million taking the variancefor the first 7 periods to £38.1 million above budget. By ticket product, Ordinary tickets continue to remain around £3 million per week,a level that has remained consistent since the January 2006 fares revision. Duringthe period, Oyster PAYG (Pay as you go) has grown strongly. Reported PAYGrevenue almost hit the £9 million mark this period, an increase of approximately25% compared with period 6, whilst sales average around £7.5 million per week.
Peak Travelcards sales appear to have continued to decline, while products usedpredominantly by discretionary users (One & Three Day Off-Peak Travelcards)have also shown a trend of gradual decline since January. For Travelcard Seasons, Weekly ticket sales have shown little growth during theperiod. With Monthly tickets, recent data shows a decline continuing to takeplace.
The forecast is unchanged this period at £1,417 million which is £45 million abovebudget.
Passenger Journeys
60
65
70
75
80
85
90
7 8 9 10 11 12 13 1 2 3 4 5 6 7
Period 05/06 - 06/07
Milli
ons
Actual Budget
Traffic Revenue
70
80
90
100
110
120
7 8 9 10 11 12 13 1 2 3 4 5 6 7
Period 05/06 - 06/07
£ M
illion
s
Actual Budget
Page 6
Excess Journey Time by Element (minutes)Period 6 Period 7 Budget Variance
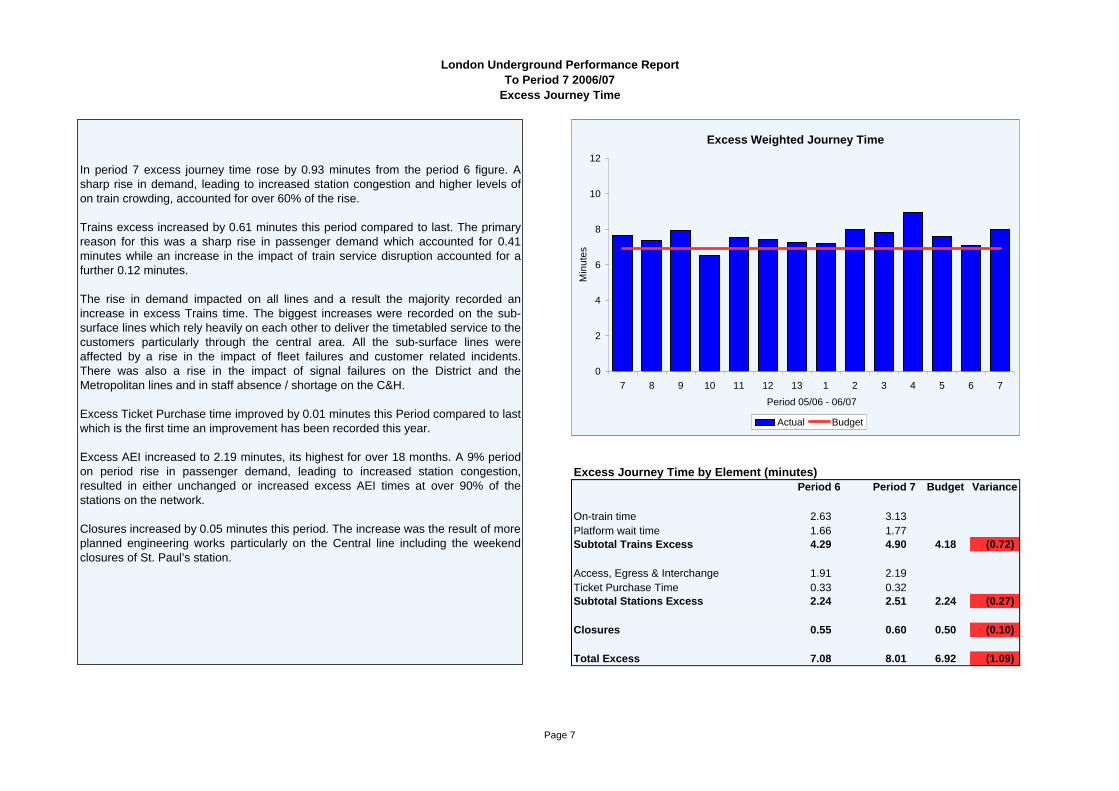
On-train time 2.63 3.13Platform wait time 1.66 1.77Subtotal Trains Excess 4.29 4.90 4.18 (0.72)
Access, Egress & Interchange 1.91 2.19Ticket Purchase Time 0.33 0.32Subtotal Stations Excess 2.24 2.51 2.24 (0.27)
Closures 0.55 0.60 0.50 (0.10)
Total Excess 7.08 8.01 6.92 (1.09)
Excess Journey Time
London Underground Performance ReportTo Period 7 2006/07
In period 7 excess journey time rose by 0.93 minutes from the period 6 figure. Asharp rise in demand, leading to increased station congestion and higher levels ofon train crowding, accounted for over 60% of the rise.
Trains excess increased by 0.61 minutes this period compared to last. The primaryreason for this was a sharp rise in passenger demand which accounted for 0.41minutes while an increase in the impact of train service disruption accounted for afurther 0.12 minutes.
The rise in demand impacted on all lines and a result the majority recorded anincrease in excess Trains time. The biggest increases were recorded on the sub-surface lines which rely heavily on each other to deliver the timetabled service to thecustomers particularly through the central area. All the sub-surface lines wereaffected by a rise in the impact of fleet failures and customer related incidents.There was also a rise in the impact of signal failures on the District and theMetropolitan lines and in staff absence / shortage on the C&H.
Excess Ticket Purchase time improved by 0.01 minutes this Period compared to lastwhich is the first time an improvement has been recorded this year.
Excess AEI increased to 2.19 minutes, its highest for over 18 months. A 9% periodon period rise in passenger demand, leading to increased station congestion,resulted in either unchanged or increased excess AEI times at over 90% of thestations on the network.
Closures increased by 0.05 minutes this period. The increase was the result of moreplanned engineering works particularly on the Central line including the weekendclosures of St. Paul’s station.
Excess Weighted Journey Time
0
2
4
6
8
10
12
7 8 9 10 11 12 13 1 2 3 4 5 6 7Period 05/06 - 06/07
Min
utes
Actual Budget
Page 7
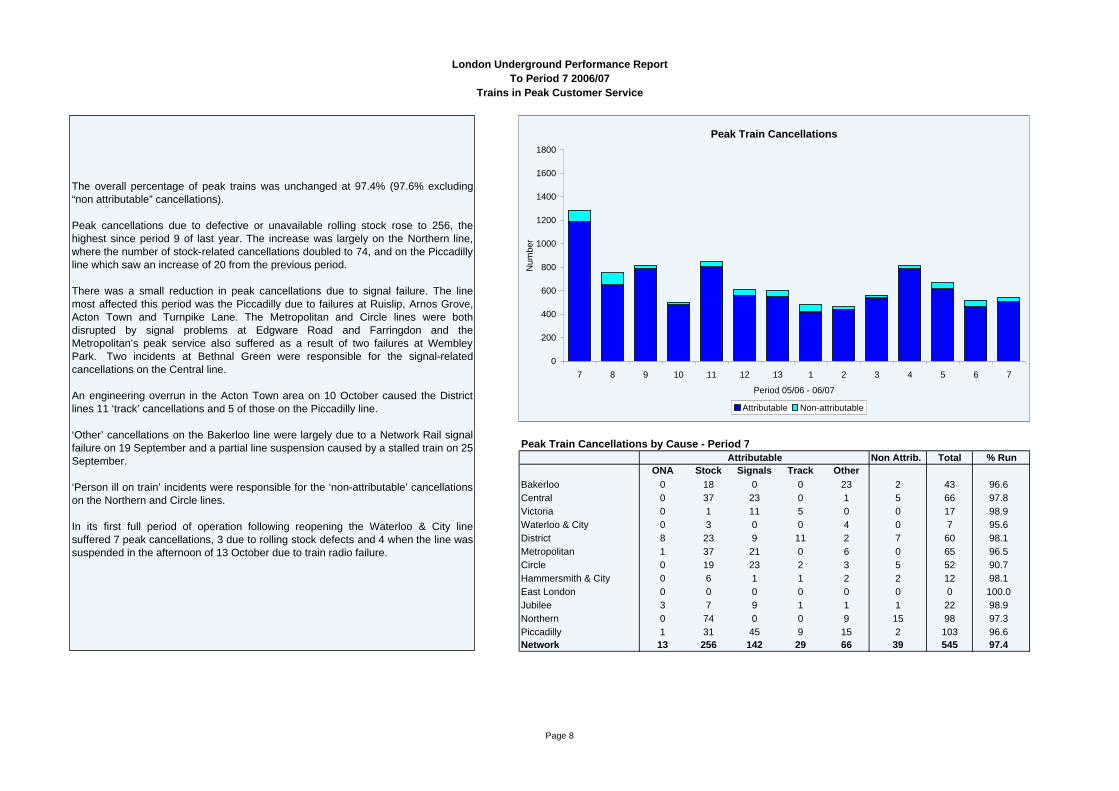
Peak Train Cancellations by Cause - Period 7Attributable Non Attrib. Total % Run
ONA Stock Signals Track OtherBakerloo 0 18 0 0 23 2 43 96.6 Central 0 37 23 0 1 5 66 97.8 Victoria 0 1 11 5 0 0 17 98.9 Waterloo & City 0 3 0 0 4 0 7 95.6 District 8 23 9 11 2 7 60 98.1 Metropolitan 1 37 21 0 6 0 65 96.5 Circle 0 19 23 2 3 5 52 90.7 Hammersmith & City 0 6 1 1 2 2 12 98.1 East London 0 0 0 0 0 0 0 100.0 Jubilee 3 7 9 1 1 1 22 98.9 Northern 0 74 0 0 9 15 98 97.3 Piccadilly 1 31 45 9 15 2 103 96.6 Network 13 256 142 29 66 39 545 97.4
Trains in Peak Customer Service
London Underground Performance ReportTo Period 7 2006/07
The overall percentage of peak trains was unchanged at 97.4% (97.6% excluding“non attributable” cancellations).
Peak cancellations due to defective or unavailable rolling stock rose to 256, thehighest since period 9 of last year. The increase was largely on the Northern line,where the number of stock-related cancellations doubled to 74, and on the Piccadillyline which saw an increase of 20 from the previous period.
There was a small reduction in peak cancellations due to signal failure. The linemost affected this period was the Piccadilly due to failures at Ruislip, Arnos Grove,Acton Town and Turnpike Lane. The Metropolitan and Circle lines were bothdisrupted by signal problems at Edgware Road and Farringdon and theMetropolitan’s peak service also suffered as a result of two failures at WembleyPark. Two incidents at Bethnal Green were responsible for the signal-relatedcancellations on the Central line.
An engineering overrun in the Acton Town area on 10 October caused the Districtlines 11 ‘track’ cancellations and 5 of those on the Piccadilly line.
‘Other’ cancellations on the Bakerloo line were largely due to a Network Rail signalfailure on 19 September and a partial line suspension caused by a stalled train on 25September.
‘Person ill on train’ incidents were responsible for the ‘non-attributable’ cancellationson the Northern and Circle lines.
In its first full period of operation following reopening the Waterloo & City linesuffered 7 peak cancellations, 3 due to rolling stock defects and 4 when the line wassuspended in the afternoon of 13 October due to train radio failure.
Peak Train Cancellations
0
200
400
600
800
1000
1200
1400
1600
1800
7 8 9 10 11 12 13 1 2 3 4 5 6 7
Period 05/06 - 06/07
Num
ber
Attributable Non-attributable
Page 8
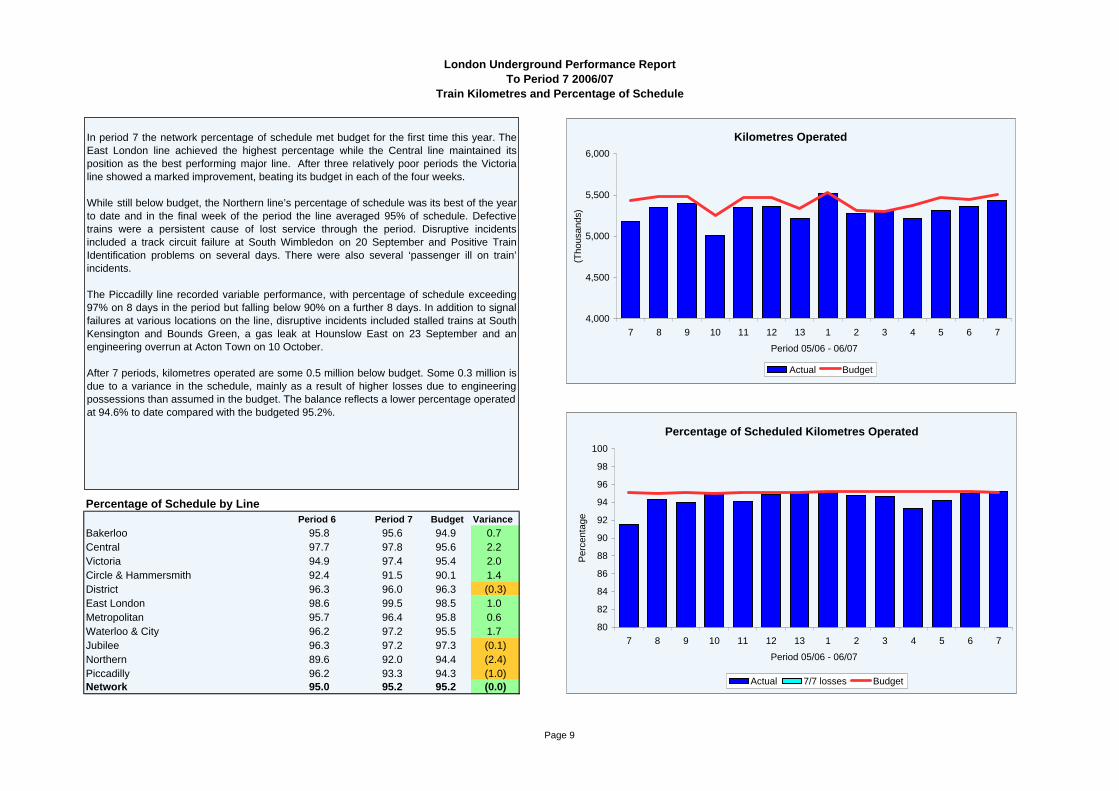
Percentage of Schedule by LinePeriod 6 Period 7 Budget Variance
Bakerloo 95.8 95.6 94.9 0.7 Central 97.7 97.8 95.6 2.2 Victoria 94.9 97.4 95.4 2.0 Circle & Hammersmith 92.4 91.5 90.1 1.4 District 96.3 96.0 96.3 (0.3)East London 98.6 99.5 98.5 1.0 Metropolitan 95.7 96.4 95.8 0.6 Waterloo & City 96.2 97.2 95.5 1.7 Jubilee 96.3 97.2 97.3 (0.1)Northern 89.6 92.0 94.4 (2.4)Piccadilly 96.2 93.3 94.3 (1.0)Network 95.0 95.2 95.2 (0.0)
Train Kilometres and Percentage of Schedule
London Underground Performance ReportTo Period 7 2006/07
In period 7 the network percentage of schedule met budget for the first time this year. TheEast London line achieved the highest percentage while the Central line maintained itsposition as the best performing major line. After three relatively poor periods the Victorialine showed a marked improvement, beating its budget in each of the four weeks.
While still below budget, the Northern line’s percentage of schedule was its best of the yearto date and in the final week of the period the line averaged 95% of schedule. Defectivetrains were a persistent cause of lost service through the period. Disruptive incidentsincluded a track circuit failure at South Wimbledon on 20 September and Positive TrainIdentification problems on several days. There were also several ‘passenger ill on train’incidents.
The Piccadilly line recorded variable performance, with percentage of schedule exceeding97% on 8 days in the period but falling below 90% on a further 8 days. In addition to signalfailures at various locations on the line, disruptive incidents included stalled trains at SouthKensington and Bounds Green, a gas leak at Hounslow East on 23 September and anengineering overrun at Acton Town on 10 October.
After 7 periods, kilometres operated are some 0.5 million below budget. Some 0.3 million isdue to a variance in the schedule, mainly as a result of higher losses due to engineeringpossessions than assumed in the budget. The balance reflects a lower percentage operated at 94.6% to date compared with the budgeted 95.2%.
Kilometres Operated
4,000
4,500
5,000
5,500
6,000
7 8 9 10 11 12 13 1 2 3 4 5 6 7
Period 05/06 - 06/07
(Tho
usan
ds)
Actual Budget
Percentage of Scheduled Kilometres Operated
80
82
84
86
88
90
92
94
96
98
100
7 8 9 10 11 12 13 1 2 3 4 5 6 7
Period 05/06 - 06/07
Per
cent
age
Actual 7/7 losses Budget
Page 9
Safety & EnvironmentSection 2
Measures Reporting Unit AnnualFrequency Actual Budget Variance Target
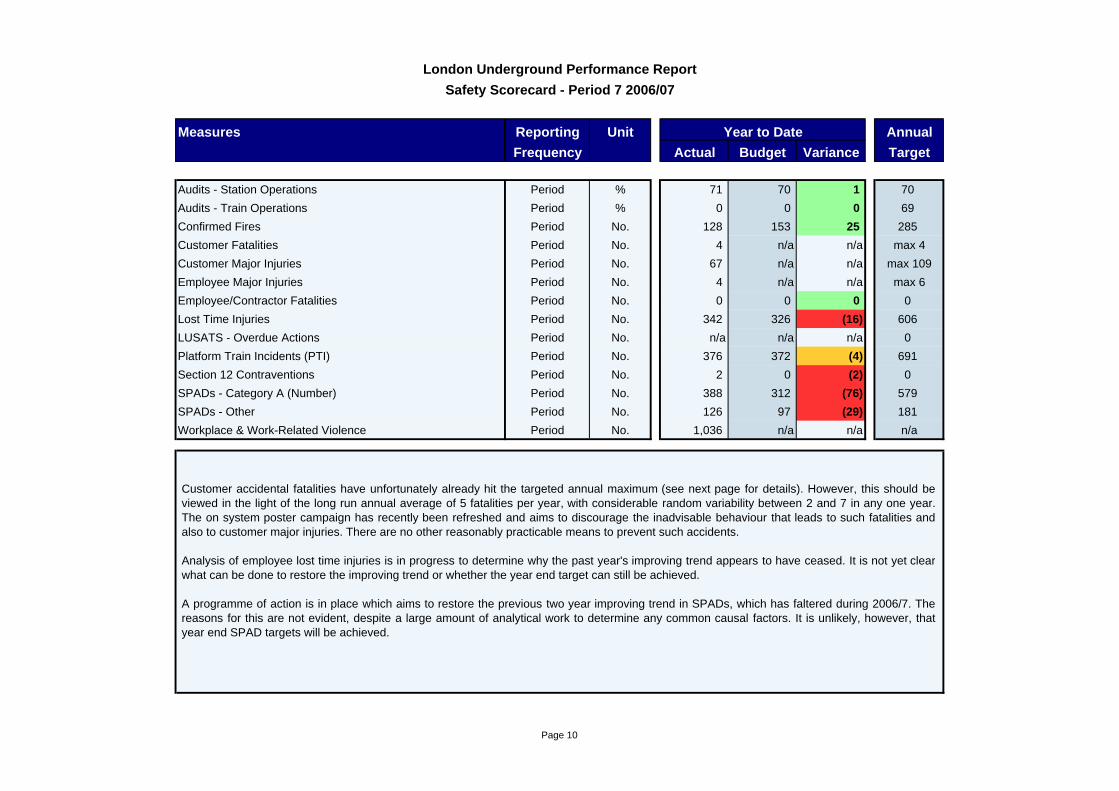
Audits - Station Operations Period % 71 70 1 70 Audits - Train Operations Period % 0 0 0 69 Confirmed Fires Period No. 128 153 25 285 Customer Fatalities Period No. 4 n/a n/a max 4Customer Major Injuries Period No. 67 n/a n/a max 109Employee Major Injuries Period No. 4 n/a n/a max 6Employee/Contractor Fatalities Period No. 0 0 0 0 Lost Time Injuries Period No. 342 326 (16) 606 LUSATS - Overdue Actions Period No. n/a n/a n/a 0 Platform Train Incidents (PTI) Period No. 376 372 (4) 691 Section 12 Contraventions Period No. 2 0 (2) 0 SPADs - Category A (Number) Period No. 388 312 (76) 579 SPADs - Other Period No. 126 97 (29) 181 Workplace & Work-Related Violence Period No. 1,036 n/a n/a n/a
London Underground Performance ReportSafety Scorecard - Period 7 2006/07
Year to Date
Customer accidental fatalities have unfortunately already hit the targeted annual maximum (see next page for details). However, this should beviewed in the light of the long run annual average of 5 fatalities per year, with considerable random variability between 2 and 7 in any one year.The on system poster campaign has recently been refreshed and aims to discourage the inadvisable behaviour that leads to such fatalities andalso to customer major injuries. There are no other reasonably practicable means to prevent such accidents. Analysis of employee lost time injuries is in progress to determine why the past year's improving trend appears to have ceased. It is not yet clearwhat can be done to restore the improving trend or whether the year end target can still be achieved. A programme of action is in place which aims to restore the previous two year improving trend in SPADs, which has faltered during 2006/7. Thereasons for this are not evident, despite a large amount of analytical work to determine any common causal factors. It is unlikely, however, thatyear end SPAD targets will be achieved.
Page 10
Customer & Employee Safety
London Underground Performance ReportTo Period 7 2006/07
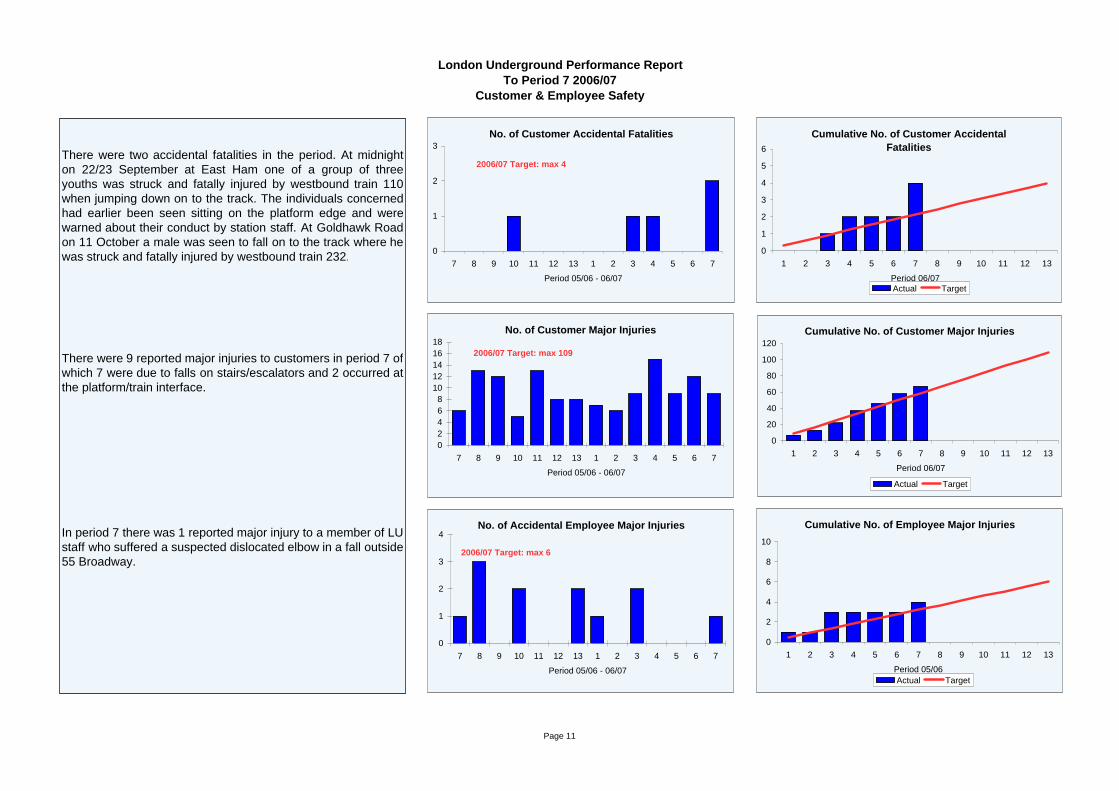
There were two accidental fatalities in the period. At midnighton 22/23 September at East Ham one of a group of threeyouths was struck and fatally injured by westbound train 110when jumping down on to the track. The individuals concernedhad earlier been seen sitting on the platform edge and werewarned about their conduct by station staff. At Goldhawk Roadon 11 October a male was seen to fall on to the track where hewas struck and fatally injured by westbound train 232.
There were 9 reported major injuries to customers in period 7 ofwhich 7 were due to falls on stairs/escalators and 2 occurred atthe platform/train interface.
In period 7 there was 1 reported major injury to a member of LUstaff who suffered a suspected dislocated elbow in a fall outside55 Broadway.
Cumulative No. of Customer Accidental Fatalities
0
1
2
3
4
5
6
1 2 3 4 5 6 7 8 9 10 11 12 13
Period 06/07Actual Target
Cumulative No. of Customer Major Injuries
0
20
40
60
80
100
120
1 2 3 4 5 6 7 8 9 10 11 12 13
Period 06/07
Actual Target
No. of Customer Accidental Fatalities
0
1
2
3
7 8 9 10 11 12 13 1 2 3 4 5 6 7
Period 05/06 - 06/07
No. of Customer Major Injuries
02468
1012141618
7 8 9 10 11 12 13 1 2 3 4 5 6 7
Period 05/06 - 06/07
2006/07 Target: max 109
2006/07 Target: max 4
No. of Accidental Employee Major Injuries
0
1
2
3
4
7 8 9 10 11 12 13 1 2 3 4 5 6 7
Period 05/06 - 06/07
2006/07 Target: max 6
Cumulative No. of Employee Major Injuries
0
2
4
6
8
10
1 2 3 4 5 6 7 8 9 10 11 12 13
Period 05/06Actual Target
Page 11
Measures Reporting Unit AnnualFrequency Actual Budget Variance Target
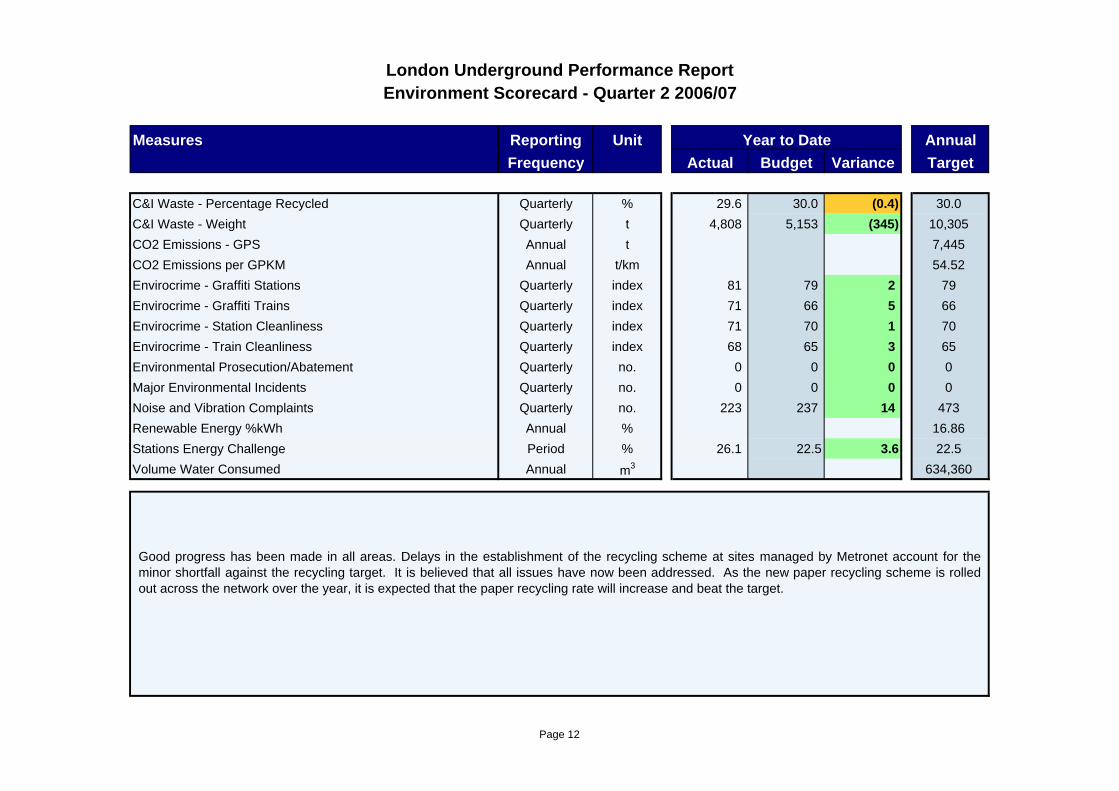
C&I Waste - Percentage Recycled Quarterly % 29.6 30.0 (0.4) 30.0 C&I Waste - Weight Quarterly t 4,808 5,153 (345) 10,305 CO2 Emissions - GPS Annual t 7,445 CO2 Emissions per GPKM Annual t/km 54.52 Envirocrime - Graffiti Stations Quarterly index 81 79 2 79 Envirocrime - Graffiti Trains Quarterly index 71 66 5 66 Envirocrime - Station Cleanliness Quarterly index 71 70 1 70 Envirocrime - Train Cleanliness Quarterly index 68 65 3 65 Environmental Prosecution/Abatement Quarterly no. 0 0 0 0 Major Environmental Incidents Quarterly no. 0 0 0 0 Noise and Vibration Complaints Quarterly no. 223 237 14 473 Renewable Energy %kWh Annual % 16.86 Stations Energy Challenge Period % 26.1 22.5 3.6 22.5 Volume Water Consumed Annual m3 634,360
London Underground Performance ReportEnvironment Scorecard - Quarter 2 2006/07
Year to Date
Good progress has been made in all areas. Delays in the establishment of the recycling scheme at sites managed by Metronet account for theminor shortfall against the recycling target. It is believed that all issues have now been addressed. As the new paper recycling scheme is rolledout across the network over the year, it is expected that the paper recycling rate will increase and beat the target.
Page 12

Financial ResultsSection 3
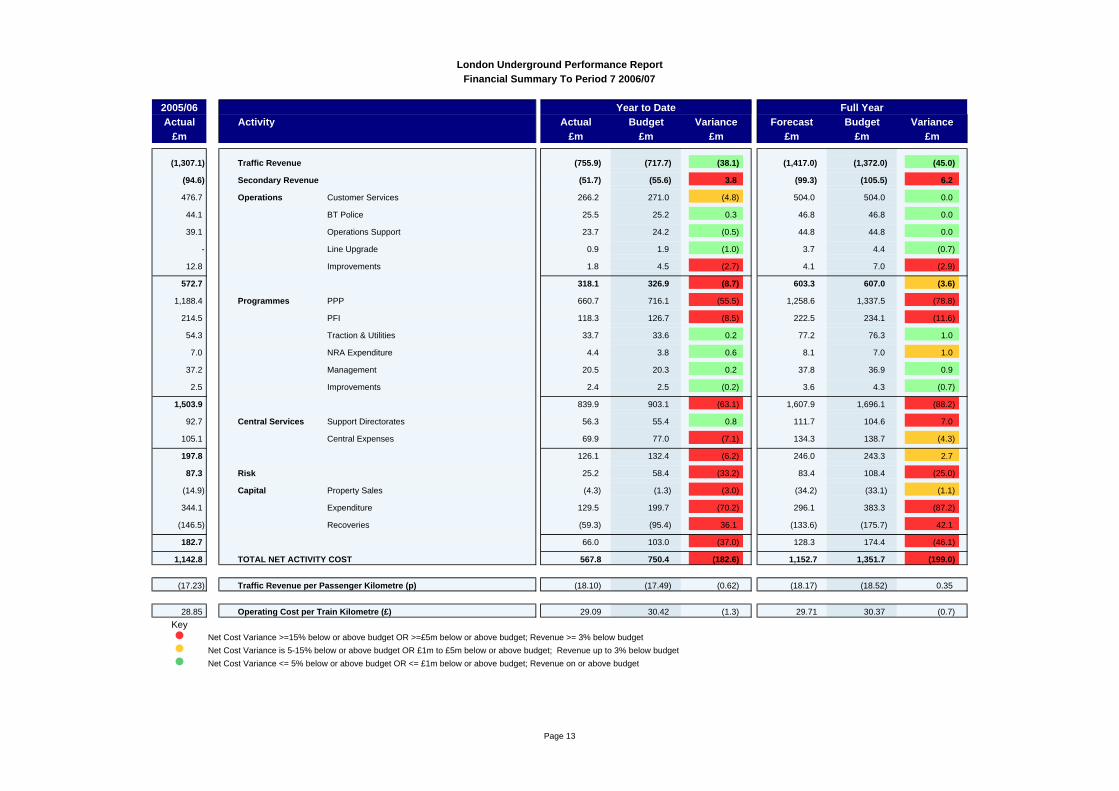
2005/06 Year to Date Full YearActual Activity Actual Budget Variance Forecast Budget Variance
£m £m £m £m £m £m £m
(1,307.1) Traffic Revenue (755.9) (717.7) (38.1) (1,417.0) (1,372.0) (45.0)
(94.6) Secondary Revenue (51.7) (55.6) 3.8 (99.3) (105.5) 6.2
476.7 Operations Customer Services 266.2 271.0 (4.8) 504.0 504.0 0.0
44.1 BT Police 25.5 25.2 0.3 46.8 46.8 0.0
39.1 Operations Support 23.7 24.2 (0.5) 44.8 44.8 0.0
- Line Upgrade 0.9 1.9 (1.0) 3.7 4.4 (0.7)
12.8 Improvements 1.8 4.5 (2.7) 4.1 7.0 (2.9)
572.7 318.1 326.9 (8.7) 603.3 607.0 (3.6)
1,188.4 Programmes PPP 660.7 716.1 (55.5) 1,258.6 1,337.5 (78.8)
214.5 PFI 118.3 126.7 (8.5) 222.5 234.1 (11.6)
54.3 Traction & Utilities 33.7 33.6 0.2 77.2 76.3 1.0
7.0 NRA Expenditure 4.4 3.8 0.6 8.1 7.0 1.0
37.2 Management 20.5 20.3 0.2 37.8 36.9 0.9
2.5 Improvements 2.4 2.5 (0.2) 3.6 4.3 (0.7)
1,503.9 839.9 903.1 (63.1) 1,607.9 1,696.1 (88.2)
92.7 Central Services Support Directorates 56.3 55.4 0.8 111.7 104.6 7.0
105.1 Central Expenses 69.9 77.0 (7.1) 134.3 138.7 (4.3)
197.8 126.1 132.4 (6.2) 246.0 243.3 2.7
87.3 Risk 25.2 58.4 (33.2) 83.4 108.4 (25.0)
(14.9) Capital Property Sales (4.3) (1.3) (3.0) (34.2) (33.1) (1.1)
344.1 Expenditure 129.5 199.7 (70.2) 296.1 383.3 (87.2)
(146.5) Recoveries (59.3) (95.4) 36.1 (133.6) (175.7) 42.1
182.7 66.0 103.0 (37.0) 128.3 174.4 (46.1)
1,142.8 TOTAL NET ACTIVITY COST 567.8 750.4 (182.6) 1,152.7 1,351.7 (199.0)
(17.23) Traffic Revenue per Passenger Kilometre (p) (18.10) (17.49) (0.62) (18.17) (18.52) 0.35
28.85 Operating Cost per Train Kilometre (£) 29.09 30.42 (1.3) 29.71 30.37 (0.7) Key
Net Cost Variance >=15% below or above budget OR >=£5m below or above budget; Revenue >= 3% below budgetNet Cost Variance is 5-15% below or above budget OR £1m to £5m below or above budget; Revenue up to 3% below budgetNet Cost Variance <= 5% below or above budget OR <= £1m below or above budget; Revenue on or above budget
London Underground Performance ReportFinancial Summary To Period 7 2006/07
Page 13
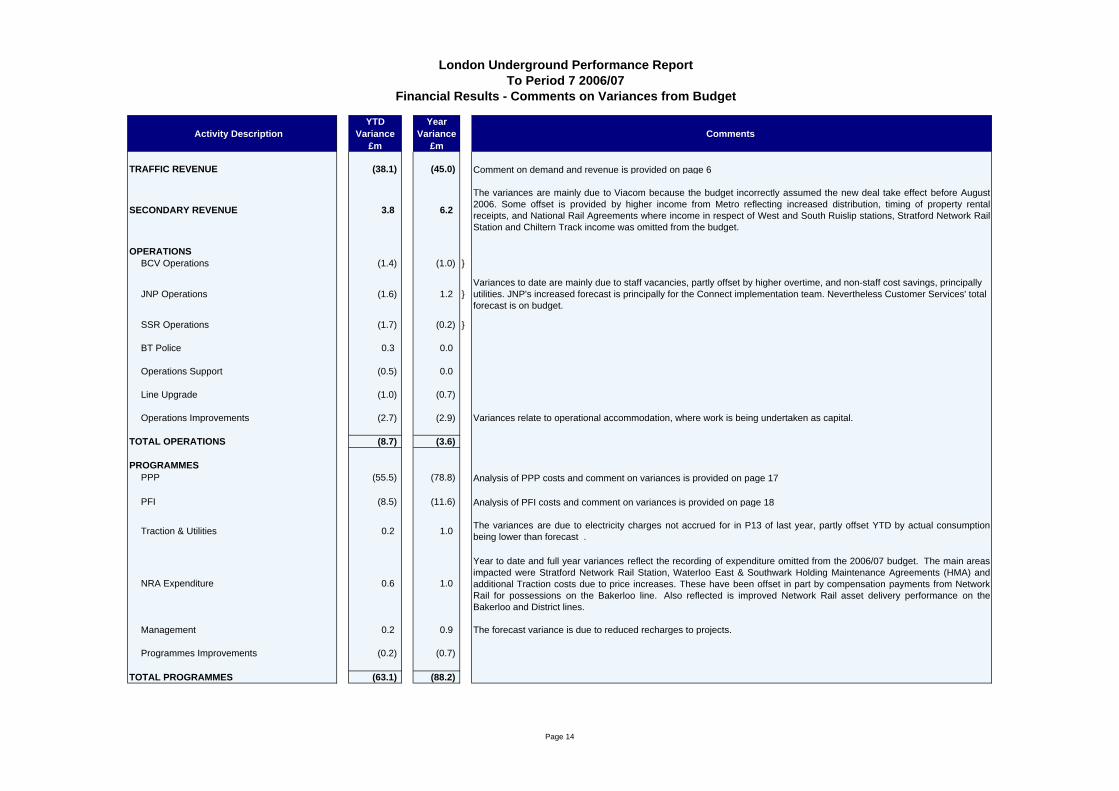
YTD YearActivity Description Variance Variance Comments
£m £m
TRAFFIC REVENUE (38.1) (45.0) Comment on demand and revenue is provided on page 6
SECONDARY REVENUE 3.8 6.2
The variances are mainly due to Viacom because the budget incorrectly assumed the new deal take effect before August2006. Some offset is provided by higher income from Metro reflecting increased distribution, timing of property rentalreceipts, and National Rail Agreements where income in respect of West and South Ruislip stations, Stratford Network RailStation and Chiltern Track income was omitted from the budget.
OPERATIONSBCV Operations (1.4) (1.0) }
JNP Operations (1.6) 1.2 }Variances to date are mainly due to staff vacancies, partly offset by higher overtime, and non-staff cost savings, principally utilities. JNP's increased forecast is principally for the Connect implementation team. Nevertheless Customer Services' total forecast is on budget.
SSR Operations (1.7) (0.2) }
BT Police 0.3 0.0
Operations Support (0.5) 0.0
Line Upgrade (1.0) (0.7)
Operations Improvements (2.7) (2.9) Variances relate to operational accommodation, where work is being undertaken as capital.
TOTAL OPERATIONS (8.7) (3.6)
PROGRAMMESPPP (55.5) (78.8) Analysis of PPP costs and comment on variances is provided on page 17
PFI (8.5) (11.6) Analysis of PFI costs and comment on variances is provided on page 18
Traction & Utilities 0.2 1.0 The variances are due to electricity charges not accrued for in P13 of last year, partly offset YTD by actual consumptionbeing lower than forecast .
NRA Expenditure 0.6 1.0
Year to date and full year variances reflect the recording of expenditure omitted from the 2006/07 budget. The main areasimpacted were Stratford Network Rail Station, Waterloo East & Southwark Holding Maintenance Agreements (HMA) andadditional Traction costs due to price increases. These have been offset in part by compensation payments from NetworkRail for possessions on the Bakerloo line. Also reflected is improved Network Rail asset delivery performance on theBakerloo and District lines.
Management 0.2 0.9 The forecast variance is due to reduced recharges to projects.
Programmes Improvements (0.2) (0.7)
TOTAL PROGRAMMES (63.1) (88.2)
Financial Results - Comments on Variances from Budget
London Underground Performance ReportTo Period 7 2006/07
Page 14
YTD YearActivity Description Variance Variance Comments
£m £m
Financial Results - Comments on Variances from Budget
London Underground Performance ReportTo Period 7 2006/07
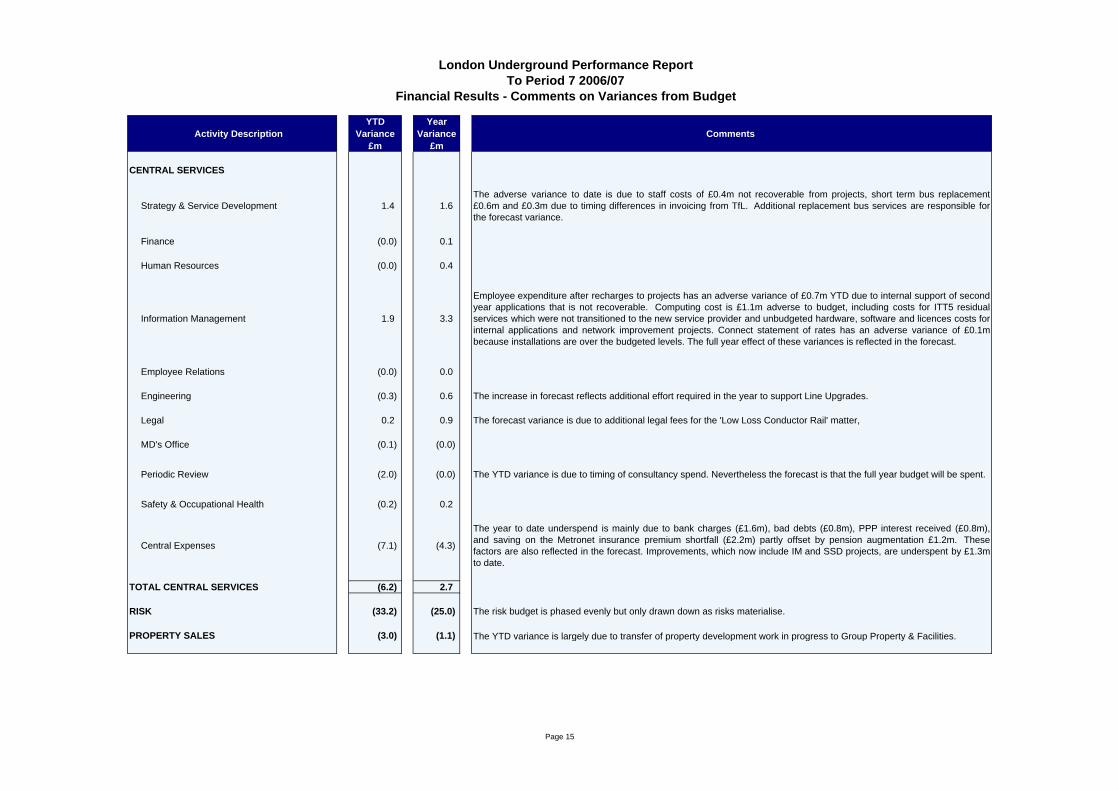
CENTRAL SERVICES
Strategy & Service Development 1.4 1.6 The adverse variance to date is due to staff costs of £0.4m not recoverable from projects, short term bus replacement£0.6m and £0.3m due to timing differences in invoicing from TfL. Additional replacement bus services are responsible forthe forecast variance.
Finance (0.0) 0.1
Human Resources (0.0) 0.4
Information Management 1.9 3.3
Employee expenditure after recharges to projects has an adverse variance of £0.7m YTD due to internal support of secondyear applications that is not recoverable. Computing cost is £1.1m adverse to budget, including costs for ITT5 residualservices which were not transitioned to the new service provider and unbudgeted hardware, software and licences costs forinternal applications and network improvement projects. Connect statement of rates has an adverse variance of £0.1mbecause installations are over the budgeted levels. The full year effect of these variances is reflected in the forecast.
Employee Relations (0.0) 0.0
Engineering (0.3) 0.6 The increase in forecast reflects additional effort required in the year to support Line Upgrades.
Legal 0.2 0.9 The forecast variance is due to additional legal fees for the 'Low Loss Conductor Rail' matter,
MD's Office (0.1) (0.0)
Periodic Review (2.0) (0.0) The YTD variance is due to timing of consultancy spend. Nevertheless the forecast is that the full year budget will be spent.
Safety & Occupational Health (0.2) 0.2
Central Expenses (7.1) (4.3)
The year to date underspend is mainly due to bank charges (£1.6m), bad debts (£0.8m), PPP interest received (£0.8m),and saving on the Metronet insurance premium shortfall (£2.2m) partly offset by pension augmentation £1.2m. Thesefactors are also reflected in the forecast. Improvements, which now include IM and SSD projects, are underspent by £1.3mto date.
TOTAL CENTRAL SERVICES (6.2) 2.7
RISK (33.2) (25.0) The risk budget is phased evenly but only drawn down as risks materialise.
PROPERTY SALES (3.0) (1.1) The YTD variance is largely due to transfer of property development work in progress to Group Property & Facilities.
Page 15
YTD YearActivity Description Variance Variance Comments
£m £m
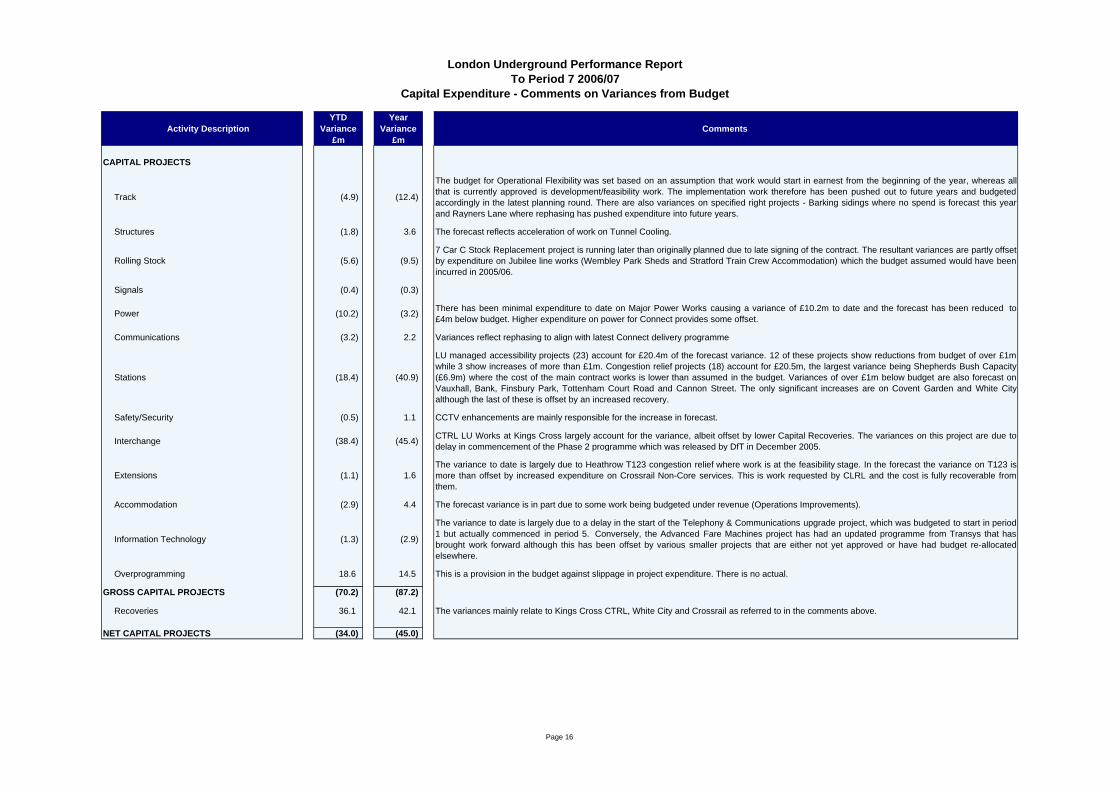
CAPITAL PROJECTS
Track (4.9) (12.4)
The budget for Operational Flexibility was set based on an assumption that work would start in earnest from the beginning of the year, whereas allthat is currently approved is development/feasibility work. The implementation work therefore has been pushed out to future years and budgetedaccordingly in the latest planning round. There are also variances on specified right projects - Barking sidings where no spend is forecast this yearand Rayners Lane where rephasing has pushed expenditure into future years.
Structures (1.8) 3.6 The forecast reflects acceleration of work on Tunnel Cooling.
Rolling Stock (5.6) (9.5) 7 Car C Stock Replacement project is running later than originally planned due to late signing of the contract. The resultant variances are partly offsetby expenditure on Jubilee line works (Wembley Park Sheds and Stratford Train Crew Accommodation) which the budget assumed would have beenincurred in 2005/06.
Signals (0.4) (0.3)
Power (10.2) (3.2) There has been minimal expenditure to date on Major Power Works causing a variance of £10.2m to date and the forecast has been reduced to£4m below budget. Higher expenditure on power for Connect provides some offset.
Communications (3.2) 2.2 Variances reflect rephasing to align with latest Connect delivery programme
Stations (18.4) (40.9)
LU managed accessibility projects (23) account for £20.4m of the forecast variance. 12 of these projects show reductions from budget of over £1mwhile 3 show increases of more than £1m. Congestion relief projects (18) account for £20.5m, the largest variance being Shepherds Bush Capacity(£6.9m) where the cost of the main contract works is lower than assumed in the budget. Variances of over £1m below budget are also forecast onVauxhall, Bank, Finsbury Park, Tottenham Court Road and Cannon Street. The only significant increases are on Covent Garden and White Cityalthough the last of these is offset by an increased recovery.
Safety/Security (0.5) 1.1 CCTV enhancements are mainly responsible for the increase in forecast.
Interchange (38.4) (45.4) CTRL LU Works at Kings Cross largely account for the variance, albeit offset by lower Capital Recoveries. The variances on this project are due todelay in commencement of the Phase 2 programme which was released by DfT in December 2005.
Extensions (1.1) 1.6 The variance to date is largely due to Heathrow T123 congestion relief where work is at the feasibility stage. In the forecast the variance on T123 ismore than offset by increased expenditure on Crossrail Non-Core services. This is work requested by CLRL and the cost is fully recoverable fromthem.
Accommodation (2.9) 4.4 The forecast variance is in part due to some work being budgeted under revenue (Operations Improvements).
Information Technology (1.3) (2.9)
The variance to date is largely due to a delay in the start of the Telephony & Communications upgrade project, which was budgeted to start in period1 but actually commenced in period 5. Conversely, the Advanced Fare Machines project has had an updated programme from Transys that hasbrought work forward although this has been offset by various smaller projects that are either not yet approved or have had budget re-allocatedelsewhere.
Overprogramming 18.6 14.5 This is a provision in the budget against slippage in project expenditure. There is no actual.
GROSS CAPITAL PROJECTS (70.2) (87.2)
Recoveries 36.1 42.1 The variances mainly relate to Kings Cross CTRL, White City and Crossrail as referred to in the comments above.
NET CAPITAL PROJECTS (34.0) (45.0)
Capital Expenditure - Comments on Variances from Budget
London Underground Performance ReportTo Period 7 2006/07
Page 16
2005/06 Year to Date Full YearActual Actual Budget Variance Forecast Budget Variance
£m £m £m £m £m £m £m
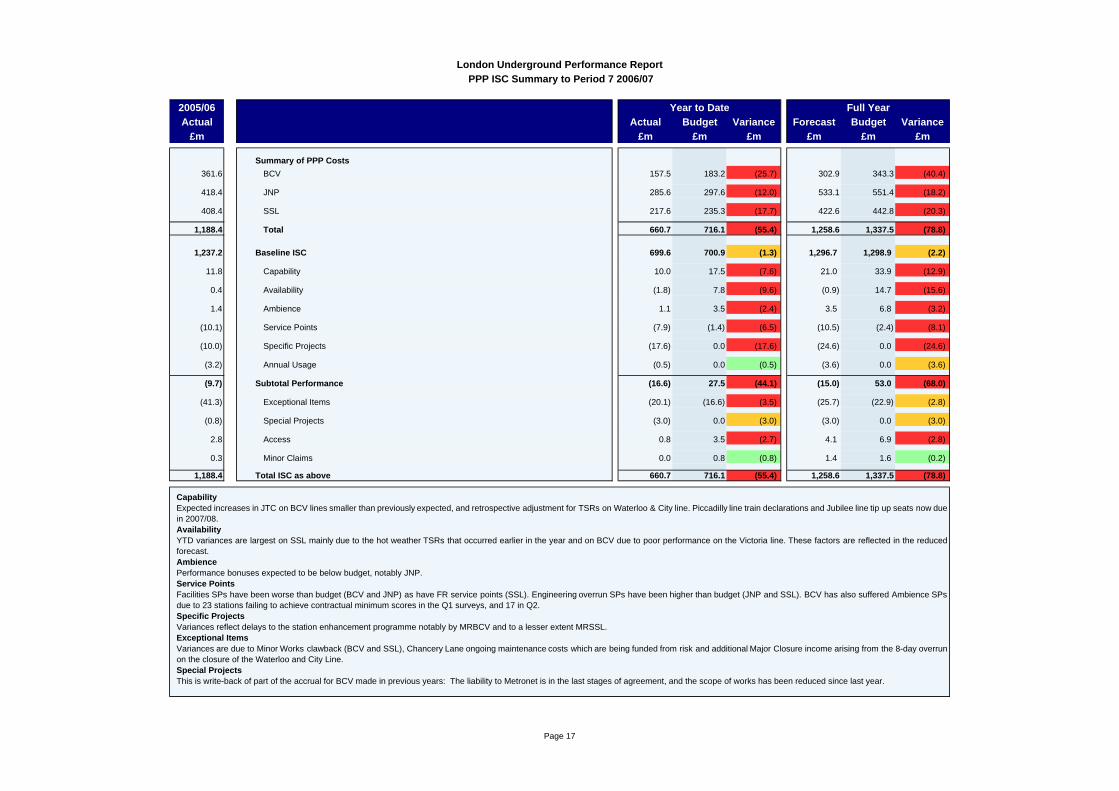
Summary of PPP Costs361.6 BCV 157.5 183.2 (25.7) 302.9 343.3 (40.4)
418.4 JNP 285.6 297.6 (12.0) 533.1 551.4 (18.2)
408.4 SSL 217.6 235.3 (17.7) 422.6 442.8 (20.3)
1,188.4 Total 660.7 716.1 (55.4) 1,258.6 1,337.5 (78.8)
1,237.2 Baseline ISC 699.6 700.9 (1.3) 1,296.7 1,298.9 (2.2)
11.8 Capability 10.0 17.5 (7.6) 21.0 33.9 (12.9)
0.4 Availability (1.8) 7.8 (9.6) (0.9) 14.7 (15.6)
1.4 Ambience 1.1 3.5 (2.4) 3.5 6.8 (3.2)
(10.1) Service Points (7.9) (1.4) (6.5) (10.5) (2.4) (8.1)
(10.0) Specific Projects (17.6) 0.0 (17.6) (24.6) 0.0 (24.6)
(3.2) Annual Usage (0.5) 0.0 (0.5) (3.6) 0.0 (3.6)
(9.7) Subtotal Performance (16.6) 27.5 (44.1) (15.0) 53.0 (68.0)
(41.3) Exceptional Items (20.1) (16.6) (3.5) (25.7) (22.9) (2.8)
(0.8) Special Projects (3.0) 0.0 (3.0) (3.0) 0.0 (3.0)
2.8 Access 0.8 3.5 (2.7) 4.1 6.9 (2.8)
0.3 Minor Claims 0.0 0.8 (0.8) 1.4 1.6 (0.2)
1,188.4 Total ISC as above 660.7 716.1 (55.4) 1,258.6 1,337.5 (78.8)
London Underground Performance Report PPP ISC Summary to Period 7 2006/07
CapabilityExpected increases in JTC on BCV lines smaller than previously expected, and retrospective adjustment for TSRs on Waterloo & City line. Piccadilly line train declarations and Jubilee line tip up seats now duein 2007/08.AvailabilityYTD variances are largest on SSL mainly due to the hot weather TSRs that occurred earlier in the year and on BCV due to poor performance on the Victoria line. These factors are reflected in the reducedforecast.AmbiencePerformance bonuses expected to be below budget, notably JNP.Service PointsFacilities SPs have been worse than budget (BCV and JNP) as have FR service points (SSL). Engineering overrun SPs have been higher than budget (JNP and SSL). BCV has also suffered Ambience SPsdue to 23 stations failing to achieve contractual minimum scores in the Q1 surveys, and 17 in Q2.Specific ProjectsVariances reflect delays to the station enhancement programme notably by MRBCV and to a lesser extent MRSSL.Exceptional ItemsVariances are due to Minor Works clawback (BCV and SSL), Chancery Lane ongoing maintenance costs which are being funded from risk and additional Major Closure income arising from the 8-day overrunon the closure of the Waterloo and City Line.Special ProjectsThis is write-back of part of the accrual for BCV made in previous years: The liability to Metronet is in the last stages of agreement, and the scope of works has been reduced since last year.
Page 17
2005/06 Year to Date Full YearActual Actual Budget Variance Forecast Budget Variance
£m £m £m £m £m £m £m
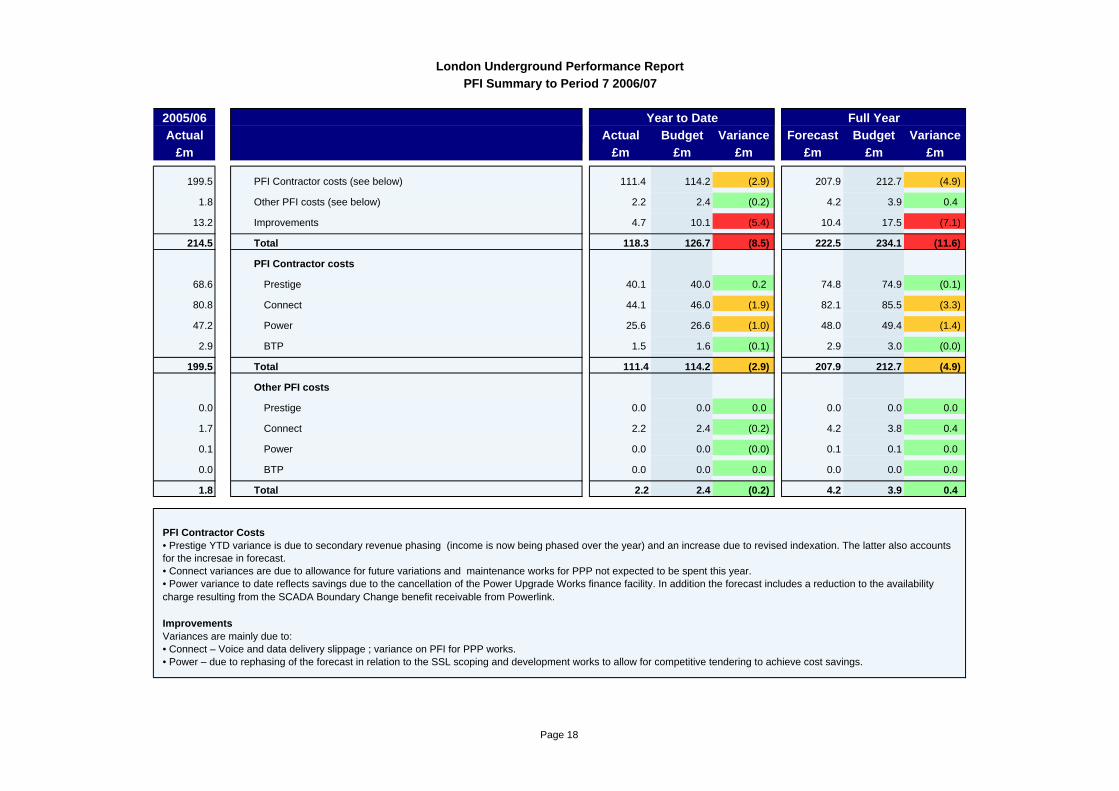
199.5 PFI Contractor costs (see below) 111.4 114.2 (2.9) 207.9 212.7 (4.9)
1.8 Other PFI costs (see below) 2.2 2.4 (0.2) 4.2 3.9 0.4
13.2 Improvements 4.7 10.1 (5.4) 10.4 17.5 (7.1)
214.5 Total 118.3 126.7 (8.5) 222.5 234.1 (11.6)
PFI Contractor costs
68.6 Prestige 40.1 40.0 0.2 74.8 74.9 (0.1)
80.8 Connect 44.1 46.0 (1.9) 82.1 85.5 (3.3)
47.2 Power 25.6 26.6 (1.0) 48.0 49.4 (1.4)
2.9 BTP 1.5 1.6 (0.1) 2.9 3.0 (0.0)
199.5 Total 111.4 114.2 (2.9) 207.9 212.7 (4.9)
Other PFI costs
0.0 Prestige 0.0 0.0 0.0 0.0 0.0 0.0
1.7 Connect 2.2 2.4 (0.2) 4.2 3.8 0.4
0.1 Power 0.0 0.0 (0.0) 0.1 0.1 0.0
0.0 BTP 0.0 0.0 0.0 0.0 0.0 0.0
1.8 Total 2.2 2.4 (0.2) 4.2 3.9 0.4
London Underground Performance ReportPFI Summary to Period 7 2006/07
PFI Contractor Costs• Prestige YTD variance is due to secondary revenue phasing (income is now being phased over the year) and an increase due to revised indexation. The latter also accounts for the incresae in forecast.• Connect variances are due to allowance for future variations and maintenance works for PPP not expected to be spent this year.• Power variance to date reflects savings due to the cancellation of the Power Upgrade Works finance facility. In addition the forecast includes a reduction to the availability charge resulting from the SCADA Boundary Change benefit receivable from Powerlink.
ImprovementsVariances are mainly due to:• Connect – Voice and data delivery slippage ; variance on PFI for PPP works.• Power – due to rephasing of the forecast in relation to the SSL scoping and development works to allow for competitive tendering to achieve cost savings.
Page 18

Asset PerformanceSection 4
Actual per Car Km 6 Period Moving Average Actual per train Km (RH axis)
London Underground Performance ReportTo Period 7 2006/07
Rolling Stock Mean Distance Between Failures
Metropolitan
0
20,000
40,000
60,000
80,000
100,000
120,000
140,000
160,000
7 8 9 10 11 12 13 1 2 3 4 5 6 70
5,000
10,000
15,000
20,000 Circle & Hammersmith
0
25,000
50,000
75,000
100,000
125,000
150,000
7 8 9 10 11 12 13 1 2 3 4 5 6 70
5,000
10,000
15,000
20,000
25,000 District
0
25,000
50,000
75,000
100,000
125,000
150,000
7 8 9 10 11 12 13 1 2 3 4 5 6 70
5,000
10,000
15,000
20,000
25,000
Jubilee 96TS
0
20,000
40,000
60,000
80,000
100,000
120,000
140,000
7 8 9 10 11 12 13 1 2 3 4 5 6 70
5,000
10,000
15,000
20,000 Northern 95TS
0
25,000
50,000
75,000
100,000
125,000
150,000
7 8 9 10 11 12 13 1 2 3 4 5 6 70
5,000
10,000
15,000
20,000
25,000 Piccadilly 73TS
0
25,000
50,000
75,000
100,000
125,000
150,000
7 8 9 10 11 12 13 1 2 3 4 5 6 70
5,000
10,000
15,000
20,000
25,000
Bakerloo 72TS
0
20,000
40,000
60,000
80,000
100,000
120,000
140,000
7 8 9 10 11 12 13 1 2 3 4 5 6 70
5,000
10,000
15,000
20,000 Central 92TS
0
20,000
40,000
60,000
80,000
100,000
120,000
140,000
160,000
7 8 9 10 11 12 13 1 2 3 4 5 6 70
5,000
10,000
15,000
20,000 Victoria 67TS
0
20,000
40,000
60,000
80,000
100,000
120,000
140,000
160,000
7 8 9 10 11 12 13 1 2 3 4 5 6 70
5,000
10,000
15,000
20,000
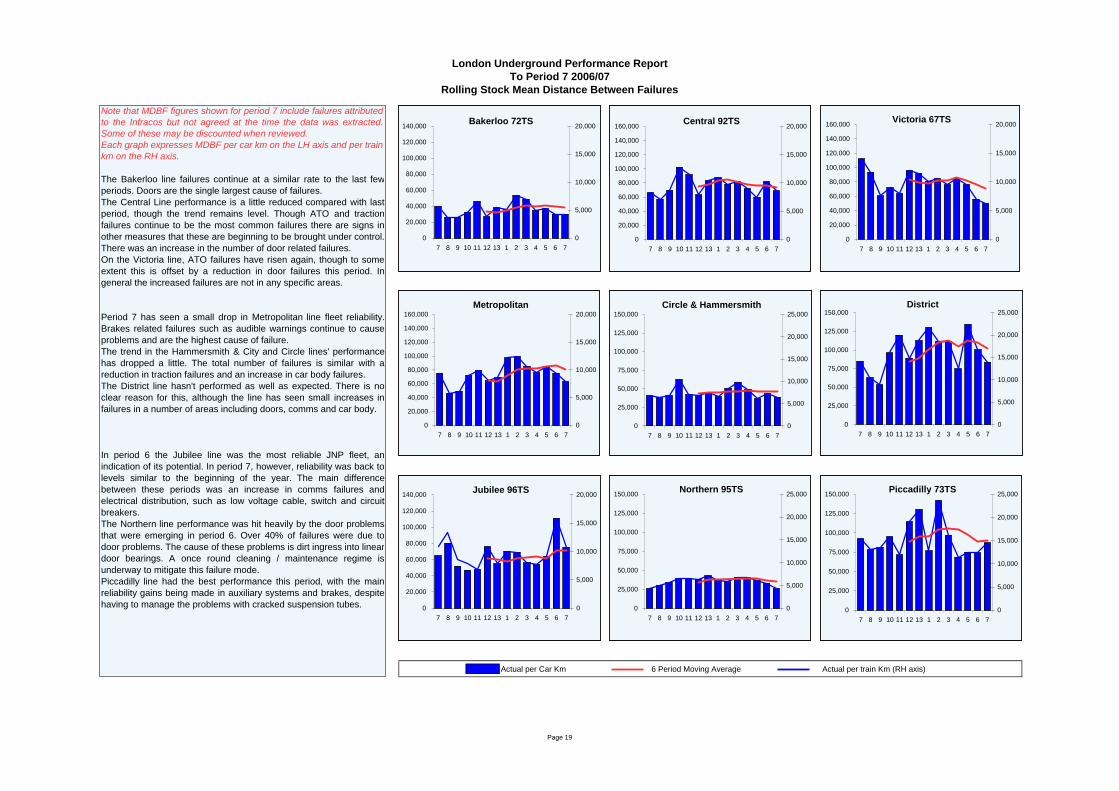
Note that MDBF figures shown for period 7 include failures attributedto the Infracos but not agreed at the time the data was extracted.Some of these may be discounted when reviewed. Each graph expresses MDBF per car km on the LH axis and per trainkm on the RH axis.
The Bakerloo line failures continue at a similar rate to the last fewperiods. Doors are the single largest cause of failures.The Central Line performance is a little reduced compared with lastperiod, though the trend remains level. Though ATO and tractionfailures continue to be the most common failures there are signs inother measures that these are beginning to be brought under control.There was an increase in the number of door related failures.On the Victoria line, ATO failures have risen again, though to someextent this is offset by a reduction in door failures this period. Ingeneral the increased failures are not in any specific areas.
Period 7 has seen a small drop in Metropolitan line fleet reliability.Brakes related failures such as audible warnings continue to causeproblems and are the highest cause of failure. The trend in the Hammersmith & City and Circle lines' performancehas dropped a little. The total number of failures is similar with areduction in traction failures and an increase in car body failures. The District line hasn't performed as well as expected. There is noclear reason for this, although the line has seen small increases infailures in a number of areas including doors, comms and car body.
In period 6 the Jubilee line was the most reliable JNP fleet, anindication of its potential. In period 7, however, reliability was back tolevels similar to the beginning of the year. The main differencebetween these periods was an increase in comms failures andelectrical distribution, such as low voltage cable, switch and circuitbreakers. The Northern line performance was hit heavily by the door problemsthat were emerging in period 6. Over 40% of failures were due todoor problems. The cause of these problems is dirt ingress into lineardoor bearings. A once round cleaning / maintenance regime isunderway to mitigate this failure mode. Piccadilly line had the best performance this period, with the mainreliability gains being made in auxiliary systems and brakes, despitehaving to manage the problems with cracked suspension tubes.
Page 19
Period Actual 2005/06 - 2006/07 6 Period Moving Average
Note: Figures reflect the number of service disruptions of 2 minutes or more attributable to Infracos
London Underground Performance ReportTo Period 7 2006/07
Signals & Points Related Delays > 2 minutes
Metropolitan
0
10
20
30
40
50
7 8 9 10 11 12 13 1 2 3 4 5 6 7
District
0
10
20
30
40
50
7 8 9 10 11 12 13 1 2 3 4 5 6 7
Circle & Hammersmith
0
10
20
30
40
50
7 8 9 10 11 12 13 1 2 3 4 5 6 7
Bakerloo
0
10
20
30
40
50
7 8 9 10 11 12 13 1 2 3 4 5 6 7
Central
0
10
20
30
40
50
7 8 9 10 11 12 13 1 2 3 4 5 6 7
Victoria
0
10
20
30
40
50
7 8 9 10 11 12 13 1 2 3 4 5 6 7
Jubilee
0
10
20
30
40
50
7 8 9 10 11 12 13 1 2 3 4 5 6 7
Northern
0
10
20
30
40
50
7 8 9 10 11 12 13 1 2 3 4 5 6 7
Piccadilly
0
10
20
30
40
50
7 8 9 10 11 12 13 1 2 3 4 5 6 7
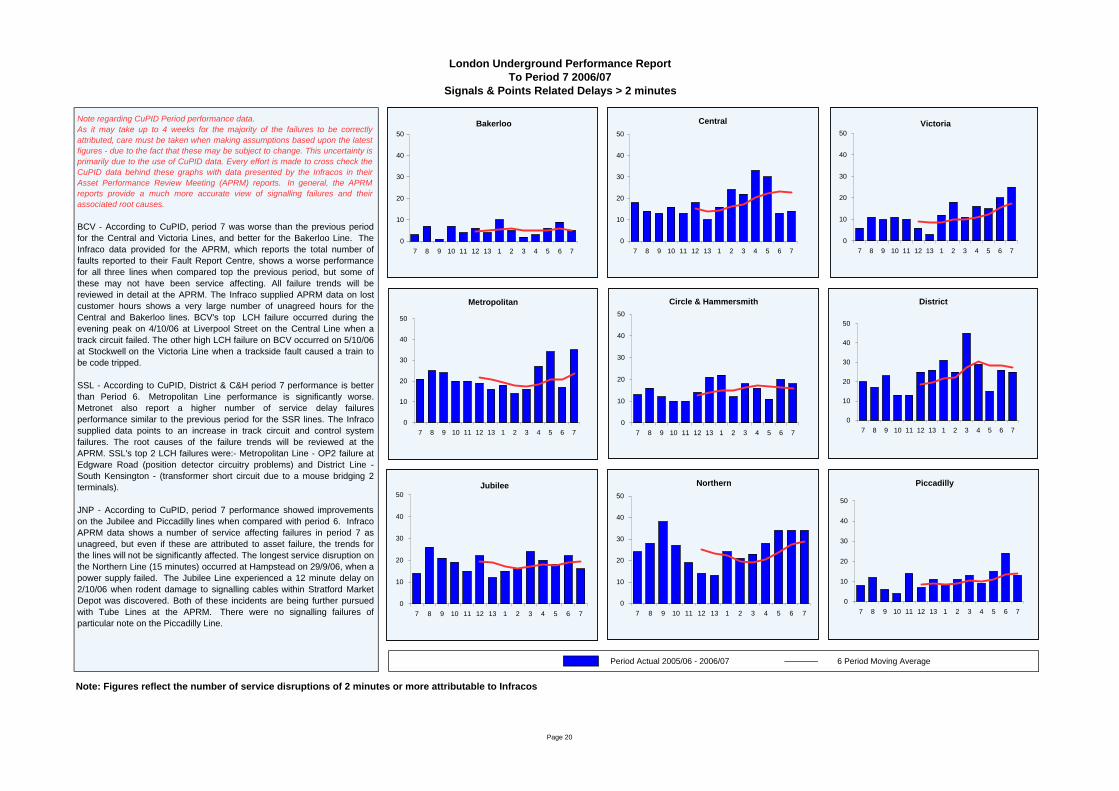
Note regarding CuPID Period performance data.As it may take up to 4 weeks for the majority of the failures to be correctlyattributed, care must be taken when making assumptions based upon the latestfigures - due to the fact that these may be subject to change. This uncertainty isprimarily due to the use of CuPID data. Every effort is made to cross check theCuPID data behind these graphs with data presented by the Infracos in theirAsset Performance Review Meeting (APRM) reports. In general, the APRMreports provide a much more accurate view of signalling failures and theirassociated root causes.
BCV - According to CuPID, period 7 was worse than the previous periodfor the Central and Victoria Lines, and better for the Bakerloo Line. TheInfraco data provided for the APRM, which reports the total number offaults reported to their Fault Report Centre, shows a worse performancefor all three lines when compared top the previous period, but some ofthese may not have been service affecting. All failure trends will bereviewed in detail at the APRM. The Infraco supplied APRM data on lostcustomer hours shows a very large number of unagreed hours for theCentral and Bakerloo lines. BCV's top LCH failure occurred during theevening peak on 4/10/06 at Liverpool Street on the Central Line when atrack circuit failed. The other high LCH failure on BCV occurred on 5/10/06at Stockwell on the Victoria Line when a trackside fault caused a train tobe code tripped.
SSL - According to CuPID, District & C&H period 7 performance is betterthan Period 6. Metropolitan Line performance is significantly worse.Metronet also report a higher number of service delay failuresperformance similar to the previous period for the SSR lines. The Infracosupplied data points to an increase in track circuit and control systemfailures. The root causes of the failure trends will be reviewed at theAPRM. SSL's top 2 LCH failures were:- Metropolitan Line - OP2 failure atEdgware Road (position detector circuitry problems) and District Line -South Kensington - (transformer short circuit due to a mouse bridging 2terminals).
JNP - According to CuPID, period 7 performance showed improvementson the Jubilee and Piccadilly lines when compared with period 6. InfracoAPRM data shows a number of service affecting failures in period 7 asunagreed, but even if these are attributed to asset failure, the trends forthe lines will not be significantly affected. The longest service disruption onthe Northern Line (15 minutes) occurred at Hampstead on 29/9/06, when apower supply failed. The Jubilee Line experienced a 12 minute delay on2/10/06 when rodent damage to signalling cables within Stratford MarketDepot was discovered. Both of these incidents are being further pursuedwith Tube Lines at the APRM. There were no signalling failures ofparticular note on the Piccadilly Line.
Page 20
Period Actual 2005/06 - 2006/07 6 Period Moving Average
Note: Figures reflect the number of service disruptions of 2 minutes or more attributable to Infracos. Speed Restrictions are not included.
London Underground Performance ReportTo Period 7 2006/07
Track Related Delays > 2 minutes
Metropolitan
0
5
10
15
20
7 8 9 10 11 12 13 1 2 3 4 5 6 7
District
0
5
10
15
20
7 8 9 10 11 12 13 1 2 3 4 5 6 7
Circle & Hammersmith
0
5
10
15
20
7 8 9 10 11 12 13 1 2 3 4 5 6 7
Bakerloo
0
5
10
15
20
7 8 9 10 11 12 13 1 2 3 4 5 6 7
Central
0
5
10
15
20
7 8 9 10 11 12 13 1 2 3 4 5 6 7
Victoria
0
5
10
15
20
7 8 9 10 11 12 13 1 2 3 4 5 6 7
Jubilee
0
5
10
15
20
7 8 9 10 11 12 13 1 2 3 4 5 6 7
Northern
0
5
10
15
20
7 8 9 10 11 12 13 1 2 3 4 5 6 7
Piccadilly
0
5
10
15
20
7 8 9 10 11 12 13 1 2 3 4 5 6 7
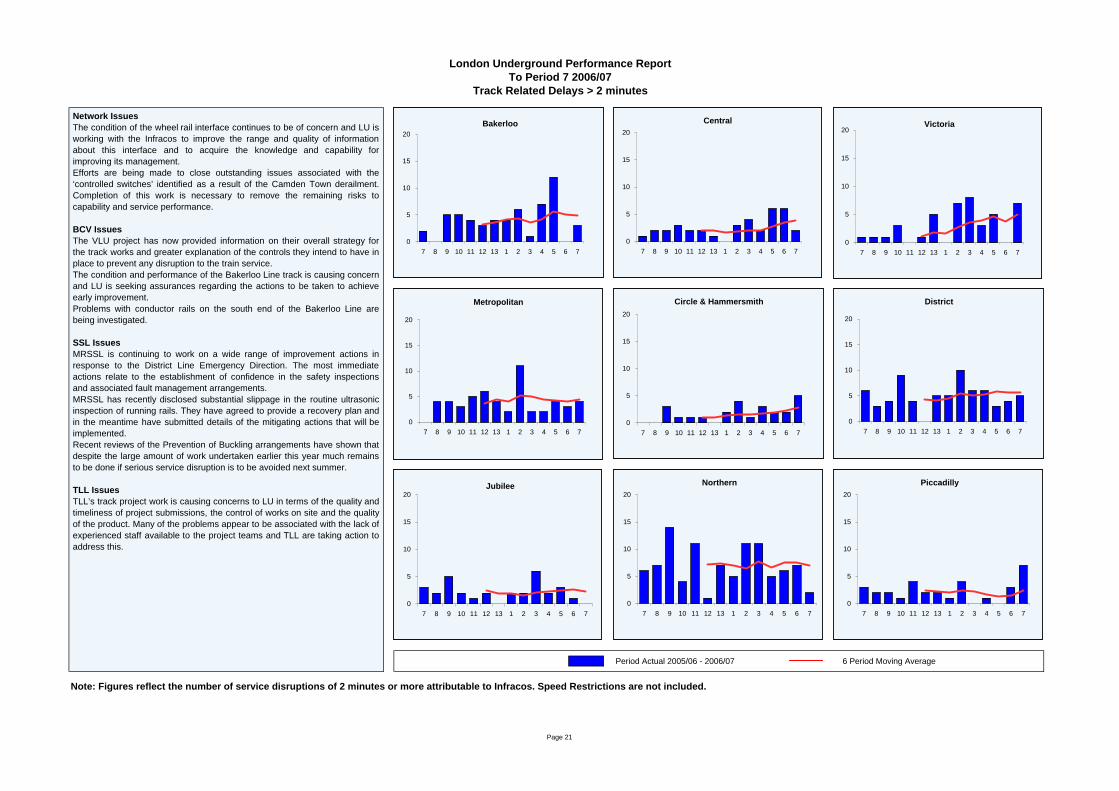
Network IssuesThe condition of the wheel rail interface continues to be of concern and LU isworking with the Infracos to improve the range and quality of informationabout this interface and to acquire the knowledge and capability forimproving its management.Efforts are being made to close outstanding issues associated with the‘controlled switches’ identified as a result of the Camden Town derailment.Completion of this work is necessary to remove the remaining risks tocapability and service performance. BCV IssuesThe VLU project has now provided information on their overall strategy forthe track works and greater explanation of the controls they intend to have inplace to prevent any disruption to the train service.The condition and performance of the Bakerloo Line track is causing concernand LU is seeking assurances regarding the actions to be taken to achieveearly improvement. Problems with conductor rails on the south end of the Bakerloo Line arebeing investigated.
SSL IssuesMRSSL is continuing to work on a wide range of improvement actions inresponse to the District Line Emergency Direction. The most immediateactions relate to the establishment of confidence in the safety inspectionsand associated fault management arrangements.MRSSL has recently disclosed substantial slippage in the routine ultrasonicinspection of running rails. They have agreed to provide a recovery plan andin the meantime have submitted details of the mitigating actions that will beimplemented. Recent reviews of the Prevention of Buckling arrangements have shown thatdespite the large amount of work undertaken earlier this year much remainsto be done if serious service disruption is to be avoided next summer.
TLL IssuesTLL’s track project work is causing concerns to LU in terms of the quality andtimeliness of project submissions, the control of works on site and the qualityof the product. Many of the problems appear to be associated with the lack ofexperienced staff available to the project teams and TLL are taking action toaddress this.
Page 21
Period Actual 2005/06 - 2006/07 Planned Works
London Underground Performance ReportTo Period 7 2006/07
Escalator Availability
SSL
80%
82%
84%
86%
88%
90%
92%
94%
96%
98%
100%
7 8 9 10 11 12 13 1 2 3 4 5 6 7
JNP
80%
82%
84%
86%
88%
90%
92%
94%
96%
98%
100%
7 8 9 10 11 12 13 1 2 3 4 5 6 7
Total
80%
82%
84%
86%
88%
90%
92%
94%
96%
98%
100%
7 8 9 10 11 12 13 1 2 3 4 5 6 7
BCV
80%
82%
84%
86%
88%
90%
92%
94%
96%
98%
100%
7 8 9 10 11 12 13 1 2 3 4 5 6 7
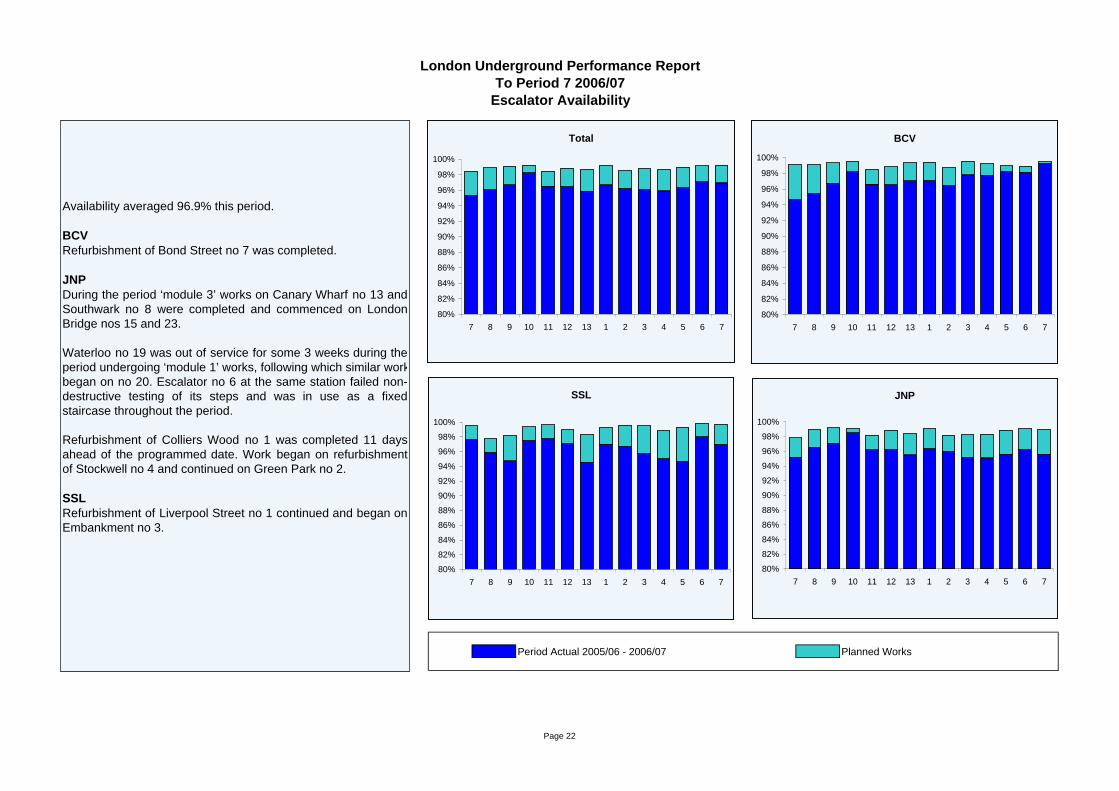
Availability averaged 96.9% this period.
BCVRefurbishment of Bond Street no 7 was completed.
JNPDuring the period ‘module 3’ works on Canary Wharf no 13 andSouthwark no 8 were completed and commenced on LondonBridge nos 15 and 23.
Waterloo no 19 was out of service for some 3 weeks during theperiod undergoing ‘module 1’ works, following which similar workbegan on no 20. Escalator no 6 at the same station failed non-destructive testing of its steps and was in use as a fixedstaircase throughout the period.
Refurbishment of Colliers Wood no 1 was completed 11 daysahead of the programmed date. Work began on refurbishmentof Stockwell no 4 and continued on Green Park no 2.
SSLRefurbishment of Liverpool Street no 1 continued and began onEmbankment no 3.
Page 22
Period Actual 2005/06 - 2006/07 Planned Works
London Underground Performance ReportTo Period 7 2006/07
Lift Availability
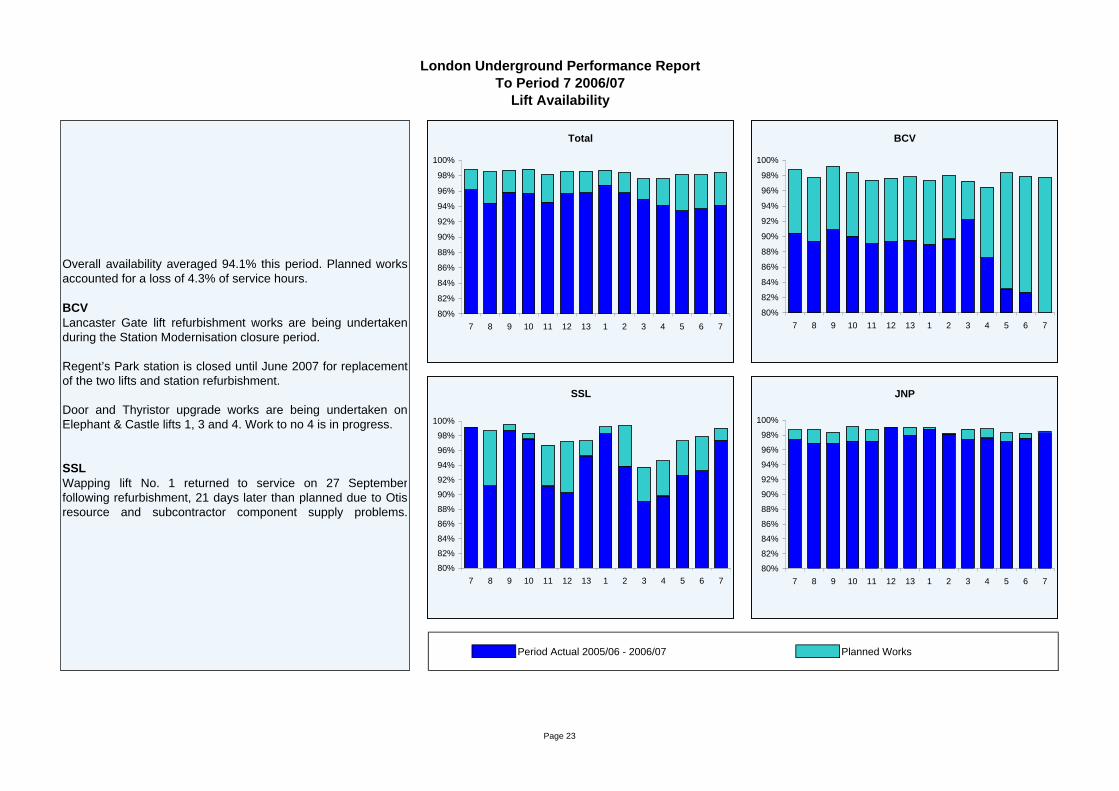
Overall availability averaged 94.1% this period. Planned worksaccounted for a loss of 4.3% of service hours.
BCVLancaster Gate lift refurbishment works are being undertakenduring the Station Modernisation closure period.
Regent’s Park station is closed until June 2007 for replacementof the two lifts and station refurbishment.
Door and Thyristor upgrade works are being undertaken onElephant & Castle lifts 1, 3 and 4. Work to no 4 is in progress.
SSLWapping lift No. 1 returned to service on 27 Septemberfollowing refurbishment, 21 days later than planned due to Otisresource and subcontractor component supply problems.
Total
80%
82%
84%
86%
88%
90%
92%
94%
96%
98%
100%
7 8 9 10 11 12 13 1 2 3 4 5 6 7
BCV
80%
82%
84%
86%
88%
90%
92%
94%
96%
98%
100%
7 8 9 10 11 12 13 1 2 3 4 5 6 7
SSL
80%
82%
84%
86%
88%
90%
92%
94%
96%
98%
100%
7 8 9 10 11 12 13 1 2 3 4 5 6 7
JNP
80%
82%
84%
86%
88%
90%
92%
94%
96%
98%
100%
7 8 9 10 11 12 13 1 2 3 4 5 6 7
Page 23
PPP Contract PerformanceSection 5
London Underground Performance ReportTo Period 7 2006/07
PPP Performance vs Availability Benchmark
Metronet BCV Bakerloo line Bonus / (Abatement) £000
(100)
(80)
(60)
(40)
(20)
0
20
40
60
80
100
7 8 9 10 11 12 13 1 2 3 4 5 6 7
Bonus Abatement
Central line Bonus / (Abatement) £000
(300)
(200)
(100)
0
100
200
300
400
500
7 8 9 10 11 12 13 1 2 3 4 5 6 7
Bonus Abatement
Bakerloo line Lost Customer Hours (000)
0
10
20
30
40
50
60
70
80
90
100
7 8 9 10 11 12 13 1 2 3 4 5 6 7
Agreed Abeyance Contractual Measure Benchmark
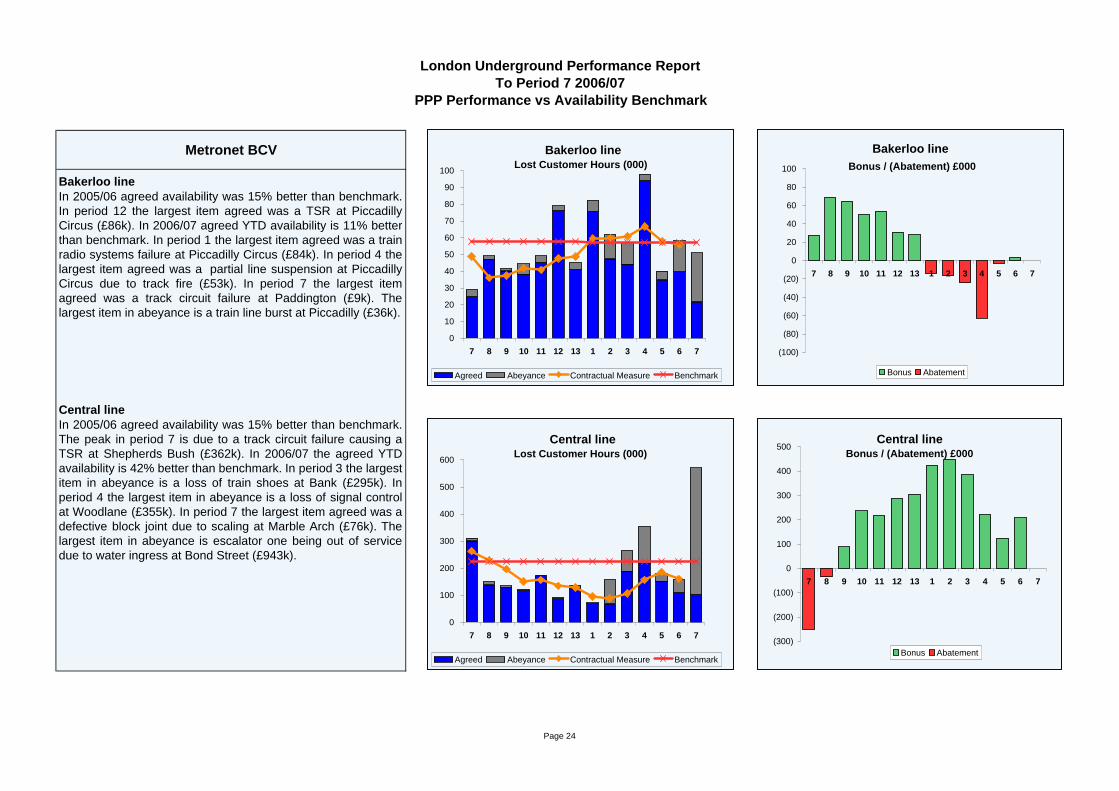
Bakerloo lineIn 2005/06 agreed availability was 15% better than benchmark.In period 12 the largest item agreed was a TSR at PiccadillyCircus (£86k). In 2006/07 agreed YTD availability is 11% betterthan benchmark. In period 1 the largest item agreed was a trainradio systems failure at Piccadilly Circus (£84k). In period 4 thelargest item agreed was a partial line suspension at PiccadillyCircus due to track fire (£53k). In period 7 the largest itemagreed was a track circuit failure at Paddington (£9k). Thelargest item in abeyance is a train line burst at Piccadilly (£36k).
Central lineIn 2005/06 agreed availability was 15% better than benchmark.The peak in period 7 is due to a track circuit failure causing aTSR at Shepherds Bush (£362k). In 2006/07 the agreed YTDavailability is 42% better than benchmark. In period 3 the largestitem in abeyance is a loss of train shoes at Bank (£295k). Inperiod 4 the largest item in abeyance is a loss of signal controlat Woodlane (£355k). In period 7 the largest item agreed was adefective block joint due to scaling at Marble Arch (£76k). Thelargest item in abeyance is escalator one being out of servicedue to water ingress at Bond Street (£943k).
Central line Lost Customer Hours (000)
0
100
200
300
400
500
600
7 8 9 10 11 12 13 1 2 3 4 5 6 7
Agreed Abeyance Contractual Measure Benchmark
Page 24
London Underground Performance ReportTo Period 7 2006/07
PPP Performance vs Availability Benchmark
Metronet BCV Victoria line Bonus / (Abatement) £000
(350)
(300)
(250)
(200)
(150)
(100)
(50)
0
50
100
150
7 8 9 10 11 12 13 1 2 3 4 5 6 7
Bonus Abatement
Waterloo & City line Bonus / (Abatement) £000
(20)
(15)
(10)
(5)
0
5
10
15
20
7 8 9 10 11 12 13 1 2 3 4 5 6 7
Bonus Abatement
Victoria line Lost Customer Hours (000)
0
50
100
150
200
250
300
350
7 8 9 10 11 12 13 1 2 3 4 5 6 7
Agreed Abeyance Contractual Measure Benchmark
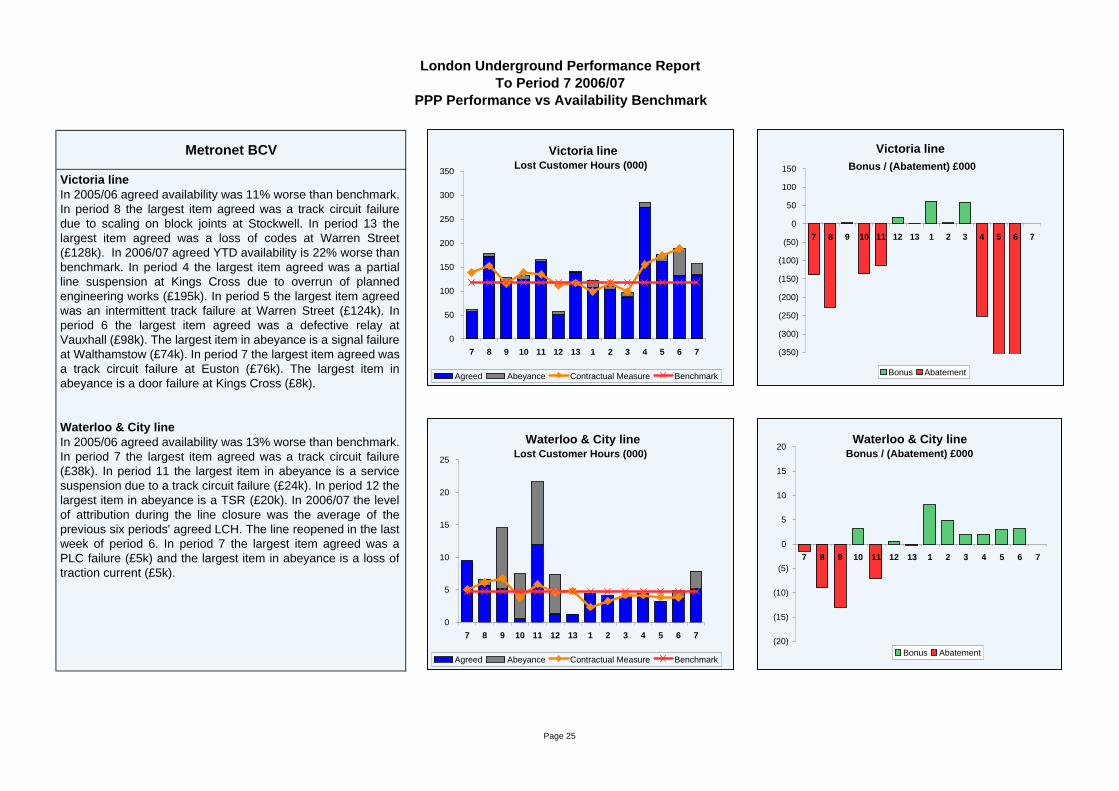
Victoria lineIn 2005/06 agreed availability was 11% worse than benchmark.In period 8 the largest item agreed was a track circuit failuredue to scaling on block joints at Stockwell. In period 13 thelargest item agreed was a loss of codes at Warren Street(£128k). In 2006/07 agreed YTD availability is 22% worse thanbenchmark. In period 4 the largest item agreed was a partialline suspension at Kings Cross due to overrun of plannedengineering works (£195k). In period 5 the largest item agreedwas an intermittent track failure at Warren Street (£124k). Inperiod 6 the largest item agreed was a defective relay atVauxhall (£98k). The largest item in abeyance is a signal failureat Walthamstow (£74k). In period 7 the largest item agreed wasa track circuit failure at Euston (£76k). The largest item inabeyance is a door failure at Kings Cross (£8k).
Waterloo & City lineIn 2005/06 agreed availability was 13% worse than benchmark.In period 7 the largest item agreed was a track circuit failure(£38k). In period 11 the largest item in abeyance is a servicesuspension due to a track circuit failure (£24k). In period 12 thelargest item in abeyance is a TSR (£20k). In 2006/07 the levelof attribution during the line closure was the average of theprevious six periods' agreed LCH. The line reopened in the lastweek of period 6. In period 7 the largest item agreed was aPLC failure (£5k) and the largest item in abeyance is a loss oftraction current (£5k).
Waterloo & City line Lost Customer Hours (000)
0
5
10
15
20
25
7 8 9 10 11 12 13 1 2 3 4 5 6 7
Agreed Abeyance Contractual Measure Benchmark
Page 25
London Underground Performance ReportTo Period 7 2006/07
PPP Performance vs Availability Benchmark
Tube Lines JNP Jubilee line Bonus / (Abatement) £000
(150)
(100)
(50)
0
50
100
150
7 8 9 10 11 12 13 1 2 3 4 5 6 7
Bonus Abatement
Northern line Bonus / (Abatement) £000
(1000)
(800)
(600)
(400)
(200)
0
200
7 8 9 10 11 12 13 1 2 3 4 5 6 7
Bonus Abatement
Jubilee line Lost Customer Hours (000)
0
50
100
150
200
7 8 9 10 11 12 13 1 2 3 4 5 6 7
Agreed Abeyance Contractual Measure Benchmark
Northern line Lost Customer Hours (000)
0
100
200
300
400
7 8 9 10 11 12 13 1 2 3 4 5 6 7
Agreed Abeyance Contractual Measure Benchmark
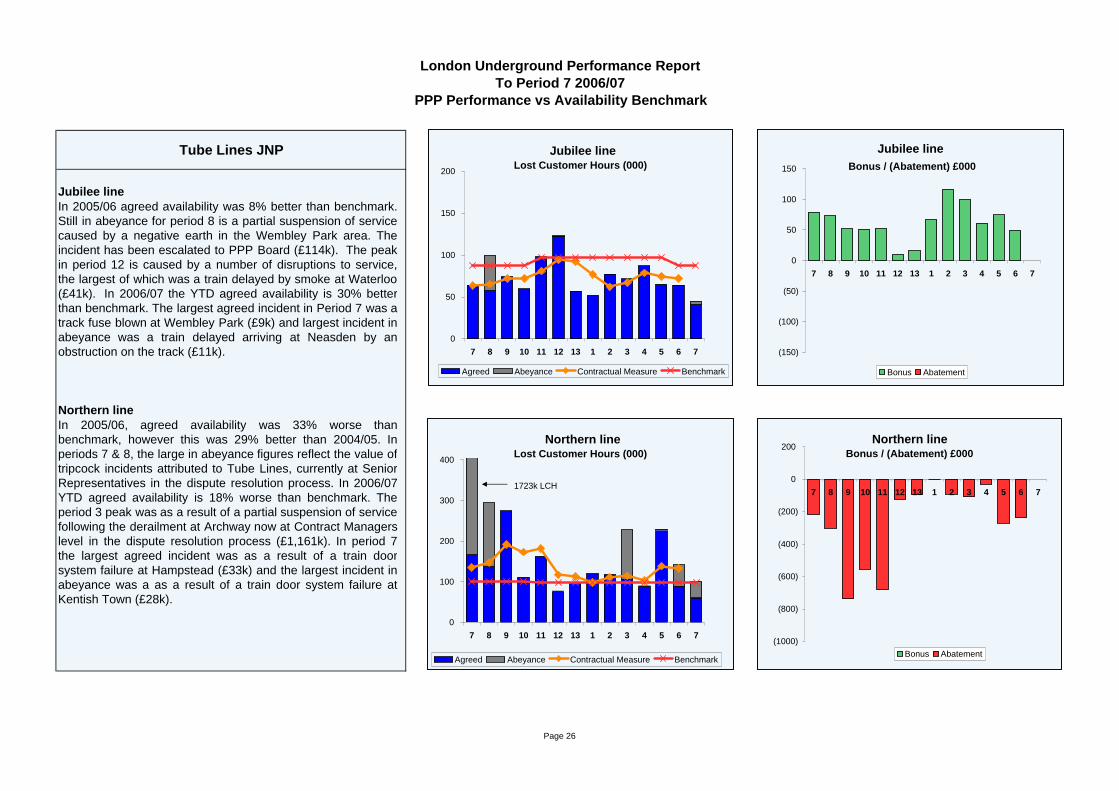
Jubilee lineIn 2005/06 agreed availability was 8% better than benchmark.Still in abeyance for period 8 is a partial suspension of servicecaused by a negative earth in the Wembley Park area. Theincident has been escalated to PPP Board (£114k). The peakin period 12 is caused by a number of disruptions to service,the largest of which was a train delayed by smoke at Waterloo(£41k). In 2006/07 the YTD agreed availability is 30% betterthan benchmark. The largest agreed incident in Period 7 was atrack fuse blown at Wembley Park (£9k) and largest incident inabeyance was a train delayed arriving at Neasden by anobstruction on the track (£11k).
Northern lineIn 2005/06, agreed availability was 33% worse thanbenchmark, however this was 29% better than 2004/05. Inperiods 7 & 8, the large in abeyance figures reflect the value oftripcock incidents attributed to Tube Lines, currently at SeniorRepresentatives in the dispute resolution process. In 2006/07YTD agreed availability is 18% worse than benchmark. Theperiod 3 peak was as a result of a partial suspension of servicefollowing the derailment at Archway now at Contract Managerslevel in the dispute resolution process (£1,161k). In period 7the largest agreed incident was as a result of a train doorsystem failure at Hampstead (£33k) and the largest incident inabeyance was a as a result of a train door system failure atKentish Town (£28k).
1723k LCH
Page 26
Metronet SSL
London Underground Performance ReportTo Period 7 2006/07
PPP Performance vs Availability Benchmark
Tube Lines JNP Piccadilly line Bonus / (Abatement) £000
(100)
0
100
200
300
400
500
600
7 8 9 10 11 12 13 1 2 3 4 5 6 7
Bonus Abatement
Metropolitan, Circle & Hammersmith linesBonus / (Abatement) £000
(100)
0
100
200
300
400
500
7 8 9 10 11 12 13 1 2 3 4 5 6 7
Bonus Abatement
Piccadilly line Lost Customer Hours (000)
0
50
100
150
200
250
7 8 9 10 11 12 13 1 2 3 4 5 6 7
Agreed Abeyance Contractual Measure Benchmark
Metropolitan, Circle & Hammersmith linesLost Customer Hours (000)
0
50
100
150
200
250
300
350
400
7 8 9 10 11 12 13 1 2 3 4 5 6 7
Agreed Abeyance Contractual Measure Benchmark
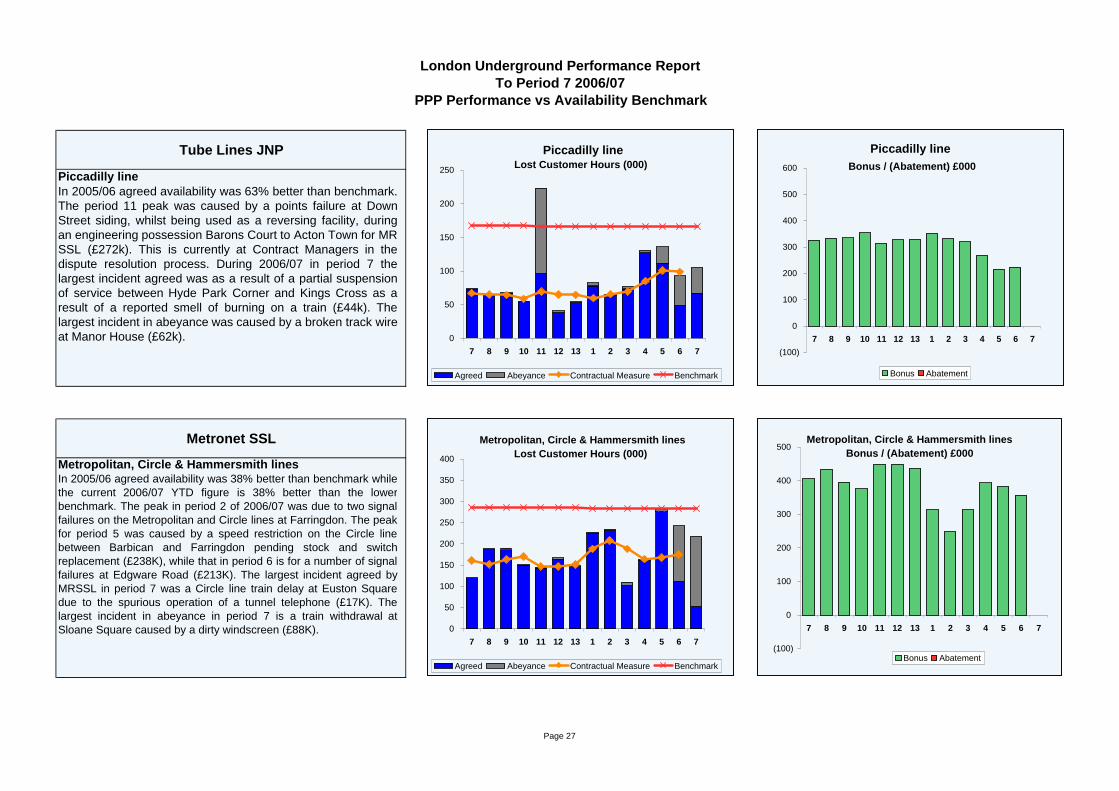
Piccadilly lineIn 2005/06 agreed availability was 63% better than benchmark.The period 11 peak was caused by a points failure at DownStreet siding, whilst being used as a reversing facility, duringan engineering possession Barons Court to Acton Town for MRSSL (£272k). This is currently at Contract Managers in thedispute resolution process. During 2006/07 in period 7 thelargest incident agreed was as a result of a partial suspensionof service between Hyde Park Corner and Kings Cross as aresult of a reported smell of burning on a train (£44k). Thelargest incident in abeyance was caused by a broken track wireat Manor House (£62k).
Metropolitan, Circle & Hammersmith linesIn 2005/06 agreed availability was 38% better than benchmark whilethe current 2006/07 YTD figure is 38% better than the lowerbenchmark. The peak in period 2 of 2006/07 was due to two signalfailures on the Metropolitan and Circle lines at Farringdon. The peakfor period 5 was caused by a speed restriction on the Circle linebetween Barbican and Farringdon pending stock and switchreplacement (£238K), while that in period 6 is for a number of signalfailures at Edgware Road (£213K). The largest incident agreed byMRSSL in period 7 was a Circle line train delay at Euston Squaredue to the spurious operation of a tunnel telephone (£17K). Thelargest incident in abeyance in period 7 is a train withdrawal atSloane Square caused by a dirty windscreen (£88K).
Page 27
London Underground Performance ReportTo Period 7 2006/07
PPP Performance vs Availability Benchmark
Metronet SSL District line Bonus / (Abatement) £000
(200)
(100)
0
100
200
300
400
7 8 9 10 11 12 13 1 2 3 4 5 6 7
Bonus Abatement
East London line Bonus / (Abatement) £000
(4)
(2)
0
2
4
6
8
7 8 9 10 11 12 13 1 2 3 4 5 6 7
Bonus Abatement
District line Lost Customer Hours (000)
0
50
100
150
200
250
300
350
7 8 9 10 11 12 13 1 2 3 4 5 6 7
Agreed Abeyance Contractual Measure Benchmark
East London line Lost Customer Hours (000)
0
1
2
3
4
5
6
7 8 9 10 11 12 13 1 2 3 4 5 6 7
Agreed Abeyance Contractual Measure Benchmark
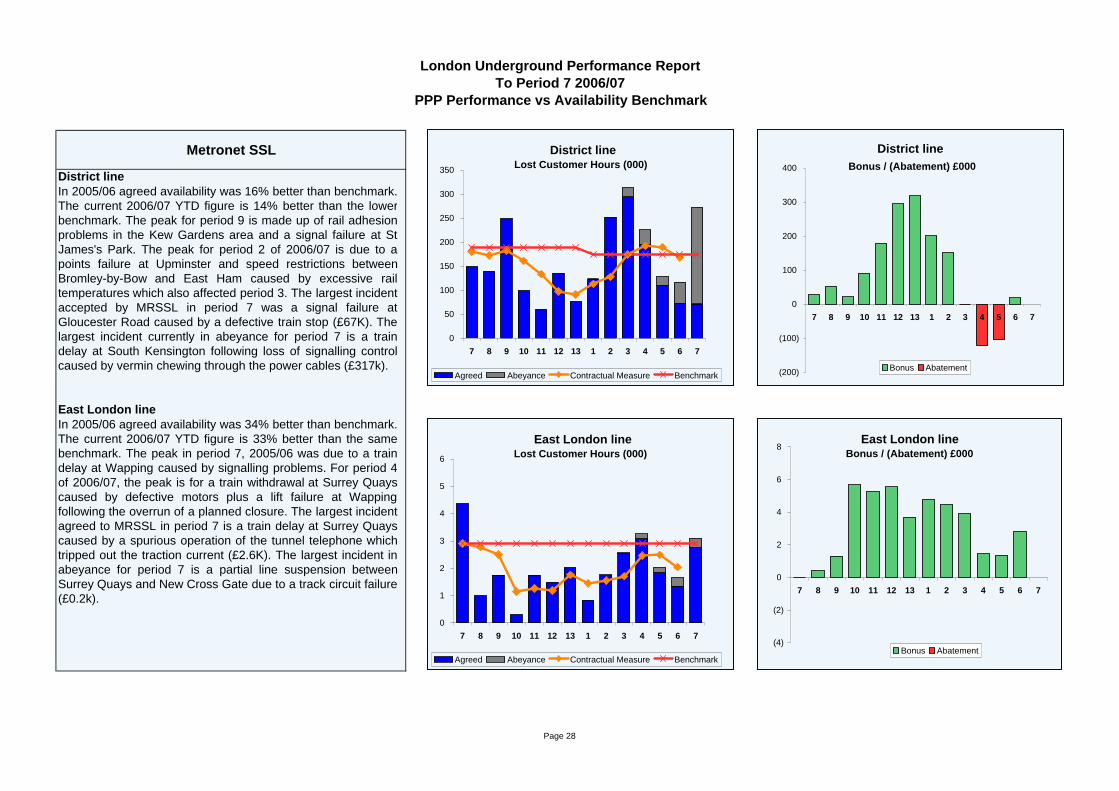
District lineIn 2005/06 agreed availability was 16% better than benchmark.The current 2006/07 YTD figure is 14% better than the lowerbenchmark. The peak for period 9 is made up of rail adhesionproblems in the Kew Gardens area and a signal failure at StJames's Park. The peak for period 2 of 2006/07 is due to apoints failure at Upminster and speed restrictions betweenBromley-by-Bow and East Ham caused by excessive railtemperatures which also affected period 3. The largest incidentaccepted by MRSSL in period 7 was a signal failure atGloucester Road caused by a defective train stop (£67K). Thelargest incident currently in abeyance for period 7 is a traindelay at South Kensington following loss of signalling controlcaused by vermin chewing through the power cables (£317k).
East London lineIn 2005/06 agreed availability was 34% better than benchmark.The current 2006/07 YTD figure is 33% better than the samebenchmark. The peak in period 7, 2005/06 was due to a traindelay at Wapping caused by signalling problems. For period 4of 2006/07, the peak is for a train withdrawal at Surrey Quayscaused by defective motors plus a lift failure at Wappingfollowing the overrun of a planned closure. The largest incidentagreed to MRSSL in period 7 is a train delay at Surrey Quayscaused by a spurious operation of the tunnel telephone whichtripped out the traction current (£2.6K). The largest incident inabeyance for period 7 is a partial line suspension betweenSurrey Quays and New Cross Gate due to a track circuit failure(£0.2k).
Page 28
London Underground Performance Report
PPP Availability - Other LinesTo Period 7 2006/07
Metronet BCV (Abatement) £000
(20)
(15)
(10)
(5)
0 7 8 9 10 11 12 13 1 2 3 4 5 6 7
Abatement
Metronet BCV Lost Customer Hours (000) - Other Lines
0
5
10
15
20
7 8 9 10 11 12 13 1 2 3 4 5 6 7
Agreed Abeyance
Metronet SSL Lost Customer Hours (000) - Other Lines
0 20 40 60 80
100 120 140 160 180 200
7 8 9 10 11 12 13 1 2 3 4 5 6 7
Agreed Abeyance
Metronet SSL (Abatement) £000
(1,400)
(1,200)
(1,000)
(800)
(600)
(400)
(200)
0 7 8 9 10 11 12 13 1 2 3 4 5 6 7
Abatement
Tube Lines JNP Lost Customer Hours (000) - Other Lines
0
10
20
30
40
7 8 9 10 11 12 13 1 2 3 4 5 6 7
Agreed Abeyance
Tube Lines JNP (Abatement) £000
(200)
(150)
(100)
(50)
0 7 8 9 10 11 12 13 1 2 3 4 5 6 7
Abatement
Note there are no benchmarks as it is impossible to predict the effectsof Infraco incidents on other lines.
In 2005/06 the peak in period 9 was due to a loss of air supply totrainstops at Finsbury Park that affected Piccadilly line services. In2006/07 in period 1 the peak is due to a delayed Northern line traindeparture caused by loss of power at Elephant and Castle station. Thepeak abeyance in period 7 is due to the District Line Platforms floodingat Victoria.
The peaks in periods 2 and 3 of 2006/07 are due to a number of speedrestrictions on the Piccadilly Line in the Acton Town area, caused byexcessive rail temperatures. The largest incident agreed in period 7 wasa Piccadilly Line train delay at Hammersmith caused by a signal failure(£10K). The largest incident in abeyance for period 7 is a signal failureon the Piccadilly Line train at Turnham Green caused by a track circuitfailure (£41K).
In 2005/06 the peak in period 9 was due to a signal failure at Earls Court(£27k). The 2006/07 period 1 peak was as a result of a MetropolitanLine train delayed at Finchley Road by a signal failure (£125k). In period7 the largest agreed incident was a Metropolitan Line train delayed by asignal failure at Finchley Road (£3.5k) and the largest incident inabeyance was a Metropolitan Line points failure at Neasden (£9k).
Page 29
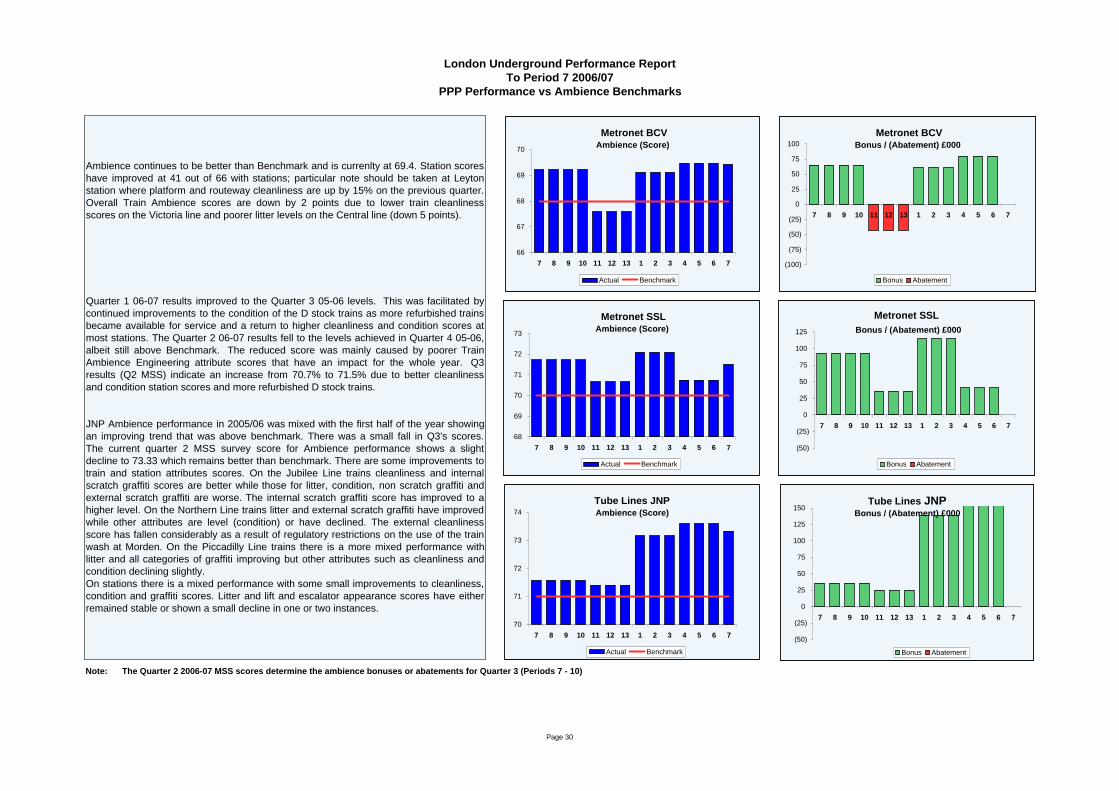
Note: The Quarter 2 2006-07 MSS scores determine the ambience bonuses or abatements for Quarter 3 (Periods 7 - 10)
London Underground Performance ReportTo Period 7 2006/07
PPP Performance vs Ambience Benchmarks
Ambience continues to be better than Benchmark and is currenlty at 69.4. Station scoreshave improved at 41 out of 66 with stations; particular note should be taken at Leytonstation where platform and routeway cleanliness are up by 15% on the previous quarter.Overall Train Ambience scores are down by 2 points due to lower train cleanlinessscores on the Victoria line and poorer litter levels on the Central line (down 5 points).
Quarter 1 06-07 results improved to the Quarter 3 05-06 levels. This was facilitated bycontinued improvements to the condition of the D stock trains as more refurbished trainsbecame available for service and a return to higher cleanliness and condition scores atmost stations. The Quarter 2 06-07 results fell to the levels achieved in Quarter 4 05-06,albeit still above Benchmark. The reduced score was mainly caused by poorer TrainAmbience Engineering attribute scores that have an impact for the whole year. Q3results (Q2 MSS) indicate an increase from 70.7% to 71.5% due to better cleanlinessand condition station scores and more refurbished D stock trains.
JNP Ambience performance in 2005/06 was mixed with the first half of the year showingan improving trend that was above benchmark. There was a small fall in Q3's scores.The current quarter 2 MSS survey score for Ambience performance shows a slightdecline to 73.33 which remains better than benchmark. There are some improvements totrain and station attributes scores. On the Jubilee Line trains cleanliness and internalscratch graffiti scores are better while those for litter, condition, non scratch graffiti andexternal scratch graffiti are worse. The internal scratch graffiti score has improved to ahigher level. On the Northern Line trains litter and external scratch graffiti have improvedwhile other attributes are level (condition) or have declined. The external cleanlinessscore has fallen considerably as a result of regulatory restrictions on the use of the trainwash at Morden. On the Piccadilly Line trains there is a more mixed performance withlitter and all categories of graffiti improving but other attributes such as cleanliness andcondition declining slightly. On stations there is a mixed performance with some small improvements to cleanliness,condition and graffiti scores. Litter and lift and escalator appearance scores have eitherremained stable or shown a small decline in one or two instances.
Metronet SSL Bonus / (Abatement) £000
(50)
(25)
0
25
50
75
100
125
7 8 9 10 11 12 13 1 2 3 4 5 6 7
Bonus Abatement
Tube Lines JNPBonus / (Abatement) £000
(50)
(25)
0
25
50
75
100
125
150
7 8 9 10 11 12 13 1 2 3 4 5 6 7
Bonus Abatement
Metronet BCV Bonus / (Abatement) £000
(100)
(75)
(50)
(25)
0
25
50
75
100
7 8 9 10 11 12 13 1 2 3 4 5 6 7
Bonus Abatement
Metronet BCV Ambience (Score)
66
67
68
69
70
7 8 9 10 11 12 13 1 2 3 4 5 6 7
Actual Benchmark
Metronet SSL Ambience (Score)
68
69
70
71
72
73
7 8 9 10 11 12 13 1 2 3 4 5 6 7
Actual Benchmark
Tube Lines JNPAmbience (Score)
70
71
72
73
74
7 8 9 10 11 12 13 1 2 3 4 5 6 7
Actual Benchmark
Page 30
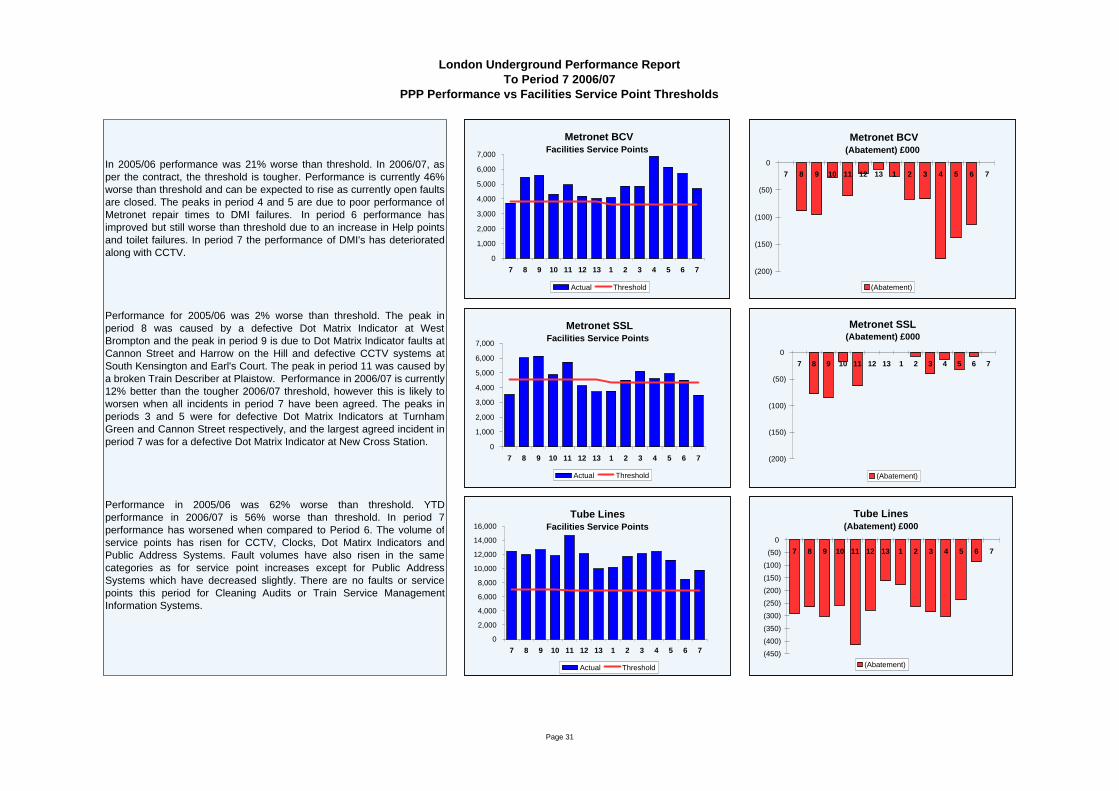
London Underground Performance ReportTo Period 7 2006/07
PPP Performance vs Facilities Service Point Thresholds
In 2005/06 performance was 21% worse than threshold. In 2006/07, asper the contract, the threshold is tougher. Performance is currently 46%worse than threshold and can be expected to rise as currently open faultsare closed. The peaks in period 4 and 5 are due to poor performance ofMetronet repair times to DMI failures. In period 6 performance hasimproved but still worse than threshold due to an increase in Help pointsand toilet failures. In period 7 the performance of DMI's has deterioratedalong with CCTV.
Performance for 2005/06 was 2% worse than threshold. The peak inperiod 8 was caused by a defective Dot Matrix Indicator at WestBrompton and the peak in period 9 is due to Dot Matrix Indicator faults atCannon Street and Harrow on the Hill and defective CCTV systems atSouth Kensington and Earl's Court. The peak in period 11 was caused bya broken Train Describer at Plaistow. Performance in 2006/07 is currently12% better than the tougher 2006/07 threshold, however this is likely toworsen when all incidents in period 7 have been agreed. The peaks inperiods 3 and 5 were for defective Dot Matrix Indicators at TurnhamGreen and Cannon Street respectively, and the largest agreed incident inperiod 7 was for a defective Dot Matrix Indicator at New Cross Station.
Performance in 2005/06 was 62% worse than threshold. YTDperformance in 2006/07 is 56% worse than threshold. In period 7performance has worsened when compared to Period 6. The volume ofservice points has risen for CCTV, Clocks, Dot Matirx Indicators andPublic Address Systems. Fault volumes have also risen in the samecategories as for service point increases except for Public AddressSystems which have decreased slightly. There are no faults or servicepoints this period for Cleaning Audits or Train Service ManagementInformation Systems.
Metronet SSL(Abatement) £000
(200)
(150)
(100)
(50)
0 7 8 9 10 11 12 13 1 2 3 4 5 6 7
(Abatement)
Tube Lines (Abatement) £000
(450)
(400)
(350)
(300)
(250)
(200)
(150)
(100)
(50)
0 7 8 9 10 11 12 13 1 2 3 4 5 6 7
(Abatement)
Metronet BCV (Abatement) £000
(200)
(150)
(100)
(50)
0 7 8 9 10 11 12 13 1 2 3 4 5 6 7
(Abatement)
Metronet BCV Facilities Service Points
0
1,000
2,000
3,000
4,000
5,000
6,000
7,000
7 8 9 10 11 12 13 1 2 3 4 5 6 7
Actual Threshold
Metronet SSL Facilities Service Points
0
1,000
2,000
3,000
4,000
5,000
6,000
7,000
7 8 9 10 11 12 13 1 2 3 4 5 6 7
Actual Threshold
Tube LinesFacilities Service Points
0
2,000
4,000
6,000
8,000
10,000
12,000
14,000
16,000
7 8 9 10 11 12 13 1 2 3 4 5 6 7
Actual Threshold
Page 31
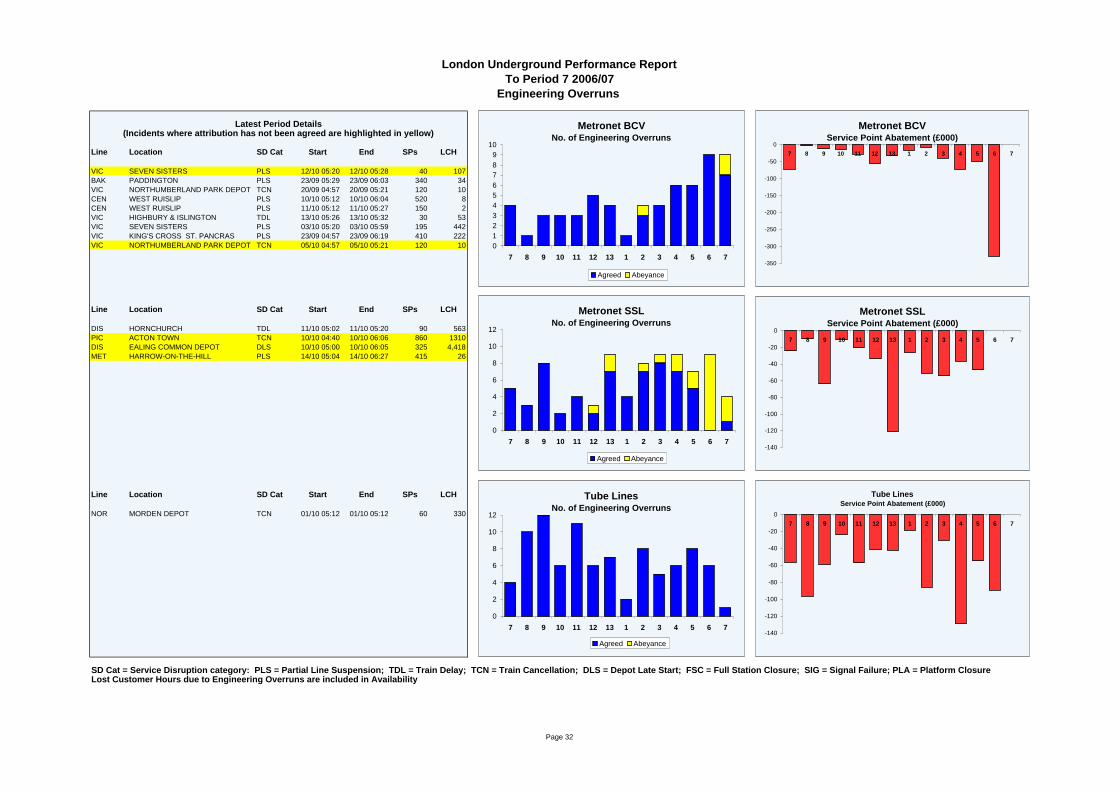
Line Location SD Cat Start End SPs LCH
VIC SEVEN SISTERS PLS 12/10 05:20 12/10 05:28 40 107BAK PADDINGTON PLS 23/09 05:29 23/09 06:03 340 34VIC NORTHUMBERLAND PARK DEPOT TCN 20/09 04:57 20/09 05:21 120 10CEN WEST RUISLIP PLS 10/10 05:12 10/10 06:04 520 8CEN WEST RUISLIP PLS 11/10 05:12 11/10 05:27 150 2VIC HIGHBURY & ISLINGTON TDL 13/10 05:26 13/10 05:32 30 53VIC SEVEN SISTERS PLS 03/10 05:20 03/10 05:59 195 442VIC KING'S CROSS ST. PANCRAS PLS 23/09 04:57 23/09 06:19 410 222VIC NORTHUMBERLAND PARK DEPOT TCN 05/10 04:57 05/10 05:21 120 10
0 0 0 00/01 00:00 00/01 00:00 0 0
Line Location SD Cat Start End SPs LCH
DIS HORNCHURCH TDL 11/10 05:02 11/10 05:20 90 563PIC ACTON TOWN TCN 10/10 04:40 10/10 06:06 860 1310DIS EALING COMMON DEPOT DLS 10/10 05:00 10/10 06:05 325 4,418MET HARROW-ON-THE-HILL PLS 14/10 05:04 14/10 06:27 415 26
0 0 0 00/01 00:00 00/01 00:00 0 00 0 0 00/01 00:00 00/01 00:00 0 00 0 0 00/01 00:00 00/01 00:00 0 00 0 0 00/01 00:00 00/01 00:00 0 0
Line Location SD Cat Start End SPs LCH
NOR MORDEN DEPOT TCN 01/10 05:12 01/10 05:12 60 3300 0 0 00/01 00:00 00/01 00:00 0 00 0 0 00/01 00:00 00/01 00:00 0 00 0 0 00/01 00:00 00/01 00:00 0 00 0 0 00/01 00:00 00/01 00:00 0 00 0 0 00/01 00:00 00/01 00:00 0 00 0 0 00/01 00:00 00/01 00:00 0 00 0 0 00/01 00:00 00/01 00:00 0 00 0 0 00/01 00:00 00/01 00:00 0 00 0 0 00/01 00:00 00/01 00:00 0 00 0 0 00/01 00:00 00/01 00:00 0 00 0 0 00/01 00:00 00/01 00:00 0 0
SD Cat = Service Disruption category: PLS = Partial Line Suspension; TDL = Train Delay; TCN = Train Cancellation; DLS = Depot Late Start; FSC = Full Station Closure; SIG = Signal Failure; PLA = Platform ClosureLost Customer Hours due to Engineering Overruns are included in Availability
(Incidents where attribution has not been agreed are highlighted in yellow)
London Underground Performance ReportTo Period 7 2006/07
Engineering Overruns
Latest Period Details Metronet BCVService Point Abatement (£000)
-350
-300
-250
-200
-150
-100
-50
07 8 9 10 11 12 13 1 2 3 4 5 6 7
Metronet SSLService Point Abatement (£000)
-140
-120
-100
-80
-60
-40
-20
07 8 9 10 11 12 13 1 2 3 4 5 6 7
Tube LinesService Point Abatement (£000)
-140
-120
-100
-80
-60
-40
-20
07 8 9 10 11 12 13 1 2 3 4 5 6 7
Metronet BCVNo. of Engineering Overruns
0123456789
10
7 8 9 10 11 12 13 1 2 3 4 5 6 7
Agreed Abeyance
Metronet SSLNo. of Engineering Overruns
0
2
4
6
8
10
12
7 8 9 10 11 12 13 1 2 3 4 5 6 7
Agreed Abeyance
Tube LinesNo. of Engineering Overruns
0
2
4
6
8
10
12
7 8 9 10 11 12 13 1 2 3 4 5 6 7
Agreed Abeyance
Page 32
1 of 3
AGENDA ITEM 8
TRANSPORT FOR LONDON
SURFACE ADVISORY PANEL SUBJECT: TfL’s CRIME AND DISORDER STRATEGY 2007-2008 MEETING DATE: 7 December 2006 1. INTRODUCTION
1.1. The purpose of this paper is to:
• Seek comments on TfL’s Draft Crime and Disorder Strategy 2007-2008 (attached) and seek approval for the revised strategy to be published for external consultation.
2. BACKGROUND & OBJECTIVES
2.1. TfL and the Mayor of London are wholly committed to improving safety and security on our transport services and tackling the issues that matter most to our passengers and staff. This was underpinned by the voluntary adoption of the provisions of Section 17 of the Crime and Disorder Act (the Act) by TfL Board on 24th May 2006. TfL made a commitment to consider the impact of its activities/projects on crime and disorder in London and where appropriate identify actions to reduce levels of crime and disorder as part of this process.
2.2. The development of TfL’s Crime and Disorder Strategy is an integral part of the implementation of Section 17 across the organisation. The Strategy provides the framework for a systematic, coordinated and sustainable approach to improving safety and security on the network.
2.3. The implementation of Section 17 of the Act and the development of TfL’s first Crime and Disorder strategy further strengthens this commitment and builds on the work that has already been undertaken to reduce crime and disorder and improve perceptions of safety and security on the TfL network.
3. CONSULTATION AND KEY DATES
3.1. The strategy has been circulated for internal comment which has also included consultation with the Metropolitan Police Service Transport Operational Command Unit and the British Transport Police.
3.2. The key dates for consultation include:
2 of 3
Internal consultation • London Underground Chief Operating Officer Group – 16th October • BTP Strategy and Coordination Group – 20th October • Legal, Equalities and Inclusion, Group Planning and Performance, Group
Communications – 31st October • London Rail Management Team – 1st November • TfL / MPS Combined Advisory Committee – 2nd November • Streets RISC – 8th November • Surface RISC – 10th November • Performance Indicator and Target setting meeting – 17th November • Surface Advisory Panel - 13th December
External consultation
• 22nd December - 2nd March 2007
Internal consultation
• 16th - 22nd March 2007 • Final version presented to TfL Board on 30th March 2007 • Strategy launched in April 2007
4. LEGAL IMPLICATIONS
4.1. The implementation of Section 17 provisions and the development of TfL’s Crime and Disorder Strategy will help ensure that TfL is fulfilling its requirements under the Act if TfL is designated as a Responsible Authority. Effective compliance monitoring will help to minimise the risk of legal challenge if individuals or groups feel that TfL is in breach of its duty.
5. FINANCIAL IMPLICATIONS
5.1. There is not expected to be any direct implications on funding. However, the Transport Policing and Enforcement Directorate (TPED) will work with other TfL Directorates to identify opportunities for consolidating existing budgets to ensure the most effective use of resources for delivering TfL’s Crime and Disorder Strategy.
6. CRIME AND DISORDER IMPLICATIONS
6.1. TfL’s Crime and Disorder Strategy will make a direct contribution to improving community safety across London. The Strategy builds on the work of TfL and its police partners to provide passengers and staff with a safe and secure transport environment and one that feels safe.
6.2. The Crime and Disorder Strategy provides the framework for how TfL and its
police partners intend to achieve reductions in crime, disorder and anti-social behaviour and improve perceptions of safety and security on the TfL network. It identifies TfL's strategic priority areas and priority crimes and the effective action required to deliver and sustain a reduction in crime and disorder and anti-social behaviour across the network.
3 of 3
6.3. Governance arrangements are currently being developed that will oversee
the delivery of the strategy and that will ensure that TfL and its police partners are accountable for their identified actions. Trends and performance towards objectives set out in the strategy will be reviewed regularly to improve future responses to crime, disorder and anti-social behaviour on the network.
7. EQUALITIES AND INCLUSION
7.1. The Crime and Disorder Strategy aims to provide overall benefits for passengers, staff and local communities by reducing crime, disorder and anti-social behaviour on and around the transport network. The Strategy identifies actions to target offenders, protect victims and reduce opportunities fore perpetrators to commit crimes that will deliver positive outcomes for all that use and work on the transport network.
7.2. The Strategy also identifies a number of strategic priority areas and priority crimes areas where TfL and its police partners intend to focus their efforts. While these efforts will deliver overall benefits to passengers and staff they will also seek to further protect vulnerable groups and help to ensure a more socially inclusive transport system. Hate crime is a priority crime for TfL and actions to address this are expected to benefit equalities groups. Likewise, efforts to reduce illegal minicab touting aim to reduce the number of sexual assaults on women in illegal minicabs.
7.3. Furthermore, TfL will be monitoring perceptions of safety and security by ethnicity to inform and improve our responses to crime and disorder and fear of crime on the network.
7.4. Comments on the Strategy from TfL’s Equalities and Inclusion Group have been incorporated. The Strategy will also be sent to equalities groups for consultation as part of the external consultation phase.
8. RECOMMENDATIONS
8.1. The Surface Advisory Panel is invited to comment on the draft TfL Crime and Disorder strategy

The Crime and Disorder Reduction Strategy is in draft form and will not be published with these papers. It will be made available after it has received Board Approval