
Underexplored Research Topics An Industry Perspective Erik Hoel esri esri Super Secret Research...
86
Underexplored Research Topics An Industry Perspective Erik Hoel esri esri Super Secret Research Laboratory, August 2011
-
Upload
cathleen-jones -
Category
Documents
-
view
216 -
download
0
Transcript of Underexplored Research Topics An Industry Perspective Erik Hoel esri esri Super Secret Research...
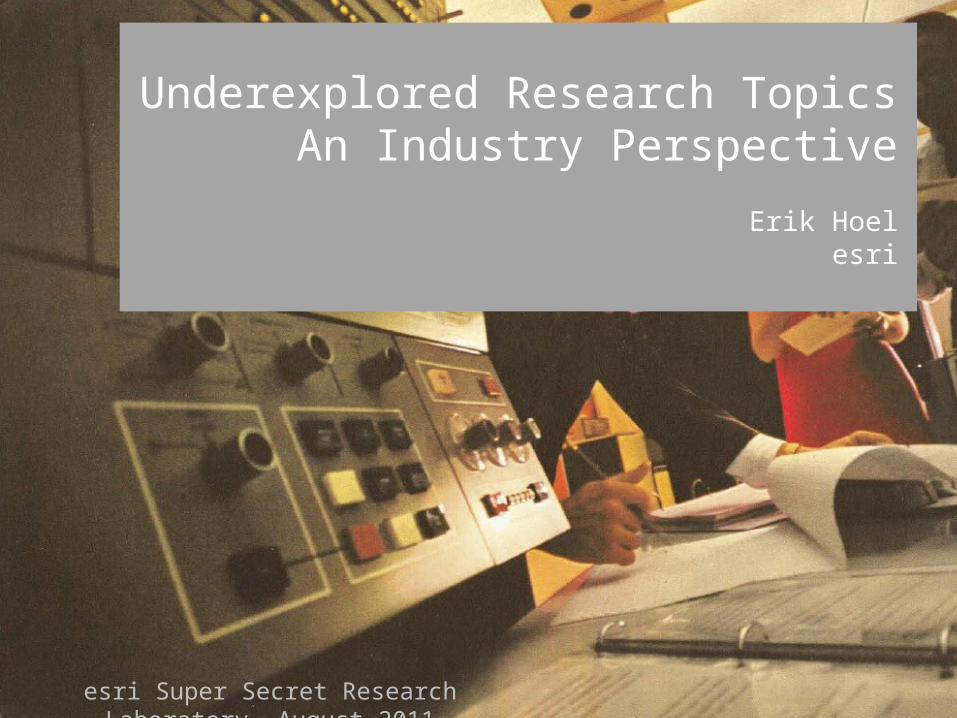
Underexplored Research TopicsAn Industry Perspective
Erik Hoelesri
esri Super Secret Research Laboratory, August 2011

2
Agenda
• History• Big Data• Imagery and Video• Lidar, Point Clouds, and 3D• Mobile Devices• Geostreaming• Dynamic GIS
3
Early History
• Problems – Forrest Management, Land Management, Transportation Planning, Military, …
• People – Garrison, Tobler, Tomlinson, Horwood, Fisher, etc.
• Places – Univ. of Washington, US Forest Service, Biological Records Centre, Canada Land Inventory, Harvard Graphics Lab
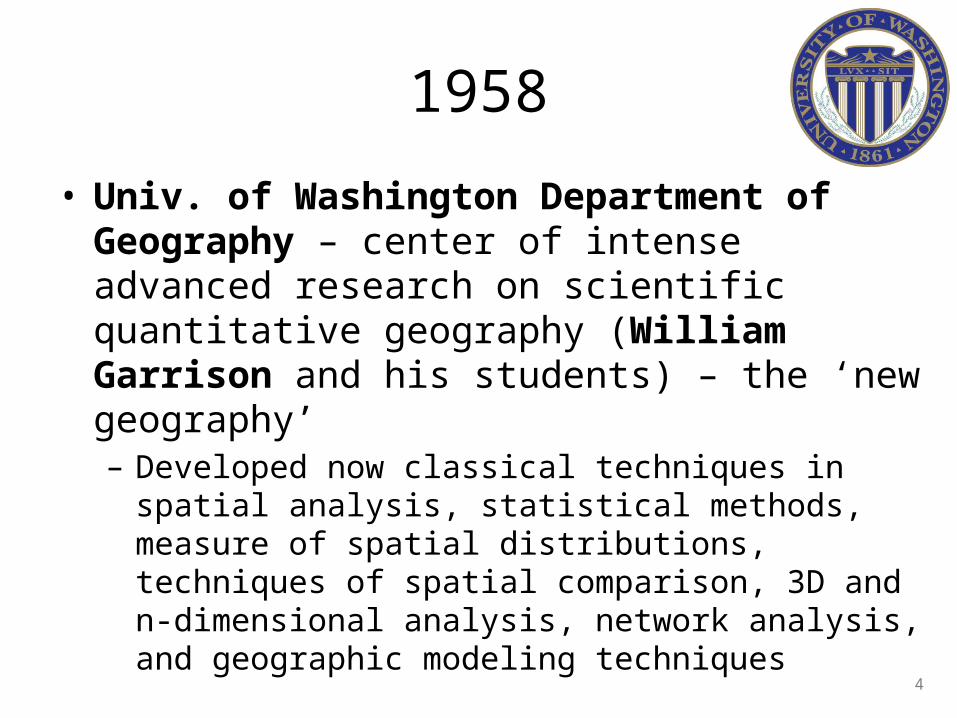
1958
• Univ. of Washington Department of Geography – center of intense advanced research on scientific quantitative geography (William Garrison and his students) – the ‘new geography’– Developed now classical techniques in spatial analysis,
statistical methods, measure of spatial distributions, techniques of spatial comparison, 3D and n-dimensional analysis, network analysis, and geographic modeling techniques
4
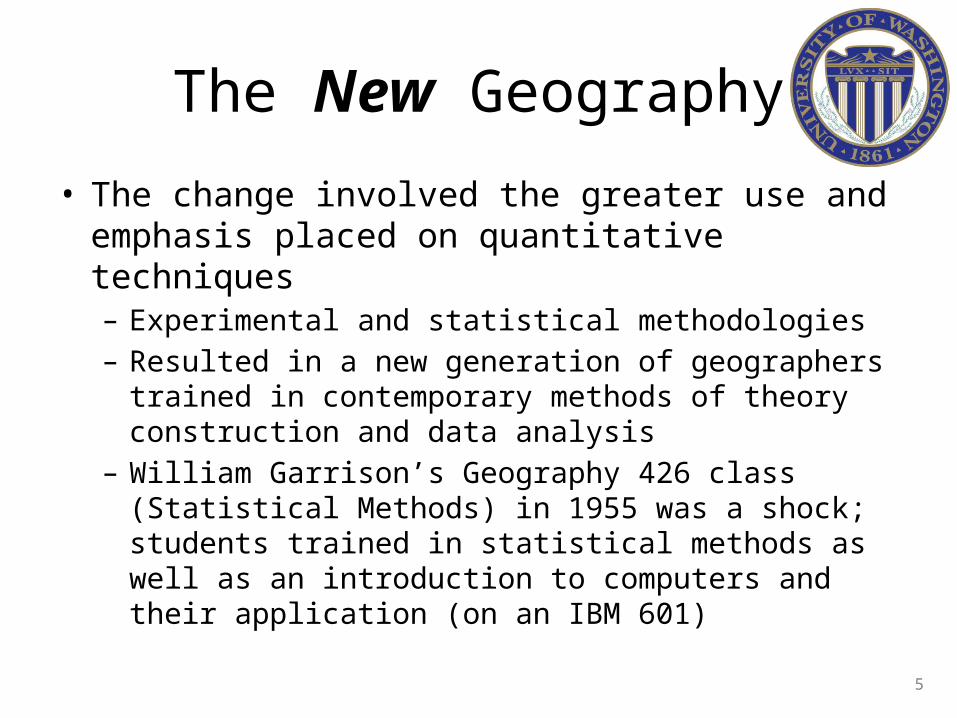
The New Geography
• The change involved the greater use and emphasis placed on quantitative techniques– Experimental and statistical methodologies– Resulted in a new generation of geographers trained in
contemporary methods of theory construction and data analysis
– William Garrison’s Geography 426 class (Statistical Methods) in 1955 was a shock; students trained in statistical methods as well as an introduction to computers and their application (on an IBM 601)
5

The New Geography
• Students of William Garrison:– Brian Berry – urban and regional research sparked
geography’s social-scientific revolution - the most-cited geographer for more than 25 years; member NAS
– William Bunge – theoretical geography (dependence of geographical theory on geometry and topological mathematics)
– John Nystuen – fundamental spatial concepts (distance, orientation, connectivity)
– Waldo Tobler – mathematics of projection, cartography– Other students: Duane Marble, Richard Morrill, Michael
Dacey, John Kolars, Art Getis, Bob Mayfield, Ron Boyce6

The New Geography
• Other active UW faculty included Edward Ullman and Donald Hudson
• As PhDs moved, many other faculty at other universities became involved in the movement; e.g.,– Richard Chorley, Peter Haggett, John Borchert, Leslie Curry,
Leslie King, and Maurice Yeates
7
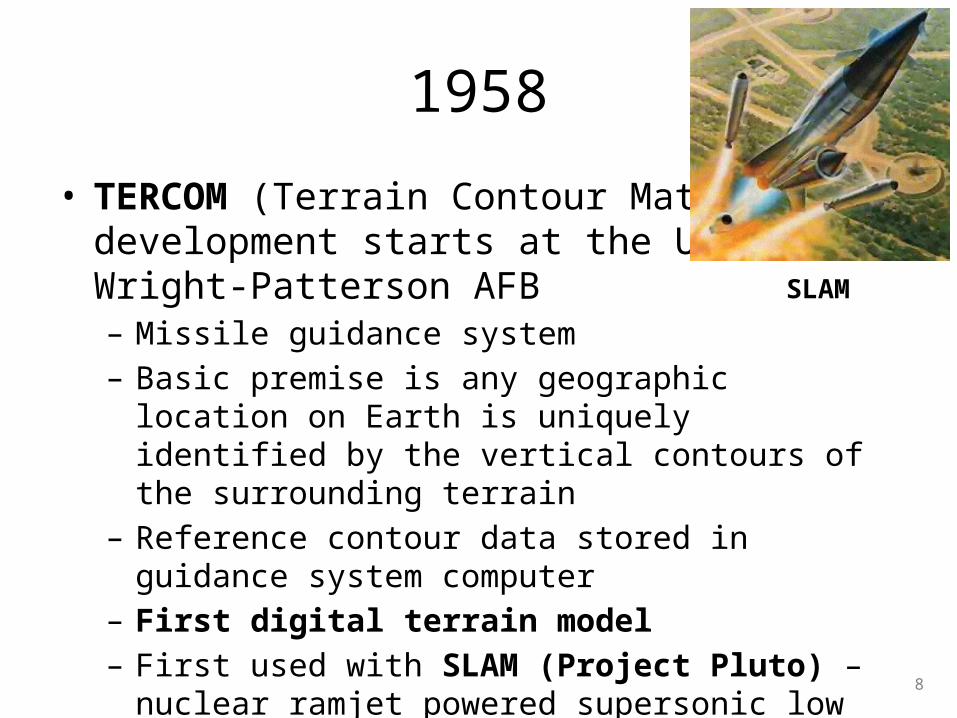
1958
• TERCOM (Terrain Contour Matching) development starts at the USAF’s Wright-Patterson AFB– Missile guidance system– Basic premise is any geographic location on Earth is
uniquely identified by the vertical contours of the surrounding terrain
– Reference contour data stored in guidance system computer
– First digital terrain model– First used with SLAM (Project Pluto) – nuclear ramjet
powered supersonic low altitude cruise missile
SLAM
8
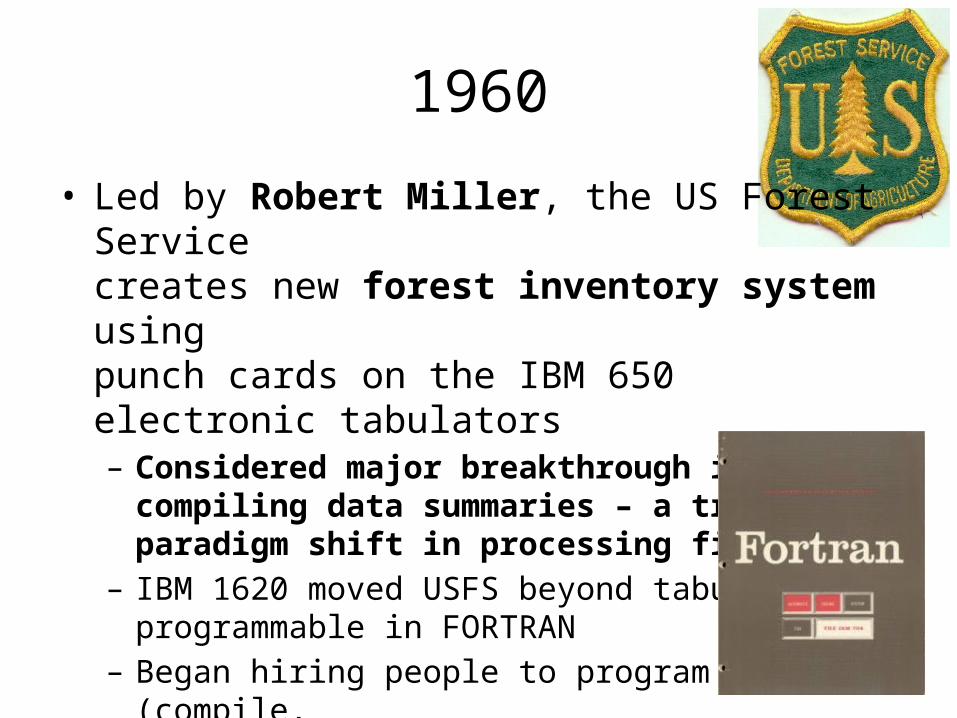
1960
• Led by Robert Miller, the US Forest Service creates new forest inventory system using punch cards on the IBM 650 electronic tabulators– Considered major breakthrough in compiling data
summaries – a true paradigm shift in processing field data– IBM 1620 moved USFS beyond tabulators;
programmable in FORTRAN– Began hiring people to program (compile,
edit, and analyze the data)

10
1962
• Max Waters and Franklyn Perring (Biological Records Centre - BRC) author the Atlas of British Flora– BRC held the atlas data on record cards and punched cards– ~1700 species– Used mechanical equipment for
data-processing, using 40-column punched cards
– One of the earliest machine readable geographical databases
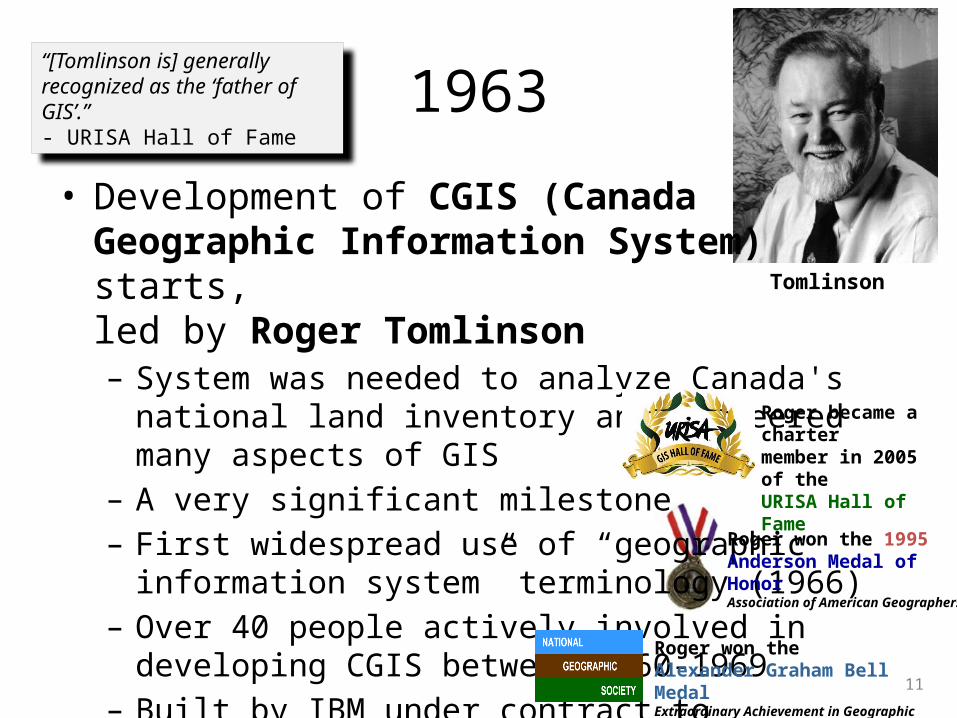
1963
• Development of CGIS (Canada Geographic Information System) starts, led by Roger Tomlinson– System was needed to analyze Canada's national land
inventory and pioneered many aspects of GIS– A very significant milestone– First widespread use of “geographic
information system” terminology (1966)– Over 40 people actively involved in
developing CGIS between 1960-1969– Built by IBM under contract to
the Canada Land Inventory
Tomlinson
Roger won the 1995 Anderson Medal of HonorAssociation of American Geographers
Roger won the Alexander Graham Bell Medal Extraordinary Achievement in Geographic Research
Roger became a chartermember in 2005 of the URISA Hall of Fame
“[Tomlinson is] generally recognized as the ‘father of GIS’.”- URISA Hall of Fame
11
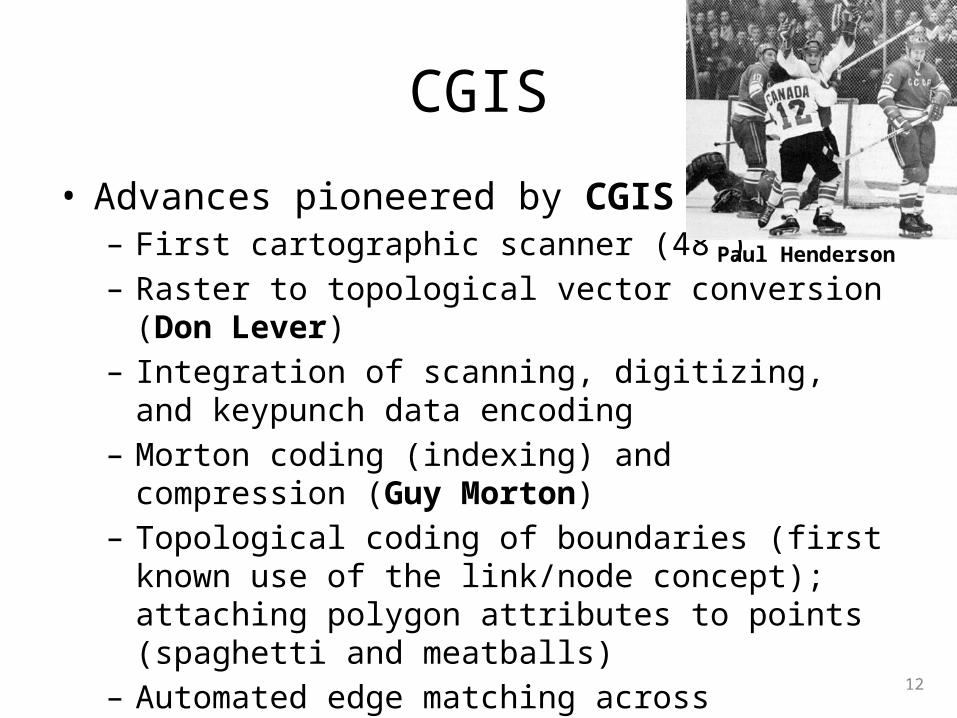
CGIS
• Advances pioneered by CGIS– First cartographic scanner (48”)– Raster to topological vector conversion (Don Lever)– Integration of scanning, digitizing, and keypunch data
encoding– Morton coding (indexing) and compression (Guy Morton)– Topological coding of boundaries (first known use of the
link/node concept); attaching polygon attributes to points (spaghetti and meatballs)
– Automated edge matching across tiles/sheets– Spatial coordinate systems– Command language for data overlay
Paul Henderson
12
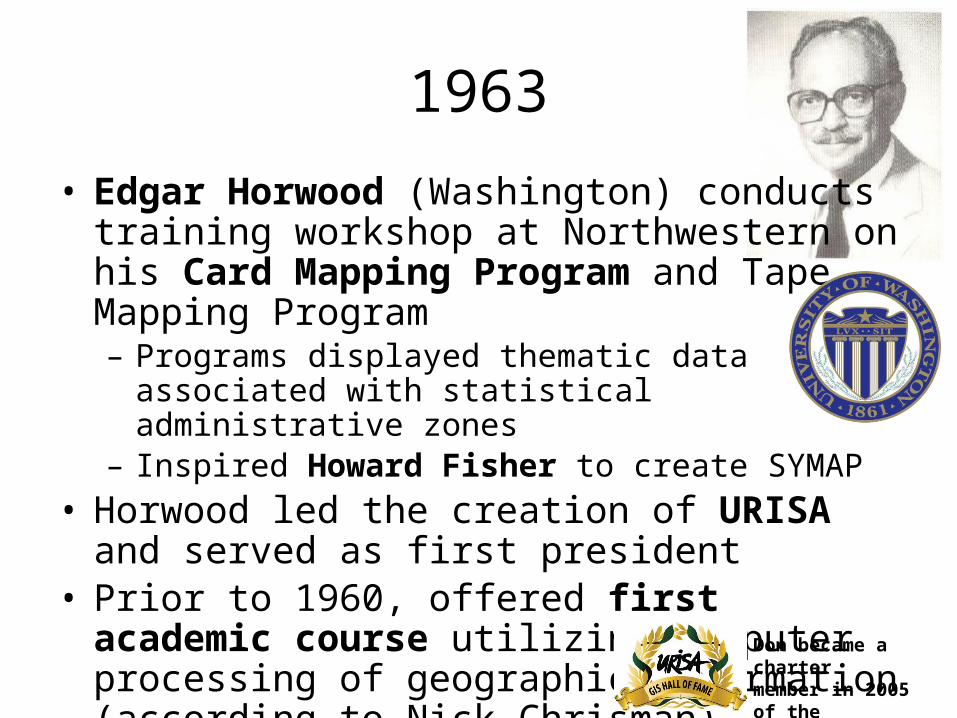
1963
• Edgar Horwood (Washington) conducts training workshop at Northwestern on his Card Mapping Program and Tape Mapping Program– Programs displayed thematic data associated with
statistical administrative zones– Inspired Howard Fisher to create SYMAP
• Horwood led the creation of URISA and served as first president
• Prior to 1960, offered first academic course utilizing computer processing of geographic information (according to Nick Chrisman)
Don became a chartermember in 2005 of the URISA Hall of Fame

Horwood’s Short Laws
1. Good data is the data you already have2. Bad data drives out good3. The data you have for the present crisis was
collected to relate to the previous one4. The respectability of existing data grows with
elapsed time and distance from the data source to the investigator
5. Data can be moved from one office to another but it cannot be created or destroyed
14
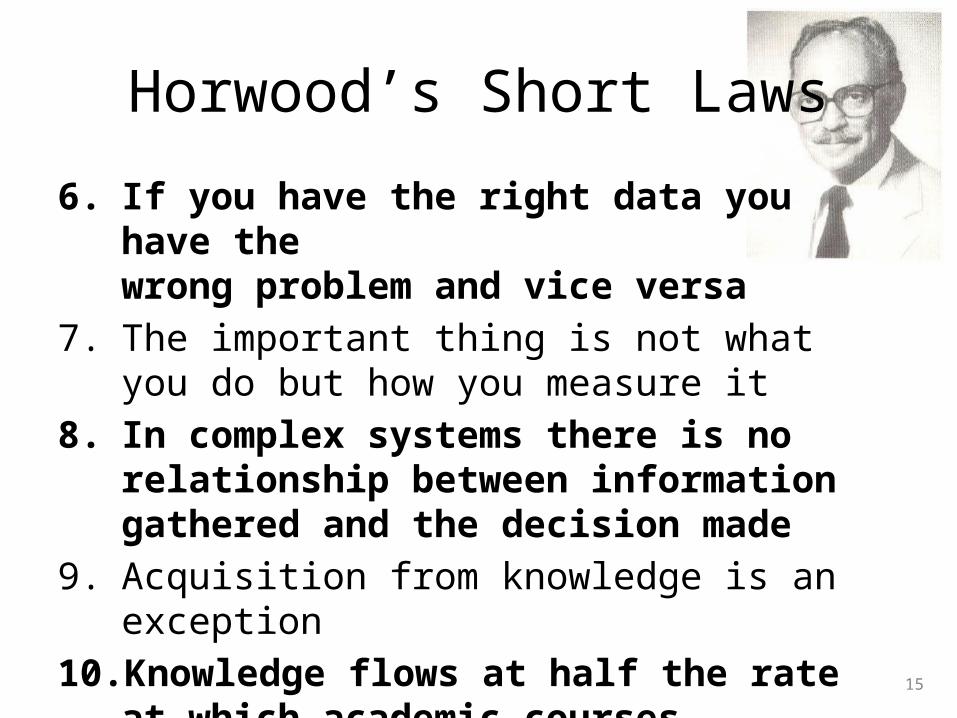
Horwood’s Short Laws
6. If you have the right data you have the wrong problem and vice versa
7. The important thing is not what you do but how you measure it
8. In complex systems there is no relationship between information gathered and the decision made
9. Acquisition from knowledge is an exception10. Knowledge flows at half the rate at which
academic courses proliferate15
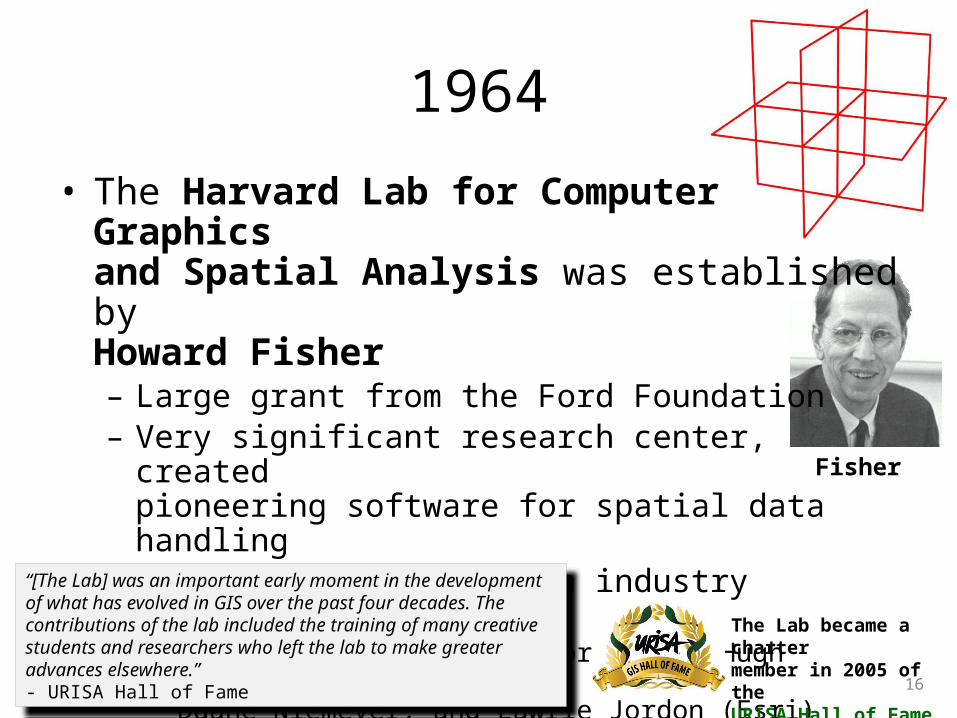
1964
• The Harvard Lab for Computer Graphics and Spatial Analysis was established by Howard Fisher– Large grant from the Ford Foundation– Very significant research center, created
pioneering software for spatial data handling– Many key individuals in industry participated:
• Jack Dangermond, Scott Morehouse, Hugh Keegan, Duane Niemeyer, and Lawrie Jordon (Esri)
• David Sinton (Intergraph), Lawrie Jordon and Bruce Rado (ERDAS)
Fisher
The Lab became a chartermember in 2005 of the URISA Hall of Fame
“[The Lab] was an important early moment in the development of what has evolved in GIS over the past four decades. The contributions of the lab included the training of many creative students and researchers who left the lab to make greater advances elsewhere.”- URISA Hall of Fame
16
Harvard Lab
• Many key academics also participated:– Nick Chrisman– Geoff Dutton – Randolf Franklin– Tom Poiker– Carl Steinitz– William Warntz
17
Harvard Packages
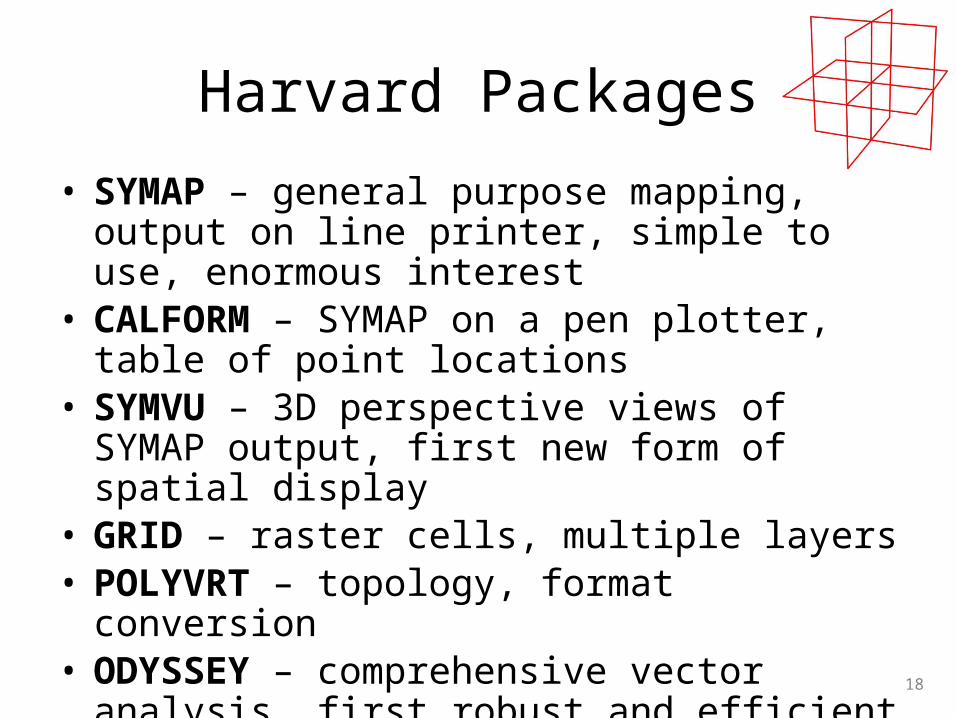
• SYMAP – general purpose mapping, output on line printer, simple to use, enormous interest
• CALFORM – SYMAP on a pen plotter, table of point locations
• SYMVU – 3D perspective views of SYMAP output, first new form of spatial display
• GRID – raster cells, multiple layers• POLYVRT – topology, format conversion• ODYSSEY – comprehensive vector analysis, first
robust and efficient polygon overlay (including sliver removal)
18

1970
• First Law of Geography by Waldo Tobler– Everything is related to everything else, but near
things are more related than distant things• First GIS conference sponsored by the
International Geographical Union (IGU)– Representatives of all known GIS systems
invited– 40 participants
Tobler
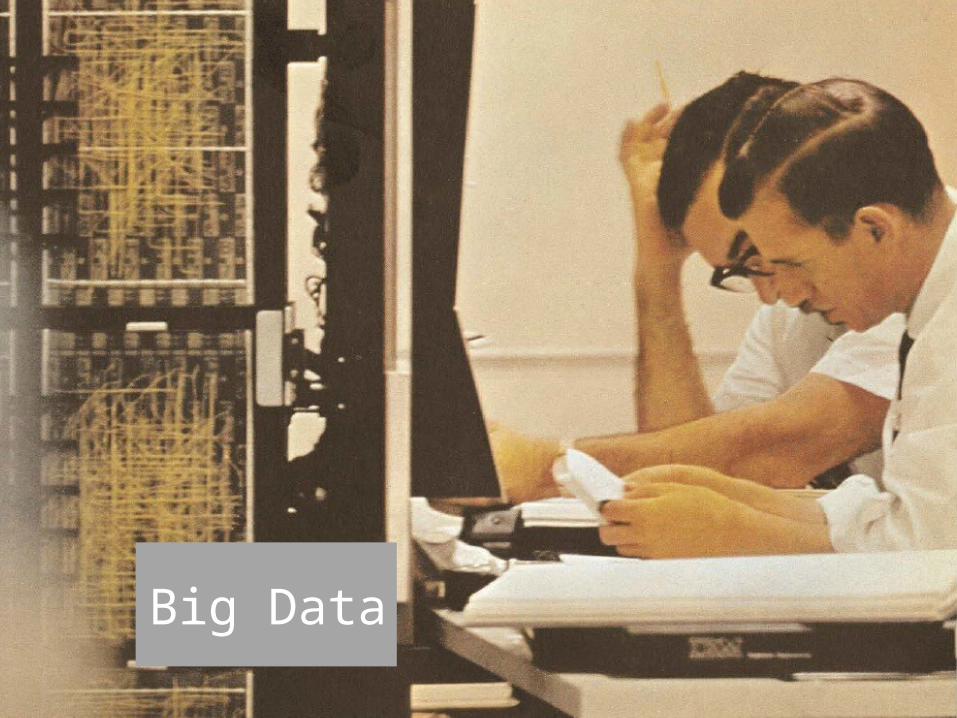
Big Data

21
Big Data
• Basically, extremely scalable analytics
• The three Vs– Volume – petabytes and more– Velocity – real time acquisition and analysis– Variety – structured, unstructured, and semi-structured

22
Big Data
• Example data– Full motion video– Multi/hyper-spectral imagery– Cell phone calls– Register transactions– Lidar/point clouds– Email/tweets
• Space/time critical
23
Big Data
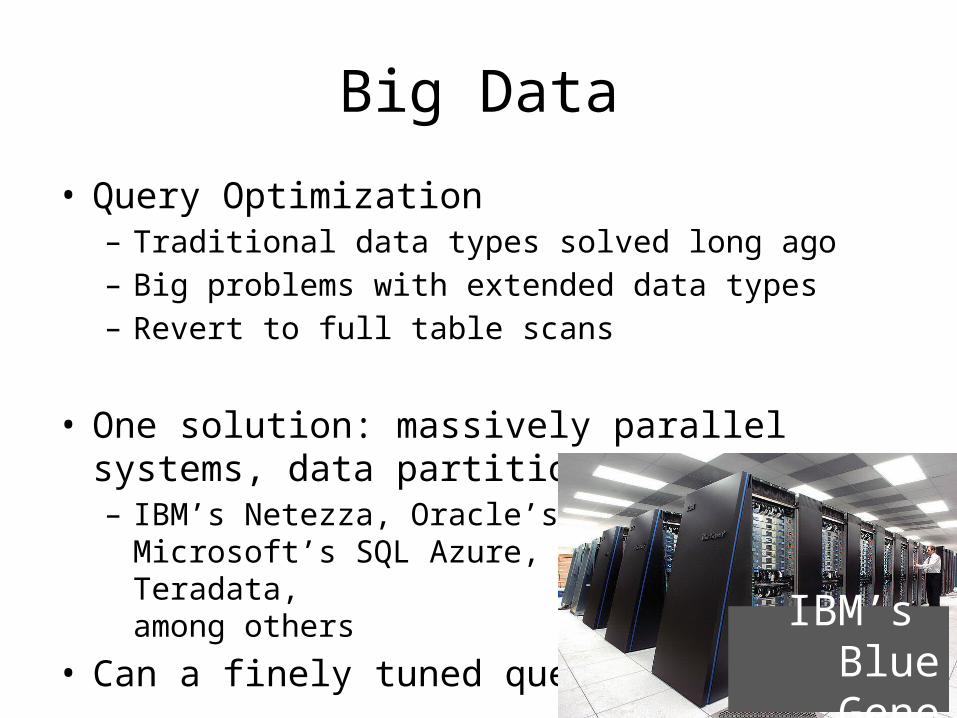
• Query Optimization– Traditional data types solved long ago– Big problems with extended data types– Revert to full table scans
• One solution: massively parallel systems, data partitioning, etc.– IBM’s Netezza, Oracle’s Exadata, Microsoft’s SQL Azure,
Apache’s Hadoop, Teradata, among others
• Can a finely tuned query win? IBM’s Blue Gene

24
Big Data
• How to stream for real time event processing– Store to disk/post process– Analyst with manual inspection– Slow
• How to persist/partition and rapidly search
25
Big Data
• Search criterion controlling storage– Based upon predicate filtering– Temporal, then spatial, or vice versa– Placenames– Type of attribute/tags
• Sensor platform attributes
– Column-oriented stores
26
Big Data
• Peeking at data as it flows in
• Identify interesting bits, ignore most– When is something near, when does something cross …– Query optimization problem
• Existing frameworks– Microsoft, Oracle, IBM, etc.
27
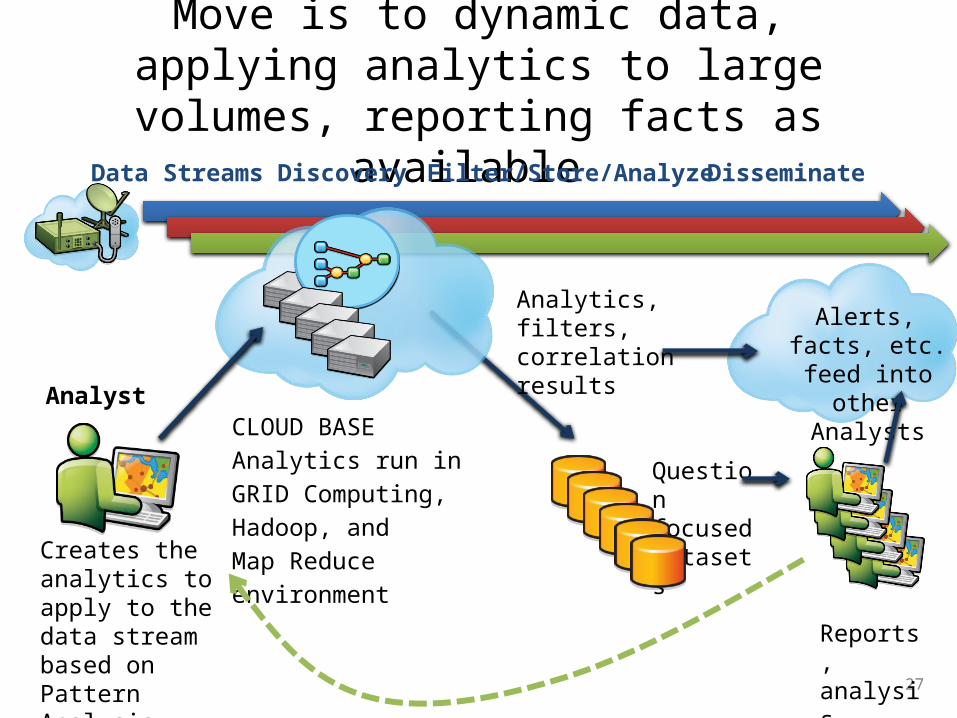
Move is to dynamic data, applying analytics to large volumes, reporting facts as available Data Streams
Creates the analytics to apply to the data stream based onPattern Analysis
CLOUD BASEAnalytics run inGRID Computing,Hadoop, and Map Reduceenvironment
Analyst
Question focused datasets
Analytics, filters, correlation results
Reports, analysis, other web pages
Alerts, facts, etc. feed into other
Analysts
Discovery Filter/Store/Analyze Disseminate
28
Big Data
• Detecting patterns, connecting thing together– Social media type stuff with spatial/temporal
• Cash register transactions, cell phone calls• Pattern of life
– “Connecting the dots spatially”
• Knowns and unknowns– How to assign unknowns to knows– How to assign confidences
Temporal Anomalies
• A half-million Enron e-mails from ~150 accounts were sent from 1999 to 2001, a period when Enron executives were manipulating financial data, making false public statements, engaging in insider trading, and the company was coming under scrutiny by regulators
• The graph reveals a map of a week's e-mail patterns in May 2001, when a new name suddenly appeared– This week's pattern differed greatly from others, suggesting different
conversations were taking place that might interest investigators

Temporal Anomalies
31
Big Data
• Spatio-temporal web crawlers– Trends and spatial activity– Social media– Meaningful persistence
• Fast, geolocate, query
32
Non-traditional Data
• Lots of non-spatial data– CSV/TXT files, Excel spreadsheets, news feeds, social media
• Coarse grained spatial data– City level, not down to 10 meters …– E.g., Fukushima radiation
• Geoprocessing and trend analysis/detection
Imagery and Video
34
Imagery
• Data management problems solved
• Reliable feature extraction – Very high value/demand area
• Data fusion
• Full motion video
35
Reliable Feature Extraction
• Need ability to combine image sources with algorithms– E.g., GeoEye-1 + easy to use tools -> rooftops
• Users willing to tie capabilities to sources– With EROS B, here are 4 things you can do– With SPOT5, here are 5 things you can do …
• Currently, image processing systems need PhD level analysts to run semi-automated systems– Solutions attempt to be too general

36
Not so good user experience
37
Reliable Feature Extraction
• Feature extraction is a huge deal even if tied to a specific commercial data source– Key is not to be too generic
• 3D feature extraction– Trees from point clouds– Signage from car imagery

38
Object Recognition
• Identification of objects at a coarse level– Simpler than feature extraction (a car vs. Fred’s car)– Analyze shape with simple transformation– Examples:
• Where are the planes at the airport (not which planes are at the airport)?
• Where are the parking spaces in a city, how many are there?
• Image understanding– Not edge detection, …<image>
39
Object Recognition
• Identification of objects at a coarse level– Simpler than feature extraction (a car vs. Fred’s car)– Analyze shape with simple transformation– Examples:
• Where are the planes at the airport (not which planes are at the airport)?
• Where are the parking spaces in a city, how many are there?
• Image understanding– Not edge detection, …<image>
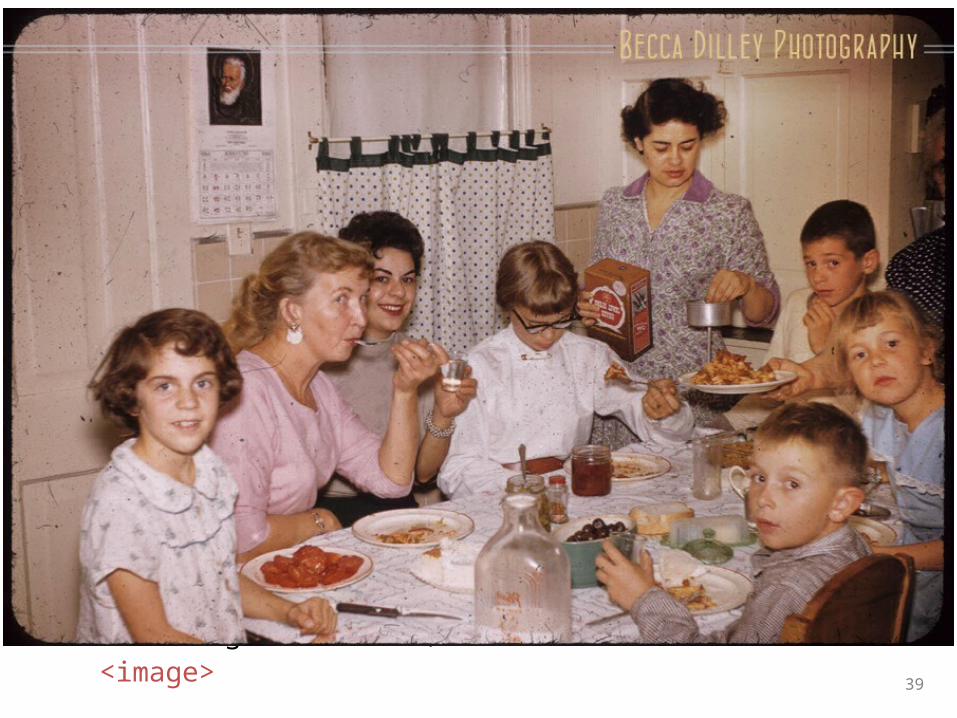
Family eating a weekend breakfast in the late 1950s/early 1960s
41
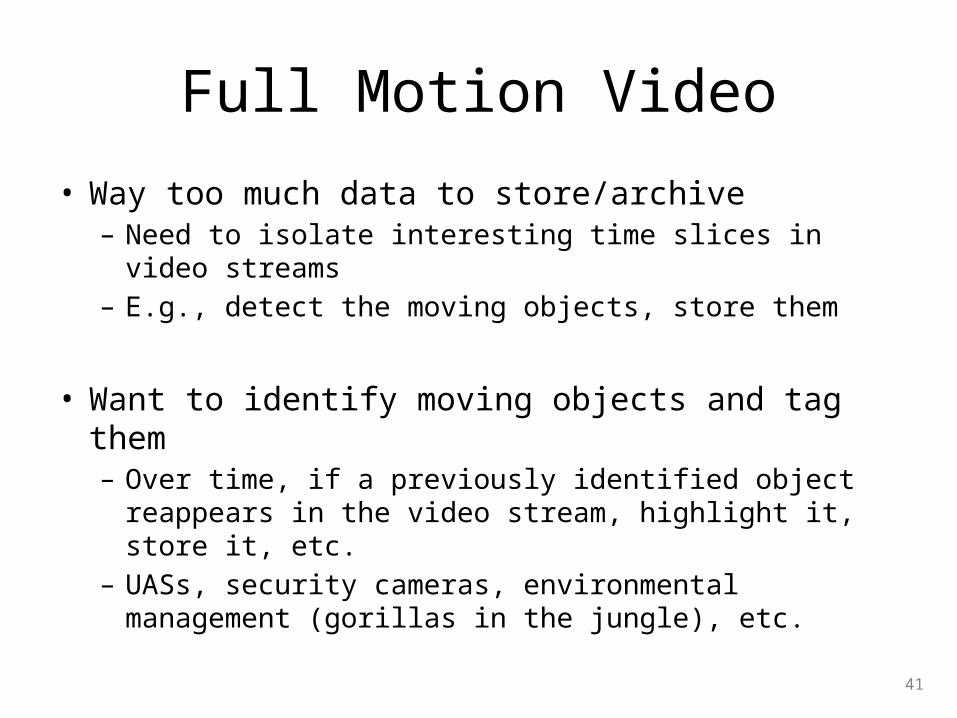
Full Motion Video
• Way too much data to store/archive– Need to isolate interesting time slices in video streams– E.g., detect the moving objects, store them
• Want to identify moving objects and tag them– Over time, if a previously identified object reappears in the
video stream, highlight it, store it, etc.– UASs, security cameras, environmental management
(gorillas in the jungle), etc.
42
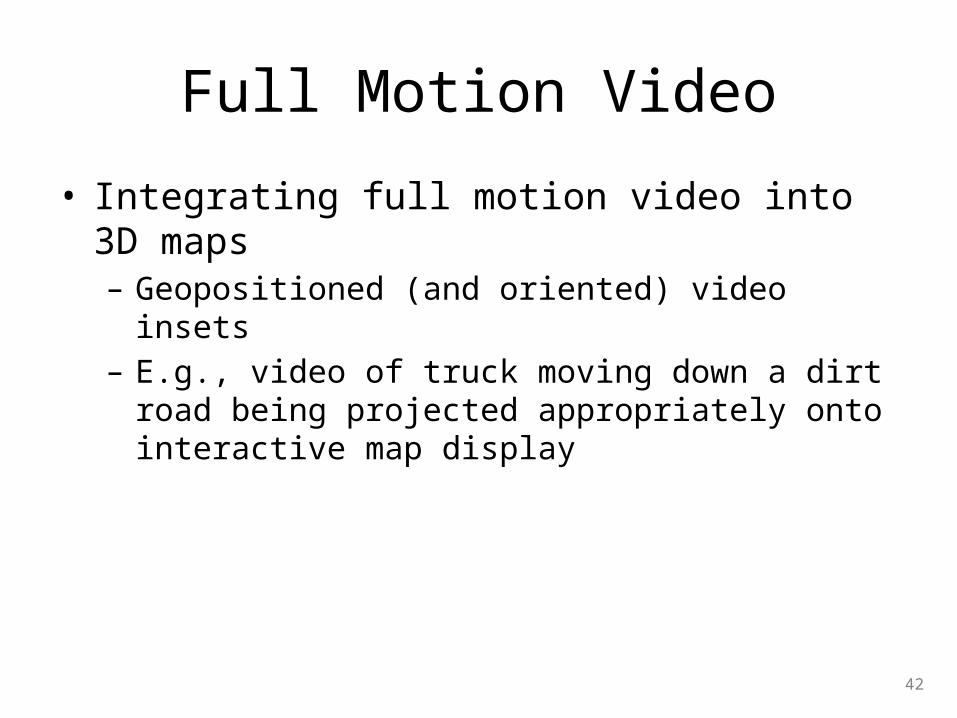
Full Motion Video
• Integrating full motion video into 3D maps– Geopositioned (and oriented) video insets– E.g., video of truck moving down a dirt road being
projected appropriately onto interactive map display

43
Compression
• Lots of good general purpose compression– Wireless carriers doing a lot of work (3G vs. 4G)
• Need data specific compression techniques– Compression tied to data or type of request– Optimize the transport; huge issue with wireless– E.g., User A wants 10m accuracy data, User B wants 50m
accuracy data
– Need table compression, not row by row compression
44
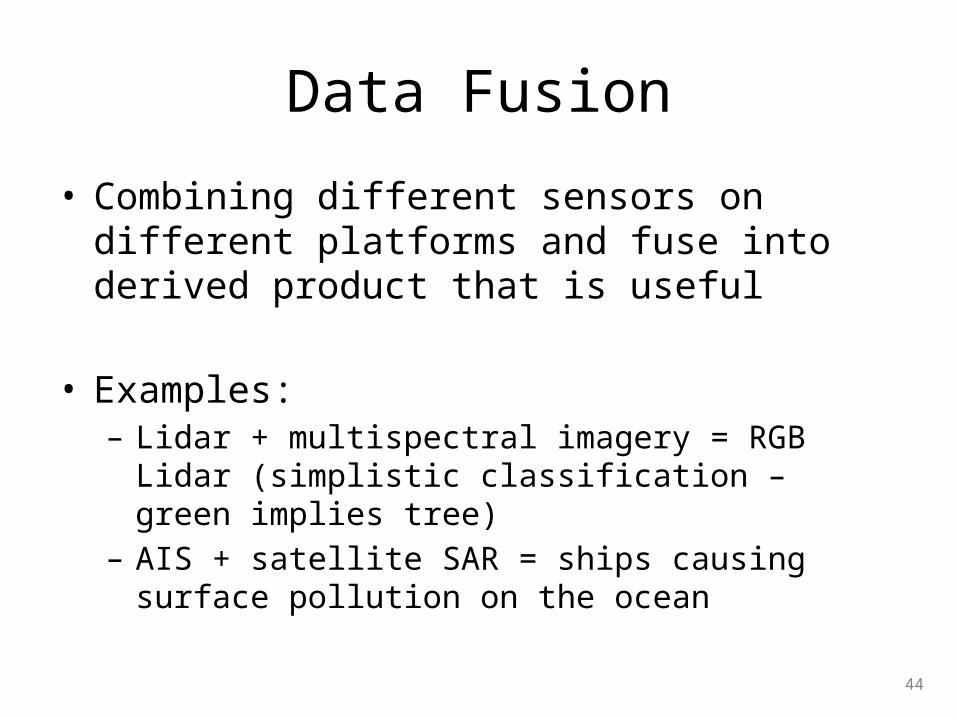
Data Fusion
• Combining different sensors on different platforms and fuse into derived product that is useful
• Examples: – Lidar + multispectral imagery = RGB Lidar (simplistic
classification – green implies tree)– AIS + satellite SAR = ships causing surface pollution on the
ocean

45
Data Fusion
• Future example: imagery + range detection = mensuration– How tall is a building?
• Platform – combination of hardware and software that is placed on satellite, UAS, or aircraft– Platform to find IEDs – hyperspectral imagery and SAR– Platform to find rooftops – which sensors and software?
46
Imagery
• Imagery is more than a pretty background in GIS– Hard to convince people it is useful

Topology Editing
Lidar, Point Clouds and 3D

48
Lidar
• There is lots of Lidar out there, what can be done in specific problem domains?– E.g, vegetation growth near powerlines
• Lidar needs to move beyond basic classification, visualization, surface generation, and change detection; e.g., – Immersive point clouds – Inside buildings
<Petrovic video>
49
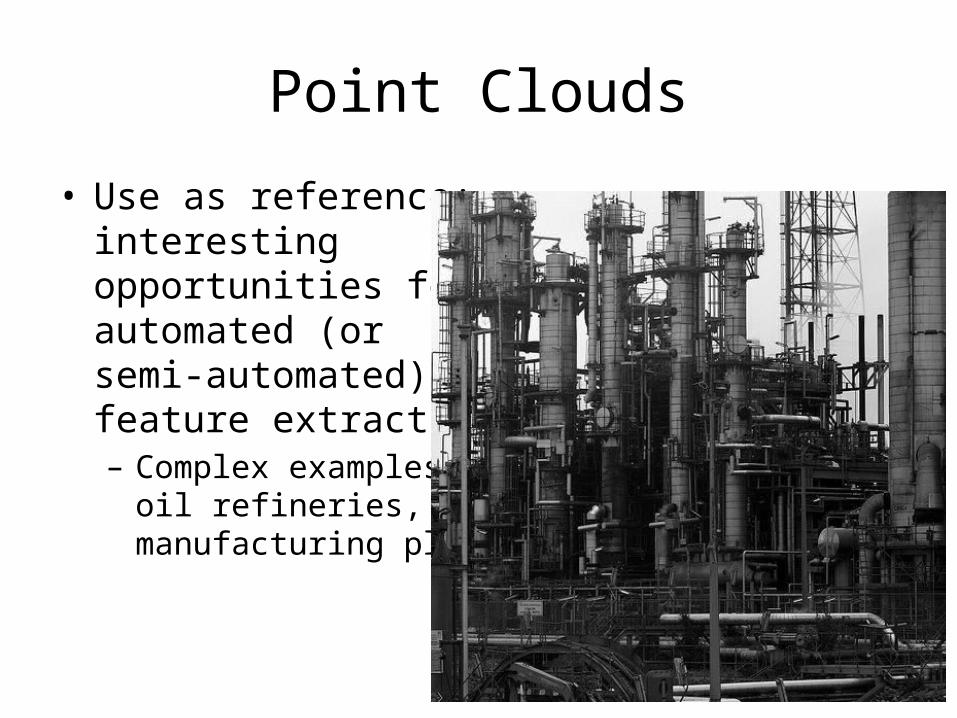
Point Clouds
• Use as reference; interesting opportunities for automated (or semi-automated) feature extraction– Complex examples:
oil refineries, manufacturing plants
50
3D
• Still large disconnect between 2D and 3D– Collected and stored differently
• E.g., store a tree as a point with attributes and rules, applied at runtime for visualization or analysis
• AutoCAD
• Analytical 3D still in infancy– Mining industry is where big interest is
• Visual analytics– Seeing trends/relationships
51
3D
• The ability to manage 3D features is problematic– Editing workflows and input devices are still awkward to
use– Look to Hollywood?
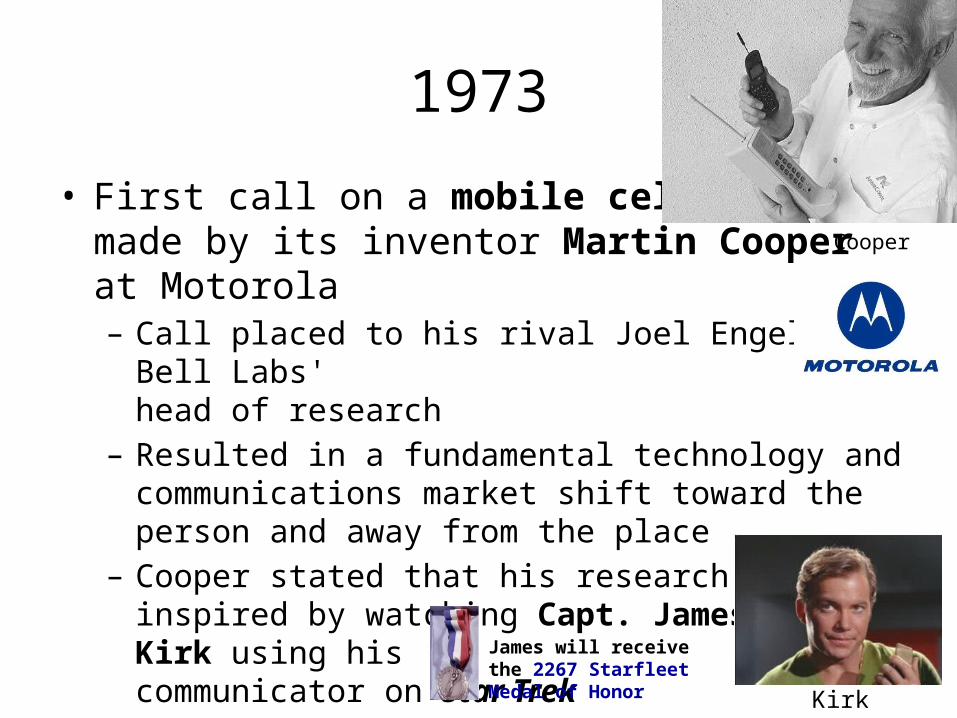
1973
• First call on a mobile cell phone made by its inventor Martin Cooper at Motorola– Call placed to his rival Joel Engell, Bell Labs'
head of research– Resulted in a fundamental technology and communications
market shift toward the person and away from the place– Cooper stated that his research was inspired by
watching Capt. James T. Kirk using his communicator on Star Trek
Cooper
Kirk
James will receive the 2267 Starfleet Medal of Honor
53
Modeling Hierarchies
• Modeling building interiors and cities very difficult– Hierarchies (table, room, apartment, floor, building, block,
city, …) without redundancy– 3D, networks, infrastructure, underground– How to merge/abstract
<Sydney video>
VersioningMobile Devices

55
Mobile Devices
• Developing for mobile “feels like Windows 95”– Primitive by today’s standards
• Data storage remains the biggest challenge– RDBMS-based storage problematic– Still using traditional techniques – e.g., R-tree in
conjunction with SQLite
– >>95% of time is spent drawing• RDBMS not optimized for this
56
Mobile Devices
• Need good spatial clustering and column-based structuring
• Need to move beyond RDBMS and SQL– Expressing search still hard – time, space, attributes,
network connectivity, etc.

57
Mobile Devices
• How do these fit into the remote sensing community?– Lots of info with all the photos
• Consider micro-platforms on mobile devices– Everyone is a walking sensor– Imagery, accelerometers, inclinometers
• Does it make sense to build platforms on mobile devices?
58
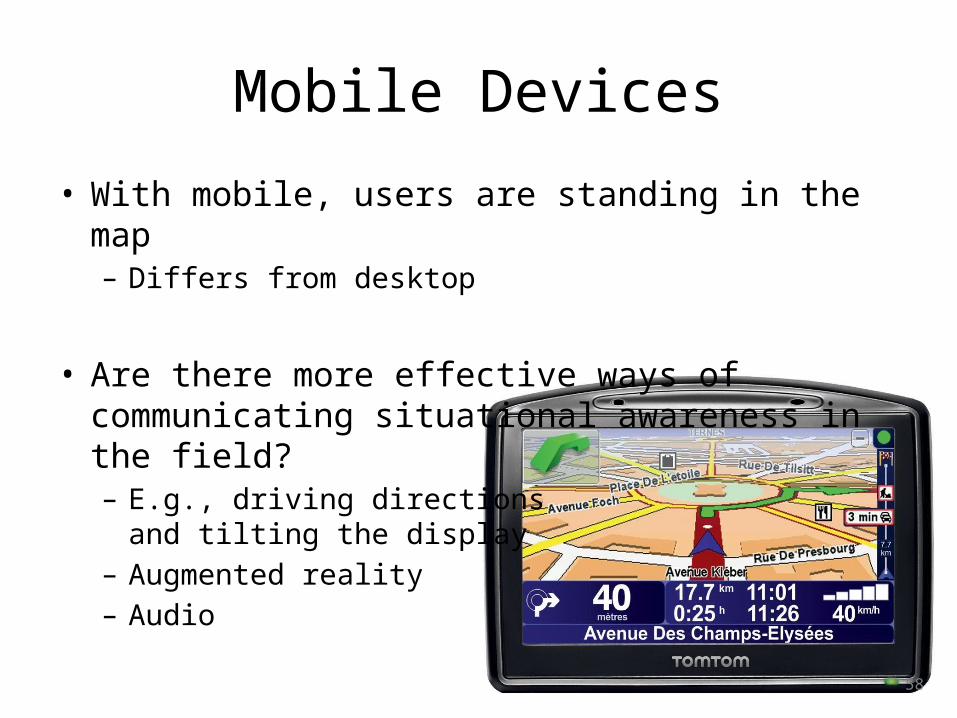
Mobile Devices
• With mobile, users are standing in the map– Differs from desktop
• Are there more effective ways of communicating situational awareness in the field?– E.g., driving directions
and tilting the display– Augmented reality– Audio
59
Mobile Devices
• Current examples– Earthquake detection– Pothole detection
• Future examples– GM’s OnStar-like. system – your phone detects travel on
road and sudden violent deceleration; auto-calls for help– You have a skin rash – take a multispectral image of it and
upload to a doctor service. What kind of rash is it? Do I need to be seen by the doctor? Is over the counter OK?
– Don Cooke’s cat
60
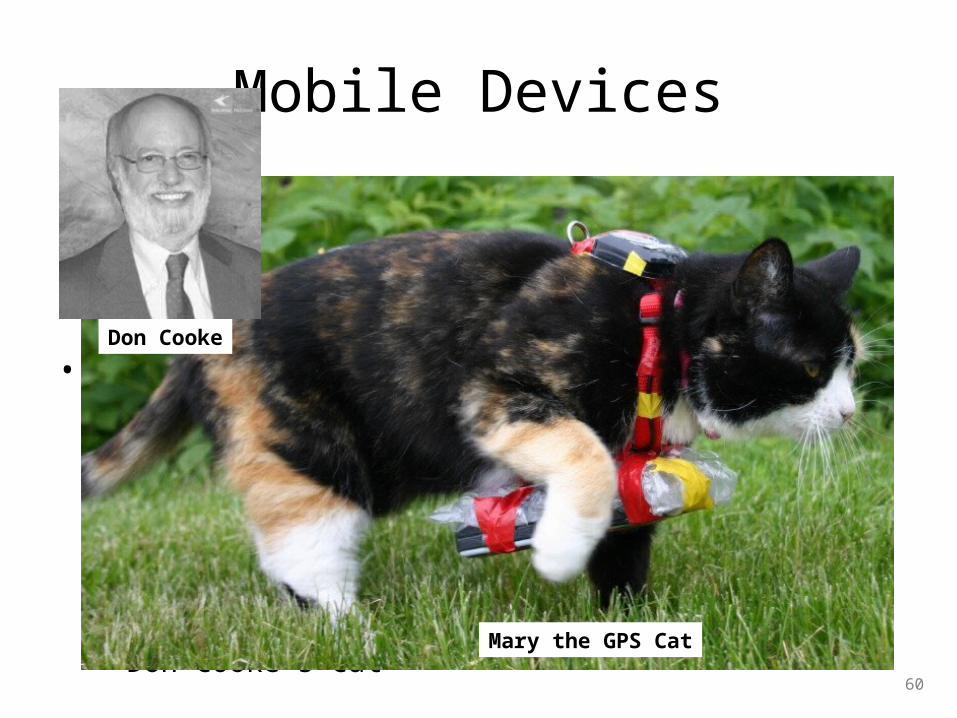
Mobile Devices
• Current examples– Earthquake detection– Pothole detection
• Future examples– GM’s OnStar system – your phone detects travel on road
and sudden violent deceleration; auto-calls for help– You have a skin rash – take a multispectral image of it and
upload to a doctor service. What kind of rash is it? Do I need to be seen by the doctor? What do I do?
– Don Cooke’s cat
Don Cooke
Mary the GPS Cat

Mobile Devices
• Tablets are a disruptor– Screen real estate, power, usability, portability
• Replacing traditional devices– E.g., Field engineers replacing high-end GPS units
and ruggedized PCs (~$5000) with an iPad (~$800) that has built in GPS and wireless; or United Airlines replacing 34 lbs. of pilot charts (11,000 units)
– Cheaper, lighter, more useful
– Are disks needed in the future?
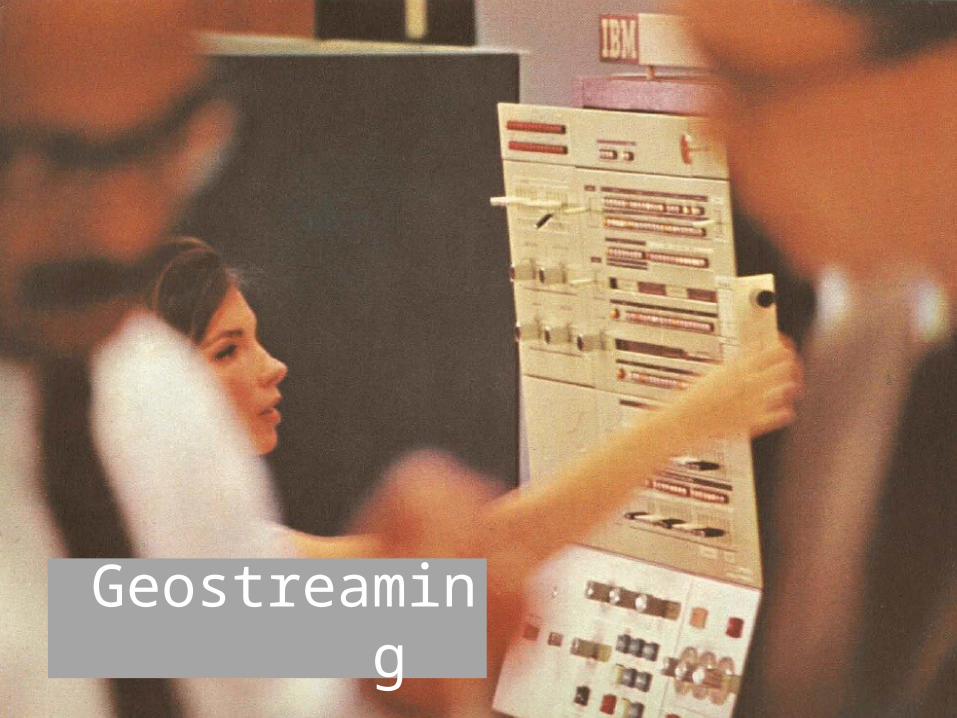
Data Model Design Geostreaming
63
Geostreaming
• Lots of work during past decade on stream processing– Big, sophisticated systems in place, particularly in financial
services/Wall Street and defense/intel
• Available commercial frameworks:– Microsoft, Oracle, IBM, StreamBase, Tibco, etc.
• Need to extend into spatial domain
64
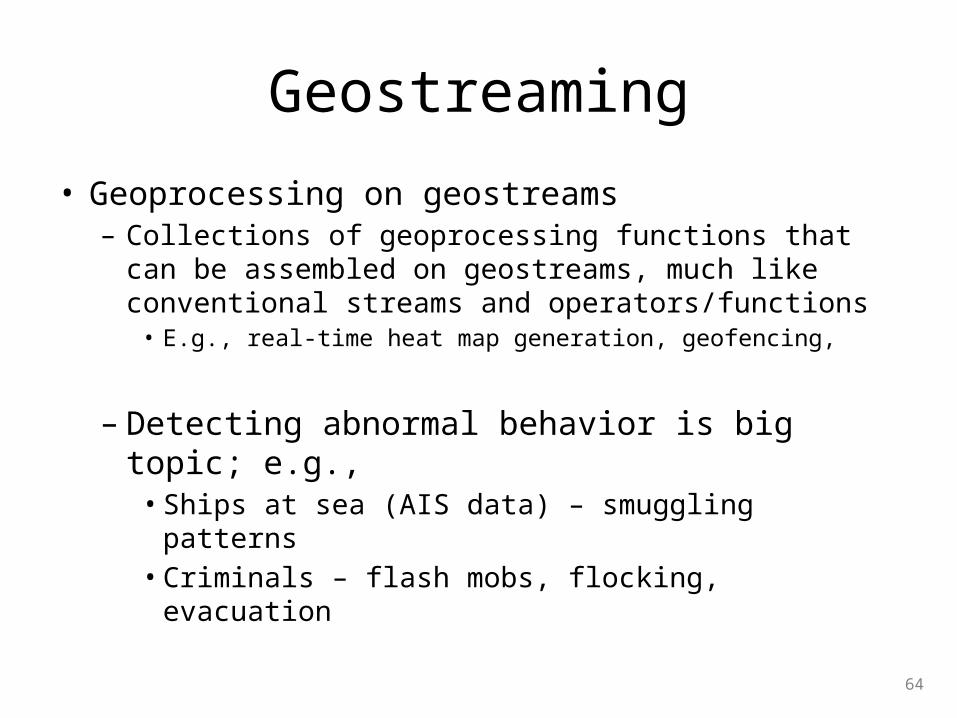
Geostreaming
• Geoprocessing on geostreams– Collections of geoprocessing functions that can be
assembled on geostreams, much like conventional streams and operators/functions• E.g., real-time heat map generation, geofencing,
– Detecting abnormal behavior is big topic; e.g.,• Ships at sea (AIS data) – smuggling patterns• Criminals – flash mobs, flocking, evacuation
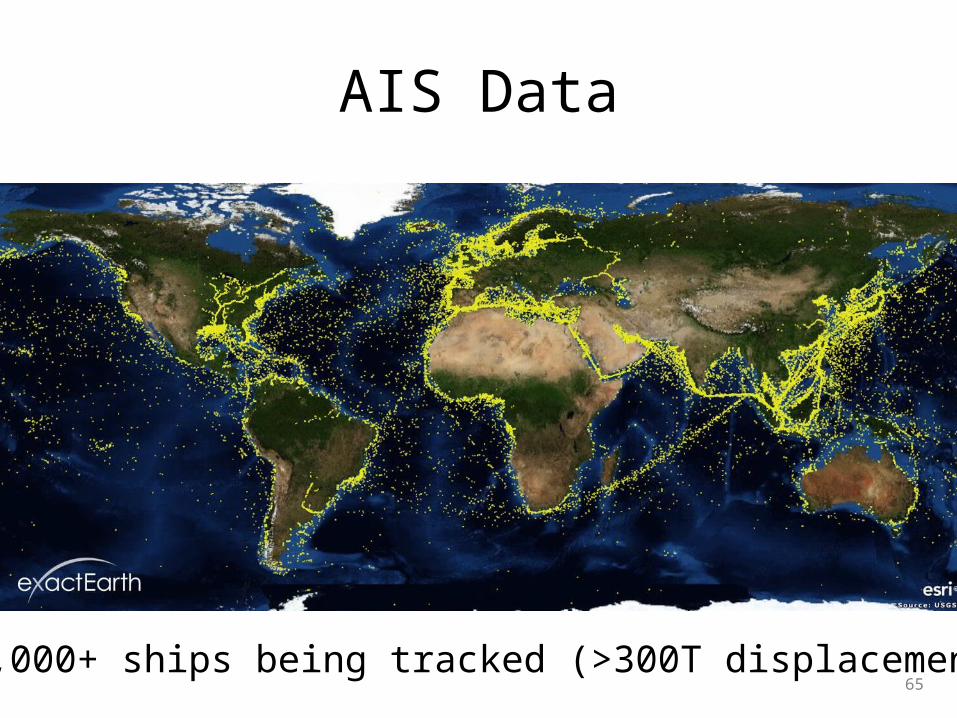
65
AIS Data
70,000+ ships being tracked (>300T displacement)
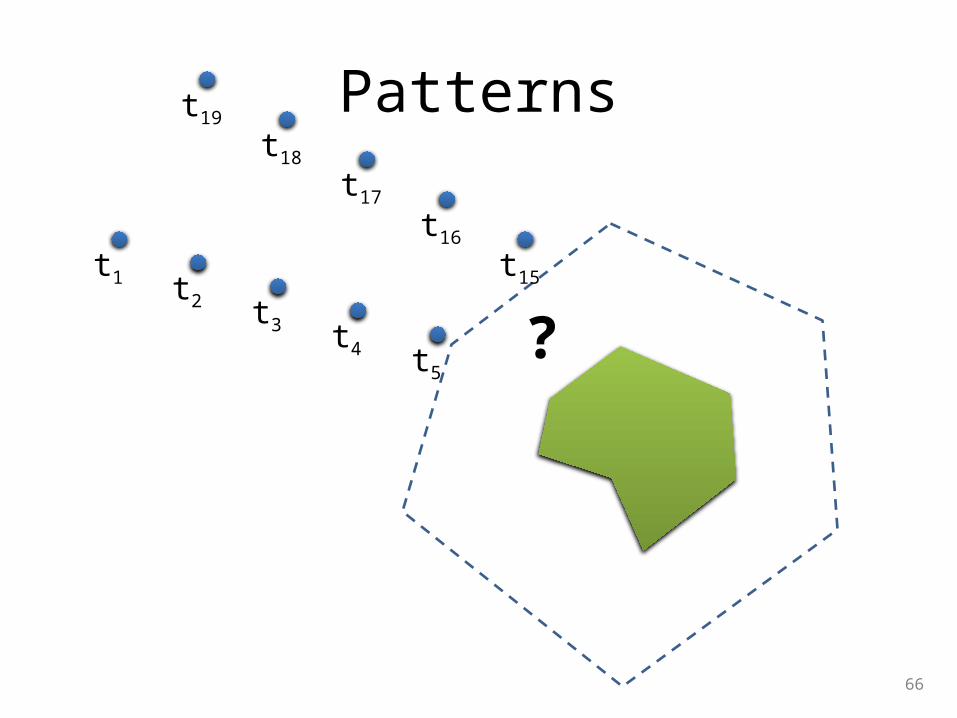
66
Patterns
t1 t2
t4
t3
t5
t15
t16
t17
t18
t19
?
67
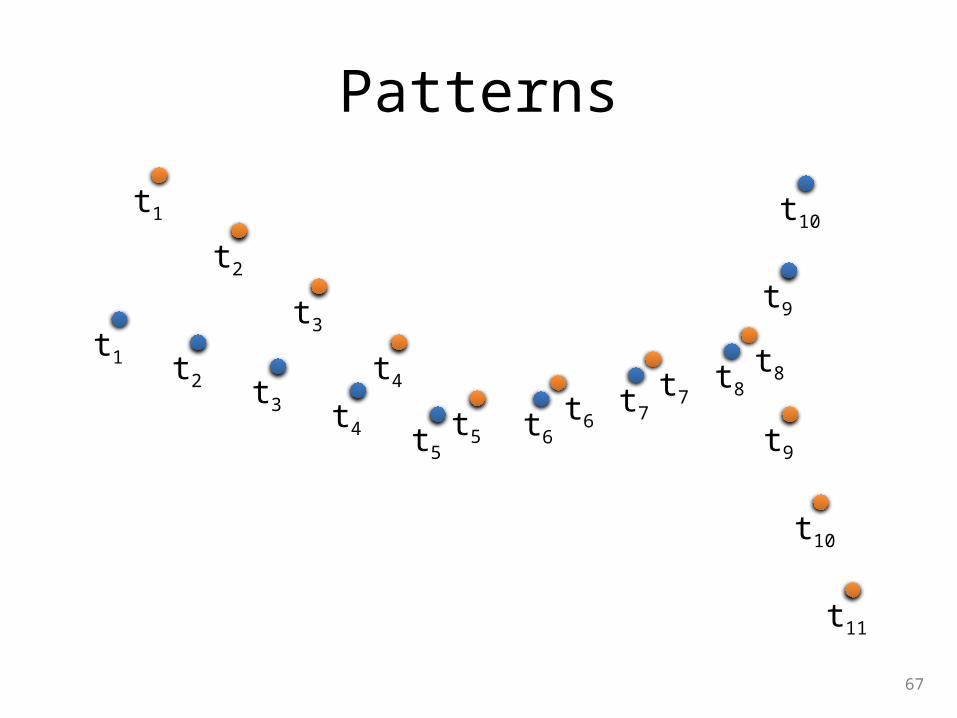
Patterns
t1 t2
t4
t3
t5t5
t4
t3
t2
t1
t6t6
t7t7
t8t8
t9
t9
t10
t10
t11
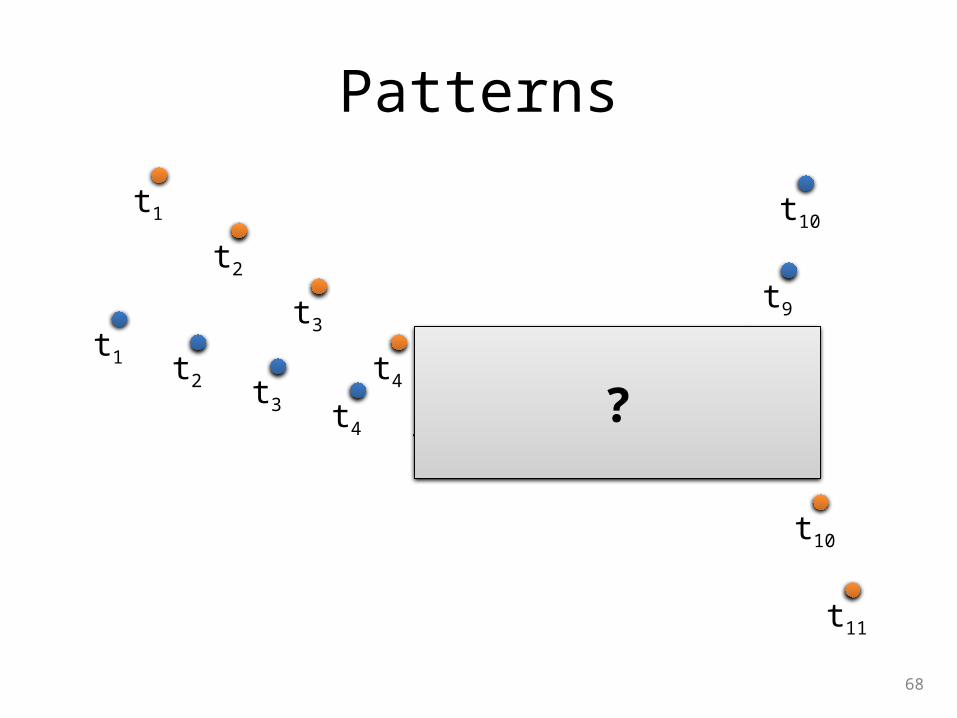
68
Patterns
t1 t2
t4
t3
t5t5
t4
t3
t2
t1
t6t6
t7t7
t8t8
t9
t9
t10
t10
t11
?

69
Patterns
• Many interesting patterns:– Moving too slowly (engine
problems)– Moving too quickly in bad
weather (safety)– Stoppages (accidents)– Stoppages, then moving quickly (repairs)– Orbiting, scan line patterns (fishing)

70
Patterns

71
Patterns

72
Sensor Networks
• Maintain real-time databases
• Specialized forms exist– E.g., weather, air traffic control, traffic loops, SOSUS,
electric power distribution (SCADA, Smart Grid, AMI)
• Very difficult and expensive to implement; very custom functionality
73
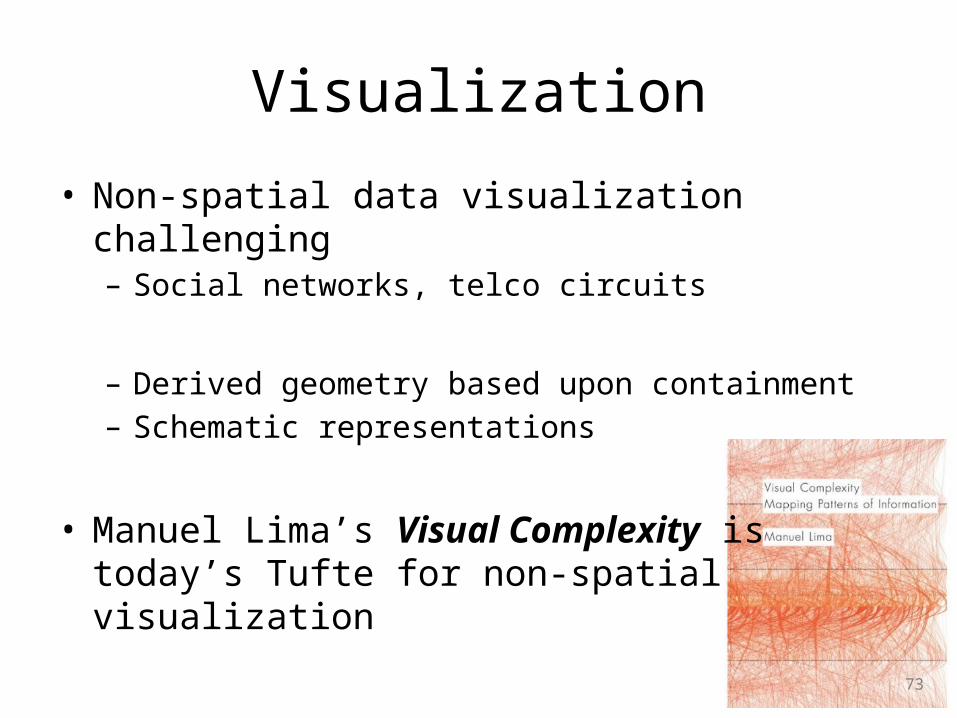
Visualization
• Non-spatial data visualization challenging– Social networks, telco circuits
– Derived geometry based upon containment– Schematic representations
• Manuel Lima’s Visual Complexity is today’s Tufte for non-spatial visualization

74
Procedural
• Procedural definitions– Polynomial with coefficients describing 3D solids
• ParallelGeometry (Quebec)
– Procedural descriptions of houses and buildings
<CityEngine video>
Dynamic GIS
76
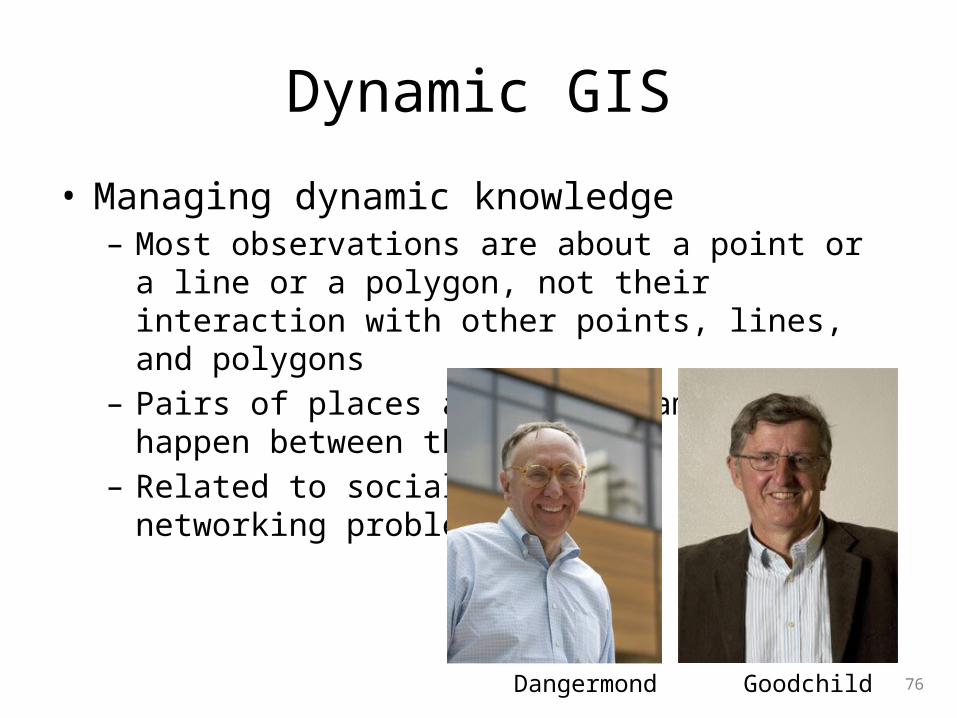
Dynamic GIS
• Managing dynamic knowledge– Most observations are about a point or a line or a polygon,
not their interaction with other points, lines, and polygons– Pairs of places and the dynamics that happen between
them– Related to social
networking problems
Dangermond Goodchild
77
Dynamic GIS
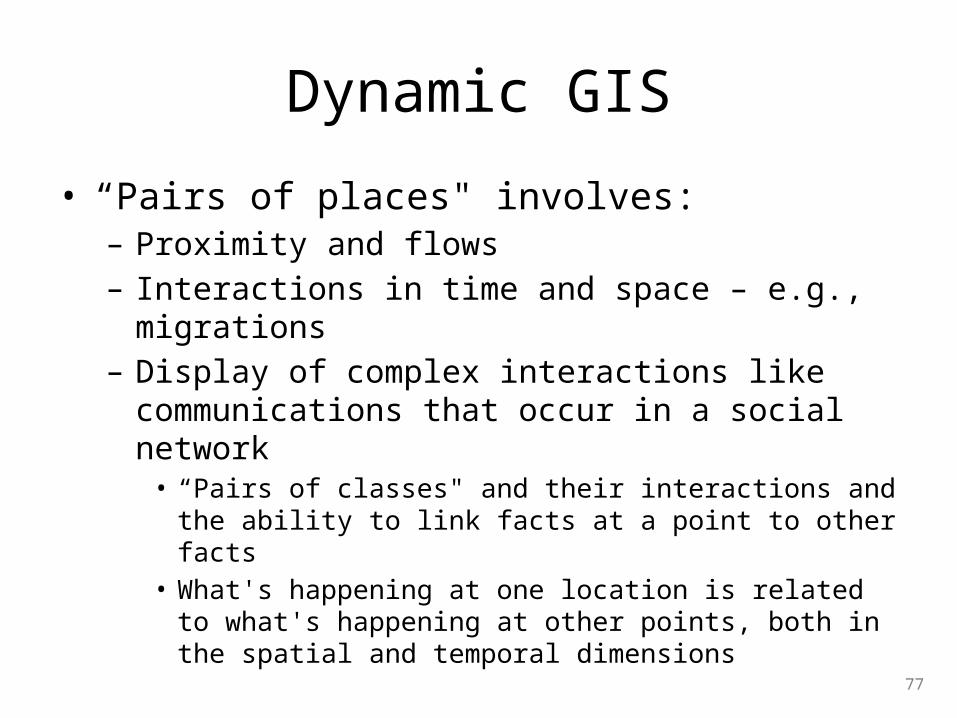
• “Pairs of places" involves:– Proximity and flows– Interactions in time and space – e.g., migrations– Display of complex interactions like communications that
occur in a social network• “Pairs of classes" and their interactions and the ability to link facts
at a point to other facts• What's happening at one location is related to what's happening
at other points, both in the spatial and temporal dimensions

78
Dynamic GIS
• Need to look at spatio-temporal patterns and infer something about the processes that are going on– Can be done best visually with maps, where things like
footprints lead to inferences about a pattern– E.g., flash mobs, flocking, cotravelor, etc.
• Over time, we've attempted to build these kinds of relationships like point and polygon, polygon overlay, and other geometric static relationships and space
79
Dynamic GIS
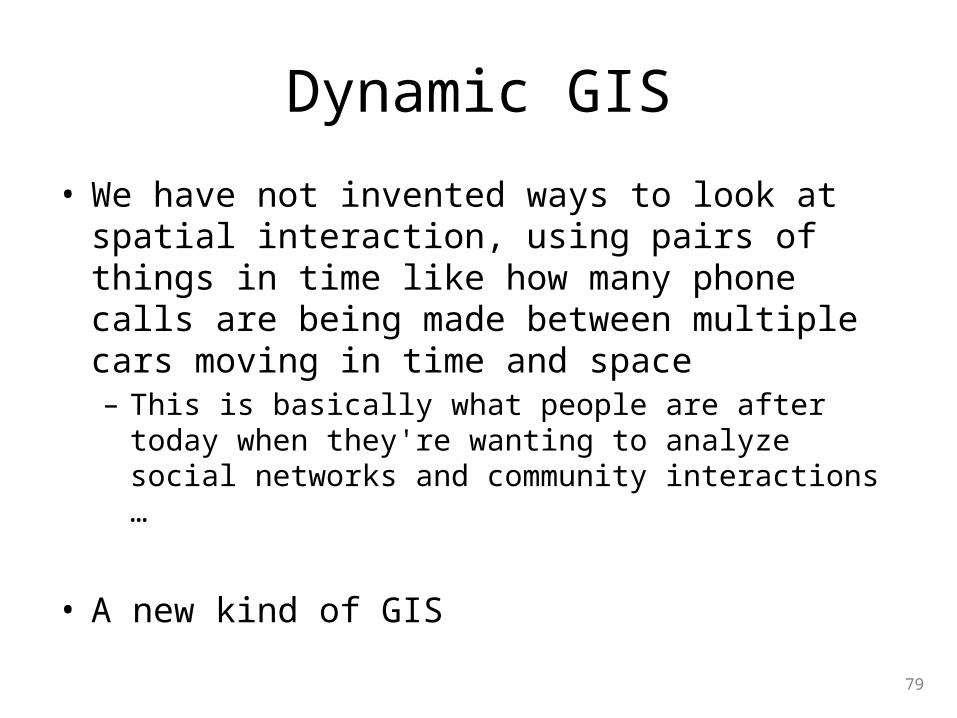
• We have not invented ways to look at spatial interaction, using pairs of things in time like how many phone calls are being made between multiple cars moving in time and space– This is basically what people are after today when they're
wanting to analyze social networks and community interactions …
• A new kind of GIS

80
Dynamic GIS
• Dynamic GIS is a paradigm for GIS that enables continuous processing of spatial information to deliver temporally relevant map and analysis outputs
Final Observations

82
Final Observations
• Focus on disruptive technology– Too much delta (and epsilon) research
• Workflow based research– Solve useful problems that you could explain to your mom
• Don’t try to develop the grand unification theory– E.g., procedural / rule-based construction of only buildings
and roads, not everything
83
Final Observations
• How can we take science and make it really easy?– Universe is changing; rise of the Neo-Geos– Very difficult for everyone
• How can you make bad data good?
84
Final Observations
• Inject some pragmatic engineering
– Use real databases (open source/web-based/whatever)
– Simple scales, complex fails
– Precompute as if your life depends upon it• Significant performance advantages may be gained if reasonable
constraints may be made• Disk space cheap, as is hardware running in background


