UNCTAD/TD/STATunctad.org/en/docs/tdstat30p7_enfr.pdf · td/stat.30 united nations conference on...
71
TD/STAT.30 UNITED NATIONS CONFERENCE ON TRADE AND DEVELOPMENT Geneva UNCTAD HANDBOOK OF STATISTICS 2005 CONFÉRENCE DES NATIONS UNIES SUR LE COMMERCE ET LE DÉVELOPPEMENT Genève MANUEL DE STATISTIQUES DE LA CNUCED ______________________________________________________ PART SEVEN Indicators of development SEPTIÈME PARTIE Indicateurs du développement ______________________________________________________ UNITED NATIONS New York and Geneva 2005 NATIONS UNIES New York et Genève
Transcript of UNCTAD/TD/STATunctad.org/en/docs/tdstat30p7_enfr.pdf · td/stat.30 united nations conference on...
TD/STAT.30
UNITED NATIONS CONFERENCE ON TRADE AND DEVELOPMENT Geneva
UNCTAD HANDBOOK OF STATISTICS
2005
CONFÉRENCE DES NATIONS UNIES SUR LE COMMERCE ET LE DÉVELOPPEMENT Genève
MANUEL DE STATISTIQUES DE LA CNUCED
______________________________________________________
PART SEVEN Indicators of development
SEPTIÈME PARTIE
Indicateurs du développement
______________________________________________________
UNITED NATIONS New York and Geneva
2005
NATIONS UNIES New York et Genève
1980-90 1990-04
Thousands
Millierskm2
Inhabitants
per km2
Habitants
par km2
Millions of dollars
Millionsde dollars
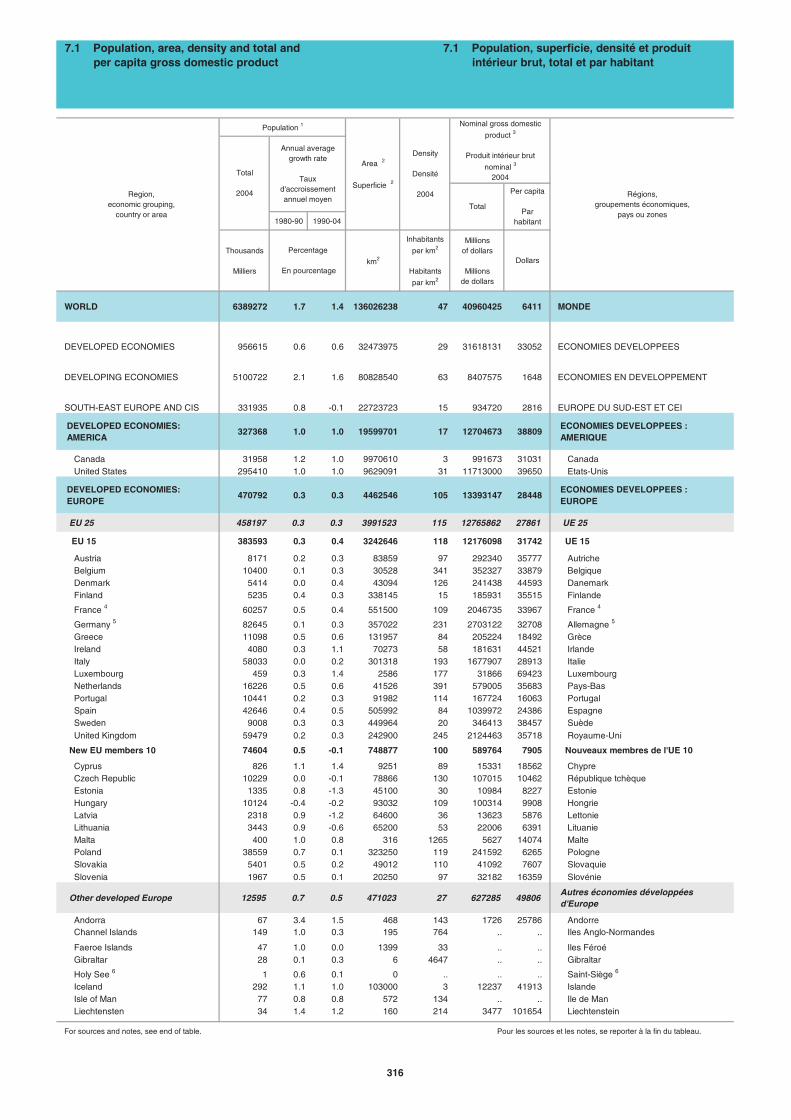
WORLD 6389272 1.7 1.4 136026238 47 40960425 6411 MONDE
DEVELOPED ECONOMIES 956615 0.6 0.6 32473975 29 31618131 33052 ECONOMIES DEVELOPPEES
DEVELOPING ECONOMIES 5100722 2.1 1.6 80828540 63 8407575 1648 ECONOMIES EN DEVELOPPEMENT
SOUTH-EAST EUROPE AND CIS 331935 0.8 -0.1 22723723 15 934720 2816 EUROPE DU SUD-EST ET CEI
DEVELOPED ECONOMIES: AMERICA
327368 1.0 1.0 19599701 17 12704673 38809 ECONOMIES DEVELOPPEES : AMERIQUE
Canada 31958 1.2 1.0 9970610 3 991673 31031 Canada United States 295410 1.0 1.0 9629091 31 11713000 39650 Etats-Unis
DEVELOPED ECONOMIES: EUROPE
470792 0.3 0.3 4462546 105 13393147 28448 ECONOMIES DEVELOPPEES : EUROPE
EU 25 458197 0.3 0.3 3991523 115 12765862 27861 UE 25
EU 15 383593 0.3 0.4 3242646 118 12176098 31742 UE 15
Austria 8171 0.2 0.3 83859 97 292340 35777 Autriche Belgium 10400 0.1 0.3 30528 341 352327 33879 Belgique Denmark 5414 0.0 0.4 43094 126 241438 44593 Danemark Finland 5235 0.4 0.3 338145 15 185931 35515 Finlande
France 4 60257 0.5 0.4 551500 109 2046735 33967 France 4
Germany 5 82645 0.1 0.3 357022 231 2703122 32708 Allemagne 5
Greece 11098 0.5 0.6 131957 84 205224 18492 Grèce Ireland 4080 0.3 1.1 70273 58 181631 44521 Irlande Italy 58033 0.0 0.2 301318 193 1677907 28913 Italie Luxembourg 459 0.3 1.4 2586 177 31866 69423 Luxembourg Netherlands 16226 0.5 0.6 41526 391 579005 35683 Pays-Bas Portugal 10441 0.2 0.3 91982 114 167724 16063 Portugal Spain 42646 0.4 0.5 505992 84 1039972 24386 Espagne Sweden 9008 0.3 0.3 449964 20 346413 38457 Suède United Kingdom 59479 0.2 0.3 242900 245 2124463 35718 Royaume-Uni
New EU members 10 74604 0.5 -0.1 748877 100 589764 7905 Nouveaux membres de l'UE 10
Cyprus 826 1.1 1.4 9251 89 15331 18562 Chypre Czech Republic 10229 0.0 -0.1 78866 130 107015 10462 République tchèque Estonia 1335 0.8 -1.3 45100 30 10984 8227 Estonie Hungary 10124 -0.4 -0.2 93032 109 100314 9908 Hongrie Latvia 2318 0.9 -1.2 64600 36 13623 5876 Lettonie Lithuania 3443 0.9 -0.6 65200 53 22006 6391 Lituanie Malta 400 1.0 0.8 316 1265 5627 14074 Malte Poland 38559 0.7 0.1 323250 119 241592 6265 Pologne Slovakia 5401 0.5 0.2 49012 110 41092 7607 Slovaquie Slovenia 1967 0.5 0.1 20250 97 32182 16359 Slovénie
Other developed Europe 12595 0.7 0.5 471023 27 627285 49806 Autres économies développées d'Europe
Andorra 67 3.4 1.5 468 143 1726 25786 Andorre Channel Islands 149 1.0 0.3 195 764 .. .. Iles Anglo-Normandes
Faeroe Islands 47 1.0 0.0 1399 33 .. .. Iles Féroé Gibraltar 28 0.1 0.3 6 4647 .. .. Gibraltar
Holy See 6 1 0.6 0.1 0 .. .. .. Saint-Siège 6
Iceland 292 1.1 1.0 103000 3 12237 41913 Islande Isle of Man 77 0.8 0.8 572 134 .. .. Ile de Man Liechtensten 34 1.4 1.2 160 214 3477 101654 Liechtenstein
For sources and notes, see end of table. Pour les sources et les notes, se reporter à la fin du tableau.
7.1 Population, area, density and total and per capita gross domestic product
Annual averagegrowth rate
Taux d'accroissementannuel moyen
Régions,groupements économiques,
pays ou zones
Region, economic grouping,
country or area
Percentage
En pourcentage
Total
7.1 Population, superficie, densité et produit intérieur brut, total et par habitant
Population 1
Total
2004
Area 2
Superficie 2
Nominal gross domestic
product 3
Produit intérieur brut
nominal 3
2004
Per capita
Parhabitant
Dollars
Density
Densité
2004
316
1980-90 1990-04
Thousands
Millierskm2
Inhabitants
per km2
Habitants
par km2
Millions of dollars
Millionsde dollars
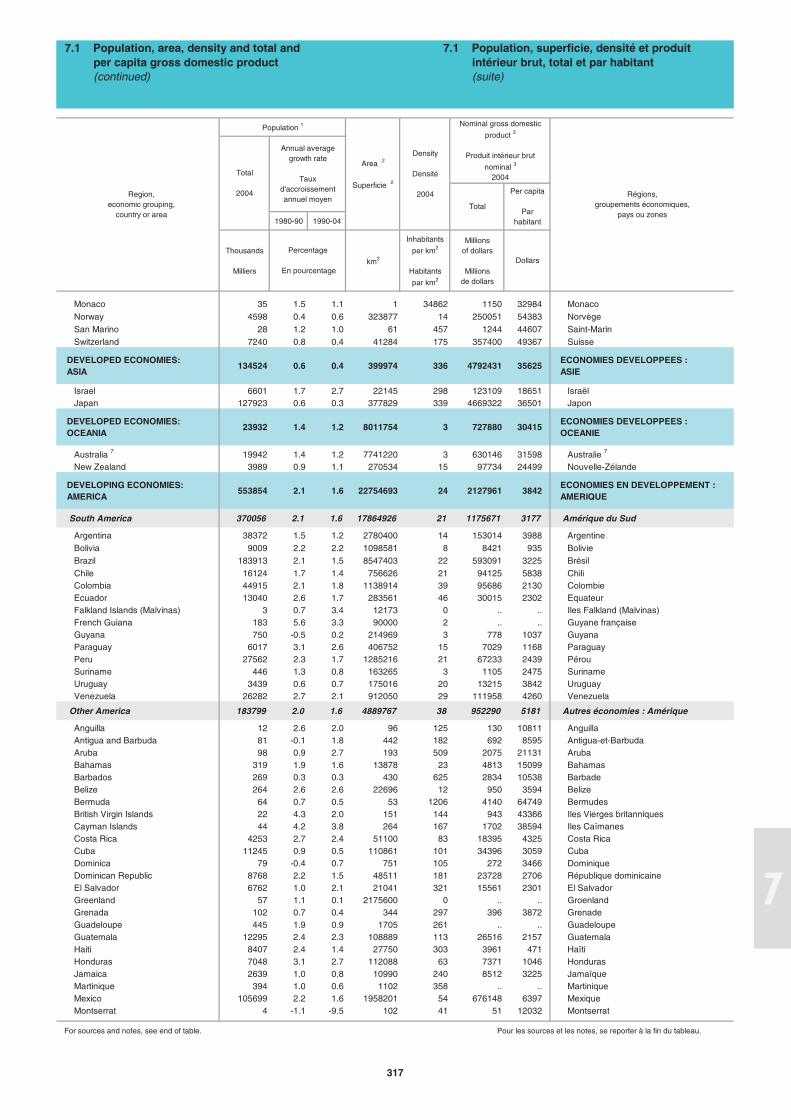
Monaco 35 1.5 1.1 1 34862 1150 32984 Monaco Norway 4598 0.4 0.6 323877 14 250051 54383 Norvège San Marino 28 1.2 1.0 61 457 1244 44607 Saint-Marin Switzerland 7240 0.8 0.4 41284 175 357400 49367 Suisse
DEVELOPED ECONOMIES: ASIA
134524 0.6 0.4 399974 336 4792431 35625 ECONOMIES DEVELOPPEES : ASIE
Israel 6601 1.7 2.7 22145 298 123109 18651 Israël Japan 127923 0.6 0.3 377829 339 4669322 36501 Japon
DEVELOPED ECONOMIES: OCEANIA
23932 1.4 1.2 8011754 3 727880 30415 ECONOMIES DEVELOPPEES : OCEANIE
Australia 7 19942 1.4 1.2 7741220 3 630146 31598 Australie 7
New Zealand 3989 0.9 1.1 270534 15 97734 24499 Nouvelle-Zélande
DEVELOPING ECONOMIES: AMERICA
553854 2.1 1.6 22754693 24 2127961 3842 ECONOMIES EN DEVELOPPEMENT : AMERIQUE
South America 370056 2.1 1.6 17864926 21 1175671 3177 Amérique du Sud
Argentina 38372 1.5 1.2 2780400 14 153014 3988 Argentine Bolivia 9009 2.2 2.2 1098581 8 8421 935 Bolivie Brazil 183913 2.1 1.5 8547403 22 593091 3225 Brésil Chile 16124 1.7 1.4 756626 21 94125 5838 Chili Colombia 44915 2.1 1.8 1138914 39 95686 2130 Colombie Ecuador 13040 2.6 1.7 283561 46 30015 2302 Equateur Falkland Islands (Malvinas) 3 0.7 3.4 12173 0 .. .. Iles Falkland (Malvinas) French Guiana 183 5.6 3.3 90000 2 .. .. Guyane française Guyana 750 -0.5 0.2 214969 3 778 1037 Guyana Paraguay 6017 3.1 2.6 406752 15 7029 1168 Paraguay Peru 27562 2.3 1.7 1285216 21 67233 2439 Pérou Suriname 446 1.3 0.8 163265 3 1105 2475 Suriname Uruguay 3439 0.6 0.7 175016 20 13215 3842 Uruguay Venezuela 26282 2.7 2.1 912050 29 111958 4260 Venezuela
Other America 183799 2.0 1.6 4889767 38 952290 5181 Autres économies : Amérique
Anguilla 12 2.6 2.0 96 125 130 10811 Anguilla Antigua and Barbuda 81 -0.1 1.8 442 182 692 8595 Antigua-et-Barbuda Aruba 98 0.9 2.7 193 509 2075 21131 Aruba Bahamas 319 1.9 1.6 13878 23 4813 15099 Bahamas Barbados 269 0.3 0.3 430 625 2834 10538 Barbade Belize 264 2.6 2.6 22696 12 950 3594 Belize Bermuda 64 0.7 0.5 53 1206 4140 64749 Bermudes British Virgin Islands 22 4.3 2.0 151 144 943 43366 Iles Vierges britanniques Cayman Islands 44 4.2 3.8 264 167 1702 38594 Iles Caïmanes Costa Rica 4253 2.7 2.4 51100 83 18395 4325 Costa Rica Cuba 11245 0.9 0.5 110861 101 34396 3059 Cuba Dominica 79 -0.4 0.7 751 105 272 3466 Dominique Dominican Republic 8768 2.2 1.5 48511 181 23728 2706 République dominicaine El Salvador 6762 1.0 2.1 21041 321 15561 2301 El Salvador Greenland 57 1.1 0.1 2175600 0 .. .. Groenland Grenada 102 0.7 0.4 344 297 396 3872 Grenade Guadeloupe 445 1.9 0.9 1705 261 .. .. Guadeloupe Guatemala 12295 2.4 2.3 108889 113 26516 2157 Guatemala Haiti 8407 2.4 1.4 27750 303 3961 471 Haïti Honduras 7048 3.1 2.7 112088 63 7371 1046 Honduras Jamaica 2639 1.0 0.8 10990 240 8512 3225 Jamaïque Martinique 394 1.0 0.6 1102 358 .. .. Martinique Mexico 105699 2.2 1.6 1958201 54 676148 6397 Mexique Montserrat 4 -1.1 -9.5 102 41 51 12032 Montserrat
For sources and notes, see end of table. Pour les sources et les notes, se reporter à la fin du tableau.
Per capita
Parhabitant
7.1 Population, area, density and total and per capita gross domestic product
(continued)
Régions,groupements économiques,
pays ou zones
Percentage
En pourcentageDollars
Population 1
7.1 Population, superficie, densité et produit intérieur brut, total et par habitant
(suite)
Region, economic grouping,
country or area
Nominal gross domestic
product 3
Produit intérieur brut
nominal 3
2004
Area 2
Superficie 2
Density
Densité
2004
Total
2004
Annual averagegrowth rate
Taux d'accroissementannuel moyen
Total
317
1980-90 1990-04
Thousands
Millierskm2
Inhabitants
per km2
Habitants
par km2
Millions of dollars
Millionsde dollars
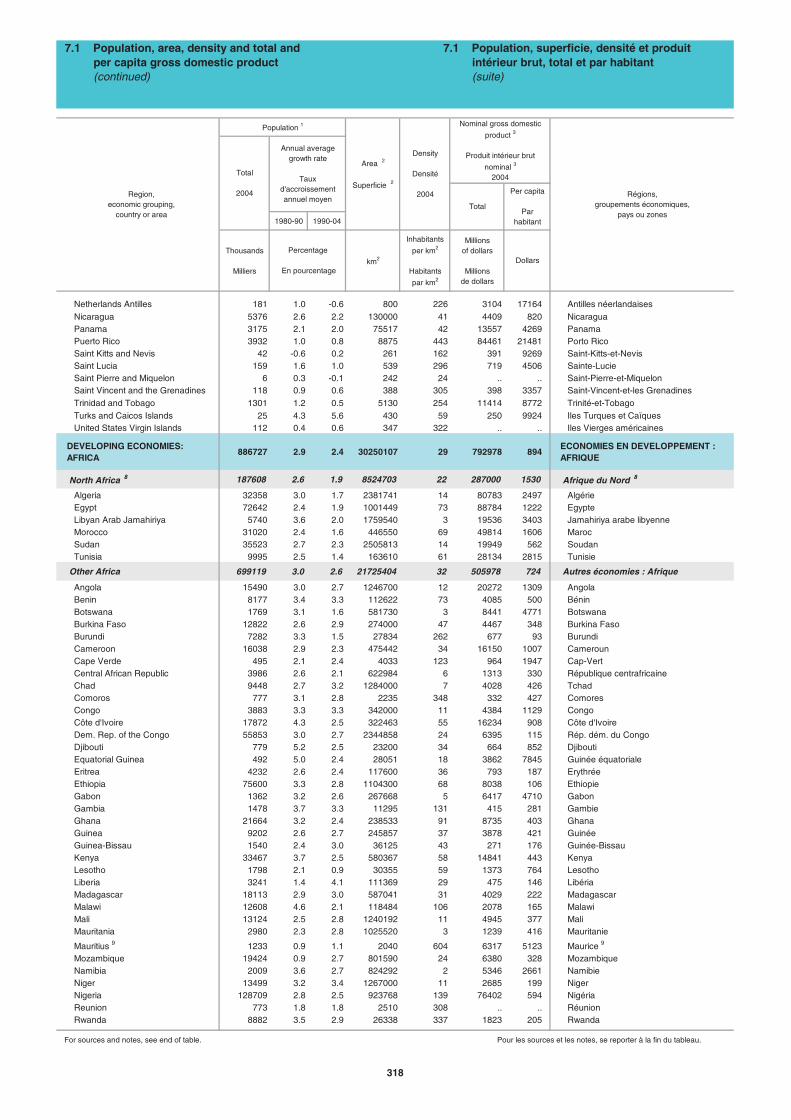
Netherlands Antilles 181 1.0 -0.6 800 226 3104 17164 Antilles néerlandaises Nicaragua 5376 2.6 2.2 130000 41 4409 820 Nicaragua Panama 3175 2.1 2.0 75517 42 13557 4269 Panama Puerto Rico 3932 1.0 0.8 8875 443 84461 21481 Porto Rico Saint Kitts and Nevis 42 -0.6 0.2 261 162 391 9269 Saint-Kitts-et-Nevis Saint Lucia 159 1.6 1.0 539 296 719 4506 Sainte-Lucie Saint Pierre and Miquelon 6 0.3 -0.1 242 24 .. .. Saint-Pierre-et-Miquelon Saint Vincent and the Grenadines 118 0.9 0.6 388 305 398 3357 Saint-Vincent-et-les Grenadines Trinidad and Tobago 1301 1.2 0.5 5130 254 11414 8772 Trinité-et-Tobago Turks and Caicos Islands 25 4.3 5.6 430 59 250 9924 Iles Turques et Caïques United States Virgin Islands 112 0.4 0.6 347 322 .. .. Iles Vierges américaines
DEVELOPING ECONOMIES: AFRICA
886727 2.9 2.4 30250107 29 792978 894 ECONOMIES EN DEVELOPPEMENT : AFRIQUE
North Africa 8 187608 2.6 1.9 8524703 22 287000 1530 Afrique du Nord 8
Algeria 32358 3.0 1.7 2381741 14 80783 2497 Algérie Egypt 72642 2.4 1.9 1001449 73 88784 1222 Egypte Libyan Arab Jamahiriya 5740 3.6 2.0 1759540 3 19536 3403 Jamahiriya arabe libyenne Morocco 31020 2.4 1.6 446550 69 49814 1606 Maroc Sudan 35523 2.7 2.3 2505813 14 19949 562 Soudan Tunisia 9995 2.5 1.4 163610 61 28134 2815 Tunisie
Other Africa 699119 3.0 2.6 21725404 32 505978 724 Autres économies : Afrique
Angola 15490 3.0 2.7 1246700 12 20272 1309 Angola Benin 8177 3.4 3.3 112622 73 4085 500 Bénin Botswana 1769 3.1 1.6 581730 3 8441 4771 Botswana Burkina Faso 12822 2.6 2.9 274000 47 4467 348 Burkina Faso Burundi 7282 3.3 1.5 27834 262 677 93 Burundi Cameroon 16038 2.9 2.3 475442 34 16150 1007 Cameroun Cape Verde 495 2.1 2.4 4033 123 964 1947 Cap-Vert Central African Republic 3986 2.6 2.1 622984 6 1313 330 République centrafricaine Chad 9448 2.7 3.2 1284000 7 4028 426 Tchad Comoros 777 3.1 2.8 2235 348 332 427 Comores Congo 3883 3.3 3.3 342000 11 4384 1129 Congo Côte d'Ivoire 17872 4.3 2.5 322463 55 16234 908 Côte d'Ivoire Dem. Rep. of the Congo 55853 3.0 2.7 2344858 24 6395 115 Rép. dém. du Congo Djibouti 779 5.2 2.5 23200 34 664 852 Djibouti Equatorial Guinea 492 5.0 2.4 28051 18 3862 7845 Guinée équatoriale Eritrea 4232 2.6 2.4 117600 36 793 187 Erythrée Ethiopia 75600 3.3 2.8 1104300 68 8038 106 Ethiopie Gabon 1362 3.2 2.6 267668 5 6417 4710 Gabon Gambia 1478 3.7 3.3 11295 131 415 281 Gambie Ghana 21664 3.2 2.4 238533 91 8735 403 Ghana Guinea 9202 2.6 2.7 245857 37 3878 421 Guinée Guinea-Bissau 1540 2.4 3.0 36125 43 271 176 Guinée-Bissau Kenya 33467 3.7 2.5 580367 58 14841 443 Kenya Lesotho 1798 2.1 0.9 30355 59 1373 764 Lesotho Liberia 3241 1.4 4.1 111369 29 475 146 Libéria Madagascar 18113 2.9 3.0 587041 31 4029 222 Madagascar Malawi 12608 4.6 2.1 118484 106 2078 165 Malawi Mali 13124 2.5 2.8 1240192 11 4945 377 Mali Mauritania 2980 2.3 2.8 1025520 3 1239 416 Mauritanie
Mauritius 9 1233 0.9 1.1 2040 604 6317 5123 Maurice 9
Mozambique 19424 0.9 2.7 801590 24 6380 328 Mozambique Namibia 2009 3.6 2.7 824292 2 5346 2661 Namibie Niger 13499 3.2 3.4 1267000 11 2685 199 Niger Nigeria 128709 2.8 2.5 923768 139 76402 594 Nigéria Reunion 773 1.8 1.8 2510 308 .. .. Réunion Rwanda 8882 3.5 2.9 26338 337 1823 205 Rwanda
For sources and notes, see end of table. Pour les sources et les notes, se reporter à la fin du tableau.
Region, economic grouping,
country or area
Nominal gross domestic
product 3
Produit intérieur brut
nominal 3
2004
Population 1
Area 2
Superficie 2
Dollars
Density
Densité
2004
Annual averagegrowth rate
Taux d'accroissementannuel moyen
Total
Per capita
Parhabitant
7.1 Population, area, density and total and per capita gross domestic product
(continued)
7.1 Population, superficie, densité et produit intérieur brut, total et par habitant
(suite)
Régions,groupements économiques,
pays ou zones
Total
2004
Percentage
En pourcentage
318
1980-90 1990-04
Thousands
Millierskm2
Inhabitants
per km2
Habitants
par km2
Millions of dollars
Millionsde dollars
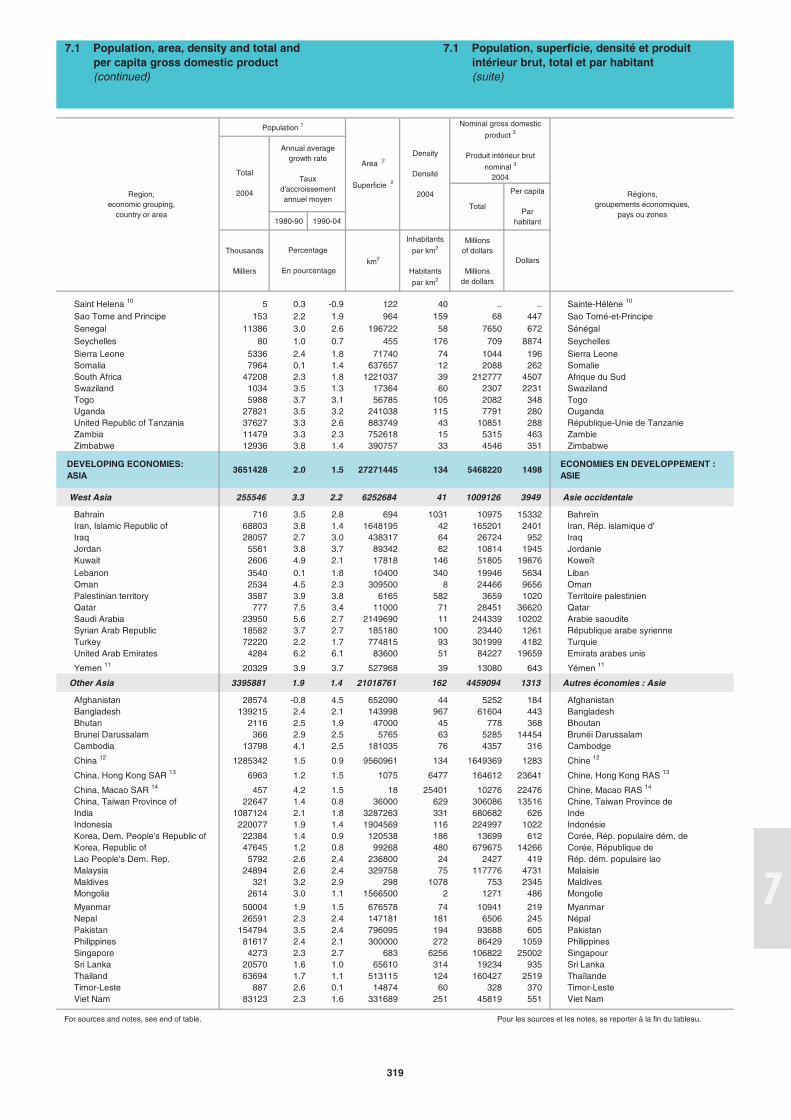
Saint Helena 10 5 0.3 -0.9 122 40 .. .. Sainte-Hélène 10
Sao Tome and Principe 153 2.2 1.9 964 159 68 447 Sao Tomé-et-Principe Senegal 11386 3.0 2.6 196722 58 7650 672 Sénégal Seychelles 80 1.0 0.7 455 176 709 8874 Seychelles Sierra Leone 5336 2.4 1.8 71740 74 1044 196 Sierra Leone Somalia 7964 0.1 1.4 637657 12 2088 262 Somalie South Africa 47208 2.3 1.8 1221037 39 212777 4507 Afrique du Sud Swaziland 1034 3.5 1.3 17364 60 2307 2231 Swaziland Togo 5988 3.7 3.1 56785 105 2082 348 Togo Uganda 27821 3.5 3.2 241038 115 7791 280 Ouganda United Republic of Tanzania 37627 3.3 2.6 883749 43 10851 288 République-Unie de Tanzanie Zambia 11479 3.3 2.3 752618 15 5315 463 Zambie Zimbabwe 12936 3.8 1.4 390757 33 4546 351 Zimbabwe
DEVELOPING ECONOMIES: ASIA
3651428 2.0 1.5 27271445 134 5468220 1498 ECONOMIES EN DEVELOPPEMENT : ASIE
West Asia 255546 3.3 2.2 6252684 41 1009126 3949 Asie occidentale
Bahrain 716 3.5 2.8 694 1031 10975 15332 Bahreïn Iran, Islamic Republic of 68803 3.8 1.4 1648195 42 165201 2401 Iran, Rép. islamique d' Iraq 28057 2.7 3.0 438317 64 26724 952 Iraq Jordan 5561 3.8 3.7 89342 62 10814 1945 Jordanie Kuwait 2606 4.9 2.1 17818 146 51805 19876 Koweït Lebanon 3540 0.1 1.8 10400 340 19946 5634 Liban Oman 2534 4.5 2.3 309500 8 24466 9656 Oman Palestinian territory 3587 3.9 3.8 6165 582 3659 1020 Territoire palestinien Qatar 777 7.5 3.4 11000 71 28451 36620 Qatar Saudi Arabia 23950 5.6 2.7 2149690 11 244339 10202 Arabie saoudite Syrian Arab Republic 18582 3.7 2.7 185180 100 23440 1261 République arabe syrienne Turkey 72220 2.2 1.7 774815 93 301999 4182 Turquie United Arab Emirates 4284 6.2 6.1 83600 51 84227 19659 Emirats arabes unis
Yemen 11 20329 3.9 3.7 527968 39 13080 643 Yémen 11
Other Asia 3395881 1.9 1.4 21018761 162 4459094 1313 Autres économies : Asie
Afghanistan 28574 -0.8 4.5 652090 44 5252 184 Afghanistan Bangladesh 139215 2.4 2.1 143998 967 61604 443 Bangladesh Bhutan 2116 2.5 1.9 47000 45 778 368 Bhoutan Brunei Darussalam 366 2.9 2.5 5765 63 5285 14454 Brunéi Darussalam Cambodia 13798 4.1 2.5 181035 76 4357 316 Cambodge
China 12 1285342 1.5 0.9 9560961 134 1649369 1283 Chine 12
China, Hong Kong SAR 13 6963 1.2 1.5 1075 6477 164612 23641 Chine, Hong Kong RAS 13
China, Macao SAR 14 457 4.2 1.5 18 25401 10276 22476 Chine, Macao RAS 14
China, Taiwan Province of 22647 1.4 0.8 36000 629 306086 13516 Chine, Taiwan Province de India 1087124 2.1 1.8 3287263 331 680682 626 Inde Indonesia 220077 1.9 1.4 1904569 116 224997 1022 Indonésie Korea, Dem. People's Republic of 22384 1.4 0.9 120538 186 13699 612 Corée, Rép. populaire dém. de Korea, Republic of 47645 1.2 0.8 99268 480 679675 14266 Corée, République de Lao People's Dem. Rep. 5792 2.6 2.4 236800 24 2427 419 Rép. dém. populaire lao Malaysia 24894 2.6 2.4 329758 75 117776 4731 Malaisie Maldives 321 3.2 2.9 298 1078 753 2345 Maldives Mongolia 2614 3.0 1.1 1566500 2 1271 486 Mongolie
Myanmar 50004 1.9 1.5 676578 74 10941 219 Myanmar Nepal 26591 2.3 2.4 147181 181 6506 245 Népal Pakistan 154794 3.5 2.4 796095 194 93688 605 Pakistan Philippines 81617 2.4 2.1 300000 272 86429 1059 Philippines Singapore 4273 2.3 2.7 683 6256 106822 25002 Singapour Sri Lanka 20570 1.6 1.0 65610 314 19234 935 Sri Lanka Thailand 63694 1.7 1.1 513115 124 160427 2519 Thaïlande Timor-Leste 887 2.6 0.1 14874 60 328 370 Timor-Leste Viet Nam 83123 2.3 1.6 331689 251 45819 551 Viet Nam
For sources and notes, see end of table. Pour les sources et les notes, se reporter à la fin du tableau.
Total
7.1 Population, area, density and total and per capita gross domestic product
(continued)
Area 2
Superficie 2
Density
Densité
2004
Nominal gross domestic
product 3
Produit intérieur brut
nominal 3
2004
Annual averagegrowth rate
Taux d'accroissementannuel moyen
Per capita
Parhabitant
Percentage
En pourcentageDollars
7.1 Population, superficie, densité et produit intérieur brut, total et par habitant
(suite)
Region, economic grouping,
country or area
Population 1
Régions,groupements économiques,
pays ou zones
Total
2004
319
1980-90 1990-04
Thousands
Millierskm2
Inhabitants
per km2
Habitants
par km2
Millions of dollars
Millionsde dollars
DEVELOPING ECONOMIES:
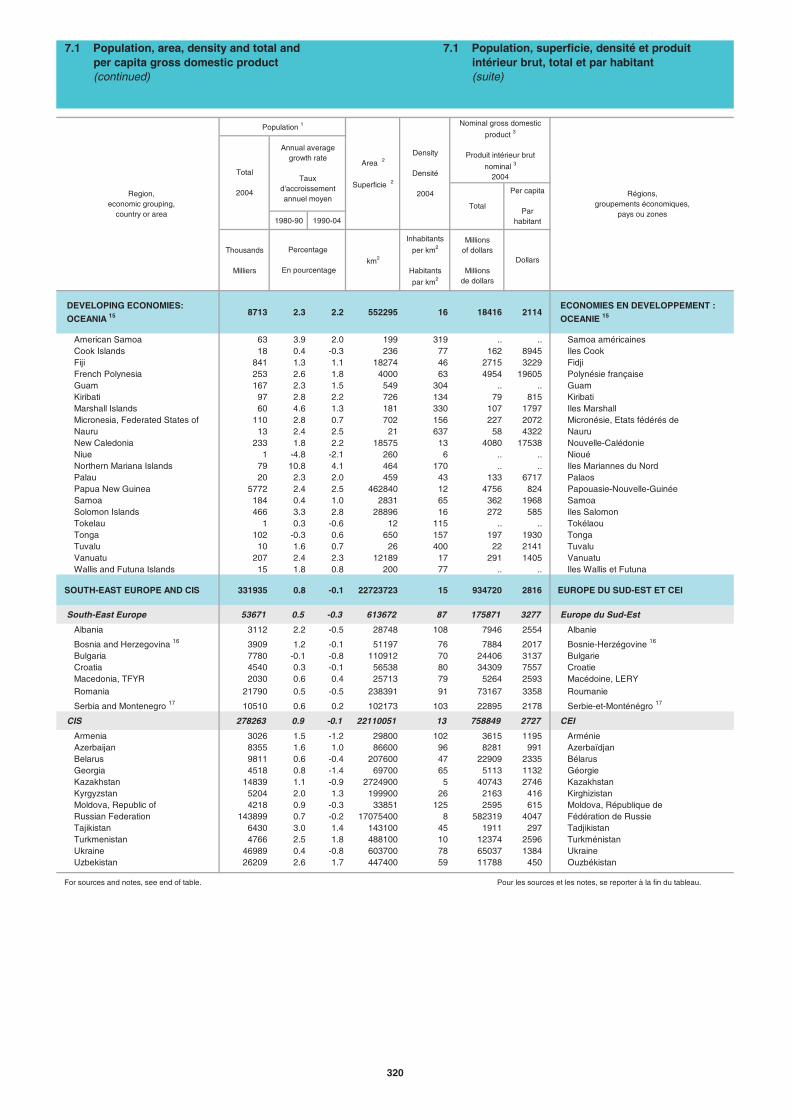
OCEANIA 15 8713 2.3 2.2 552295 16 18416 2114 ECONOMIES EN DEVELOPPEMENT :
OCEANIE 15
American Samoa 63 3.9 2.0 199 319 .. .. Samoa américaines Cook Islands 18 0.4 -0.3 236 77 162 8945 Iles Cook Fiji 841 1.3 1.1 18274 46 2715 3229 Fidji French Polynesia 253 2.6 1.8 4000 63 4954 19605 Polynésie française Guam 167 2.3 1.5 549 304 .. .. Guam Kiribati 97 2.8 2.2 726 134 79 815 Kiribati Marshall Islands 60 4.6 1.3 181 330 107 1797 Iles Marshall Micronesia, Federated States of 110 2.8 0.7 702 156 227 2072 Micronésie, Etats fédérés de Nauru 13 2.4 2.5 21 637 58 4322 Nauru New Caledonia 233 1.8 2.2 18575 13 4080 17538 Nouvelle-Calédonie Niue 1 -4.8 -2.1 260 6 .. .. Nioué Northern Mariana Islands 79 10.8 4.1 464 170 .. .. Iles Mariannes du Nord Palau 20 2.3 2.0 459 43 133 6717 Palaos Papua New Guinea 5772 2.4 2.5 462840 12 4756 824 Papouasie-Nouvelle-Guinée Samoa 184 0.4 1.0 2831 65 362 1968 Samoa Solomon Islands 466 3.3 2.8 28896 16 272 585 Iles Salomon Tokelau 1 0.3 -0.6 12 115 .. .. Tokélaou Tonga 102 -0.3 0.6 650 157 197 1930 Tonga Tuvalu 10 1.6 0.7 26 400 22 2141 Tuvalu Vanuatu 207 2.4 2.3 12189 17 291 1405 Vanuatu Wallis and Futuna Islands 15 1.8 0.8 200 77 .. .. Iles Wallis et Futuna
SOUTH-EAST EUROPE AND CIS 331935 0.8 -0.1 22723723 15 934720 2816 EUROPE DU SUD-EST ET CEI
South-East Europe 53671 0.5 -0.3 613672 87 175871 3277 Europe du Sud-Est
Albania 3112 2.2 -0.5 28748 108 7946 2554 Albanie
Bosnia and Herzegovina 16 3909 1.2 -0.1 51197 76 7884 2017 Bosnie-Herzégovine 16
Bulgaria 7780 -0.1 -0.8 110912 70 24406 3137 Bulgarie Croatia 4540 0.3 -0.1 56538 80 34309 7557 Croatie Macedonia, TFYR 2030 0.6 0.4 25713 79 5264 2593 Macédoine, LERY Romania 21790 0.5 -0.5 238391 91 73167 3358 Roumanie
Serbia and Montenegro 17 10510 0.6 0.2 102173 103 22895 2178 Serbie-et-Monténégro 17
CIS 278263 0.9 -0.1 22110051 13 758849 2727 CEI
Armenia 3026 1.5 -1.2 29800 102 3615 1195 Arménie Azerbaijan 8355 1.6 1.0 86600 96 8281 991 Azerbaïdjan Belarus 9811 0.6 -0.4 207600 47 22909 2335 Bélarus Georgia 4518 0.8 -1.4 69700 65 5113 1132 Géorgie Kazakhstan 14839 1.1 -0.9 2724900 5 40743 2746 Kazakhstan Kyrgyzstan 5204 2.0 1.3 199900 26 2163 416 Kirghizistan Moldova, Republic of 4218 0.9 -0.3 33851 125 2595 615 Moldova, République de Russian Federation 143899 0.7 -0.2 17075400 8 582319 4047 Fédération de Russie Tajikistan 6430 3.0 1.4 143100 45 1911 297 Tadjikistan Turkmenistan 4766 2.5 1.8 488100 10 12374 2596 Turkménistan Ukraine 46989 0.4 -0.8 603700 78 65037 1384 Ukraine Uzbekistan 26209 2.6 1.7 447400 59 11788 450 Ouzbékistan
For sources and notes, see end of table. Pour les sources et les notes, se reporter à la fin du tableau.
Region, economic grouping,
country or area
7.1 Population, superficie, densité et produit intérieur brut, total et par habitant
(suite)
7.1 Population, area, density and total and per capita gross domestic product
(continued)
Density
Densité
2004
Nominal gross domestic
product 3
Produit intérieur brut
nominal 3
2004
Régions,groupements économiques,
pays ou zones
Total
2004
Annual averagegrowth rate
Taux d'accroissementannuel moyen
Total
Per capita
Parhabitant
Percentage
En pourcentageDollars
Population 1
Area 2
Superficie 2
320
1980-90 1990-04
Thousands
Millierskm2
Inhabitants
per km2
Habitants
par km2
Millions of dollars
Millionsde dollars
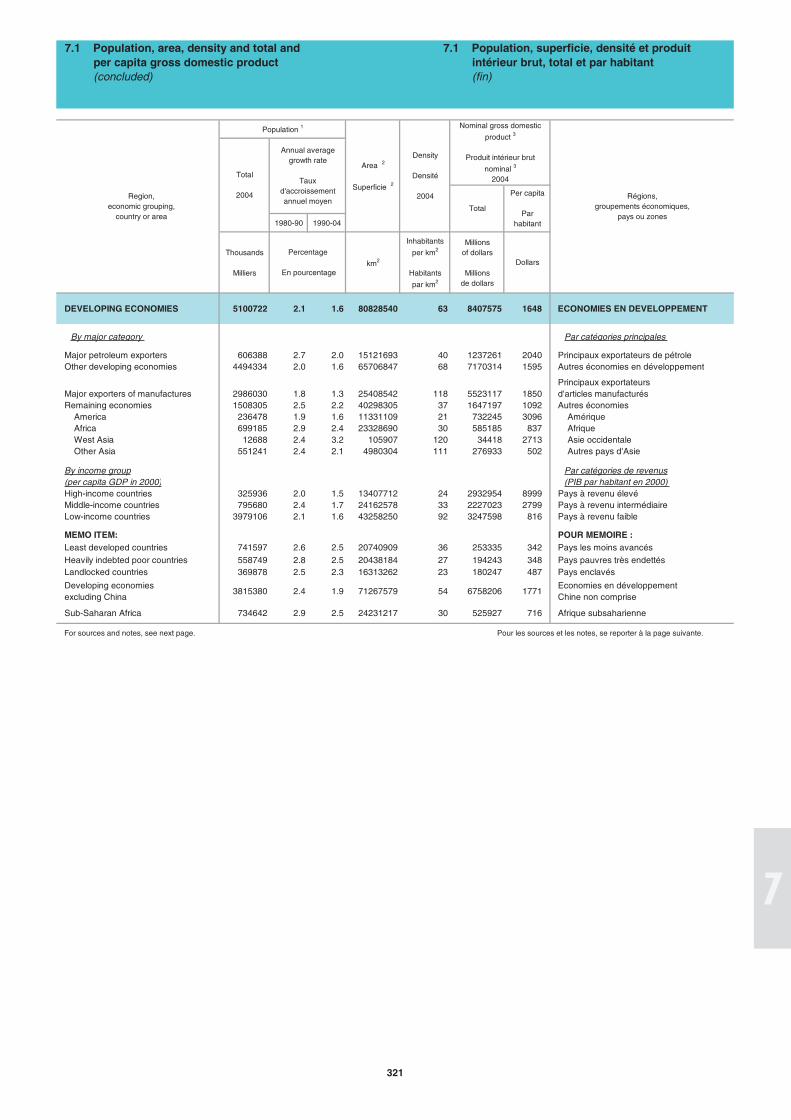
DEVELOPING ECONOMIES 5100722 2.1 1.6 80828540 63 8407575 1648 ECONOMIES EN DEVELOPPEMENT
By major category Par catégories principales
Major petroleum exporters 606388 2.7 2.0 15121693 40 1237261 2040 Principaux exportateurs de pétroleOther developing economies 4494334 2.0 1.6 65706847 68 7170314 1595 Autres économies en développement
Major exporters of manufactures 2986030 1.8 1.3 25408542 118 5523117 1850Principaux exportateurs d'articles manufacturés
Remaining economies 1508305 2.5 2.2 40298305 37 1647197 1092 Autres économies America 236478 1.9 1.6 11331109 21 732245 3096 Amérique Africa 699185 2.9 2.4 23328690 30 585185 837 Afrique West Asia 12688 2.4 3.2 105907 120 34418 2713 Asie occidentale Other Asia 551241 2.4 2.1 4980304 111 276933 502 Autres pays d'Asie
By income group(per capita GDP in 2000)
Par catégories de revenus(PIB par habitant en 2000)
High-income countries 325936 2.0 1.5 13407712 24 2932954 8999 Pays à revenu élevéMiddle-income countries 795680 2.4 1.7 24162578 33 2227023 2799 Pays à revenu intermédiaireLow-income countries 3979106 2.1 1.6 43258250 92 3247598 816 Pays à revenu faible
MEMO ITEM: POUR MEMOIRE :Least developed countries 741597 2.6 2.5 20740909 36 253335 342 Pays les moins avancésHeavily indebted poor countries 558749 2.8 2.5 20438184 27 194243 348 Pays pauvres très endettésLandlocked countries 369878 2.5 2.3 16313262 23 180247 487 Pays enclavés
Developing economies excluding China
3815380 2.4 1.9 71267579 54 6758206 1771Economies en développement Chine non comprise
Sub-Saharan Africa 734642 2.9 2.5 24231217 30 525927 716 Afrique subsaharienne
For sources and notes, see next page. Pour les sources et les notes, se reporter à la page suivante.
7.1 Population, area, density and total and per capita gross domestic product
(concluded)
Annual averagegrowth rate
Taux d'accroissementannuel moyen
Total
2004Region, economic grouping,
country or area
Population 1
Percentage
En pourcentage
Area 2
Superficie 2
Density
Densité
2004
Nominal gross domestic
product 3
Produit intérieur brut
nominal 3
2004
7.1 Population, superficie, densité et produit intérieur brut, total et par habitant
(fin)
Régions,groupements économiques,
pays ou zonesTotal
Per capita
Parhabitant
Dollars
321

Total real product / Produit réel total 1
1980-89 1980-00 1980-03 1990-00 1990-04 1995-00 1995-04 2000-01 2001-02 2002-03 2003-04
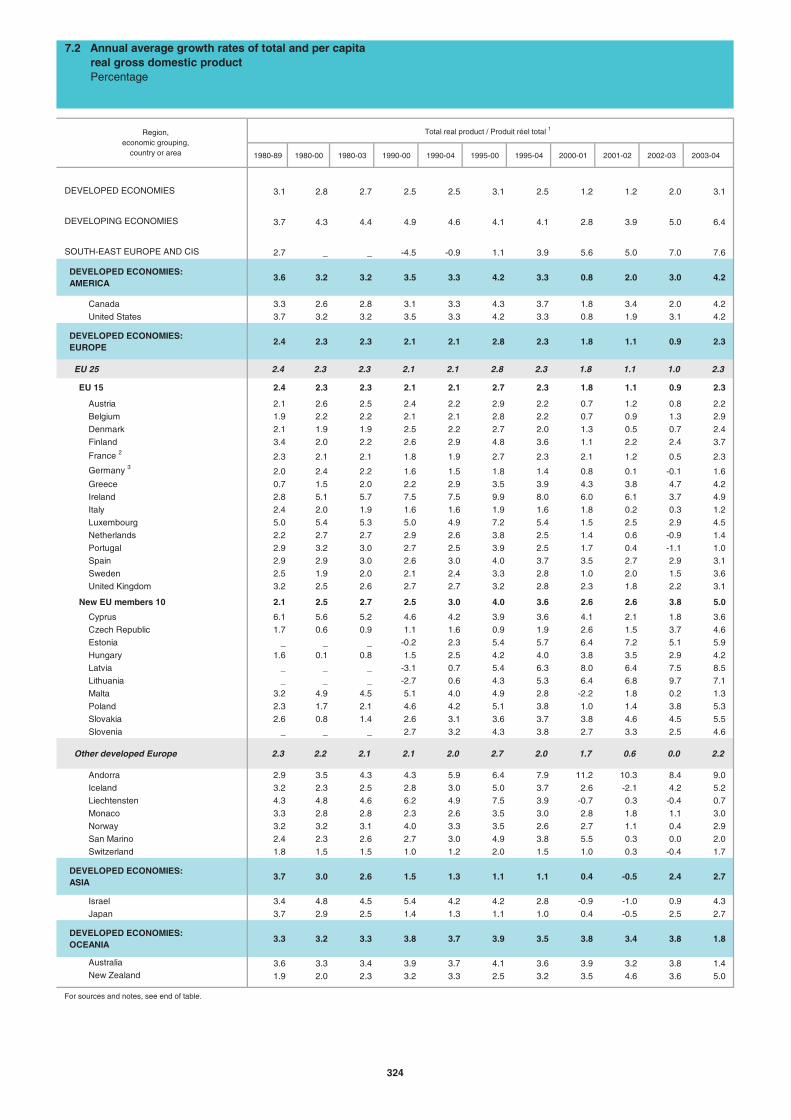
DEVELOPED ECONOMIES 3.1 2.8 2.7 2.5 2.5 3.1 2.5 1.2 1.2 2.0 3.1
DEVELOPING ECONOMIES 3.7 4.3 4.4 4.9 4.6 4.1 4.1 2.8 3.9 5.0 6.4
SOUTH-EAST EUROPE AND CIS 2.7 _ _ -4.5 -0.9 1.1 3.9 5.6 5.0 7.0 7.6
DEVELOPED ECONOMIES: AMERICA
3.6 3.2 3.2 3.5 3.3 4.2 3.3 0.8 2.0 3.0 4.2
Canada 3.3 2.6 2.8 3.1 3.3 4.3 3.7 1.8 3.4 2.0 4.2
United States 3.7 3.2 3.2 3.5 3.3 4.2 3.3 0.8 1.9 3.1 4.2
DEVELOPED ECONOMIES: EUROPE
2.4 2.3 2.3 2.1 2.1 2.8 2.3 1.8 1.1 0.9 2.3
EU 25 2.4 2.3 2.3 2.1 2.1 2.8 2.3 1.8 1.1 1.0 2.3
EU 15 2.4 2.3 2.3 2.1 2.1 2.7 2.3 1.8 1.1 0.9 2.3
Austria 2.1 2.6 2.5 2.4 2.2 2.9 2.2 0.7 1.2 0.8 2.2
Belgium 1.9 2.2 2.2 2.1 2.1 2.8 2.2 0.7 0.9 1.3 2.9
Denmark 2.1 1.9 1.9 2.5 2.2 2.7 2.0 1.3 0.5 0.7 2.4
Finland 3.4 2.0 2.2 2.6 2.9 4.8 3.6 1.1 2.2 2.4 3.7
France 2 2.3 2.1 2.1 1.8 1.9 2.7 2.3 2.1 1.2 0.5 2.3
Germany 3 2.0 2.4 2.2 1.6 1.5 1.8 1.4 0.8 0.1 -0.1 1.6
Greece 0.7 1.5 2.0 2.2 2.9 3.5 3.9 4.3 3.8 4.7 4.2
Ireland 2.8 5.1 5.7 7.5 7.5 9.9 8.0 6.0 6.1 3.7 4.9
Italy 2.4 2.0 1.9 1.6 1.6 1.9 1.6 1.8 0.2 0.3 1.2
Luxembourg 5.0 5.4 5.3 5.0 4.9 7.2 5.4 1.5 2.5 2.9 4.5
Netherlands 2.2 2.7 2.7 2.9 2.6 3.8 2.5 1.4 0.6 -0.9 1.4
Portugal 2.9 3.2 3.0 2.7 2.5 3.9 2.5 1.7 0.4 -1.1 1.0
Spain 2.9 2.9 3.0 2.6 3.0 4.0 3.7 3.5 2.7 2.9 3.1
Sweden 2.5 1.9 2.0 2.1 2.4 3.3 2.8 1.0 2.0 1.5 3.6
United Kingdom 3.2 2.5 2.6 2.7 2.7 3.2 2.8 2.3 1.8 2.2 3.1
New EU members 10 2.1 2.5 2.7 2.5 3.0 4.0 3.6 2.6 2.6 3.8 5.0
Cyprus 6.1 5.6 5.2 4.6 4.2 3.9 3.6 4.1 2.1 1.8 3.6
Czech Republic 1.7 0.6 0.9 1.1 1.6 0.9 1.9 2.6 1.5 3.7 4.6
Estonia _ _ _ -0.2 2.3 5.4 5.7 6.4 7.2 5.1 5.9
Hungary 1.6 0.1 0.8 1.5 2.5 4.2 4.0 3.8 3.5 2.9 4.2
Latvia _ _ _ -3.1 0.7 5.4 6.3 8.0 6.4 7.5 8.5
Lithuania _ _ _ -2.7 0.6 4.3 5.3 6.4 6.8 9.7 7.1
Malta 3.2 4.9 4.5 5.1 4.0 4.9 2.8 -2.2 1.8 0.2 1.3
Poland 2.3 1.7 2.1 4.6 4.2 5.1 3.8 1.0 1.4 3.8 5.3
Slovakia 2.6 0.8 1.4 2.6 3.1 3.6 3.7 3.8 4.6 4.5 5.5
Slovenia _ _ _ 2.7 3.2 4.3 3.8 2.7 3.3 2.5 4.6
Other developed Europe 2.3 2.2 2.1 2.1 2.0 2.7 2.0 1.7 0.6 0.0 2.2
Andorra 2.9 3.5 4.3 4.3 5.9 6.4 7.9 11.2 10.3 8.4 9.0
Iceland 3.2 2.3 2.5 2.8 3.0 5.0 3.7 2.6 -2.1 4.2 5.2
Liechtensten 4.3 4.8 4.6 6.2 4.9 7.5 3.9 -0.7 0.3 -0.4 0.7
Monaco 3.3 2.8 2.8 2.3 2.6 3.5 3.0 2.8 1.8 1.1 3.0
Norway 3.2 3.2 3.1 4.0 3.3 3.5 2.6 2.7 1.1 0.4 2.9
San Marino 2.4 2.3 2.6 2.7 3.0 4.9 3.8 5.5 0.3 0.0 2.0
Switzerland 1.8 1.5 1.5 1.0 1.2 2.0 1.5 1.0 0.3 -0.4 1.7
DEVELOPED ECONOMIES: ASIA
3.7 3.0 2.6 1.5 1.3 1.1 1.1 0.4 -0.5 2.4 2.7
Israel 3.4 4.8 4.5 5.4 4.2 4.2 2.8 -0.9 -1.0 0.9 4.3
Japan 3.7 2.9 2.5 1.4 1.3 1.1 1.0 0.4 -0.5 2.5 2.7
DEVELOPED ECONOMIES: OCEANIA
3.3 3.2 3.3 3.8 3.7 3.9 3.5 3.8 3.4 3.8 1.8
Australia 3.6 3.3 3.4 3.9 3.7 4.1 3.6 3.9 3.2 3.8 1.4 New Zealand 1.9 2.0 2.3 3.2 3.3 2.5 3.2 3.5 4.6 3.6 5.0
For sources and notes, see end of table.
7.2 Annual average growth rates of total and per capita real gross domestic product
Percentage
Region,economic grouping,
country or area
324
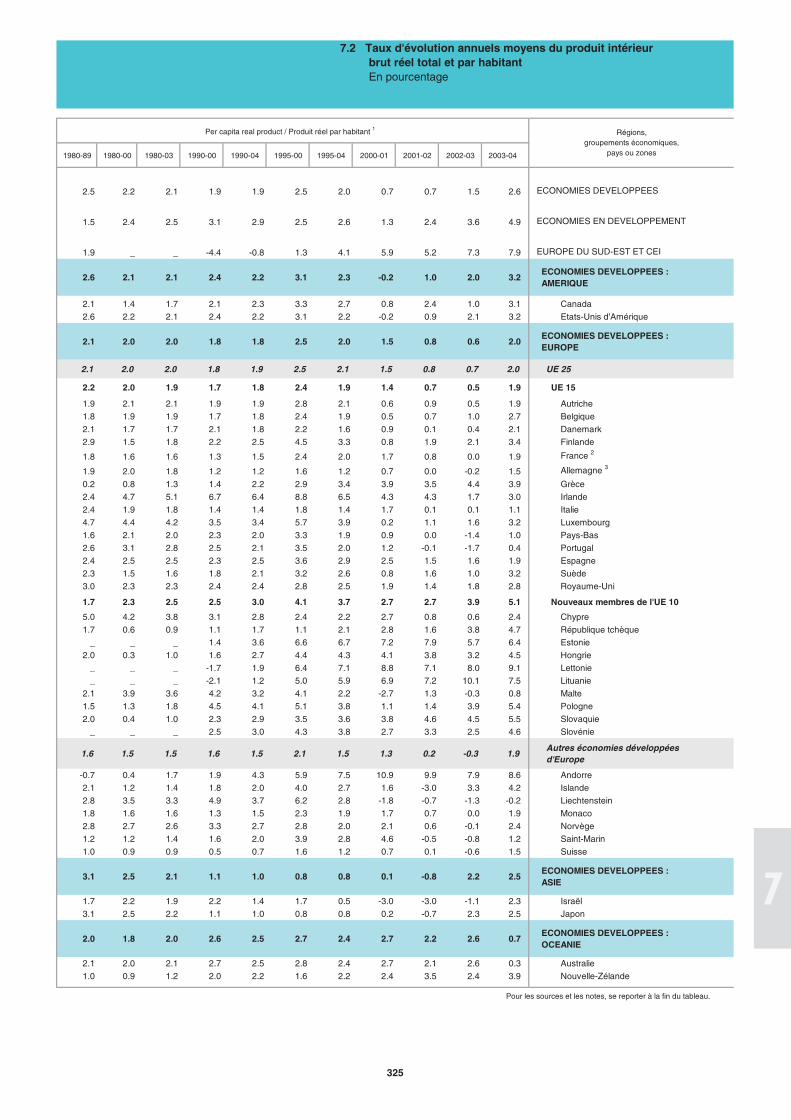
Per capita real product / Produit réel par habitant 1
1980-89 1980-00 1980-03 1990-00 1990-04 1995-00 1995-04 2000-01 2001-02 2002-03 2003-04
2.5 2.2 2.1 1.9 1.9 2.5 2.0 0.7 0.7 1.5 2.6 ECONOMIES DEVELOPPEES
1.5 2.4 2.5 3.1 2.9 2.5 2.6 1.3 2.4 3.6 4.9 ECONOMIES EN DEVELOPPEMENT
1.9 _ _ -4.4 -0.8 1.3 4.1 5.9 5.2 7.3 7.9 EUROPE DU SUD-EST ET CEI
2.6 2.1 2.1 2.4 2.2 3.1 2.3 -0.2 1.0 2.0 3.2 ECONOMIES DEVELOPPEES : AMERIQUE
2.1 1.4 1.7 2.1 2.3 3.3 2.7 0.8 2.4 1.0 3.1 Canada
2.6 2.2 2.1 2.4 2.2 3.1 2.2 -0.2 0.9 2.1 3.2 Etats-Unis d'Amérique
2.1 2.0 2.0 1.8 1.8 2.5 2.0 1.5 0.8 0.6 2.0 ECONOMIES DEVELOPPEES : EUROPE
2.1 2.0 2.0 1.8 1.9 2.5 2.1 1.5 0.8 0.7 2.0 UE 25
2.2 2.0 1.9 1.7 1.8 2.4 1.9 1.4 0.7 0.5 1.9 UE 15
1.9 2.1 2.1 1.9 1.9 2.8 2.1 0.6 0.9 0.5 1.9 Autriche
1.8 1.9 1.9 1.7 1.8 2.4 1.9 0.5 0.7 1.0 2.7 Belgique
2.1 1.7 1.7 2.1 1.8 2.2 1.6 0.9 0.1 0.4 2.1 Danemark
2.9 1.5 1.8 2.2 2.5 4.5 3.3 0.8 1.9 2.1 3.4 Finlande
1.8 1.6 1.6 1.3 1.5 2.4 2.0 1.7 0.8 0.0 1.9 France 2
1.9 2.0 1.8 1.2 1.2 1.6 1.2 0.7 0.0 -0.2 1.5 Allemagne 3
0.2 0.8 1.3 1.4 2.2 2.9 3.4 3.9 3.5 4.4 3.9 Grèce
2.4 4.7 5.1 6.7 6.4 8.8 6.5 4.3 4.3 1.7 3.0 Irlande
2.4 1.9 1.8 1.4 1.4 1.8 1.4 1.7 0.1 0.1 1.1 Italie
4.7 4.4 4.2 3.5 3.4 5.7 3.9 0.2 1.1 1.6 3.2 Luxembourg
1.6 2.1 2.0 2.3 2.0 3.3 1.9 0.9 0.0 -1.4 1.0 Pays-Bas
2.6 3.1 2.8 2.5 2.1 3.5 2.0 1.2 -0.1 -1.7 0.4 Portugal
2.4 2.5 2.5 2.3 2.5 3.6 2.9 2.5 1.5 1.6 1.9 Espagne
2.3 1.5 1.6 1.8 2.1 3.2 2.6 0.8 1.6 1.0 3.2 Suède
3.0 2.3 2.3 2.4 2.4 2.8 2.5 1.9 1.4 1.8 2.8 Royaume-Uni
1.7 2.3 2.5 2.5 3.0 4.1 3.7 2.7 2.7 3.9 5.1 Nouveaux membres de l'UE 10
5.0 4.2 3.8 3.1 2.8 2.4 2.2 2.7 0.8 0.6 2.4 Chypre
1.7 0.6 0.9 1.1 1.7 1.1 2.1 2.8 1.6 3.8 4.7 République tchèque
_ _ _ 1.4 3.6 6.6 6.7 7.2 7.9 5.7 6.4 Estonie
2.0 0.3 1.0 1.6 2.7 4.4 4.3 4.1 3.8 3.2 4.5 Hongrie
_ _ _ -1.7 1.9 6.4 7.1 8.8 7.1 8.0 9.1 Lettonie
_ _ _ -2.1 1.2 5.0 5.9 6.9 7.2 10.1 7.5 Lituanie
2.1 3.9 3.6 4.2 3.2 4.1 2.2 -2.7 1.3 -0.3 0.8 Malte
1.5 1.3 1.8 4.5 4.1 5.1 3.8 1.1 1.4 3.9 5.4 Pologne
2.0 0.4 1.0 2.3 2.9 3.5 3.6 3.8 4.6 4.5 5.5 Slovaquie
_ _ _ 2.5 3.0 4.3 3.8 2.7 3.3 2.5 4.6 Slovénie
1.6 1.5 1.5 1.6 1.5 2.1 1.5 1.3 0.2 -0.3 1.9 Autres économies développées d'Europe
-0.7 0.4 1.7 1.9 4.3 5.9 7.5 10.9 9.9 7.9 8.6 Andorre
2.1 1.2 1.4 1.8 2.0 4.0 2.7 1.6 -3.0 3.3 4.2 Islande
2.8 3.5 3.3 4.9 3.7 6.2 2.8 -1.8 -0.7 -1.3 -0.2 Liechtenstein
1.8 1.6 1.6 1.3 1.5 2.3 1.9 1.7 0.7 0.0 1.9 Monaco
2.8 2.7 2.6 3.3 2.7 2.8 2.0 2.1 0.6 -0.1 2.4 Norvège
1.2 1.2 1.4 1.6 2.0 3.9 2.8 4.6 -0.5 -0.8 1.2 Saint-Marin
1.0 0.9 0.9 0.5 0.7 1.6 1.2 0.7 0.1 -0.6 1.5 Suisse
3.1 2.5 2.1 1.1 1.0 0.8 0.8 0.1 -0.8 2.2 2.5 ECONOMIES DEVELOPPEES : ASIE
1.7 2.2 1.9 2.2 1.4 1.7 0.5 -3.0 -3.0 -1.1 2.3 Israël
3.1 2.5 2.2 1.1 1.0 0.8 0.8 0.2 -0.7 2.3 2.5 Japon
2.0 1.8 2.0 2.6 2.5 2.7 2.4 2.7 2.2 2.6 0.7 ECONOMIES DEVELOPPEES : OCEANIE
2.1 2.0 2.1 2.7 2.5 2.8 2.4 2.7 2.1 2.6 0.3 Australie
1.0 0.9 1.2 2.0 2.2 1.6 2.2 2.4 3.5 2.4 3.9 Nouvelle-Zélande
Pour les sources et les notes, se reporter à la fin du tableau.
Régions,groupements économiques,
pays ou zones
7.2 Taux d'évolution annuels moyens du produit intérieur brut réel total et par habitant
En pourcentage
325
Total real product / Produit réel total 1
1980-89 1980-00 1980-03 1990-00 1990-04 1995-00 1995-04 2000-01 2001-02 2002-03 2003-04
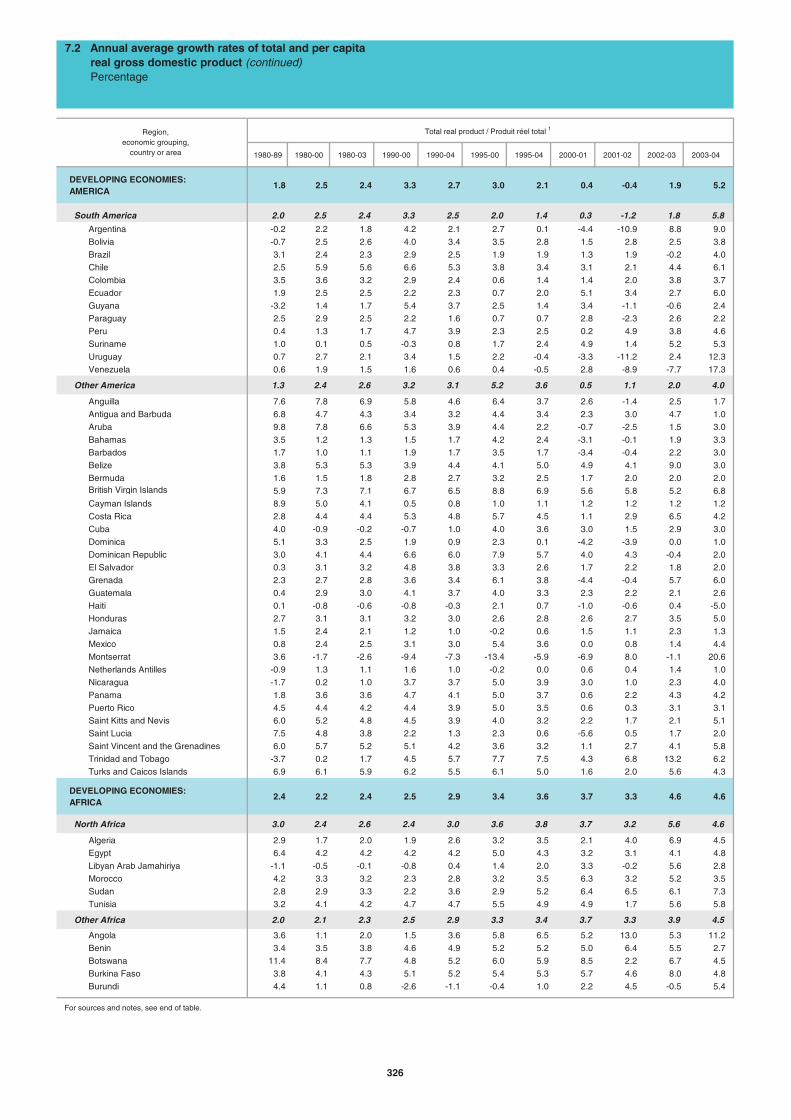
DEVELOPING ECONOMIES: AMERICA
1.8 2.5 2.4 3.3 2.7 3.0 2.1 0.4 -0.4 1.9 5.2
South America 2.0 2.5 2.4 3.3 2.5 2.0 1.4 0.3 -1.2 1.8 5.8
Argentina -0.2 2.2 1.8 4.2 2.1 2.7 0.1 -4.4 -10.9 8.8 9.0
Bolivia -0.7 2.5 2.6 4.0 3.4 3.5 2.8 1.5 2.8 2.5 3.8
Brazil 3.1 2.4 2.3 2.9 2.5 1.9 1.9 1.3 1.9 -0.2 4.0
Chile 2.5 5.9 5.6 6.6 5.3 3.8 3.4 3.1 2.1 4.4 6.1
Colombia 3.5 3.6 3.2 2.9 2.4 0.6 1.4 1.4 2.0 3.8 3.7
Ecuador 1.9 2.5 2.5 2.2 2.3 0.7 2.0 5.1 3.4 2.7 6.0
Guyana -3.2 1.4 1.7 5.4 3.7 2.5 1.4 3.4 -1.1 -0.6 2.4
Paraguay 2.5 2.9 2.5 2.2 1.6 0.7 0.7 2.8 -2.3 2.6 2.2
Peru 0.4 1.3 1.7 4.7 3.9 2.3 2.5 0.2 4.9 3.8 4.6
Suriname 1.0 0.1 0.5 -0.3 0.8 1.7 2.4 4.9 1.4 5.2 5.3
Uruguay 0.7 2.7 2.1 3.4 1.5 2.2 -0.4 -3.3 -11.2 2.4 12.3
Venezuela 0.6 1.9 1.5 1.6 0.6 0.4 -0.5 2.8 -8.9 -7.7 17.3
Other America 1.3 2.4 2.6 3.2 3.1 5.2 3.6 0.5 1.1 2.0 4.0
Anguilla 7.6 7.8 6.9 5.8 4.6 6.4 3.7 2.6 -1.4 2.5 1.7
Antigua and Barbuda 6.8 4.7 4.3 3.4 3.2 4.4 3.4 2.3 3.0 4.7 1.0
Aruba 9.8 7.8 6.6 5.3 3.9 4.4 2.2 -0.7 -2.5 1.5 3.0
Bahamas 3.5 1.2 1.3 1.5 1.7 4.2 2.4 -3.1 -0.1 1.9 3.3
Barbados 1.7 1.0 1.1 1.9 1.7 3.5 1.7 -3.4 -0.4 2.2 3.0
Belize 3.8 5.3 5.3 3.9 4.4 4.1 5.0 4.9 4.1 9.0 3.0
Bermuda 1.6 1.5 1.8 2.8 2.7 3.2 2.5 1.7 2.0 2.0 2.0 British Virgin Islands 5.9 7.3 7.1 6.7 6.5 8.8 6.9 5.6 5.8 5.2 6.8
Cayman Islands 8.9 5.0 4.1 0.5 0.8 1.0 1.1 1.2 1.2 1.2 1.2
Costa Rica 2.8 4.4 4.4 5.3 4.8 5.7 4.5 1.1 2.9 6.5 4.2
Cuba 4.0 -0.9 -0.2 -0.7 1.0 4.0 3.6 3.0 1.5 2.9 3.0
Dominica 5.1 3.3 2.5 1.9 0.9 2.3 0.1 -4.2 -3.9 0.0 1.0
Dominican Republic 3.0 4.1 4.4 6.6 6.0 7.9 5.7 4.0 4.3 -0.4 2.0
El Salvador 0.3 3.1 3.2 4.8 3.8 3.3 2.6 1.7 2.2 1.8 2.0
Grenada 2.3 2.7 2.8 3.6 3.4 6.1 3.8 -4.4 -0.4 5.7 6.0
Guatemala 0.4 2.9 3.0 4.1 3.7 4.0 3.3 2.3 2.2 2.1 2.6
Haiti 0.1 -0.8 -0.6 -0.8 -0.3 2.1 0.7 -1.0 -0.6 0.4 -5.0
Honduras 2.7 3.1 3.1 3.2 3.0 2.6 2.8 2.6 2.7 3.5 5.0
Jamaica 1.5 2.4 2.1 1.2 1.0 -0.2 0.6 1.5 1.1 2.3 1.3
Mexico 0.8 2.4 2.5 3.1 3.0 5.4 3.6 0.0 0.8 1.4 4.4
Montserrat 3.6 -1.7 -2.6 -9.4 -7.3 -13.4 -5.9 -6.9 8.0 -1.1 20.6
Netherlands Antilles -0.9 1.3 1.1 1.6 1.0 -0.2 0.0 0.6 0.4 1.4 1.0
Nicaragua -1.7 0.2 1.0 3.7 3.7 5.0 3.9 3.0 1.0 2.3 4.0
Panama 1.8 3.6 3.6 4.7 4.1 5.0 3.7 0.6 2.2 4.3 4.2
Puerto Rico 4.5 4.4 4.2 4.4 3.9 5.0 3.5 0.6 0.3 3.1 3.1
Saint Kitts and Nevis 6.0 5.2 4.8 4.5 3.9 4.0 3.2 2.2 1.7 2.1 5.1
Saint Lucia 7.5 4.8 3.8 2.2 1.3 2.3 0.6 -5.6 0.5 1.7 2.0
Saint Vincent and the Grenadines 6.0 5.7 5.2 5.1 4.2 3.6 3.2 1.1 2.7 4.1 5.8
Trinidad and Tobago -3.7 0.2 1.7 4.5 5.7 7.7 7.5 4.3 6.8 13.2 6.2
Turks and Caicos Islands 6.9 6.1 5.9 6.2 5.5 6.1 5.0 1.6 2.0 5.6 4.3
DEVELOPING ECONOMIES: AFRICA
2.4 2.2 2.4 2.5 2.9 3.4 3.6 3.7 3.3 4.6 4.6
North Africa 3.0 2.4 2.6 2.4 3.0 3.6 3.8 3.7 3.2 5.6 4.6
Algeria 2.9 1.7 2.0 1.9 2.6 3.2 3.5 2.1 4.0 6.9 4.5
Egypt 6.4 4.2 4.2 4.2 4.2 5.0 4.3 3.2 3.1 4.1 4.8
Libyan Arab Jamahiriya -1.1 -0.5 -0.1 -0.8 0.4 1.4 2.0 3.3 -0.2 5.6 2.8
Morocco 4.2 3.3 3.2 2.3 2.8 3.2 3.5 6.3 3.2 5.2 3.5
Sudan 2.8 2.9 3.3 2.2 3.6 2.9 5.2 6.4 6.5 6.1 7.3
Tunisia 3.2 4.1 4.2 4.7 4.7 5.5 4.9 4.9 1.7 5.6 5.8
Other Africa 2.0 2.1 2.3 2.5 2.9 3.3 3.4 3.7 3.3 3.9 4.5
Angola 3.6 1.1 2.0 1.5 3.6 5.8 6.5 5.2 13.0 5.3 11.2
Benin 3.4 3.5 3.8 4.6 4.9 5.2 5.2 5.0 6.4 5.5 2.7
Botswana 11.4 8.4 7.7 4.8 5.2 6.0 5.9 8.5 2.2 6.7 4.5
Burkina Faso 3.8 4.1 4.3 5.1 5.2 5.4 5.3 5.7 4.6 8.0 4.8
Burundi 4.4 1.1 0.8 -2.6 -1.1 -0.4 1.0 2.2 4.5 -0.5 5.4
For sources and notes, see end of table.
7.2 Annual average growth rates of total and per capita real gross domestic product (continued)
Percentage
Region,economic grouping,
country or area
326
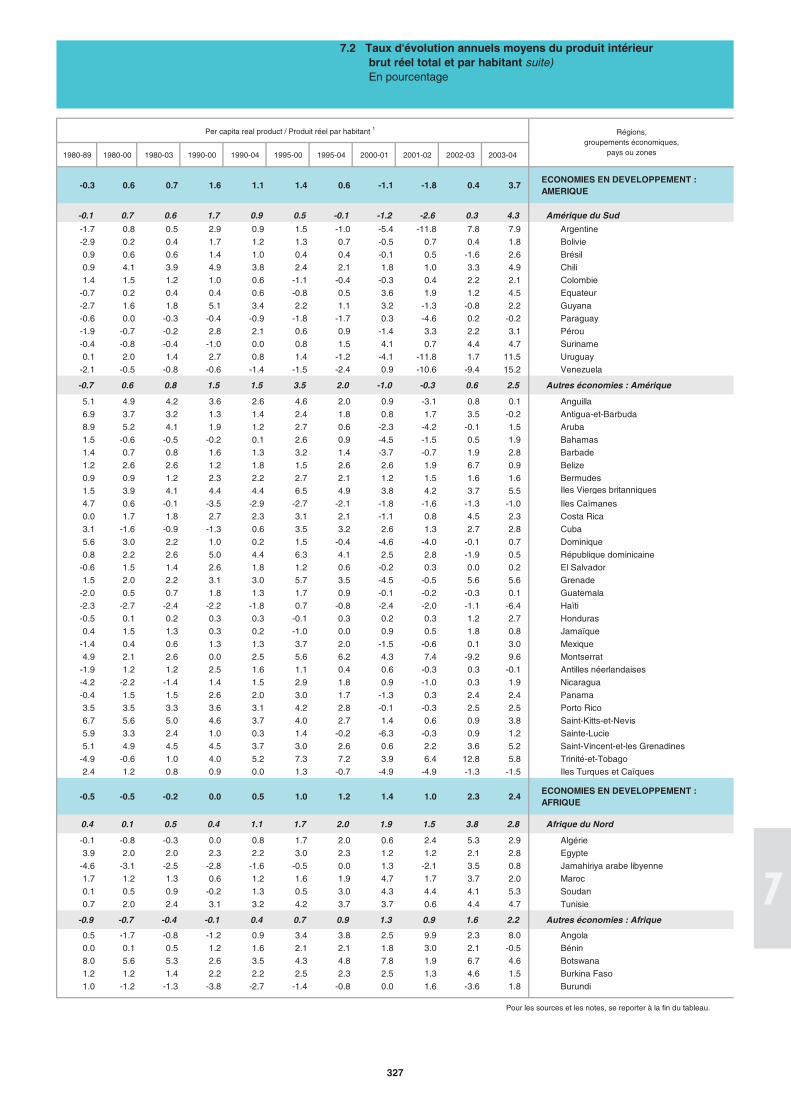
Per capita real product / Produit réel par habitant 1
1980-89 1980-00 1980-03 1990-00 1990-04 1995-00 1995-04 2000-01 2001-02 2002-03 2003-04
-0.3 0.6 0.7 1.6 1.1 1.4 0.6 -1.1 -1.8 0.4 3.7 ECONOMIES EN DEVELOPPEMENT : AMERIQUE
-0.1 0.7 0.6 1.7 0.9 0.5 -0.1 -1.2 -2.6 0.3 4.3 Amérique du Sud
-1.7 0.8 0.5 2.9 0.9 1.5 -1.0 -5.4 -11.8 7.8 7.9 Argentine
-2.9 0.2 0.4 1.7 1.2 1.3 0.7 -0.5 0.7 0.4 1.8 Bolivie
0.9 0.6 0.6 1.4 1.0 0.4 0.4 -0.1 0.5 -1.6 2.6 Brésil
0.9 4.1 3.9 4.9 3.8 2.4 2.1 1.8 1.0 3.3 4.9 Chili
1.4 1.5 1.2 1.0 0.6 -1.1 -0.4 -0.3 0.4 2.2 2.1 Colombie
-0.7 0.2 0.4 0.4 0.6 -0.8 0.5 3.6 1.9 1.2 4.5 Equateur
-2.7 1.6 1.8 5.1 3.4 2.2 1.1 3.2 -1.3 -0.8 2.2 Guyana
-0.6 0.0 -0.3 -0.4 -0.9 -1.8 -1.7 0.3 -4.6 0.2 -0.2 Paraguay
-1.9 -0.7 -0.2 2.8 2.1 0.6 0.9 -1.4 3.3 2.2 3.1 Pérou
-0.4 -0.8 -0.4 -1.0 0.0 0.8 1.5 4.1 0.7 4.4 4.7 Suriname
0.1 2.0 1.4 2.7 0.8 1.4 -1.2 -4.1 -11.8 1.7 11.5 Uruguay
-2.1 -0.5 -0.8 -0.6 -1.4 -1.5 -2.4 0.9 -10.6 -9.4 15.2 Venezuela
-0.7 0.6 0.8 1.5 1.5 3.5 2.0 -1.0 -0.3 0.6 2.5 Autres économies : Amérique
5.1 4.9 4.2 3.6 2.6 4.6 2.0 0.9 -3.1 0.8 0.1 Anguilla
6.9 3.7 3.2 1.3 1.4 2.4 1.8 0.8 1.7 3.5 -0.2 Antigua-et-Barbuda
8.9 5.2 4.1 1.9 1.2 2.7 0.6 -2.3 -4.2 -0.1 1.5 Aruba
1.5 -0.6 -0.5 -0.2 0.1 2.6 0.9 -4.5 -1.5 0.5 1.9 Bahamas
1.4 0.7 0.8 1.6 1.3 3.2 1.4 -3.7 -0.7 1.9 2.8 Barbade
1.2 2.6 2.6 1.2 1.8 1.5 2.6 2.6 1.9 6.7 0.9 Belize
0.9 0.9 1.2 2.3 2.2 2.7 2.1 1.2 1.5 1.6 1.6 Bermudes
1.5 3.9 4.1 4.4 4.4 6.5 4.9 3.8 4.2 3.7 5.5 Iles Vierges britanniques
4.7 0.6 -0.1 -3.5 -2.9 -2.7 -2.1 -1.8 -1.6 -1.3 -1.0 Iles Caïmanes
0.0 1.7 1.8 2.7 2.3 3.1 2.1 -1.1 0.8 4.5 2.3 Costa Rica
3.1 -1.6 -0.9 -1.3 0.6 3.5 3.2 2.6 1.3 2.7 2.8 Cuba
5.6 3.0 2.2 1.0 0.2 1.5 -0.4 -4.6 -4.0 -0.1 0.7 Dominique
0.8 2.2 2.6 5.0 4.4 6.3 4.1 2.5 2.8 -1.9 0.5 République dominicaine
-0.6 1.5 1.4 2.6 1.8 1.2 0.6 -0.2 0.3 0.0 0.2 El Salvador
1.5 2.0 2.2 3.1 3.0 5.7 3.5 -4.5 -0.5 5.6 5.6 Grenade
-2.0 0.5 0.7 1.8 1.3 1.7 0.9 -0.1 -0.2 -0.3 0.1 Guatemala
-2.3 -2.7 -2.4 -2.2 -1.8 0.7 -0.8 -2.4 -2.0 -1.1 -6.4 Haïti
-0.5 0.1 0.2 0.3 0.3 -0.1 0.3 0.2 0.3 1.2 2.7 Honduras
0.4 1.5 1.3 0.3 0.2 -1.0 0.0 0.9 0.5 1.8 0.8 Jamaïque
-1.4 0.4 0.6 1.3 1.3 3.7 2.0 -1.5 -0.6 0.1 3.0 Mexique
4.9 2.1 2.6 0.0 2.5 5.6 6.2 4.3 7.4 -9.2 9.6 Montserrat
-1.9 1.2 1.2 2.5 1.6 1.1 0.4 0.6 -0.3 0.3 -0.1 Antilles néerlandaises
-4.2 -2.2 -1.4 1.4 1.5 2.9 1.8 0.9 -1.0 0.3 1.9 Nicaragua
-0.4 1.5 1.5 2.6 2.0 3.0 1.7 -1.3 0.3 2.4 2.4 Panama
3.5 3.5 3.3 3.6 3.1 4.2 2.8 -0.1 -0.3 2.5 2.5 Porto Rico
6.7 5.6 5.0 4.6 3.7 4.0 2.7 1.4 0.6 0.9 3.8 Saint-Kitts-et-Nevis
5.9 3.3 2.4 1.0 0.3 1.4 -0.2 -6.3 -0.3 0.9 1.2 Sainte-Lucie
5.1 4.9 4.5 4.5 3.7 3.0 2.6 0.6 2.2 3.6 5.2 Saint-Vincent-et-les Grenadines
-4.9 -0.6 1.0 4.0 5.2 7.3 7.2 3.9 6.4 12.8 5.8 Trinité-et-Tobago
2.4 1.2 0.8 0.9 0.0 1.3 -0.7 -4.9 -4.9 -1.3 -1.5 Iles Turques et Caïques
-0.5 -0.5 -0.2 0.0 0.5 1.0 1.2 1.4 1.0 2.3 2.4 ECONOMIES EN DEVELOPPEMENT : AFRIQUE
0.4 0.1 0.5 0.4 1.1 1.7 2.0 1.9 1.5 3.8 2.8 Afrique du Nord
-0.1 -0.8 -0.3 0.0 0.8 1.7 2.0 0.6 2.4 5.3 2.9 Algérie
3.9 2.0 2.0 2.3 2.2 3.0 2.3 1.2 1.2 2.1 2.8 Egypte
-4.6 -3.1 -2.5 -2.8 -1.6 -0.5 0.0 1.3 -2.1 3.5 0.8 Jamahiriya arabe libyenne
1.7 1.2 1.3 0.6 1.2 1.6 1.9 4.7 1.7 3.7 2.0 Maroc
0.1 0.5 0.9 -0.2 1.3 0.5 3.0 4.3 4.4 4.1 5.3 Soudan
0.7 2.0 2.4 3.1 3.2 4.2 3.7 3.7 0.6 4.4 4.7 Tunisie
-0.9 -0.7 -0.4 -0.1 0.4 0.7 0.9 1.3 0.9 1.6 2.2 Autres économies : Afrique
0.5 -1.7 -0.8 -1.2 0.9 3.4 3.8 2.5 9.9 2.3 8.0 Angola
0.0 0.1 0.5 1.2 1.6 2.1 2.1 1.8 3.0 2.1 -0.5 Bénin
8.0 5.6 5.3 2.6 3.5 4.3 4.8 7.8 1.9 6.7 4.6 Botswana
1.2 1.2 1.4 2.2 2.2 2.5 2.3 2.5 1.3 4.6 1.5 Burkina Faso
1.0 -1.2 -1.3 -3.8 -2.7 -1.4 -0.8 0.0 1.6 -3.6 1.8 Burundi
Pour les sources et les notes, se reporter à la fin du tableau.
Régions,groupements économiques,
pays ou zones
7.2 Taux d'évolution annuels moyens du produit intérieur brut réel total et par habitant suite)
En pourcentage
327
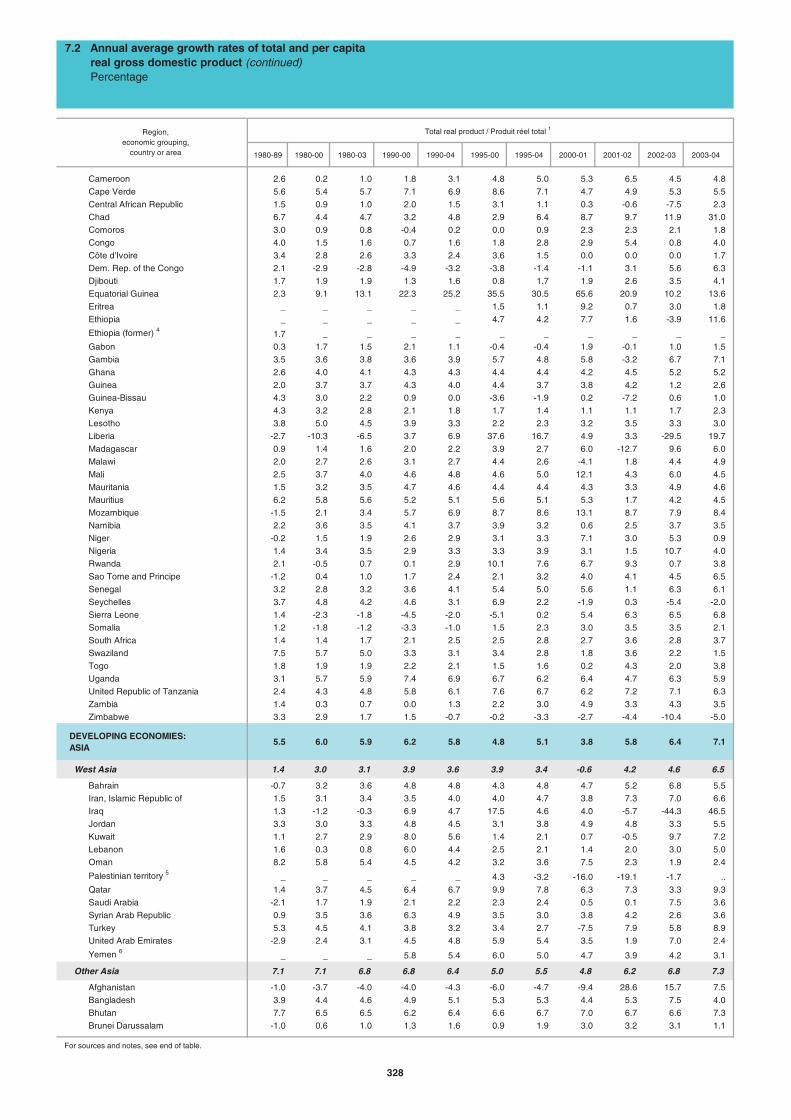
Total real product / Produit réel total 1
1980-89 1980-00 1980-03 1990-00 1990-04 1995-00 1995-04 2000-01 2001-02 2002-03 2003-04
Cameroon 2.6 0.2 1.0 1.8 3.1 4.8 5.0 5.3 6.5 4.5 4.8
Cape Verde 5.6 5.4 5.7 7.1 6.9 8.6 7.1 4.7 4.9 5.3 5.5
Central African Republic 1.5 0.9 1.0 2.0 1.5 3.1 1.1 0.3 -0.6 -7.5 2.3
Chad 6.7 4.4 4.7 3.2 4.8 2.9 6.4 8.7 9.7 11.9 31.0
Comoros 3.0 0.9 0.8 -0.4 0.2 0.0 0.9 2.3 2.3 2.1 1.8
Congo 4.0 1.5 1.6 0.7 1.6 1.8 2.8 2.9 5.4 0.8 4.0
Côte d'Ivoire 3.4 2.8 2.6 3.3 2.4 3.6 1.5 0.0 0.0 0.0 1.7
Dem. Rep. of the Congo 2.1 -2.9 -2.8 -4.9 -3.2 -3.8 -1.4 -1.1 3.1 5.6 6.3
Djibouti 1.7 1.9 1.9 1.3 1.6 0.8 1.7 1.9 2.6 3.5 4.1
Equatorial Guinea 2.3 9.1 13.1 22.3 25.2 35.5 30.5 65.6 20.9 10.2 13.6
Eritrea _ _ _ _ _ 1.5 1.1 9.2 0.7 3.0 1.8
Ethiopia _ _ _ _ _ 4.7 4.2 7.7 1.6 -3.9 11.6
Ethiopia (former) 4 1.7 _ _ _ _ _ _ _ _ _ _
Gabon 0.3 1.7 1.5 2.1 1.1 -0.4 -0.4 1.9 -0.1 1.0 1.5
Gambia 3.5 3.6 3.8 3.6 3.9 5.7 4.8 5.8 -3.2 6.7 7.1
Ghana 2.6 4.0 4.1 4.3 4.3 4.4 4.4 4.2 4.5 5.2 5.2
Guinea 2.0 3.7 3.7 4.3 4.0 4.4 3.7 3.8 4.2 1.2 2.6
Guinea-Bissau 4.3 3.0 2.2 0.9 0.0 -3.6 -1.9 0.2 -7.2 0.6 1.0
Kenya 4.3 3.2 2.8 2.1 1.8 1.7 1.4 1.1 1.1 1.7 2.3
Lesotho 3.8 5.0 4.5 3.9 3.3 2.2 2.3 3.2 3.5 3.3 3.0
Liberia -2.7 -10.3 -6.5 3.7 6.9 37.6 16.7 4.9 3.3 -29.5 19.7
Madagascar 0.9 1.4 1.6 2.0 2.2 3.9 2.7 6.0 -12.7 9.6 6.0
Malawi 2.0 2.7 2.6 3.1 2.7 4.4 2.6 -4.1 1.8 4.4 4.9
Mali 2.5 3.7 4.0 4.6 4.8 4.6 5.0 12.1 4.3 6.0 4.5
Mauritania 1.5 3.2 3.5 4.7 4.6 4.4 4.4 4.3 3.3 4.9 4.6
Mauritius 6.2 5.8 5.6 5.2 5.1 5.6 5.1 5.3 1.7 4.2 4.5
Mozambique -1.5 2.1 3.4 5.7 6.9 8.7 8.6 13.1 8.7 7.9 8.4
Namibia 2.2 3.6 3.5 4.1 3.7 3.9 3.2 0.6 2.5 3.7 3.5
Niger -0.2 1.5 1.9 2.6 2.9 3.1 3.3 7.1 3.0 5.3 0.9
Nigeria 1.4 3.4 3.5 2.9 3.3 3.3 3.9 3.1 1.5 10.7 4.0
Rwanda 2.1 -0.5 0.7 0.1 2.9 10.1 7.6 6.7 9.3 0.7 3.8
Sao Tome and Principe -1.2 0.4 1.0 1.7 2.4 2.1 3.2 4.0 4.1 4.5 6.5
Senegal 3.2 2.8 3.2 3.6 4.1 5.4 5.0 5.6 1.1 6.3 6.1
Seychelles 3.7 4.8 4.2 4.6 3.1 6.9 2.2 -1.9 0.3 -5.4 -2.0
Sierra Leone 1.4 -2.3 -1.8 -4.5 -2.0 -5.1 0.2 5.4 6.3 6.5 6.8
Somalia 1.2 -1.8 -1.2 -3.3 -1.0 1.5 2.3 3.0 3.5 3.5 2.1
South Africa 1.4 1.4 1.7 2.1 2.5 2.5 2.8 2.7 3.6 2.8 3.7
Swaziland 7.5 5.7 5.0 3.3 3.1 3.4 2.8 1.8 3.6 2.2 1.5
Togo 1.8 1.9 1.9 2.2 2.1 1.5 1.6 0.2 4.3 2.0 3.8
Uganda 3.1 5.7 5.9 7.4 6.9 6.7 6.2 6.4 4.7 6.3 5.9
United Republic of Tanzania 2.4 4.3 4.8 5.8 6.1 7.6 6.7 6.2 7.2 7.1 6.3
Zambia 1.4 0.3 0.7 0.0 1.3 2.2 3.0 4.9 3.3 4.3 3.5
Zimbabwe 3.3 2.9 1.7 1.5 -0.7 -0.2 -3.3 -2.7 -4.4 -10.4 -5.0
DEVELOPING ECONOMIES: ASIA
5.5 6.0 5.9 6.2 5.8 4.8 5.1 3.8 5.8 6.4 7.1
West Asia 1.4 3.0 3.1 3.9 3.6 3.9 3.4 -0.6 4.2 4.6 6.5
Bahrain -0.7 3.2 3.6 4.8 4.8 4.3 4.8 4.7 5.2 6.8 5.5
Iran, Islamic Republic of 1.5 3.1 3.4 3.5 4.0 4.0 4.7 3.8 7.3 7.0 6.6
Iraq 1.3 -1.2 -0.3 6.9 4.7 17.5 4.6 4.0 -5.7 -44.3 46.5
Jordan 3.3 3.0 3.3 4.8 4.5 3.1 3.8 4.9 4.8 3.3 5.5
Kuwait 1.1 2.7 2.9 8.0 5.6 1.4 2.1 0.7 -0.5 9.7 7.2
Lebanon 1.6 0.3 0.8 6.0 4.4 2.5 2.1 1.4 2.0 3.0 5.0
Oman 8.2 5.8 5.4 4.5 4.2 3.2 3.6 7.5 2.3 1.9 2.4
Palestinian territory 5 _ _ _ _ _ 4.3 -3.2 -16.0 -19.1 -1.7 ..
Qatar 1.4 3.7 4.5 6.4 6.7 9.9 7.8 6.3 7.3 3.3 9.3
Saudi Arabia -2.1 1.7 1.9 2.1 2.2 2.3 2.4 0.5 0.1 7.5 3.6
Syrian Arab Republic 0.9 3.5 3.6 6.3 4.9 3.5 3.0 3.8 4.2 2.6 3.6
Turkey 5.3 4.5 4.1 3.8 3.2 3.4 2.7 -7.5 7.9 5.8 8.9
United Arab Emirates -2.9 2.4 3.1 4.5 4.8 5.9 5.4 3.5 1.9 7.0 2.4
Yemen 6 _ _ _ 5.8 5.4 6.0 5.0 4.7 3.9 4.2 3.1
Other Asia 7.1 7.1 6.8 6.8 6.4 5.0 5.5 4.8 6.2 6.8 7.3
Afghanistan -1.0 -3.7 -4.0 -4.0 -4.3 -6.0 -4.7 -9.4 28.6 15.7 7.5
Bangladesh 3.9 4.4 4.6 4.9 5.1 5.3 5.3 4.4 5.3 7.5 4.0
Bhutan 7.7 6.5 6.5 6.2 6.4 6.6 6.7 7.0 6.7 6.6 7.3
Brunei Darussalam -1.0 0.6 1.0 1.3 1.6 0.9 1.9 3.0 3.2 3.1 1.1
For sources and notes, see end of table.
7.2 Annual average growth rates of total and per capita real gross domestic product (continued)
Percentage
Region,economic grouping,
country or area
328
Per capita real product / Produit réel par habitant 1
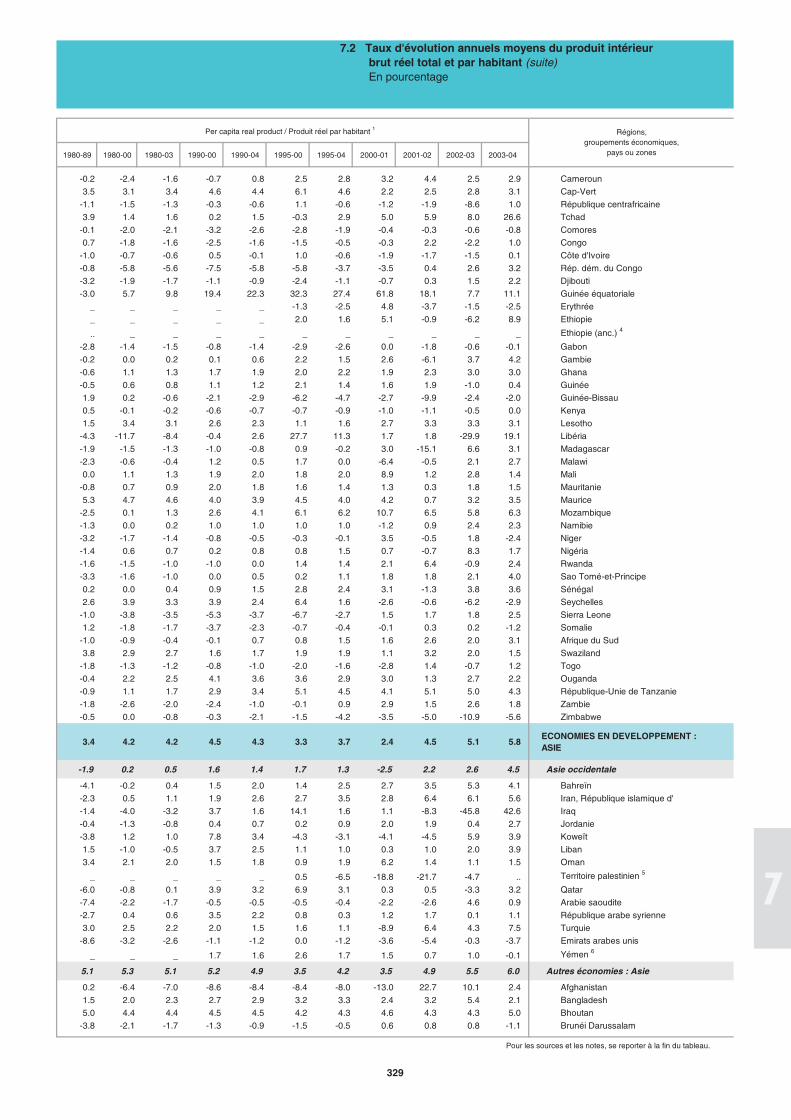
1980-89 1980-00 1980-03 1990-00 1990-04 1995-00 1995-04 2000-01 2001-02 2002-03 2003-04
-0.2 -2.4 -1.6 -0.7 0.8 2.5 2.8 3.2 4.4 2.5 2.9 Cameroun
3.5 3.1 3.4 4.6 4.4 6.1 4.6 2.2 2.5 2.8 3.1 Cap-Vert
-1.1 -1.5 -1.3 -0.3 -0.6 1.1 -0.6 -1.2 -1.9 -8.6 1.0 République centrafricaine
3.9 1.4 1.6 0.2 1.5 -0.3 2.9 5.0 5.9 8.0 26.6 Tchad
-0.1 -2.0 -2.1 -3.2 -2.6 -2.8 -1.9 -0.4 -0.3 -0.6 -0.8 Comores
0.7 -1.8 -1.6 -2.5 -1.6 -1.5 -0.5 -0.3 2.2 -2.2 1.0 Congo
-1.0 -0.7 -0.6 0.5 -0.1 1.0 -0.6 -1.9 -1.7 -1.5 0.1 Côte d'Ivoire
-0.8 -5.8 -5.6 -7.5 -5.8 -5.8 -3.7 -3.5 0.4 2.6 3.2 Rép. dém. du Congo
-3.2 -1.9 -1.7 -1.1 -0.9 -2.4 -1.1 -0.7 0.3 1.5 2.2 Djibouti
-3.0 5.7 9.8 19.4 22.3 32.3 27.4 61.8 18.1 7.7 11.1 Guinée équatoriale
_ _ _ _ _ -1.3 -2.5 4.8 -3.7 -1.5 -2.5 Erythrée
_ _ _ _ _ 2.0 1.6 5.1 -0.9 -6.2 8.9 Ethiopie
.. _ _ _ _ _ _ _ _ _ _ Ethiopie (anc.) 4
-2.8 -1.4 -1.5 -0.8 -1.4 -2.9 -2.6 0.0 -1.8 -0.6 -0.1 Gabon
-0.2 0.0 0.2 0.1 0.6 2.2 1.5 2.6 -6.1 3.7 4.2 Gambie
-0.6 1.1 1.3 1.7 1.9 2.0 2.2 1.9 2.3 3.0 3.0 Ghana
-0.5 0.6 0.8 1.1 1.2 2.1 1.4 1.6 1.9 -1.0 0.4 Guinée
1.9 0.2 -0.6 -2.1 -2.9 -6.2 -4.7 -2.7 -9.9 -2.4 -2.0 Guinée-Bissau
0.5 -0.1 -0.2 -0.6 -0.7 -0.7 -0.9 -1.0 -1.1 -0.5 0.0 Kenya
1.5 3.4 3.1 2.6 2.3 1.1 1.6 2.7 3.3 3.3 3.1 Lesotho
-4.3 -11.7 -8.4 -0.4 2.6 27.7 11.3 1.7 1.8 -29.9 19.1 Libéria
-1.9 -1.5 -1.3 -1.0 -0.8 0.9 -0.2 3.0 -15.1 6.6 3.1 Madagascar
-2.3 -0.6 -0.4 1.2 0.5 1.7 0.0 -6.4 -0.5 2.1 2.7 Malawi
0.0 1.1 1.3 1.9 2.0 1.8 2.0 8.9 1.2 2.8 1.4 Mali
-0.8 0.7 0.9 2.0 1.8 1.6 1.4 1.3 0.3 1.8 1.5 Mauritanie
5.3 4.7 4.6 4.0 3.9 4.5 4.0 4.2 0.7 3.2 3.5 Maurice
-2.5 0.1 1.3 2.6 4.1 6.1 6.2 10.7 6.5 5.8 6.3 Mozambique
-1.3 0.0 0.2 1.0 1.0 1.0 1.0 -1.2 0.9 2.4 2.3 Namibie
-3.2 -1.7 -1.4 -0.8 -0.5 -0.3 -0.1 3.5 -0.5 1.8 -2.4 Niger
-1.4 0.6 0.7 0.2 0.8 0.8 1.5 0.7 -0.7 8.3 1.7 Nigéria
-1.6 -1.5 -1.0 -1.0 0.0 1.4 1.4 2.1 6.4 -0.9 2.4 Rwanda
-3.3 -1.6 -1.0 0.0 0.5 0.2 1.1 1.8 1.8 2.1 4.0 Sao Tomé-et-Principe
0.2 0.0 0.4 0.9 1.5 2.8 2.4 3.1 -1.3 3.8 3.6 Sénégal
2.6 3.9 3.3 3.9 2.4 6.4 1.6 -2.6 -0.6 -6.2 -2.9 Seychelles
-1.0 -3.8 -3.5 -5.3 -3.7 -6.7 -2.7 1.5 1.7 1.8 2.5 Sierra Leone
1.2 -1.8 -1.7 -3.7 -2.3 -0.7 -0.4 -0.1 0.3 0.2 -1.2 Somalie
-1.0 -0.9 -0.4 -0.1 0.7 0.8 1.5 1.6 2.6 2.0 3.1 Afrique du Sud
3.8 2.9 2.7 1.6 1.7 1.9 1.9 1.1 3.2 2.0 1.5 Swaziland
-1.8 -1.3 -1.2 -0.8 -1.0 -2.0 -1.6 -2.8 1.4 -0.7 1.2 Togo
-0.4 2.2 2.5 4.1 3.6 3.6 2.9 3.0 1.3 2.7 2.2 Ouganda
-0.9 1.1 1.7 2.9 3.4 5.1 4.5 4.1 5.1 5.0 4.3 République-Unie de Tanzanie
-1.8 -2.6 -2.0 -2.4 -1.0 -0.1 0.9 2.9 1.5 2.6 1.8 Zambie
-0.5 0.0 -0.8 -0.3 -2.1 -1.5 -4.2 -3.5 -5.0 -10.9 -5.6 Zimbabwe
3.4 4.2 4.2 4.5 4.3 3.3 3.7 2.4 4.5 5.1 5.8 ECONOMIES EN DEVELOPPEMENT : ASIE
-1.9 0.2 0.5 1.6 1.4 1.7 1.3 -2.5 2.2 2.6 4.5 Asie occidentale
-4.1 -0.2 0.4 1.5 2.0 1.4 2.5 2.7 3.5 5.3 4.1 Bahreïn
-2.3 0.5 1.1 1.9 2.6 2.7 3.5 2.8 6.4 6.1 5.6 Iran, République islamique d'
-1.4 -4.0 -3.2 3.7 1.6 14.1 1.6 1.1 -8.3 -45.8 42.6 Iraq
-0.4 -1.3 -0.8 0.4 0.7 0.2 0.9 2.0 1.9 0.4 2.7 Jordanie
-3.8 1.2 1.0 7.8 3.4 -4.3 -3.1 -4.1 -4.5 5.9 3.9 Koweït
1.5 -1.0 -0.5 3.7 2.5 1.1 1.0 0.3 1.0 2.0 3.9 Liban
3.4 2.1 2.0 1.5 1.8 0.9 1.9 6.2 1.4 1.1 1.5 Oman
_ _ _ _ _ 0.5 -6.5 -18.8 -21.7 -4.7 .. Territoire palestinien 5
-6.0 -0.8 0.1 3.9 3.2 6.9 3.1 0.3 0.5 -3.3 3.2 Qatar
-7.4 -2.2 -1.7 -0.5 -0.5 -0.5 -0.4 -2.2 -2.6 4.6 0.9 Arabie saoudite
-2.7 0.4 0.6 3.5 2.2 0.8 0.3 1.2 1.7 0.1 1.1 République arabe syrienne
3.0 2.5 2.2 2.0 1.5 1.6 1.1 -8.9 6.4 4.3 7.5 Turquie
-8.6 -3.2 -2.6 -1.1 -1.2 0.0 -1.2 -3.6 -5.4 -0.3 -3.7 Emirats arabes unis
_ _ _ 1.7 1.6 2.6 1.7 1.5 0.7 1.0 -0.1 Yémen 6
5.1 5.3 5.1 5.2 4.9 3.5 4.2 3.5 4.9 5.5 6.0 Autres économies : Asie
0.2 -6.4 -7.0 -8.6 -8.4 -8.4 -8.0 -13.0 22.7 10.1 2.4 Afghanistan
1.5 2.0 2.3 2.7 2.9 3.2 3.3 2.4 3.2 5.4 2.1 Bangladesh
5.0 4.4 4.4 4.5 4.5 4.2 4.3 4.6 4.3 4.3 5.0 Bhoutan
-3.8 -2.1 -1.7 -1.3 -0.9 -1.5 -0.5 0.6 0.8 0.8 -1.1 Brunéi Darussalam
Pour les sources et les notes, se reporter à la fin du tableau.
Régions,groupements économiques,
pays ou zones
7.2 Taux d'évolution annuels moyens du produit intérieur brut réel total et par habitant (suite)
En pourcentage
329
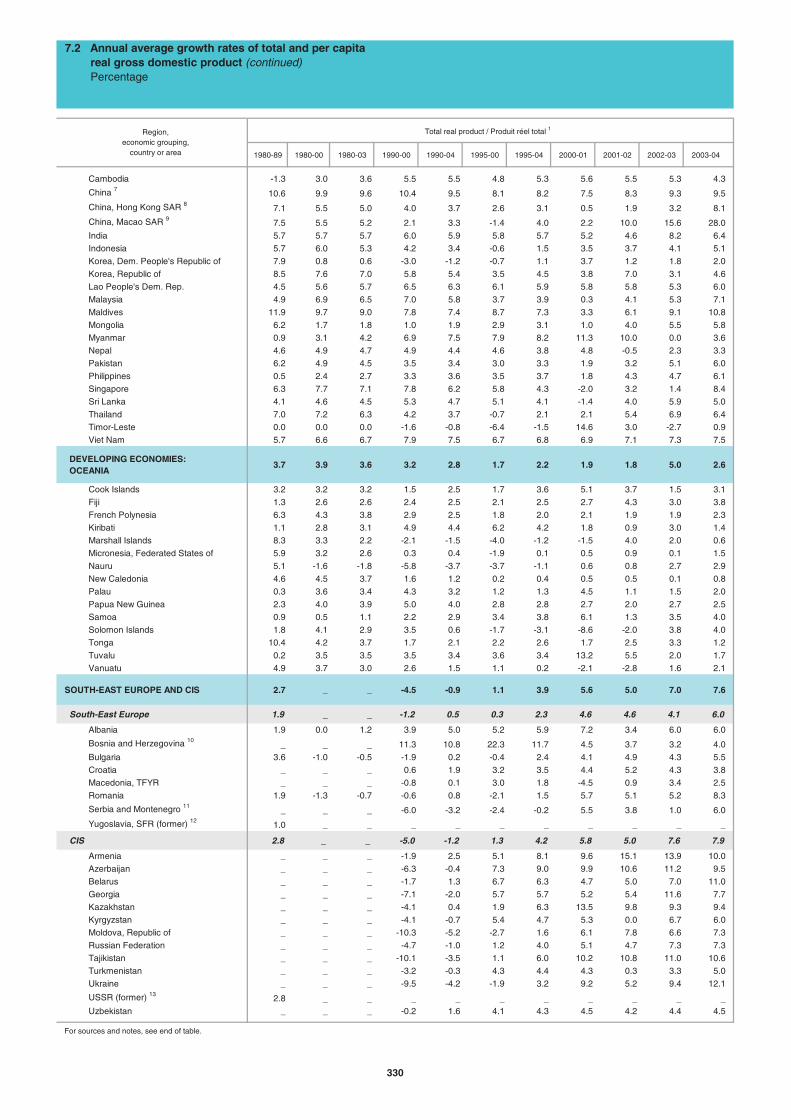
Total real product / Produit réel total 1
1980-89 1980-00 1980-03 1990-00 1990-04 1995-00 1995-04 2000-01 2001-02 2002-03 2003-04
Cambodia -1.3 3.0 3.6 5.5 5.5 4.8 5.3 5.6 5.5 5.3 4.3
China 7 10.6 9.9 9.6 10.4 9.5 8.1 8.2 7.5 8.3 9.3 9.5
China, Hong Kong SAR 8 7.1 5.5 5.0 4.0 3.7 2.6 3.1 0.5 1.9 3.2 8.1
China, Macao SAR 9 7.5 5.5 5.2 2.1 3.3 -1.4 4.0 2.2 10.0 15.6 28.0
India 5.7 5.7 5.7 6.0 5.9 5.8 5.7 5.2 4.6 8.2 6.4
Indonesia 5.7 6.0 5.3 4.2 3.4 -0.6 1.5 3.5 3.7 4.1 5.1
Korea, Dem. People's Republic of 7.9 0.8 0.6 -3.0 -1.2 -0.7 1.1 3.7 1.2 1.8 2.0
Korea, Republic of 8.5 7.6 7.0 5.8 5.4 3.5 4.5 3.8 7.0 3.1 4.6
Lao People's Dem. Rep. 4.5 5.6 5.7 6.5 6.3 6.1 5.9 5.8 5.8 5.3 6.0
Malaysia 4.9 6.9 6.5 7.0 5.8 3.7 3.9 0.3 4.1 5.3 7.1
Maldives 11.9 9.7 9.0 7.8 7.4 8.7 7.3 3.3 6.1 9.1 10.8
Mongolia 6.2 1.7 1.8 1.0 1.9 2.9 3.1 1.0 4.0 5.5 5.8
Myanmar 0.9 3.1 4.2 6.9 7.5 7.9 8.2 11.3 10.0 0.0 3.6
Nepal 4.6 4.9 4.7 4.9 4.4 4.6 3.8 4.8 -0.5 2.3 3.3
Pakistan 6.2 4.9 4.5 3.5 3.4 3.0 3.3 1.9 3.2 5.1 6.0
Philippines 0.5 2.4 2.7 3.3 3.6 3.5 3.7 1.8 4.3 4.7 6.1
Singapore 6.3 7.7 7.1 7.8 6.2 5.8 4.3 -2.0 3.2 1.4 8.4
Sri Lanka 4.1 4.6 4.5 5.3 4.7 5.1 4.1 -1.4 4.0 5.9 5.0
Thailand 7.0 7.2 6.3 4.2 3.7 -0.7 2.1 2.1 5.4 6.9 6.4
Timor-Leste 0.0 0.0 0.0 -1.6 -0.8 -6.4 -1.5 14.6 3.0 -2.7 0.9
Viet Nam 5.7 6.6 6.7 7.9 7.5 6.7 6.8 6.9 7.1 7.3 7.5
DEVELOPING ECONOMIES: OCEANIA
3.7 3.9 3.6 3.2 2.8 1.7 2.2 1.9 1.8 5.0 2.6
Cook Islands 3.2 3.2 3.2 1.5 2.5 1.7 3.6 5.1 3.7 1.5 3.1
Fiji 1.3 2.6 2.6 2.4 2.5 2.1 2.5 2.7 4.3 3.0 3.8
French Polynesia 6.3 4.3 3.8 2.9 2.5 1.8 2.0 2.1 1.9 1.9 2.3
Kiribati 1.1 2.8 3.1 4.9 4.4 6.2 4.2 1.8 0.9 3.0 1.4
Marshall Islands 8.3 3.3 2.2 -2.1 -1.5 -4.0 -1.2 -1.5 4.0 2.0 0.6
Micronesia, Federated States of 5.9 3.2 2.6 0.3 0.4 -1.9 0.1 0.5 0.9 0.1 1.5
Nauru 5.1 -1.6 -1.8 -5.8 -3.7 -3.7 -1.1 0.6 0.8 2.7 2.9
New Caledonia 4.6 4.5 3.7 1.6 1.2 0.2 0.4 0.5 0.5 0.1 0.8
Palau 0.3 3.6 3.4 4.3 3.2 1.2 1.3 4.5 1.1 1.5 2.0
Papua New Guinea 2.3 4.0 3.9 5.0 4.0 2.8 2.8 2.7 2.0 2.7 2.5
Samoa 0.9 0.5 1.1 2.2 2.9 3.4 3.8 6.1 1.3 3.5 4.0
Solomon Islands 1.8 4.1 2.9 3.5 0.6 -1.7 -3.1 -8.6 -2.0 3.8 4.0
Tonga 10.4 4.2 3.7 1.7 2.1 2.2 2.6 1.7 2.5 3.3 1.2
Tuvalu 0.2 3.5 3.5 3.5 3.4 3.6 3.4 13.2 5.5 2.0 1.7
Vanuatu 4.9 3.7 3.0 2.6 1.5 1.1 0.2 -2.1 -2.8 1.6 2.1
SOUTH-EAST EUROPE AND CIS 2.7 _ _ -4.5 -0.9 1.1 3.9 5.6 5.0 7.0 7.6
South-East Europe 1.9 _ _ -1.2 0.5 0.3 2.3 4.6 4.6 4.1 6.0
Albania 1.9 0.0 1.2 3.9 5.0 5.2 5.9 7.2 3.4 6.0 6.0
Bosnia and Herzegovina 10_ _ _ 11.3 10.8 22.3 11.7 4.5 3.7 3.2 4.0
Bulgaria 3.6 -1.0 -0.5 -1.9 0.2 -0.4 2.4 4.1 4.9 4.3 5.5
Croatia _ _ _ 0.6 1.9 3.2 3.5 4.4 5.2 4.3 3.8
Macedonia, TFYR _ _ _ -0.8 0.1 3.0 1.8 -4.5 0.9 3.4 2.5
Romania 1.9 -1.3 -0.7 -0.6 0.8 -2.1 1.5 5.7 5.1 5.2 8.3
Serbia and Montenegro 11_ _ _ -6.0 -3.2 -2.4 -0.2 5.5 3.8 1.0 6.0
Yugoslavia, SFR (former) 121.0 _ _ _ _ _ _ _ _ _ _
CIS 2.8 _ _ -5.0 -1.2 1.3 4.2 5.8 5.0 7.6 7.9
Armenia _ _ _ -1.9 2.5 5.1 8.1 9.6 15.1 13.9 10.0
Azerbaijan _ _ _ -6.3 -0.4 7.3 9.0 9.9 10.6 11.2 9.5
Belarus _ _ _ -1.7 1.3 6.7 6.3 4.7 5.0 7.0 11.0
Georgia _ _ _ -7.1 -2.0 5.7 5.7 5.2 5.4 11.6 7.7
Kazakhstan _ _ _ -4.1 0.4 1.9 6.3 13.5 9.8 9.3 9.4
Kyrgyzstan _ _ _ -4.1 -0.7 5.4 4.7 5.3 0.0 6.7 6.0
Moldova, Republic of _ _ _ -10.3 -5.2 -2.7 1.6 6.1 7.8 6.6 7.3
Russian Federation _ _ _ -4.7 -1.0 1.2 4.0 5.1 4.7 7.3 7.3
Tajikistan _ _ _ -10.1 -3.5 1.1 6.0 10.2 10.8 11.0 10.6
Turkmenistan _ _ _ -3.2 -0.3 4.3 4.4 4.3 0.3 3.3 5.0
Ukraine _ _ _ -9.5 -4.2 -1.9 3.2 9.2 5.2 9.4 12.1
USSR (former) 132.8 _ _ _ _ _ _ _ _ _ _
Uzbekistan _ _ _ -0.2 1.6 4.1 4.3 4.5 4.2 4.4 4.5
For sources and notes, see end of table.
Region,economic grouping,
country or area
7.2 Annual average growth rates of total and per capita real gross domestic product (continued)
Percentage
330
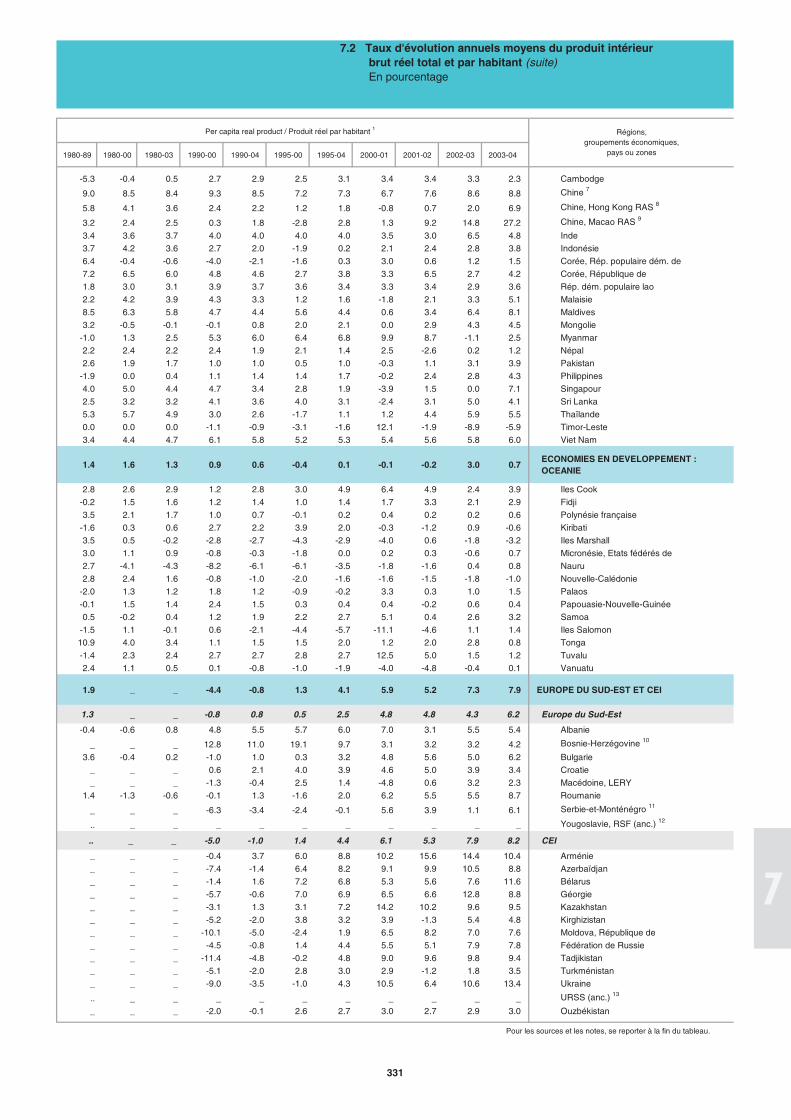
Per capita real product / Produit réel par habitant 1
1980-89 1980-00 1980-03 1990-00 1990-04 1995-00 1995-04 2000-01 2001-02 2002-03 2003-04
-5.3 -0.4 0.5 2.7 2.9 2.5 3.1 3.4 3.4 3.3 2.3 Cambodge
9.0 8.5 8.4 9.3 8.5 7.2 7.3 6.7 7.6 8.6 8.8 Chine 7
5.8 4.1 3.6 2.4 2.2 1.2 1.8 -0.8 0.7 2.0 6.9 Chine, Hong Kong RAS 8
3.2 2.4 2.5 0.3 1.8 -2.8 2.8 1.3 9.2 14.8 27.2 Chine, Macao RAS 9
3.4 3.6 3.7 4.0 4.0 4.0 4.0 3.5 3.0 6.5 4.8 Inde
3.7 4.2 3.6 2.7 2.0 -1.9 0.2 2.1 2.4 2.8 3.8 Indonésie
6.4 -0.4 -0.6 -4.0 -2.1 -1.6 0.3 3.0 0.6 1.2 1.5 Corée, Rép. populaire dém. de
7.2 6.5 6.0 4.8 4.6 2.7 3.8 3.3 6.5 2.7 4.2 Corée, République de
1.8 3.0 3.1 3.9 3.7 3.6 3.4 3.3 3.4 2.9 3.6 Rép. dém. populaire lao
2.2 4.2 3.9 4.3 3.3 1.2 1.6 -1.8 2.1 3.3 5.1 Malaisie
8.5 6.3 5.8 4.7 4.4 5.6 4.4 0.6 3.4 6.4 8.1 Maldives
3.2 -0.5 -0.1 -0.1 0.8 2.0 2.1 0.0 2.9 4.3 4.5 Mongolie
-1.0 1.3 2.5 5.3 6.0 6.4 6.8 9.9 8.7 -1.1 2.5 Myanmar
2.2 2.4 2.2 2.4 1.9 2.1 1.4 2.5 -2.6 0.2 1.2 Népal
2.6 1.9 1.7 1.0 1.0 0.5 1.0 -0.3 1.1 3.1 3.9 Pakistan
-1.9 0.0 0.4 1.1 1.4 1.4 1.7 -0.2 2.4 2.8 4.3 Philippines
4.0 5.0 4.4 4.7 3.4 2.8 1.9 -3.9 1.5 0.0 7.1 Singapour
2.5 3.2 3.2 4.1 3.6 4.0 3.1 -2.4 3.1 5.0 4.1 Sri Lanka
5.3 5.7 4.9 3.0 2.6 -1.7 1.1 1.2 4.4 5.9 5.5 Thaïlande
0.0 0.0 0.0 -1.1 -0.9 -3.1 -1.6 12.1 -1.9 -8.9 -5.9 Timor-Leste
3.4 4.4 4.7 6.1 5.8 5.2 5.3 5.4 5.6 5.8 6.0 Viet Nam
1.4 1.6 1.3 0.9 0.6 -0.4 0.1 -0.1 -0.2 3.0 0.7 ECONOMIES EN DEVELOPPEMENT : OCEANIE
2.8 2.6 2.9 1.2 2.8 3.0 4.9 6.4 4.9 2.4 3.9 Iles Cook
-0.2 1.5 1.6 1.2 1.4 1.0 1.4 1.7 3.3 2.1 2.9 Fidji
3.5 2.1 1.7 1.0 0.7 -0.1 0.2 0.4 0.2 0.2 0.6 Polynésie française
-1.6 0.3 0.6 2.7 2.2 3.9 2.0 -0.3 -1.2 0.9 -0.6 Kiribati
3.5 0.5 -0.2 -2.8 -2.7 -4.3 -2.9 -4.0 0.6 -1.8 -3.2 Iles Marshall
3.0 1.1 0.9 -0.8 -0.3 -1.8 0.0 0.2 0.3 -0.6 0.7 Micronésie, Etats fédérés de
2.7 -4.1 -4.3 -8.2 -6.1 -6.1 -3.5 -1.8 -1.6 0.4 0.8 Nauru
2.8 2.4 1.6 -0.8 -1.0 -2.0 -1.6 -1.6 -1.5 -1.8 -1.0 Nouvelle-Calédonie
-2.0 1.3 1.2 1.8 1.2 -0.9 -0.2 3.3 0.3 1.0 1.5 Palaos
-0.1 1.5 1.4 2.4 1.5 0.3 0.4 0.4 -0.2 0.6 0.4 Papouasie-Nouvelle-Guinée
0.5 -0.2 0.4 1.2 1.9 2.2 2.7 5.1 0.4 2.6 3.2 Samoa
-1.5 1.1 -0.1 0.6 -2.1 -4.4 -5.7 -11.1 -4.6 1.1 1.4 Iles Salomon
10.9 4.0 3.4 1.1 1.5 1.5 2.0 1.2 2.0 2.8 0.8 Tonga
-1.4 2.3 2.4 2.7 2.7 2.8 2.7 12.5 5.0 1.5 1.2 Tuvalu
2.4 1.1 0.5 0.1 -0.8 -1.0 -1.9 -4.0 -4.8 -0.4 0.1 Vanuatu
1.9 _ _ -4.4 -0.8 1.3 4.1 5.9 5.2 7.3 7.9 EUROPE DU SUD-EST ET CEI
1.3 _ _ -0.8 0.8 0.5 2.5 4.8 4.8 4.3 6.2 Europe du Sud-Est
-0.4 -0.6 0.8 4.8 5.5 5.7 6.0 7.0 3.1 5.5 5.4 Albanie
_ _ _ 12.8 11.0 19.1 9.7 3.1 3.2 3.2 4.2 Bosnie-Herzégovine 10
3.6 -0.4 0.2 -1.0 1.0 0.3 3.2 4.8 5.6 5.0 6.2 Bulgarie
_ _ _ 0.6 2.1 4.0 3.9 4.6 5.0 3.9 3.4 Croatie
_ _ _ -1.3 -0.4 2.5 1.4 -4.8 0.6 3.2 2.3 Macédoine, LERY
1.4 -1.3 -0.6 -0.1 1.3 -1.6 2.0 6.2 5.5 5.5 8.7 Roumanie
_ _ _ -6.3 -3.4 -2.4 -0.1 5.6 3.9 1.1 6.1 Serbie-et-Monténégro 11
.. _ _ _ _ _ _ _ _ _ _ Yougoslavie, RSF (anc.) 12
.. _ _ -5.0 -1.0 1.4 4.4 6.1 5.3 7.9 8.2 CEI
_ _ _ -0.4 3.7 6.0 8.8 10.2 15.6 14.4 10.4 Arménie
_ _ _ -7.4 -1.4 6.4 8.2 9.1 9.9 10.5 8.8 Azerbaïdjan
_ _ _ -1.4 1.6 7.2 6.8 5.3 5.6 7.6 11.6 Bélarus
_ _ _ -5.7 -0.6 7.0 6.9 6.5 6.6 12.8 8.8 Géorgie
_ _ _ -3.1 1.3 3.1 7.2 14.2 10.2 9.6 9.5 Kazakhstan
_ _ _ -5.2 -2.0 3.8 3.2 3.9 -1.3 5.4 4.8 Kirghizistan
_ _ _ -10.1 -5.0 -2.4 1.9 6.5 8.2 7.0 7.6 Moldova, République de
_ _ _ -4.5 -0.8 1.4 4.4 5.5 5.1 7.9 7.8 Fédération de Russie
_ _ _ -11.4 -4.8 -0.2 4.8 9.0 9.6 9.8 9.4 Tadjikistan
_ _ _ -5.1 -2.0 2.8 3.0 2.9 -1.2 1.8 3.5 Turkménistan
_ _ _ -9.0 -3.5 -1.0 4.3 10.5 6.4 10.6 13.4 Ukraine
.. _ _ _ _ _ _ _ _ _ _ URSS (anc.) 13
_ _ _ -2.0 -0.1 2.6 2.7 3.0 2.7 2.9 3.0 Ouzbékistan
Pour les sources et les notes, se reporter à la fin du tableau.
7.2 Taux d'évolution annuels moyens du produit intérieur brut réel total et par habitant (suite)
En pourcentage
Régions,groupements économiques,
pays ou zones
331
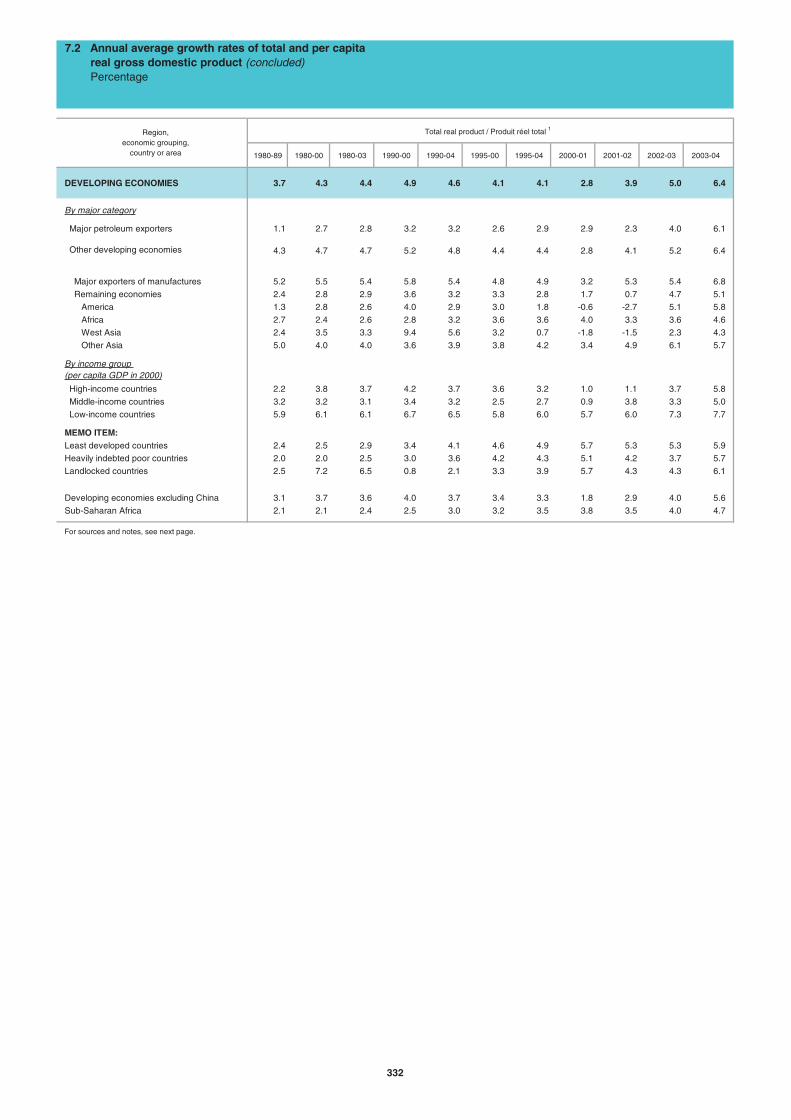
Total real product / Produit réel total 1
1980-89 1980-00 1980-03 1990-00 1990-04 1995-00 1995-04 2000-01 2001-02 2002-03 2003-04
DEVELOPING ECONOMIES 3.7 4.3 4.4 4.9 4.6 4.1 4.1 2.8 3.9 5.0 6.4
By major category
Major petroleum exporters 1.1 2.7 2.8 3.2 3.2 2.6 2.9 2.9 2.3 4.0 6.1
Other developing economies 4.3 4.7 4.7 5.2 4.8 4.4 4.4 2.8 4.1 5.2 6.4
Major exporters of manufactures 5.2 5.5 5.4 5.8 5.4 4.8 4.9 3.2 5.3 5.4 6.8
Remaining economies 2.4 2.8 2.9 3.6 3.2 3.3 2.8 1.7 0.7 4.7 5.1
America 1.3 2.8 2.6 4.0 2.9 3.0 1.8 -0.6 -2.7 5.1 5.8
Africa 2.7 2.4 2.6 2.8 3.2 3.6 3.6 4.0 3.3 3.6 4.6
West Asia 2.4 3.5 3.3 9.4 5.6 3.2 0.7 -1.8 -1.5 2.3 4.3
Other Asia 5.0 4.0 4.0 3.6 3.9 3.8 4.2 3.4 4.9 6.1 5.7
By income group (per capita GDP in 2000)
High-income countries 2.2 3.8 3.7 4.2 3.7 3.6 3.2 1.0 1.1 3.7 5.8
Middle-income countries 3.2 3.2 3.1 3.4 3.2 2.5 2.7 0.9 3.8 3.3 5.0
Low-income countries 5.9 6.1 6.1 6.7 6.5 5.8 6.0 5.7 6.0 7.3 7.7
MEMO ITEM:Least developed countries 2.4 2.5 2.9 3.4 4.1 4.6 4.9 5.7 5.3 5.3 5.9
Heavily indebted poor countries 2.0 2.0 2.5 3.0 3.6 4.2 4.3 5.1 4.2 3.7 5.7
Landlocked countries 2.5 7.2 6.5 0.8 2.1 3.3 3.9 5.7 4.3 4.3 6.1
Developing economies excluding China 3.1 3.7 3.6 4.0 3.7 3.4 3.3 1.8 2.9 4.0 5.6
Sub-Saharan Africa 2.1 2.1 2.4 2.5 3.0 3.2 3.5 3.8 3.5 4.0 4.7
For sources and notes, see next page.
7.2 Annual average growth rates of total and per capita real gross domestic product (concluded)
Percentage
Region,economic grouping,
country or area
332
Per capita real product / Produit réel par habitant 1
1980-89 1980-00 1980-03 1990-00 1990-04 1995-00 1995-04 2000-01 2001-02 2002-03 2003-04
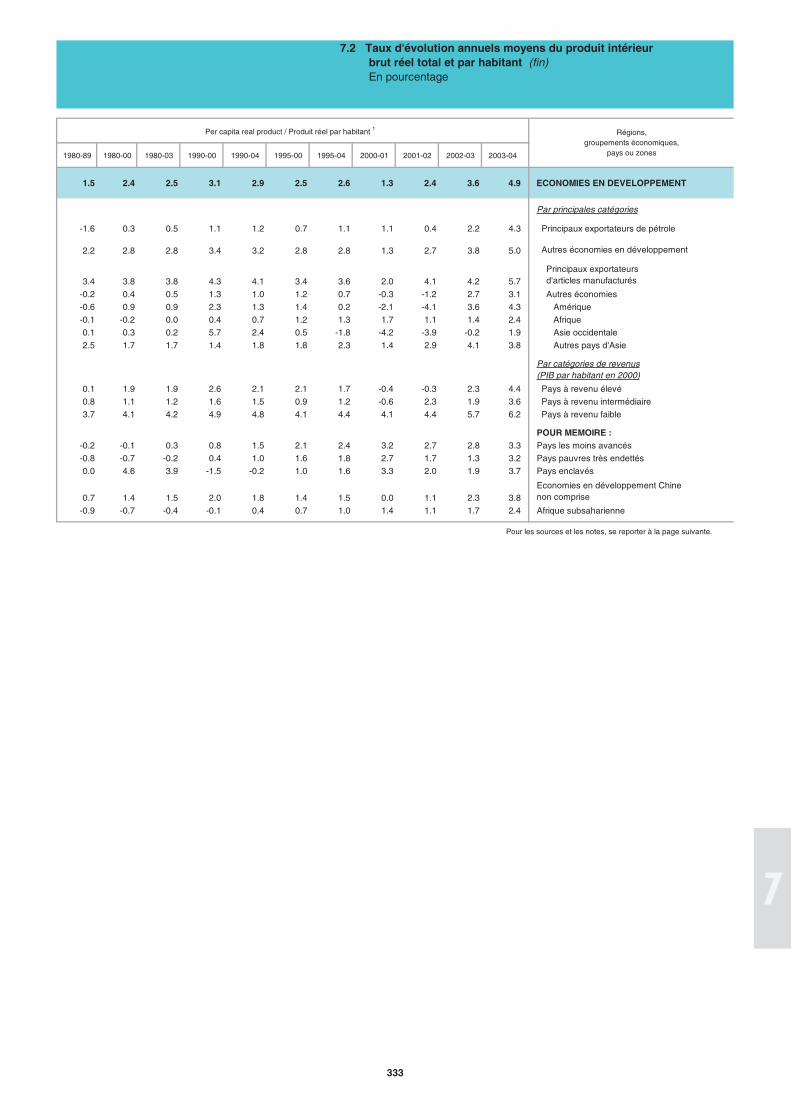
1.5 2.4 2.5 3.1 2.9 2.5 2.6 1.3 2.4 3.6 4.9 ECONOMIES EN DEVELOPPEMENT
Par principales catégories
-1.6 0.3 0.5 1.1 1.2 0.7 1.1 1.1 0.4 2.2 4.3 Principaux exportateurs de pétrole
2.2 2.8 2.8 3.4 3.2 2.8 2.8 1.3 2.7 3.8 5.0 Autres économies en développement
3.4 3.8 3.8 4.3 4.1 3.4 3.6 2.0 4.1 4.2 5.7 Principaux exportateurs d'articles manufacturés
-0.2 0.4 0.5 1.3 1.0 1.2 0.7 -0.3 -1.2 2.7 3.1 Autres économies
-0.6 0.9 0.9 2.3 1.3 1.4 0.2 -2.1 -4.1 3.6 4.3 Amérique
-0.1 -0.2 0.0 0.4 0.7 1.2 1.3 1.7 1.1 1.4 2.4 Afrique
0.1 0.3 0.2 5.7 2.4 0.5 -1.8 -4.2 -3.9 -0.2 1.9 Asie occidentale
2.5 1.7 1.7 1.4 1.8 1.8 2.3 1.4 2.9 4.1 3.8 Autres pays d'Asie
Par catégories de revenus(PIB par habitant en 2000)
0.1 1.9 1.9 2.6 2.1 2.1 1.7 -0.4 -0.3 2.3 4.4 Pays à revenu élevé
0.8 1.1 1.2 1.6 1.5 0.9 1.2 -0.6 2.3 1.9 3.6 Pays à revenu intermédiaire
3.7 4.1 4.2 4.9 4.8 4.1 4.4 4.1 4.4 5.7 6.2 Pays à revenu faible
POUR MEMOIRE :-0.2 -0.1 0.3 0.8 1.5 2.1 2.4 3.2 2.7 2.8 3.3 Pays les moins avancés
-0.8 -0.7 -0.2 0.4 1.0 1.6 1.8 2.7 1.7 1.3 3.2 Pays pauvres très endettés
0.0 4.6 3.9 -1.5 -0.2 1.0 1.6 3.3 2.0 1.9 3.7 Pays enclavés
0.7 1.4 1.5 2.0 1.8 1.4 1.5 0.0 1.1 2.3 3.8Economies en développement Chine non comprise
-0.9 -0.7 -0.4 -0.1 0.4 0.7 1.0 1.4 1.1 1.7 2.4 Afrique subsaharienne
Pour les sources et les notes, se reporter à la page suivante.
7.2 Taux d'évolution annuels moyens du produit intérieur brut réel total et par habitant (fin)
En pourcentage
Régions,groupements économiques,
pays ou zones
333
Exports
Expor-tations
Less imports
Moins les impor-tations
Government
Administrationpublique
Household
MénagesTotal
Manu-facturing
Activitésde
fabrication
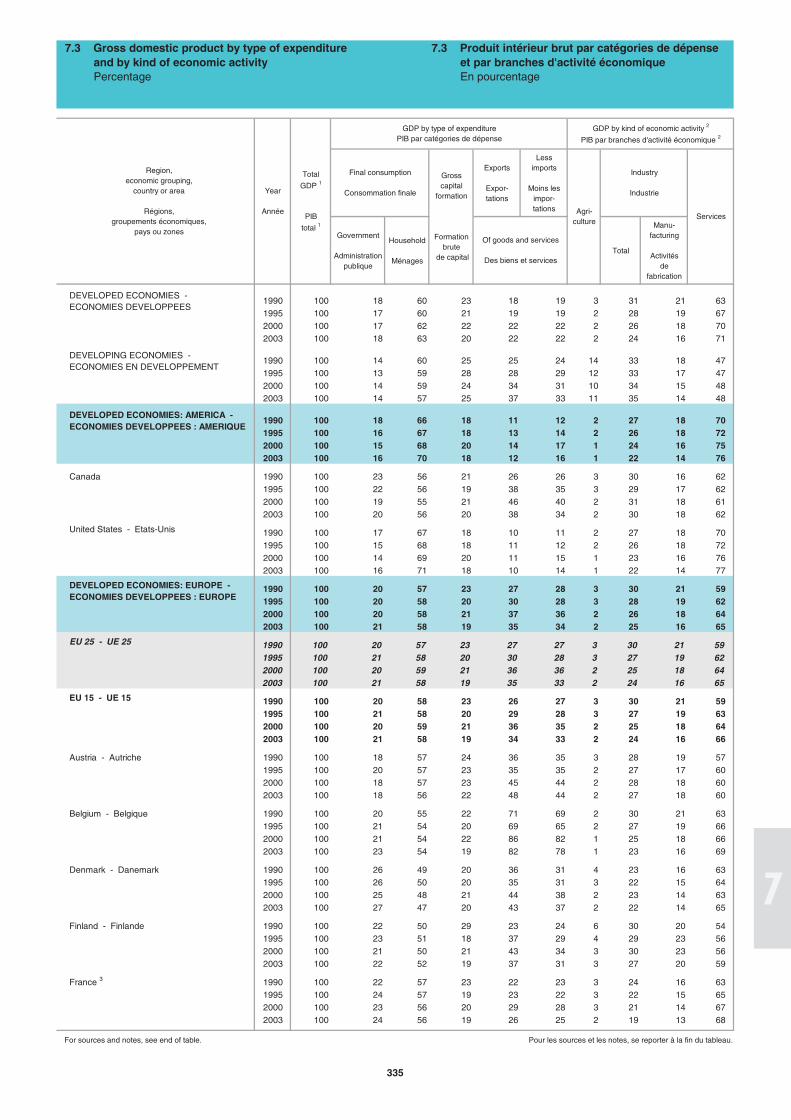
1990 100 18 60 23 18 19 3 31 21 631995 100 17 60 21 19 19 2 28 19 672000 100 17 62 22 22 22 2 26 18 702003 100 18 63 20 22 22 2 24 16 71
1990 100 14 60 25 25 24 14 33 18 471995 100 13 59 28 28 29 12 33 17 472000 100 14 59 24 34 31 10 34 15 482003 100 14 57 25 37 33 11 35 14 48
1990 100 18 66 18 11 12 2 27 18 701995 100 16 67 18 13 14 2 26 18 722000 100 15 68 20 14 17 1 24 16 752003 100 16 70 18 12 16 1 22 14 76
Canada 1990 100 23 56 21 26 26 3 30 16 621995 100 22 56 19 38 35 3 29 17 622000 100 19 55 21 46 40 2 31 18 612003 100 20 56 20 38 34 2 30 18 62
United States - Etats-Unis 1990 100 17 67 18 10 11 2 27 18 701995 100 15 68 18 11 12 2 26 18 722000 100 14 69 20 11 15 1 23 16 762003 100 16 71 18 10 14 1 22 14 77
1990 100 20 57 23 27 28 3 30 21 591995 100 20 58 20 30 28 3 28 19 622000 100 20 58 21 37 36 2 26 18 642003 100 21 58 19 35 34 2 25 16 65
EU 25 - UE 25 1990 100 20 57 23 27 27 3 30 21 591995 100 21 58 20 30 28 3 27 19 622000 100 20 59 21 36 36 2 25 18 642003 100 21 58 19 35 33 2 24 16 65
EU 15 - UE 15 1990 100 20 58 23 26 27 3 30 21 591995 100 21 58 20 29 28 3 27 19 632000 100 20 59 21 36 35 2 25 18 642003 100 21 58 19 34 33 2 24 16 66
Austria - Autriche 1990 100 18 57 24 36 35 3 28 19 571995 100 20 57 23 35 35 2 27 17 602000 100 18 57 23 45 44 2 28 18 602003 100 18 56 22 48 44 2 27 18 60
Belgium - Belgique 1990 100 20 55 22 71 69 2 30 21 631995 100 21 54 20 69 65 2 27 19 662000 100 21 54 22 86 82 1 25 18 662003 100 23 54 19 82 78 1 23 16 69
Denmark - Danemark 1990 100 26 49 20 36 31 4 23 16 631995 100 26 50 20 35 31 3 22 15 642000 100 25 48 21 44 38 2 23 14 632003 100 27 47 20 43 37 2 22 14 65
Finland - Finlande 1990 100 22 50 29 23 24 6 30 20 541995 100 23 51 18 37 29 4 29 23 562000 100 21 50 21 43 34 3 30 23 562003 100 22 52 19 37 31 3 27 20 59
France 3 1990 100 22 57 23 22 23 3 24 16 631995 100 24 57 19 23 22 3 22 15 652000 100 23 56 20 29 28 3 21 14 672003 100 24 56 19 26 25 2 19 13 68
For sources and notes, see end of table. Pour les sources et les notes, se reporter à la fin du tableau.
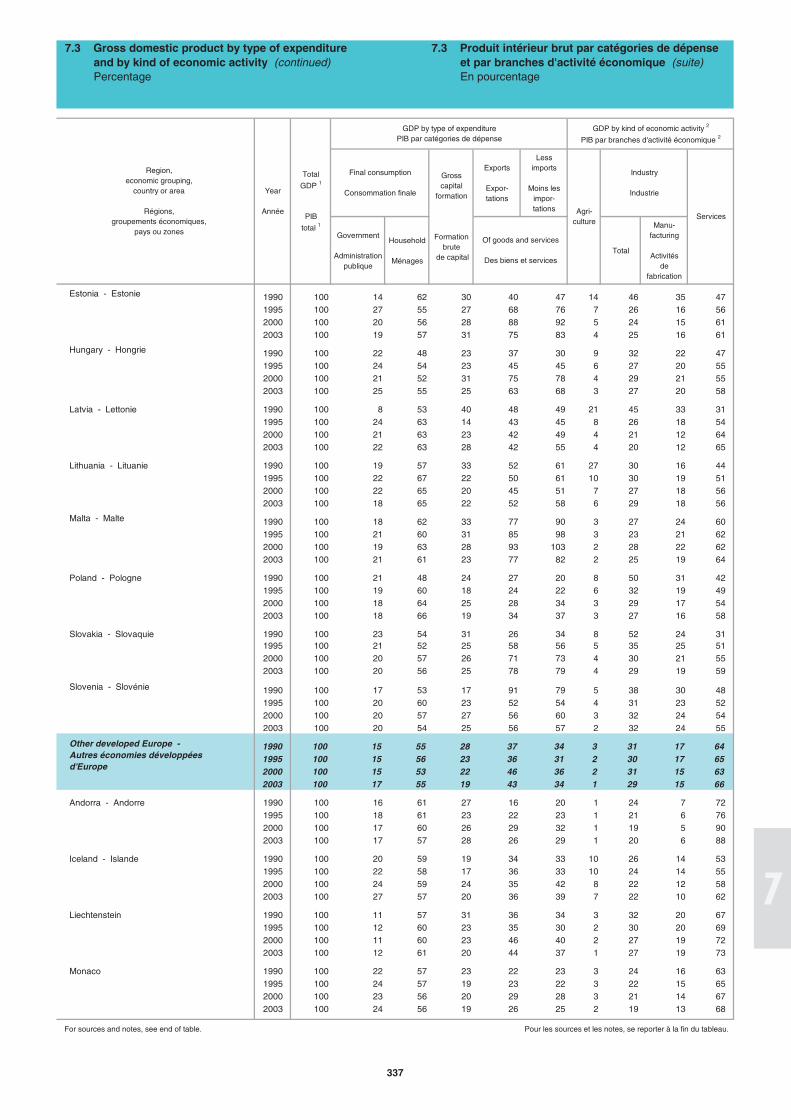
7.3 Gross domestic product by type of expenditure and by kind of economic activity Percentage
7.3 Produit intérieur brut par catégories de dépense et par branches d'activité économique En pourcentage
Region,economic grouping,
country or area
Régions,groupements économiques,
pays ou zones
Final consumption
Consommation finale
Gross capital
formation
Formation brute
de capital
GDP by type of expenditurePIB par catégories de dépense
DEVELOPING ECONOMIES - ECONOMIES EN DEVELOPPEMENT
DEVELOPED ECONOMIES - ECONOMIES DEVELOPPEES
DEVELOPED ECONOMIES: EUROPE - ECONOMIES DEVELOPPEES : EUROPE
Year
Année
Total
GDP 1
PIB
total 1
Of goods and services
Des biens et services
Agri-culture
GDP by kind of economic activity 2
PIB par branches d'activité économique 2
Industry
Industrie
Services
DEVELOPED ECONOMIES: AMERICA - ECONOMIES DEVELOPPEES : AMERIQUE
335
Exports
Expor-tations
Less imports
Moins les impor-tations
Government
Administrationpublique
Household
MénagesTotal
Manu-facturing
Activitésde
fabrication
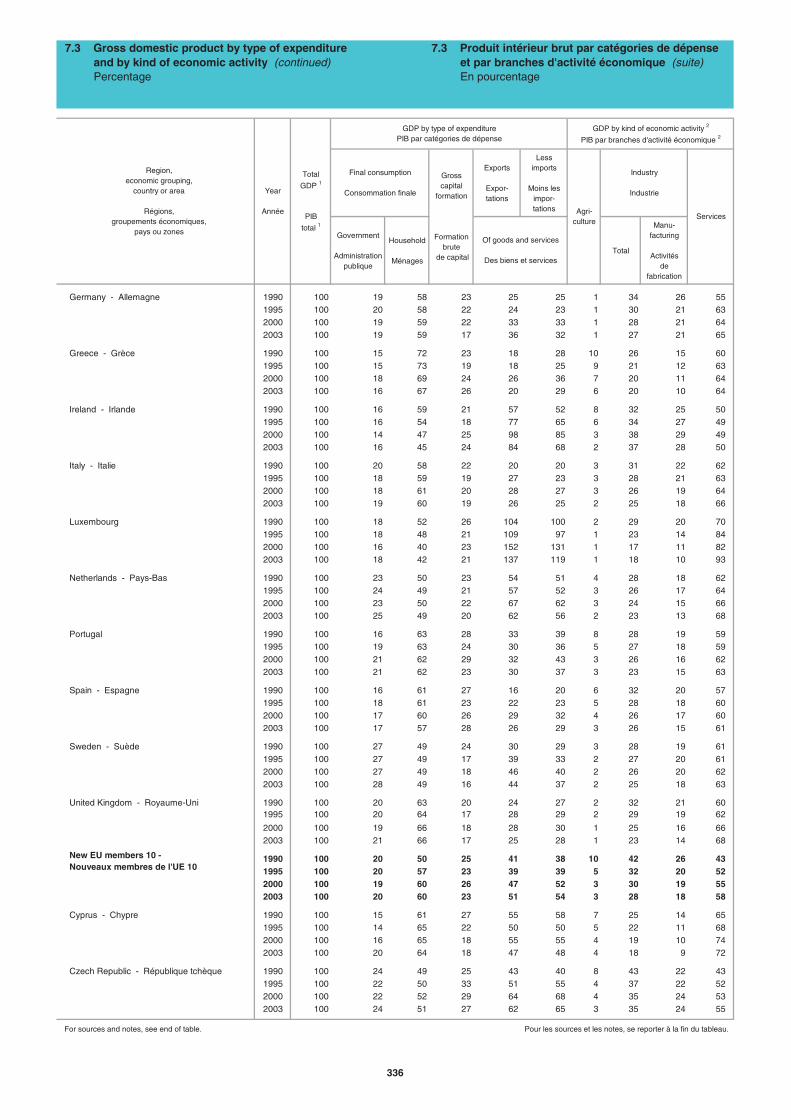
Germany - Allemagne 1990 100 19 58 23 25 25 1 34 26 551995 100 20 58 22 24 23 1 30 21 632000 100 19 59 22 33 33 1 28 21 642003 100 19 59 17 36 32 1 27 21 65
Greece - Grèce 1990 100 15 72 23 18 28 10 26 15 601995 100 15 73 19 18 25 9 21 12 632000 100 18 69 24 26 36 7 20 11 642003 100 16 67 26 20 29 6 20 10 64
Ireland - Irlande 1990 100 16 59 21 57 52 8 32 25 501995 100 16 54 18 77 65 6 34 27 492000 100 14 47 25 98 85 3 38 29 492003 100 16 45 24 84 68 2 37 28 50
Italy - Italie 1990 100 20 58 22 20 20 3 31 22 621995 100 18 59 19 27 23 3 28 21 632000 100 18 61 20 28 27 3 26 19 642003 100 19 60 19 26 25 2 25 18 66
Luxembourg 1990 100 18 52 26 104 100 2 29 20 701995 100 18 48 21 109 97 1 23 14 842000 100 16 40 23 152 131 1 17 11 822003 100 18 42 21 137 119 1 18 10 93
Netherlands - Pays-Bas 1990 100 23 50 23 54 51 4 28 18 621995 100 24 49 21 57 52 3 26 17 642000 100 23 50 22 67 62 3 24 15 662003 100 25 49 20 62 56 2 23 13 68
Portugal 1990 100 16 63 28 33 39 8 28 19 591995 100 19 63 24 30 36 5 27 18 592000 100 21 62 29 32 43 3 26 16 622003 100 21 62 23 30 37 3 23 15 63
Spain - Espagne 1990 100 16 61 27 16 20 6 32 20 571995 100 18 61 23 22 23 5 28 18 602000 100 17 60 26 29 32 4 26 17 602003 100 17 57 28 26 29 3 26 15 61
Sweden - Suède 1990 100 27 49 24 30 29 3 28 19 611995 100 27 49 17 39 33 2 27 20 612000 100 27 49 18 46 40 2 26 20 622003 100 28 49 16 44 37 2 25 18 63
United Kingdom - Royaume-Uni 1990 100 20 63 20 24 27 2 32 21 601995 100 20 64 17 28 29 2 29 19 62
2000 100 19 66 18 28 30 1 25 16 662003 100 21 66 17 25 28 1 23 14 68
1990 100 20 50 25 41 38 10 42 26 431995 100 20 57 23 39 39 5 32 20 522000 100 19 60 26 47 52 3 30 19 552003 100 20 60 23 51 54 3 28 18 58
Cyprus - Chypre 1990 100 15 61 27 55 58 7 25 14 651995 100 14 65 22 50 50 5 22 11 682000 100 16 65 18 55 55 4 19 10 742003 100 20 64 18 47 48 4 18 9 72
Czech Republic - République tchèque 1990 100 24 49 25 43 40 8 43 22 431995 100 22 50 33 51 55 4 37 22 522000 100 22 52 29 64 68 4 35 24 532003 100 24 51 27 62 65 3 35 24 55
For sources and notes, see end of table. Pour les sources et les notes, se reporter à la fin du tableau.
7.3 Produit intérieur brut par catégories de dépense et par branches d'activité économique (suite) En pourcentage
Total
GDP 1
PIB
total 1
Of goods and services
Des biens et services
Region,economic grouping,
country or area
Régions,groupements économiques,
pays ou zones
Services
GDP by kind of economic activity 2
PIB par branches d'activité économique 2
Year
Année
7.3 Gross domestic product by type of expenditure and by kind of economic activity (continued) Percentage
GDP by type of expenditurePIB par catégories de dépense
Industry
Industrie
Final consumption
Consommation finale
Gross capital
formation
Formation brute
de capital
Agri-culture
New EU members 10 - Nouveaux membres de l'UE 10
336
Exports
Expor-tations
Less imports
Moins les impor-tations
Government
Administrationpublique
Household
MénagesTotal
Manu-facturing
Activitésde
fabrication
Estonia - Estonie 1990 100 14 62 30 40 47 14 46 35 471995 100 27 55 27 68 76 7 26 16 562000 100 20 56 28 88 92 5 24 15 612003 100 19 57 31 75 83 4 25 16 61
Hungary - Hongrie 1990 100 22 48 23 37 30 9 32 22 471995 100 24 54 23 45 45 6 27 20 552000 100 21 52 31 75 78 4 29 21 552003 100 25 55 25 63 68 3 27 20 58
Latvia - Lettonie 1990 100 8 53 40 48 49 21 45 33 311995 100 24 63 14 43 45 8 26 18 542000 100 21 63 23 42 49 4 21 12 642003 100 22 63 28 42 55 4 20 12 65
Lithuania - Lituanie 1990 100 19 57 33 52 61 27 30 16 441995 100 22 67 22 50 61 10 30 19 512000 100 22 65 20 45 51 7 27 18 562003 100 18 65 22 52 58 6 29 18 56
Malta - Malte 1990 100 18 62 33 77 90 3 27 24 601995 100 21 60 31 85 98 3 23 21 622000 100 19 63 28 93 103 2 28 22 622003 100 21 61 23 77 82 2 25 19 64
Poland - Pologne 1990 100 21 48 24 27 20 8 50 31 421995 100 19 60 18 24 22 6 32 19 492000 100 18 64 25 28 34 3 29 17 542003 100 18 66 19 34 37 3 27 16 58
Slovakia - Slovaquie 1990 100 23 54 31 26 34 8 52 24 311995 100 21 52 25 58 56 5 35 25 512000 100 20 57 26 71 73 4 30 21 552003 100 20 56 25 78 79 4 29 19 59
Slovenia - Slovénie 1990 100 17 53 17 91 79 5 38 30 481995 100 20 60 23 52 54 4 31 23 522000 100 20 57 27 56 60 3 32 24 542003 100 20 54 25 56 57 2 32 24 55
1990 100 15 55 28 37 34 3 31 17 641995 100 15 56 23 36 31 2 30 17 652000 100 15 53 22 46 36 2 31 15 632003 100 17 55 19 43 34 1 29 15 66
Andorra - Andorre 1990 100 16 61 27 16 20 1 24 7 721995 100 18 61 23 22 23 1 21 6 762000 100 17 60 26 29 32 1 19 5 902003 100 17 57 28 26 29 1 20 6 88
Iceland - Islande 1990 100 20 59 19 34 33 10 26 14 531995 100 22 58 17 36 33 10 24 14 552000 100 24 59 24 35 42 8 22 12 582003 100 27 57 20 36 39 7 22 10 62
Liechtenstein 1990 100 11 57 31 36 34 3 32 20 671995 100 12 60 23 35 30 2 30 20 692000 100 11 60 23 46 40 2 27 19 722003 100 12 61 20 44 37 1 27 19 73
Monaco 1990 100 22 57 23 22 23 3 24 16 631995 100 24 57 19 23 22 3 22 15 652000 100 23 56 20 29 28 3 21 14 672003 100 24 56 19 26 25 2 19 13 68
For sources and notes, see end of table. Pour les sources et les notes, se reporter à la fin du tableau.
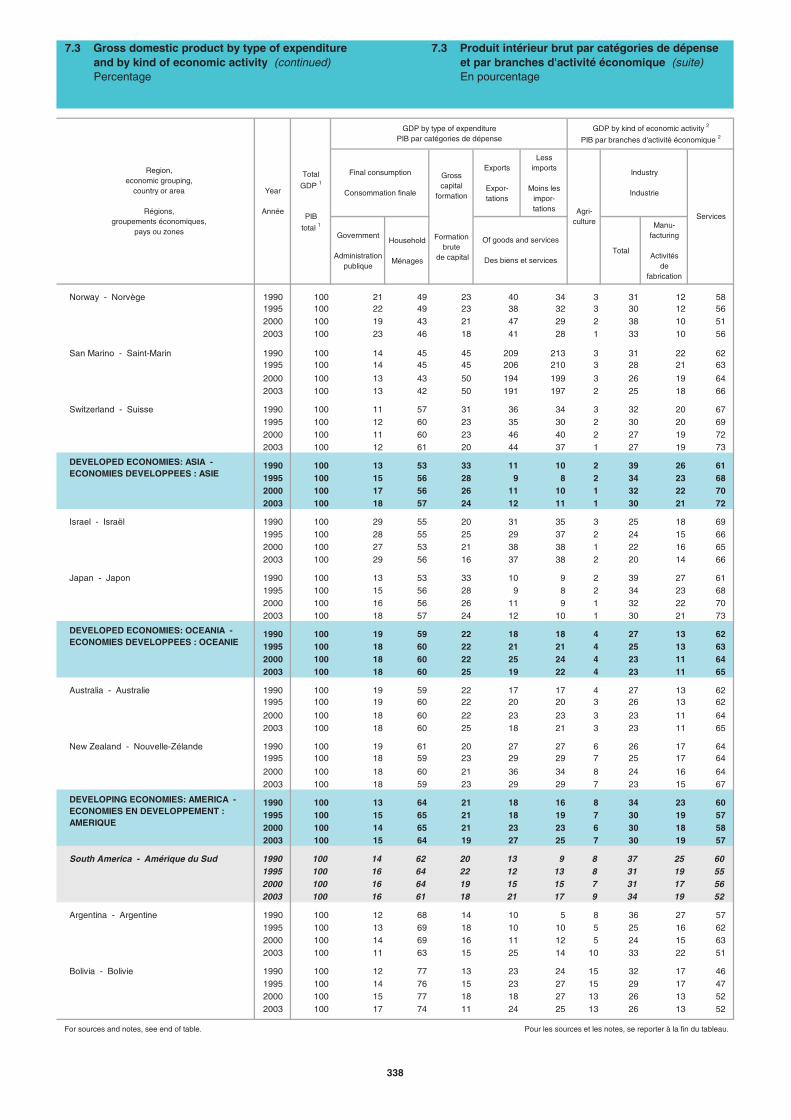
7.3 Gross domestic product by type of expenditure and by kind of economic activity (continued) Percentage
Year
Année
Total
GDP 1
PIB
total 1
Region,economic grouping,
country or area
Régions,groupements économiques,
pays ou zones
7.3 Produit intérieur brut par catégories de dépense et par branches d'activité économique (suite) En pourcentage
Final consumption
Consommation finale
Services
Industry
Industrie
Agri-culture
GDP by type of expenditurePIB par catégories de dépense
GDP by kind of economic activity 2
PIB par branches d'activité économique 2
Of goods and services
Des biens et services
Gross capital
formation
Formation brute
de capital
Other developed Europe - Autres économies développées d'Europe
337
Exports
Expor-tations
Less imports
Moins les impor-tations
Government
Administrationpublique
Household
MénagesTotal
Manu-facturing
Activitésde
fabrication
Norway - Norvège 1990 100 21 49 23 40 34 3 31 12 581995 100 22 49 23 38 32 3 30 12 562000 100 19 43 21 47 29 2 38 10 512003 100 23 46 18 41 28 1 33 10 56
San Marino - Saint-Marin 1990 100 14 45 45 209 213 3 31 22 621995 100 14 45 45 206 210 3 28 21 63
2000 100 13 43 50 194 199 3 26 19 642003 100 13 42 50 191 197 2 25 18 66
Switzerland - Suisse 1990 100 11 57 31 36 34 3 32 20 671995 100 12 60 23 35 30 2 30 20 692000 100 11 60 23 46 40 2 27 19 722003 100 12 61 20 44 37 1 27 19 73
1990 100 13 53 33 11 10 2 39 26 611995 100 15 56 28 9 8 2 34 23 682000 100 17 56 26 11 10 1 32 22 702003 100 18 57 24 12 11 1 30 21 72
Israel - Israël 1990 100 29 55 20 31 35 3 25 18 691995 100 28 55 25 29 37 2 24 15 662000 100 27 53 21 38 38 1 22 16 652003 100 29 56 16 37 38 2 20 14 66
Japan - Japon 1990 100 13 53 33 10 9 2 39 27 611995 100 15 56 28 9 8 2 34 23 682000 100 16 56 26 11 9 1 32 22 702003 100 18 57 24 12 10 1 30 21 73
1990 100 19 59 22 18 18 4 27 13 621995 100 18 60 22 21 21 4 25 13 632000 100 18 60 22 25 24 4 23 11 642003 100 18 60 25 19 22 4 23 11 65
Australia - Australie 1990 100 19 59 22 17 17 4 27 13 621995 100 19 60 22 20 20 3 26 13 62
2000 100 18 60 22 23 23 3 23 11 642003 100 18 60 25 18 21 3 23 11 65
New Zealand - Nouvelle-Zélande 1990 100 19 61 20 27 27 6 26 17 641995 100 18 59 23 29 29 7 25 17 64
2000 100 18 60 21 36 34 8 24 16 642003 100 18 59 23 29 29 7 23 15 67
1990 100 13 64 21 18 16 8 34 23 601995 100 15 65 21 18 19 7 30 19 572000 100 14 65 21 23 23 6 30 18 582003 100 15 64 19 27 25 7 30 19 57
South America - Amérique du Sud 1990 100 14 62 20 13 9 8 37 25 601995 100 16 64 22 12 13 8 31 19 552000 100 16 64 19 15 15 7 31 17 562003 100 16 61 18 21 17 9 34 19 52
Argentina - Argentine 1990 100 12 68 14 10 5 8 36 27 571995 100 13 69 18 10 10 5 25 16 622000 100 14 69 16 11 12 5 24 15 632003 100 11 63 15 25 14 10 33 22 51
Bolivia - Bolivie 1990 100 12 77 13 23 24 15 32 17 461995 100 14 76 15 23 27 15 29 17 472000 100 15 77 18 18 27 13 26 13 522003 100 17 74 11 24 25 13 26 13 52
For sources and notes, see end of table. Pour les sources et les notes, se reporter à la fin du tableau.
Year
Année
Total
GDP 1
PIB
total 1
Final consumption
Consommation finale
GDP by type of expenditurePIB par catégories de dépense
DEVELOPED ECONOMIES: ASIA - ECONOMIES DEVELOPPEES : ASIE
DEVELOPED ECONOMIES: OCEANIA - ECONOMIES DEVELOPPEES : OCEANIE
DEVELOPING ECONOMIES: AMERICA - ECONOMIES EN DEVELOPPEMENT : AMERIQUE
Region,economic grouping,
country or area
Régions,groupements économiques,
pays ou zones
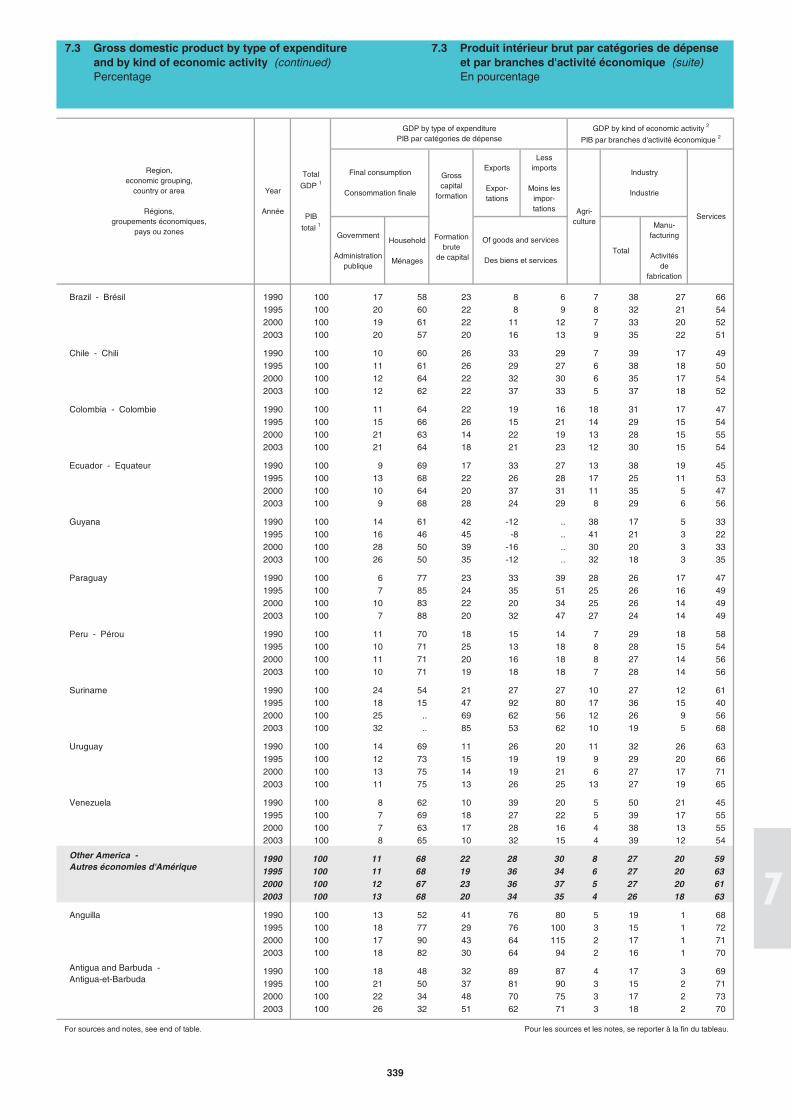
7.3 Gross domestic product by type of expenditure and by kind of economic activity (continued) Percentage
7.3 Produit intérieur brut par catégories de dépense et par branches d'activité économique (suite) En pourcentage
Gross capital
formation
Formation brute
de capital
Of goods and services
Des biens et services
Agri-culture
Industry
Industrie
Services
GDP by kind of economic activity 2
PIB par branches d'activité économique 2
338
Exports
Expor-tations
Less imports
Moins les impor-tations
Government
Administrationpublique
Household
MénagesTotal
Manu-facturing
Activitésde
fabrication
Brazil - Brésil 1990 100 17 58 23 8 6 7 38 27 661995 100 20 60 22 8 9 8 32 21 542000 100 19 61 22 11 12 7 33 20 522003 100 20 57 20 16 13 9 35 22 51
Chile - Chili 1990 100 10 60 26 33 29 7 39 17 491995 100 11 61 26 29 27 6 38 18 502000 100 12 64 22 32 30 6 35 17 542003 100 12 62 22 37 33 5 37 18 52
Colombia - Colombie 1990 100 11 64 22 19 16 18 31 17 471995 100 15 66 26 15 21 14 29 15 542000 100 21 63 14 22 19 13 28 15 552003 100 21 64 18 21 23 12 30 15 54
Ecuador - Equateur 1990 100 9 69 17 33 27 13 38 19 451995 100 13 68 22 26 28 17 25 11 532000 100 10 64 20 37 31 11 35 5 472003 100 9 68 28 24 29 8 29 6 56
Guyana 1990 100 14 61 42 -12 .. 38 17 5 331995 100 16 46 45 -8 .. 41 21 3 222000 100 28 50 39 -16 .. 30 20 3 332003 100 26 50 35 -12 .. 32 18 3 35
Paraguay 1990 100 6 77 23 33 39 28 26 17 471995 100 7 85 24 35 51 25 26 16 492000 100 10 83 22 20 34 25 26 14 492003 100 7 88 20 32 47 27 24 14 49
Peru - Pérou 1990 100 11 70 18 15 14 7 29 18 581995 100 10 71 25 13 18 8 28 15 542000 100 11 71 20 16 18 8 27 14 562003 100 10 71 19 18 18 7 28 14 56
Suriname 1990 100 24 54 21 27 27 10 27 12 611995 100 18 15 47 92 80 17 36 15 402000 100 25 .. 69 62 56 12 26 9 562003 100 32 .. 85 53 62 10 19 5 68
Uruguay 1990 100 14 69 11 26 20 11 32 26 631995 100 12 73 15 19 19 9 29 20 662000 100 13 75 14 19 21 6 27 17 712003 100 11 75 13 26 25 13 27 19 65
Venezuela 1990 100 8 62 10 39 20 5 50 21 451995 100 7 69 18 27 22 5 39 17 552000 100 7 63 17 28 16 4 38 13 552003 100 8 65 10 32 15 4 39 12 54
1990 100 11 68 22 28 30 8 27 20 591995 100 11 68 19 36 34 6 27 20 632000 100 12 67 23 36 37 5 27 20 612003 100 13 68 20 34 35 4 26 18 63
Anguilla 1990 100 13 52 41 76 80 5 19 1 681995 100 18 77 29 76 100 3 15 1 722000 100 17 90 43 64 115 2 17 1 712003 100 18 82 30 64 94 2 16 1 70
1990 100 18 48 32 89 87 4 17 3 691995 100 21 50 37 81 90 3 15 2 712000 100 22 34 48 70 75 3 17 2 732003 100 26 32 51 62 71 3 18 2 70
For sources and notes, see end of table. Pour les sources et les notes, se reporter à la fin du tableau.
Total
GDP 1
PIB
total 1
Final consumption
Consommation finale
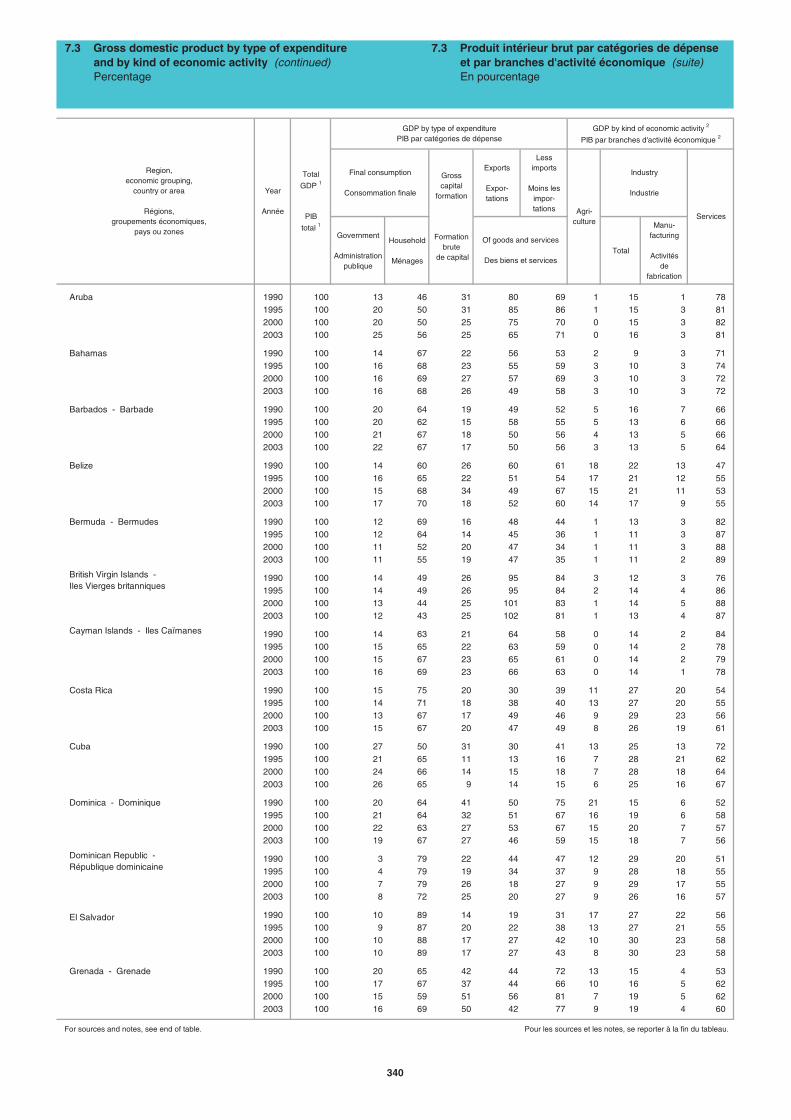
7.3 Gross domestic product by type of expenditure and by kind of economic activity (continued) Percentage
GDP by type of expenditurePIB par catégories de dépense
Region,economic grouping,
country or area
Régions,groupements économiques,
pays ou zones
Year
Année Agri-culture
Of goods and services
Des biens et services
Antigua and Barbuda - Antigua-et-Barbuda
Other America - Autres économies d'Amérique
Services
Industry
Industrie
GDP by kind of economic activity 2
PIB par branches d'activité économique 2
7.3 Produit intérieur brut par catégories de dépense et par branches d'activité économique (suite) En pourcentage
Gross capital
formation
Formation brute
de capital
339
Exports
Expor-tations
Less imports
Moins les impor-tations
Government
Administrationpublique
Household
MénagesTotal
Manu-facturing
Activitésde
fabrication
Aruba 1990 100 13 46 31 80 69 1 15 1 781995 100 20 50 31 85 86 1 15 3 812000 100 20 50 25 75 70 0 15 3 822003 100 25 56 25 65 71 0 16 3 81
Bahamas 1990 100 14 67 22 56 53 2 9 3 711995 100 16 68 23 55 59 3 10 3 742000 100 16 69 27 57 69 3 10 3 722003 100 16 68 26 49 58 3 10 3 72
Barbados - Barbade 1990 100 20 64 19 49 52 5 16 7 661995 100 20 62 15 58 55 5 13 6 662000 100 21 67 18 50 56 4 13 5 662003 100 22 67 17 50 56 3 13 5 64
Belize 1990 100 14 60 26 60 61 18 22 13 471995 100 16 65 22 51 54 17 21 12 552000 100 15 68 34 49 67 15 21 11 532003 100 17 70 18 52 60 14 17 9 55
Bermuda - Bermudes 1990 100 12 69 16 48 44 1 13 3 821995 100 12 64 14 45 36 1 11 3 872000 100 11 52 20 47 34 1 11 3 882003 100 11 55 19 47 35 1 11 2 89
1990 100 14 49 26 95 84 3 12 3 761995 100 14 49 26 95 84 2 14 4 862000 100 13 44 25 101 83 1 14 5 882003 100 12 43 25 102 81 1 13 4 87
Cayman Islands - Iles Caïmanes 1990 100 14 63 21 64 58 0 14 2 841995 100 15 65 22 63 59 0 14 2 782000 100 15 67 23 65 61 0 14 2 792003 100 16 69 23 66 63 0 14 1 78
Costa Rica 1990 100 15 75 20 30 39 11 27 20 541995 100 14 71 18 38 40 13 27 20 552000 100 13 67 17 49 46 9 29 23 562003 100 15 67 20 47 49 8 26 19 61
Cuba 1990 100 27 50 31 30 41 13 25 13 721995 100 21 65 11 13 16 7 28 21 622000 100 24 66 14 15 18 7 28 18 642003 100 26 65 9 14 15 6 25 16 67
Dominica - Dominique 1990 100 20 64 41 50 75 21 15 6 521995 100 21 64 32 51 67 16 19 6 582000 100 22 63 27 53 67 15 20 7 572003 100 19 67 27 46 59 15 18 7 56
1990 100 3 79 22 44 47 12 29 20 511995 100 4 79 19 34 37 9 28 18 552000 100 7 79 26 18 27 9 29 17 552003 100 8 72 25 20 27 9 26 16 57
1990 100 10 89 14 19 31 17 27 22 561995 100 9 87 20 22 38 13 27 21 552000 100 10 88 17 27 42 10 30 23 582003 100 10 89 17 27 43 8 30 23 58
Grenada - Grenade 1990 100 20 65 42 44 72 13 15 4 531995 100 17 67 37 44 66 10 16 5 622000 100 15 59 51 56 81 7 19 5 622003 100 16 69 50 42 77 9 19 4 60
For sources and notes, see end of table. Pour les sources et les notes, se reporter à la fin du tableau.
7.3 Gross domestic product by type of expenditure and by kind of economic activity (continued) Percentage
Year
Année
Total
GDP 1
PIB
total 1
Agri-culture
British Virgin Islands - Iles Vierges britanniques
Dominican Republic - République dominicaine
Final consumption
Consommation finale
Of goods and services
Des biens et services
Gross capital
formation
Formation brute
de capital
Services
Industry
Industrie
7.3 Produit intérieur brut par catégories de dépense et par branches d'activité économique (suite) En pourcentage
GDP by kind of economic activity 2
PIB par branches d'activité économique 2GDP by type of expenditure
PIB par catégories de dépense
Region,economic grouping,
country or area
Régions,groupements économiques,
pays ou zones
El Salvador
340
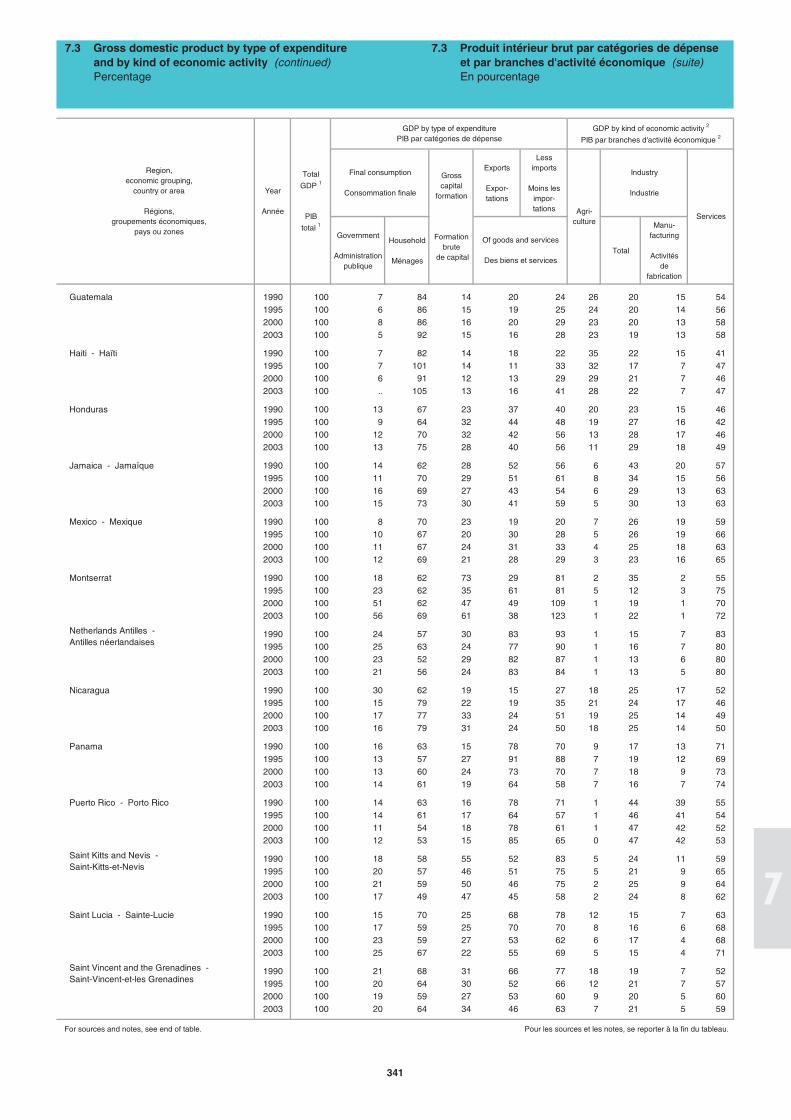
Exports
Expor-tations
Less imports
Moins les impor-tations
Government
Administrationpublique
Household
MénagesTotal
Manu-facturing
Activitésde
fabrication
Guatemala 1990 100 7 84 14 20 24 26 20 15 541995 100 6 86 15 19 25 24 20 14 562000 100 8 86 16 20 29 23 20 13 582003 100 5 92 15 16 28 23 19 13 58
Haiti - Haïti 1990 100 7 82 14 18 22 35 22 15 411995 100 7 101 14 11 33 32 17 7 472000 100 6 91 12 13 29 29 21 7 462003 100 .. 105 13 16 41 28 22 7 47
Honduras 1990 100 13 67 23 37 40 20 23 15 461995 100 9 64 32 44 48 19 27 16 422000 100 12 70 32 42 56 13 28 17 462003 100 13 75 28 40 56 11 29 18 49
Jamaica - Jamaïque 1990 100 14 62 28 52 56 6 43 20 571995 100 11 70 29 51 61 8 34 15 562000 100 16 69 27 43 54 6 29 13 632003 100 15 73 30 41 59 5 30 13 63
Mexico - Mexique 1990 100 8 70 23 19 20 7 26 19 591995 100 10 67 20 30 28 5 26 19 662000 100 11 67 24 31 33 4 25 18 632003 100 12 69 21 28 29 3 23 16 65
Montserrat 1990 100 18 62 73 29 81 2 35 2 551995 100 23 62 35 61 81 5 12 3 752000 100 51 62 47 49 109 1 19 1 702003 100 56 69 61 38 123 1 22 1 72
1990 100 24 57 30 83 93 1 15 7 831995 100 25 63 24 77 90 1 16 7 802000 100 23 52 29 82 87 1 13 6 802003 100 21 56 24 83 84 1 13 5 80
Nicaragua 1990 100 30 62 19 15 27 18 25 17 521995 100 15 79 22 19 35 21 24 17 462000 100 17 77 33 24 51 19 25 14 492003 100 16 79 31 24 50 18 25 14 50
Panama 1990 100 16 63 15 78 70 9 17 13 711995 100 13 57 27 91 88 7 19 12 692000 100 13 60 24 73 70 7 18 9 732003 100 14 61 19 64 58 7 16 7 74
Puerto Rico - Porto Rico 1990 100 14 63 16 78 71 1 44 39 551995 100 14 61 17 64 57 1 46 41 542000 100 11 54 18 78 61 1 47 42 522003 100 12 53 15 85 65 0 47 42 53
1990 100 18 58 55 52 83 5 24 11 591995 100 20 57 46 51 75 5 21 9 652000 100 21 59 50 46 75 2 25 9 642003 100 17 49 47 45 58 2 24 8 62
Saint Lucia - Sainte-Lucie 1990 100 15 70 25 68 78 12 15 7 631995 100 17 59 25 70 70 8 16 6 682000 100 23 59 27 53 62 6 17 4 682003 100 25 67 22 55 69 5 15 4 71
1990 100 21 68 31 66 77 18 19 7 521995 100 20 64 30 52 66 12 21 7 572000 100 19 59 27 53 60 9 20 5 602003 100 20 64 34 46 63 7 21 5 59
For sources and notes, see end of table. Pour les sources et les notes, se reporter à la fin du tableau.
Year
Année
GDP by type of expenditurePIB par catégories de dépense
Region,economic grouping,
country or area
Régions,groupements économiques,
pays ou zones
Total
GDP 1
PIB
total 1
Industry
Industrie
Agri-culture
Gross capital
formation
Formation brute
de capital
Services
Of goods and services
Des biens et services
7.3 Produit intérieur brut par catégories de dépense et par branches d'activité économique (suite) En pourcentage
GDP by kind of economic activity 2
PIB par branches d'activité économique 2
Final consumption
Consommation finale
Netherlands Antilles - Antilles néerlandaises
7.3 Gross domestic product by type of expenditure and by kind of economic activity (continued) Percentage
Saint Kitts and Nevis - Saint-Kitts-et-Nevis
Saint Vincent and the Grenadines - Saint-Vincent-et-les Grenadines
341
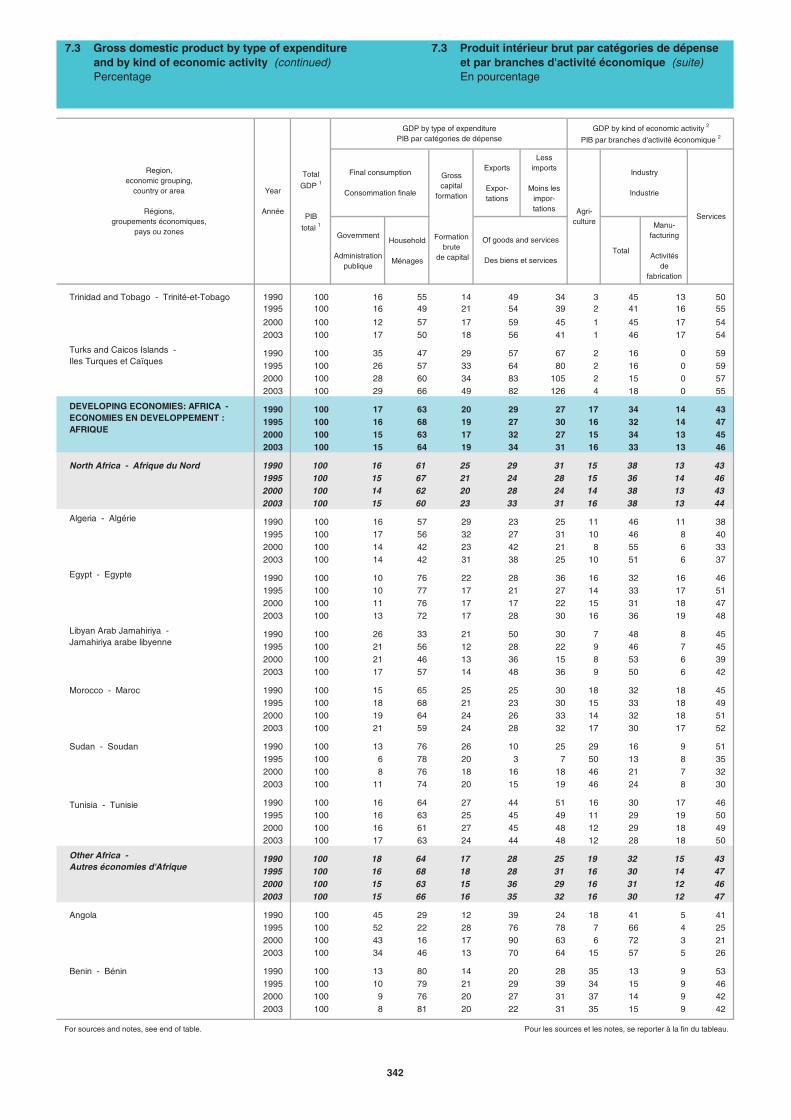
Exports
Expor-tations
Less imports
Moins les impor-tations
Government
Administrationpublique
Household
MénagesTotal
Manu-facturing
Activitésde
fabrication
Trinidad and Tobago - Trinité-et-Tobago 1990 100 16 55 14 49 34 3 45 13 501995 100 16 49 21 54 39 2 41 16 55
2000 100 12 57 17 59 45 1 45 17 542003 100 17 50 18 56 41 1 46 17 54
1990 100 35 47 29 57 67 2 16 0 591995 100 26 57 33 64 80 2 16 0 592000 100 28 60 34 83 105 2 15 0 572003 100 29 66 49 82 126 4 18 0 55
1990 100 17 63 20 29 27 17 34 14 431995 100 16 68 19 27 30 16 32 14 472000 100 15 63 17 32 27 15 34 13 452003 100 15 64 19 34 31 16 33 13 46
North Africa - Afrique du Nord 1990 100 16 61 25 29 31 15 38 13 431995 100 15 67 21 24 28 15 36 14 462000 100 14 62 20 28 24 14 38 13 432003 100 15 60 23 33 31 16 38 13 44
Algeria - Algérie 1990 100 16 57 29 23 25 11 46 11 381995 100 17 56 32 27 31 10 46 8 402000 100 14 42 23 42 21 8 55 6 332003 100 14 42 31 38 25 10 51 6 37
Egypt - Egypte 1990 100 10 76 22 28 36 16 32 16 461995 100 10 77 17 21 27 14 33 17 512000 100 11 76 17 17 22 15 31 18 472003 100 13 72 17 28 30 16 36 19 48
1990 100 26 33 21 50 30 7 48 8 451995 100 21 56 12 28 22 9 46 7 452000 100 21 46 13 36 15 8 53 6 392003 100 17 57 14 48 36 9 50 6 42
Morocco - Maroc 1990 100 15 65 25 25 30 18 32 18 451995 100 18 68 21 23 30 15 33 18 492000 100 19 64 24 26 33 14 32 18 512003 100 21 59 24 28 32 17 30 17 52
Sudan - Soudan 1990 100 13 76 26 10 25 29 16 9 511995 100 6 78 20 3 7 50 13 8 352000 100 8 76 18 16 18 46 21 7 322003 100 11 74 20 15 19 46 24 8 30
1990 100 16 64 27 44 51 16 30 17 461995 100 16 63 25 45 49 11 29 19 502000 100 16 61 27 45 48 12 29 18 492003 100 17 63 24 44 48 12 28 18 50
1990 100 18 64 17 28 25 19 32 15 431995 100 16 68 18 28 31 16 30 14 472000 100 15 63 15 36 29 16 31 12 462003 100 15 66 16 35 32 16 30 12 47
Angola 1990 100 45 29 12 39 24 18 41 5 411995 100 52 22 28 76 78 7 66 4 252000 100 43 16 17 90 63 6 72 3 212003 100 34 46 13 70 64 15 57 5 26
Benin - Bénin 1990 100 13 80 14 20 28 35 13 9 531995 100 10 79 21 29 39 34 15 9 462000 100 9 76 20 27 31 37 14 9 422003 100 8 81 20 22 31 35 15 9 42
For sources and notes, see end of table. Pour les sources et les notes, se reporter à la fin du tableau.
Total
GDP 1
PIB
total 1
7.3 Gross domestic product by type of expenditure and by kind of economic activity (continued) Percentage
Gross capital
formation
Formation brute
de capital
GDP by kind of economic activity 2
PIB par branches d'activité économique 2
Industry
Industrie
7.3 Produit intérieur brut par catégories de dépense et par branches d'activité économique (suite) En pourcentage
Agri-culture
Final consumption
Consommation finaleYear
Année
Libyan Arab Jamahiriya - Jamahiriya arabe libyenne
Other Africa - Autres économies d'Afrique
GDP by type of expenditurePIB par catégories de dépense
Of goods and services
Des biens et services
Services
Turks and Caicos Islands - Iles Turques et Caïques
DEVELOPING ECONOMIES: AFRICA - ECONOMIES EN DEVELOPPEMENT : AFRIQUE
Region,economic grouping,
country or area
Régions,groupements économiques,
pays ou zones
Tunisia - Tunisie
342
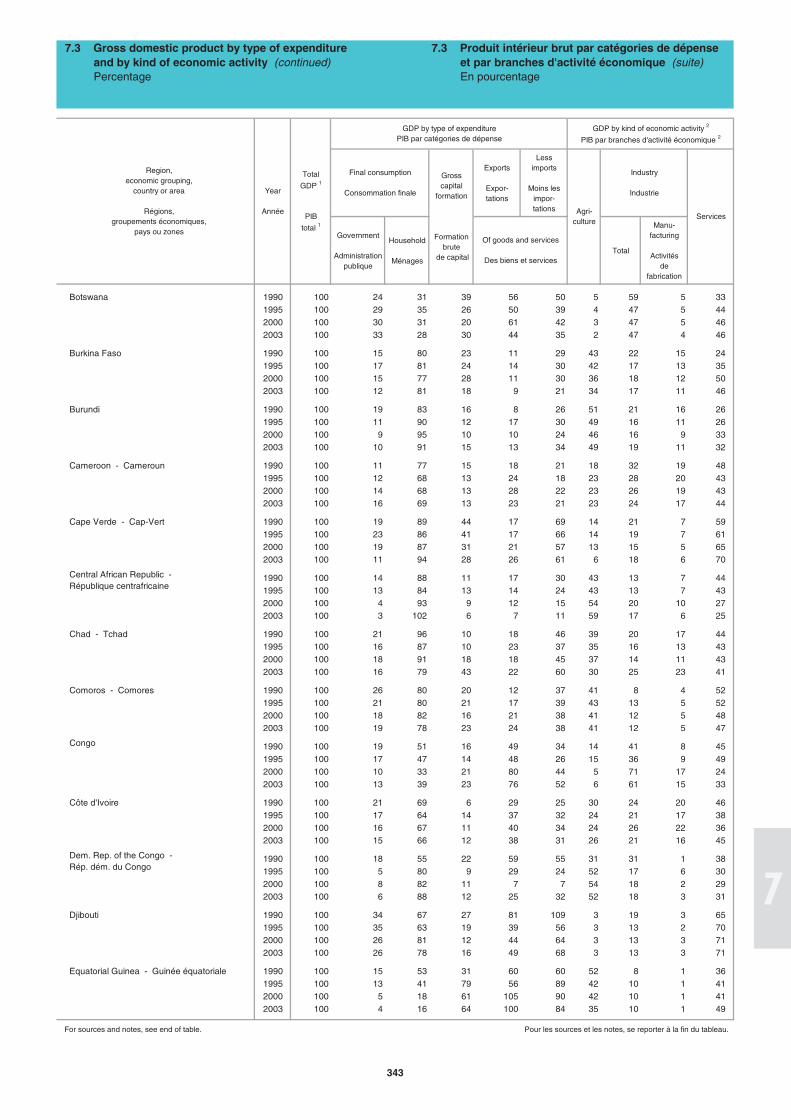
Exports
Expor-tations
Less imports
Moins les impor-tations
Government
Administrationpublique
Household
MénagesTotal
Manu-facturing
Activitésde
fabrication
Botswana 1990 100 24 31 39 56 50 5 59 5 331995 100 29 35 26 50 39 4 47 5 442000 100 30 31 20 61 42 3 47 5 462003 100 33 28 30 44 35 2 47 4 46
Burkina Faso 1990 100 15 80 23 11 29 43 22 15 241995 100 17 81 24 14 30 42 17 13 352000 100 15 77 28 11 30 36 18 12 502003 100 12 81 18 9 21 34 17 11 46
Burundi 1990 100 19 83 16 8 26 51 21 16 261995 100 11 90 12 17 30 49 16 11 262000 100 9 95 10 10 24 46 16 9 332003 100 10 91 15 13 34 49 19 11 32
Cameroon - Cameroun 1990 100 11 77 15 18 21 18 32 19 481995 100 12 68 13 24 18 23 28 20 432000 100 14 68 13 28 22 23 26 19 432003 100 16 69 13 23 21 23 24 17 44
Cape Verde - Cap-Vert 1990 100 19 89 44 17 69 14 21 7 591995 100 23 86 41 17 66 14 19 7 612000 100 19 87 31 21 57 13 15 5 652003 100 11 94 28 26 61 6 18 6 70
1990 100 14 88 11 17 30 43 13 7 441995 100 13 84 13 14 24 43 13 7 432000 100 4 93 9 12 15 54 20 10 272003 100 3 102 6 7 11 59 17 6 25
Chad - Tchad 1990 100 21 96 10 18 46 39 20 17 441995 100 16 87 10 23 37 35 16 13 432000 100 18 91 18 18 45 37 14 11 432003 100 16 79 43 22 60 30 25 23 41
Comoros - Comores 1990 100 26 80 20 12 37 41 8 4 521995 100 21 80 21 17 39 43 13 5 522000 100 18 82 16 21 38 41 12 5 482003 100 19 78 23 24 38 41 12 5 47
Congo 1990 100 19 51 16 49 34 14 41 8 451995 100 17 47 14 48 26 15 36 9 492000 100 10 33 21 80 44 5 71 17 242003 100 13 39 23 76 52 6 61 15 33
Côte d'Ivoire 1990 100 21 69 6 29 25 30 24 20 461995 100 17 64 14 37 32 24 21 17 382000 100 16 67 11 40 34 24 26 22 362003 100 15 66 12 38 31 26 21 16 45
1990 100 18 55 22 59 55 31 31 1 381995 100 5 80 9 29 24 52 17 6 302000 100 8 82 11 7 7 54 18 2 292003 100 6 88 12 25 32 52 18 3 31
Djibouti 1990 100 34 67 27 81 109 3 19 3 651995 100 35 63 19 39 56 3 13 2 702000 100 26 81 12 44 64 3 13 3 712003 100 26 78 16 49 68 3 13 3 71
Equatorial Guinea - Guinée équatoriale 1990 100 15 53 31 60 60 52 8 1 361995 100 13 41 79 56 89 42 10 1 412000 100 5 18 61 105 90 42 10 1 412003 100 4 16 64 100 84 35 10 1 49
For sources and notes, see end of table. Pour les sources et les notes, se reporter à la fin du tableau.
7.3 Gross domestic product by type of expenditure and by kind of economic activity (continued) Percentage
Services
Industry
Industrie
Region,economic grouping,
country or area
Régions,groupements économiques,
pays ou zones
Year
Année
Total
GDP 1
PIB
total 1
7.3 Produit intérieur brut par catégories de dépense et par branches d'activité économique (suite) En pourcentage
Of goods and services
Des biens et services
GDP by type of expenditurePIB par catégories de dépense
GDP by kind of economic activity 2
PIB par branches d'activité économique 2
Agri-culture
Final consumption
Consommation finale
Gross capital
formation
Formation brute
de capital
Central African Republic - République centrafricaine
Dem. Rep. of the Congo - Rép. dém. du Congo
343
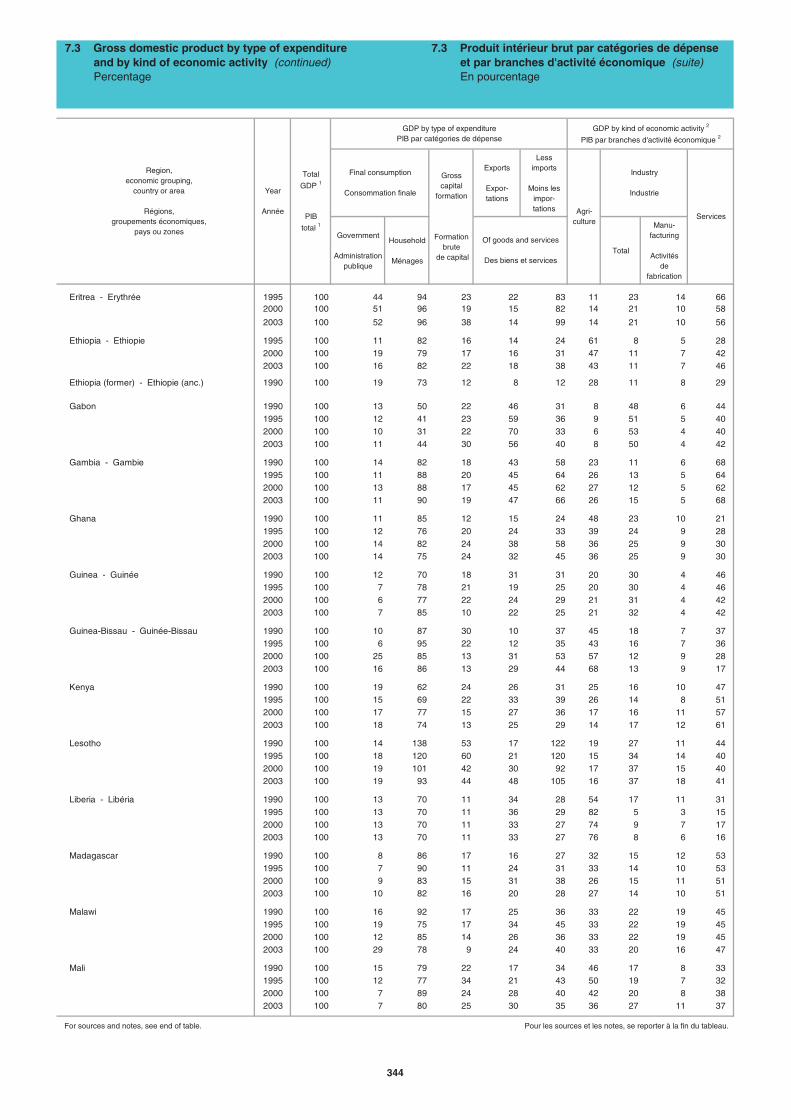
Exports
Expor-tations
Less imports
Moins les impor-tations
Government
Administrationpublique
Household
MénagesTotal
Manu-facturing
Activitésde
fabrication
Eritrea - Erythrée 1995 100 44 94 23 22 83 11 23 14 662000 100 51 96 19 15 82 14 21 10 58
2003 100 52 96 38 14 99 14 21 10 56
Ethiopia - Ethiopie 1995 100 11 82 16 14 24 61 8 5 282000 100 19 79 17 16 31 47 11 7 422003 100 16 82 22 18 38 43 11 7 46
Ethiopia (former) - Ethiopie (anc.) 1990 100 19 73 12 8 12 28 11 8 29
Gabon 1990 100 13 50 22 46 31 8 48 6 441995 100 12 41 23 59 36 9 51 5 402000 100 10 31 22 70 33 6 53 4 402003 100 11 44 30 56 40 8 50 4 42
Gambia - Gambie 1990 100 14 82 18 43 58 23 11 6 681995 100 11 88 20 45 64 26 13 5 642000 100 13 88 17 45 62 27 12 5 622003 100 11 90 19 47 66 26 15 5 68
Ghana 1990 100 11 85 12 15 24 48 23 10 211995 100 12 76 20 24 33 39 24 9 282000 100 14 82 24 38 58 36 25 9 302003 100 14 75 24 32 45 36 25 9 30
Guinea - Guinée 1990 100 12 70 18 31 31 20 30 4 461995 100 7 78 21 19 25 20 30 4 462000 100 6 77 22 24 29 21 31 4 422003 100 7 85 10 22 25 21 32 4 42
Guinea-Bissau - Guinée-Bissau 1990 100 10 87 30 10 37 45 18 7 371995 100 6 95 22 12 35 43 16 7 362000 100 25 85 13 31 53 57 12 9 282003 100 16 86 13 29 44 68 13 9 17
Kenya 1990 100 19 62 24 26 31 25 16 10 471995 100 15 69 22 33 39 26 14 8 512000 100 17 77 15 27 36 17 16 11 572003 100 18 74 13 25 29 14 17 12 61
Lesotho 1990 100 14 138 53 17 122 19 27 11 441995 100 18 120 60 21 120 15 34 14 402000 100 19 101 42 30 92 17 37 15 402003 100 19 93 44 48 105 16 37 18 41
Liberia - Libéria 1990 100 13 70 11 34 28 54 17 11 311995 100 13 70 11 36 29 82 5 3 152000 100 13 70 11 33 27 74 9 7 172003 100 13 70 11 33 27 76 8 6 16
Madagascar 1990 100 8 86 17 16 27 32 15 12 531995 100 7 90 11 24 31 33 14 10 532000 100 9 83 15 31 38 26 15 11 512003 100 10 82 16 20 28 27 14 10 51
Malawi 1990 100 16 92 17 25 36 33 22 19 451995 100 19 75 17 34 45 33 22 19 452000 100 12 85 14 26 36 33 22 19 452003 100 29 78 9 24 40 33 20 16 47
Mali 1990 100 15 79 22 17 34 46 17 8 331995 100 12 77 34 21 43 50 19 7 322000 100 7 89 24 28 40 42 20 8 382003 100 7 80 25 30 35 36 27 11 37
For sources and notes, see end of table. Pour les sources et les notes, se reporter à la fin du tableau.
ServicesAgri-
culture
Industry
Industrie Year
Année
Total
GDP 1
PIB
total 1
GDP by type of expenditurePIB par catégories de dépense
Final consumption
Consommation finale
Of goods and services
Des biens et services
Gross capital
formation
Formation brute
de capital
7.3 Produit intérieur brut par catégories de dépense et par branches d'activité économique (suite) En pourcentage
GDP by kind of economic activity 2
PIB par branches d'activité économique 2
Region,economic grouping,
country or area
Régions,groupements économiques,
pays ou zones
7.3 Gross domestic product by type of expenditure and by kind of economic activity (continued) Percentage
344
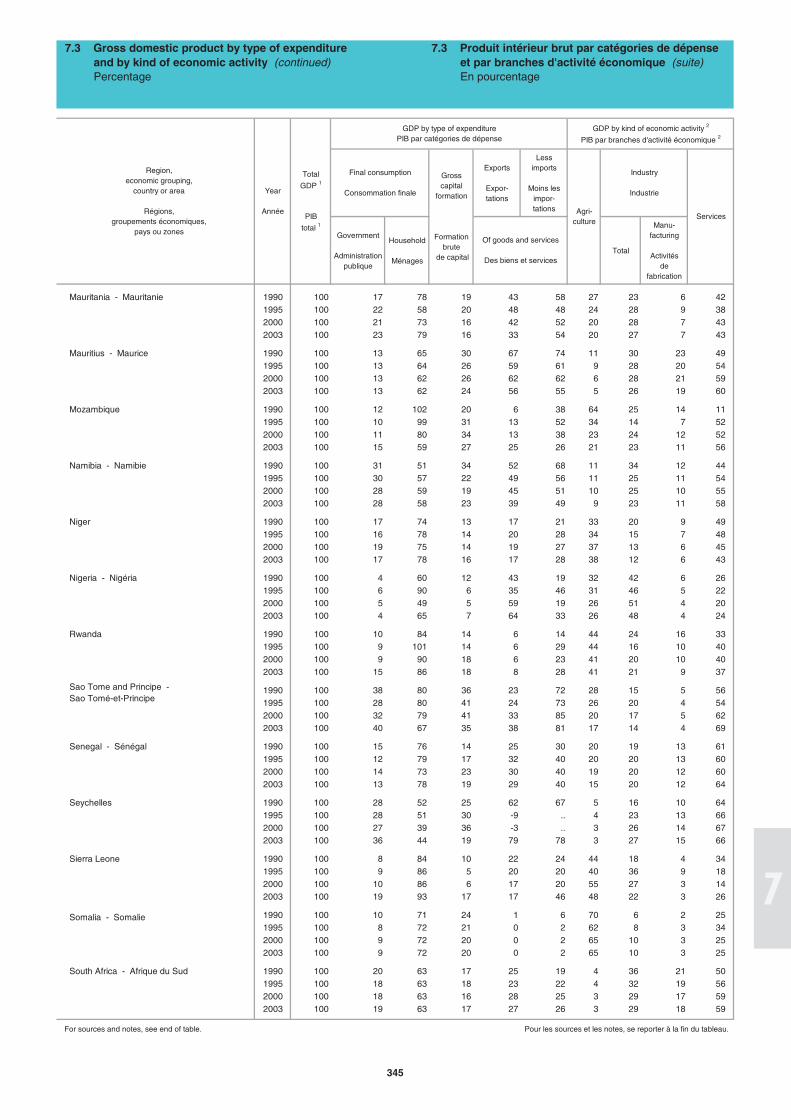
Exports
Expor-tations
Less imports
Moins les impor-tations
Government
Administrationpublique
Household
MénagesTotal
Manu-facturing
Activitésde
fabrication
Mauritania - Mauritanie 1990 100 17 78 19 43 58 27 23 6 421995 100 22 58 20 48 48 24 28 9 382000 100 21 73 16 42 52 20 28 7 432003 100 23 79 16 33 54 20 27 7 43
Mauritius - Maurice 1990 100 13 65 30 67 74 11 30 23 491995 100 13 64 26 59 61 9 28 20 542000 100 13 62 26 62 62 6 28 21 592003 100 13 62 24 56 55 5 26 19 60
Mozambique 1990 100 12 102 20 6 38 64 25 14 111995 100 10 99 31 13 52 34 14 7 522000 100 11 80 34 13 38 23 24 12 522003 100 15 59 27 25 26 21 23 11 56
Namibia - Namibie 1990 100 31 51 34 52 68 11 34 12 441995 100 30 57 22 49 56 11 25 11 542000 100 28 59 19 45 51 10 25 10 552003 100 28 58 23 39 49 9 23 11 58
Niger 1990 100 17 74 13 17 21 33 20 9 491995 100 16 78 14 20 28 34 15 7 482000 100 19 75 14 19 27 37 13 6 452003 100 17 78 16 17 28 38 12 6 43
Nigeria - Nigéria 1990 100 4 60 12 43 19 32 42 6 261995 100 6 90 6 35 46 31 46 5 222000 100 5 49 5 59 19 26 51 4 202003 100 4 65 7 64 33 26 48 4 24
Rwanda 1990 100 10 84 14 6 14 44 24 16 331995 100 9 101 14 6 29 44 16 10 402000 100 9 90 18 6 23 41 20 10 402003 100 15 86 18 8 28 41 21 9 37
1990 100 38 80 36 23 72 28 15 5 561995 100 28 80 41 24 73 26 20 4 542000 100 32 79 41 33 85 20 17 5 622003 100 40 67 35 38 81 17 14 4 69
Senegal - Sénégal 1990 100 15 76 14 25 30 20 19 13 611995 100 12 79 17 32 40 20 20 13 602000 100 14 73 23 30 40 19 20 12 602003 100 13 78 19 29 40 15 20 12 64
Seychelles 1990 100 28 52 25 62 67 5 16 10 641995 100 28 51 30 -9 .. 4 23 13 662000 100 27 39 36 -3 .. 3 26 14 672003 100 36 44 19 79 78 3 27 15 66
Sierra Leone 1990 100 8 84 10 22 24 44 18 4 341995 100 9 86 5 20 20 40 36 9 182000 100 10 86 6 17 20 55 27 3 142003 100 19 93 17 17 46 48 22 3 26
1990 100 10 71 24 1 6 70 6 2 251995 100 8 72 21 0 2 62 8 3 342000 100 9 72 20 0 2 65 10 3 252003 100 9 72 20 0 2 65 10 3 25
South Africa - Afrique du Sud 1990 100 20 63 17 25 19 4 36 21 501995 100 18 63 18 23 22 4 32 19 562000 100 18 63 16 28 25 3 29 17 592003 100 19 63 17 27 26 3 29 18 59
For sources and notes, see end of table. Pour les sources et les notes, se reporter à la fin du tableau.
7.3 Produit intérieur brut par catégories de dépense et par branches d'activité économique (suite) En pourcentage
Agri-culture
Services
GDP by kind of economic activity 2
PIB par branches d'activité économique 2GDP by type of expenditure
PIB par catégories de dépense
Gross capital
formation
Formation brute
de capital
Industry
Industrie
Of goods and services
Des biens et services
Year
Année
Total
GDP 1
PIB
total 1
Final consumption
Consommation finale
Sao Tome and Principe - Sao Tomé-et-Principe
Region,economic grouping,
country or area
Régions,groupements économiques,
pays ou zones
7.3 Gross domestic product by type of expenditure and by kind of economic activity (continued) Percentage
Somalia - Somalie
345
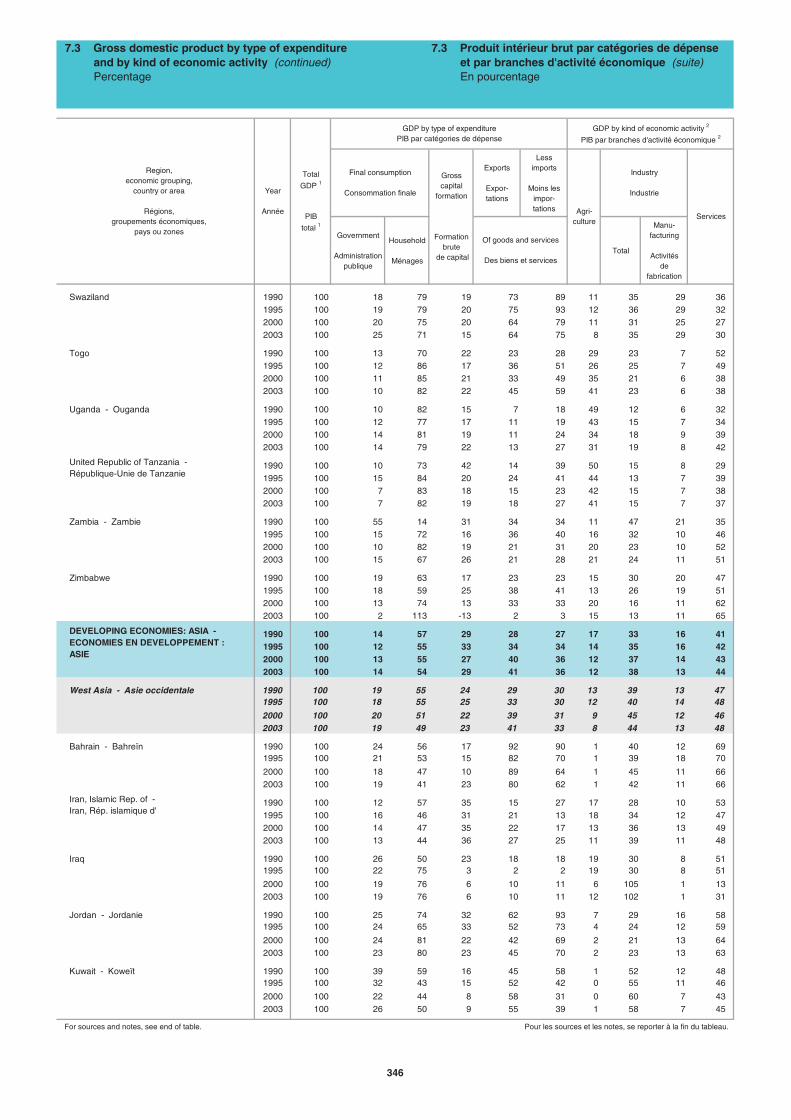
Exports
Expor-tations
Less imports
Moins les impor-tations
Government
Administrationpublique
Household
MénagesTotal
Manu-facturing
Activitésde
fabrication
Swaziland 1990 100 18 79 19 73 89 11 35 29 361995 100 19 79 20 75 93 12 36 29 322000 100 20 75 20 64 79 11 31 25 272003 100 25 71 15 64 75 8 35 29 30
Togo 1990 100 13 70 22 23 28 29 23 7 521995 100 12 86 17 36 51 26 25 7 492000 100 11 85 21 33 49 35 21 6 382003 100 10 82 22 45 59 41 23 6 38
Uganda - Ouganda 1990 100 10 82 15 7 18 49 12 6 321995 100 12 77 17 11 19 43 15 7 342000 100 14 81 19 11 24 34 18 9 392003 100 14 79 22 13 27 31 19 8 42
1990 100 10 73 42 14 39 50 15 8 291995 100 15 84 20 24 41 44 13 7 392000 100 7 83 18 15 23 42 15 7 382003 100 7 82 19 18 27 41 15 7 37
Zambia - Zambie 1990 100 55 14 31 34 34 11 47 21 351995 100 15 72 16 36 40 16 32 10 462000 100 10 82 19 21 31 20 23 10 522003 100 15 67 26 21 28 21 24 11 51
Zimbabwe 1990 100 19 63 17 23 23 15 30 20 471995 100 18 59 25 38 41 13 26 19 512000 100 13 74 13 33 33 20 16 11 622003 100 2 113 -13 2 3 15 13 11 65
1990 100 14 57 29 28 27 17 33 16 411995 100 12 55 33 34 34 14 35 16 422000 100 13 55 27 40 36 12 37 14 432003 100 14 54 29 41 36 12 38 13 44
West Asia - Asie occidentale 1990 100 19 55 24 29 30 13 39 13 471995 100 18 55 25 33 30 12 40 14 48
2000 100 20 51 22 39 31 9 45 12 462003 100 19 49 23 41 33 8 44 13 48
Bahrain - Bahreïn 1990 100 24 56 17 92 90 1 40 12 691995 100 21 53 15 82 70 1 39 18 70
2000 100 18 47 10 89 64 1 45 11 662003 100 19 41 23 80 62 1 42 11 66
1990 100 12 57 35 15 27 17 28 10 531995 100 16 46 31 21 13 18 34 12 472000 100 14 47 35 22 17 13 36 13 492003 100 13 44 36 27 25 11 39 11 48
Iraq 1990 100 26 50 23 18 18 19 30 8 511995 100 22 75 3 2 2 19 30 8 51
2000 100 19 76 6 10 11 6 105 1 132003 100 19 76 6 10 11 12 102 1 31
Jordan - Jordanie 1990 100 25 74 32 62 93 7 29 16 581995 100 24 65 33 52 73 4 24 12 59
2000 100 24 81 22 42 69 2 21 13 642003 100 23 80 23 45 70 2 23 13 63
Kuwait - Koweït 1990 100 39 59 16 45 58 1 52 12 481995 100 32 43 15 52 42 0 55 11 46
2000 100 22 44 8 58 31 0 60 7 432003 100 26 50 9 55 39 1 58 7 45
For sources and notes, see end of table. Pour les sources et les notes, se reporter à la fin du tableau.
Industry
Industrie
Gross capital
formation
Formation brute
de capital
Agri-culture
GDP by type of expenditurePIB par catégories de dépense
GDP by kind of economic activity 2
PIB par branches d'activité économique 2
Services
Final consumption
Consommation finale
7.3 Produit intérieur brut par catégories de dépense et par branches d'activité économique (suite) En pourcentage
Of goods and services
Des biens et services
DEVELOPING ECONOMIES: ASIA - ECONOMIES EN DEVELOPPEMENT : ASIE
Iran, Islamic Rep. of - Iran, Rép. islamique d'
United Republic of Tanzania - République-Unie de Tanzanie
Region,economic grouping,
country or area
Régions,groupements économiques,
pays ou zones
7.3 Gross domestic product by type of expenditure and by kind of economic activity (continued) Percentage
Year
Année
Total
GDP 1
PIB
total 1
346
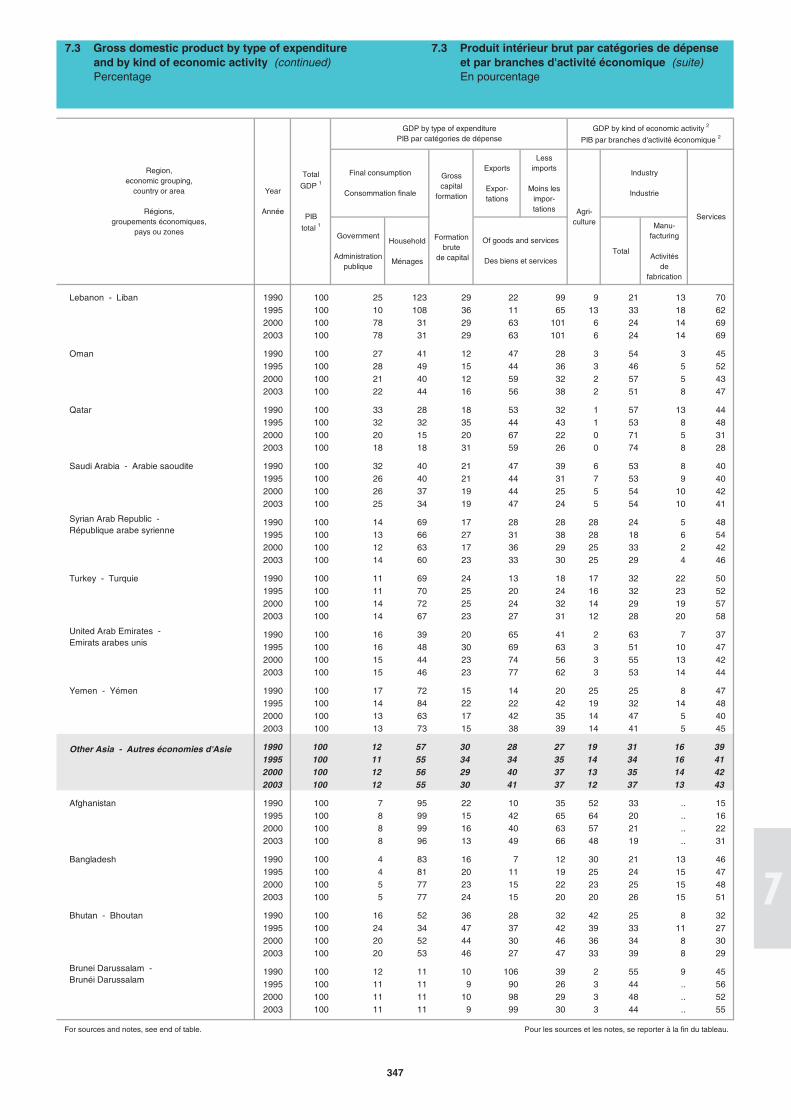
Exports
Expor-tations
Less imports
Moins les impor-tations
Government
Administrationpublique
Household
MénagesTotal
Manu-facturing
Activitésde
fabrication
Lebanon - Liban 1990 100 25 123 29 22 99 9 21 13 701995 100 10 108 36 11 65 13 33 18 622000 100 78 31 29 63 101 6 24 14 692003 100 78 31 29 63 101 6 24 14 69
Oman 1990 100 27 41 12 47 28 3 54 3 451995 100 28 49 15 44 36 3 46 5 522000 100 21 40 12 59 32 2 57 5 432003 100 22 44 16 56 38 2 51 8 47
Qatar 1990 100 33 28 18 53 32 1 57 13 441995 100 32 32 35 44 43 1 53 8 482000 100 20 15 20 67 22 0 71 5 312003 100 18 18 31 59 26 0 74 8 28
Saudi Arabia - Arabie saoudite 1990 100 32 40 21 47 39 6 53 8 401995 100 26 40 21 44 31 7 53 9 402000 100 26 37 19 44 25 5 54 10 422003 100 25 34 19 47 24 5 54 10 41
1990 100 14 69 17 28 28 28 24 5 481995 100 13 66 27 31 38 28 18 6 542000 100 12 63 17 36 29 25 33 2 422003 100 14 60 23 33 30 25 29 4 46
Turkey - Turquie 1990 100 11 69 24 13 18 17 32 22 501995 100 11 70 25 20 24 16 32 23 522000 100 14 72 25 24 32 14 29 19 572003 100 14 67 23 27 31 12 28 20 58
1990 100 16 39 20 65 41 2 63 7 371995 100 16 48 30 69 63 3 51 10 472000 100 15 44 23 74 56 3 55 13 422003 100 15 46 23 77 62 3 53 14 44
Yemen - Yémen 1990 100 17 72 15 14 20 25 25 8 471995 100 14 84 22 22 42 19 32 14 482000 100 13 63 17 42 35 14 47 5 402003 100 13 73 15 38 39 14 41 5 45
1990 100 12 57 30 28 27 19 31 16 391995 100 11 55 34 34 35 14 34 16 412000 100 12 56 29 40 37 13 35 14 422003 100 12 55 30 41 37 12 37 13 43
Afghanistan 1990 100 7 95 22 10 35 52 33 .. 151995 100 8 99 15 42 65 64 20 .. 162000 100 8 99 16 40 63 57 21 .. 222003 100 8 96 13 49 66 48 19 .. 31
Bangladesh 1990 100 4 83 16 7 12 30 21 13 461995 100 4 81 20 11 19 25 24 15 472000 100 5 77 23 15 22 23 25 15 482003 100 5 77 24 15 20 20 26 15 51
Bhutan - Bhoutan 1990 100 16 52 36 28 32 42 25 8 321995 100 24 34 47 37 42 39 33 11 272000 100 20 52 44 30 46 36 34 8 302003 100 20 53 46 27 47 33 39 8 29
1990 100 12 11 10 106 39 2 55 9 451995 100 11 11 9 90 26 3 44 .. 562000 100 11 11 10 98 29 3 48 .. 522003 100 11 11 9 99 30 3 44 .. 55
For sources and notes, see end of table. Pour les sources et les notes, se reporter à la fin du tableau.
Syrian Arab Republic - République arabe syrienne
Brunei Darussalam - Brunéi Darussalam
Other Asia - Autres économies d'Asie
Total
GDP 1
PIB
total 1
Of goods and services
Des biens et services
7.3 Produit intérieur brut par catégories de dépense et par branches d'activité économique (suite) En pourcentage
GDP by kind of economic activity 2
PIB par branches d'activité économique 2
Gross capital
formation
Formation brute
de capital
Agri-culture
Industry
Industrie
Services
Final consumption
Consommation finale
7.3 Gross domestic product by type of expenditure and by kind of economic activity (continued) Percentage
Region,economic grouping,
country or area
Régions,groupements économiques,
pays ou zones
Year
Année
GDP by type of expenditurePIB par catégories de dépense
United Arab Emirates - Emirats arabes unis
347
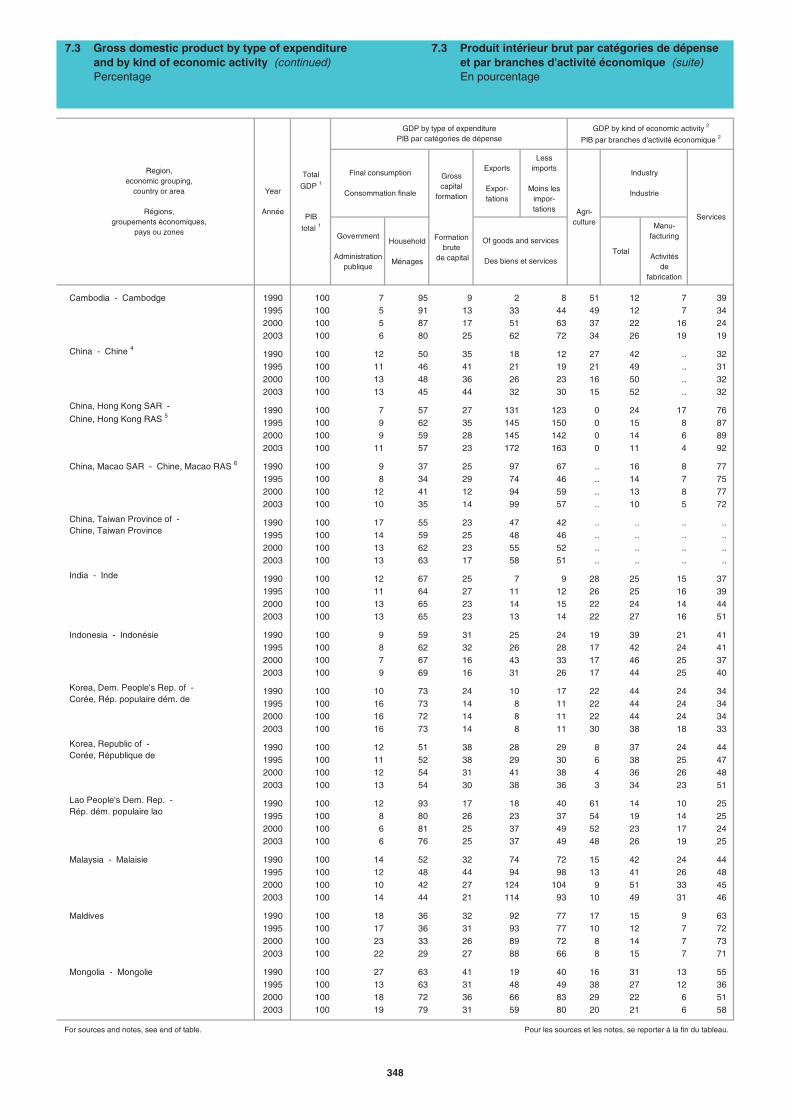
Exports
Expor-tations
Less imports
Moins les impor-tations
Government
Administrationpublique
Household
MénagesTotal
Manu-facturing
Activitésde
fabrication
Cambodia - Cambodge 1990 100 7 95 9 2 8 51 12 7 391995 100 5 91 13 33 44 49 12 7 342000 100 5 87 17 51 63 37 22 16 242003 100 6 80 25 62 72 34 26 19 19
China - Chine 4 1990 100 12 50 35 18 12 27 42 .. 321995 100 11 46 41 21 19 21 49 .. 312000 100 13 48 36 26 23 16 50 .. 322003 100 13 45 44 32 30 15 52 .. 32
1990 100 7 57 27 131 123 0 24 17 761995 100 9 62 35 145 150 0 15 8 872000 100 9 59 28 145 142 0 14 6 892003 100 11 57 23 172 163 0 11 4 92
China, Macao SAR - Chine, Macao RAS 6 1990 100 9 37 25 97 67 .. 16 8 771995 100 8 34 29 74 46 .. 14 7 752000 100 12 41 12 94 59 .. 13 8 772003 100 10 35 14 99 57 .. 10 5 72
1990 100 17 55 23 47 42 .. .. .. ..1995 100 14 59 25 48 46 .. .. .. ..2000 100 13 62 23 55 52 .. .. .. ..2003 100 13 63 17 58 51 .. .. .. ..
India - Inde 1990 100 12 67 25 7 9 28 25 15 371995 100 11 64 27 11 12 26 25 16 392000 100 13 65 23 14 15 22 24 14 442003 100 13 65 23 13 14 22 27 16 51
Indonesia - Indonésie 1990 100 9 59 31 25 24 19 39 21 411995 100 8 62 32 26 28 17 42 24 412000 100 7 67 16 43 33 17 46 25 372003 100 9 69 16 31 26 17 44 25 40
1990 100 10 73 24 10 17 22 44 24 341995 100 16 73 14 8 11 22 44 24 342000 100 16 72 14 8 11 22 44 24 342003 100 16 73 14 8 11 30 38 18 33
1990 100 12 51 38 28 29 8 37 24 441995 100 11 52 38 29 30 6 38 25 472000 100 12 54 31 41 38 4 36 26 482003 100 13 54 30 38 36 3 34 23 51
1990 100 12 93 17 18 40 61 14 10 251995 100 8 80 26 23 37 54 19 14 252000 100 6 81 25 37 49 52 23 17 242003 100 6 76 25 37 49 48 26 19 25
Malaysia - Malaisie 1990 100 14 52 32 74 72 15 42 24 441995 100 12 48 44 94 98 13 41 26 482000 100 10 42 27 124 104 9 51 33 452003 100 14 44 21 114 93 10 49 31 46
Maldives 1990 100 18 36 32 92 77 17 15 9 631995 100 17 36 31 93 77 10 12 7 722000 100 23 33 26 89 72 8 14 7 732003 100 22 29 27 88 66 8 15 7 71
Mongolia - Mongolie 1990 100 27 63 41 19 40 16 31 13 551995 100 13 63 31 48 49 38 27 12 362000 100 18 72 36 66 83 29 22 6 512003 100 19 79 31 59 80 20 21 6 58
For sources and notes, see end of table. Pour les sources et les notes, se reporter à la fin du tableau.
China, Taiwan Province of - Chine, Taiwan Province
Lao People's Dem. Rep. - Rép. dém. populaire lao
Korea, Dem. People's Rep. of - Corée, Rép. populaire dém. de
Korea, Republic of - Corée, République de
GDP by kind of economic activity 2
PIB par branches d'activité économique 2
Services
Of goods and services
Des biens et services
Final consumption
Consommation finale
Gross capital
formation
Formation brute
de capital
Agri-culture
7.3 Produit intérieur brut par catégories de dépense et par branches d'activité économique (suite) En pourcentage
Industry
Industrie
7.3 Gross domestic product by type of expenditure and by kind of economic activity (continued) Percentage
Region,economic grouping,
country or area
Régions,groupements économiques,
pays ou zones
Year
Année
China, Hong Kong SAR -
Chine, Hong Kong RAS 5
Total
GDP 1
PIB
total 1
GDP by type of expenditurePIB par catégories de dépense
348
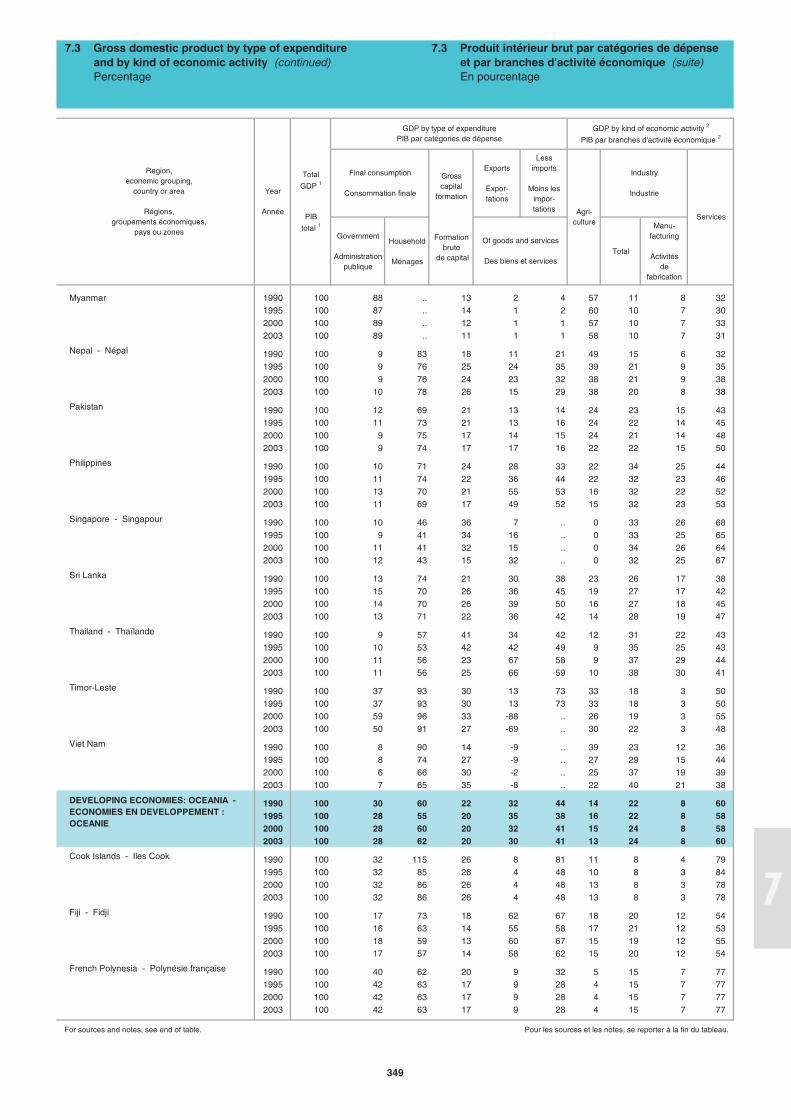
Exports
Expor-tations
Less imports
Moins les impor-tations
Government
Administrationpublique
Household
MénagesTotal
Manu-facturing
Activitésde
fabrication
Myanmar 1990 100 88 .. 13 2 4 57 11 8 321995 100 87 .. 14 1 2 60 10 7 302000 100 89 .. 12 1 1 57 10 7 332003 100 89 .. 11 1 1 58 10 7 31
Nepal - Népal 1990 100 9 83 18 11 21 49 15 6 321995 100 9 76 25 24 35 39 21 9 352000 100 9 76 24 23 32 38 21 9 382003 100 10 78 26 15 29 38 20 8 38
Pakistan 1990 100 12 69 21 13 14 24 23 15 431995 100 11 73 21 13 16 24 22 14 452000 100 9 75 17 14 15 24 21 14 482003 100 9 74 17 17 16 22 22 15 50
Philippines 1990 100 10 71 24 28 33 22 34 25 441995 100 11 74 22 36 44 22 32 23 462000 100 13 70 21 55 53 16 32 22 522003 100 11 69 17 49 52 15 32 23 53
Singapore - Singapour 1990 100 10 46 36 7 .. 0 33 26 681995 100 9 41 34 16 .. 0 33 25 652000 100 11 41 32 15 .. 0 34 26 642003 100 12 43 15 32 .. 0 32 25 67
Sri Lanka 1990 100 13 74 21 30 38 23 26 17 381995 100 15 70 26 36 45 19 27 17 422000 100 14 70 26 39 50 16 27 18 452003 100 13 71 22 36 42 14 28 19 47
Thailand - Thaïlande 1990 100 9 57 41 34 42 12 31 22 431995 100 10 53 42 42 49 9 35 25 432000 100 11 56 23 67 58 9 37 29 442003 100 11 56 25 66 59 10 38 30 41
Timor-Leste 1990 100 37 93 30 13 73 33 18 3 501995 100 37 93 30 13 73 33 18 3 502000 100 59 96 33 -88 .. 26 19 3 552003 100 50 91 27 -69 .. 30 22 3 48
Viet Nam 1990 100 8 90 14 -9 .. 39 23 12 361995 100 8 74 27 -9 .. 27 29 15 442000 100 6 66 30 -2 .. 25 37 19 392003 100 7 65 35 -8 .. 22 40 21 38
1990 100 30 60 22 32 44 14 22 8 601995 100 28 55 20 35 38 16 22 8 582000 100 28 60 20 32 41 15 24 8 582003 100 28 62 20 30 41 13 24 8 60
Cook Islands - Iles Cook 1990 100 32 115 26 8 81 11 8 4 791995 100 32 85 26 4 48 10 8 3 842000 100 32 86 26 4 48 13 8 3 782003 100 32 86 26 4 48 13 8 3 78
Fiji - Fidji 1990 100 17 73 18 62 67 18 20 12 541995 100 16 63 14 55 58 17 21 12 532000 100 18 59 13 60 67 15 19 12 552003 100 17 57 14 58 62 15 20 12 54
French Polynesia - Polynésie française 1990 100 40 62 20 9 32 5 15 7 771995 100 42 63 17 9 28 4 15 7 772000 100 42 63 17 9 28 4 15 7 772003 100 42 63 17 9 28 4 15 7 77
For sources and notes, see end of table. Pour les sources et les notes, se reporter à la fin du tableau.
Gross capital
formation
Formation brute
de capital
Of goods and services
Des biens et services
Industry
Industrie
Agri-culture
GDP by kind of economic activity 2
PIB par branches d'activité économique 2
DEVELOPING ECONOMIES: OCEANIA - ECONOMIES EN DEVELOPPEMENT : OCEANIE
Year
Année
Total
GDP 1
PIB
total 1
7.3 Gross domestic product by type of expenditure and by kind of economic activity (continued) Percentage
Final consumption
Consommation finale
7.3 Produit intérieur brut par catégories de dépense et par branches d'activité économique (suite) En pourcentage
Services
GDP by type of expenditurePIB par catégories de dépense
Region,economic grouping,
country or area
Régions,groupements économiques,
pays ou zones
349
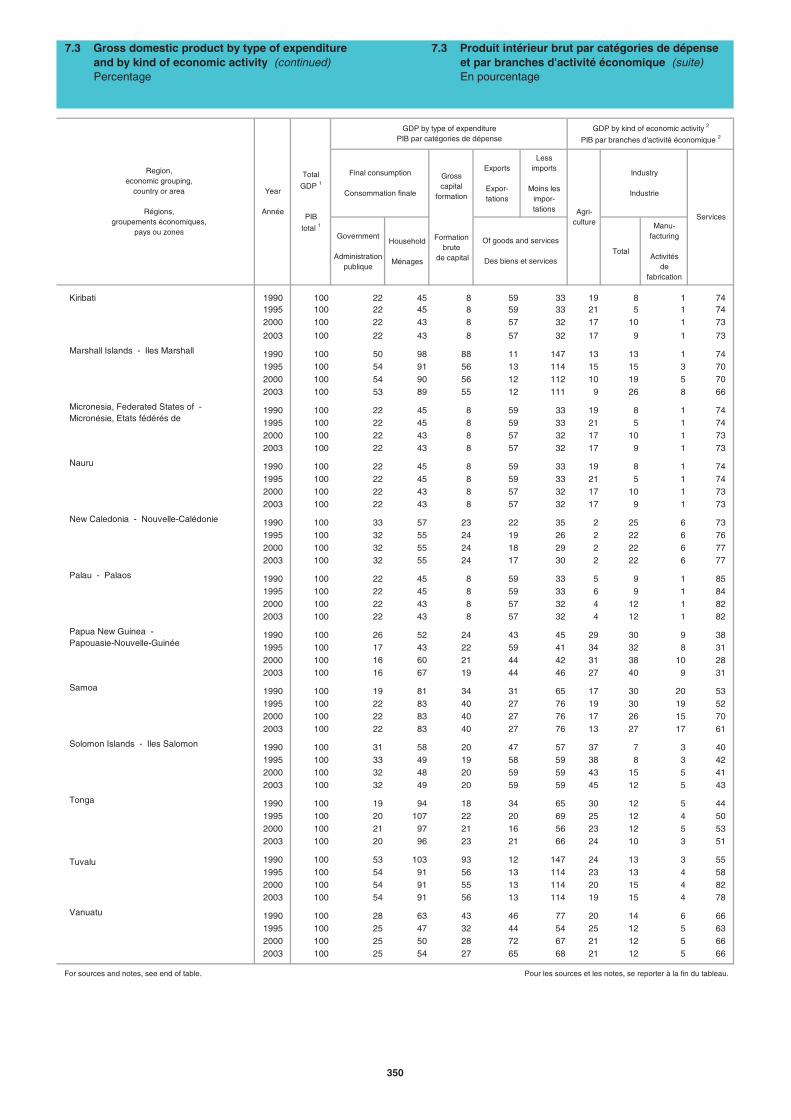
Exports
Expor-tations
Less imports
Moins les impor-tations
Government
Administrationpublique
Household
MénagesTotal
Manu-facturing
Activitésde
fabrication
Kiribati 1990 100 22 45 8 59 33 19 8 1 741995 100 22 45 8 59 33 21 5 1 742000 100 22 43 8 57 32 17 10 1 73
2003 100 22 43 8 57 32 17 9 1 73
Marshall Islands - Iles Marshall 1990 100 50 98 88 11 147 13 13 1 741995 100 54 91 56 13 114 15 15 3 702000 100 54 90 56 12 112 10 19 5 702003 100 53 89 55 12 111 9 26 8 66
1990 100 22 45 8 59 33 19 8 1 741995 100 22 45 8 59 33 21 5 1 742000 100 22 43 8 57 32 17 10 1 732003 100 22 43 8 57 32 17 9 1 73
Nauru 1990 100 22 45 8 59 33 19 8 1 741995 100 22 45 8 59 33 21 5 1 742000 100 22 43 8 57 32 17 10 1 732003 100 22 43 8 57 32 17 9 1 73
New Caledonia - Nouvelle-Calédonie 1990 100 33 57 23 22 35 2 25 6 731995 100 32 55 24 19 26 2 22 6 762000 100 32 55 24 18 29 2 22 6 772003 100 32 55 24 17 30 2 22 6 77
Palau - Palaos 1990 100 22 45 8 59 33 5 9 1 851995 100 22 45 8 59 33 6 9 1 842000 100 22 43 8 57 32 4 12 1 822003 100 22 43 8 57 32 4 12 1 82
1990 100 26 52 24 43 45 29 30 9 381995 100 17 43 22 59 41 34 32 8 312000 100 16 60 21 44 42 31 38 10 282003 100 16 67 19 44 46 27 40 9 31
Samoa 1990 100 19 81 34 31 65 17 30 20 531995 100 22 83 40 27 76 19 30 19 522000 100 22 83 40 27 76 17 26 15 702003 100 22 83 40 27 76 13 27 17 61
Solomon Islands - Iles Salomon 1990 100 31 58 20 47 57 37 7 3 401995 100 33 49 19 58 59 38 8 3 422000 100 32 48 20 59 59 43 15 5 412003 100 32 49 20 59 59 45 12 5 43
Tonga 1990 100 19 94 18 34 65 30 12 5 441995 100 20 107 22 20 69 25 12 4 502000 100 21 97 21 16 56 23 12 5 532003 100 20 96 23 21 66 24 10 3 51
1990 100 53 103 93 12 147 24 13 3 551995 100 54 91 56 13 114 23 13 4 582000 100 54 91 55 13 114 20 15 4 822003 100 54 91 56 13 114 19 15 4 78
Vanuatu 1990 100 28 63 43 46 77 20 14 6 661995 100 25 47 32 44 54 25 12 5 632000 100 25 50 28 72 67 21 12 5 662003 100 25 54 27 65 68 21 12 5 66
For sources and notes, see end of table. Pour les sources et les notes, se reporter à la fin du tableau.
Agri-culture
Industry
Industrie
GDP by type of expenditurePIB par catégories de dépense
Final consumption
Consommation finale
GDP by kind of economic activity 2
PIB par branches d'activité économique 2
7.3 Gross domestic product by type of expenditure and by kind of economic activity (continued) Percentage
7.3 Produit intérieur brut par catégories de dépense et par branches d'activité économique (suite) En pourcentage
Services
Of goods and services
Des biens et services
Gross capital
formation
Formation brute
de capital
Micronesia, Federated States of - Micronésie, Etats fédérés de
Region,economic grouping,
country or area
Régions,groupements économiques,
pays ou zones
Year
Année
Total
GDP 1
PIB
total 1
Papua New Guinea - Papouasie-Nouvelle-Guinée
Tuvalu
350
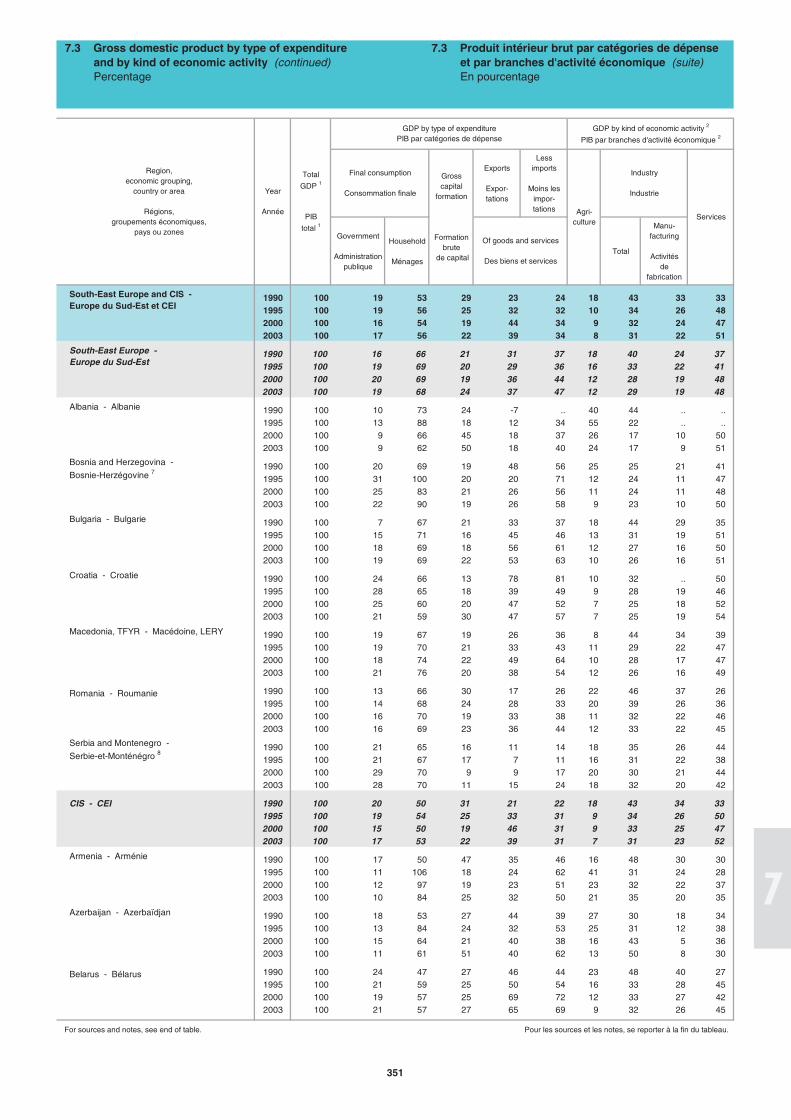
Exports
Expor-tations
Less imports
Moins les impor-tations
Government
Administrationpublique
Household
MénagesTotal
Manu-facturing
Activitésde
fabrication
1990 100 19 53 29 23 24 18 43 33 331995 100 19 56 25 32 32 10 34 26 482000 100 16 54 19 44 34 9 32 24 472003 100 17 56 22 39 34 8 31 22 51
1990 100 16 66 21 31 37 18 40 24 371995 100 19 69 20 29 36 16 33 22 412000 100 20 69 19 36 44 12 28 19 482003 100 19 68 24 37 47 12 29 19 48
Albania - Albanie 1990 100 10 73 24 -7 .. 40 44 .. ..1995 100 13 88 18 12 34 55 22 .. ..2000 100 9 66 45 18 37 26 17 10 502003 100 9 62 50 18 40 24 17 9 51
1990 100 20 69 19 48 56 25 25 21 411995 100 31 100 20 20 71 12 24 11 472000 100 25 83 21 26 56 11 24 11 482003 100 22 90 19 26 58 9 23 10 50
Bulgaria - Bulgarie 1990 100 7 67 21 33 37 18 44 29 351995 100 15 71 16 45 46 13 31 19 512000 100 18 69 18 56 61 12 27 16 502003 100 19 69 22 53 63 10 26 16 51
Croatia - Croatie 1990 100 24 66 13 78 81 10 32 .. 501995 100 28 65 18 39 49 9 28 19 462000 100 25 60 20 47 52 7 25 18 522003 100 21 59 30 47 57 7 25 19 54
Macedonia, TFYR - Macédoine, LERY 1990 100 19 67 19 26 36 8 44 34 391995 100 19 70 21 33 43 11 29 22 472000 100 18 74 22 49 64 10 28 17 472003 100 21 76 20 38 54 12 26 16 49
1990 100 13 66 30 17 26 22 46 37 261995 100 14 68 24 28 33 20 39 26 362000 100 16 70 19 33 38 11 32 22 462003 100 16 69 23 36 44 12 33 22 45
1990 100 21 65 16 11 14 18 35 26 441995 100 21 67 17 7 11 16 31 22 382000 100 29 70 9 9 17 20 30 21 442003 100 28 70 11 15 24 18 32 20 42
CIS - CEI 1990 100 20 50 31 21 22 18 43 34 331995 100 19 54 25 33 31 9 34 26 502000 100 15 50 19 46 31 9 33 25 472003 100 17 53 22 39 31 7 31 23 52
Armenia - Arménie 1990 100 17 50 47 35 46 16 48 30 301995 100 11 106 18 24 62 41 31 24 282000 100 12 97 19 23 51 23 32 22 372003 100 10 84 25 32 50 21 35 20 35
Azerbaijan - Azerbaïdjan 1990 100 18 53 27 44 39 27 30 18 341995 100 13 84 24 32 53 25 31 12 382000 100 15 64 21 40 38 16 43 5 362003 100 11 61 51 40 62 13 50 8 30
1990 100 24 47 27 46 44 23 48 40 271995 100 21 59 25 50 54 16 33 28 452000 100 19 57 25 69 72 12 33 27 422003 100 21 57 27 65 69 9 32 26 45
For sources and notes, see end of table. Pour les sources et les notes, se reporter à la fin du tableau.
Bosnia and Herzegovina -
Bosnie-Herzégovine 7
Romania - Roumanie
Belarus - Bélarus
Serbia and Montenegro -
Serbie-et-Monténégro 8
Total
GDP 1
PIB
total 1
GDP by type of expenditurePIB par catégories de dépense
Of goods and services
Des biens et services
Gross capital
formation
Formation brute
de capital
Region,economic grouping,
country or area
Régions,groupements économiques,
pays ou zones
7.3 Gross domestic product by type of expenditure and by kind of economic activity (continued) Percentage
Final consumption
Consommation finale
7.3 Produit intérieur brut par catégories de dépense et par branches d'activité économique (suite) En pourcentage
Year
Année
GDP by kind of economic activity 2
PIB par branches d'activité économique 2
Agri-culture
Industry
Industrie
Services
South-East Europe and CIS - Europe du Sud-Est et CEI
South-East Europe - Europe du Sud-Est
351
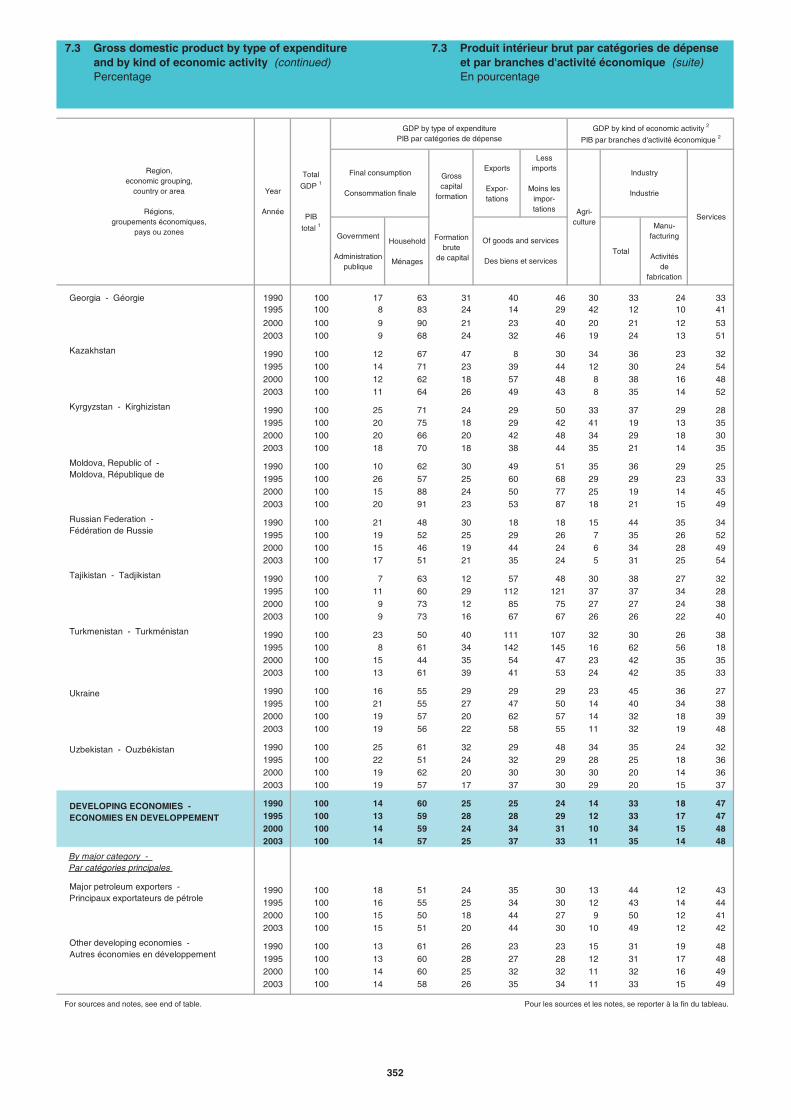
Exports
Expor-tations
Less imports
Moins les impor-tations
Government
Administrationpublique
Household
MénagesTotal
Manu-facturing
Activitésde
fabrication
Georgia - Géorgie 1990 100 17 63 31 40 46 30 33 24 331995 100 8 83 24 14 29 42 12 10 41
2000 100 9 90 21 23 40 20 21 12 532003 100 9 68 24 32 46 19 24 13 51
Kazakhstan 1990 100 12 67 47 8 30 34 36 23 321995 100 14 71 23 39 44 12 30 24 542000 100 12 62 18 57 48 8 38 16 482003 100 11 64 26 49 43 8 35 14 52
Kyrgyzstan - Kirghizistan 1990 100 25 71 24 29 50 33 37 29 281995 100 20 75 18 29 42 41 19 13 352000 100 20 66 20 42 48 34 29 18 302003 100 18 70 18 38 44 35 21 14 35
1990 100 10 62 30 49 51 35 36 29 251995 100 26 57 25 60 68 29 29 23 332000 100 15 88 24 50 77 25 19 14 452003 100 20 91 23 53 87 18 21 15 49
1990 100 21 48 30 18 18 15 44 35 341995 100 19 52 25 29 26 7 35 26 522000 100 15 46 19 44 24 6 34 28 492003 100 17 51 21 35 24 5 31 25 54
Tajikistan - Tadjikistan 1990 100 7 63 12 57 48 30 38 27 321995 100 11 60 29 112 121 37 37 34 282000 100 9 73 12 85 75 27 27 24 382003 100 9 73 16 67 67 26 26 22 40
Turkmenistan - Turkménistan 1990 100 23 50 40 111 107 32 30 26 381995 100 8 61 34 142 145 16 62 56 182000 100 15 44 35 54 47 23 42 35 352003 100 13 61 39 41 53 24 42 35 33
1990 100 16 55 29 29 29 23 45 36 271995 100 21 55 27 47 50 14 40 34 382000 100 19 57 20 62 57 14 32 18 392003 100 19 56 22 58 55 11 32 19 48
1990 100 25 61 32 29 48 34 35 24 321995 100 22 51 24 32 29 28 25 18 362000 100 19 62 20 30 30 30 20 14 362003 100 19 57 17 37 30 29 20 15 37
1990 100 14 60 25 25 24 14 33 18 471995 100 13 59 28 28 29 12 33 17 472000 100 14 59 24 34 31 10 34 15 482003 100 14 57 25 37 33 11 35 14 48
By major category - Par catégories principales
1990 100 18 51 24 35 30 13 44 12 431995 100 16 55 25 34 30 12 43 14 442000 100 15 50 18 44 27 9 50 12 412003 100 15 51 20 44 30 10 49 12 42
1990 100 13 61 26 23 23 15 31 19 481995 100 13 60 28 27 28 12 31 17 482000 100 14 60 25 32 32 11 32 16 492003 100 14 58 26 35 34 11 33 15 49
For sources and notes, see end of table. Pour les sources et les notes, se reporter à la fin du tableau.
Services
Of goods and services
Des biens et services
Ukraine
7.3 Produit intérieur brut par catégories de dépense et par branches d'activité économique (suite) En pourcentage
7.3 Gross domestic product by type of expenditure and by kind of economic activity (continued) Percentage
Region,economic grouping,
country or area
Régions,groupements économiques,
pays ou zones
Moldova, Republic of - Moldova, République de
Russian Federation - Fédération de Russie
Other developing economies - Autres économies en développement
Major petroleum exporters - Principaux exportateurs de pétrole
DEVELOPING ECONOMIES - ECONOMIES EN DEVELOPPEMENT
Uzbekistan - Ouzbékistan
GDP by kind of economic activity 2
PIB par branches d'activité économique 2
Final consumption
Consommation finale
Gross capital
formation
Formation brute
de capital
Agri-culture
Industry
Industrie
Total
GDP 1
PIB
total 1
GDP by type of expenditurePIB par catégories de dépense
Year
Année
352
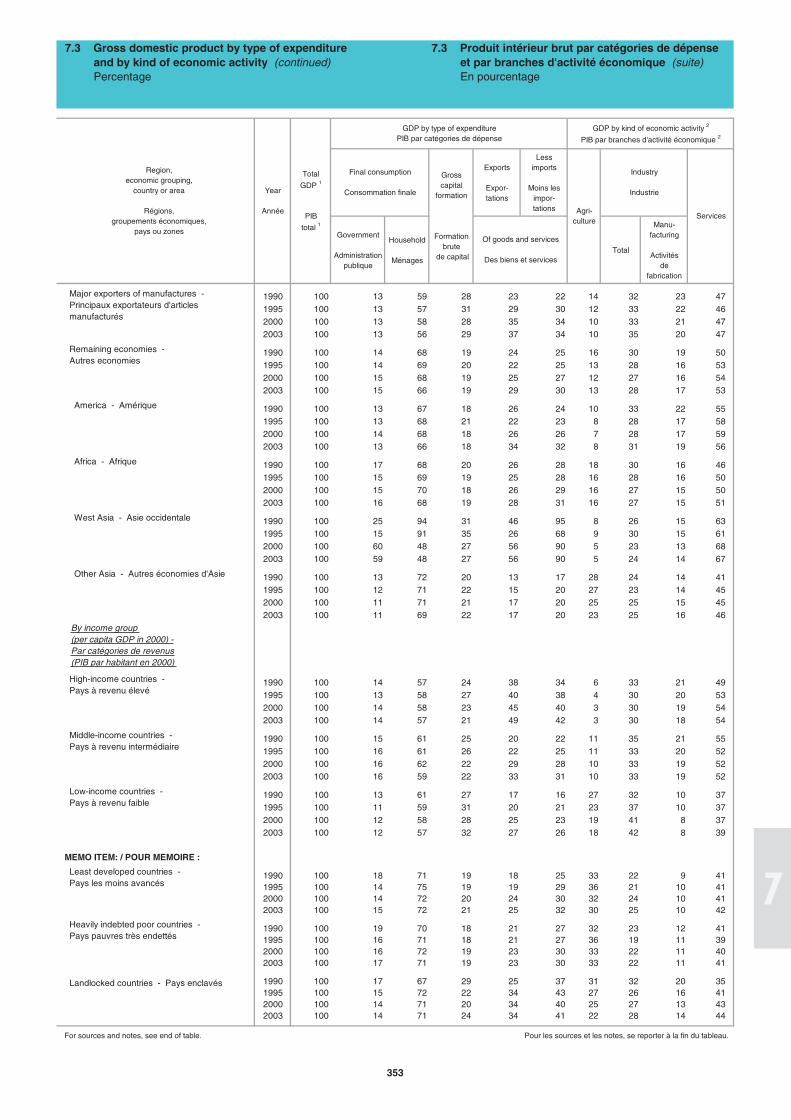
Exports
Expor-tations
Less imports
Moins les impor-tations
Government
Administrationpublique
Household
MénagesTotal
Manu-facturing
Activitésde
fabrication
1990 100 13 59 28 23 22 14 32 23 471995 100 13 57 31 29 30 12 33 22 462000 100 13 58 28 35 34 10 33 21 472003 100 13 56 29 37 34 10 35 20 47
1990 100 14 68 19 24 25 16 30 19 501995 100 14 69 20 22 25 13 28 16 532000 100 15 68 19 25 27 12 27 16 542003 100 15 66 19 29 30 13 28 17 53
America - Amérique 1990 100 13 67 18 26 24 10 33 22 551995 100 13 68 21 22 23 8 28 17 582000 100 14 68 18 26 26 7 28 17 592003 100 13 66 18 34 32 8 31 19 56
Africa - Afrique 1990 100 17 68 20 26 28 18 30 16 461995 100 15 69 19 25 28 16 28 16 502000 100 15 70 18 26 29 16 27 15 502003 100 16 68 19 28 31 16 27 15 51
West Asia - Asie occidentale 1990 100 25 94 31 46 95 8 26 15 631995 100 15 91 35 26 68 9 30 15 612000 100 60 48 27 56 90 5 23 13 682003 100 59 48 27 56 90 5 24 14 67
Other Asia - Autres économies d'Asie 1990 100 13 72 20 13 17 28 24 14 411995 100 12 71 22 15 20 27 23 14 452000 100 11 71 21 17 20 25 25 15 452003 100 11 69 22 17 20 23 25 16 46
By income group (per capita GDP in 2000) - Par catégories de revenus (PIB par habitant en 2000)
1990 100 14 57 24 38 34 6 33 21 491995 100 13 58 27 40 38 4 30 20 532000 100 14 58 23 45 40 3 30 19 542003 100 14 57 21 49 42 3 30 18 54
1990 100 15 61 25 20 22 11 35 21 551995 100 16 61 26 22 25 11 33 20 522000 100 16 62 22 29 28 10 33 19 522003 100 16 59 22 33 31 10 33 19 52
1990 100 13 61 27 17 16 27 32 10 371995 100 11 59 31 20 21 23 37 10 372000 100 12 58 28 25 23 19 41 8 372003 100 12 57 32 27 26 18 42 8 39
MEMO ITEM: / POUR MEMOIRE :
1990 100 18 71 19 18 25 33 22 9 411995 100 14 75 19 19 29 36 21 10 412000 100 14 72 20 24 30 32 24 10 412003 100 15 72 21 25 32 30 25 10 42
1990 100 19 70 18 21 27 32 23 12 411995 100 16 71 18 21 27 36 19 11 392000 100 16 72 19 23 30 33 22 11 402003 100 17 71 19 23 30 33 22 11 41
1990 100 17 67 29 25 37 31 32 20 351995 100 15 72 22 34 43 27 26 16 412000 100 14 71 20 34 40 25 27 13 432003 100 14 71 24 34 41 22 28 14 44
For sources and notes, see end of table. Pour les sources et les notes, se reporter à la fin du tableau.
Middle-income countries - Pays à revenu intermédiaire
Major exporters of manufactures - Principaux exportateurs d'articles manufacturés
Region,economic grouping,
country or area
Régions,groupements économiques,
pays ou zones
High-income countries - Pays à revenu élevé
Low-income countries - Pays à revenu faible
7.3 Produit intérieur brut par catégories de dépense et par branches d'activité économique (suite) En pourcentage
GDP by kind of economic activity 2
PIB par branches d'activité économique 2
Services
Industry
Industrie
Agri-culture
Year
Année
Total
GDP 1
PIB
total 1
GDP by type of expenditurePIB par catégories de dépense
Of goods and services
Des biens et services
Final consumption
Consommation finale
Gross capital
formation
Formation brute
de capital
Remaining economies - Autres economies
7.3 Gross domestic product by type of expenditure and by kind of economic activity (continued) Percentage
Landlocked countries - Pays enclavés
Least developed countries - Pays les moins avancés
Heavily indebted poor countries - Pays pauvres très endettés
353
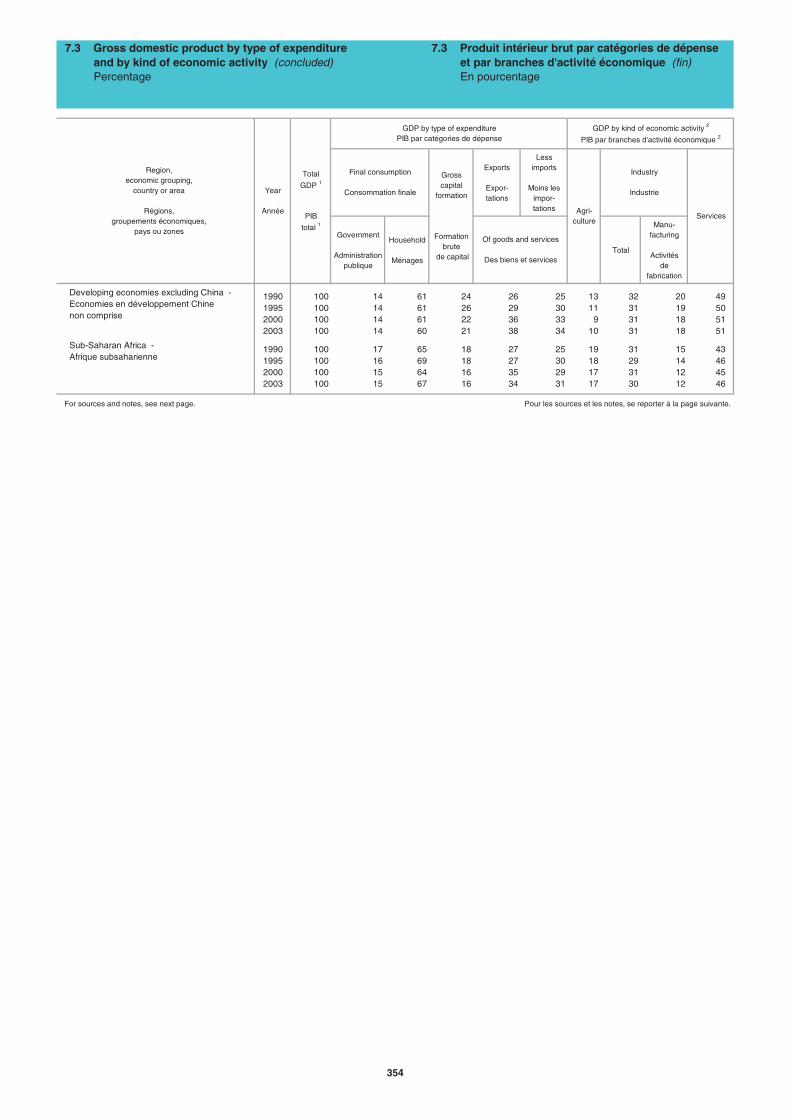
Exports
Expor-tations
Less imports
Moins les impor-tations
Government
Administrationpublique
Household
MénagesTotal
Manu-facturing
Activitésde
fabrication
1990 100 14 61 24 26 25 13 32 20 491995 100 14 61 26 29 30 11 31 19 502000 100 14 61 22 36 33 9 31 18 512003 100 14 60 21 38 34 10 31 18 51
1990 100 17 65 18 27 25 19 31 15 431995 100 16 69 18 27 30 18 29 14 462000 100 15 64 16 35 29 17 31 12 452003 100 15 67 16 34 31 17 30 12 46
For sources and notes, see next page. Pour les sources et les notes, se reporter à la page suivante.
Sub-Saharan Africa - Afrique subsaharienne
Developing economies excluding China - Economies en développement Chine non comprise
Region,economic grouping,
country or area
Régions,groupements économiques,
pays ou zones
GDP by kind of economic activity 2
PIB par branches d'activité économique 2
Services
Of goods and services
Des biens et services
Industry
Industrie
Gross capital
formation
Formation brute
de capital
Agri-culture
Final consumption
Consommation finaleYear
Année
7.3 Gross domestic product by type of expenditure and by kind of economic activity (concluded) Percentage
Total
GDP 1
PIB
total 1
GDP by type of expenditurePIB par catégories de dépense
7.3 Produit intérieur brut par catégories de dépense et par branches d'activité économique (fin) En pourcentage
354
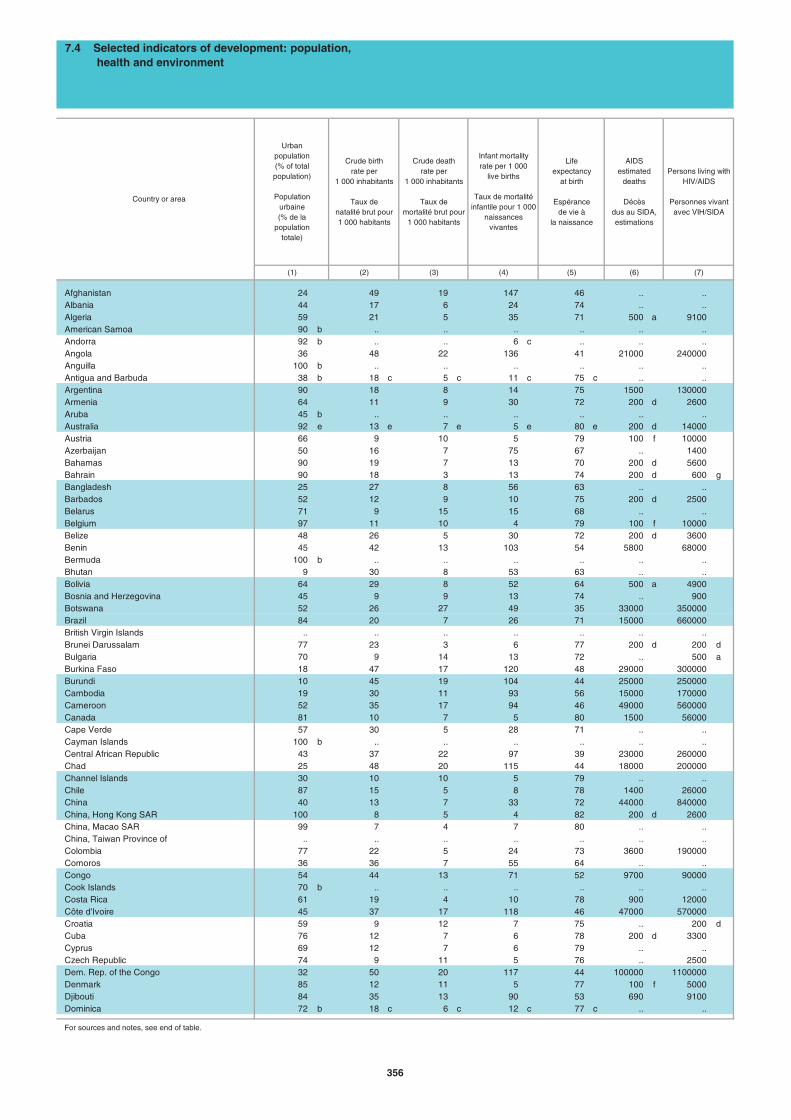
Afghanistan 24 49 19 147 46 .. ..Albania 44 17 6 24 74 .. ..Algeria 59 21 5 35 71 500 a 9100American Samoa 90 b .. .. .. .. .. ..Andorra 92 b .. .. 6 c .. .. ..Angola 36 48 22 136 41 21000 240000Anguilla 100 b .. .. .. .. .. ..Antigua and Barbuda 38 b 18 c 5 c 11 c 75 c .. ..Argentina 90 18 8 14 75 1500 130000Armenia 64 11 9 30 72 200 d 2600Aruba 45 b .. .. .. .. .. ..Australia 92 e 13 e 7 e 5 e 80 e 200 d 14000Austria 66 9 10 5 79 100 f 10000Azerbaijan 50 16 7 75 67 .. 1400Bahamas 90 19 7 13 70 200 d 5600Bahrain 90 18 3 13 74 200 d 600 gBangladesh 25 27 8 56 63 .. ..Barbados 52 12 9 10 75 200 d 2500Belarus 71 9 15 15 68 .. ..Belgium 97 11 10 4 79 100 f 10000Belize 48 26 5 30 72 200 d 3600Benin 45 42 13 103 54 5800 68000Bermuda 100 b .. .. .. .. .. ..Bhutan 9 30 8 53 63 .. ..Bolivia 64 29 8 52 64 500 a 4900Bosnia and Herzegovina 45 9 9 13 74 .. 900Botswana 52 26 27 49 35 33000 350000Brazil 84 20 7 26 71 15000 660000British Virgin Islands .. .. .. .. .. .. ..Brunei Darussalam 77 23 3 6 77 200 d 200 dBulgaria 70 9 14 13 72 .. 500 aBurkina Faso 18 47 17 120 48 29000 300000Burundi 10 45 19 104 44 25000 250000Cambodia 19 30 11 93 56 15000 170000Cameroon 52 35 17 94 46 49000 560000Canada 81 10 7 5 80 1500 56000Cape Verde 57 30 5 28 71 .. ..Cayman Islands 100 b .. .. .. .. .. ..Central African Republic 43 37 22 97 39 23000 260000Chad 25 48 20 115 44 18000 200000Channel Islands 30 10 10 5 79 .. ..Chile 87 15 5 8 78 1400 26000China 40 13 7 33 72 44000 840000China, Hong Kong SAR 100 8 5 4 82 200 d 2600China, Macao SAR 99 7 4 7 80 .. ..China, Taiwan Province of .. .. .. .. .. .. ..Colombia 77 22 5 24 73 3600 190000Comoros 36 36 7 55 64 .. ..Congo 54 44 13 71 52 9700 90000Cook Islands 70 b .. .. .. .. .. ..Costa Rica 61 19 4 10 78 900 12000Côte d'Ivoire 45 37 17 118 46 47000 570000Croatia 59 9 12 7 75 .. 200 dCuba 76 12 7 6 78 200 d 3300Cyprus 69 12 7 6 79 .. ..Czech Republic 74 9 11 5 76 .. 2500Dem. Rep. of the Congo 32 50 20 117 44 100000 1100000Denmark 85 12 11 5 77 100 f 5000Djibouti 84 35 13 90 53 690 9100Dominica 72 b 18 c 6 c 12 c 77 c .. ..
For sources and notes, see end of table.
(6)
7.4 Selected indicators of development: population, health and environment
Country or area
(1) (2) (3) (4) (5)
Persons living with HIV/AIDS
Personnes vivant avec VIH/SIDA
Life expectancy
at birth
Espérance de vie à
la naissance
AIDS estimated
deaths
Décès dus au SIDA, estimations
(7)
Urban population(% of totalpopulation)
Populationurbaine (% de la
populationtotale)
Crude birthrate per
1 000 inhabitants
Taux de natalité brut pour 1 000 habitants
Crude deathrate per
1 000 inhabitants
Taux de mortalité brut pour
1 000 habitants
Infant mortalityrate per 1 000
live births
Taux de mortalitéinfantile pour 1 000
naissances vivantes
356
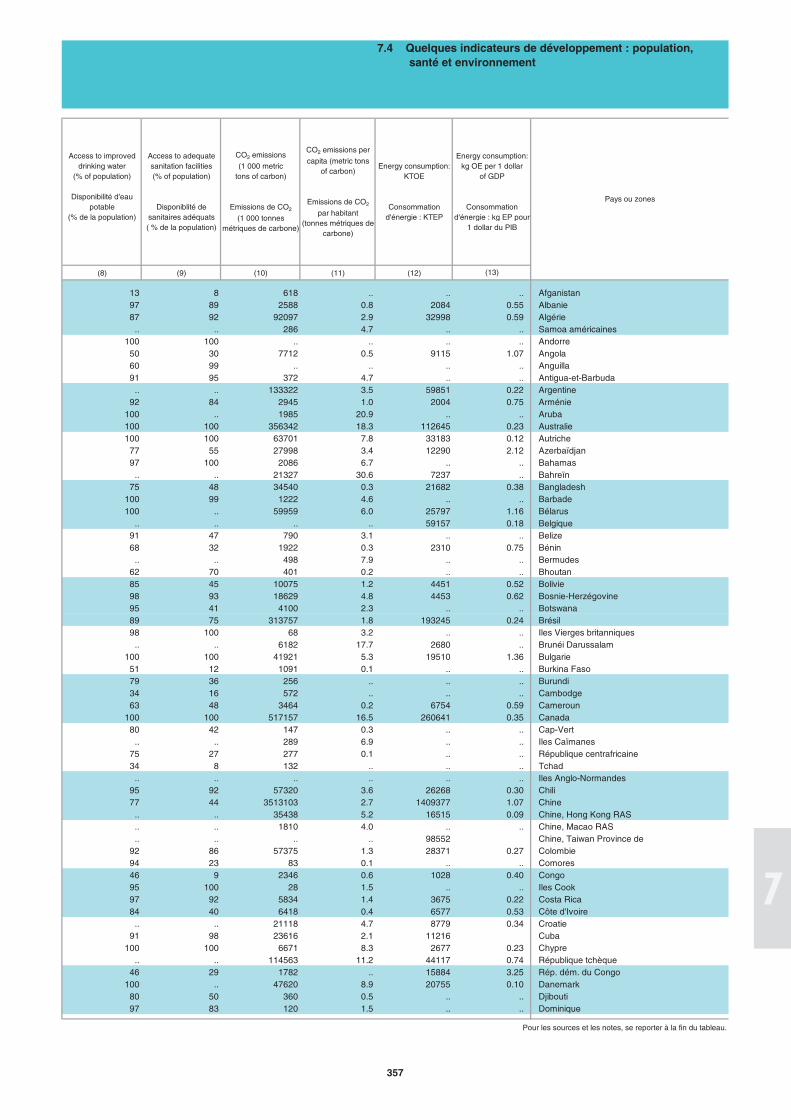
(8) (9) (10) (11) (12)
13 8 618 .. .. .. Afganistan97 89 2588 0.8 2084 0.55 Albanie87 92 92097 2.9 32998 0.59 Algérie
.. .. 286 4.7 .. .. Samoa américaines100 100 .. .. .. .. Andorre
50 30 7712 0.5 9115 1.07 Angola60 99 .. .. .. .. Anguilla91 95 372 4.7 .. .. Antigua-et-Barbuda
.. .. 133322 3.5 59851 0.22 Argentine92 84 2945 1.0 2004 0.75 Arménie
100 .. 1985 20.9 .. .. Aruba100 100 356342 18.3 112645 0.23 Australie100 100 63701 7.8 33183 0.12 Autriche
77 55 27998 3.4 12290 2.12 Azerbaïdjan97 100 2086 6.7 .. .. Bahamas
.. .. 21327 30.6 7237 .. Bahreïn75 48 34540 0.3 21682 0.38 Bangladesh
100 99 1222 4.6 .. .. Barbade100 .. 59959 6.0 25797 1.16 Bélarus
.. .. .. .. 59157 0.18 Belgique91 47 790 3.1 .. .. Belize68 32 1922 0.3 2310 0.75 Bénin
.. .. 498 7.9 .. .. Bermudes62 70 401 0.2 .. .. Bhoutan85 45 10075 1.2 4451 0.52 Bolivie98 93 18629 4.8 4453 0.62 Bosnie-Herzégovine95 41 4100 2.3 .. .. Botswana89 75 313757 1.8 193245 0.24 Brésil98 100 68 3.2 .. .. Iles Vierges britanniques
.. .. 6182 17.7 2680 .. Brunéi Darussalam100 100 41921 5.3 19510 1.36 Bulgarie
51 12 1091 0.1 .. .. Burkina Faso79 36 256 .. .. .. Burundi34 16 572 .. .. .. Cambodge63 48 3464 0.2 6754 0.59 Cameroun
100 100 517157 16.5 260641 0.35 Canada80 42 147 0.3 .. .. Cap-Vert
.. .. 289 6.9 .. .. Iles Caïmanes75 27 277 0.1 .. .. République centrafricaine34 8 132 .. .. .. Tchad
.. .. .. .. .. .. Iles Anglo-Normandes95 92 57320 3.6 26268 0.30 Chili77 44 3513103 2.7 1409377 1.07 Chine
.. .. 35438 5.2 16515 0.09 Chine, Hong Kong RAS
.. .. 1810 4.0 .. .. Chine, Macao RAS
.. .. .. .. 98552 Chine, Taiwan Province de92 86 57375 1.3 28371 0.27 Colombie94 23 83 0.1 .. .. Comores46 9 2346 0.6 1028 0.40 Congo95 100 28 1.5 .. .. Iles Cook97 92 5834 1.4 3675 0.22 Costa Rica84 40 6418 0.4 6577 0.53 Côte d'Ivoire
.. .. 21118 4.7 8779 0.34 Croatie91 98 23616 2.1 11216 Cuba
100 100 6671 8.3 2677 0.23 Chypre.. .. 114563 11.2 44117 0.74 République tchèque
46 29 1782 .. 15884 3.25 Rép. dém. du Congo100 .. 47620 8.9 20755 0.10 Danemark
80 50 360 0.5 .. .. Djibouti97 83 120 1.5 .. .. Dominique
7.4 Quelques indicateurs de développement : population, santé et environnement
(13)
Energy consumption: KTOE
Consommation d'énergie : KTEP
Energy consumption: kg OE per 1 dollar
of GDP
Consommation d'énergie : kg EP pour
1 dollar du PIB
Pays ou zones
Pour les sources et les notes, se reporter à la fin du tableau.
Access to adequate sanitation facilities (% of population)
Disponiblité de sanitaires adéquats ( % de la population)
Access to improved drinking water
(% of population)
Disponibilité d'eaupotable
(% de la population)
CO2 emissions
(1 000 metric tons of carbon)
Emissions de CO2
(1 000 tonnes métriques de carbone)
CO2 emissions per
capita (metric tons of carbon)
Emissions de CO2
par habitant (tonnes métriques de
carbone)
357
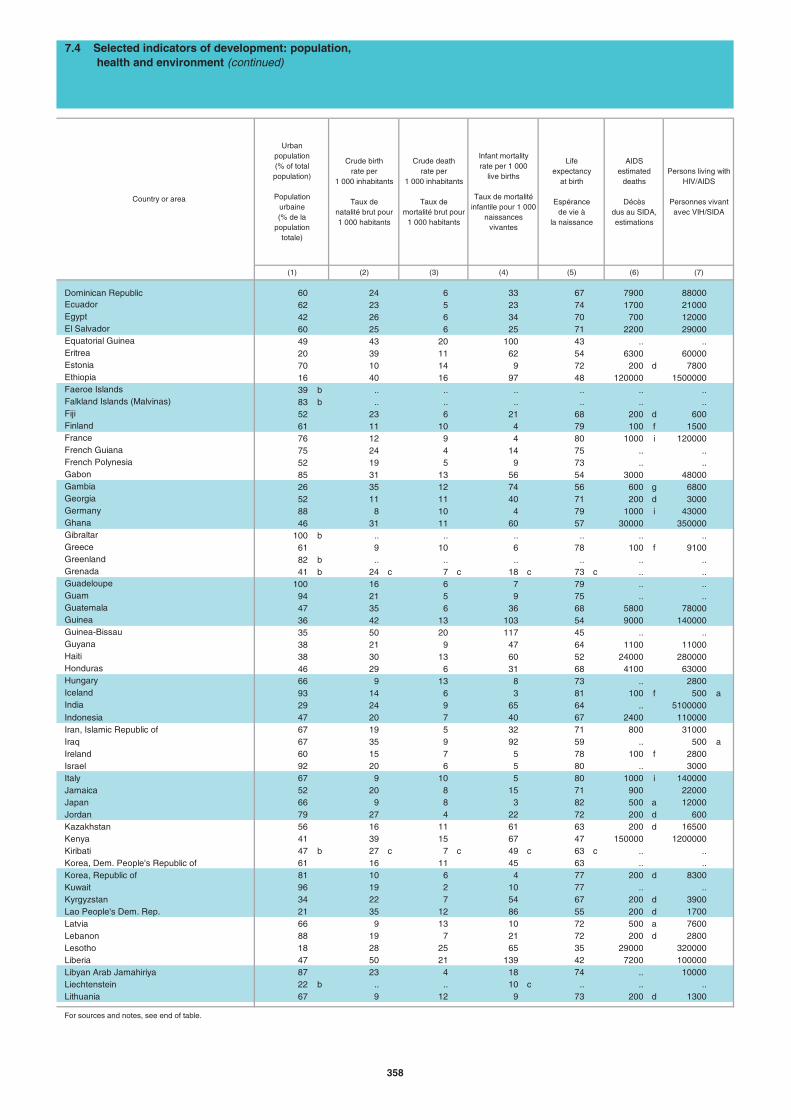
Dominican Republic 60 24 6 33 67 7900 88000Ecuador 62 23 5 23 74 1700 21000Egypt 42 26 6 34 70 700 12000El Salvador 60 25 6 25 71 2200 29000Equatorial Guinea 49 43 20 100 43 .. ..Eritrea 20 39 11 62 54 6300 60000Estonia 70 10 14 9 72 200 d 7800Ethiopia 16 40 16 97 48 120000 1500000Faeroe Islands 39 b .. .. .. .. .. ..Falkland Islands (Malvinas) 83 b .. .. .. .. .. ..Fiji 52 23 6 21 68 200 d 600Finland 61 11 10 4 79 100 f 1500France 76 12 9 4 80 1000 i 120000French Guiana 75 24 4 14 75 .. ..French Polynesia 52 19 5 9 73 .. ..Gabon 85 31 13 56 54 3000 48000Gambia 26 35 12 74 56 600 g 6800Georgia 52 11 11 40 71 200 d 3000Germany 88 8 10 4 79 1000 i 43000Ghana 46 31 11 60 57 30000 350000Gibraltar 100 b .. .. .. .. .. ..Greece 61 9 10 6 78 100 f 9100Greenland 82 b .. .. .. .. .. ..Grenada 41 b 24 c 7 c 18 c 73 c .. ..Guadeloupe 100 16 6 7 79 .. ..Guam 94 21 5 9 75 .. ..Guatemala 47 35 6 36 68 5800 78000Guinea 36 42 13 103 54 9000 140000Guinea-Bissau 35 50 20 117 45 .. ..Guyana 38 21 9 47 64 1100 11000Haiti 38 30 13 60 52 24000 280000Honduras 46 29 6 31 68 4100 63000Hungary 66 9 13 8 73 .. 2800Iceland 93 14 6 3 81 100 f 500 aIndia 29 24 9 65 64 .. 5100000Indonesia 47 20 7 40 67 2400 110000Iran, Islamic Republic of 67 19 5 32 71 800 31000Iraq 67 35 9 92 59 .. 500 aIreland 60 15 7 5 78 100 f 2800Israel 92 20 6 5 80 .. 3000Italy 67 9 10 5 80 1000 i 140000Jamaica 52 20 8 15 71 900 22000Japan 66 9 8 3 82 500 a 12000Jordan 79 27 4 22 72 200 d 600Kazakhstan 56 16 11 61 63 200 d 16500Kenya 41 39 15 67 47 150000 1200000Kiribati 47 b 27 c 7 c 49 c 63 c .. ..Korea, Dem. People's Republic of 61 16 11 45 63 .. ..Korea, Republic of 81 10 6 4 77 200 d 8300Kuwait 96 19 2 10 77 .. ..Kyrgyzstan 34 22 7 54 67 200 d 3900Lao People's Dem. Rep. 21 35 12 86 55 200 d 1700Latvia 66 9 13 10 72 500 a 7600Lebanon 88 19 7 21 72 200 d 2800Lesotho 18 28 25 65 35 29000 320000Liberia 47 50 21 139 42 7200 100000Libyan Arab Jamahiriya 87 23 4 18 74 .. 10000Liechtenstein 22 b .. .. 10 c .. .. ..Lithuania 67 9 12 9 73 200 d 1300
For sources and notes, see end of table.
AIDS estimated
deaths
Décès dus au SIDA, estimations
(6)(2) (3) (4)
7.4 Selected indicators of development: population, health and environment (continued)
(7)
Country or area
(1)
Urban population(% of totalpopulation)
Populationurbaine (% de la
populationtotale)
Crude birthrate per
1 000 inhabitants
Taux de natalité brut pour 1 000 habitants
Persons living with HIV/AIDS
Personnes vivant avec VIH/SIDA
Infant mortalityrate per 1 000
live births
Taux de mortalitéinfantile pour 1 000
naissances vivantes
Life expectancy
at birth
Espérance de vie à
la naissance
(5)
Crude deathrate per
1 000 inhabitants
Taux de mortalité brut pour
1 000 habitants
358
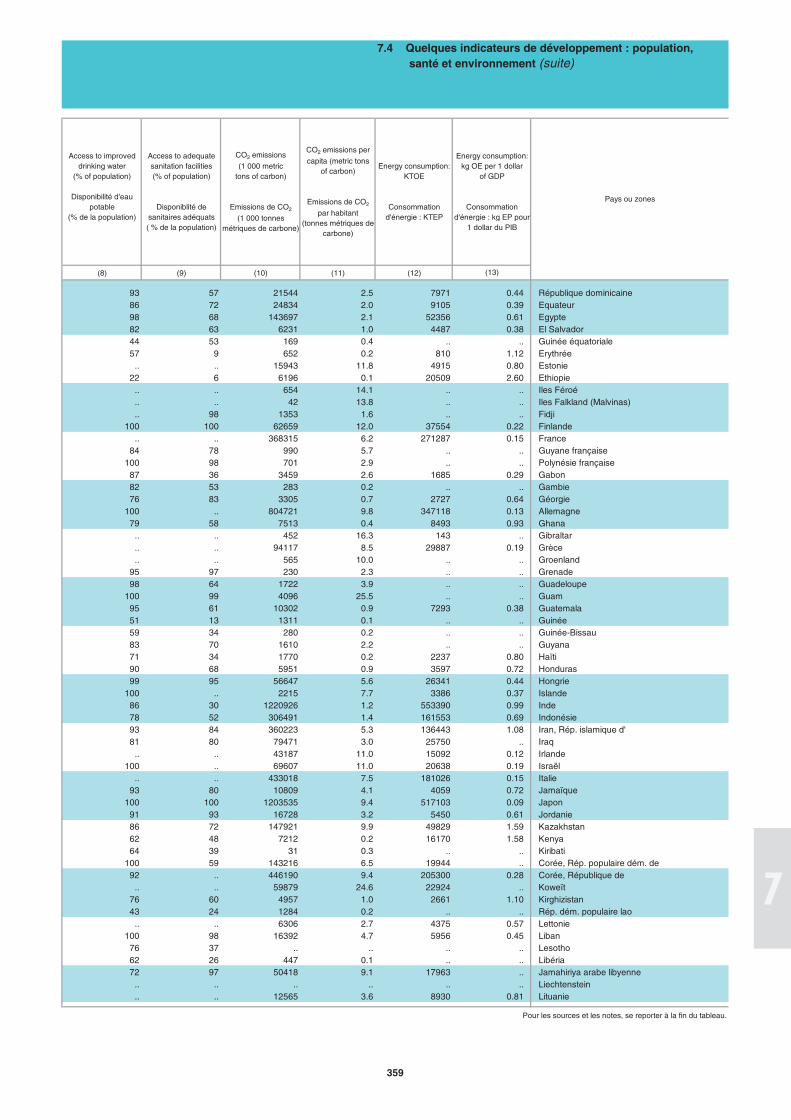
(8) (9) (10) (11) (12)
93 57 21544 2.5 7971 0.44 République dominicaine86 72 24834 2.0 9105 0.39 Equateur98 68 143697 2.1 52356 0.61 Egypte82 63 6231 1.0 4487 0.38 El Salvador44 53 169 0.4 .. .. Guinée équatoriale57 9 652 0.2 810 1.12 Erythrée
.. .. 15943 11.8 4915 0.80 Estonie22 6 6196 0.1 20509 2.60 Ethiopie
.. .. 654 14.1 .. .. Iles Féroé
.. .. 42 13.8 .. .. Iles Falkland (Malvinas)
.. 98 1353 1.6 .. .. Fidji100 100 62659 12.0 37554 0.22 Finlande
.. .. 368315 6.2 271287 0.15 France84 78 990 5.7 .. .. Guyane française
100 98 701 2.9 .. .. Polynésie française87 36 3459 2.6 1685 0.29 Gabon82 53 283 0.2 .. .. Gambie76 83 3305 0.7 2727 0.64 Géorgie
100 .. 804721 9.8 347118 0.13 Allemagne79 58 7513 0.4 8493 0.93 Ghana
.. .. 452 16.3 143 .. Gibraltar
.. .. 94117 8.5 29887 0.19 Grèce
.. .. 565 10.0 .. .. Groenland95 97 230 2.3 .. .. Grenade98 64 1722 3.9 .. .. Guadeloupe
100 99 4096 25.5 .. .. Guam95 61 10302 0.9 7293 0.38 Guatemala51 13 1311 0.1 .. .. Guinée59 34 280 0.2 .. .. Guinée-Bissau83 70 1610 2.2 .. .. Guyana71 34 1770 0.2 2237 0.80 Haïti90 68 5951 0.9 3597 0.72 Honduras99 95 56647 5.6 26341 0.44 Hongrie
100 .. 2215 7.7 3386 0.37 Islande86 30 1220926 1.2 553390 0.99 Inde78 52 306491 1.4 161553 0.69 Indonésie93 84 360223 5.3 136443 1.08 Iran, Rép. islamique d'81 80 79471 3.0 25750 .. Iraq
.. .. 43187 11.0 15092 0.12 Irlande100 .. 69607 11.0 20638 0.19 Israël
.. .. 433018 7.5 181026 0.15 Italie93 80 10809 4.1 4059 0.72 Jamaïque
100 100 1203535 9.4 517103 0.09 Japon91 93 16728 3.2 5450 0.61 Jordanie86 72 147921 9.9 49829 1.59 Kazakhstan62 48 7212 0.2 16170 1.58 Kenya64 39 31 0.3 .. .. Kiribati
100 59 143216 6.5 19944 .. Corée, Rép. populaire dém. de92 .. 446190 9.4 205300 0.28 Corée, République de
.. .. 59879 24.6 22924 .. Koweït76 60 4957 1.0 2661 1.10 Kirghizistan43 24 1284 0.2 .. .. Rép. dém. populaire lao
.. .. 6306 2.7 4375 0.57 Lettonie100 98 16392 4.7 5956 0.45 Liban
76 37 .. .. .. .. Lesotho62 26 447 0.1 .. .. Libéria72 97 50418 9.1 17963 .. Jamahiriya arabe libyenne
.. .. .. .. .. .. Liechtenstein
.. .. 12565 3.6 8930 0.81 Lituanie
Pour les sources et les notes, se reporter à la fin du tableau.
Energy consumption: KTOE
Consommation d'énergie : KTEP
Energy consumption: kg OE per 1 dollar
of GDP
Consommation d'énergie : kg EP pour
1 dollar du PIB
7.4 Quelques indicateurs de développement : population, santé et environnement (suite)
Access to adequate sanitation facilities (% of population)
Disponiblité de sanitaires adéquats ( % de la population)
Access to improved drinking water
(% of population)
Disponibilité d'eaupotable
(% de la population)
(13)
Pays ou zones
CO2 emissions
(1 000 metric tons of carbon)
Emissions de CO2
(1 000 tonnes métriques de carbone)
CO2 emissions per
capita (metric tons of carbon)
Emissions de CO2
par habitant (tonnes métriques de
carbone)
359
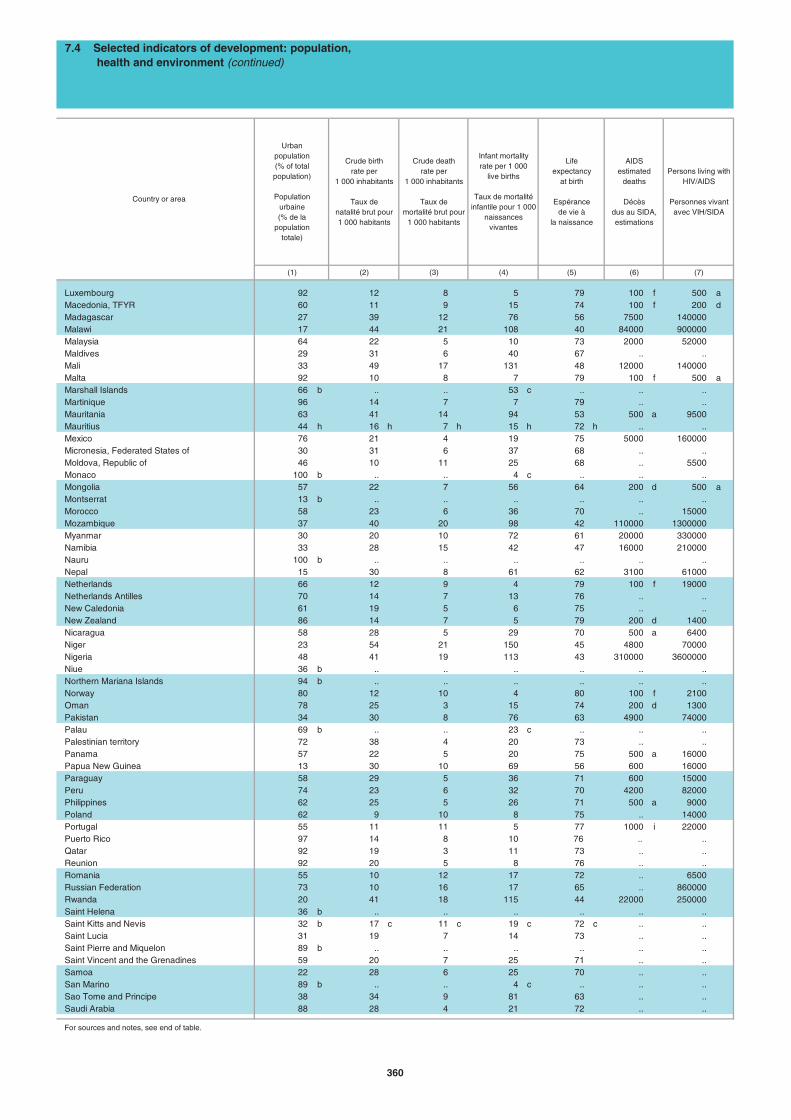
Luxembourg 92 12 8 5 79 100 f 500 aMacedonia, TFYR 60 11 9 15 74 100 f 200 dMadagascar 27 39 12 76 56 7500 140000Malawi 17 44 21 108 40 84000 900000Malaysia 64 22 5 10 73 2000 52000Maldives 29 31 6 40 67 .. ..Mali 33 49 17 131 48 12000 140000Malta 92 10 8 7 79 100 f 500 aMarshall Islands 66 b .. .. 53 c .. .. ..Martinique 96 14 7 7 79 .. ..Mauritania 63 41 14 94 53 500 a 9500Mauritius 44 h 16 h 7 h 15 h 72 h .. ..Mexico 76 21 4 19 75 5000 160000Micronesia, Federated States of 30 31 6 37 68 .. ..Moldova, Republic of 46 10 11 25 68 .. 5500Monaco 100 b .. .. 4 c .. .. ..Mongolia 57 22 7 56 64 200 d 500 aMontserrat 13 b .. .. .. .. .. ..Morocco 58 23 6 36 70 .. 15000Mozambique 37 40 20 98 42 110000 1300000Myanmar 30 20 10 72 61 20000 330000Namibia 33 28 15 42 47 16000 210000Nauru 100 b .. .. .. .. .. ..Nepal 15 30 8 61 62 3100 61000Netherlands 66 12 9 4 79 100 f 19000Netherlands Antilles 70 14 7 13 76 .. ..New Caledonia 61 19 5 6 75 .. ..New Zealand 86 14 7 5 79 200 d 1400Nicaragua 58 28 5 29 70 500 a 6400Niger 23 54 21 150 45 4800 70000Nigeria 48 41 19 113 43 310000 3600000Niue 36 b .. .. .. .. .. ..Northern Mariana Islands 94 b .. .. .. .. .. ..Norway 80 12 10 4 80 100 f 2100Oman 78 25 3 15 74 200 d 1300Pakistan 34 30 8 76 63 4900 74000Palau 69 b .. .. 23 c .. .. ..Palestinian territory 72 38 4 20 73 .. ..Panama 57 22 5 20 75 500 a 16000Papua New Guinea 13 30 10 69 56 600 16000Paraguay 58 29 5 36 71 600 15000Peru 74 23 6 32 70 4200 82000Philippines 62 25 5 26 71 500 a 9000Poland 62 9 10 8 75 .. 14000Portugal 55 11 11 5 77 1000 i 22000Puerto Rico 97 14 8 10 76 .. ..Qatar 92 19 3 11 73 .. ..Reunion 92 20 5 8 76 .. ..Romania 55 10 12 17 72 .. 6500Russian Federation 73 10 16 17 65 .. 860000Rwanda 20 41 18 115 44 22000 250000Saint Helena 36 b .. .. .. .. .. ..Saint Kitts and Nevis 32 b 17 c 11 c 19 c 72 c .. ..Saint Lucia 31 19 7 14 73 .. ..Saint Pierre and Miquelon 89 b .. .. .. .. .. ..Saint Vincent and the Grenadines 59 20 7 25 71 .. ..Samoa 22 28 6 25 70 .. ..San Marino 89 b .. .. 4 c .. .. ..Sao Tome and Principe 38 34 9 81 63 .. ..Saudi Arabia 88 28 4 21 72 .. ..
For sources and notes, see end of table.
AIDS estimated
deaths
Décès dus au SIDA, estimations
(7)
Persons living with HIV/AIDS
Personnes vivant avec VIH/SIDA
(6)
Country or area
(1) (2)
7.4 Selected indicators of development: population, health and environment (continued)
(5)(4)
Urban population(% of totalpopulation)
Populationurbaine (% de la
populationtotale)
Crude birthrate per
1 000 inhabitants
Taux de natalité brut pour 1 000 habitants
Crude deathrate per
1 000 inhabitants
Taux de mortalité brut pour
1 000 habitants
Infant mortalityrate per 1 000
live births
Taux de mortalitéinfantile pour 1 000
naissances vivantes
Life expectancy
at birth
Espérance de vie à
la naissance
(3)
360
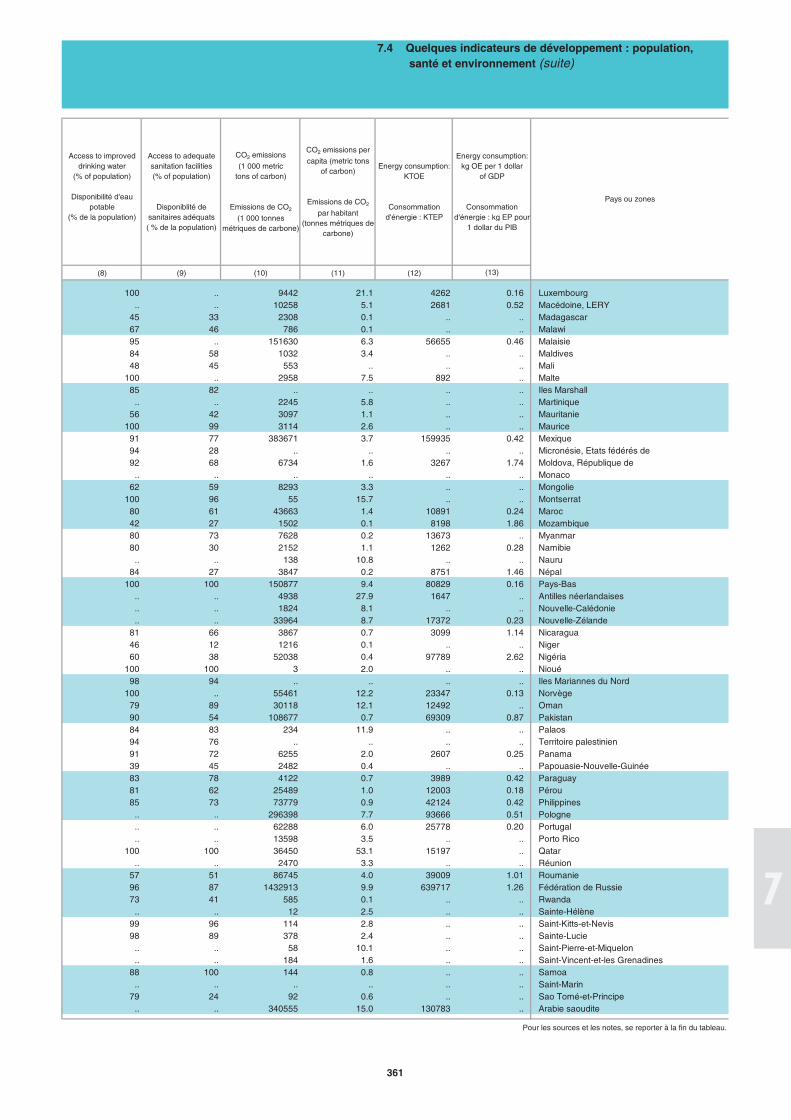
(8) (9) (10) (11) (12)
100 .. 9442 21.1 4262 0.16 Luxembourg.. .. 10258 5.1 2681 0.52 Macédoine, LERY
45 33 2308 0.1 .. .. Madagascar67 46 786 0.1 .. .. Malawi95 .. 151630 6.3 56655 0.46 Malaisie84 58 1032 3.4 .. .. Maldives48 45 553 .. .. .. Mali
100 .. 2958 7.5 892 .. Malte85 82 .. .. .. .. Iles Marshall
.. .. 2245 5.8 .. .. Martinique56 42 3097 1.1 .. .. Mauritanie
100 99 3114 2.6 .. .. Maurice91 77 383671 3.7 159935 0.42 Mexique94 28 .. .. .. .. Micronésie, Etats fédérés de92 68 6734 1.6 3267 1.74 Moldova, République de
.. .. .. .. .. .. Monaco62 59 8293 3.3 .. .. Mongolie
100 96 55 15.7 .. .. Montserrat80 61 43663 1.4 10891 0.24 Maroc42 27 1502 0.1 8198 1.86 Mozambique80 73 7628 0.2 13673 .. Myanmar80 30 2152 1.1 1262 0.28 Namibie
.. .. 138 10.8 .. .. Nauru84 27 3847 0.2 8751 1.46 Népal
100 100 150877 9.4 80829 0.16 Pays-Bas.. .. 4938 27.9 1647 .. Antilles néerlandaises.. .. 1824 8.1 .. .. Nouvelle-Calédonie.. .. 33964 8.7 17372 0.23 Nouvelle-Zélande
81 66 3867 0.7 3099 1.14 Nicaragua46 12 1216 0.1 .. .. Niger60 38 52038 0.4 97789 2.62 Nigéria
100 100 3 2.0 .. .. Nioué98 94 .. .. .. .. Iles Mariannes du Nord
100 .. 55461 12.2 23347 0.13 Norvège79 89 30118 12.1 12492 .. Oman90 54 108677 0.7 69309 0.87 Pakistan84 83 234 11.9 .. .. Palaos94 76 .. .. .. .. Territoire palestinien 91 72 6255 2.0 2607 0.25 Panama39 45 2482 0.4 .. .. Papouasie-Nouvelle-Guinée83 78 4122 0.7 3989 0.42 Paraguay81 62 25489 1.0 12003 0.18 Pérou85 73 73779 0.9 42124 0.42 Philippines
.. .. 296398 7.7 93666 0.51 Pologne
.. .. 62288 6.0 25778 0.20 Portugal
.. .. 13598 3.5 .. .. Porto Rico100 100 36450 53.1 15197 .. Qatar
.. .. 2470 3.3 .. .. Réunion57 51 86745 4.0 39009 1.01 Roumanie96 87 1432913 9.9 639717 1.26 Fédération de Russie73 41 585 0.1 .. .. Rwanda
.. .. 12 2.5 .. .. Sainte-Hélène99 96 114 2.8 .. .. Saint-Kitts-et-Nevis98 89 378 2.4 .. .. Sainte-Lucie
.. .. 58 10.1 .. .. Saint-Pierre-et-Miquelon
.. .. 184 1.6 .. .. Saint-Vincent-et-les Grenadines88 100 144 0.8 .. .. Samoa
.. .. .. .. .. .. Saint-Marin79 24 92 0.6 .. .. Sao Tomé-et-Principe
.. .. 340555 15.0 130783 .. Arabie saoudite
Pour les sources et les notes, se reporter à la fin du tableau.
7.4 Quelques indicateurs de développement : population, santé et environnement (suite)
Access to adequate sanitation facilities (% of population)
Disponiblité de sanitaires adéquats ( % de la population)
CO2 emissions
(1 000 metric tons of carbon)
Emissions de CO2
(1 000 tonnes métriques de carbone)
CO2 emissions per
capita (metric tons of carbon)
Emissions de CO2
par habitant (tonnes métriques de
carbone)
Pays ou zones
(13)
Energy consumption: KTOE
Consommation d'énergie : KTEP
Energy consumption: kg OE per 1 dollar
of GDP
Consommation d'énergie : kg EP pour
1 dollar du PIB
Access to improved drinking water
(% of population)
Disponibilité d'eaupotable
(% de la population)
361
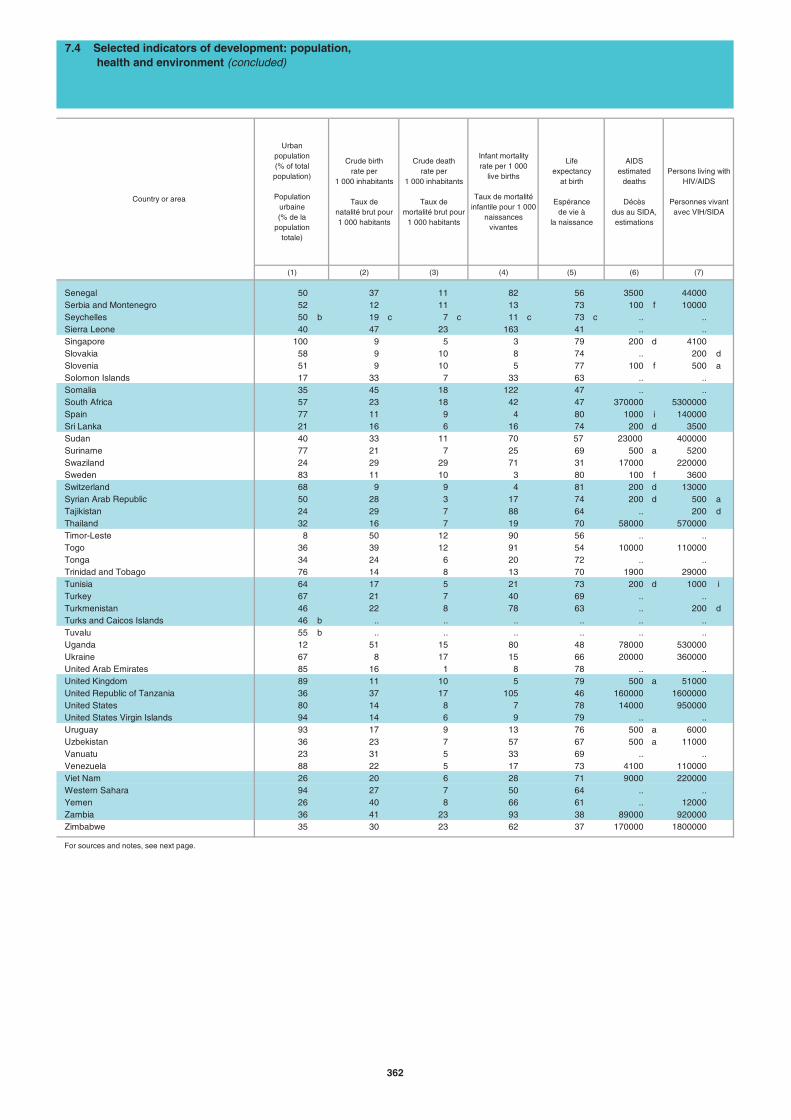
Senegal 50 37 11 82 56 3500 44000Serbia and Montenegro 52 12 11 13 73 100 f 10000Seychelles 50 b 19 c 7 c 11 c 73 c .. ..Sierra Leone 40 47 23 163 41 .. ..Singapore 100 9 5 3 79 200 d 4100Slovakia 58 9 10 8 74 .. 200 dSlovenia 51 9 10 5 77 100 f 500 aSolomon Islands 17 33 7 33 63 .. ..Somalia 35 45 18 122 47 .. ..South Africa 57 23 18 42 47 370000 5300000Spain 77 11 9 4 80 1000 i 140000Sri Lanka 21 16 6 16 74 200 d 3500Sudan 40 33 11 70 57 23000 400000Suriname 77 21 7 25 69 500 a 5200Swaziland 24 29 29 71 31 17000 220000Sweden 83 11 10 3 80 100 f 3600Switzerland 68 9 9 4 81 200 d 13000Syrian Arab Republic 50 28 3 17 74 200 d 500 aTajikistan 24 29 7 88 64 .. 200 dThailand 32 16 7 19 70 58000 570000Timor-Leste 8 50 12 90 56 .. ..Togo 36 39 12 91 54 10000 110000Tonga 34 24 6 20 72 .. ..Trinidad and Tobago 76 14 8 13 70 1900 29000Tunisia 64 17 5 21 73 200 d 1000 iTurkey 67 21 7 40 69 .. ..Turkmenistan 46 22 8 78 63 .. 200 dTurks and Caicos Islands 46 b .. .. .. .. .. ..Tuvalu 55 b .. .. .. .. .. ..Uganda 12 51 15 80 48 78000 530000Ukraine 67 8 17 15 66 20000 360000United Arab Emirates 85 16 1 8 78 .. ..United Kingdom 89 11 10 5 79 500 a 51000United Republic of Tanzania 36 37 17 105 46 160000 1600000United States 80 14 8 7 78 14000 950000United States Virgin Islands 94 14 6 9 79 .. ..Uruguay 93 17 9 13 76 500 a 6000Uzbekistan 36 23 7 57 67 500 a 11000Vanuatu 23 31 5 33 69 .. ..Venezuela 88 22 5 17 73 4100 110000Viet Nam 26 20 6 28 71 9000 220000Western Sahara 94 27 7 50 64 .. ..Yemen 26 40 8 66 61 .. 12000Zambia 36 41 23 93 38 89000 920000Zimbabwe 35 30 23 62 37 170000 1800000
For sources and notes, see next page.
AIDS estimated
deaths
Décès dus au SIDA, estimations
(6)(2) (3)(1)
Urban population(% of totalpopulation)
Populationurbaine (% de la
populationtotale)
Crude birthrate per
1 000 inhabitants
Taux de natalité brut pour 1 000 habitants
Crude deathrate per
1 000 inhabitants
Taux de mortalité brut pour
1 000 habitants
Life expectancy
at birth
Espérance de vie à
la naissance
Persons living with HIV/AIDS
Personnes vivant avec VIH/SIDA
(7)
Infant mortalityrate per 1 000
live births
Taux de mortalitéinfantile pour 1 000
naissances vivantes
7.4 Selected indicators of development: population, health and environment (concluded)
Country or area
(4) (5)
362
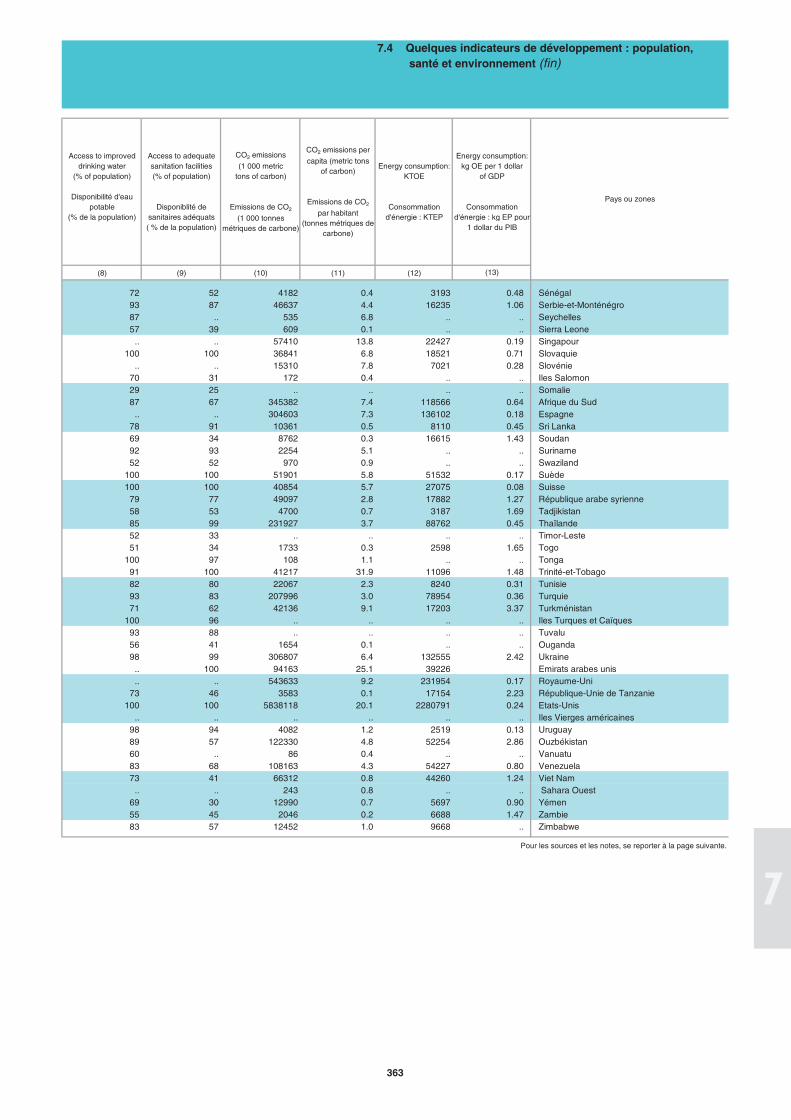
(8) (9) (10) (11) (12)
72 52 4182 0.4 3193 0.48 Sénégal93 87 46637 4.4 16235 1.06 Serbie-et-Monténégro87 .. 535 6.8 .. .. Seychelles57 39 609 0.1 .. .. Sierra Leone
.. .. 57410 13.8 22427 0.19 Singapour100 100 36841 6.8 18521 0.71 Slovaquie
.. .. 15310 7.8 7021 0.28 Slovénie70 31 172 0.4 .. .. Iles Salomon29 25 .. .. .. .. Somalie87 67 345382 7.4 118566 0.64 Afrique du Sud
.. .. 304603 7.3 136102 0.18 Espagne78 91 10361 0.5 8110 0.45 Sri Lanka69 34 8762 0.3 16615 1.43 Soudan92 93 2254 5.1 .. .. Suriname52 52 970 0.9 .. .. Swaziland
100 100 51901 5.8 51532 0.17 Suède100 100 40854 5.7 27075 0.08 Suisse
79 77 49097 2.8 17882 1.27 République arabe syrienne58 53 4700 0.7 3187 1.69 Tadjikistan85 99 231927 3.7 88762 0.45 Thaïlande52 33 .. .. .. .. Timor-Leste51 34 1733 0.3 2598 1.65 Togo
100 97 108 1.1 .. .. Tonga91 100 41217 31.9 11096 1.48 Trinité-et-Tobago82 80 22067 2.3 8240 0.31 Tunisie93 83 207996 3.0 78954 0.36 Turquie71 62 42136 9.1 17203 3.37 Turkménistan
100 96 .. .. .. .. Iles Turques et Caïques93 88 .. .. .. .. Tuvalu56 41 1654 0.1 .. .. Ouganda98 99 306807 6.4 132555 2.42 Ukraine
.. 100 94163 25.1 39226 Emirats arabes unis
.. .. 543633 9.2 231954 0.17 Royaume-Uni73 46 3583 0.1 17154 2.23 République-Unie de Tanzanie
100 100 5838118 20.1 2280791 0.24 Etats-Unis.. .. .. .. .. .. Iles Vierges américaines
98 94 4082 1.2 2519 0.13 Uruguay89 57 122330 4.8 52254 2.86 Ouzbékistan60 .. 86 0.4 .. .. Vanuatu83 68 108163 4.3 54227 0.80 Venezuela73 41 66312 0.8 44260 1.24 Viet Nam
.. .. 243 0.8 .. .. Sahara Ouest69 30 12990 0.7 5697 0.90 Yémen55 45 2046 0.2 6688 1.47 Zambie83 57 12452 1.0 9668 .. Zimbabwe
Access to improved drinking water
(% of population)
Disponibilité d'eaupotable
(% de la population)
Access to adequate sanitation facilities (% of population)
Disponiblité de sanitaires adéquats ( % de la population)
Pour les sources et les notes, se reporter à la page suivante.
Pays ou zones
(13)
Energy consumption: kg OE per 1 dollar
of GDP
Consommation d'énergie : kg EP pour
1 dollar du PIB
7.4 Quelques indicateurs de développement : population, santé et environnement (fin)
Energy consumption: KTOE
Consommation d'énergie : KTEP
CO2 emissions
(1 000 metric tons of carbon)
Emissions de CO2
(1 000 tonnes métriques de carbone)
CO2 emissions per
capita (metric tons of carbon)
Emissions de CO2
par habitant (tonnes métriques de
carbone)
363
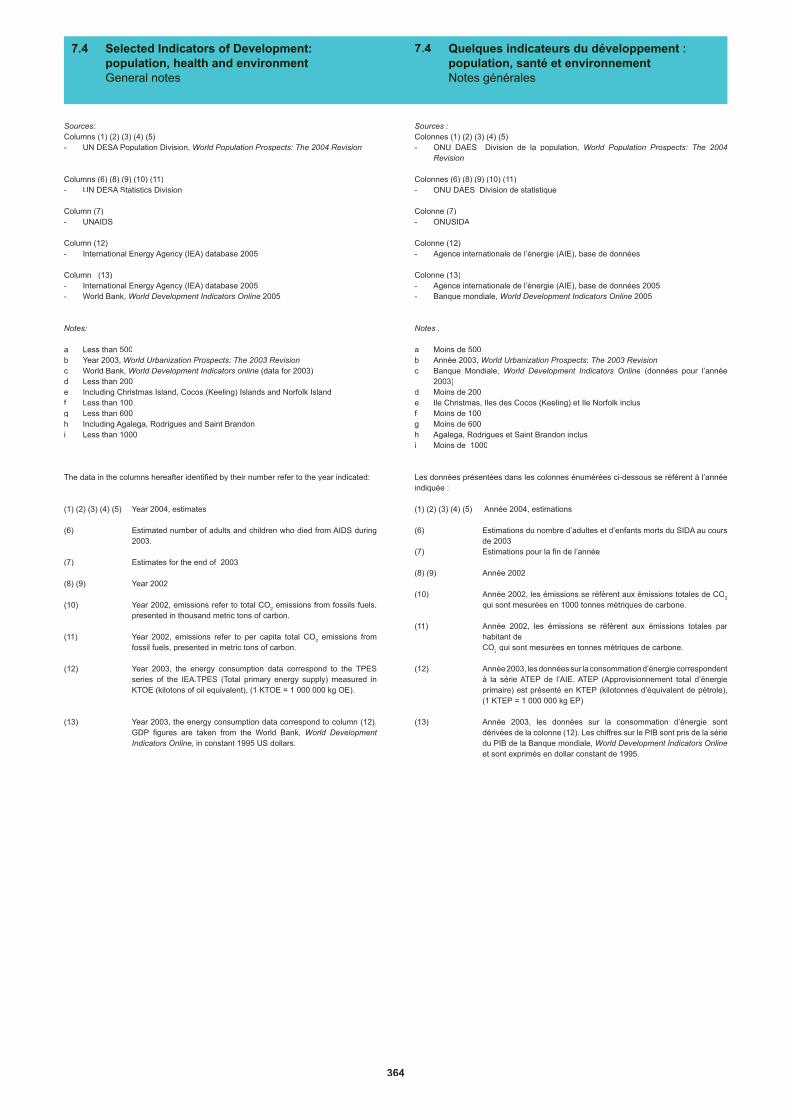

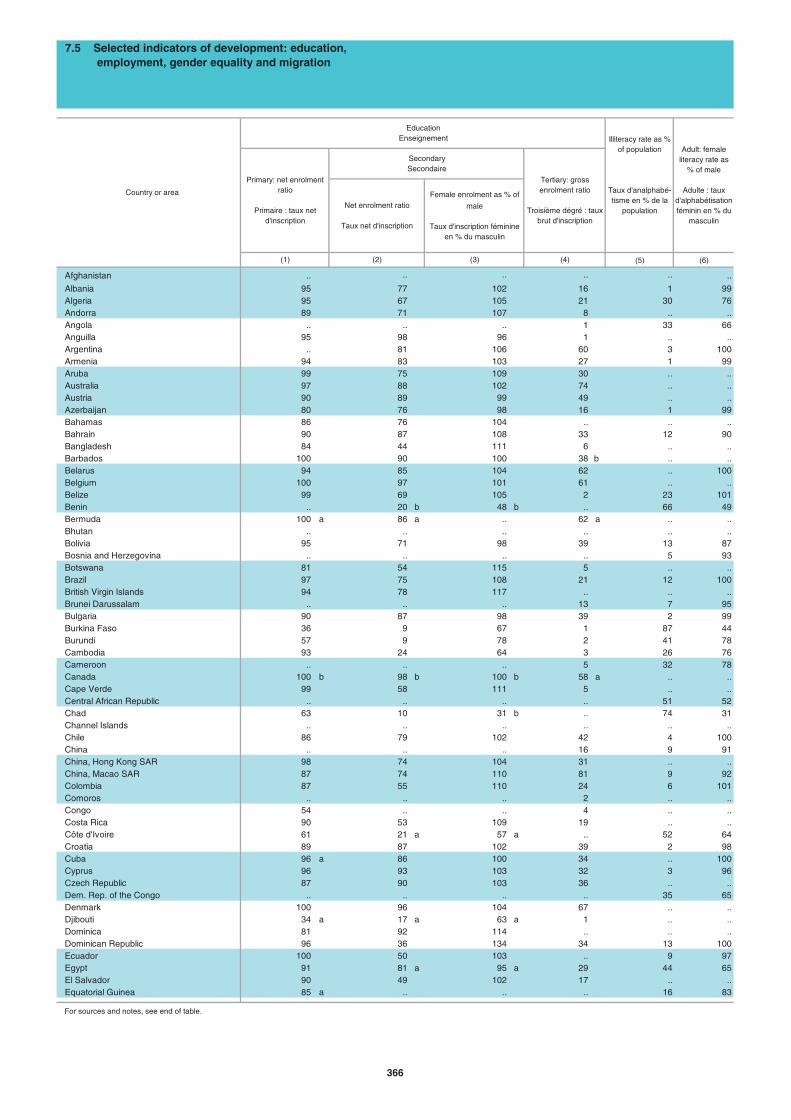
(5) (6)
Afghanistan .. .. .. .. .. ..
Albania 95 77 102 16 1 99Algeria 95 67 105 21 30 76Andorra 89 71 107 8 .. ..Angola .. .. .. 1 33 66Anguilla 95 98 96 1 .. ..Argentina .. 81 106 60 3 100Armenia 94 83 103 27 1 99Aruba 99 75 109 30 .. ..Australia 97 88 102 74 .. ..Austria 90 89 99 49 .. ..Azerbaijan 80 76 98 16 1 99Bahamas 86 76 104 .. .. ..Bahrain 90 87 108 33 12 90Bangladesh 84 44 111 6 .. ..Barbados 100 90 100 38 b .. ..Belarus 94 85 104 62 .. 100Belgium 100 97 101 61 .. ..Belize 99 69 105 2 23 101Benin .. 20 b 48 b .. 66 49Bermuda 100 a 86 a .. 62 a .. ..Bhutan .. .. .. .. .. ..Bolivia 95 71 98 39 13 87Bosnia and Herzegovina .. .. .. .. 5 93Botswana 81 54 115 5 .. ..Brazil 97 75 108 21 12 100British Virgin Islands 94 78 117 .. .. ..Brunei Darussalam .. .. .. 13 7 95Bulgaria 90 87 98 39 2 99Burkina Faso 36 9 67 1 87 44Burundi 57 9 78 2 41 78Cambodia 93 24 64 3 26 76Cameroon .. .. .. 5 32 78Canada 100 b 98 b 100 b 58 a .. ..Cape Verde 99 58 111 5 .. ..Central African Republic .. .. .. .. 51 52Chad 63 10 31 b .. 74 31Channel Islands .. .. .. .. .. ..Chile 86 79 102 42 4 100China .. .. .. 16 9 91China, Hong Kong SAR 98 74 104 31 .. ..China, Macao SAR 87 74 110 81 9 92Colombia 87 55 110 24 6 101Comoros .. .. .. 2 .. ..Congo 54 .. .. 4 .. ..Costa Rica 90 53 109 19 .. ..Côte d'Ivoire 61 21 a 57 a .. 52 64Croatia 89 87 102 39 2 98Cuba 96 a 86 100 34 .. 100Cyprus 96 93 103 32 3 96Czech Republic 87 90 103 36 .. ..Dem. Rep. of the Congo .. .. .. .. 35 65Denmark 100 96 104 67 .. ..Djibouti 34 a 17 a 63 a 1 .. ..Dominica 81 92 114 .. .. ..Dominican Republic 96 36 134 34 13 100Ecuador 100 50 103 .. 9 97Egypt 91 81 a 95 a 29 44 65El Salvador 90 49 102 17 .. ..Equatorial Guinea 85 a .. .. .. 16 83
For sources and notes, see end of table.
7.5 Selected indicators of development: education, employment, gender equality and migration
Country or area
SecondarySecondaire
Female enrolment as % of
male
Taux d'inscription féminine en % du masculin
Illiteracy rate as % of population
Taux d'analphabé-tisme en % de la
population
Tertiary: gross enrolment ratio
Troisième dégré : taux brut d'inscription
(4)
EducationEnseignement
Primary: net enrolment ratio
Primaire : taux net d'inscription
(3)
Net enrolment ratio
Taux net d'inscription
Adult: female literacy rate as
% of male
Adulte : taux d'alphabétisation féminin en % du
masculin
(1) (2)
366
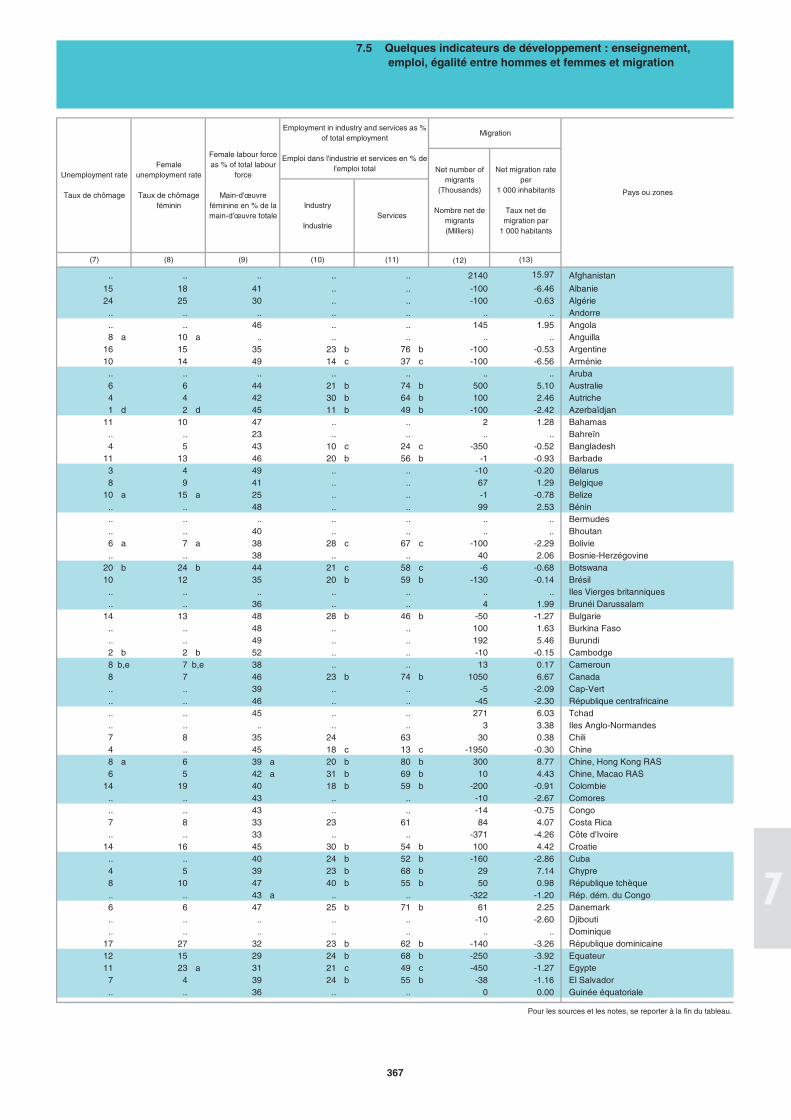
(12)
.. .. .. .. .. 2140 15.97 Afghanistan
15 18 41 .. .. -100 -6.46 Albanie24 25 30 .. .. -100 -0.63 Algérie
.. .. .. .. .. .. .. Andorre
.. .. 46 .. .. 145 1.95 Angola8 a 10 a .. .. .. .. .. Anguilla
16 15 35 23 b 76 b -100 -0.53 Argentine10 14 49 14 c 37 c -100 -6.56 Arménie
.. .. .. .. .. .. .. Aruba6 6 44 21 b 74 b 500 5.10 Australie4 4 42 30 b 64 b 100 2.46 Autriche1 d 2 d 45 11 b 49 b -100 -2.42 Azerbaïdjan
11 10 47 .. .. 2 1.28 Bahamas.. .. 23 .. .. .. .. Bahreïn4 5 43 10 c 24 c -350 -0.52 Bangladesh
11 13 46 20 b 56 b -1 -0.93 Barbade3 4 49 .. .. -10 -0.20 Bélarus8 9 41 .. .. 67 1.29 Belgique
10 a 15 a 25 .. .. -1 -0.78 Belize.. .. 48 .. .. 99 2.53 Bénin.. .. .. .. .. .. .. Bermudes.. .. 40 .. .. .. .. Bhoutan6 a 7 a 38 28 c 67 c -100 -2.29 Bolivie.. .. 38 .. .. 40 2.06 Bosnie-Herzégovine
20 b 24 b 44 21 c 58 c -6 -0.68 Botswana10 12 35 20 b 59 b -130 -0.14 Brésil
.. .. .. .. .. .. .. Iles Vierges britanniques
.. .. 36 .. .. 4 1.99 Brunéi Darussalam14 13 48 28 b 46 b -50 -1.27 Bulgarie
.. .. 48 .. .. 100 1.63 Burkina Faso
.. .. 49 .. .. 192 5.46 Burundi2 b 2 b 52 .. .. -10 -0.15 Cambodge8 b,e 7 b,e 38 .. .. 13 0.17 Cameroun8 7 46 23 b 74 b 1050 6.67 Canada.. .. 39 .. .. -5 -2.09 Cap-Vert.. .. 46 .. .. -45 -2.30 République centrafricaine.. .. 45 .. .. 271 6.03 Tchad.. .. .. .. .. 3 3.38 Iles Anglo-Normandes7 8 35 24 63 30 0.38 Chili4 .. 45 18 c 13 c -1950 -0.30 Chine8 a 6 39 a 20 b 80 b 300 8.77 Chine, Hong Kong RAS6 5 42 a 31 b 69 b 10 4.43 Chine, Macao RAS
14 19 40 18 b 59 b -200 -0.91 Colombie.. .. 43 .. .. -10 -2.67 Comores.. .. 43 .. .. -14 -0.75 Congo7 8 33 23 61 84 4.07 Costa Rica.. .. 33 .. .. -371 -4.26 Côte d'Ivoire
14 16 45 30 b 54 b 100 4.42 Croatie.. .. 40 24 b 52 b -160 -2.86 Cuba4 5 39 23 b 68 b 29 7.14 Chypre8 10 47 40 b 55 b 50 0.98 République tchèque.. .. 43 a .. .. -322 -1.20 Rép. dém. du Congo6 6 47 25 b 71 b 61 2.25 Danemark.. .. .. .. .. -10 -2.60 Djibouti.. .. .. .. .. .. .. Dominique
17 27 32 23 b 62 b -140 -3.26 République dominicaine12 15 29 24 b 68 b -250 -3.92 Equateur11 23 a 31 21 c 49 c -450 -1.27 Egypte
7 4 39 24 b 55 b -38 -1.16 El Salvador.. .. 36 .. .. 0 0.00 Guinée équatoriale
7.5 Quelques indicateurs de développement : enseignement, emploi, égalité entre hommes et femmes et migration
(7)
Pays ou zones
(10)
Unemployment rate
Taux de chômage
Female unemployment rate
Taux de chômage féminin
Migration
(11)
Net number of migrants
(Thousands)
Nombre net de migrants (Milliers)
(13)
Net migration rate per
1 000 inhabitants
Taux net de migration par
1 000 habitants
Pour les sources et les notes, se reporter à la fin du tableau.
Female labour force as % of total labour
force
Main-d'œuvre féminine en % de la main-d'œuvre totale
Industry
IndustrieServices
Employment in industry and services as % of total employment
Emploi dans l'industrie et services en % de l'emploi total
(9)(8)
367
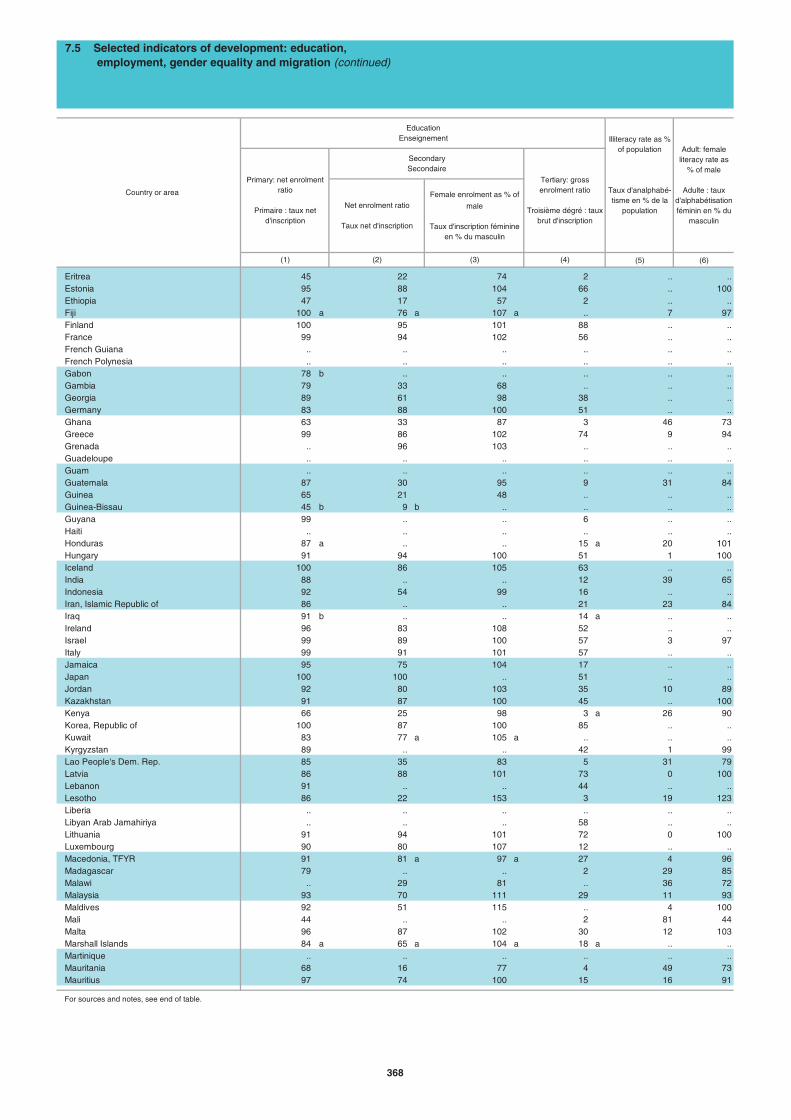
(5) (6)
Eritrea 45 22 74 2 .. ..Estonia 95 88 104 66 .. 100Ethiopia 47 17 57 2 .. ..Fiji 100 a 76 a 107 a .. 7 97Finland 100 95 101 88 .. ..France 99 94 102 56 .. ..French Guiana .. .. .. .. .. ..French Polynesia .. .. .. .. .. ..Gabon 78 b .. .. .. .. ..Gambia 79 33 68 .. .. ..Georgia 89 61 98 38 .. ..Germany 83 88 100 51 .. ..Ghana 63 33 87 3 46 73Greece 99 86 102 74 9 94Grenada .. 96 103 .. .. ..Guadeloupe .. .. .. .. .. ..Guam .. .. .. .. .. ..Guatemala 87 30 95 9 31 84Guinea 65 21 48 .. .. ..Guinea-Bissau 45 b 9 b .. .. .. ..Guyana 99 .. .. 6 .. ..Haiti .. .. .. .. .. ..Honduras 87 a .. .. 15 a 20 101Hungary 91 94 100 51 1 100Iceland 100 86 105 63 .. ..India 88 .. .. 12 39 65Indonesia 92 54 99 16 .. ..Iran, Islamic Republic of 86 .. .. 21 23 84Iraq 91 b .. .. 14 a .. ..Ireland 96 83 108 52 .. ..Israel 99 89 100 57 3 97Italy 99 91 101 57 .. ..Jamaica 95 75 104 17 .. ..Japan 100 100 .. 51 .. ..Jordan 92 80 103 35 10 89Kazakhstan 91 87 100 45 .. 100Kenya 66 25 98 3 a 26 90Korea, Republic of 100 87 100 85 .. ..Kuwait 83 77 a 105 a .. .. ..Kyrgyzstan 89 .. .. 42 1 99Lao People's Dem. Rep. 85 35 83 5 31 79Latvia 86 88 101 73 0 100Lebanon 91 .. .. 44 .. ..Lesotho 86 22 153 3 19 123Liberia .. .. .. .. .. ..Libyan Arab Jamahiriya .. .. .. 58 .. ..Lithuania 91 94 101 72 0 100Luxembourg 90 80 107 12 .. ..Macedonia, TFYR 91 81 a 97 a 27 4 96Madagascar 79 .. .. 2 29 85Malawi .. 29 81 .. 36 72Malaysia 93 70 111 29 11 93Maldives 92 51 115 .. 4 100Mali 44 .. .. 2 81 44Malta 96 87 102 30 12 103Marshall Islands 84 a 65 a 104 a 18 a .. ..Martinique .. .. .. .. .. ..Mauritania 68 16 77 4 49 73Mauritius 97 74 100 15 16 91
For sources and notes, see end of table.
(1) (2)
Illiteracy rate as % of population
Taux d'analphabé-tisme en % de la
population
SecondarySecondaire
EducationEnseignement
Tertiary: gross enrolment ratio
Troisième dégré : taux brut d'inscription
Net enrolment ratio
Taux net d'inscription
Female enrolment as % of
male
Taux d'inscription féminine en % du masculin
Primary: net enrolment ratio
Primaire : taux net d'inscription
(3)
7.5 Selected indicators of development: education, employment, gender equality and migration (continued)
Country or area
(4)
Adult: female literacy rate as
% of male
Adulte : taux d'alphabétisation féminin en % du
masculin
368
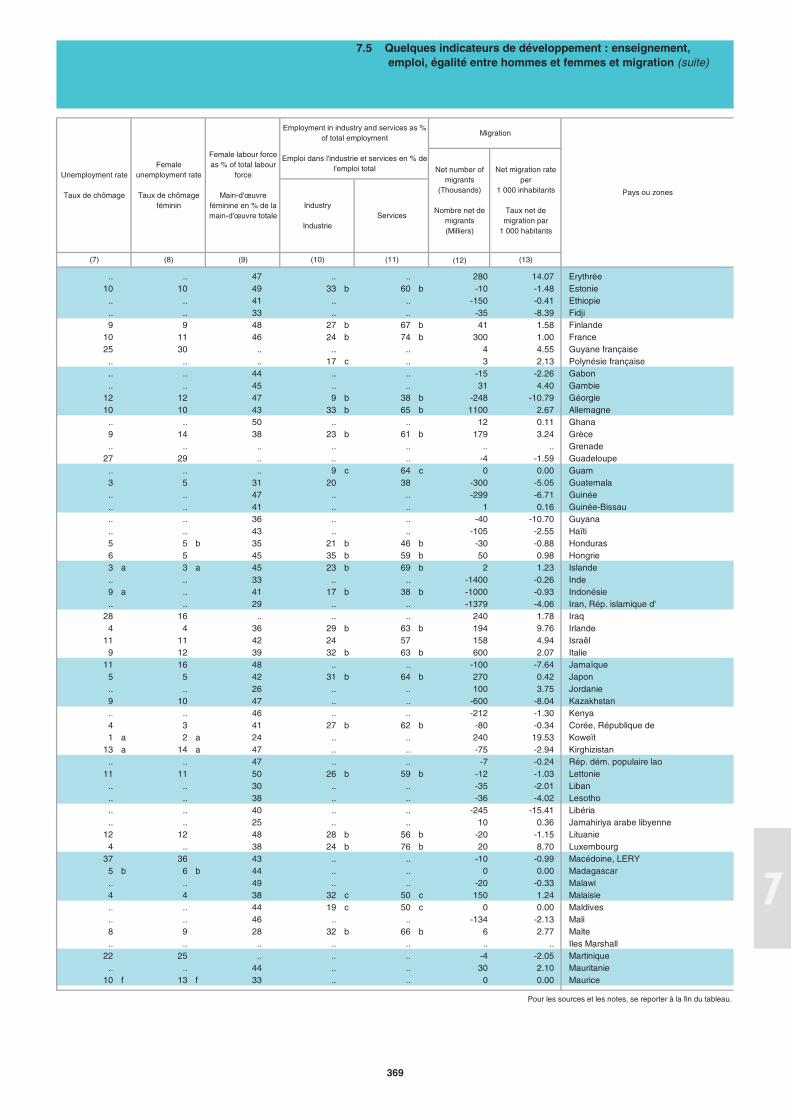
(12)
.. .. 47 .. .. 280 14.07 Erythrée10 10 49 33 b 60 b -10 -1.48 Estonie
.. .. 41 .. .. -150 -0.41 Ethiopie
.. .. 33 .. .. -35 -8.39 Fidji9 9 48 27 b 67 b 41 1.58 Finlande
10 11 46 24 b 74 b 300 1.00 France25 30 .. .. .. 4 4.55 Guyane française
.. .. .. 17 c .. 3 2.13 Polynésie française
.. .. 44 .. .. -15 -2.26 Gabon
.. .. 45 .. .. 31 4.40 Gambie12 12 47 9 b 38 b -248 -10.79 Géorgie10 10 43 33 b 65 b 1100 2.67 Allemagne
.. .. 50 .. .. 12 0.11 Ghana9 14 38 23 b 61 b 179 3.24 Grèce.. .. .. .. .. .. .. Grenade
27 29 .. .. .. -4 -1.59 Guadeloupe.. .. .. 9 c 64 c 0 0.00 Guam3 5 31 20 38 -300 -5.05 Guatemala.. .. 47 .. .. -299 -6.71 Guinée.. .. 41 .. .. 1 0.16 Guinée-Bissau.. .. 36 .. .. -40 -10.70 Guyana.. .. 43 .. .. -105 -2.55 Haïti5 5 b 35 21 b 46 b -30 -0.88 Honduras6 5 45 35 b 59 b 50 0.98 Hongrie3 a 3 a 45 23 b 69 b 2 1.23 Islande.. .. 33 .. .. -1400 -0.26 Inde9 a .. 41 17 b 38 b -1000 -0.93 Indonésie.. .. 29 .. .. -1379 -4.06 Iran, Rép. islamique d'
28 16 .. .. .. 240 1.78 Iraq4 4 36 29 b 63 b 194 9.76 Irlande
11 11 42 24 57 158 4.94 Israël9 12 39 32 b 63 b 600 2.07 Italie
11 16 48 .. .. -100 -7.64 Jamaïque5 5 42 31 b 64 b 270 0.42 Japon.. .. 26 .. .. 100 3.75 Jordanie9 10 47 .. .. -600 -8.04 Kazakhstan.. .. 46 .. .. -212 -1.30 Kenya4 3 41 27 b 62 b -80 -0.34 Corée, République de1 a 2 a 24 .. .. 240 19.53 Koweït
13 a 14 a 47 .. .. -75 -2.94 Kirghizistan.. .. 47 .. .. -7 -0.24 Rép. dém. populaire lao
11 11 50 26 b 59 b -12 -1.03 Lettonie.. .. 30 .. .. -35 -2.01 Liban.. .. 38 .. .. -36 -4.02 Lesotho.. .. 40 .. .. -245 -15.41 Libéria.. .. 25 .. .. 10 0.36 Jamahiriya arabe libyenne
12 12 48 28 b 56 b -20 -1.15 Lituanie4 .. 38 24 b 76 b 20 8.70 Luxembourg
37 36 43 .. .. -10 -0.99 Macédoine, LERY5 b 6 b 44 .. .. 0 0.00 Madagascar.. .. 49 .. .. -20 -0.33 Malawi4 4 38 32 c 50 c 150 1.24 Malaisie.. .. 44 19 c 50 c 0 0.00 Maldives.. .. 46 .. .. -134 -2.13 Mali8 9 28 32 b 66 b 6 2.77 Malte.. .. .. .. .. .. .. Iles Marshall
22 25 .. .. .. -4 -2.05 Martinique.. .. 44 .. .. 30 2.10 Mauritanie
10 f 13 f 33 .. .. 0 0.00 Maurice
(9) (10)
Migration
Pour les sources et les notes, se reporter à la fin du tableau.
Unemployment rate
Taux de chômage
(13)
7.5 Quelques indicateurs de développement : enseignement, emploi, égalité entre hommes et femmes et migration (suite)
(7) (8)
Pays ou zones
Net number of migrants
(Thousands)
Nombre net de migrants (Milliers)
Female labour force as % of total labour
force
Main-d'œuvre féminine en % de la main-d'œuvre totale
Employment in industry and services as % of total employment
Emploi dans l'industrie et services en % de l'emploi total Net migration rate
per 1 000 inhabitants
Taux net de migration par
1 000 habitants
(11)
Female unemployment rate
Taux de chômage féminin Industry
IndustrieServices
369
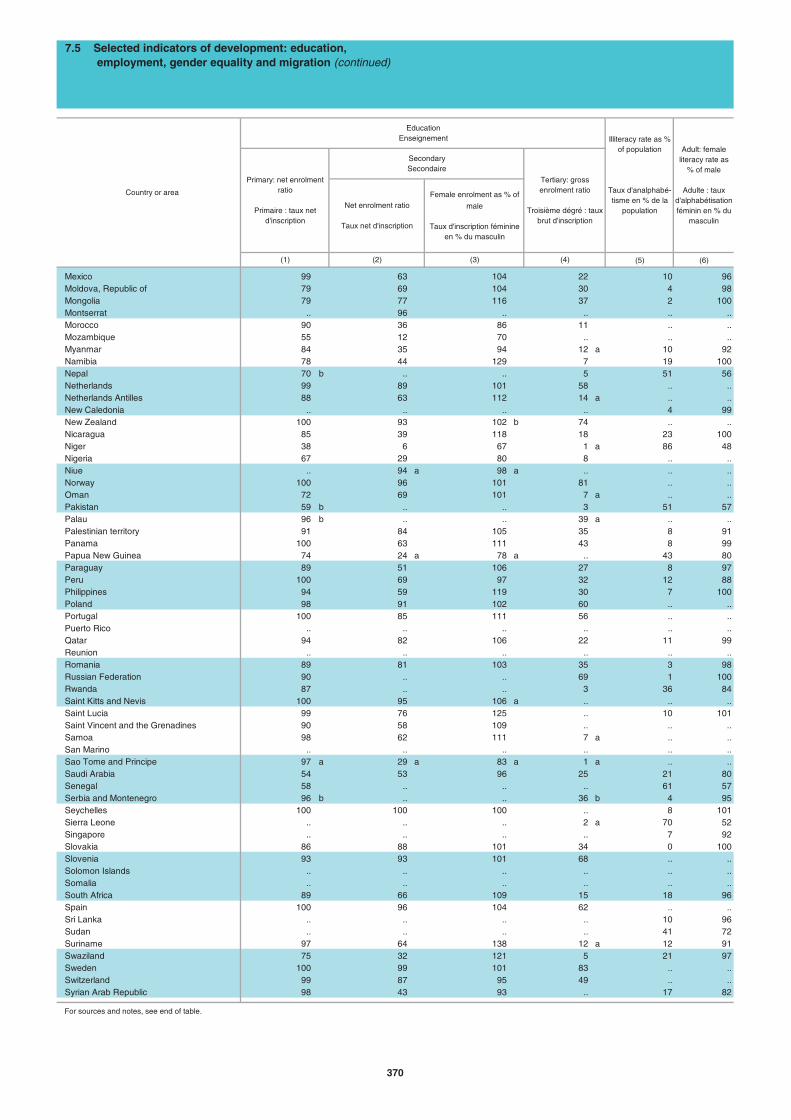
(5) (6)
Mexico 99 63 104 22 10 96Moldova, Republic of 79 69 104 30 4 98Mongolia 79 77 116 37 2 100Montserrat .. 96 .. .. .. ..Morocco 90 36 86 11 .. ..Mozambique 55 12 70 .. .. ..Myanmar 84 35 94 12 a 10 92Namibia 78 44 129 7 19 100Nepal 70 b .. .. 5 51 56Netherlands 99 89 101 58 .. ..Netherlands Antilles 88 63 112 14 a .. ..New Caledonia .. .. .. .. 4 99New Zealand 100 93 102 b 74 .. ..Nicaragua 85 39 118 18 23 100Niger 38 6 67 1 a 86 48Nigeria 67 29 80 8 .. ..Niue .. 94 a 98 a .. .. ..Norway 100 96 101 81 .. ..Oman 72 69 101 7 a .. ..Pakistan 59 b .. .. 3 51 57Palau 96 b .. .. 39 a .. ..Palestinian territory 91 84 105 35 8 91Panama 100 63 111 43 8 99Papua New Guinea 74 24 a 78 a .. 43 80Paraguay 89 51 106 27 8 97Peru 100 69 97 32 12 88Philippines 94 59 119 30 7 100Poland 98 91 102 60 .. ..Portugal 100 85 111 56 .. ..Puerto Rico .. .. .. .. .. ..Qatar 94 82 106 22 11 99Reunion .. .. .. .. .. ..Romania 89 81 103 35 3 98Russian Federation 90 .. .. 69 1 100Rwanda 87 .. .. 3 36 84Saint Kitts and Nevis 100 95 106 a .. .. ..Saint Lucia 99 76 125 .. 10 101Saint Vincent and the Grenadines 90 58 109 .. .. ..Samoa 98 62 111 7 a .. ..San Marino .. .. .. .. .. ..Sao Tome and Principe 97 a 29 a 83 a 1 a .. ..Saudi Arabia 54 53 96 25 21 80Senegal 58 .. .. .. 61 57Serbia and Montenegro 96 b .. .. 36 b 4 95Seychelles 100 100 100 .. 8 101Sierra Leone .. .. .. 2 a 70 52Singapore .. .. .. .. 7 92Slovakia 86 88 101 34 0 100Slovenia 93 93 101 68 .. ..Solomon Islands .. .. .. .. .. ..Somalia .. .. .. .. .. ..South Africa 89 66 109 15 18 96Spain 100 96 104 62 .. ..Sri Lanka .. .. .. .. 10 96Sudan .. .. .. .. 41 72Suriname 97 64 138 12 a 12 91Swaziland 75 32 121 5 21 97Sweden 100 99 101 83 .. ..Switzerland 99 87 95 49 .. ..Syrian Arab Republic 98 43 93 .. 17 82
For sources and notes, see end of table.
Female enrolment as % of
male
Taux d'inscription féminine en % du masculin
(3)
Adult: female literacy rate as
% of male
Adulte : taux d'alphabétisation féminin en % du
masculin
(4)
Illiteracy rate as % of population
Taux d'analphabé-tisme en % de la
population
Primary: net enrolment ratio
Primaire : taux net d'inscription
Net enrolment ratio
Taux net d'inscription
SecondarySecondaire
Tertiary: gross enrolment ratio
Troisième dégré : taux brut d'inscription
7.5 Selected indicators of development: education, employment, gender equality and migration (continued)
Country or area
(1) (2)
EducationEnseignement
370
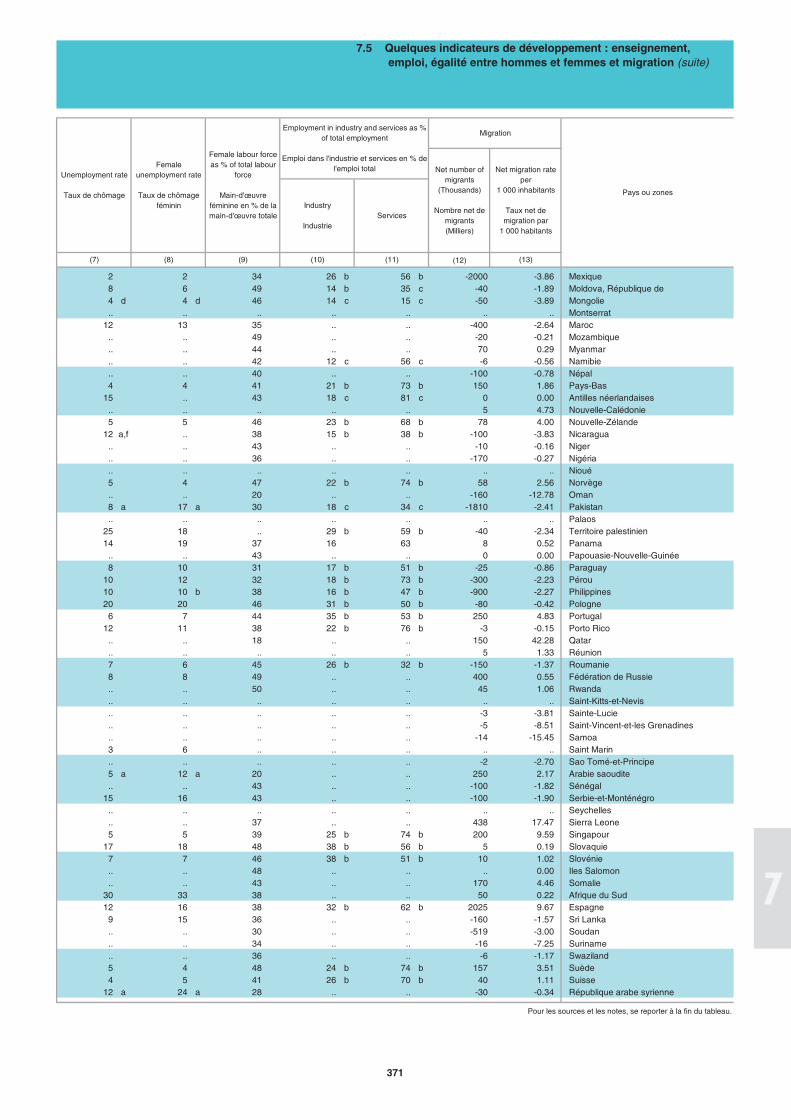
(12)
2 2 34 26 b 56 b -2000 -3.86 Mexique8 6 49 14 b 35 c -40 -1.89 Moldova, République de4 d 4 d 46 14 c 15 c -50 -3.89 Mongolie.. .. .. .. .. .. .. Montserrat
12 13 35 .. .. -400 -2.64 Maroc.. .. 49 .. .. -20 -0.21 Mozambique.. .. 44 .. .. 70 0.29 Myanmar.. .. 42 12 c 56 c -6 -0.56 Namibie.. .. 40 .. .. -100 -0.78 Népal4 4 41 21 b 73 b 150 1.86 Pays-Bas
15 .. 43 18 c 81 c 0 0.00 Antilles néerlandaises.. .. .. .. .. 5 4.73 Nouvelle-Calédonie5 5 46 23 b 68 b 78 4.00 Nouvelle-Zélande
12 a,f .. 38 15 b 38 b -100 -3.83 Nicaragua.. .. 43 .. .. -10 -0.16 Niger.. .. 36 .. .. -170 -0.27 Nigéria.. .. .. .. .. .. .. Nioué5 4 47 22 b 74 b 58 2.56 Norvège.. .. 20 .. .. -160 -12.78 Oman8 a 17 a 30 18 c 34 c -1810 -2.41 Pakistan.. .. .. .. .. .. .. Palaos
25 18 .. 29 b 59 b -40 -2.34 Territoire palestinien 14 19 37 16 63 8 0.52 Panama
.. .. 43 .. .. 0 0.00 Papouasie-Nouvelle-Guinée8 10 31 17 b 51 b -25 -0.86 Paraguay
10 12 32 18 b 73 b -300 -2.23 Pérou10 10 b 38 16 b 47 b -900 -2.27 Philippines20 20 46 31 b 50 b -80 -0.42 Pologne
6 7 44 35 b 53 b 250 4.83 Portugal12 11 38 22 b 76 b -3 -0.15 Porto Rico
.. .. 18 .. .. 150 42.28 Qatar
.. .. .. .. .. 5 1.33 Réunion7 6 45 26 b 32 b -150 -1.37 Roumanie8 8 49 .. .. 400 0.55 Fédération de Russie.. .. 50 .. .. 45 1.06 Rwanda.. .. .. .. .. .. .. Saint-Kitts-et-Nevis.. .. .. .. .. -3 -3.81 Sainte-Lucie.. .. .. .. .. -5 -8.51 Saint-Vincent-et-les Grenadines.. .. .. .. .. -14 -15.45 Samoa3 6 .. .. .. .. .. Saint Marin.. .. .. .. .. -2 -2.70 Sao Tomé-et-Principe5 a 12 a 20 .. .. 250 2.17 Arabie saoudite.. .. 43 .. .. -100 -1.82 Sénégal
15 16 43 .. .. -100 -1.90 Serbie-et-Monténégro.. .. .. .. .. .. .. Seychelles.. .. 37 .. .. 438 17.47 Sierra Leone5 5 39 25 b 74 b 200 9.59 Singapour
17 18 48 38 b 56 b 5 0.19 Slovaquie7 7 46 38 b 51 b 10 1.02 Slovénie.. .. 48 .. .. .. 0.00 Iles Salomon.. .. 43 .. .. 170 4.46 Somalie
30 33 38 .. .. 50 0.22 Afrique du Sud12 16 38 32 b 62 b 2025 9.67 Espagne
9 15 36 .. .. -160 -1.57 Sri Lanka.. .. 30 .. .. -519 -3.00 Soudan.. .. 34 .. .. -16 -7.25 Suriname.. .. 36 .. .. -6 -1.17 Swaziland5 4 48 24 b 74 b 157 3.51 Suède4 5 41 26 b 70 b 40 1.11 Suisse
12 a 24 a 28 .. .. -30 -0.34 République arabe syrienne
Pour les sources et les notes, se reporter à la fin du tableau.
Pays ou zones
(7) (8) (10)
Unemployment rate
Taux de chômageIndustry
Industrie
Female unemployment rate
Taux de chômage féminin
Female labour force as % of total labour
force
Main-d'œuvre féminine en % de la main-d'œuvre totale
(9)
Net number of migrants
(Thousands)
Nombre net de migrants (Milliers)
(13)
7.5 Quelques indicateurs de développement : enseignement, emploi, égalité entre hommes et femmes et migration (suite)
Employment in industry and services as % of total employment
Emploi dans l'industrie et services en % de l'emploi total Net migration rate
per 1 000 inhabitants
Taux net de migration par
1 000 habitants
Services
(11)
Migration
371
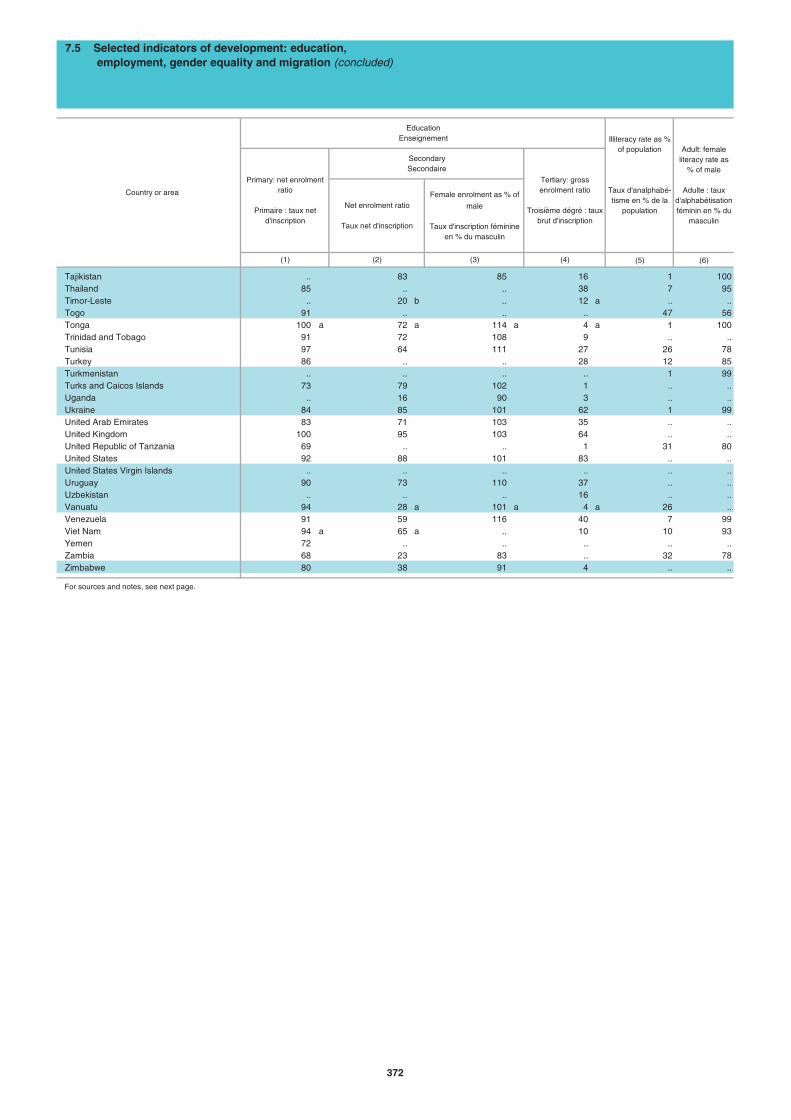
(5) (6)
Tajikistan .. 83 85 16 1 100Thailand 85 .. .. 38 7 95Timor-Leste .. 20 b .. 12 a .. ..Togo 91 .. .. .. 47 56Tonga 100 a 72 a 114 a 4 a 1 100Trinidad and Tobago 91 72 108 9 .. ..Tunisia 97 64 111 27 26 78Turkey 86 .. .. 28 12 85Turkmenistan .. .. .. .. 1 99Turks and Caicos Islands 73 79 102 1 .. ..Uganda .. 16 90 3 .. ..Ukraine 84 85 101 62 1 99United Arab Emirates 83 71 103 35 .. ..United Kingdom 100 95 103 64 .. ..United Republic of Tanzania 69 .. .. 1 31 80United States 92 88 101 83 .. ..United States Virgin Islands .. .. .. .. .. ..Uruguay 90 73 110 37 .. ..Uzbekistan .. .. .. 16 .. ..Vanuatu 94 28 a 101 a 4 a 26 ..Venezuela 91 59 116 40 7 99Viet Nam 94 a 65 a .. 10 10 93Yemen 72 .. .. .. .. ..Zambia 68 23 83 .. 32 78Zimbabwe 80 38 91 4 .. ..
For sources and notes, see next page.
Primary: net enrolment ratio
Primaire : taux net d'inscription
Net enrolment ratio
Taux net d'inscription
7.5 Selected indicators of development: education, employment, gender equality and migration (concluded)
Country or area Female enrolment as % of
male
Taux d'inscription féminine en % du masculin
(3)
EducationEnseignement
(1) (2) (4)
SecondarySecondaire
Tertiary: gross enrolment ratio
Troisième dégré : taux brut d'inscription
Illiteracy rate as % of population
Taux d'analphabé-tisme en % de la
population
Adult: female literacy rate as
% of male
Adulte : taux d'alphabétisation féminin en % du
masculin
372
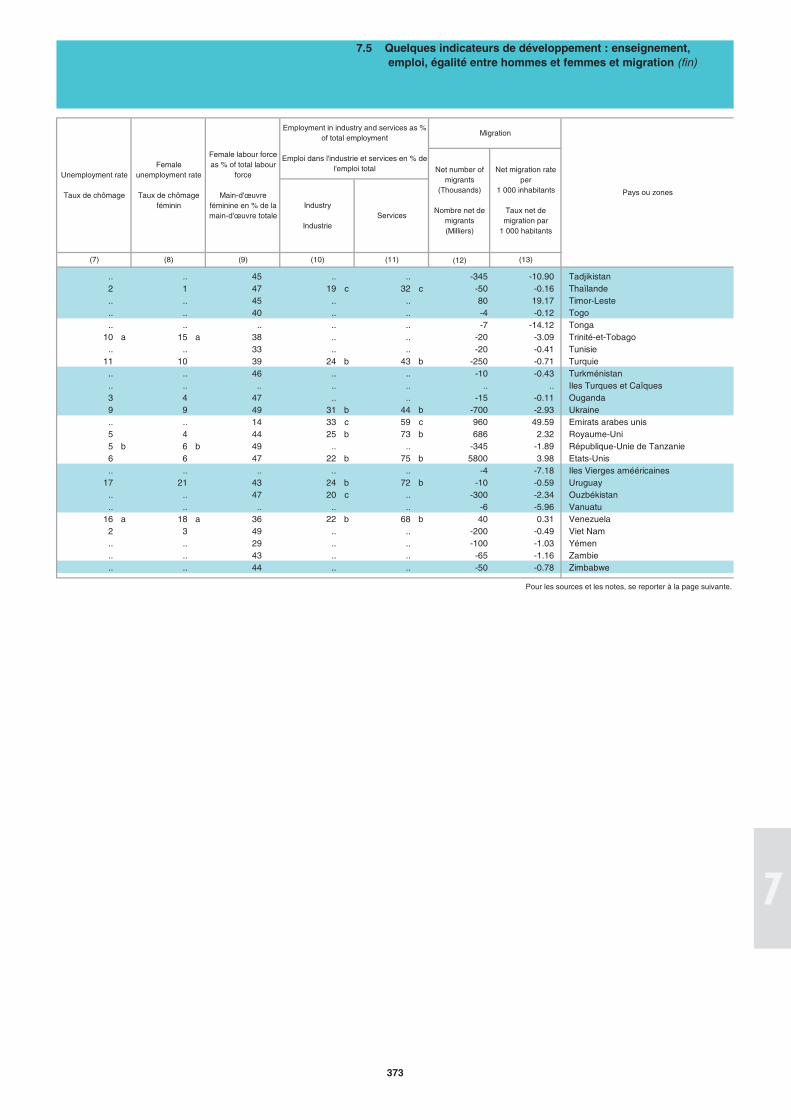
(12)
.. .. 45 .. .. -345 -10.90 Tadjikistan2 1 47 19 c 32 c -50 -0.16 Thaïlande.. .. 45 .. .. 80 19.17 Timor-Leste.. .. 40 .. .. -4 -0.12 Togo.. .. .. .. .. -7 -14.12 Tonga
10 a 15 a 38 .. .. -20 -3.09 Trinité-et-Tobago.. .. 33 .. .. -20 -0.41 Tunisie
11 10 39 24 b 43 b -250 -0.71 Turquie.. .. 46 .. .. -10 -0.43 Turkménistan.. .. .. .. .. .. .. Iles Turques et Caïques3 4 47 .. .. -15 -0.11 Ouganda9 9 49 31 b 44 b -700 -2.93 Ukraine.. .. 14 33 c 59 c 960 49.59 Emirats arabes unis5 4 44 25 b 73 b 686 2.32 Royaume-Uni5 b 6 b 49 .. .. -345 -1.89 République-Unie de Tanzanie6 6 47 22 b 75 b 5800 3.98 Etats-Unis.. .. .. .. .. -4 -7.18 Iles Vierges amééricaines
17 21 43 24 b 72 b -10 -0.59 Uruguay.. .. 47 20 c .. -300 -2.34 Ouzbékistan.. .. .. .. .. -6 -5.96 Vanuatu
16 a 18 a 36 22 b 68 b 40 0.31 Venezuela2 3 49 .. .. -200 -0.49 Viet Nam.. .. 29 .. .. -100 -1.03 Yémen.. .. 43 .. .. -65 -1.16 Zambie.. .. 44 .. .. -50 -0.78 Zimbabwe
Pays ou zones
(7) (8) (10) (11)(9) (13)
Migration
Unemployment rate
Taux de chômage
Female unemployment rate
Taux de chômage féminin
7.5 Quelques indicateurs de développement : enseignement, emploi, égalité entre hommes et femmes et migration (fin)
Pour les sources et les notes, se reporter à la page suivante.
Net migration rate per
1 000 inhabitants
Taux net de migration par
1 000 habitants
Net number of migrants
(Thousands)
Nombre net de migrants (Milliers)
Female labour force as % of total labour
force
Main-d'œuvre féminine en % de la main-d'œuvre totale
Employment in industry and services as % of total employment
Emploi dans l'industrie et services en % de l'emploi total
ServicesIndustry
Industrie
373

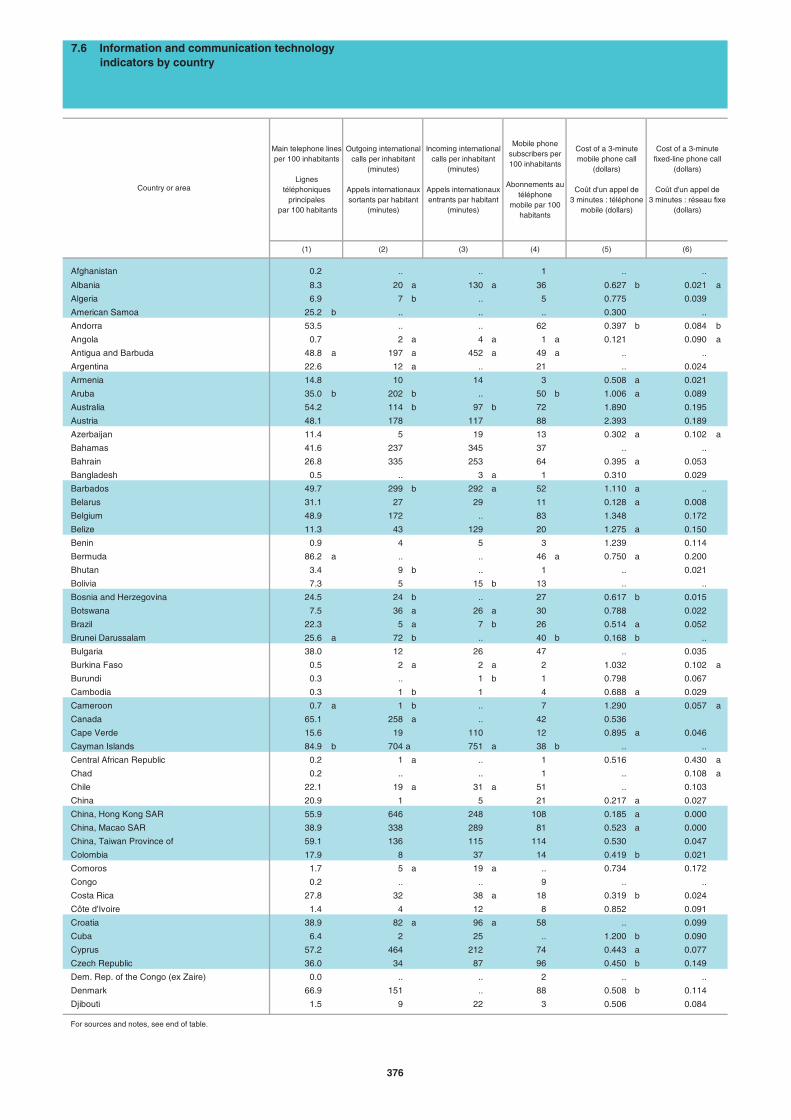
Afghanistan 0.2 .. .. 1 .. ..
Albania 8.3 20 a 130 a 36 0.627 b 0.021 a
Algeria 6.9 7 b .. 5 0.775 0.039
American Samoa 25.2 b .. .. .. 0.300 ..
Andorra 53.5 .. .. 62 0.397 b 0.084 b
Angola 0.7 2 a 4 a 1 a 0.121 0.090 a
Antigua and Barbuda 48.8 a 197 a 452 a 49 a .. ..
Argentina 22.6 12 a .. 21 .. 0.024
Armenia 14.8 10 14 3 0.508 a 0.021
Aruba 35.0 b 202 b .. 50 b 1.006 a 0.089
Australia 54.2 114 b 97 b 72 1.890 0.195
Austria 48.1 178 117 88 2.393 0.189
Azerbaijan 11.4 5 19 13 0.302 a 0.102 a
Bahamas 41.6 237 345 37 .. ..
Bahrain 26.8 335 253 64 0.395 a 0.053
Bangladesh 0.5 .. 3 a 1 0.310 0.029
Barbados 49.7 299 b 292 a 52 1.110 a ..
Belarus 31.1 27 29 11 0.128 a 0.008
Belgium 48.9 172 .. 83 1.348 0.172
Belize 11.3 43 129 20 1.275 a 0.150
Benin 0.9 4 5 3 1.239 0.114
Bermuda 86.2 a .. .. 46 a 0.750 a 0.200
Bhutan 3.4 9 b .. 1 .. 0.021
Bolivia 7.3 5 15 b 13 .. ..
Bosnia and Herzegovina 24.5 24 b .. 27 0.617 b 0.015
Botswana 7.5 36 a 26 a 30 0.788 0.022
Brazil 22.3 5 a 7 b 26 0.514 a 0.052
Brunei Darussalam 25.6 a 72 b .. 40 b 0.168 b ..
Bulgaria 38.0 12 26 47 .. 0.035
Burkina Faso 0.5 2 a 2 a 2 1.032 0.102 a
Burundi 0.3 .. 1 b 1 0.798 0.067
Cambodia 0.3 1 b 1 4 0.688 a 0.029
Cameroon 0.7 a 1 b .. 7 1.290 0.057 a
Canada 65.1 258 a .. 42 0.536
Cape Verde 15.6 19 110 12 0.895 a 0.046
Cayman Islands 84.9 b 704 a 751 a 38 b .. ..
Central African Republic 0.2 1 a .. 1 0.516 0.430 a
Chad 0.2 .. .. 1 .. 0.108 a
Chile 22.1 19 a 31 a 51 .. 0.103
China 20.9 1 5 21 0.217 a 0.027
China, Hong Kong SAR 55.9 646 248 108 0.185 a 0.000
China, Macao SAR 38.9 338 289 81 0.523 a 0.000
China, Taiwan Province of 59.1 136 115 114 0.530 0.047
Colombia 17.9 8 37 14 0.419 b 0.021
Comoros 1.7 5 a 19 a .. 0.734 0.172
Congo 0.2 .. .. 9 .. ..
Costa Rica 27.8 32 38 a 18 0.319 b 0.024
Côte d'Ivoire 1.4 4 12 8 0.852 0.091
Croatia 38.9 82 a 96 a 58 .. 0.099
Cuba 6.4 2 25 .. 1.200 b 0.090
Cyprus 57.2 464 212 74 0.443 a 0.077
Czech Republic 36.0 34 87 96 0.450 b 0.149
Dem. Rep. of the Congo (ex Zaire) 0.0 .. .. 2 .. ..
Denmark 66.9 151 .. 88 0.508 b 0.114
Djibouti 1.5 9 22 3 0.506 0.084
For sources and notes, see end of table.
7.6 Information and communication technology indicators by country
Outgoing international calls per inhabitant
(minutes)
Appels internationaux sortants par habitant
(minutes)
(4)
Mobile phone subscribers per 100 inhabitants
Abonnements au téléphone
mobile par 100 habitants
Cost of a 3-minute mobile phone call
(dollars)
Coût d'un appel de 3 minutes : téléphone
mobile (dollars)
Cost of a 3-minute fixed-line phone call
(dollars)
Coût d'un appel de 3 minutes : réseau fixe
(dollars)
(5)(2) (3)
Main telephone lines per 100 inhabitants
Lignes téléphoniques
principales par 100 habitants
Incoming international calls per inhabitant
(minutes)
Appels internationaux entrants par habitant
(minutes)
Country or area
(1) (6)
376
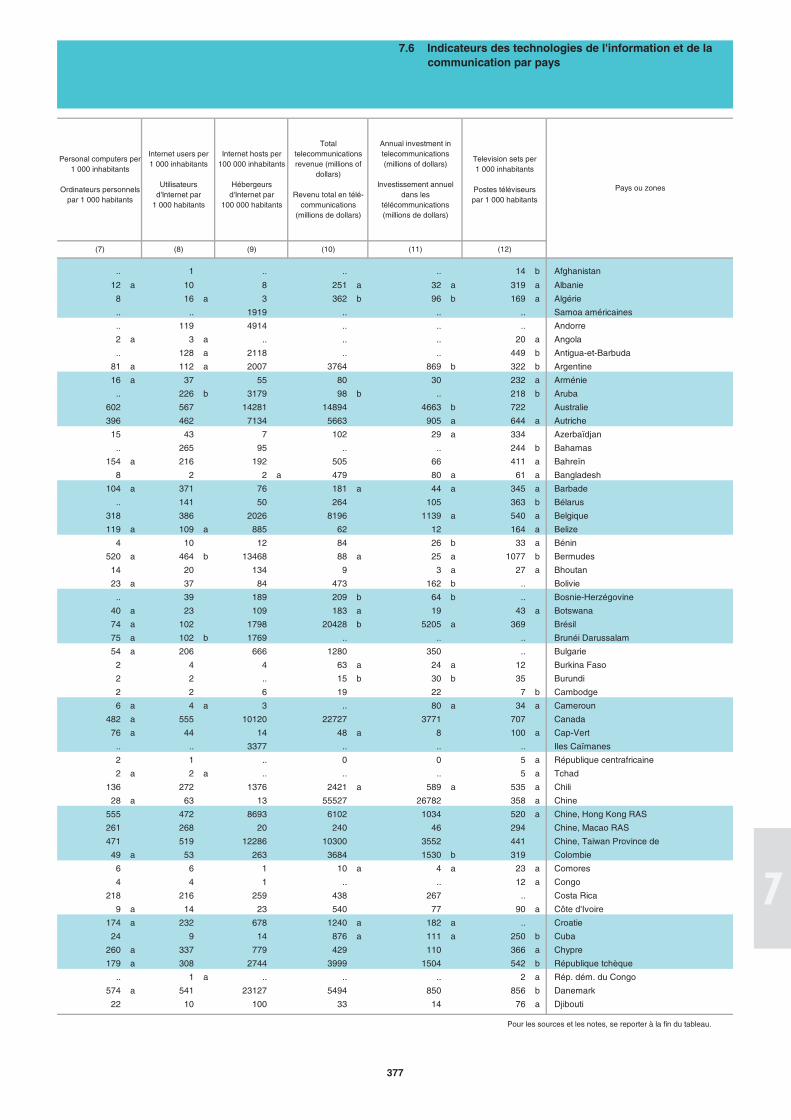
.. 1 .. .. .. 14 b Afghanistan
12 a 10 8 251 a 32 a 319 a Albanie
8 16 a 3 362 b 96 b 169 a Algérie
.. .. 1919 .. .. .. Samoa américaines
.. 119 4914 .. .. .. Andorre
2 a 3 a .. .. .. 20 a Angola
.. 128 a 2118 .. .. 449 b Antigua-et-Barbuda
81 a 112 a 2007 3764 869 b 322 b Argentine
16 a 37 55 80 30 232 a Arménie
.. 226 b 3179 98 b .. 218 b Aruba
602 567 14281 14894 4663 b 722 Australie
396 462 7134 5663 905 a 644 a Autriche
15 43 7 102 29 a 334 Azerbaïdjan
.. 265 95 .. .. 244 b Bahamas
154 a 216 192 505 66 411 a Bahreïn
8 2 2 a 479 80 a 61 a Bangladesh
104 a 371 76 181 a 44 a 345 a Barbade
.. 141 50 264 105 363 b Bélarus
318 386 2026 8196 1139 a 540 a Belgique
119 a 109 a 885 62 12 164 a Belize
4 10 12 84 26 b 33 a Bénin
520 a 464 b 13468 88 a 25 a 1077 b Bermudes
14 20 134 9 3 a 27 a Bhoutan
23 a 37 84 473 162 b .. Bolivie
.. 39 189 209 b 64 b .. Bosnie-Herzégovine
40 a 23 109 183 a 19 43 a Botswana
74 a 102 1798 20428 b 5205 a 369 Brésil
75 a 102 b 1769 .. .. .. Brunéi Darussalam
54 a 206 666 1280 350 .. Bulgarie
2 4 4 63 a 24 a 12 Burkina Faso
2 2 .. 15 b 30 b 35 Burundi
2 2 6 19 22 7 b Cambodge
6 a 4 a 3 .. 80 a 34 a Cameroun
482 a 555 10120 22727 3771 707 Canada
76 a 44 14 48 a 8 100 a Cap-Vert
.. .. 3377 .. .. .. Iles Caïmanes
2 1 .. 0 0 5 a République centrafricaine
2 a 2 a .. .. .. 5 a Tchad
136 272 1376 2421 a 589 a 535 a Chili
28 a 63 13 55527 26782 358 a Chine
555 472 8693 6102 1034 520 a Chine, Hong Kong RAS
261 268 20 240 46 294 Chine, Macao RAS
471 519 12286 10300 3552 441 Chine, Taiwan Province de
49 a 53 263 3684 1530 b 319 Colombie
6 6 1 10 a 4 a 23 a Comores
4 4 1 .. .. 12 a Congo
218 216 259 438 267 .. Costa Rica
9 a 14 23 540 77 90 a Côte d'Ivoire
174 a 232 678 1240 a 182 a .. Croatie
24 9 14 876 a 111 a 250 b Cuba
260 a 337 779 429 110 366 a Chypre
179 a 308 2744 3999 1504 542 b République tchèque
.. 1 a .. .. .. 2 a Rép. dém. du Congo
574 a 541 23127 5494 850 856 b Danemark
22 10 100 33 14 76 a Djibouti
Pour les sources et les notes, se reporter à la fin du tableau.
(7)
Internet users per 1 000 inhabitants
Utilisateurs d'Internet par
1 000 habitants
(8)
Personal computers per 1 000 inhabitants
Ordinateurs personnels par 1 000 habitants
7.6 Indicateurs des technologies de l'information et de la communication par pays
Pays ou zones
Internet hosts per 100 000 inhabitants
Hébergeurs d'Internet par
100 000 habitants
(9)
Total telecommunications revenue (millions of
dollars)
Revenu total en télé-communications
(millions de dollars)
Television sets per 1 000 inhabitants
Postes téléviseurs par 1 000 habitants
Annual investment in telecommunications (millions of dollars)
Investissement annuel dans les
télécommunications (millions de dollars)
(11)(10) (12)
377
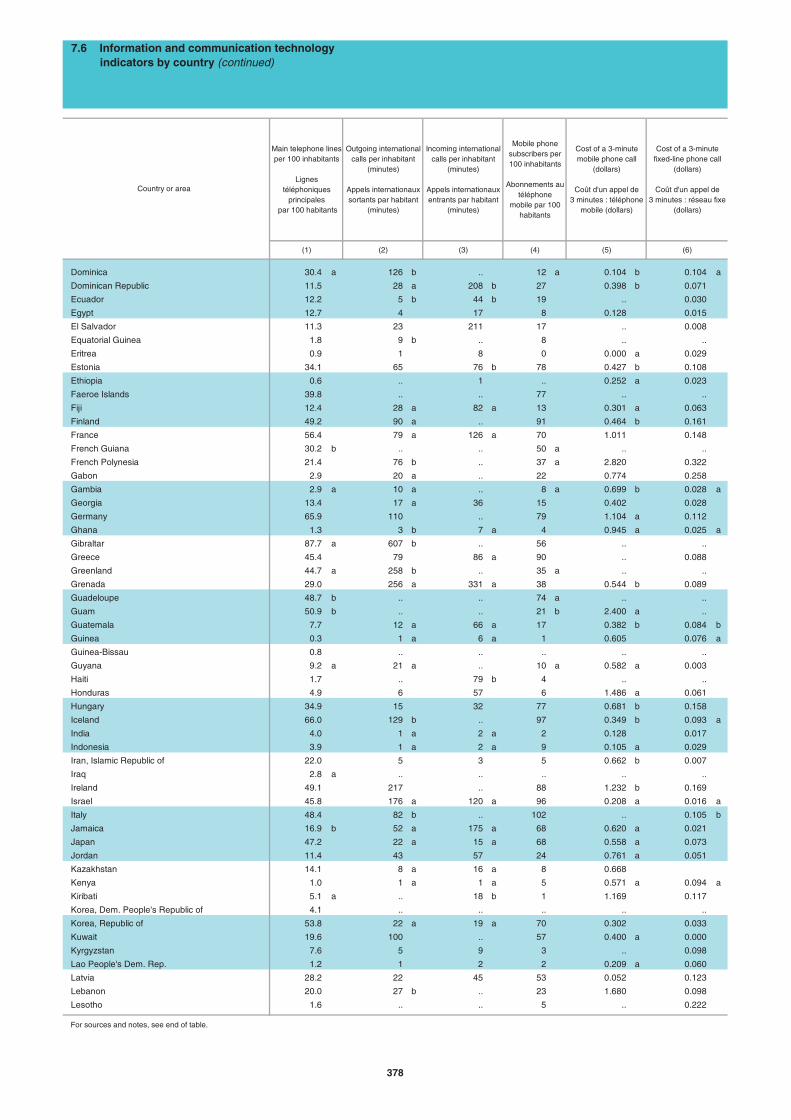
Dominica 30.4 a 126 b .. 12 a 0.104 b 0.104 a
Dominican Republic 11.5 28 a 208 b 27 0.398 b 0.071
Ecuador 12.2 5 b 44 b 19 .. 0.030
Egypt 12.7 4 17 8 0.128 0.015
El Salvador 11.3 23 211 17 .. 0.008
Equatorial Guinea 1.8 9 b .. 8 .. ..
Eritrea 0.9 1 8 0 0.000 a 0.029
Estonia 34.1 65 76 b 78 0.427 b 0.108
Ethiopia 0.6 .. 1 .. 0.252 a 0.023
Faeroe Islands 39.8 .. .. 77 .. ..
Fiji 12.4 28 a 82 a 13 0.301 a 0.063
Finland 49.2 90 a .. 91 0.464 b 0.161
France 56.4 79 a 126 a 70 1.011 0.148
French Guiana 30.2 b .. .. 50 a .. ..
French Polynesia 21.4 76 b .. 37 a 2.820 0.322
Gabon 2.9 20 a .. 22 0.774 0.258
Gambia 2.9 a 10 a .. 8 a 0.699 b 0.028 a
Georgia 13.4 17 a 36 15 0.402 0.028
Germany 65.9 110 .. 79 1.104 a 0.112
Ghana 1.3 3 b 7 a 4 0.945 a 0.025 a
Gibraltar 87.7 a 607 b .. 56 .. ..
Greece 45.4 79 86 a 90 .. 0.088
Greenland 44.7 a 258 b .. 35 a .. ..
Grenada 29.0 256 a 331 a 38 0.544 b 0.089
Guadeloupe 48.7 b .. .. 74 a .. ..
Guam 50.9 b .. .. 21 b 2.400 a ..
Guatemala 7.7 12 a 66 a 17 0.382 b 0.084 b
Guinea 0.3 1 a 6 a 1 0.605 0.076 a
Guinea-Bissau 0.8 .. .. .. .. ..
Guyana 9.2 a 21 a .. 10 a 0.582 a 0.003
Haiti 1.7 .. 79 b 4 .. ..
Honduras 4.9 6 57 6 1.486 a 0.061
Hungary 34.9 15 32 77 0.681 b 0.158
Iceland 66.0 129 b .. 97 0.349 b 0.093 a
India 4.0 1 a 2 a 2 0.128 0.017
Indonesia 3.9 1 a 2 a 9 0.105 a 0.029
Iran, Islamic Republic of 22.0 5 3 5 0.662 b 0.007
Iraq 2.8 a .. .. .. .. ..
Ireland 49.1 217 .. 88 1.232 b 0.169
Israel 45.8 176 a 120 a 96 0.208 a 0.016 a
Italy 48.4 82 b .. 102 .. 0.105 b
Jamaica 16.9 b 52 a 175 a 68 0.620 a 0.021
Japan 47.2 22 a 15 a 68 0.558 a 0.073
Jordan 11.4 43 57 24 0.761 a 0.051
Kazakhstan 14.1 8 a 16 a 8 0.668
Kenya 1.0 1 a 1 a 5 0.571 a 0.094 a
Kiribati 5.1 a .. 18 b 1 1.169 0.117
Korea, Dem. People's Republic of 4.1 .. .. .. .. ..
Korea, Republic of 53.8 22 a 19 a 70 0.302 0.033
Kuwait 19.6 100 .. 57 0.400 a 0.000
Kyrgyzstan 7.6 5 9 3 .. 0.098
Lao People's Dem. Rep. 1.2 1 2 2 0.209 a 0.060
Latvia 28.2 22 45 53 0.052 0.123
Lebanon 20.0 27 b .. 23 1.680 0.098
Lesotho 1.6 .. .. 5 .. 0.222
For sources and notes, see end of table.
(6)
Country or area
Cost of a 3-minute mobile phone call
(dollars)
Coût d'un appel de 3 minutes : téléphone
mobile (dollars)
(5)(3) (4)
7.6 Information and communication technology indicators by country (continued)
(2)
Incoming international calls per inhabitant
(minutes)
Appels internationaux entrants par habitant
(minutes)
Outgoing international calls per inhabitant
(minutes)
Appels internationaux sortants par habitant
(minutes)
Cost of a 3-minute fixed-line phone call
(dollars)
Coût d'un appel de 3 minutes : réseau fixe
(dollars)
(1)
Main telephone lines per 100 inhabitants
Lignes téléphoniques
principales par 100 habitants
Mobile phone subscribers per 100 inhabitants
Abonnements au téléphone
mobile par 100 habitants
378
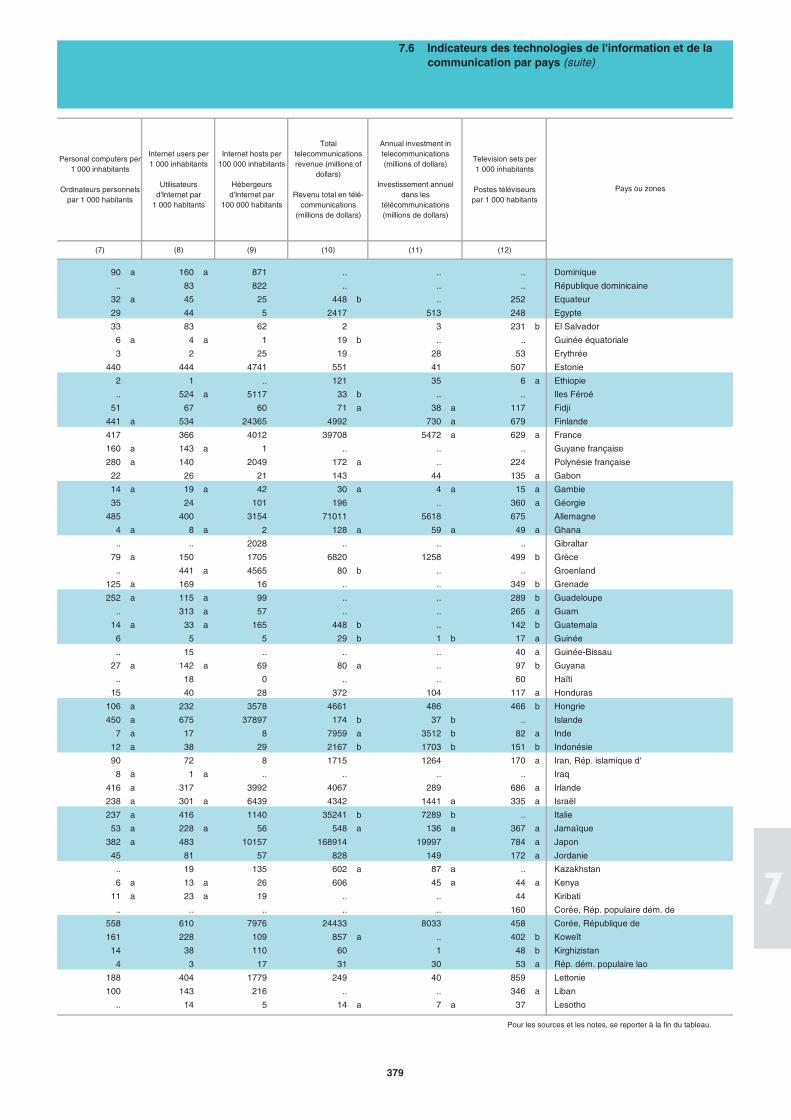
90 a 160 a 871 .. .. .. Dominique
.. 83 822 .. .. .. République dominicaine
32 a 45 25 448 b .. 252 Equateur
29 44 5 2417 513 248 Egypte
33 83 62 2 3 231 b El Salvador
6 a 4 a 1 19 b .. .. Guinée équatoriale
3 2 25 19 28 53 Erythrée
440 444 4741 551 41 507 Estonie
2 1 .. 121 35 6 a Ethiopie
.. 524 a 5117 33 b .. .. Iles Féroé
51 67 60 71 a 38 a 117 Fidji
441 a 534 24365 4992 730 a 679 Finlande
417 366 4012 39708 5472 a 629 a France
160 a 143 a 1 .. .. .. Guyane française
280 a 140 2049 172 a .. 224 Polynésie française
22 26 21 143 44 135 a Gabon
14 a 19 a 42 30 a 4 a 15 a Gambie
35 24 101 196 .. 360 a Géorgie
485 400 3154 71011 5618 675 Allemagne
4 a 8 a 2 128 a 59 a 49 a Ghana
.. .. 2028 .. .. .. Gibraltar
79 a 150 1705 6820 1258 499 b Grèce
.. 441 a 4565 80 b .. .. Groenland
125 a 169 16 .. .. 349 b Grenade
252 a 115 a 99 .. .. 289 b Guadeloupe
.. 313 a 57 .. .. 265 a Guam
14 a 33 a 165 448 b .. 142 b Guatemala
6 5 5 29 b 1 b 17 a Guinée
.. 15 .. .. .. 40 a Guinée-Bissau
27 a 142 a 69 80 a .. 97 b Guyana
.. 18 0 .. .. 60 Haïti
15 40 28 372 104 117 a Honduras
106 a 232 3578 4661 486 466 b Hongrie
450 a 675 37897 174 b 37 b .. Islande
7 a 17 8 7959 a 3512 b 82 a Inde
12 a 38 29 2167 b 1703 b 151 b Indonésie
90 72 8 1715 1264 170 a Iran, Rép. islamique d'
8 a 1 a .. .. .. .. Iraq
416 a 317 3992 4067 289 686 a Irlande
238 a 301 a 6439 4342 1441 a 335 a Israël
237 a 416 1140 35241 b 7289 b .. Italie
53 a 228 a 56 548 a 136 a 367 a Jamaïque
382 a 483 10157 168914 19997 784 a Japon
45 81 57 828 149 172 a Jordanie
.. 19 135 602 a 87 a .. Kazakhstan
6 a 13 a 26 606 45 a 44 a Kenya
11 a 23 a 19 .. .. 44 Kiribati
.. .. .. .. .. 160 Corée, Rép. populaire dém. de
558 610 7976 24433 8033 458 Corée, République de
161 228 109 857 a .. 402 b Koweït
14 38 110 60 1 48 b Kirghizistan
4 3 17 31 30 53 a Rép. dém. populaire lao
188 404 1779 249 40 859 Lettonie
100 143 216 .. .. 346 a Liban
.. 14 5 14 a 7 a 37 Lesotho
Pour les sources et les notes, se reporter à la fin du tableau.
Total telecommunications revenue (millions of
dollars)
Revenu total en télé-communications
(millions de dollars)
(10)
7.6 Indicateurs des technologies de l'information et de la communication par pays (suite)
(7) (8) (9)
Television sets per 1 000 inhabitants
Postes téléviseurs par 1 000 habitants
Pays ou zones
(12)(11)
Annual investment in telecommunications (millions of dollars)
Investissement annuel dans les
télécommunications (millions de dollars)
Personal computers per 1 000 inhabitants
Ordinateurs personnels par 1 000 habitants
Internet users per 1 000 inhabitants
Utilisateurs d'Internet par
1 000 habitants
Internet hosts per 100 000 inhabitants
Hébergeurs d'Internet par
100 000 habitants
379
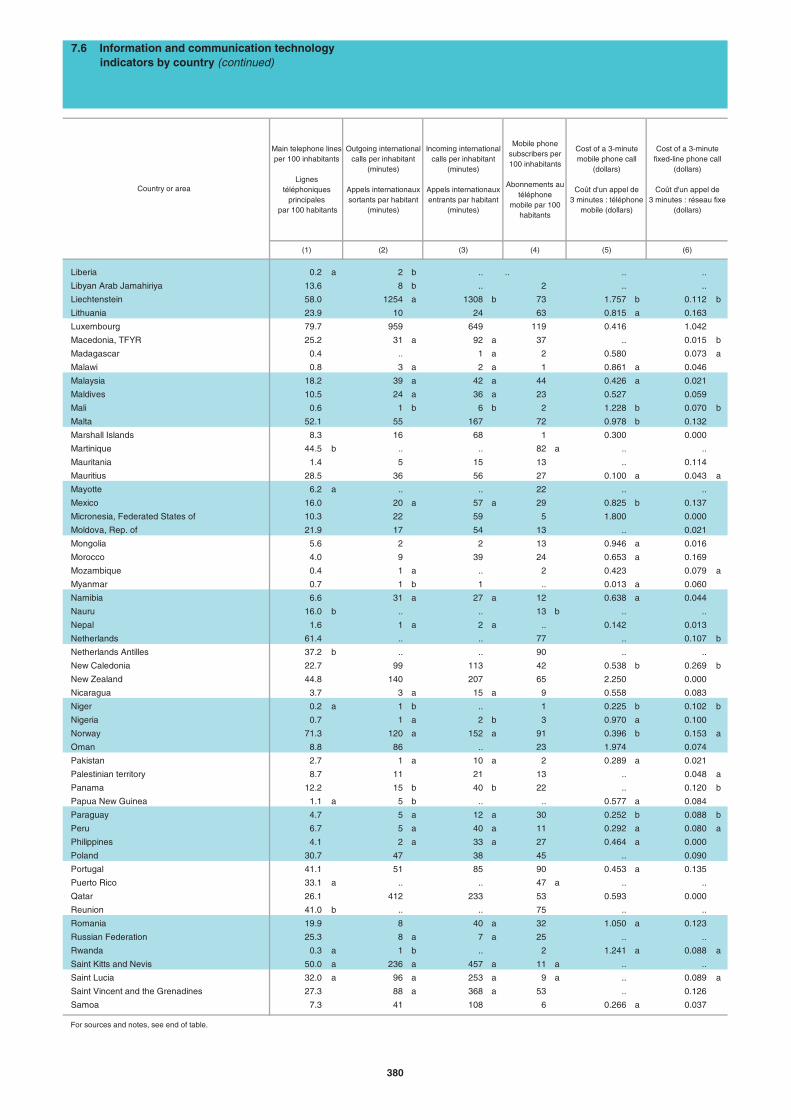
Liberia 0.2 a 2 b .. .. .. ..
Libyan Arab Jamahiriya 13.6 8 b .. 2 .. ..
Liechtenstein 58.0 1254 a 1308 b 73 1.757 b 0.112 b
Lithuania 23.9 10 24 63 0.815 a 0.163
Luxembourg 79.7 959 649 119 0.416 1.042
Macedonia, TFYR 25.2 31 a 92 a 37 .. 0.015 b
Madagascar 0.4 .. 1 a 2 0.580 0.073 a
Malawi 0.8 3 a 2 a 1 0.861 a 0.046
Malaysia 18.2 39 a 42 a 44 0.426 a 0.021
Maldives 10.5 24 a 36 a 23 0.527 0.059
Mali 0.6 1 b 6 b 2 1.228 b 0.070 b
Malta 52.1 55 167 72 0.978 b 0.132
Marshall Islands 8.3 16 68 1 0.300 0.000
Martinique 44.5 b .. .. 82 a .. ..
Mauritania 1.4 5 15 13 .. 0.114
Mauritius 28.5 36 56 27 0.100 a 0.043 a
Mayotte 6.2 a .. .. 22 .. ..
Mexico 16.0 20 a 57 a 29 0.825 b 0.137
Micronesia, Federated States of 10.3 22 59 5 1.800 0.000
Moldova, Rep. of 21.9 17 54 13 .. 0.021
Mongolia 5.6 2 2 13 0.946 a 0.016
Morocco 4.0 9 39 24 0.653 a 0.169
Mozambique 0.4 1 a .. 2 0.423 0.079 a
Myanmar 0.7 1 b 1 .. 0.013 a 0.060
Namibia 6.6 31 a 27 a 12 0.638 a 0.044
Nauru 16.0 b .. .. 13 b .. ..
Nepal 1.6 1 a 2 a .. 0.142 0.013
Netherlands 61.4 .. .. 77 .. 0.107 b
Netherlands Antilles 37.2 b .. .. 90 .. ..
New Caledonia 22.7 99 113 42 0.538 b 0.269 b
New Zealand 44.8 140 207 65 2.250 0.000
Nicaragua 3.7 3 a 15 a 9 0.558 0.083
Niger 0.2 a 1 b .. 1 0.225 b 0.102 b
Nigeria 0.7 1 a 2 b 3 0.970 a 0.100
Norway 71.3 120 a 152 a 91 0.396 b 0.153 a
Oman 8.8 86 .. 23 1.974 0.074
Pakistan 2.7 1 a 10 a 2 0.289 a 0.021
Palestinian territory 8.7 11 21 13 .. 0.048 a
Panama 12.2 15 b 40 b 22 .. 0.120 b
Papua New Guinea 1.1 a 5 b .. .. 0.577 a 0.084
Paraguay 4.7 5 a 12 a 30 0.252 b 0.088 b
Peru 6.7 5 a 40 a 11 0.292 a 0.080 a
Philippines 4.1 2 a 33 a 27 0.464 a 0.000
Poland 30.7 47 38 45 .. 0.090
Portugal 41.1 51 85 90 0.453 a 0.135
Puerto Rico 33.1 a .. .. 47 a .. ..
Qatar 26.1 412 233 53 0.593 0.000
Reunion 41.0 b .. .. 75 .. ..
Romania 19.9 8 40 a 32 1.050 a 0.123
Russian Federation 25.3 8 a 7 a 25 .. ..
Rwanda 0.3 a 1 b .. 2 1.241 a 0.088 a
Saint Kitts and Nevis 50.0 a 236 a 457 a 11 a .. ..
Saint Lucia 32.0 a 96 a 253 a 9 a .. 0.089 a
Saint Vincent and the Grenadines 27.3 88 a 368 a 53 .. 0.126
Samoa 7.3 41 108 6 0.266 a 0.037
For sources and notes, see end of table.
Cost of a 3-minute fixed-line phone call
(dollars)
Coût d'un appel de 3 minutes : réseau fixe
(dollars)
Cost of a 3-minute mobile phone call
(dollars)
Coût d'un appel de 3 minutes : téléphone
mobile (dollars)
Country or area
Incoming international calls per inhabitant
(minutes)
Appels internationaux entrants par habitant
(minutes)
Main telephone lines per 100 inhabitants
Lignes téléphoniques
principales par 100 habitants
(1) (2) (3)
Outgoing international calls per inhabitant
(minutes)
Appels internationaux sortants par habitant
(minutes)
7.6 Information and communication technology indicators by country (continued)
Mobile phone subscribers per 100 inhabitants
Abonnements au téléphone
mobile par 100 habitants
(4) (5) (6)
380
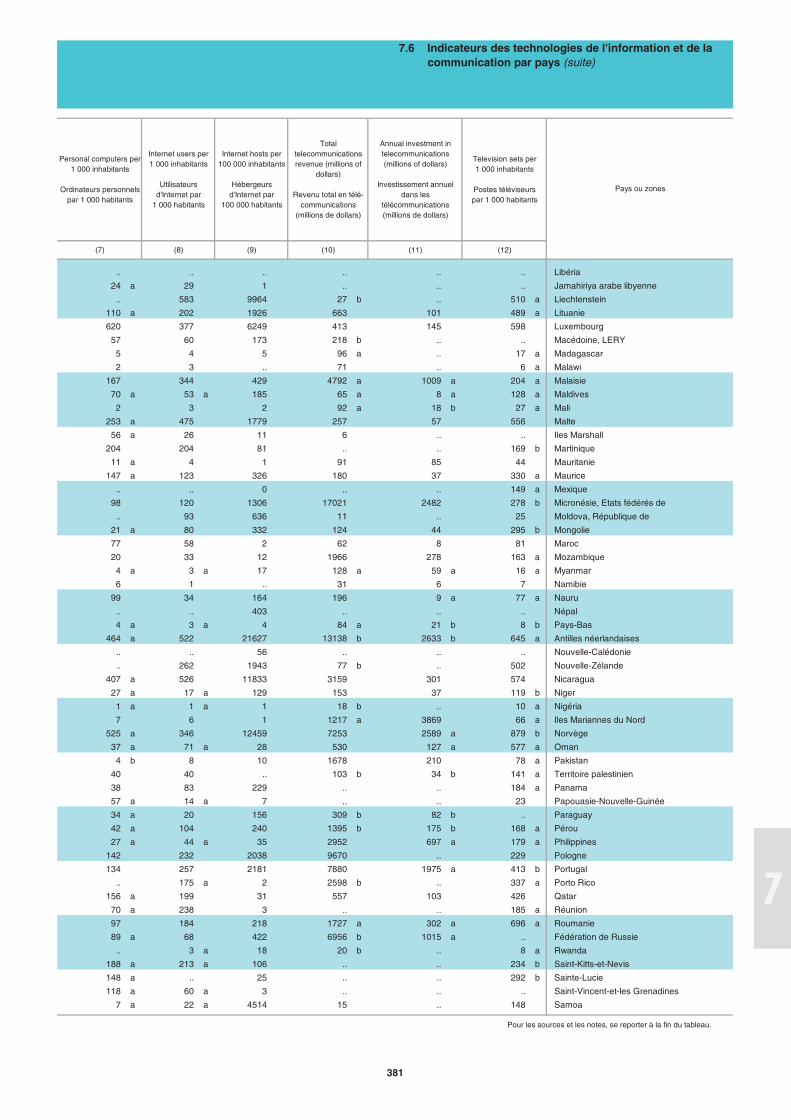
.. .. .. .. .. .. Libéria
24 a 29 1 .. .. .. Jamahiriya arabe libyenne
.. 583 9964 27 b .. 510 a Liechtenstein
110 a 202 1926 663 101 489 a Lituanie
620 377 6249 413 145 598 Luxembourg
57 60 173 218 b .. .. Macédoine, LERY
5 4 5 96 a .. 17 a Madagascar
2 3 .. 71 .. 6 a Malawi
167 344 429 4792 a 1009 a 204 a Malaisie
70 a 53 a 185 65 a 8 a 128 a Maldives
2 3 2 92 a 18 b 27 a Mali
253 a 475 1779 257 57 556 Malte
56 a 26 11 6 .. .. Iles Marshall
204 204 81 .. .. 169 b Martinique
11 a 4 1 91 85 44 Mauritanie
147 a 123 326 180 37 330 a Maurice
.. .. 0 .. .. 149 a Mexique
98 120 1306 17021 2482 278 b Micronésie, Etats fédérés de
.. 93 636 11 .. 25 Moldova, République de
21 a 80 332 124 44 295 b Mongolie
77 58 2 62 8 81 Maroc
20 33 12 1966 278 163 a Mozambique
4 a 3 a 17 128 a 59 a 16 a Myanmar
6 1 .. 31 6 7 Namibie
99 34 164 196 9 a 77 a Nauru
.. .. 403 .. .. .. Népal
4 a 3 a 4 84 a 21 b 8 b Pays-Bas
464 a 522 21627 13138 b 2633 b 645 a Antilles néerlandaises
.. .. 56 .. .. .. Nouvelle-Calédonie
.. 262 1943 77 b .. 502 Nouvelle-Zélande
407 a 526 11833 3159 301 574 Nicaragua
27 a 17 a 129 153 37 119 b Niger
1 a 1 a 1 18 b .. 10 a Nigéria
7 6 1 1217 a 3869 66 a Iles Mariannes du Nord
525 a 346 12459 7253 2589 a 879 b Norvège
37 a 71 a 28 530 127 a 577 a Oman
4 b 8 10 1678 210 78 a Pakistan
40 40 .. 103 b 34 b 141 a Territoire palestinien
38 83 229 .. .. 184 a Panama
57 a 14 a 7 .. .. 23 Papouasie-Nouvelle-Guinée
34 a 20 156 309 b 82 b .. Paraguay
42 a 104 240 1395 b 175 b 168 a Pérou
27 a 44 a 35 2952 697 a 179 a Philippines
142 232 2038 9670 .. 229 Pologne
134 257 2181 7880 1975 a 413 b Portugal
.. 175 a 2 2598 b .. 337 a Porto Rico
156 a 199 31 557 103 426 Qatar
70 a 238 3 .. .. 185 a Réunion
97 184 218 1727 a 302 a 696 a Roumanie
89 a 68 422 6956 b 1015 a .. Fédération de Russie
.. 3 a 18 20 b .. 8 a Rwanda
188 a 213 a 106 .. .. 234 b Saint-Kitts-et-Nevis
148 a .. 25 .. .. 292 b Sainte-Lucie
118 a 60 a 3 .. .. .. Saint-Vincent-et-les Grenadines
7 a 22 a 4514 15 .. 148 Samoa
Pour les sources et les notes, se reporter à la fin du tableau.
(10)
Pays ou zones
(12)
Total telecommunications revenue (millions of
dollars)
Revenu total en télé-communications
(millions de dollars)
Television sets per 1 000 inhabitants
Postes téléviseurs par 1 000 habitants
Annual investment in telecommunications (millions of dollars)
Investissement annuel dans les
télécommunications (millions de dollars)
Personal computers per 1 000 inhabitants
Ordinateurs personnels par 1 000 habitants
Internet users per 1 000 inhabitants
Utilisateurs d'Internet par
1 000 habitants
Internet hosts per 100 000 inhabitants
Hébergeurs d'Internet par
100 000 habitants
7.6 Indicateurs des technologies de l'information et de la communication par pays (suite)
(7) (8) (9) (11)
381
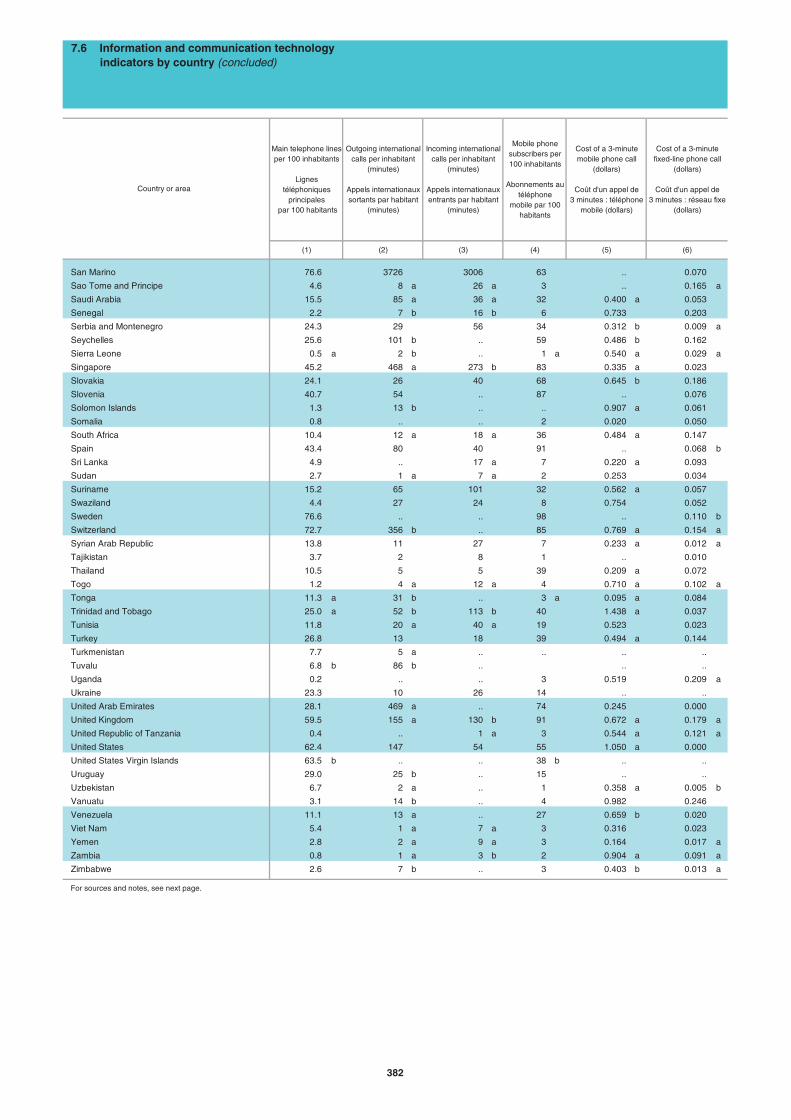
San Marino 76.6 3726 3006 63 .. 0.070
Sao Tome and Principe 4.6 8 a 26 a 3 .. 0.165 a
Saudi Arabia 15.5 85 a 36 a 32 0.400 a 0.053
Senegal 2.2 7 b 16 b 6 0.733 0.203
Serbia and Montenegro 24.3 29 56 34 0.312 b 0.009 a
Seychelles 25.6 101 b .. 59 0.486 b 0.162
Sierra Leone 0.5 a 2 b .. 1 a 0.540 a 0.029 a
Singapore 45.2 468 a 273 b 83 0.335 a 0.023
Slovakia 24.1 26 40 68 0.645 b 0.186
Slovenia 40.7 54 .. 87 .. 0.076
Solomon Islands 1.3 13 b .. .. 0.907 a 0.061
Somalia 0.8 .. .. 2 0.020 0.050
South Africa 10.4 12 a 18 a 36 0.484 a 0.147
Spain 43.4 80 40 91 .. 0.068 b
Sri Lanka 4.9 .. 17 a 7 0.220 a 0.093
Sudan 2.7 1 a 7 a 2 0.253 0.034
Suriname 15.2 65 101 32 0.562 a 0.057
Swaziland 4.4 27 24 8 0.754 0.052
Sweden 76.6 .. .. 98 .. 0.110 b
Switzerland 72.7 356 b .. 85 0.769 a 0.154 a
Syrian Arab Republic 13.8 11 27 7 0.233 a 0.012 a
Tajikistan 3.7 2 8 1 .. 0.010
Thailand 10.5 5 5 39 0.209 a 0.072
Togo 1.2 4 a 12 a 4 0.710 a 0.102 a
Tonga 11.3 a 31 b .. 3 a 0.095 a 0.084
Trinidad and Tobago 25.0 a 52 b 113 b 40 1.438 a 0.037
Tunisia 11.8 20 a 40 a 19 0.523 0.023
Turkey 26.8 13 18 39 0.494 a 0.144
Turkmenistan 7.7 5 a .. .. .. ..
Tuvalu 6.8 b 86 b .. .. ..
Uganda 0.2 .. .. 3 0.519 0.209 a
Ukraine 23.3 10 26 14 .. ..
United Arab Emirates 28.1 469 a .. 74 0.245 0.000
United Kingdom 59.5 155 a 130 b 91 0.672 a 0.179 a
United Republic of Tanzania 0.4 .. 1 a 3 0.544 a 0.121 a
United States 62.4 147 54 55 1.050 a 0.000
United States Virgin Islands 63.5 b .. .. 38 b .. ..
Uruguay 29.0 25 b .. 15 .. ..
Uzbekistan 6.7 2 a .. 1 0.358 a 0.005 b
Vanuatu 3.1 14 b .. 4 0.982 0.246
Venezuela 11.1 13 a .. 27 0.659 b 0.020
Viet Nam 5.4 1 a 7 a 3 0.316 0.023
Yemen 2.8 2 a 9 a 3 0.164 0.017 a
Zambia 0.8 1 a 3 b 2 0.904 a 0.091 a
Zimbabwe 2.6 7 b .. 3 0.403 b 0.013 a
For sources and notes, see next page.
7.6 Information and communication technology indicators by country (concluded)
Country or area
Mobile phone subscribers per 100 inhabitants
Abonnements au téléphone
mobile par 100 habitants
Main telephone lines per 100 inhabitants
Lignes téléphoniques
principales par 100 habitants
(6)
Cost of a 3-minute mobile phone call
(dollars)
Coût d'un appel de 3 minutes : téléphone
mobile (dollars)
Cost of a 3-minute fixed-line phone call
(dollars)
Coût d'un appel de 3 minutes : réseau fixe
(dollars)
Outgoing international calls per inhabitant
(minutes)
Appels internationaux sortants par habitant
(minutes)
Incoming international calls per inhabitant
(minutes)
Appels internationaux entrants par habitant
(minutes)
(1) (4)(2) (3) (5)
382
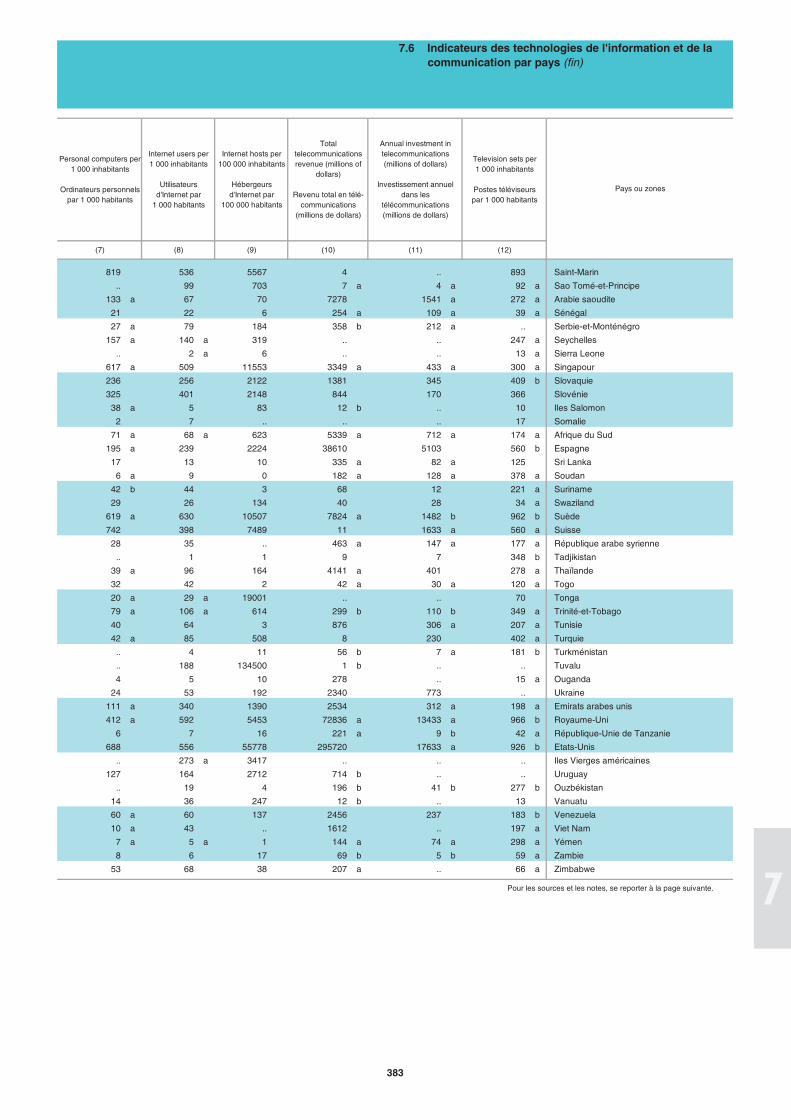
819 536 5567 4 .. 893 Saint-Marin
.. 99 703 7 a 4 a 92 a Sao Tomé-et-Principe
133 a 67 70 7278 1541 a 272 a Arabie saoudite
21 22 6 254 a 109 a 39 a Sénégal
27 a 79 184 358 b 212 a .. Serbie-et-Monténégro
157 a 140 a 319 .. .. 247 a Seychelles
.. 2 a 6 .. .. 13 a Sierra Leone
617 a 509 11553 3349 a 433 a 300 a Singapour
236 256 2122 1381 345 409 b Slovaquie
325 401 2148 844 170 366 Slovénie
38 a 5 83 12 b .. 10 Iles Salomon
2 7 .. .. .. 17 Somalie
71 a 68 a 623 5339 a 712 a 174 a Afrique du Sud
195 a 239 2224 38610 5103 560 b Espagne
17 13 10 335 a 82 a 125 Sri Lanka
6 a 9 0 182 a 128 a 378 a Soudan
42 b 44 3 68 12 221 a Suriname
29 26 134 40 28 34 a Swaziland
619 a 630 10507 7824 a 1482 b 962 b Suède
742 398 7489 11 1633 a 560 a Suisse
28 35 .. 463 a 147 a 177 a République arabe syrienne
.. 1 1 9 7 348 b Tadjikistan
39 a 96 164 4141 a 401 278 a Thaïlande
32 42 2 42 a 30 a 120 a Togo
20 a 29 a 19001 .. .. 70 Tonga
79 a 106 a 614 299 b 110 b 349 a Trinité-et-Tobago
40 64 3 876 306 a 207 a Tunisie
42 a 85 508 8 230 402 a Turquie
.. 4 11 56 b 7 a 181 b Turkménistan
.. 188 134500 1 b .. .. Tuvalu
4 5 10 278 .. 15 a Ouganda
24 53 192 2340 773 .. Ukraine
111 a 340 1390 2534 312 a 198 a Emirats arabes unis
412 a 592 5453 72836 a 13433 a 966 b Royaume-Uni
6 7 16 221 a 9 b 42 a République-Unie de Tanzanie
688 556 55778 295720 17633 a 926 b Etats-Unis
.. 273 a 3417 .. .. .. Iles Vierges américaines
127 164 2712 714 b .. .. Uruguay
.. 19 4 196 b 41 b 277 b Ouzbékistan
14 36 247 12 b .. 13 Vanuatu
60 a 60 137 2456 237 183 b Venezuela
10 a 43 .. 1612 .. 197 a Viet Nam
7 a 5 a 1 144 a 74 a 298 a Yémen
8 6 17 69 b 5 b 59 a Zambie
53 68 38 207 a .. 66 a Zimbabwe
Pour les sources et les notes, se reporter à la page suivante.
(12)
Pays ou zones
(10)
Total telecommunications revenue (millions of
dollars)
Revenu total en télé-communications
(millions de dollars)
7.6 Indicateurs des technologies de l'information et de la communication par pays (fin)
Television sets per 1 000 inhabitants
Postes téléviseurs par 1 000 habitants
(11)
Annual investment in telecommunications (millions of dollars)
Investissement annuel dans les
télécommunications (millions de dollars)
(9)
Personal computers per 1 000 inhabitants
Ordinateurs personnels par 1 000 habitants
Internet users per 1 000 inhabitants
Utilisateurs d'Internet par
1 000 habitants
Internet hosts per 100 000 inhabitants
Hébergeurs d'Internet par
100 000 habitants
(7) (8)
383
6 6