Uncovering implicit customer needs for explicit product ... · PDF fileUncovering implicit...
35
1 Uncovering implicit customer needs for explicit product positioning: Growing Prudential Annuities’ Variable Annuity Sales Jac Herschler SVP and Head of Business Strategy, Prudential Annuities V. Kumar Lenny Chair Professor Denish Shah Assistant Professor
Transcript of Uncovering implicit customer needs for explicit product ... · PDF fileUncovering implicit...
1
Uncovering implicit customer needs for explicit product positioning:
Growing Prudential Annuities’ Variable Annuity Sales
Jac HerschlerSVP and Head of Business Strategy, Prudential Annuities
V. KumarLenny Chair Professor
Denish ShahAssistant Professor
Copyright © Dr. V. Kumar
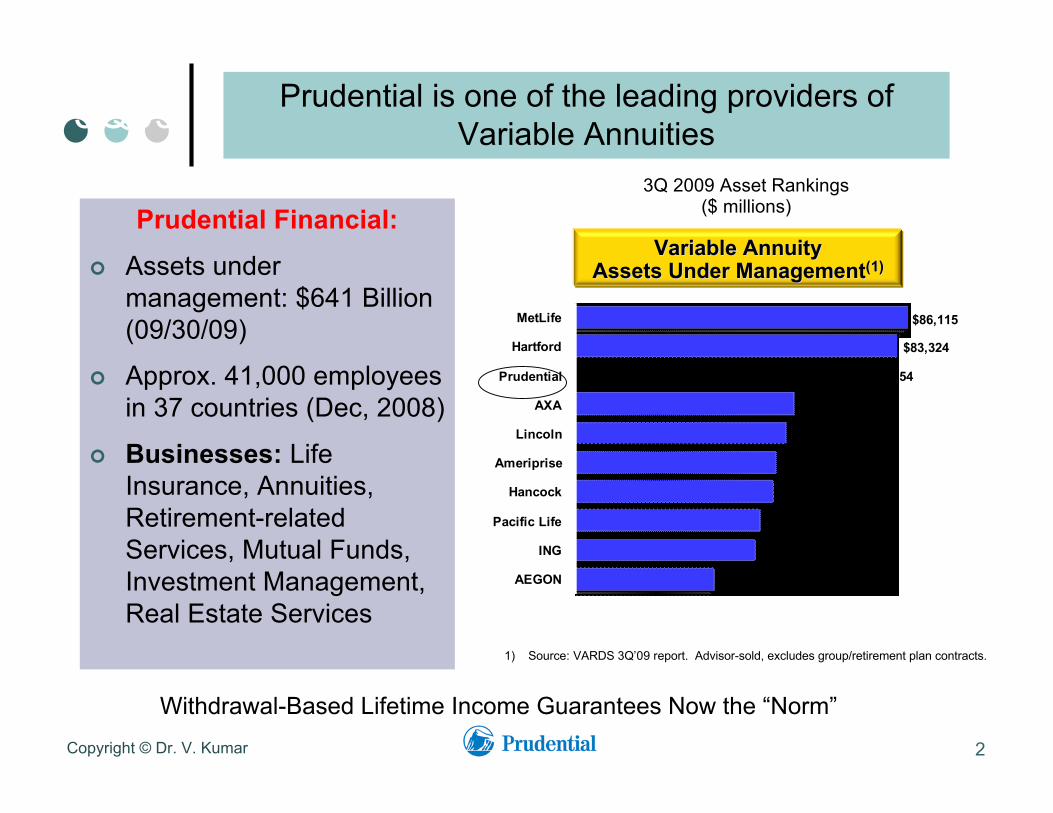
3Q 2009 Asset Rankings($ millions)
1) Source: VARDS 3Q’09 report. Advisor-sold, excludes group/retirement plan contracts.
3Q09
Variable AnnuityVariable AnnuityAssets Under ManagementAssets Under Management(1)(1)
$36,023
$46,554
$47,935
$51,387
$52,166
$54,518
$56,586
$74,554
$83,324
$86,115
AEGON
ING
Pacific Life
Hancock
Ameriprise
Lincoln
AXA
Prudential
Hartford
MetLife
2
Prudential is one of the leading providers ofVariable Annuities
Withdrawal-Based Lifetime Income Guarantees Now the “Norm”
Prudential Financial:
Assets undermanagement: $641 Billion(09/30/09)
Approx. 41,000 employeesin 37 countries (Dec, 2008)
Businesses: LifeInsurance, Annuities,Retirement-relatedServices, Mutual Funds,Investment Management,Real Estate Services
Copyright © Dr. V. Kumar
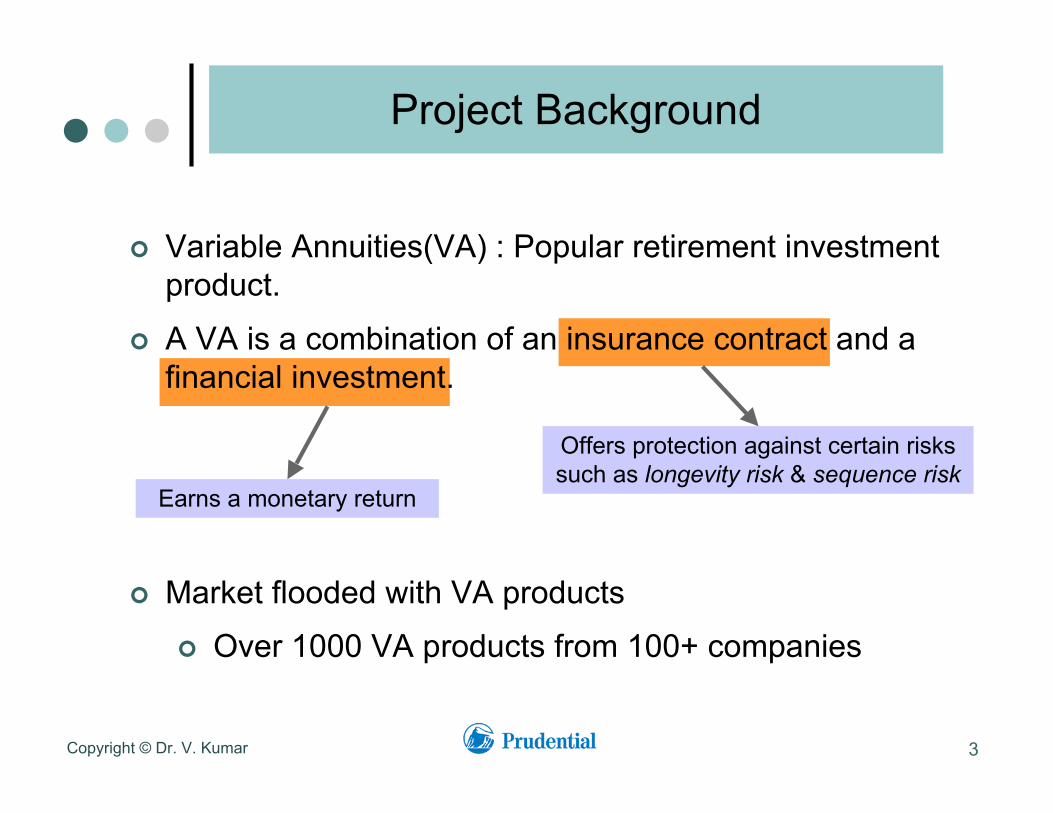
Variable Annuities(VA) : Popular retirement investmentproduct.
A VA is a combination of an insurance contract and afinancial investment.
Market flooded with VA products
Over 1000 VA products from 100+ companies
Project Background
3
Offers protection against certain riskssuch as longevity risk & sequence risk
Earns a monetary return
Copyright © Dr. V. Kumar
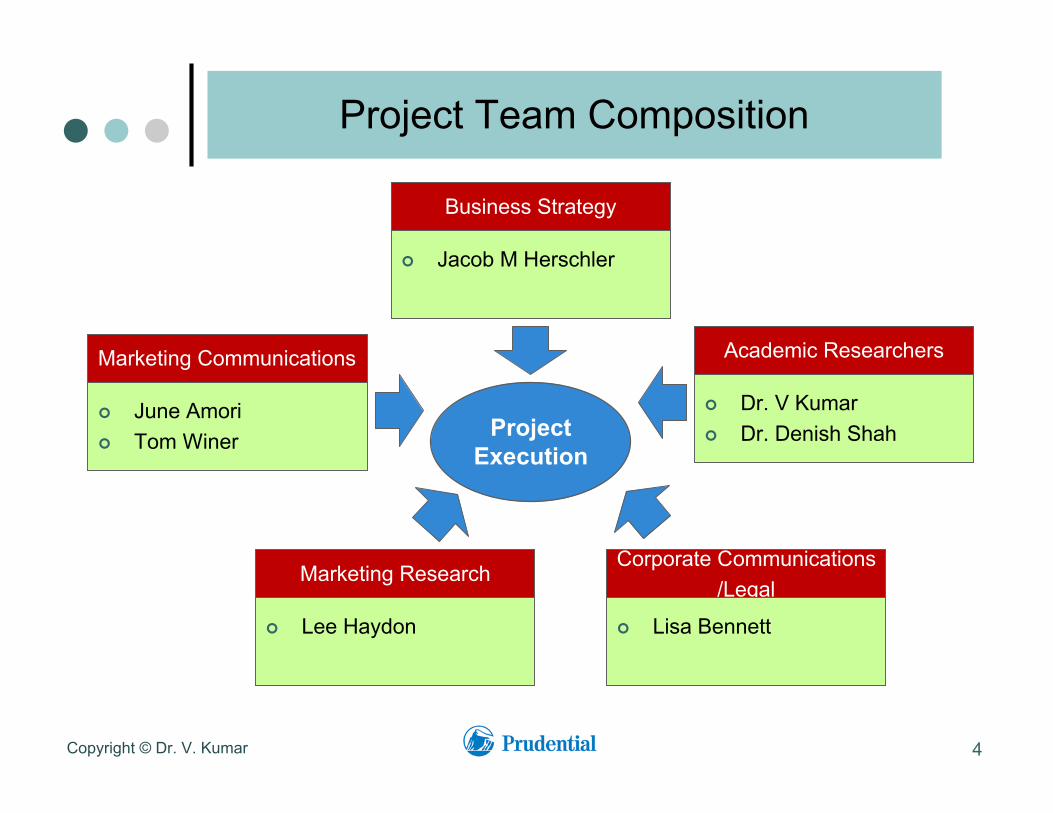
Project Team Composition
4
ProjectExecution
Marketing Communications
June Amori Tom Winer
Marketing Research
Lee Haydon
Academic Researchers
Dr. V Kumar Dr. Denish Shah
Business Strategy
Jacob M Herschler
Corporate Communications/Legal
Lisa Bennett

Copyright © Dr. V. Kumar
Research Motivation
5
KEY OBJECTIVE Grow Prudential’s VA business
POTENTIALOPPORTUNITY
Behavioral Risk* not effectivelycommunicated by competitor firms
KEY CHALLENGE How to leverage the concept ofBehavioral Risk?
*Risk of emotionally driven behavior adversely affecting one’s investment decisions.
KEY SEGMENT Investors in the Retirement Red Zone®
Copyright © Dr. V. Kumar
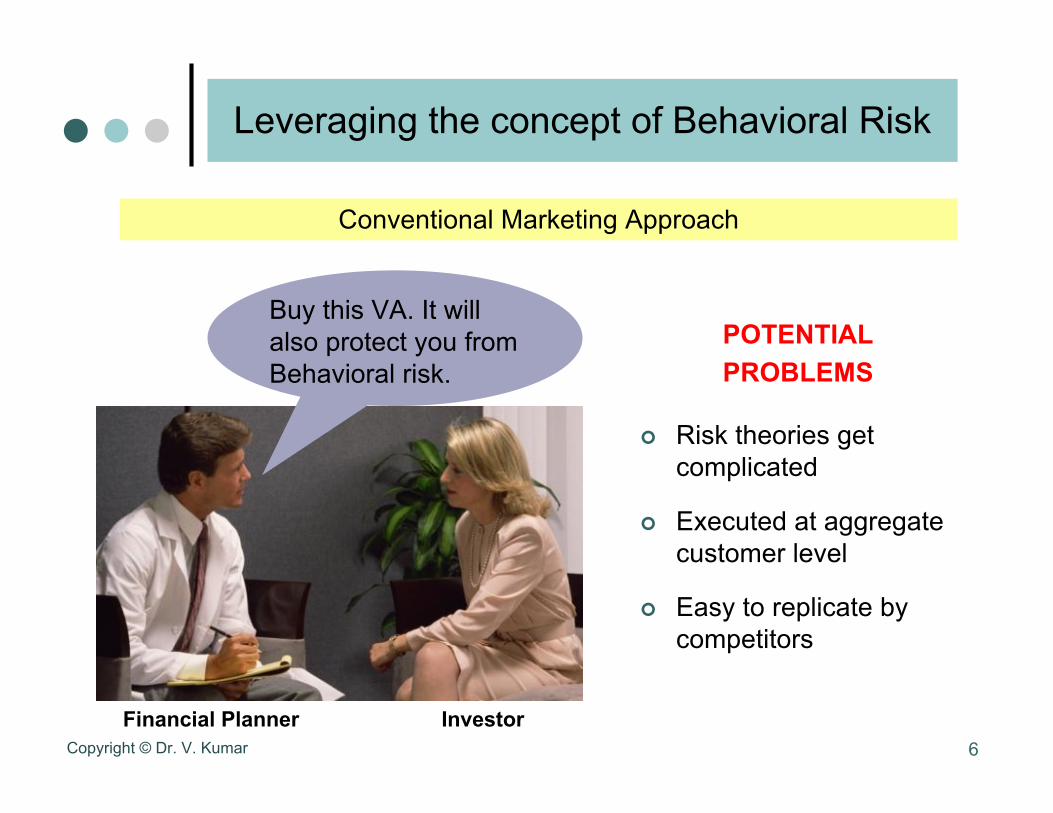
Leveraging the concept of Behavioral Risk
POTENTIALPROBLEMS
Risk theories getcomplicated
Executed at aggregatecustomer level
Easy to replicate bycompetitors
6
Buy this VA. It willalso protect you fromBehavioral risk.
Conventional Marketing Approach
Financial Planner Investor
Proposed Approach:
7
A Framework forUncovering Implicit Needs for
Customized Product Positioning
Copyright © Dr. V. Kumar
Copyright © Dr. V. Kumar
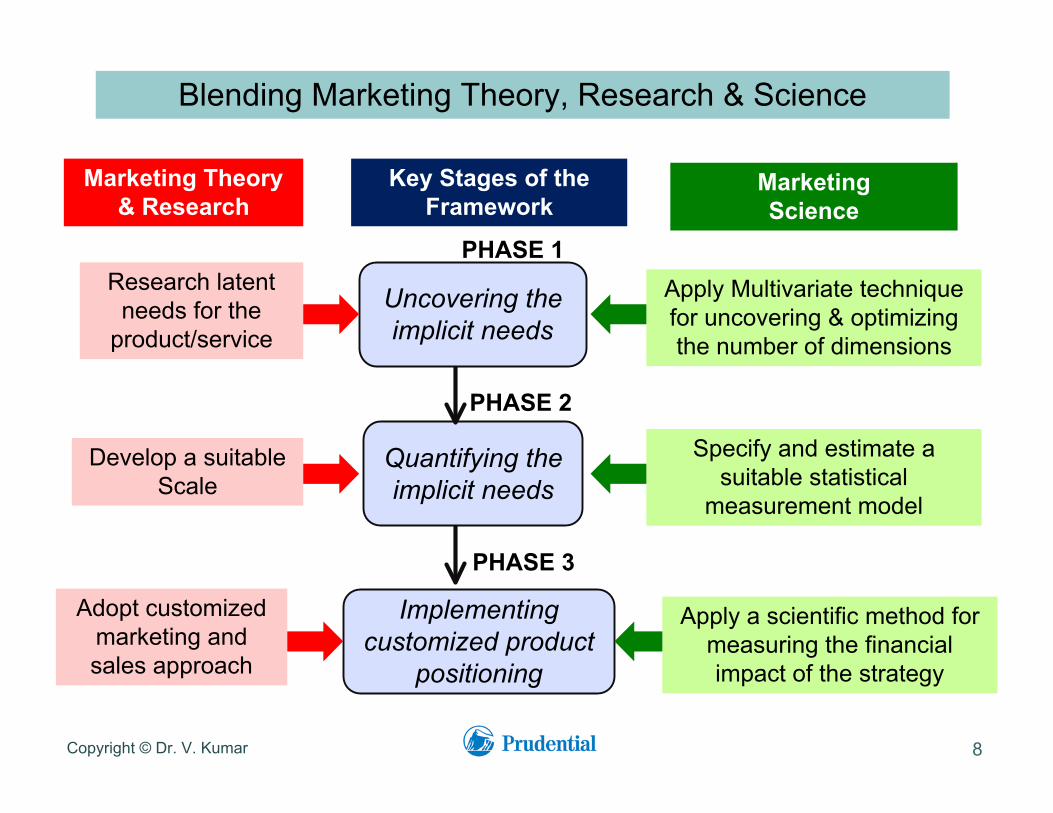
Blending Marketing Theory, Research & Science
8
Marketing Theory& Research
MarketingScience
Key Stages of theFramework
Uncovering theimplicit needs
Quantifying theimplicit needs
Implementingcustomized product
positioning
Apply Multivariate techniquefor uncovering & optimizingthe number of dimensions
Research latentneeds for the
product/service
Specify and estimate asuitable statistical
measurement model
Develop a suitableScale
Adopt customizedmarketing andsales approach
Apply a scientific method formeasuring the financialimpact of the strategy
PHASE 1
PHASE 2
PHASE 3
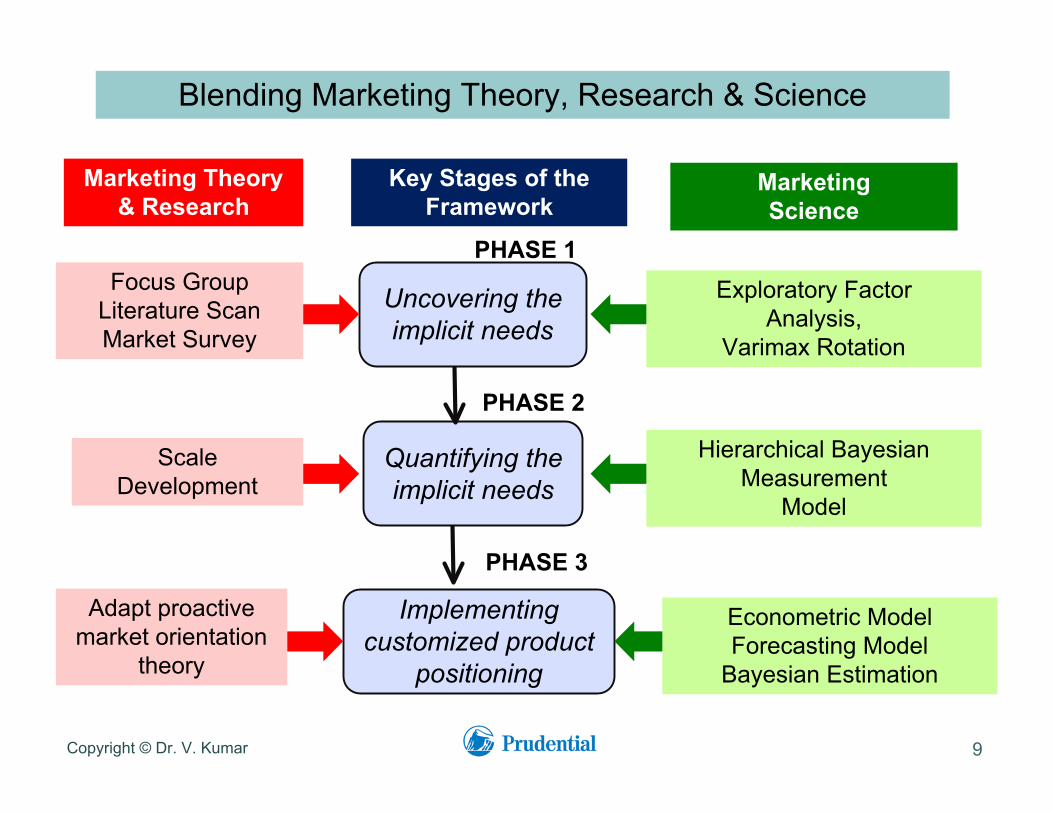
Focus GroupLiterature ScanMarket Survey
ScaleDevelopment
Adapt proactivemarket orientation
theory
Exploratory FactorAnalysis,
Varimax Rotation
Hierarchical BayesianMeasurement
Model
Econometric ModelForecasting Model
Bayesian Estimation
Blending Marketing Theory, Research & Science
9
Marketing Theory& Research
MarketingScience
Key Stages of theFramework
Uncovering theimplicit needs
Quantifying theimplicit needs
Implementingcustomized product
positioning
Copyright © Dr. V. Kumar
PHASE 1
PHASE 2
PHASE 3
Copyright © Dr. V. Kumar
PHASE 1:Uncovering Implicit Needs
What emotions* influence investors’retirement investment decisions?
10
* For the purpose of this study, emotions broadly refer to affect, feelings, attitudes and behavioral tendencies that potentially contribute to behavioral risk in the Retirement Red Zone®
Copyright © Dr. V. Kumar
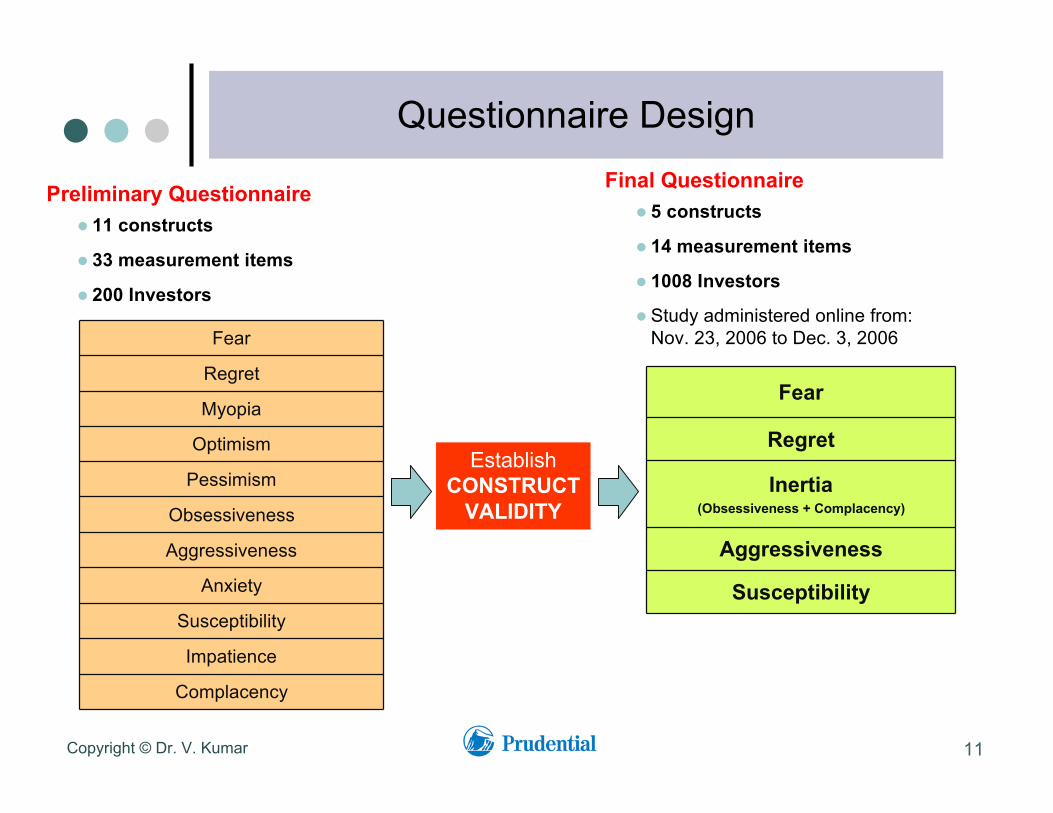
Questionnaire Design
11
Preliminary Questionnaire 11 constructs
33 measurement items
200 Investors
Final Questionnaire 5 constructs
14 measurement items
1008 Investors
Study administered online from:Nov. 23, 2006 to Dec. 3, 2006Fear
Regret
Myopia
Optimism
Pessimism
Obsessiveness
Aggressiveness
Anxiety
Susceptibility
Impatience
Complacency
Fear
Regret
Inertia(Obsessiveness + Complacency)
Aggressiveness
Susceptibility
EstablishCONSTRUCT
VALIDITY

Copyright © Dr. V. Kumar
PHASE 2:Quantifying Implicit Needs
To what extent are the relevant emotionsprevalent in investors?
Copyright © Dr. V. Kumar 12
Copyright © Dr. V. Kumar
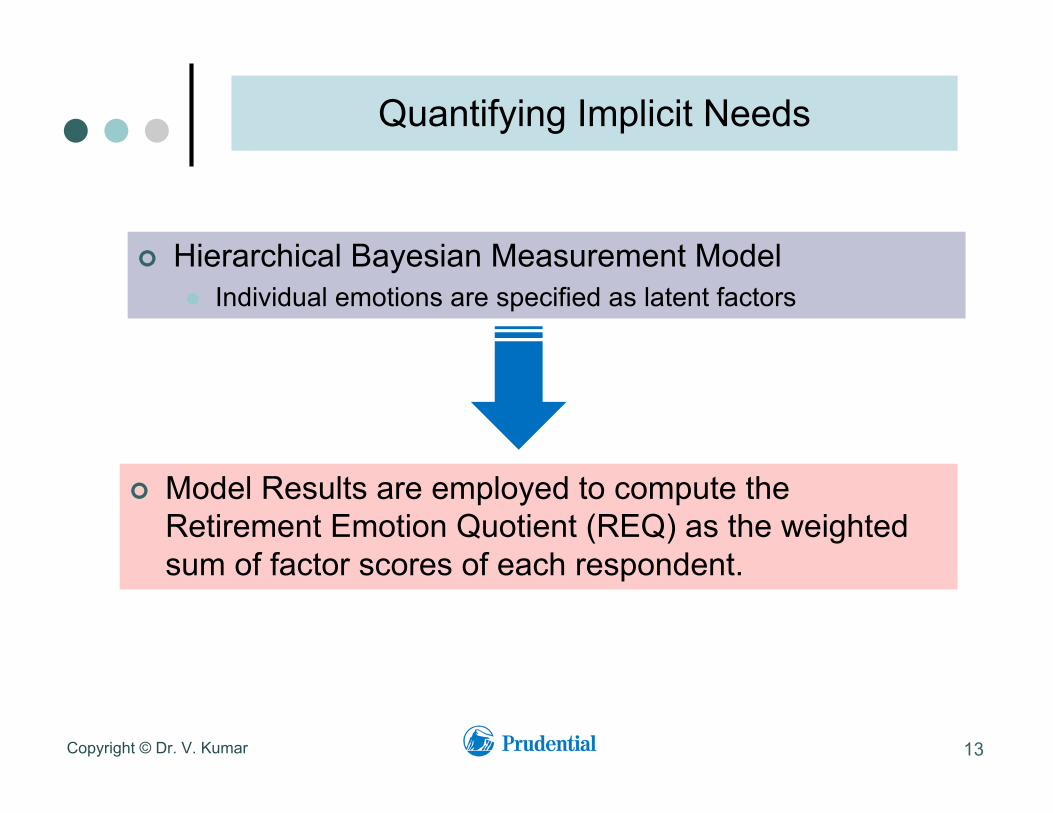
Quantifying Implicit Needs
13
Hierarchical Bayesian Measurement Model Individual emotions are specified as latent factors
Model Results are employed to compute theRetirement Emotion Quotient (REQ) as the weightedsum of factor scores of each respondent.
Copyright © Dr. V. Kumar
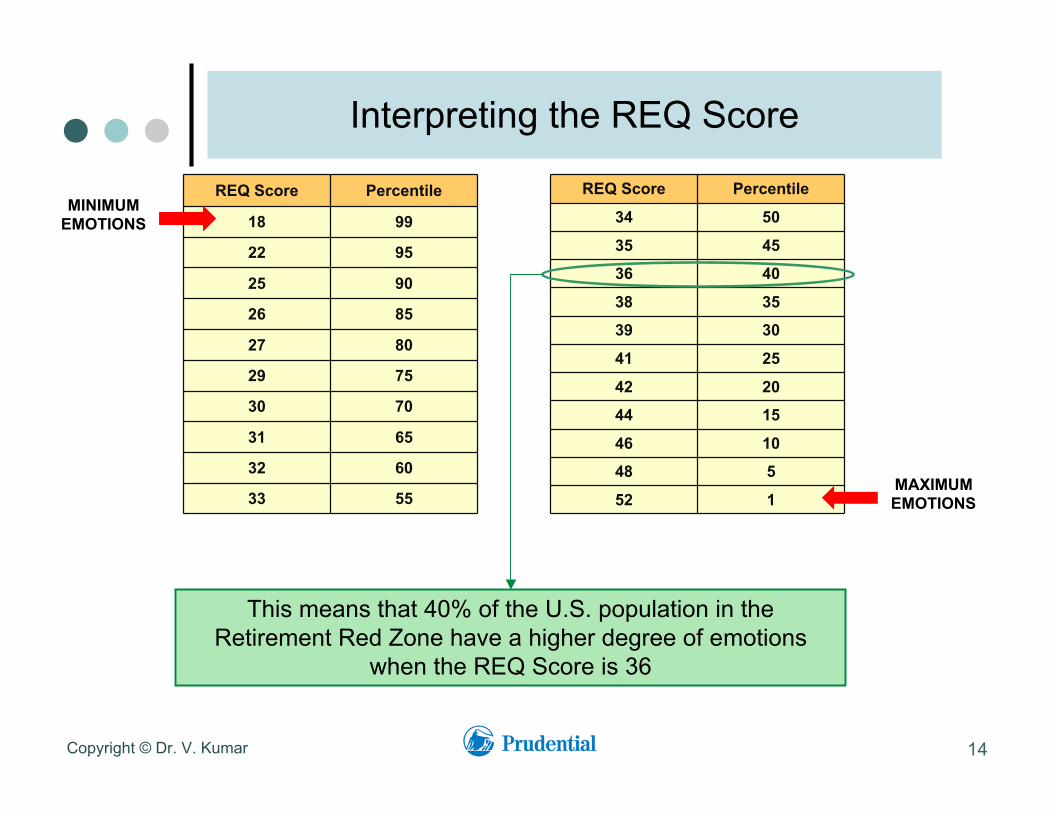
Interpreting the REQ Score
14
REQ Score Percentile
18 99
22 95
25 90
26 85
27 80
29 75
30 70
31 65
32 60
33 55
REQ Score Percentile
34 50
35 45
36 40
38 35
39 30
41 25
42 20
44 15
46 10
48 5
52 1
This means that 40% of the U.S. population in theRetirement Red Zone have a higher degree of emotions
when the REQ Score is 36
MINIMUMEMOTIONS
MAXIMUMEMOTIONS
Copyright © Dr. V. Kumar
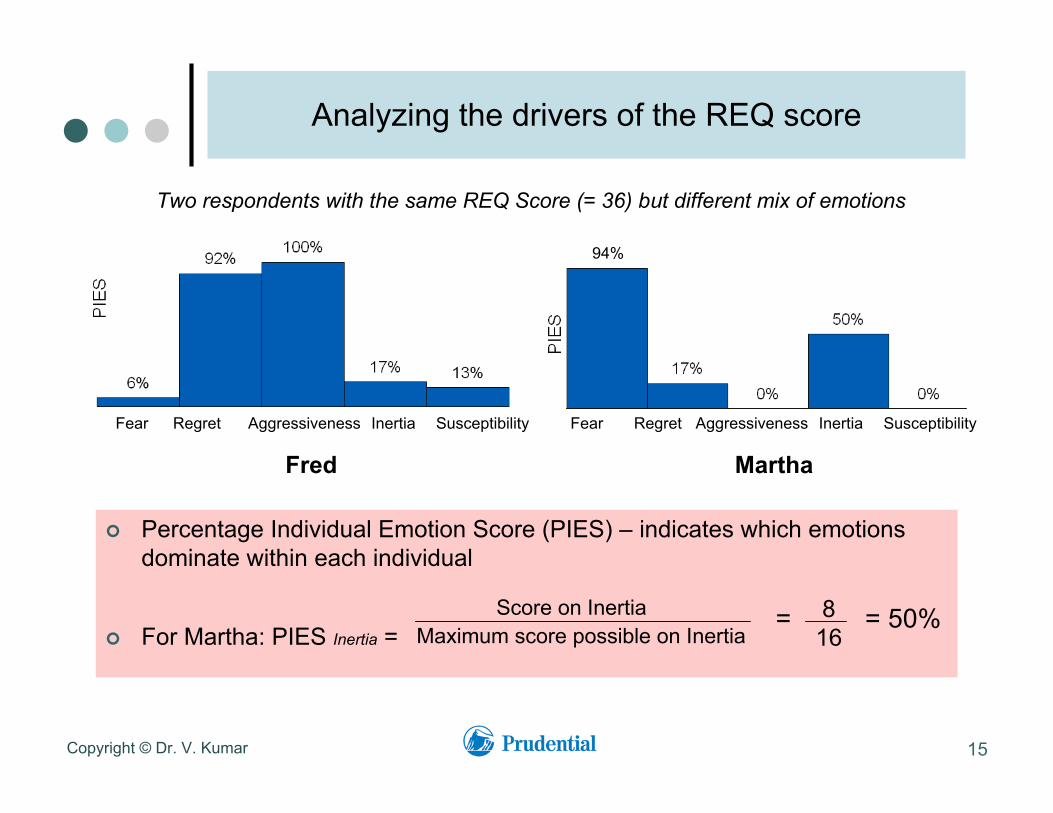
Analyzing the drivers of the REQ score
15
Two respondents with the same REQ Score (= 36) but different mix of emotions
Fear Regret Aggressiveness Inertia Susceptibility
Fred
Fear Regret Aggressiveness Inertia Susceptibility
Martha
94%
Percentage Individual Emotion Score (PIES) – indicates which emotionsdominate within each individual
For Martha: PIES Inertia == = 50%Score on Inertia
Maximum score possible on Inertia 816
Copyright © Dr. V. Kumar
PHASE 3: Implementation
How did Prudential leverage the knowledge ofimplicit needs of the customers for customized
product positioning?
Copyright © Dr. V. Kumar 16
Copyright © Dr. V. Kumar
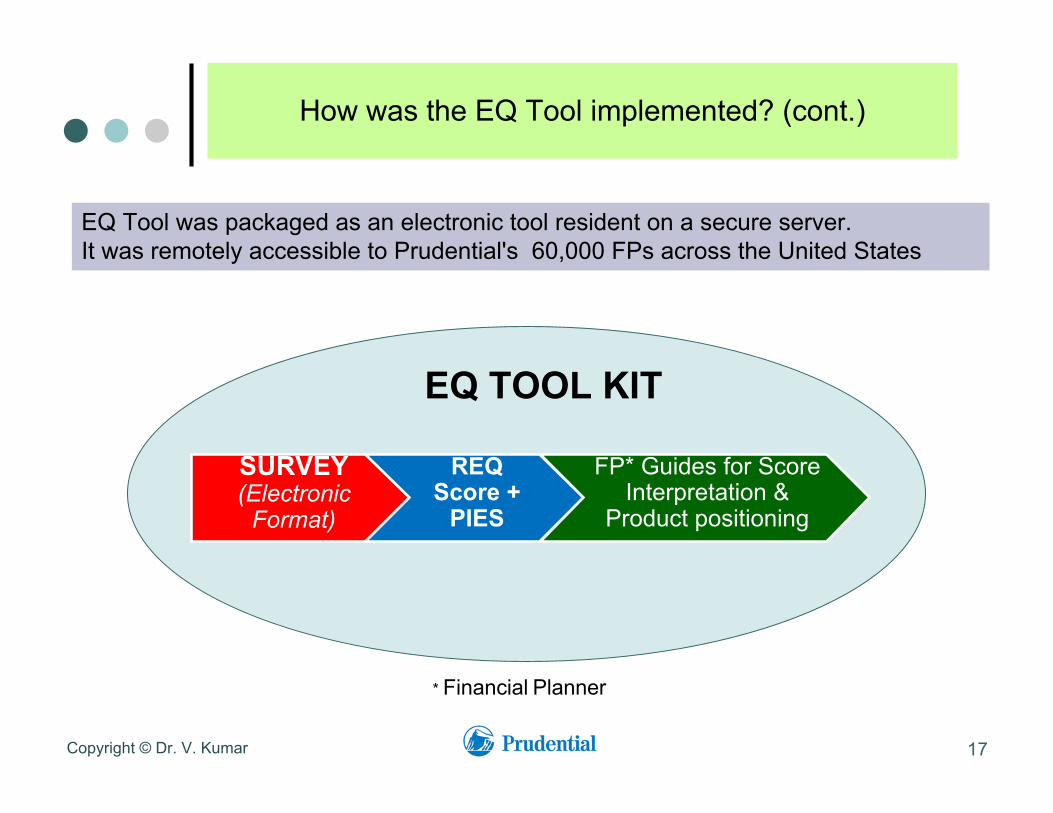
How was the EQ Tool implemented? (cont.)
17
EQ Tool was packaged as an electronic tool resident on a secure server.It was remotely accessible to Prudential's 60,000 FPs across the United States
SURVEY(Electronic
Format)
REQScore +
PIES
FP* Guides for ScoreInterpretation &
Product positioning
EQ TOOL KIT
* Financial Planner
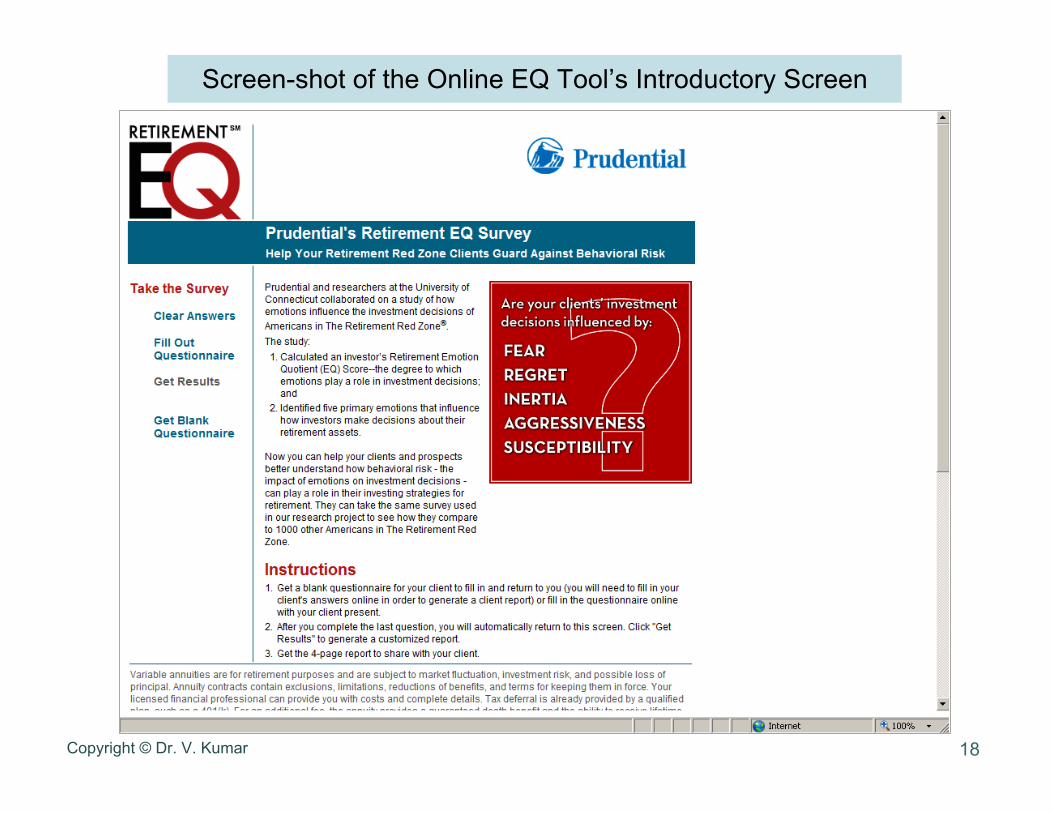
Screen-shot of the Online EQ Tool’s Introductory Screen
Copyright © Dr. V. Kumar 18

Screen-shots of the EQ Tool Report
Copyright © Dr. V. Kumar 19
Copyright © Dr. V. Kumar
How was the EQ Tool implemented? (cont.)
20
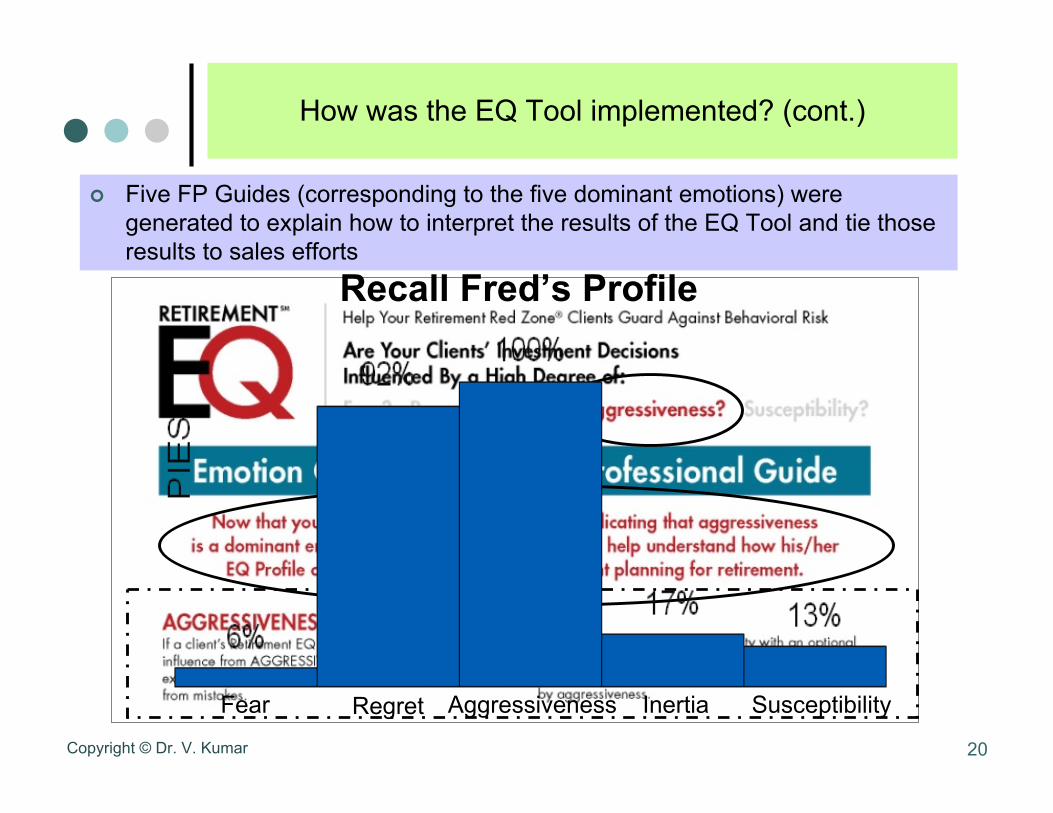
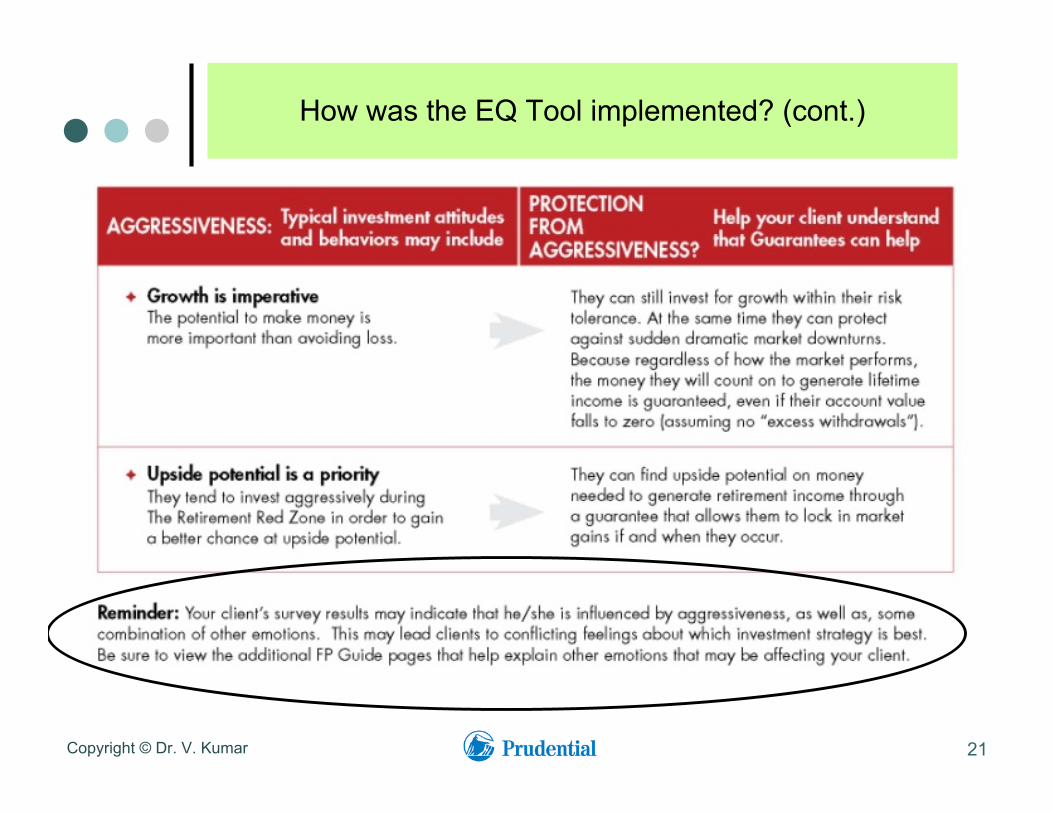
Five FP Guides (corresponding to the five dominant emotions) weregenerated to explain how to interpret the results of the EQ Tool and tie thoseresults to sales efforts
Fear Regret Aggressiveness Inertia Susceptibility
Recall Fred’s Profile
Copyright © Dr. V. Kumar
How was the EQ Tool implemented? (cont.)
21
Copyright © Dr. V. Kumar
How did Prudential marketthe EQ Tool?
22
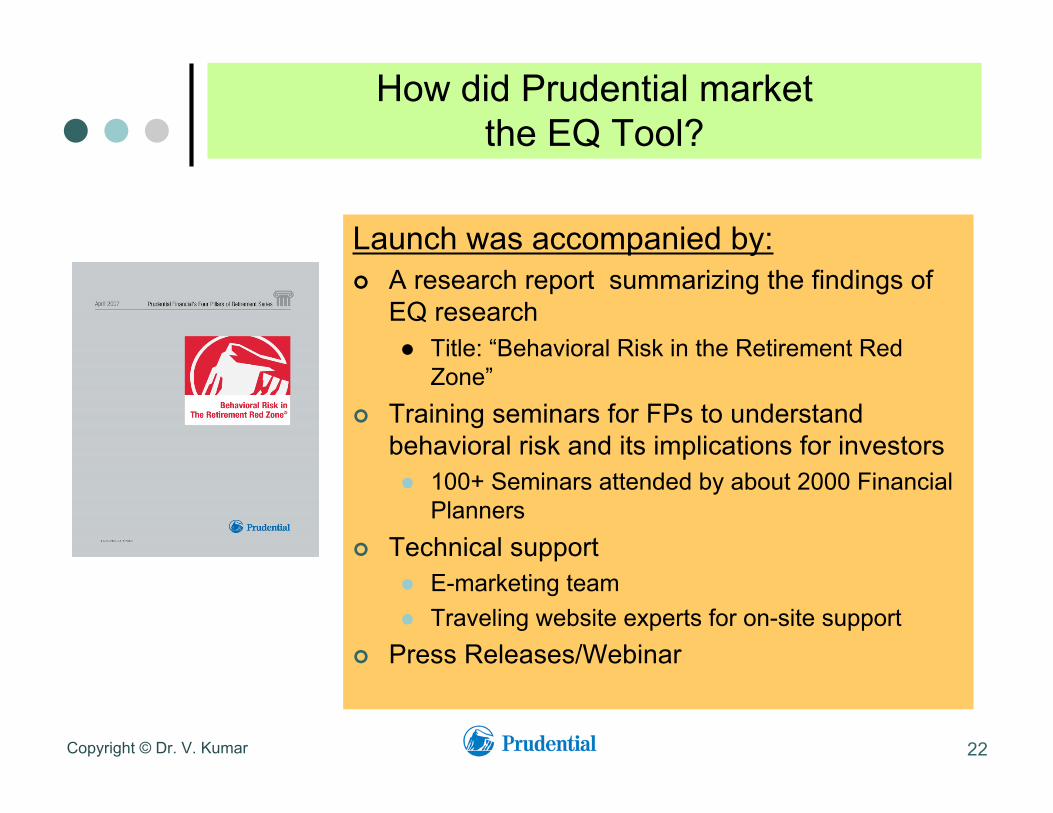
Launch was accompanied by: A research report summarizing the findings of
EQ research Title: “Behavioral Risk in the Retirement Red
Zone” Training seminars for FPs to understand
behavioral risk and its implications for investors 100+ Seminars attended by about 2000 Financial
Planners Technical support
E-marketing team Traveling website experts for on-site support
Press Releases/Webinar
Copyright © Dr. V. Kumar 2323
EQ Tool Launch Video / Webinar
How was the EQ Tool implemented in the marketplace?
Copyright © Dr. V. Kumar

Copyright © Dr. V. Kumar 24
Impact of EQ Tool
Copyright © Dr. V. Kumar
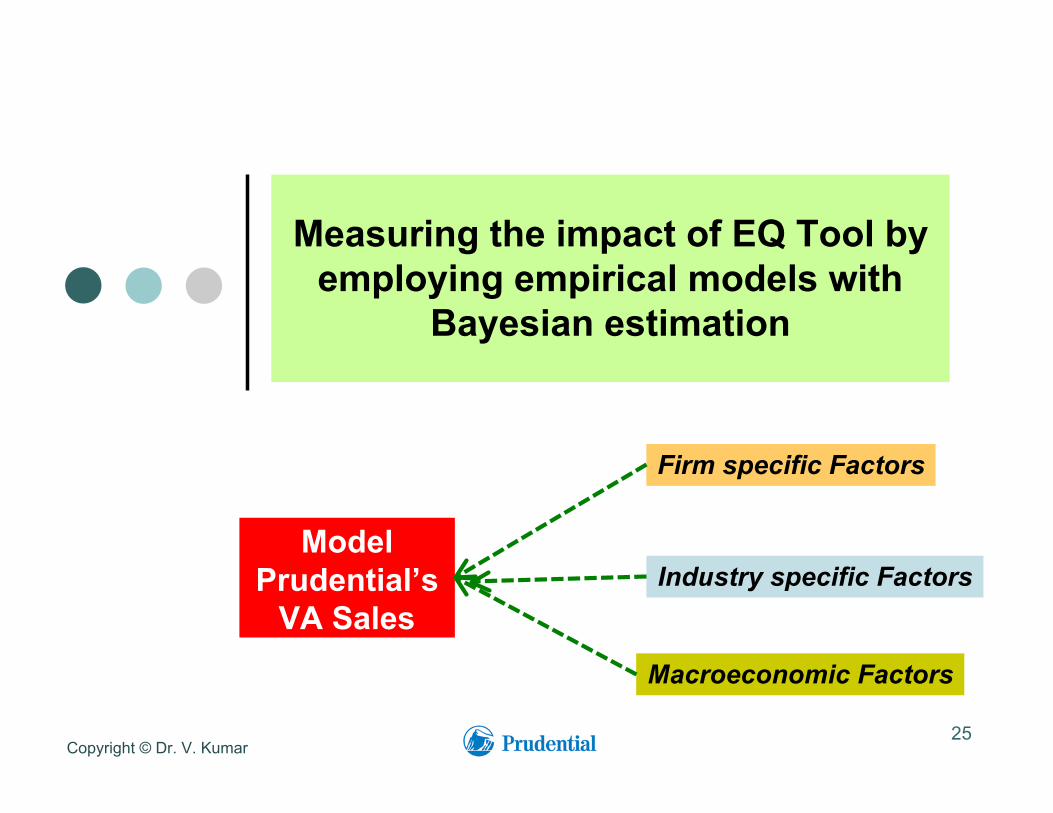
Measuring the impact of EQ Tool byemploying empirical models with
Bayesian estimation
25
ModelPrudential’s
VA Sales
Firm specific Factors
Industry specific Factors
Macroeconomic Factors
Copyright © Dr. V. Kumar
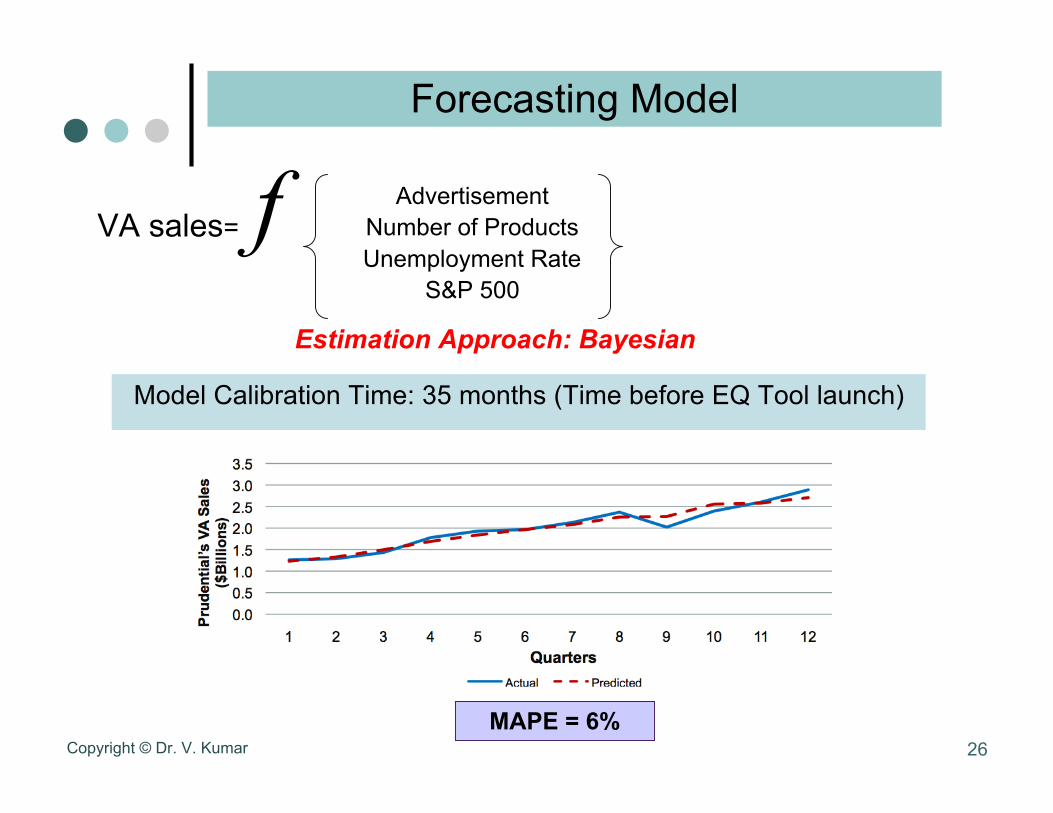
AdvertisementNumber of ProductsUnemployment Rate
S&P 500
Forecasting Model
26
Model Calibration Time: 35 months (Time before EQ Tool launch)
Estimation Approach: Bayesian
MAPE = 6%
VA sales= f
Copyright © Dr. V. Kumar
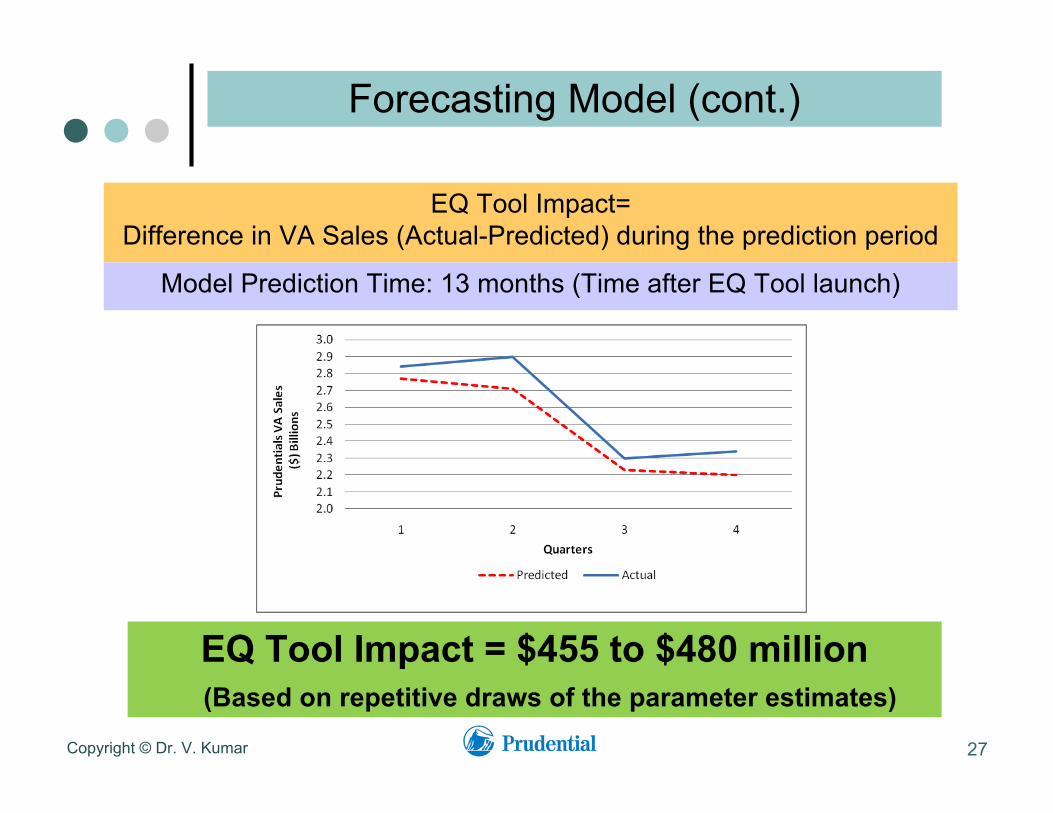
Forecasting Model (cont.)
27
EQ Tool Impact=Difference in VA Sales (Actual-Predicted) during the prediction period
EQ Tool Impact = $455 to $480 million (Based on repetitive draws of the parameter estimates)
Model Prediction Time: 13 months (Time after EQ Tool launch)
Copyright © Dr. V. Kumar
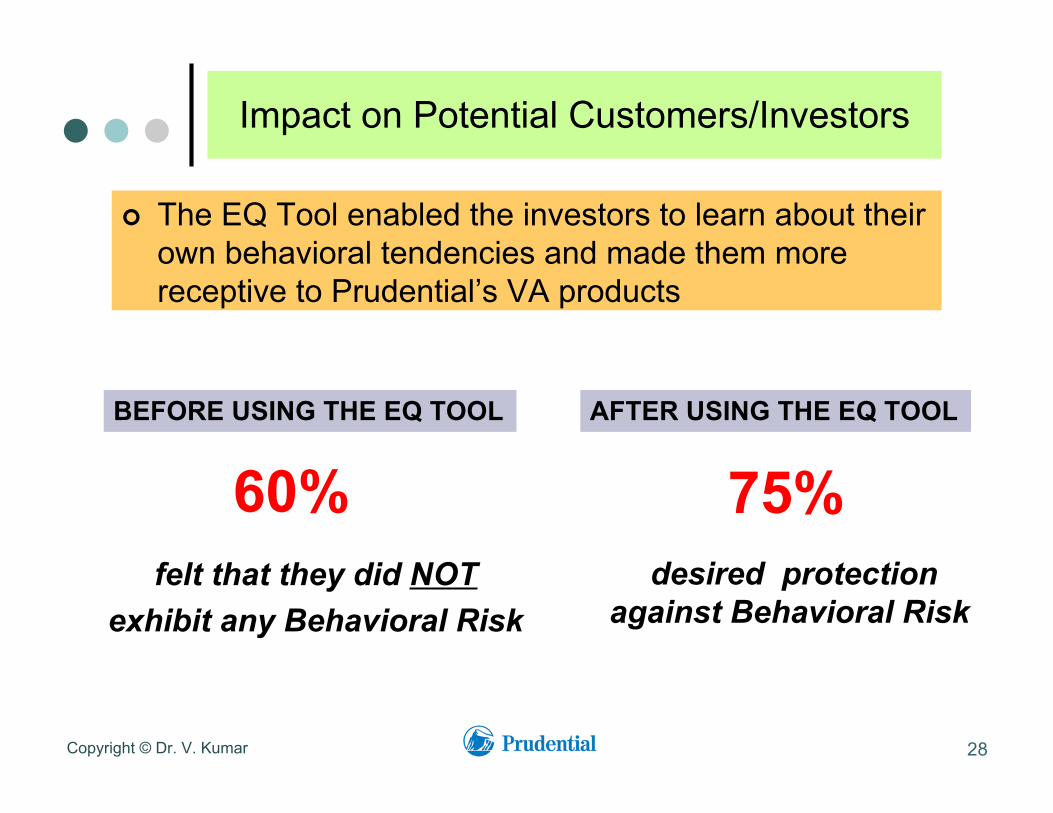
Impact on Potential Customers/Investors
The EQ Tool enabled the investors to learn about theirown behavioral tendencies and made them morereceptive to Prudential’s VA products
28
BEFORE USING THE EQ TOOL AFTER USING THE EQ TOOL
60%felt that they did NOT
exhibit any Behavioral Risk
75%desired protection
against Behavioral Risk
Copyright © Dr. V. Kumar
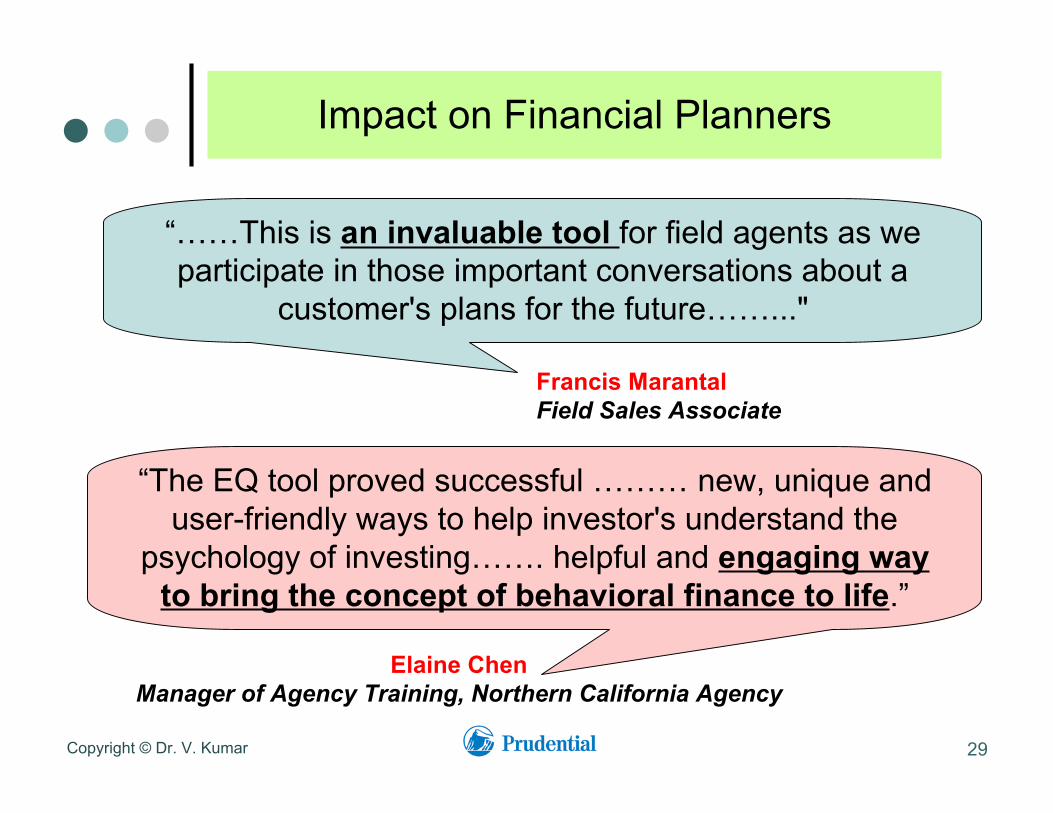
Impact on Financial Planners
29
“……This is an invaluable tool for field agents as weparticipate in those important conversations about a
customer's plans for the future……..."
“The EQ tool proved successful ……… new, unique anduser-friendly ways to help investor's understand the
psychology of investing……. helpful and engaging wayto bring the concept of behavioral finance to life.”
Francis MarantalField Sales Associate
Elaine ChenManager of Agency Training, Northern California Agency
Copyright © Dr. V. Kumar
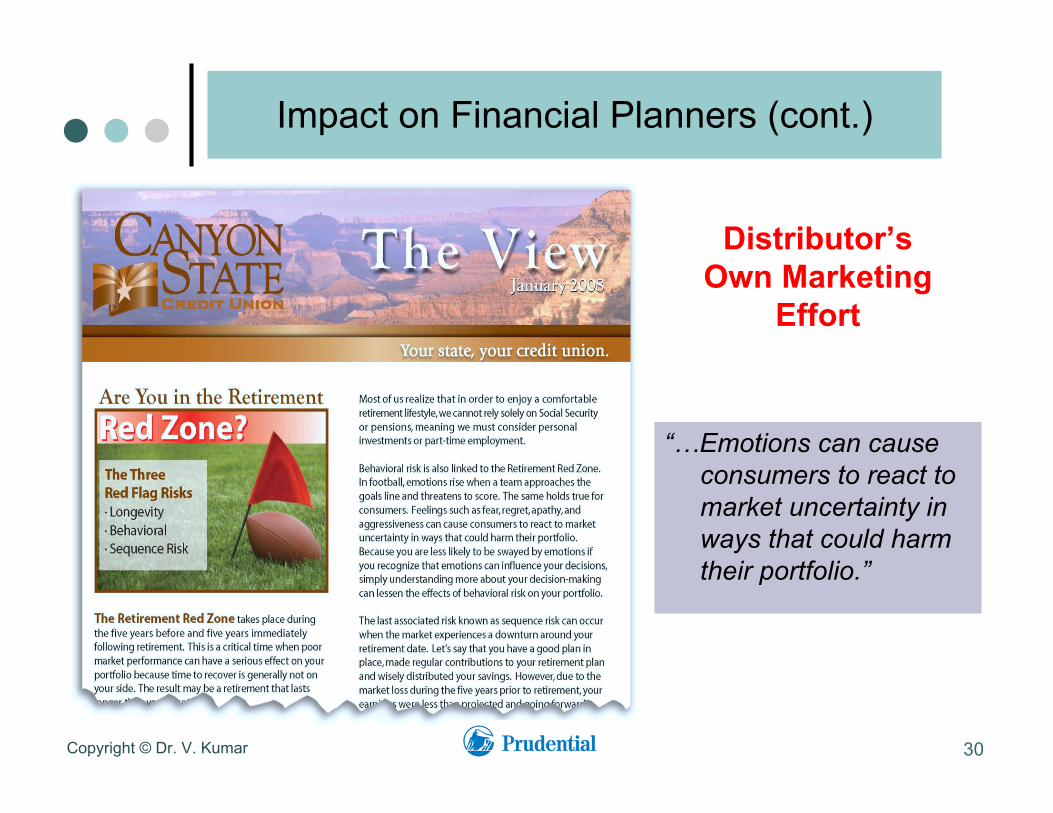
Impact on Financial Planners (cont.)
“…Emotions can causeconsumers to react tomarket uncertainty inways that could harmtheir portfolio.”
30
Distributor’sOwn Marketing
Effort
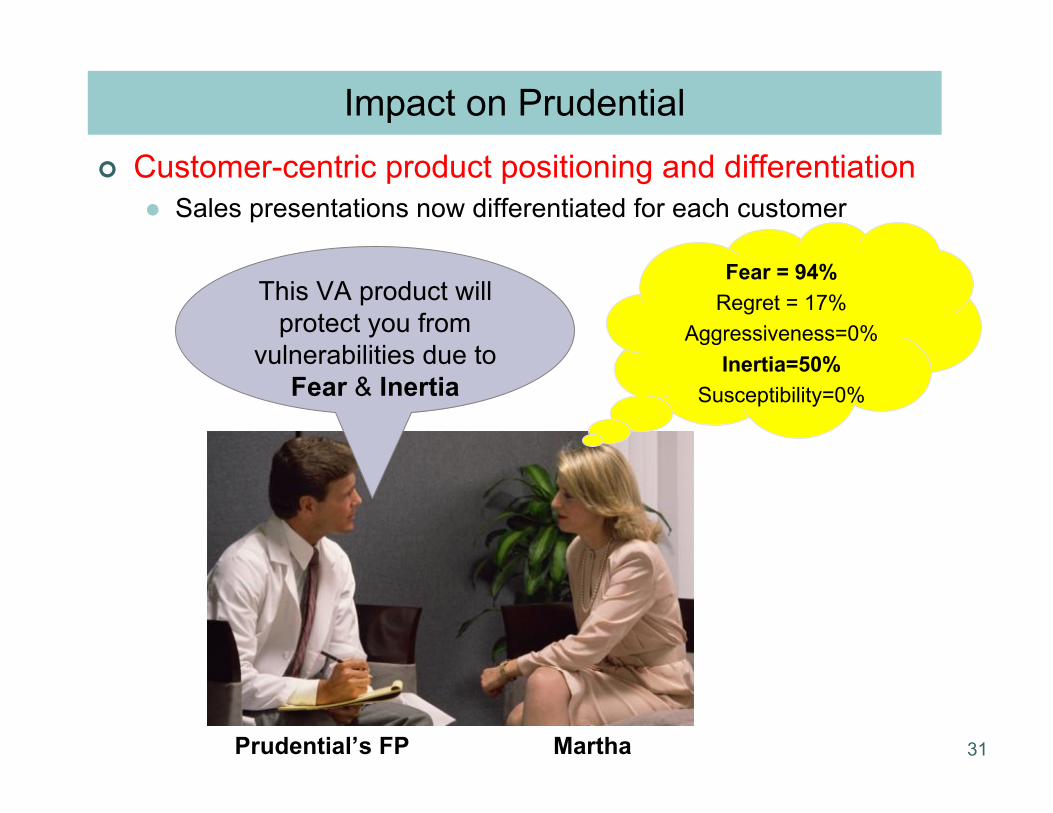
Impact on Prudential Customer-centric product positioning and differentiation
Sales presentations now differentiated for each customer
31
This VA product willprotect you from
vulnerabilities due toFear & Inertia
Prudential’s FP Martha
Fear = 94%Regret = 17%
Aggressiveness=0%Inertia=50%
Susceptibility=0%
Copyright © Dr. V. Kumar
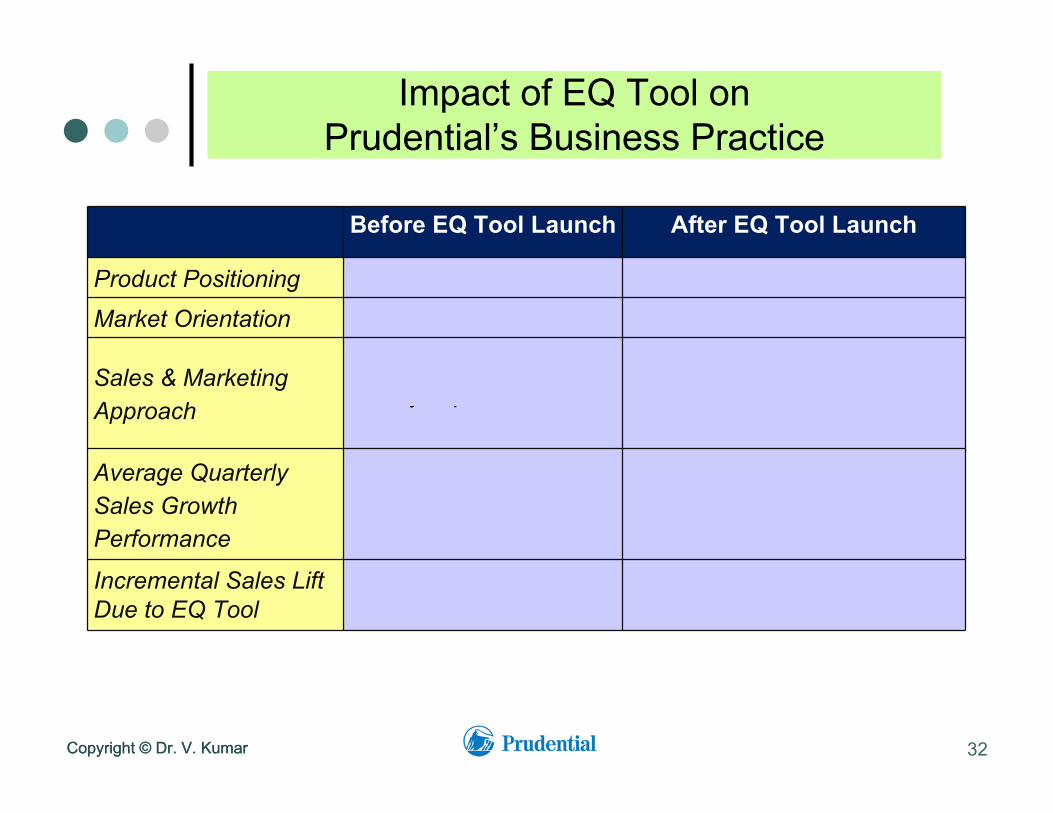
Impact of EQ Tool onPrudential’s Business Practice
32Copyright © Dr. V. Kumar
Before EQ Tool Launch After EQ Tool Launch
Product Positioning Aggregate level Individual customer level
Market Orientation Responsive Proactive
Sales & MarketingApproach
Satisfy expressed needsSatisfy latent or unarticulatedneeds
Average QuarterlySales GrowthPerformance
Outperformedcompetition by 11%
Outperformed competition by19%
Incremental Sales LiftDue to EQ Tool n.a. Greater than $450 Million (13
months from launch)
Copyright © Dr. V. Kumar
($ millions)
1) Source: VARDS 3Q’09 report. Advisor-sold, excludesgroup/retirement plan contracts.
3Q09
3Q09 Advisor-Sold3Q09 Advisor-SoldVariable Annuity SalesVariable Annuity Sales(1)(1)
$795
$841
$860
$981
$1,083
$1,426
$1,826
$2,909
$3,231
$5,828
AXA
Pacific Life
AEGON
Nationwide
SunLife
Ameriprise
Lincoln Financial
Jackson National
MetLife
Prudential
33
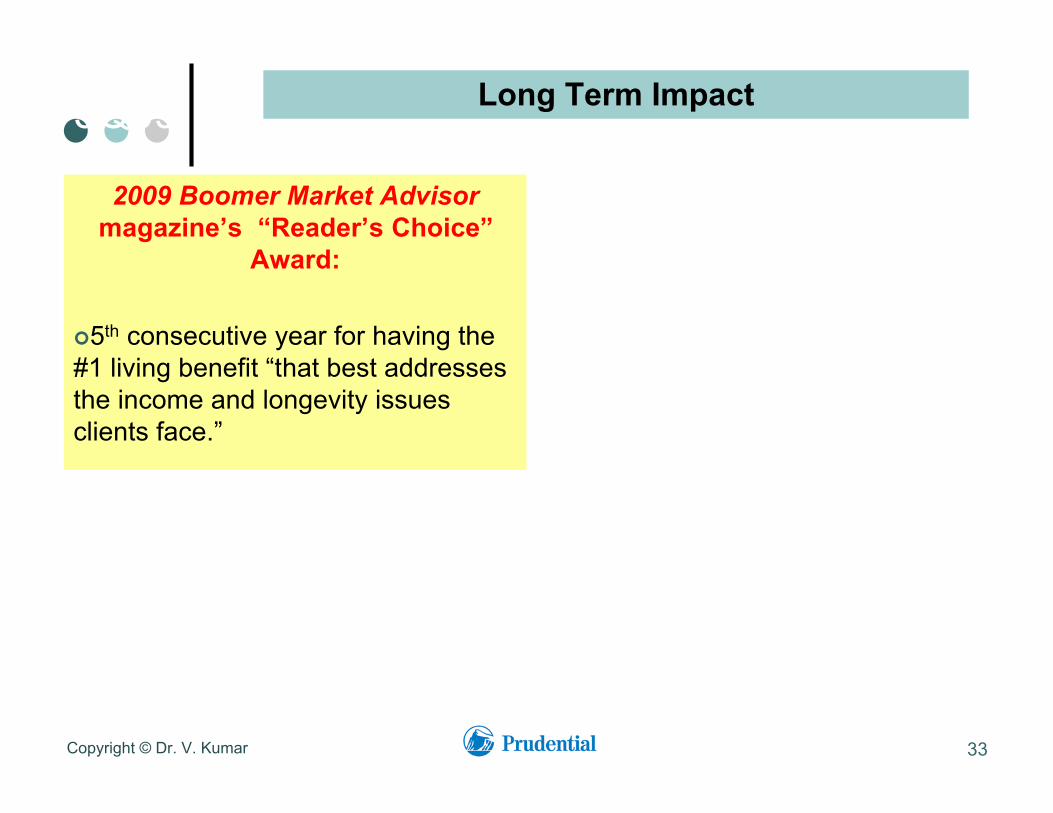
Long Term Impact
2009 Boomer Market Advisormagazine’s “Reader’s Choice”
Award:
5th consecutive year for having the#1 living benefit “that best addressesthe income and longevity issuesclients face.”
“The company’s Retirement RedZone® marketing and educationcampaign, in particular, getskudos for explaining therelationship between emotionsand investment decision-making.”
# 5 # 1
Copyright © Dr. V. Kumar
Looking Forward…..
EQ Index
Work with for the 40-year old cohort
34

Copyright © Dr. V. Kumar
THANK YOU!
Copyright © Dr. V. Kumar 35