UNCERTAINTIES IN TIR HYPERSPECTRAL IMAGE … · UNCERTAINTIES IN TIR HYPERSPECTRAL IMAGE CUBE...
4
UNCERTAINTIES IN TIR HYPERSPECTRAL IMAGE CUBE UNMIXING Keshav Dev Singh and Ramakrishnan Desikan Department of Earth Sciences, Indian Institute of Technology Bombay, Powai, Mumbai-400076, India ABSTRACT The spectral unmixing in the thermal infrared (TIR) region is not linear case. For simplicity, the spectral mixing for pixel deconvolution is assumed to be linear, but in reality, the inti- mate mixture spectra are non-linear. The multiple scattering effects due to texture and fabric do affect the spectral shape and form. In this paper, the uncertainties in unmixing of TIR hyperspectral image cube are investigated. Index Terms— Thermal infrared, Hypercube, Non- linearity, Spectral unmixing 1. INTRODUCTION Hyperspectral remote sensing in the thermal infrared (214m) region is a very recent development. Rocks and minerals typ- ically provide diagnostic spectral features only in the ther- mal region. The spectral range of 2.5 to 13.5m is specifically dominated by emitted radiations and perfectly suited for spec- tral features detection [1]. This study addresses the problem to understand the association of spectral non-linearity in the thermal infrared (TIR) region. Using model-based unmixing, a non-linear mixing model (NLMM) can be formulated using a function f as in eqn. (1), r i = f (m l ,ξ l , ρ, η; λ) (1) where, r ∈< n×1 and m l ∈ L n×l (library); l =1, ..., q. The abundance vector ξ l = ξ 1 ,ξ 2 , ..., ξ q T . Such unknown non- linear function depends upon the spatial extent, material frac- tions, media parameters (ρ) and noise levels (η). The phys- ical models do not easily lend themselves to simple mathe- matical solutions. The main difficulty is how to model these non-linearties when much of the necessary information is not available. Hence, tackling the spectral non-linearties and ad- dressing it is the most difficult task. However, by using the Planck radiation law, the emissivity interaction of intimate mixtures in thermal infrared domain could be defined [2]. Most of the thermal hyperspectral remote sensing (THRS) re- searchers [3, 4] believed that spectral mixing phenomenon in emissive (TIR) domain is purely a linear process. Taking a The authors are thankful to Prof. Dr. Schlerfet at Gabriel Lippmann Institute, Luxembourg and Telops, Canada for acquiring hypercube. Authors acknowledge Department of Science and Technology, and Indian Institute of Technology Bombay, India for the project grant support. clue from the parameters contributing to non-linearity, in this paper, the uncertainties in unmixing of TIR hyperspectral im- age cube are investigated. 2. METHODOLOGY The Fig. 1 shows a schematic flow chart of the proposed methodology which will be further explored in the follow- ing sections to show the existence and cause of spectral non- linearity in emissive (TIR) domain. Fig. 1. Hierarchical diagram depicting the adopted methodol- ogy. 2.1. Thermal Hyperspectral Data Acquisition In this study, an imaging FTIR instrument (Telops Hyper- Cam-LW) available at Gabriel Lippmann Institute, Luxem- bourg is used to collect hyperspectral image in laboratory con- ditions which covers a spectral range of 8 to 12m. Three geo- logical samples- alunite, limestone and quartz are used in this
Transcript of UNCERTAINTIES IN TIR HYPERSPECTRAL IMAGE … · UNCERTAINTIES IN TIR HYPERSPECTRAL IMAGE CUBE...

UNCERTAINTIES IN TIR HYPERSPECTRAL IMAGE CUBE UNMIXING
Keshav Dev Singh and Ramakrishnan Desikan
Department of Earth Sciences, Indian Institute of Technology Bombay, Powai, Mumbai-400076, India
ABSTRACT
The spectral unmixing in the thermal infrared (TIR) region isnot linear case. For simplicity, the spectral mixing for pixeldeconvolution is assumed to be linear, but in reality, the inti-mate mixture spectra are non-linear. The multiple scatteringeffects due to texture and fabric do affect the spectral shapeand form. In this paper, the uncertainties in unmixing of TIRhyperspectral image cube are investigated.
Index Terms— Thermal infrared, Hypercube, Non-linearity, Spectral unmixing
1. INTRODUCTION
Hyperspectral remote sensing in the thermal infrared (214m)region is a very recent development. Rocks and minerals typ-ically provide diagnostic spectral features only in the ther-mal region. The spectral range of 2.5 to 13.5m is specificallydominated by emitted radiations and perfectly suited for spec-tral features detection [1]. This study addresses the problemto understand the association of spectral non-linearity in thethermal infrared (TIR) region. Using model-based unmixing,a non-linear mixing model (NLMM) can be formulated usinga function f as in eqn. (1),
ri = f(ml, ξl, ρ, η;λ) (1)
where, r ∈ <n×1 and ml ∈ Ln×l(library); l = 1, ..., q. Theabundance vector ξl = ξ1, ξ2, ..., ξq
T . Such unknown non-linear function depends upon the spatial extent, material frac-tions, media parameters (ρ) and noise levels (η). The phys-ical models do not easily lend themselves to simple mathe-matical solutions. The main difficulty is how to model thesenon-linearties when much of the necessary information is notavailable. Hence, tackling the spectral non-linearties and ad-dressing it is the most difficult task. However, by using thePlanck radiation law, the emissivity interaction of intimatemixtures in thermal infrared domain could be defined [2].Most of the thermal hyperspectral remote sensing (THRS) re-searchers [3, 4] believed that spectral mixing phenomenon inemissive (TIR) domain is purely a linear process. Taking a
The authors are thankful to Prof. Dr. Schlerfet at Gabriel LippmannInstitute, Luxembourg and Telops, Canada for acquiring hypercube. Authorsacknowledge Department of Science and Technology, and Indian Institute ofTechnology Bombay, India for the project grant support.
clue from the parameters contributing to non-linearity, in thispaper, the uncertainties in unmixing of TIR hyperspectral im-age cube are investigated.
2. METHODOLOGY
The Fig. 1 shows a schematic flow chart of the proposedmethodology which will be further explored in the follow-ing sections to show the existence and cause of spectral non-linearity in emissive (TIR) domain.
Fig. 1. Hierarchical diagram depicting the adopted methodol-ogy.
2.1. Thermal Hyperspectral Data Acquisition
In this study, an imaging FTIR instrument (Telops Hyper-Cam-LW) available at Gabriel Lippmann Institute, Luxem-bourg is used to collect hyperspectral image in laboratory con-ditions which covers a spectral range of 8 to 12m. Three geo-logical samples- alunite, limestone and quartz are used in this

research. For emissivity retrieval, the samples are arranged asshown in Fig. 2.
Fig. 2. Diagram showing surface of limestone, alunite andquartz sample respectively (Image cube courtesy: GabrielLippmann Institute, Luxembourg).
The Telops Hyper-Cam measures a complete TIR hyper-spectral image (128×128×81) with an instantaneous field-of-view of 0.35 mrad. It forms a hyperspectral image cube withn=81 spectral bands of number of pixels, p=16384 as shownin Fig. 3.
Fig. 3. Telops Hyper-Cam measured TIR hyperspectral imagecube.
2.2. Endmember Extraction
Using ENVI, the noise in the data is reduced using MinimumNoise Fraction (MNF) technique and then Pixel Purity Index(PPI) are used for automatic endmember extraction. Spec-trally pure pixels in the image are computed by projectingn-dimensional scatter plots onto the selected random vectorfor the threshold factor of 2.5 and iterations of 10,000. Thenine endmembers showing characteristic absorption features(representing the chosen samples) are selected. Finally, these
selected optimal set of endmembers are used for further anal-ysis.
2.3. Spectral Unmixing
Once endmembers are derived, the Pearson Correlation Co-efficient (PCC) is used to match these endmembers to eachpixel of the image scene by Linear Mixing Model (LMM)developed in [5, 6]. Here, an iterative procedure based fullyconstrained quadratic programming algorithm is used to un-mix each pixel of the hypercube [7]. It produces a vector offractional abundances for individual endmembers on pixel-by-pixel basis and generates nine classified images represent-ing each endmember.
2.4. Accuracy Assessment
The Root-Mean-Square Error (RMSE) and generalized Signal-to-Noise Ratio (SNR) is used to measure the uncertainties be-tween the original (ri) and modeled (Mi) image pixel spectra.The RMSE and SNR is defined as in eqn. (2),
RMSE =
√1n
n∑i=1
η(λ)2i ;where, η =‖ ri −Mi ‖
SNR = 10× log10
( n∑i=1
‖ri−Mi‖2
n∑i=1
‖r‖2
)dB (2)
Where, n is the total number of wavelength (λ) channels.
3. RESULTS AND DISCUSSIONS
By using the SFF technique, the image is mapped for lime-stone, alunite and quartz respectively as shown in Fig. 4. InFig. 4 (a) and (b) we can clearly see that limestone and alu-nite boundary is completely mapped. On the contrary, someportions (∼ 2-3 inches) at the extreme left of quartz crystal(black color pixels) remain unmapped (Fig. 4 (c)). Also inFig. 4 (b), the extreme left of the quartz crystal (white colorpixels) are mapped as a mixture of alunite and quartz. Certainfacets of quartz crystal showing the signature of alunite is notexpected, if the process had been linear and single scatter-ing. Further, unmapped regions of quartz, limestone and alu-nite may be caused by interaction of emitted energy comingfrom objects of different thermal properties and temperatures.Variation in thermal conductivity will determine the rate ofthe dissipation of heat, and hence, the brightness temperatureof the target over time. For example, the thermal conductiv-ity at room temperature (20 ◦C) of quartz mineral (20 W/m◦C) is relatively higher than alunite (5 W/m ◦C) and lime-stone (6 W/m ◦C). Under such circumstances, objects heated

to specific constant temperatures will reach thermal equilib-rium with the ambience at different rates. This temperaturegradient will result in differential radiance from the objectsand hence, non-linear mixing/bouncing of photons. Hence,there could be coupling of emitted radiation from differentsurface components of alunite, limestone and quartz crystal,which could result in such spectral non-linearity and uncer-tainty zone.
Fig. 4. Hypercube mapping with (a.) Limestone, (b.) Alunite,and (c.) Quartz using SFF.
The thermal-infrared (TIR) radiance directly consists ofreflected and emitted radiance from the adjacent scene sam-ples. The apparent emissivity is reduced by reflected radia-tion because the emissivity (ε) and reflectivity (ρ) are alwayscomplementary to each other (Kirchhoff’s law). If materi-als are close enough, then radiation emitted by each mate-rial is absorbed by the adjacent materials. They may then beemitted later by the other materials. This process of absorp-tion and emission give rise to higher non-linearity. In somecases, emitted radiation from one sample has been transmittedthrough the other adjacent sample and then emitted towardsthe sensor. Thus, the presence of alunite spectral feature oncertain faces of quartz sample conveys that the emission spec-troscopy is clearly not a case of linear spectral mixing. In Fig.5 the elliptical portion shows precisely the higher uncertaintyarea due to the dominance of alunite emissivity over quartz.
Fig. 5. TIR hyperspectral data showing unmapped area (dot-ted ellipse) at extreme left of quartz crystal.
The derived emissivity spectra for limestone, alunite,quartz, and mixed alunite-quartz zone (most uncertain ellipti-cal region) are shown in Fig. 6.
Fig. 6. Derived emissivity profiles for limestone, alunite,quartz, and mixed alunite-quartz.
Fig. 7 shows a fractional abundance image for eachendmember, obtained from the linear spectral unmixing(DWT+PCC+FCQPA). In these abundance maps, the darkblack pixels represent the lowest fractions value (0), differentshades of grey color indicate increasing abundance, and exactwhite pixels indicate the maximum fractions value (1). Thus,the endmembers 1 to 4 are identified to represent quartz, 5and 6 as limestone, 8 and 9 as alunite. The endmember 7clearly indicates that it is a mixture of alunite and quartz.Pixels representing value 1 in the classified map typically in-dicate purest pixels. Whereas, pixels with values lower than1 indicate mixed nature of spectra. The pixels that could notbe resolved with the chosen set of endmembers (0 values)usually appear dark.
Fig. 7. Fractional abundance maps estimated from nine end-members (EM) using FCLSE (QP) algorithm.
To understand the variations in spectral similarity betweenpure pixels and mix pixels, a RMSE image (Fig. 8) is obtainedafter taking root mean square difference between actual andestimated modeled spectra for each image pixel. The ellipti-cal area in Fig. 8 can be qualitatively compared with Fig. 5for maximum RMSE zones (yellow color dotted ellipse). This
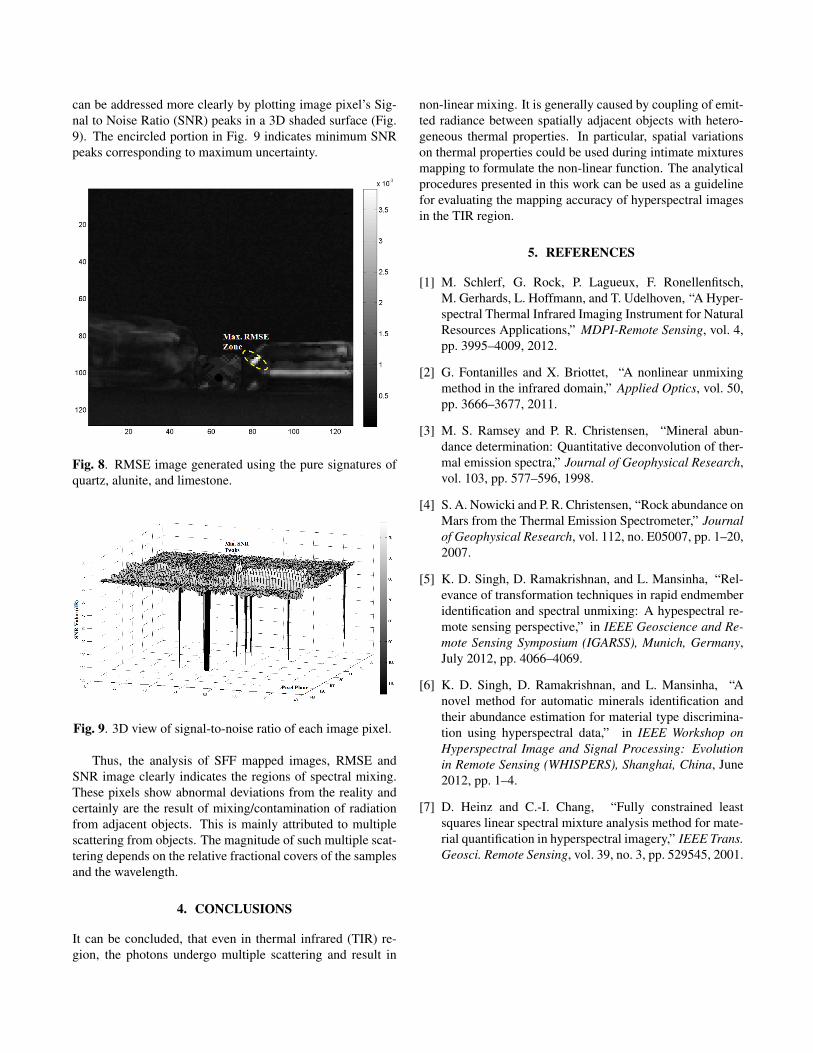
can be addressed more clearly by plotting image pixel’s Sig-nal to Noise Ratio (SNR) peaks in a 3D shaded surface (Fig.9). The encircled portion in Fig. 9 indicates minimum SNRpeaks corresponding to maximum uncertainty.
Fig. 8. RMSE image generated using the pure signatures ofquartz, alunite, and limestone.
Fig. 9. 3D view of signal-to-noise ratio of each image pixel.
Thus, the analysis of SFF mapped images, RMSE andSNR image clearly indicates the regions of spectral mixing.These pixels show abnormal deviations from the reality andcertainly are the result of mixing/contamination of radiationfrom adjacent objects. This is mainly attributed to multiplescattering from objects. The magnitude of such multiple scat-tering depends on the relative fractional covers of the samplesand the wavelength.
4. CONCLUSIONS
It can be concluded, that even in thermal infrared (TIR) re-gion, the photons undergo multiple scattering and result in
non-linear mixing. It is generally caused by coupling of emit-ted radiance between spatially adjacent objects with hetero-geneous thermal properties. In particular, spatial variationson thermal properties could be used during intimate mixturesmapping to formulate the non-linear function. The analyticalprocedures presented in this work can be used as a guidelinefor evaluating the mapping accuracy of hyperspectral imagesin the TIR region.
5. REFERENCES
[1] M. Schlerf, G. Rock, P. Lagueux, F. Ronellenfitsch,M. Gerhards, L. Hoffmann, and T. Udelhoven, “A Hyper-spectral Thermal Infrared Imaging Instrument for NaturalResources Applications,” MDPI-Remote Sensing, vol. 4,pp. 3995–4009, 2012.
[2] G. Fontanilles and X. Briottet, “A nonlinear unmixingmethod in the infrared domain,” Applied Optics, vol. 50,pp. 3666–3677, 2011.
[3] M. S. Ramsey and P. R. Christensen, “Mineral abun-dance determination: Quantitative deconvolution of ther-mal emission spectra,” Journal of Geophysical Research,vol. 103, pp. 577–596, 1998.
[4] S. A. Nowicki and P. R. Christensen, “Rock abundance onMars from the Thermal Emission Spectrometer,” Journalof Geophysical Research, vol. 112, no. E05007, pp. 1–20,2007.
[5] K. D. Singh, D. Ramakrishnan, and L. Mansinha, “Rel-evance of transformation techniques in rapid endmemberidentification and spectral unmixing: A hypespectral re-mote sensing perspective,” in IEEE Geoscience and Re-mote Sensing Symposium (IGARSS), Munich, Germany,July 2012, pp. 4066–4069.
[6] K. D. Singh, D. Ramakrishnan, and L. Mansinha, “Anovel method for automatic minerals identification andtheir abundance estimation for material type discrimina-tion using hyperspectral data,” in IEEE Workshop onHyperspectral Image and Signal Processing: Evolutionin Remote Sensing (WHISPERS), Shanghai, China, June2012, pp. 1–4.
[7] D. Heinz and C.-I. Chang, “Fully constrained leastsquares linear spectral mixture analysis method for mate-rial quantification in hyperspectral imagery,” IEEE Trans.Geosci. Remote Sensing, vol. 39, no. 3, pp. 529545, 2001.