UNAVCO 2004 GPS Campaign Receiver and Antenna Testing · Cover (left to right/top to bottom): -...
66
UNAVCO 2004 GPS Campaign System Testing in Support of the Plate Boundary Observatory (PBO) Victoria Andreatta Charles Meertens Jim Greenberg Warren Gallaher
Transcript of UNAVCO 2004 GPS Campaign Receiver and Antenna Testing · Cover (left to right/top to bottom): -...

UNAVCO 2004 GPS Campaign System Testing in Support of the Plate Boundary Observatory (PBO)
Victoria Andreatta Charles Meertens Jim Greenberg Warren Gallaher
2
Table of Contents
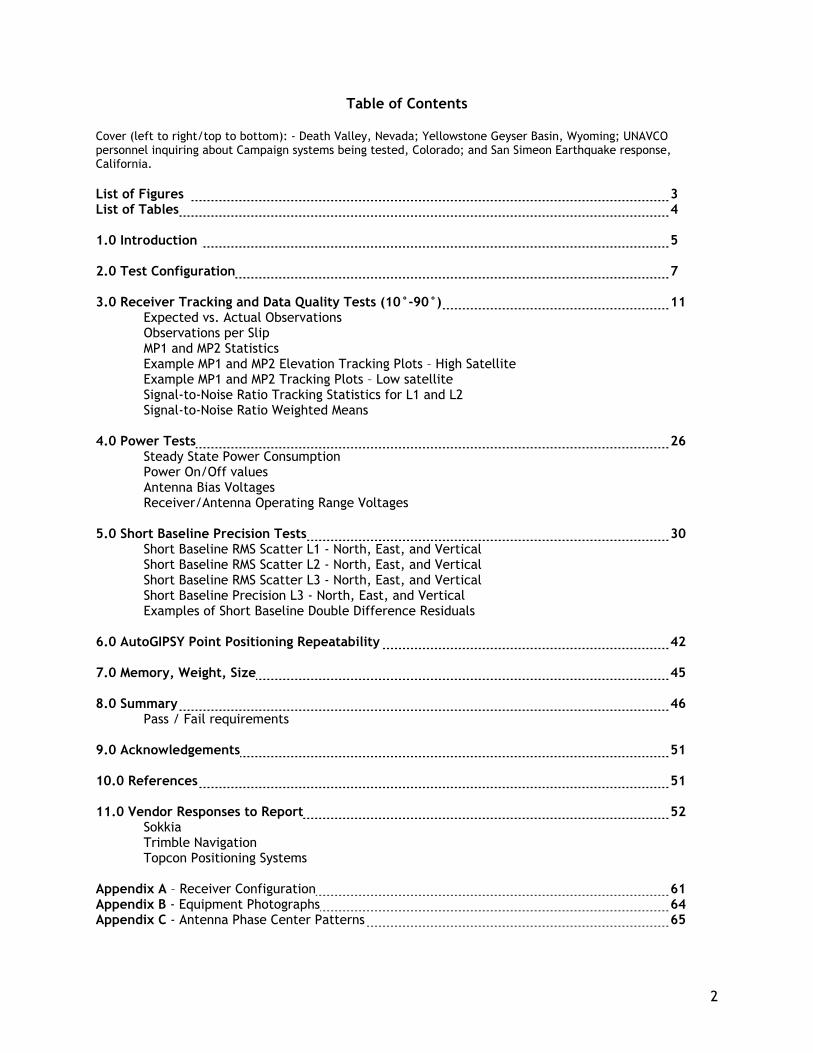
Cover (left to right/top to bottom): - Death Valley, Nevada; Yellowstone Geyser Basin, Wyoming; UNAVCO personnel inquiring about Campaign systems being tested, Colorado; and San Simeon Earthquake response, California. List of Figures 3 List of Tables 4 1.0 Introduction 5 2.0 Test Configuration 7 3.0 Receiver Tracking and Data Quality Tests (10°-90°) 11 Expected vs. Actual Observations Observations per Slip MP1 and MP2 Statistics Example MP1 and MP2 Elevation Tracking Plots – High Satellite Example MP1 and MP2 Tracking Plots – Low satellite Signal-to-Noise Ratio Tracking Statistics for L1 and L2 Signal-to-Noise Ratio Weighted Means 4.0 Power Tests 26 Steady State Power Consumption Power On/Off values Antenna Bias Voltages Receiver/Antenna Operating Range Voltages 5.0 Short Baseline Precision Tests 30 Short Baseline RMS Scatter L1 - North, East, and Vertical Short Baseline RMS Scatter L2 - North, East, and Vertical Short Baseline RMS Scatter L3 - North, East, and Vertical Short Baseline Precision L3 - North, East, and Vertical Examples of Short Baseline Double Difference Residuals 6.0 AutoGIPSY Point Positioning Repeatability 42 7.0 Memory, Weight, Size 45 8.0 Summary 46 Pass / Fail requirements 9.0 Acknowledgements 51 10.0 References 51 11.0 Vendor Responses to Report 52 Sokkia Trimble Navigation Topcon Positioning Systems Appendix A – Receiver Configuration 61 Appendix B - Equipment Photographs 64 Appendix C - Antenna Phase Center Patterns 65
3
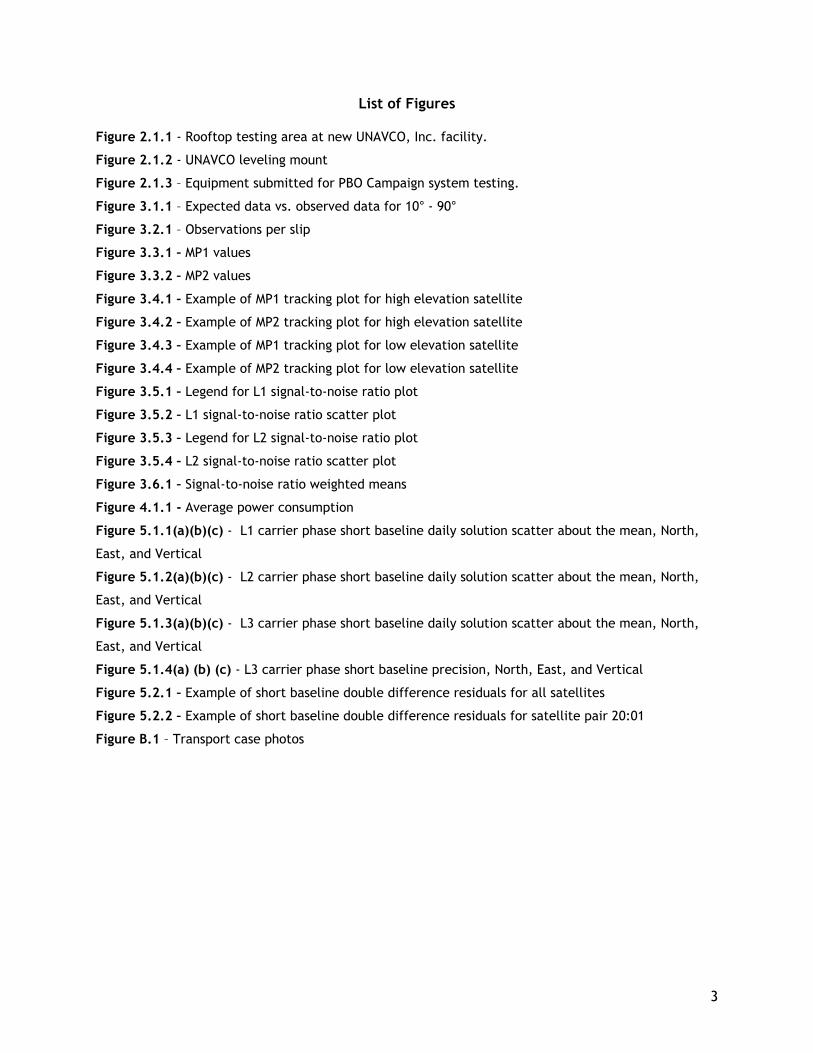
List of Figures Figure 2.1.1 - Rooftop testing area at new UNAVCO, Inc. facility.
Figure 2.1.2 - UNAVCO leveling mount
Figure 2.1.3 – Equipment submitted for PBO Campaign system testing.
Figure 3.1.1 – Expected data vs. observed data for 10° - 90°
Figure 3.2.1 – Observations per slip
Figure 3.3.1 – MP1 values
Figure 3.3.2 – MP2 values
Figure 3.4.1 – Example of MP1 tracking plot for high elevation satellite
Figure 3.4.2 – Example of MP2 tracking plot for high elevation satellite
Figure 3.4.3 – Example of MP1 tracking plot for low elevation satellite
Figure 3.4.4 – Example of MP2 tracking plot for low elevation satellite
Figure 3.5.1 – Legend for L1 signal-to-noise ratio plot
Figure 3.5.2 – L1 signal-to-noise ratio scatter plot
Figure 3.5.3 – Legend for L2 signal-to-noise ratio plot
Figure 3.5.4 – L2 signal-to-noise ratio scatter plot
Figure 3.6.1 – Signal-to-noise ratio weighted means
Figure 4.1.1 - Average power consumption
Figure 5.1.1(a)(b)(c) - L1 carrier phase short baseline daily solution scatter about the mean, North,
East, and Vertical
Figure 5.1.2(a)(b)(c) - L2 carrier phase short baseline daily solution scatter about the mean, North,
East, and Vertical
Figure 5.1.3(a)(b)(c) - L3 carrier phase short baseline daily solution scatter about the mean, North,
East, and Vertical
Figure 5.1.4(a) (b) (c) - L3 carrier phase short baseline precision, North, East, and Vertical
Figure 5.2.1 – Example of short baseline double difference residuals for all satellites
Figure 5.2.2 – Example of short baseline double difference residuals for satellite pair 20:01
Figure B.1 – Transport case photos
4
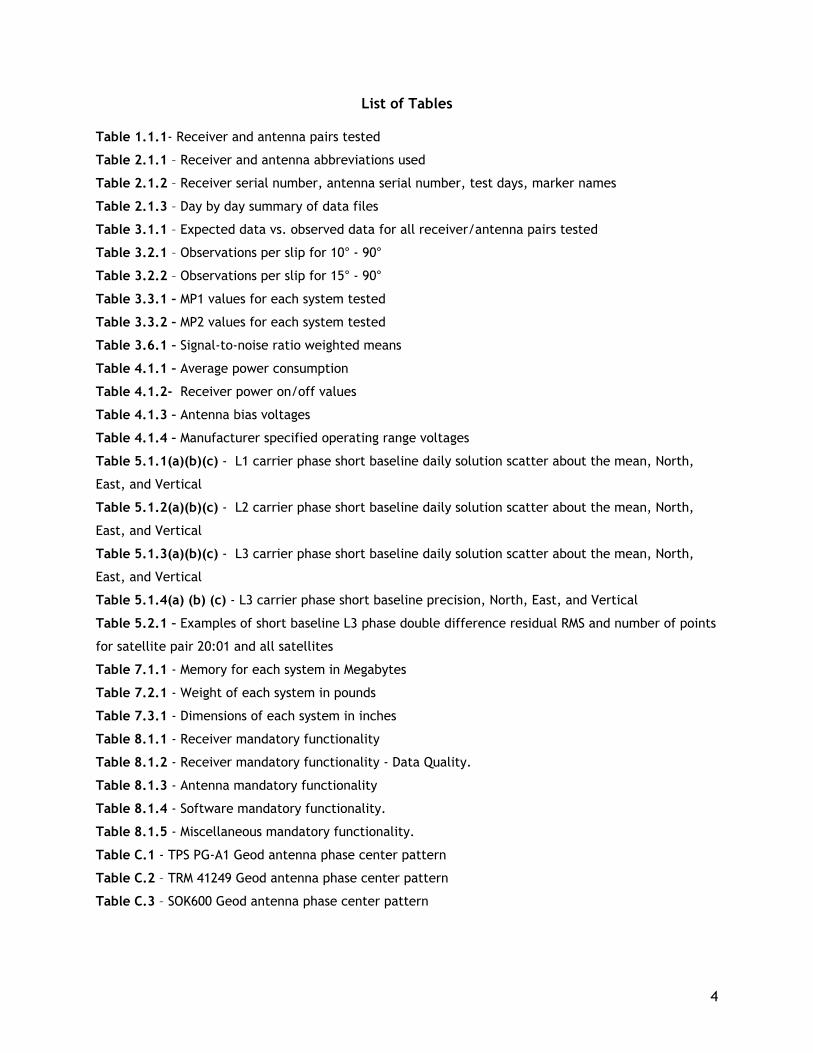
List of Tables Table 1.1.1- Receiver and antenna pairs tested
Table 2.1.1 – Receiver and antenna abbreviations used
Table 2.1.2 – Receiver serial number, antenna serial number, test days, marker names
Table 2.1.3 – Day by day summary of data files
Table 3.1.1 – Expected data vs. observed data for all receiver/antenna pairs tested
Table 3.2.1 – Observations per slip for 10° - 90°
Table 3.2.2 – Observations per slip for 15° - 90°
Table 3.3.1 – MP1 values for each system tested
Table 3.3.2 – MP2 values for each system tested
Table 3.6.1 – Signal-to-noise ratio weighted means
Table 4.1.1 – Average power consumption
Table 4.1.2- Receiver power on/off values
Table 4.1.3 – Antenna bias voltages
Table 4.1.4 – Manufacturer specified operating range voltages
Table 5.1.1(a)(b)(c) - L1 carrier phase short baseline daily solution scatter about the mean, North,
East, and Vertical
Table 5.1.2(a)(b)(c) - L2 carrier phase short baseline daily solution scatter about the mean, North,
East, and Vertical
Table 5.1.3(a)(b)(c) - L3 carrier phase short baseline daily solution scatter about the mean, North,
East, and Vertical
Table 5.1.4(a) (b) (c) - L3 carrier phase short baseline precision, North, East, and Vertical
Table 5.2.1 – Examples of short baseline L3 phase double difference residual RMS and number of points
for satellite pair 20:01 and all satellites
Table 7.1.1 - Memory for each system in Megabytes
Table 7.2.1 - Weight of each system in pounds
Table 7.3.1 - Dimensions of each system in inches
Table 8.1.1 - Receiver mandatory functionality
Table 8.1.2 - Receiver mandatory functionality - Data Quality.
Table 8.1.3 - Antenna mandatory functionality
Table 8.1.4 - Software mandatory functionality.
Table 8.1.5 - Miscellaneous mandatory functionality.
Table C.1 - TPS PG-A1 Geod antenna phase center pattern
Table C.2 – TRM 41249 Geod antenna phase center pattern
Table C.3 – SOK600 Geod antenna phase center pattern
5
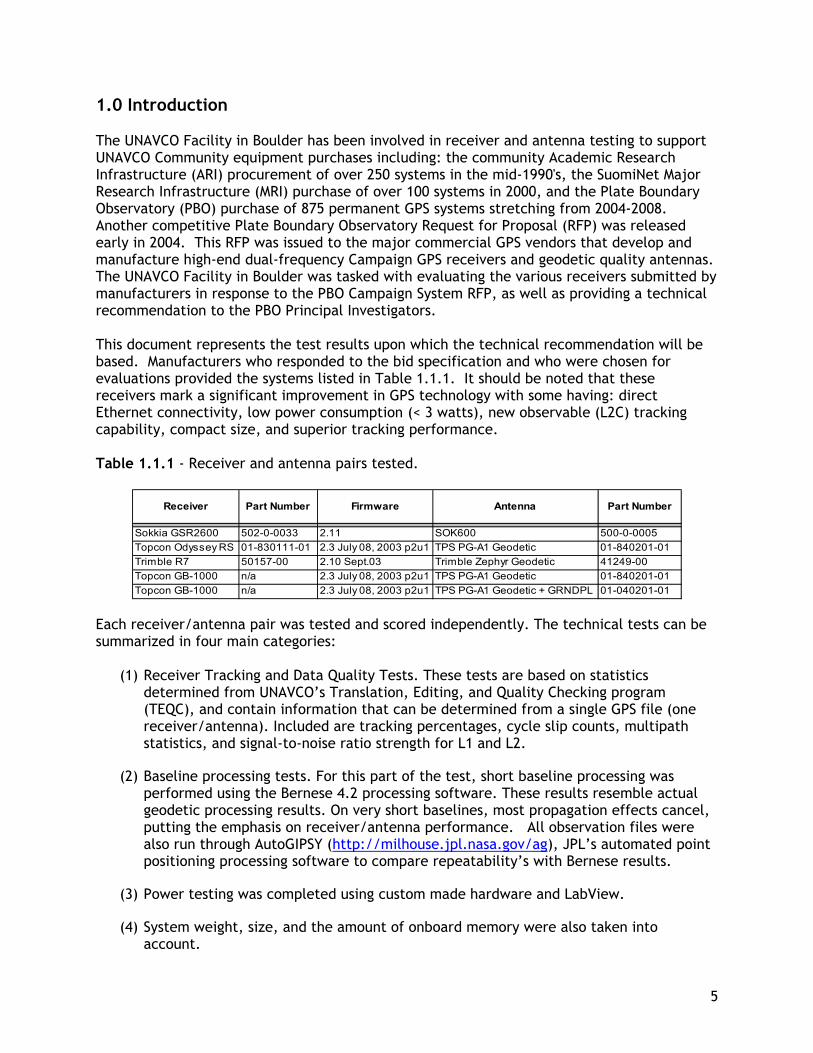
1.0 Introduction The UNAVCO Facility in Boulder has been involved in receiver and antenna testing to support UNAVCO Community equipment purchases including: the community Academic Research Infrastructure (ARI) procurement of over 250 systems in the mid-1990's, the SuomiNet Major Research Infrastructure (MRI) purchase of over 100 systems in 2000, and the Plate Boundary Observatory (PBO) purchase of 875 permanent GPS systems stretching from 2004-2008. Another competitive Plate Boundary Observatory Request for Proposal (RFP) was released early in 2004. This RFP was issued to the major commercial GPS vendors that develop and manufacture high-end dual-frequency Campaign GPS receivers and geodetic quality antennas. The UNAVCO Facility in Boulder was tasked with evaluating the various receivers submitted by manufacturers in response to the PBO Campaign System RFP, as well as providing a technical recommendation to the PBO Principal Investigators. This document represents the test results upon which the technical recommendation will be based. Manufacturers who responded to the bid specification and who were chosen for evaluations provided the systems listed in Table 1.1.1. It should be noted that these receivers mark a significant improvement in GPS technology with some having: direct Ethernet connectivity, low power consumption (< 3 watts), new observable (L2C) tracking capability, compact size, and superior tracking performance. Table 1.1.1 - Receiver and antenna pairs tested.
Receiver Part Number Firmware Antenna Part Number
Sokkia GSR2600 502-0-0033 2.11 SOK600 500-0-0005Topcon Odyssey RS 01-830111-01 2.3 July 08, 2003 p2u1 TPS PG-A1 Geodetic 01-840201-01Trimble R7 50157-00 2.10 Sept.03 Trimble Zephyr Geodetic 41249-00Topcon GB-1000 n/a 2.3 July 08, 2003 p2u1 TPS PG-A1 Geodetic 01-840201-01Topcon GB-1000 n/a 2.3 July 08, 2003 p2u1 TPS PG-A1 Geodetic + GRNDPL 01-040201-01
Each receiver/antenna pair was tested and scored independently. The technical tests can be summarized in four main categories:
(1) Receiver Tracking and Data Quality Tests. These tests are based on statistics determined from UNAVCO’s Translation, Editing, and Quality Checking program (TEQC), and contain information that can be determined from a single GPS file (one receiver/antenna). Included are tracking percentages, cycle slip counts, multipath statistics, and signal-to-noise ratio strength for L1 and L2.
(2) Baseline processing tests. For this part of the test, short baseline processing was performed using the Bernese 4.2 processing software. These results resemble actual geodetic processing results. On very short baselines, most propagation effects cancel, putting the emphasis on receiver/antenna performance. All observation files were also run through AutoGIPSY (http://milhouse.jpl.nasa.gov/ag), JPL’s automated point positioning processing software to compare repeatability’s with Bernese results.
(3) Power testing was completed using custom made hardware and LabView.
(4) System weight, size, and the amount of onboard memory were also taken into account.

6
These test results are summarized in each section and will be used to generate a numerical ranking of relative receiver/ antenna technical performance. The results will be included in a separate and confidential response to the PBO Principal Investigators. Additionally, a series of mandatory requirements were tabulated and are presented throughout this report. The summary contains the mandatory pass/fail specifications as stated in the RFP. The appendices contain information relating to receiver interfacing and configuration, transport case photographs, and the antenna phase center patterns used in processing.
7
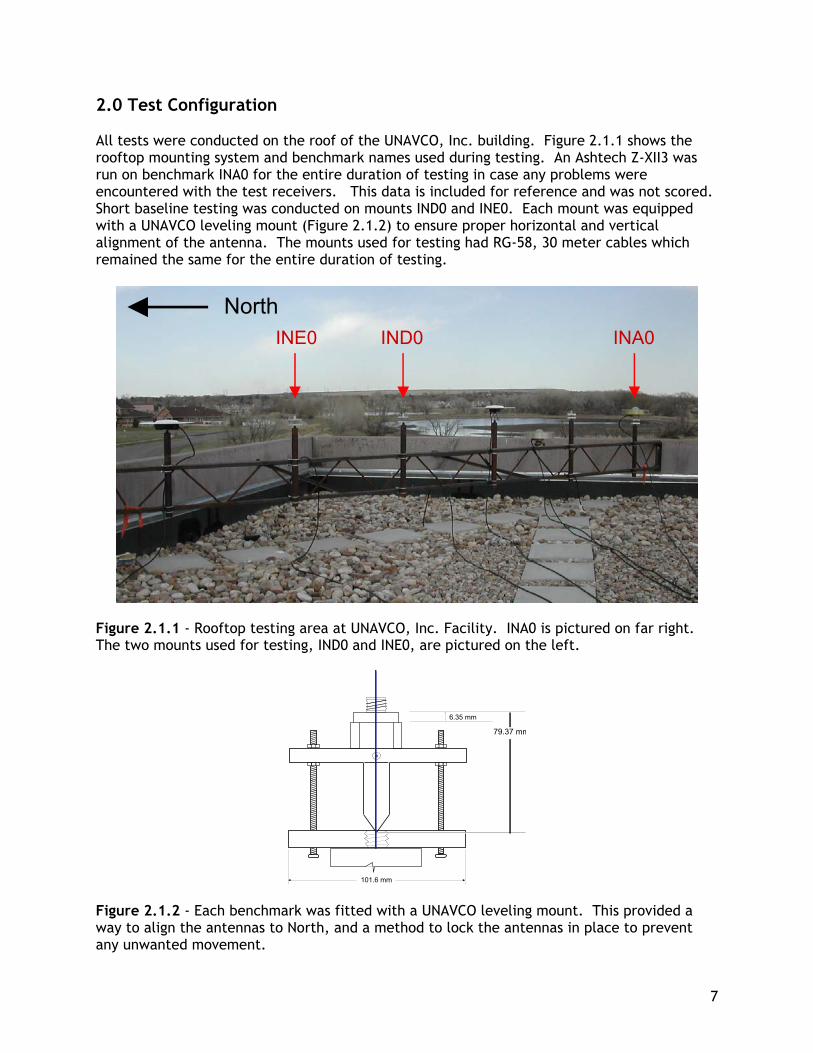
2.0 Test Configuration All tests were conducted on the roof of the UNAVCO, Inc. building. Figure 2.1.1 shows the rooftop mounting system and benchmark names used during testing. An Ashtech Z-XII3 was run on benchmark INA0 for the entire duration of testing in case any problems were encountered with the test receivers. This data is included for reference and was not scored. Short baseline testing was conducted on mounts IND0 and INE0. Each mount was equipped with a UNAVCO leveling mount (Figure 2.1.2) to ensure proper horizontal and vertical alignment of the antenna. The mounts used for testing had RG-58, 30 meter cables which remained the same for the entire duration of testing.
North
INA0IND0INE0
Figure 2.1.1 - Rooftop testing area at UNAVCO, Inc. Facility. INA0 is pictured on far right. The two mounts used for testing, IND0 and INE0, are pictured on the left.
79.37 mm
6.35 mm
101.6 mm Figure 2.1.2 - Each benchmark was fitted with a UNAVCO leveling mount. This provided a way to align the antennas to North, and a method to lock the antennas in place to prevent any unwanted movement.
8
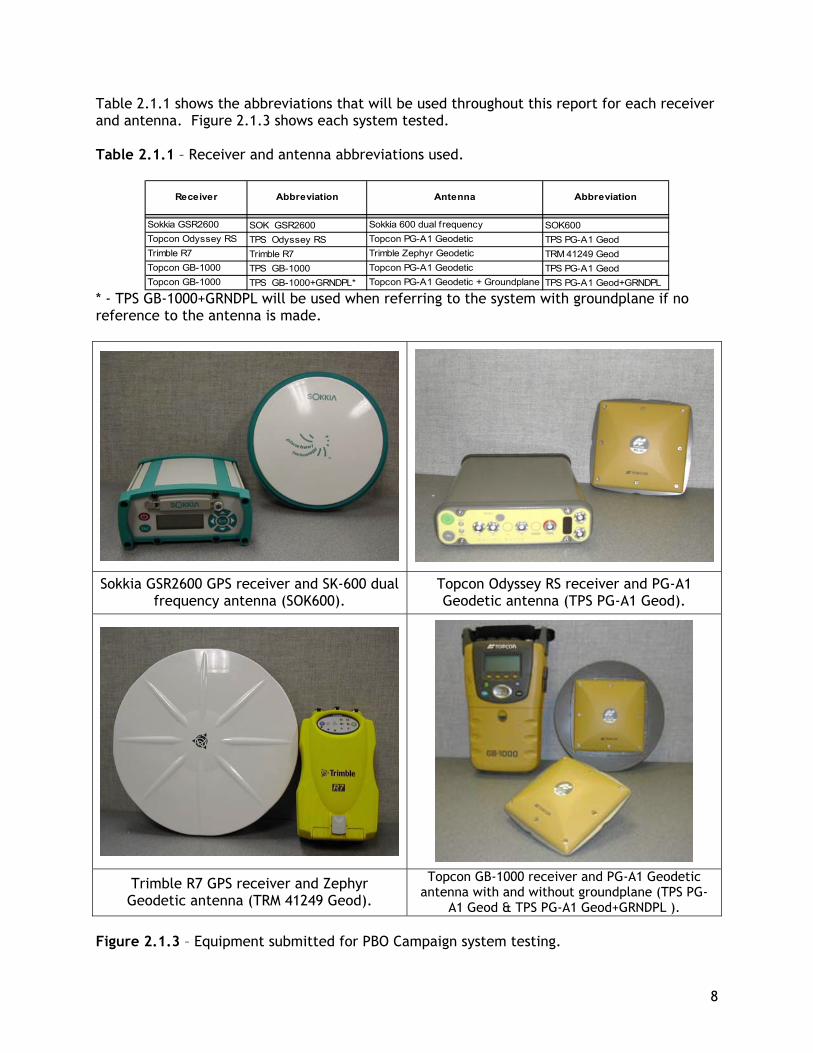
Table 2.1.1 shows the abbreviations that will be used throughout this report for each receiver and antenna. Figure 2.1.3 shows each system tested. Table 2.1.1 – Receiver and antenna abbreviations used.
Receiver Abbreviation Antenna Abbreviation
Sokkia GSR2600 SOK GSR2600 Sokkia 600 dual frequency SOK600Topcon Odyssey RS TPS Odyssey RS Topcon PG-A1 Geodetic TPS PG-A1 GeodTrimble R7 Trimble R7 Trimble Zephyr Geodetic TRM 41249 GeodTopcon GB-1000 TPS GB-1000 Topcon PG-A1 Geodetic TPS PG-A1 GeodTopcon GB-1000 TPS GB-1000+GRNDPL* Topcon PG-A1 Geodetic + Groundplane TPS PG-A1 Geod+GRNDPL
* - TPS GB-1000+GRNDPL will be used when referring to the system with groundplane if no reference to the antenna is made.
Sokkia GSR2600 GPS receiver and SK-600 dual frequency antenna (SOK600).
Topcon Odyssey RS receiver and PG-A1 Geodetic antenna (TPS PG-A1 Geod).
Trimble R7 GPS receiver and Zephyr Geodetic antenna (TRM 41249 Geod).
Topcon GB-1000 receiver and PG-A1 Geodetic antenna with and without groundplane (TPS PG-
A1 Geod & TPS PG-A1 Geod+GRNDPL ). Figure 2.1.3 – Equipment submitted for PBO Campaign system testing.
9
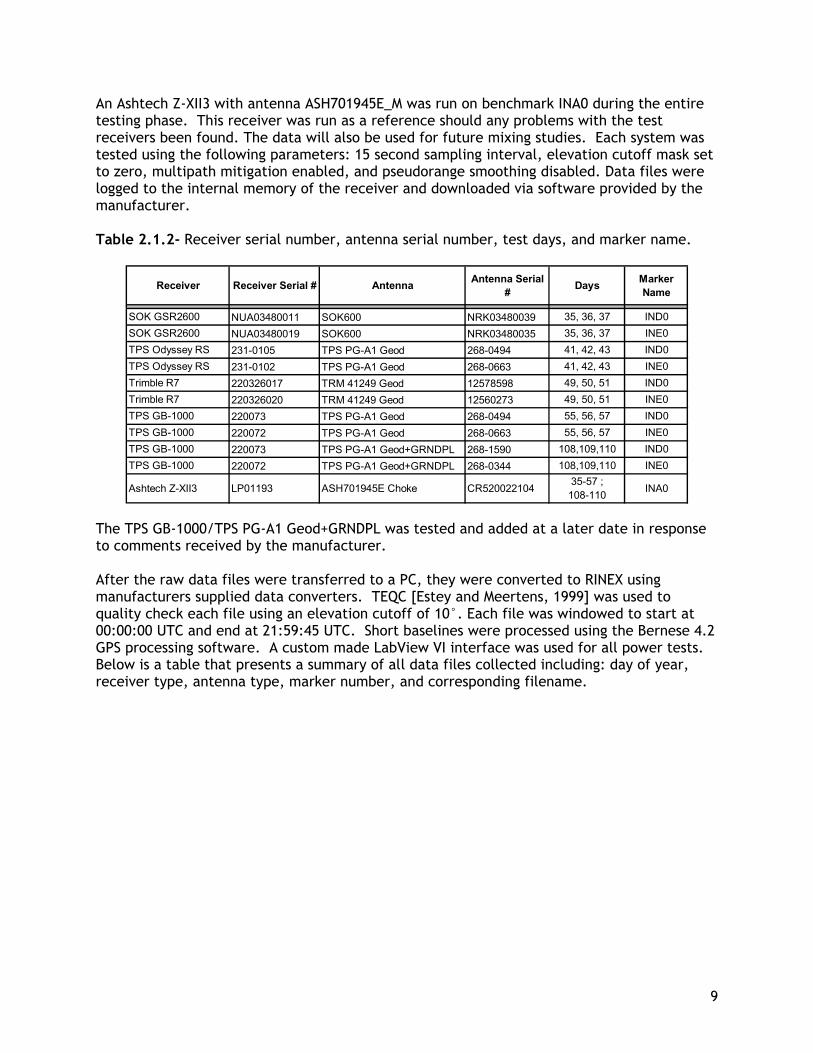
An Ashtech Z-XII3 with antenna ASH701945E_M was run on benchmark INA0 during the entire testing phase. This receiver was run as a reference should any problems with the test receivers been found. The data will also be used for future mixing studies. Each system was tested using the following parameters: 15 second sampling interval, elevation cutoff mask set to zero, multipath mitigation enabled, and pseudorange smoothing disabled. Data files were logged to the internal memory of the receiver and downloaded via software provided by the manufacturer. Table 2.1.2- Receiver serial number, antenna serial number, test days, and marker name.
Receiver Receiver Serial # Antenna Antenna Serial # Days Marker
Name
SOK GSR2600 NUA03480011 SOK600 NRK03480039 35, 36, 37 IND0SOK GSR2600 NUA03480019 SOK600 NRK03480035 35, 36, 37 INE0TPS Odyssey RS 231-0105 TPS PG-A1 Geod 268-0494 41, 42, 43 IND0TPS Odyssey RS 231-0102 TPS PG-A1 Geod 268-0663 41, 42, 43 INE0Trimble R7 220326017 TRM 41249 Geod 12578598 49, 50, 51 IND0Trimble R7 220326020 TRM 41249 Geod 12560273 49, 50, 51 INE0TPS GB-1000 220073 TPS PG-A1 Geod 268-0494 55, 56, 57 IND0TPS GB-1000 220072 TPS PG-A1 Geod 268-0663 55, 56, 57 INE0TPS GB-1000 220073 TPS PG-A1 Geod+GRNDPL 268-1590 108,109,110 IND0TPS GB-1000 220072 TPS PG-A1 Geod+GRNDPL 268-0344 108,109,110 INE0
Ashtech Z-XII3 LP01193 ASH701945E Choke CR52002210435-57 ; 108-110 INA0
The TPS GB-1000/TPS PG-A1 Geod+GRNDPL was tested and added at a later date in response to comments received by the manufacturer. After the raw data files were transferred to a PC, they were converted to RINEX using manufacturers supplied data converters. TEQC [Estey and Meertens, 1999] was used to quality check each file using an elevation cutoff of 10°. Each file was windowed to start at 00:00:00 UTC and end at 21:59:45 UTC. Short baselines were processed using the Bernese 4.2 GPS processing software. A custom made LabView VI interface was used for all power tests. Below is a table that presents a summary of all data files collected including: day of year, receiver type, antenna type, marker number, and corresponding filename.
10
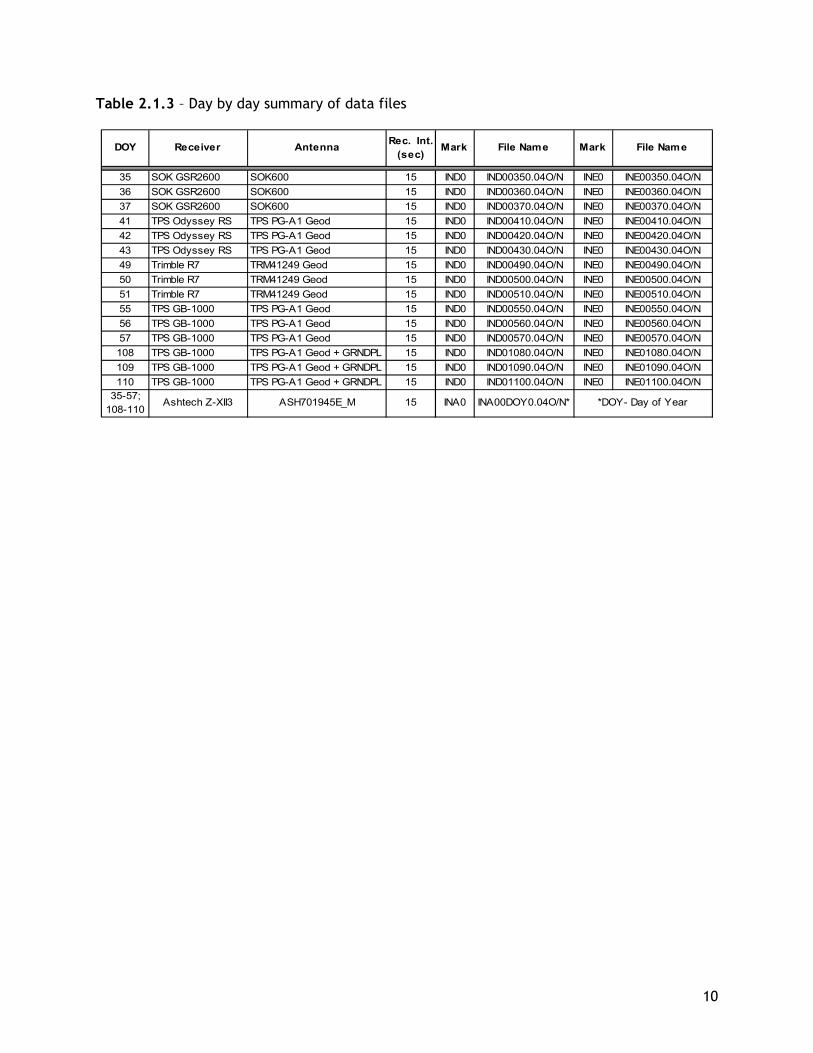
Table 2.1.3 – Day by day summary of data files
DOY Receiver Antenna Rec. Int. (sec)
Mark File Name Mark File Name
35 SOK GSR2600 SOK600 15 IND0 IND00350.04O/N INE0 INE00350.04O/N36 SOK GSR2600 SOK600 15 IND0 IND00360.04O/N INE0 INE00360.04O/N37 SOK GSR2600 SOK600 15 IND0 IND00370.04O/N INE0 INE00370.04O/N41 TPS Odyssey RS TPS PG-A1 Geod 15 IND0 IND00410.04O/N INE0 INE00410.04O/N42 TPS Odyssey RS TPS PG-A1 Geod 15 IND0 IND00420.04O/N INE0 INE00420.04O/N43 TPS Odyssey RS TPS PG-A1 Geod 15 IND0 IND00430.04O/N INE0 INE00430.04O/N49 Trimble R7 TRM41249 Geod 15 IND0 IND00490.04O/N INE0 INE00490.04O/N50 Trimble R7 TRM41249 Geod 15 IND0 IND00500.04O/N INE0 INE00500.04O/N51 Trimble R7 TRM41249 Geod 15 IND0 IND00510.04O/N INE0 INE00510.04O/N55 TPS GB-1000 TPS PG-A1 Geod 15 IND0 IND00550.04O/N INE0 INE00550.04O/N56 TPS GB-1000 TPS PG-A1 Geod 15 IND0 IND00560.04O/N INE0 INE00560.04O/N57 TPS GB-1000 TPS PG-A1 Geod 15 IND0 IND00570.04O/N INE0 INE00570.04O/N108 TPS GB-1000 TPS PG-A1 Geod + GRNDPL 15 IND0 IND01080.04O/N INE0 INE01080.04O/N109 TPS GB-1000 TPS PG-A1 Geod + GRNDPL 15 IND0 IND01090.04O/N INE0 INE01090.04O/N110 TPS GB-1000 TPS PG-A1 Geod + GRNDPL 15 IND0 IND01100.04O/N INE0 INE01100.04O/N
35-57; 108-110
Ashtech Z-XII3 ASH701945E_M 15 INA0 INA00DOY0.04O/N* *DOY- Day of Year
11
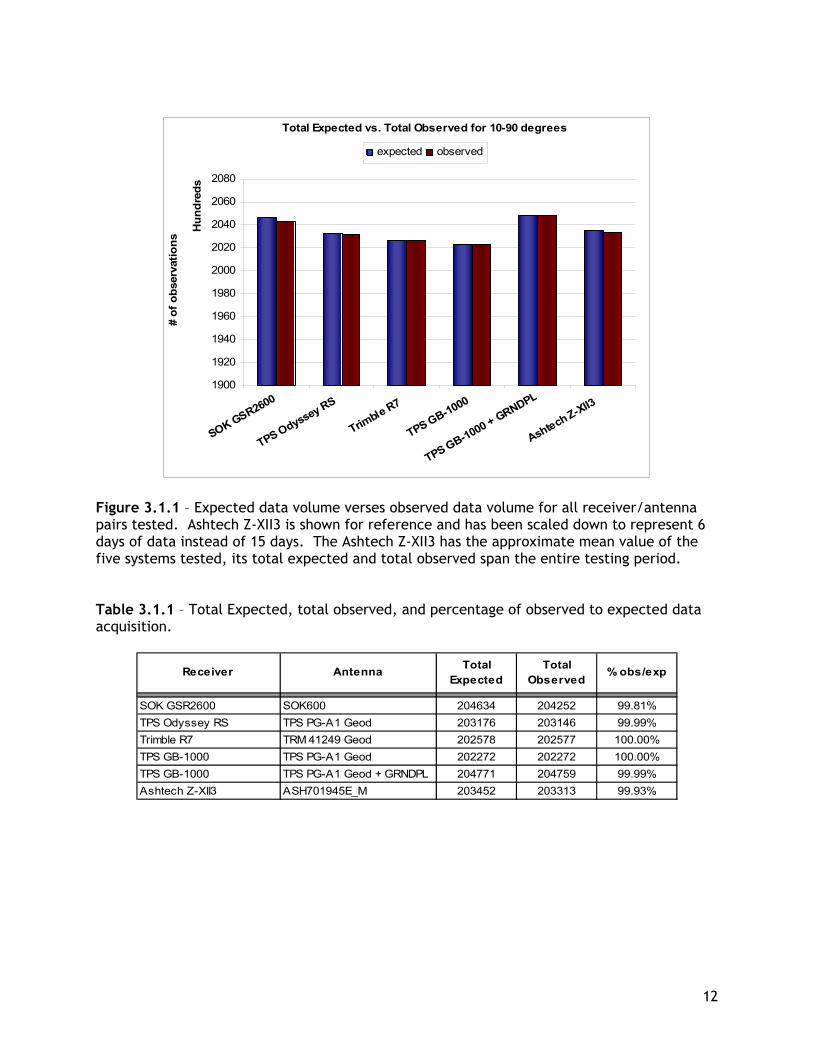
3.0 TEQC QC Statistics for 10° - 90° Data quality and receiver tracking statistics were compiled for RINEX files at high (10°-90°) elevation ranges. All quality control (QC) statistics are based on all 6 data files for any given particular receiver/antenna combination. Comparisons are based on: the total expected data volume verses the observed data volume, the total number of observations recorded divided by the total number of cycle slips, pseudorange and multipath noise statistics, and signal-to-noise ratios for L1 and L2. 3.1 Total Expected and Observed Data Figure 3.1.1 and Table 3.1.1 on the following page represent a cumulative summary of the amount of expected observations verses the amount of completed observations. The amount of expected observations is based on total data acquisition time for the actual number of satellites tracked. Due to the high number of unhealthy satellites during this time period (6 spanning the entire duration of testing), the following satellites were removed from all observation and navigation files: 02, 06, 13, 23, 27, 31, and 19. Satellites that could not be observed by all systems tested during the testing period were removed. Satellite 19 was removed from days 108-110 only. Removing un-healthy satellites helped eliminate possible erroneous data, or strange behavior the receiver might experience due to the changing health of one or multiple satellites. Summary: All receiver/ antenna combinations had greater than 99% observed to expected data acquisition. The TPS GB-1000 and the Trimble R7 both had a 100% data success rate, with zero cycle slips. The SOK GSR2600 had the lowest ratio of observed to expected data acquisition, and a total of 351 cycle slips.
12
Total Expected vs. Total Observed for 10-90 degrees
1900
1920
1940
1960
1980
2000
2020
2040
2060
2080
SOK GSR2600
TPS Odyssey RS
Trimble R7
TPS GB-1000
TPS GB-1000 + GRNDPL
Ashtech Z-XII3
Hun
dred
s
# of
obs
erva
tions
expected observed
Figure 3.1.1 – Expected data volume verses observed data volume for all receiver/antenna pairs tested. Ashtech Z-XII3 is shown for reference and has been scaled down to represent 6 days of data instead of 15 days. The Ashtech Z-XII3 has the approximate mean value of the five systems tested, its total expected and total observed span the entire testing period. Table 3.1.1 – Total Expected, total observed, and percentage of observed to expected data acquisition.
Receiver Antenna Total Expected
Total Observed
% obs/exp
SOK GSR2600 SOK600 204634 204252 99.81%TPS Odyssey RS TPS PG-A1 Geod 203176 203146 99.99%Trimble R7 TRM 41249 Geod 202578 202577 100.00%TPS GB-1000 TPS PG-A1 Geod 202272 202272 100.00%TPS GB-1000 TPS PG-A1 Geod + GRNDPL 204771 204759 99.99%Ashtech Z-XII3 ASH701945E_M 203452 203313 99.93%
13
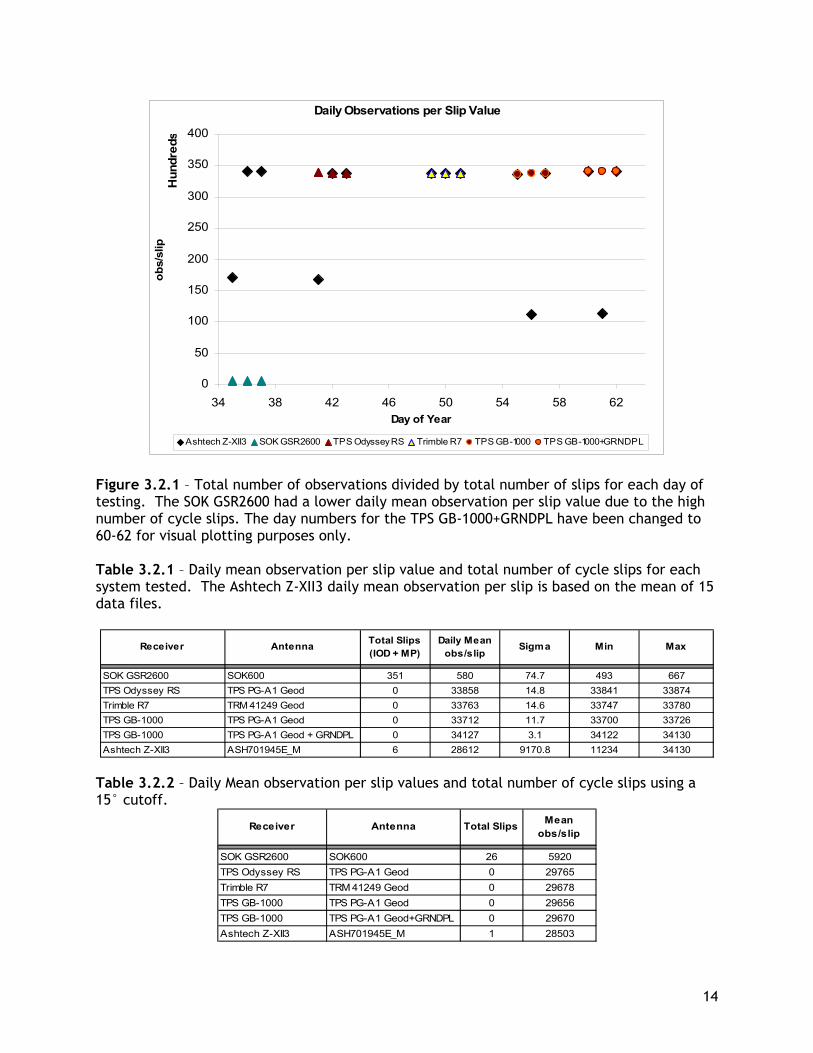
3.2 Observations per Slip Figure 3.2.1 and Table 3.2.1 on the following page summarize the TEQC observation per slip tracking statistics using a 10° elevation cutoff angle. Figure 3.2.1 represents the number of observations recorded divided by the number of slips for each day of testing. Table 3.2.1 represents the daily mean observation per slip value for the 3 days of data, both receivers. Summary Four out of five systems tested had greater than 33,000 observations per slip with no cycle slips. The Sokkia GSR2600 had 580 observations per slip. This low value was due to the large number (351) of cycle slips for the three days of data collected. In order to determine if the slips were primarily at low elevations, the daily mean observation per slip value was also calculated using a 15° cutoff. Table 3.2.2 shows that there are only 26 cycle slips when a 15° elevation angle cutoff is used, indicating that many of the SOK GSR2600 cycle slips are below 20°.
14
Daily Observations per Slip Value
0
50
100
150
200
250
300
350
400
34 38 42 46 50 54 58 62
Hun
dred
s
Day of Year
obs/
slip
Ashtech Z-XII3 SOK GSR2600 TPS Odyssey RS Trimble R7 TPS GB-1000 TPS GB-1000+GRNDPL
Figure 3.2.1 – Total number of observations divided by total number of slips for each day of testing. The SOK GSR2600 had a lower daily mean observation per slip value due to the high number of cycle slips. The day numbers for the TPS GB-1000+GRNDPL have been changed to 60-62 for visual plotting purposes only. Table 3.2.1 – Daily mean observation per slip value and total number of cycle slips for each system tested. The Ashtech Z-XII3 daily mean observation per slip is based on the mean of 15 data files.
Receiver Antenna Total Slips (IOD + MP)
Daily Mean obs/slip
Sigma Min Max
SOK GSR2600 SOK600 351 580 74.7 493 667TPS Odyssey RS TPS PG-A1 Geod 0 33858 14.8 33841 33874Trimble R7 TRM 41249 Geod 0 33763 14.6 33747 33780TPS GB-1000 TPS PG-A1 Geod 0 33712 11.7 33700 33726TPS GB-1000 TPS PG-A1 Geod + GRNDPL 0 34127 3.1 34122 34130Ashtech Z-XII3 ASH701945E_M 6 28612 9170.8 11234 34130
Table 3.2.2 – Daily Mean observation per slip values and total number of cycle slips using a 15° cutoff.
Receiver Antenna Total Slips Mean obs/slip
SOK GSR2600 SOK600 26 5920TPS Odyssey RS TPS PG-A1 Geod 0 29765Trimble R7 TRM 41249 Geod 0 29678TPS GB-1000 TPS PG-A1 Geod 0 29656TPS GB-1000 TPS PG-A1 Geod+GRNDPL 0 29670Ashtech Z-XII3 ASH701945E_M 1 28503
15
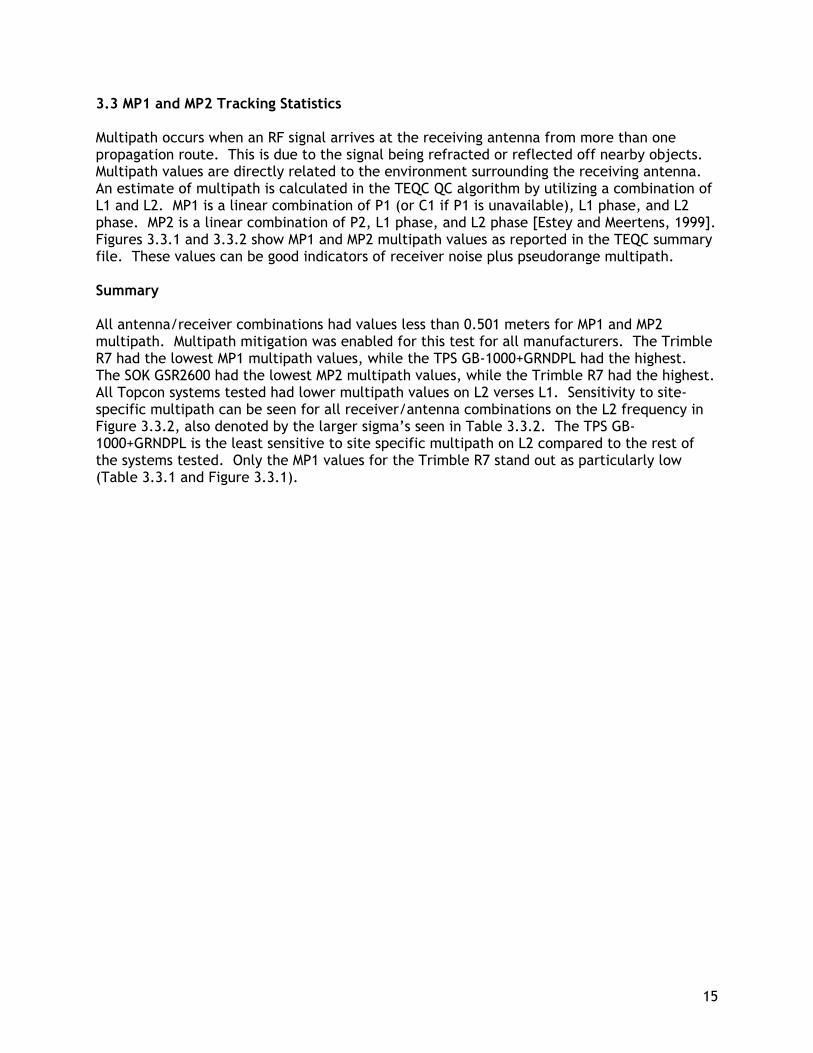
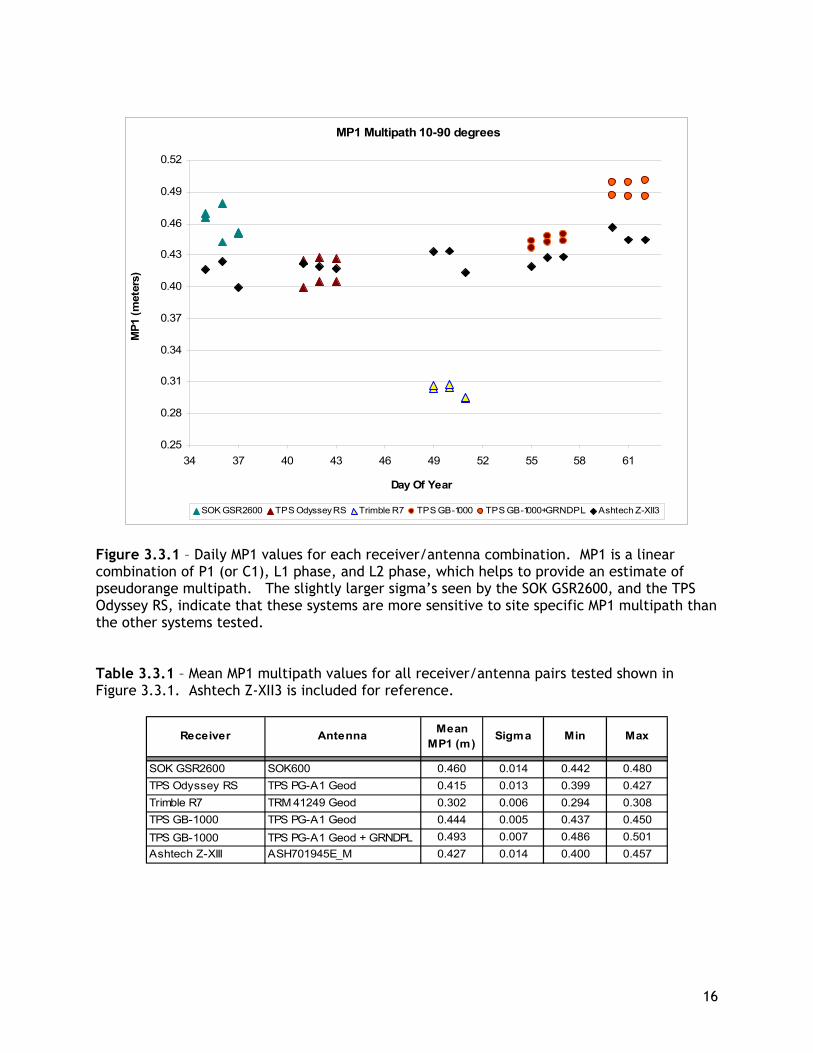
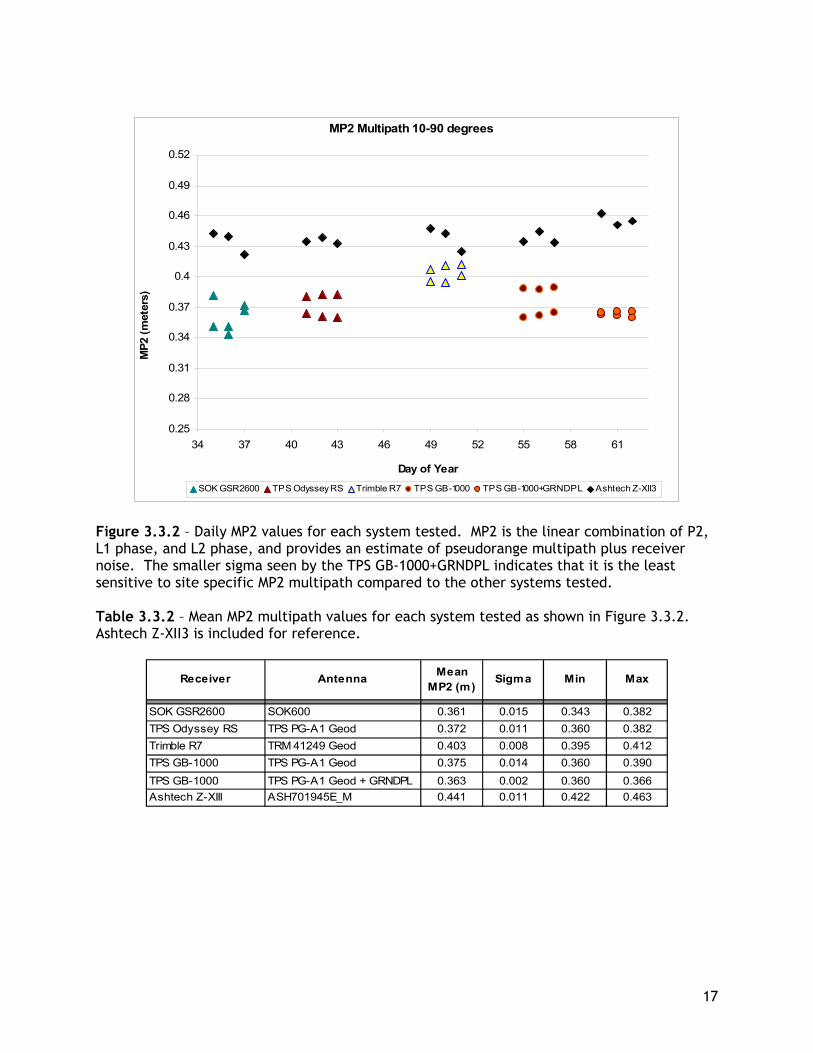
3.3 MP1 and MP2 Tracking Statistics Multipath occurs when an RF signal arrives at the receiving antenna from more than one propagation route. This is due to the signal being refracted or reflected off nearby objects. Multipath values are directly related to the environment surrounding the receiving antenna. An estimate of multipath is calculated in the TEQC QC algorithm by utilizing a combination of L1 and L2. MP1 is a linear combination of P1 (or C1 if P1 is unavailable), L1 phase, and L2 phase. MP2 is a linear combination of P2, L1 phase, and L2 phase [Estey and Meertens, 1999]. Figures 3.3.1 and 3.3.2 show MP1 and MP2 multipath values as reported in the TEQC summary file. These values can be good indicators of receiver noise plus pseudorange multipath. Summary All antenna/receiver combinations had values less than 0.501 meters for MP1 and MP2 multipath. Multipath mitigation was enabled for this test for all manufacturers. The Trimble R7 had the lowest MP1 multipath values, while the TPS GB-1000+GRNDPL had the highest. The SOK GSR2600 had the lowest MP2 multipath values, while the Trimble R7 had the highest. All Topcon systems tested had lower multipath values on L2 verses L1. Sensitivity to site-specific multipath can be seen for all receiver/antenna combinations on the L2 frequency in Figure 3.3.2, also denoted by the larger sigma’s seen in Table 3.3.2. The TPS GB-1000+GRNDPL is the least sensitive to site specific multipath on L2 compared to the rest of the systems tested. Only the MP1 values for the Trimble R7 stand out as particularly low (Table 3.3.1 and Figure 3.3.1).
16
MP1 Multipath 10-90 degrees
0.25
0.28
0.31
0.34
0.37
0.40
0.43
0.46
0.49
0.52
34 37 40 43 46 49 52 55 58 61
Day Of Year
MP1
(met
ers)
SOK GSR2600 TPS Odyssey RS Trimble R7 TPS GB-1000 TPS GB-1000+GRNDPL Ashtech Z-XII3
Figure 3.3.1 – Daily MP1 values for each receiver/antenna combination. MP1 is a linear combination of P1 (or C1), L1 phase, and L2 phase, which helps to provide an estimate of pseudorange multipath. The slightly larger sigma’s seen by the SOK GSR2600, and the TPS Odyssey RS, indicate that these systems are more sensitive to site specific MP1 multipath than the other systems tested. Table 3.3.1 – Mean MP1 multipath values for all receiver/antenna pairs tested shown in Figure 3.3.1. Ashtech Z-XII3 is included for reference.
Receiver Antenna Mean MP1 (m)
Sigma Min Max
SOK GSR2600 SOK600 0.460 0.014 0.442 0.480TPS Odyssey RS TPS PG-A1 Geod 0.415 0.013 0.399 0.427Trimble R7 TRM 41249 Geod 0.302 0.006 0.294 0.308TPS GB-1000 TPS PG-A1 Geod 0.444 0.005 0.437 0.450TPS GB-1000 TPS PG-A1 Geod + GRNDPL 0.493 0.007 0.486 0.501Ashtech Z-XIII ASH701945E_M 0.427 0.014 0.400 0.457
17
MP2 Multipath 10-90 degrees
0.25
0.28
0.31
0.34
0.37
0.4
0.43
0.46
0.49
0.52
34 37 40 43 46 49 52 55 58 61
Day of Year
MP2
(met
ers)
SOK GSR2600 TPS Odyssey RS Trimble R7 TPS GB-1000 TPS GB-1000+GRNDPL Ashtech Z-XII3
Figure 3.3.2 – Daily MP2 values for each system tested. MP2 is the linear combination of P2, L1 phase, and L2 phase, and provides an estimate of pseudorange multipath plus receiver noise. The smaller sigma seen by the TPS GB-1000+GRNDPL indicates that it is the least sensitive to site specific MP2 multipath compared to the other systems tested. Table 3.3.2 – Mean MP2 multipath values for each system tested as shown in Figure 3.3.2. Ashtech Z-XII3 is included for reference.
Receiver Antenna Mean MP2 (m)
Sigma Min Max
SOK GSR2600 SOK600 0.361 0.015 0.343 0.382TPS Odyssey RS TPS PG-A1 Geod 0.372 0.011 0.360 0.382Trimble R7 TRM 41249 Geod 0.403 0.008 0.395 0.412TPS GB-1000 TPS PG-A1 Geod 0.375 0.014 0.360 0.390TPS GB-1000 TPS PG-A1 Geod + GRNDPL 0.363 0.002 0.360 0.366Ashtech Z-XIII ASH701945E_M 0.441 0.011 0.422 0.463
18
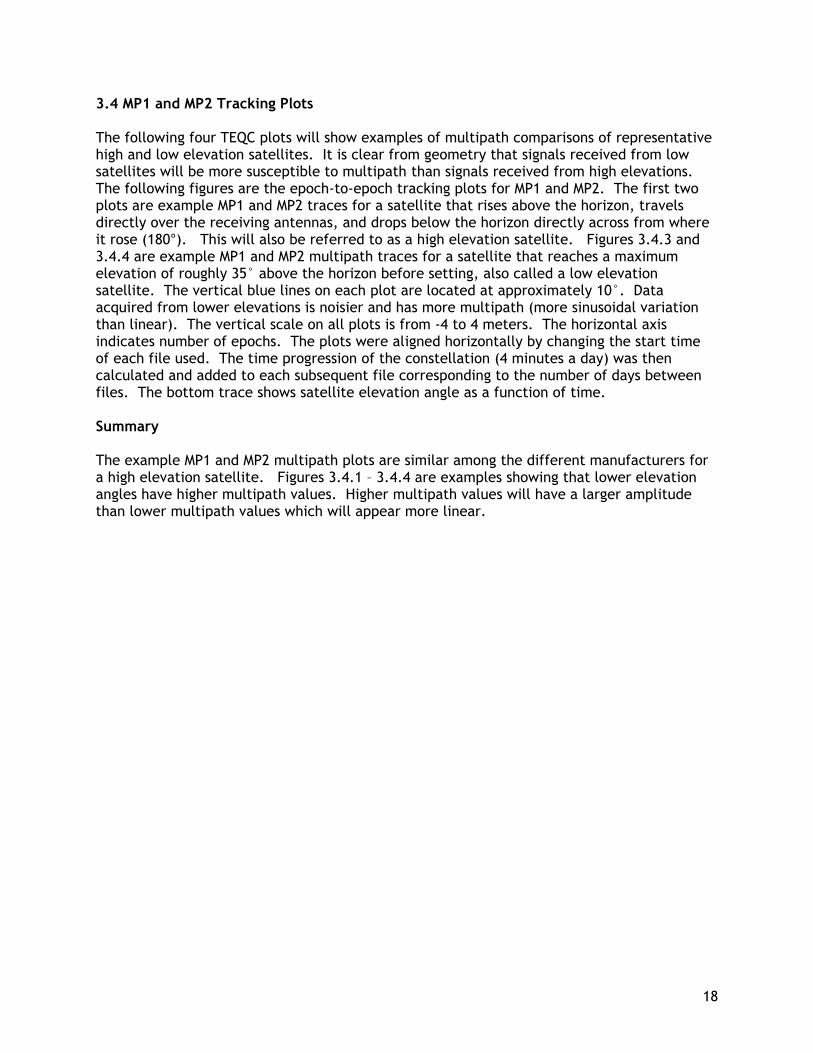
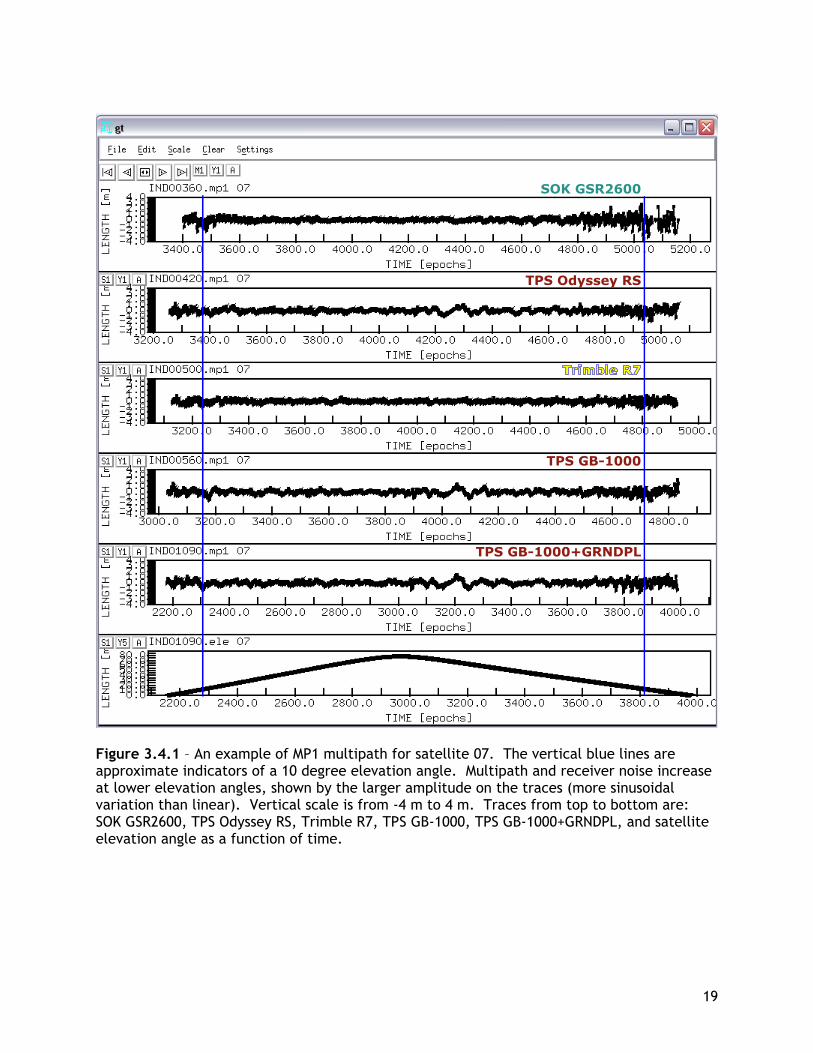
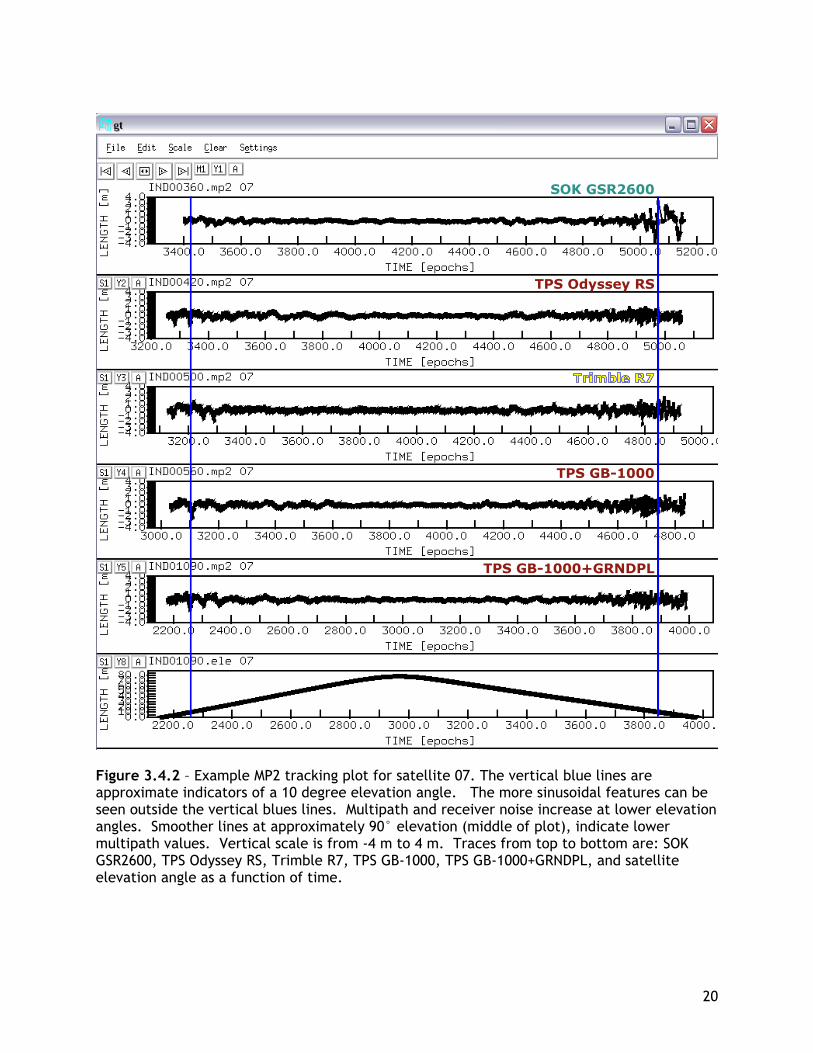
3.4 MP1 and MP2 Tracking Plots The following four TEQC plots will show examples of multipath comparisons of representative high and low elevation satellites. It is clear from geometry that signals received from low satellites will be more susceptible to multipath than signals received from high elevations. The following figures are the epoch-to-epoch tracking plots for MP1 and MP2. The first two plots are example MP1 and MP2 traces for a satellite that rises above the horizon, travels directly over the receiving antennas, and drops below the horizon directly across from where it rose (180°). This will also be referred to as a high elevation satellite. Figures 3.4.3 and 3.4.4 are example MP1 and MP2 multipath traces for a satellite that reaches a maximum elevation of roughly 35° above the horizon before setting, also called a low elevation satellite. The vertical blue lines on each plot are located at approximately 10°. Data acquired from lower elevations is noisier and has more multipath (more sinusoidal variation than linear). The vertical scale on all plots is from -4 to 4 meters. The horizontal axis indicates number of epochs. The plots were aligned horizontally by changing the start time of each file used. The time progression of the constellation (4 minutes a day) was then calculated and added to each subsequent file corresponding to the number of days between files. The bottom trace shows satellite elevation angle as a function of time. Summary The example MP1 and MP2 multipath plots are similar among the different manufacturers for a high elevation satellite. Figures 3.4.1 – 3.4.4 are examples showing that lower elevation angles have higher multipath values. Higher multipath values will have a larger amplitude than lower multipath values which will appear more linear.
19
SOK GSR2600
TPS GB-1000
TPS GB-1000+GRNDPL
TPS Odyssey RS
Figure 3.4.1 – An example of MP1 multipath for satellite 07. The vertical blue lines are approximate indicators of a 10 degree elevation angle. Multipath and receiver noise increase at lower elevation angles, shown by the larger amplitude on the traces (more sinusoidal variation than linear). Vertical scale is from -4 m to 4 m. Traces from top to bottom are: SOK GSR2600, TPS Odyssey RS, Trimble R7, TPS GB-1000, TPS GB-1000+GRNDPL, and satellite elevation angle as a function of time.
20
SOK GSR2600
TPS GB-1000
TPS GB-1000+GRNDPL
TPS Odyssey RS
Figure 3.4.2 – Example MP2 tracking plot for satellite 07. The vertical blue lines are approximate indicators of a 10 degree elevation angle. The more sinusoidal features can be seen outside the vertical blues lines. Multipath and receiver noise increase at lower elevation angles. Smoother lines at approximately 90° elevation (middle of plot), indicate lower multipath values. Vertical scale is from -4 m to 4 m. Traces from top to bottom are: SOK GSR2600, TPS Odyssey RS, Trimble R7, TPS GB-1000, TPS GB-1000+GRNDPL, and satellite elevation angle as a function of time.
21
SOK GSR2600
TPS GB-1000
TPS GB-1000+GRNDPL
TPS Odyssey RS
Figure 3.4.3 – An example MP1 tracking plot for satellite 03 which reaches a maximum elevation of approximately 35°. Traces have more sinusoidal variation below approximately 10° than seen in Figures 3.4.1 and 3.4.2 which indicate higher noise and more multipath. Vertical scale is from -4 m to 4 m. Traces from top to bottom are: SOK GSR2600, TPS Odyssey RS, Trimble R7, TPS GB-1000, TPS GB-1000+GRNDPL, and satellite elevation angle as a function of time.
22
SOK GSR2600
TPS GB-1000
TPS GB-1000+GRNDPL
TPS Odyssey RS
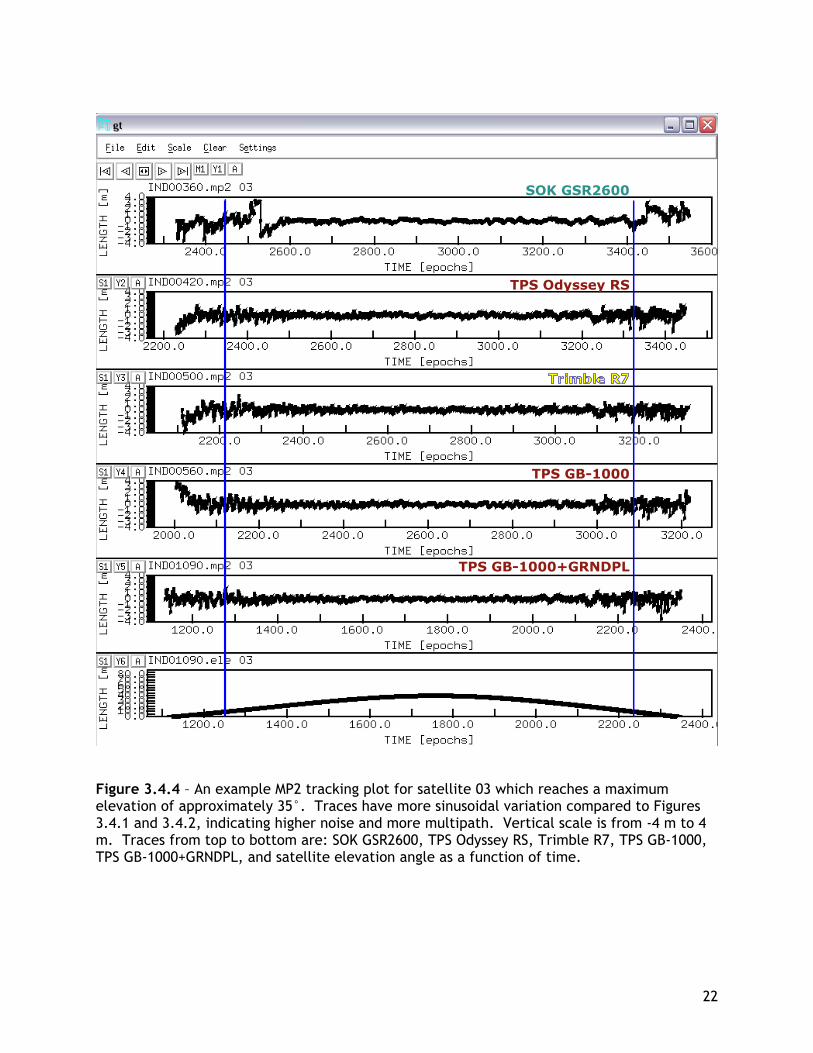
Figure 3.4.4 – An example MP2 tracking plot for satellite 03 which reaches a maximum elevation of approximately 35°. Traces have more sinusoidal variation compared to Figures 3.4.1 and 3.4.2, indicating higher noise and more multipath. Vertical scale is from -4 m to 4 m. Traces from top to bottom are: SOK GSR2600, TPS Odyssey RS, Trimble R7, TPS GB-1000, TPS GB-1000+GRNDPL, and satellite elevation angle as a function of time.
23
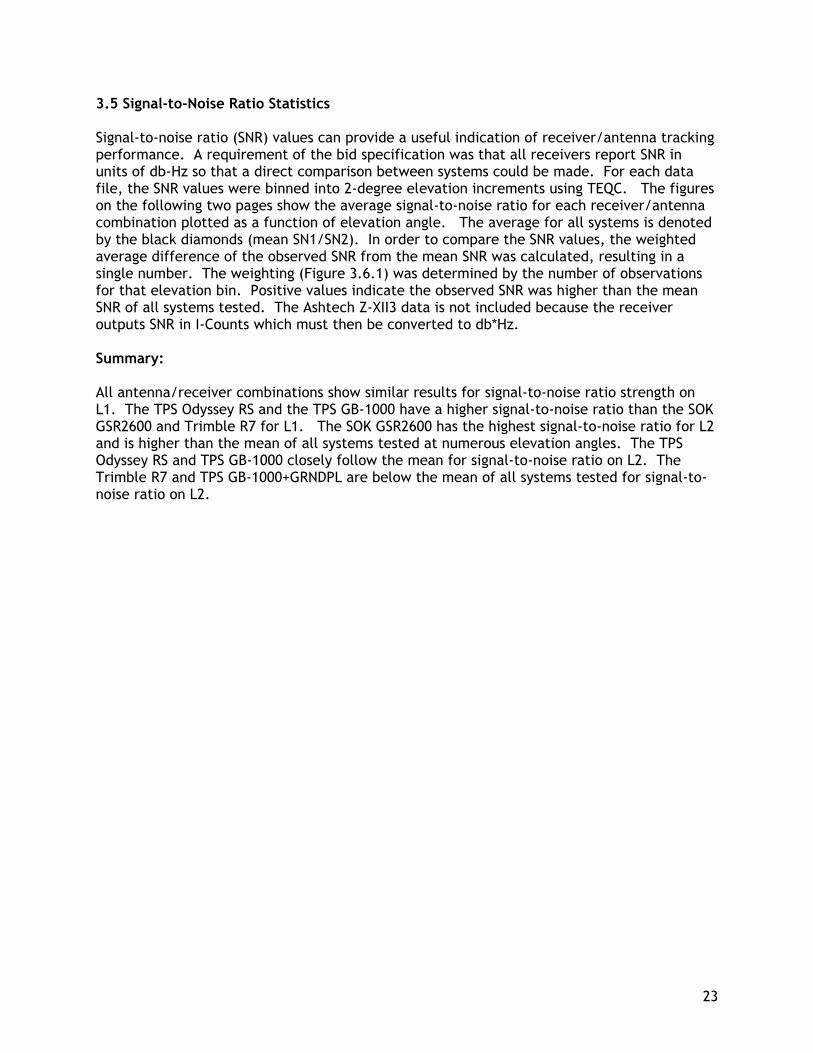
3.5 Signal-to-Noise Ratio Statistics Signal-to-noise ratio (SNR) values can provide a useful indication of receiver/antenna tracking performance. A requirement of the bid specification was that all receivers report SNR in units of db-Hz so that a direct comparison between systems could be made. For each data file, the SNR values were binned into 2-degree elevation increments using TEQC. The figures on the following two pages show the average signal-to-noise ratio for each receiver/antenna combination plotted as a function of elevation angle. The average for all systems is denoted by the black diamonds (mean SN1/SN2). In order to compare the SNR values, the weighted average difference of the observed SNR from the mean SNR was calculated, resulting in a single number. The weighting (Figure 3.6.1) was determined by the number of observations for that elevation bin. Positive values indicate the observed SNR was higher than the mean SNR of all systems tested. The Ashtech Z-XII3 data is not included because the receiver outputs SNR in I-Counts which must then be converted to db*Hz. Summary: All antenna/receiver combinations show similar results for signal-to-noise ratio strength on L1. The TPS Odyssey RS and the TPS GB-1000 have a higher signal-to-noise ratio than the SOK GSR2600 and Trimble R7 for L1. The SOK GSR2600 has the highest signal-to-noise ratio for L2 and is higher than the mean of all systems tested at numerous elevation angles. The TPS Odyssey RS and TPS GB-1000 closely follow the mean for signal-to-noise ratio on L2. The Trimble R7 and TPS GB-1000+GRNDPL are below the mean of all systems tested for signal-to-noise ratio on L2.
24
SOK GSR2600
TPS Odyssey RS TPS GB-1000
Mean SN1
Trimble R7
TPS GB-1000 +GRNDPL
Figure 3.5.1 – Legend for L1 signal-to-noise ratio plot
Signal to Noise Ratio L1
38
40
42
44
46
48
50
52
0 10 20 30 40 50 60 70 80 90
Elevation Angle (degrees)
SNR
(db*
Hz
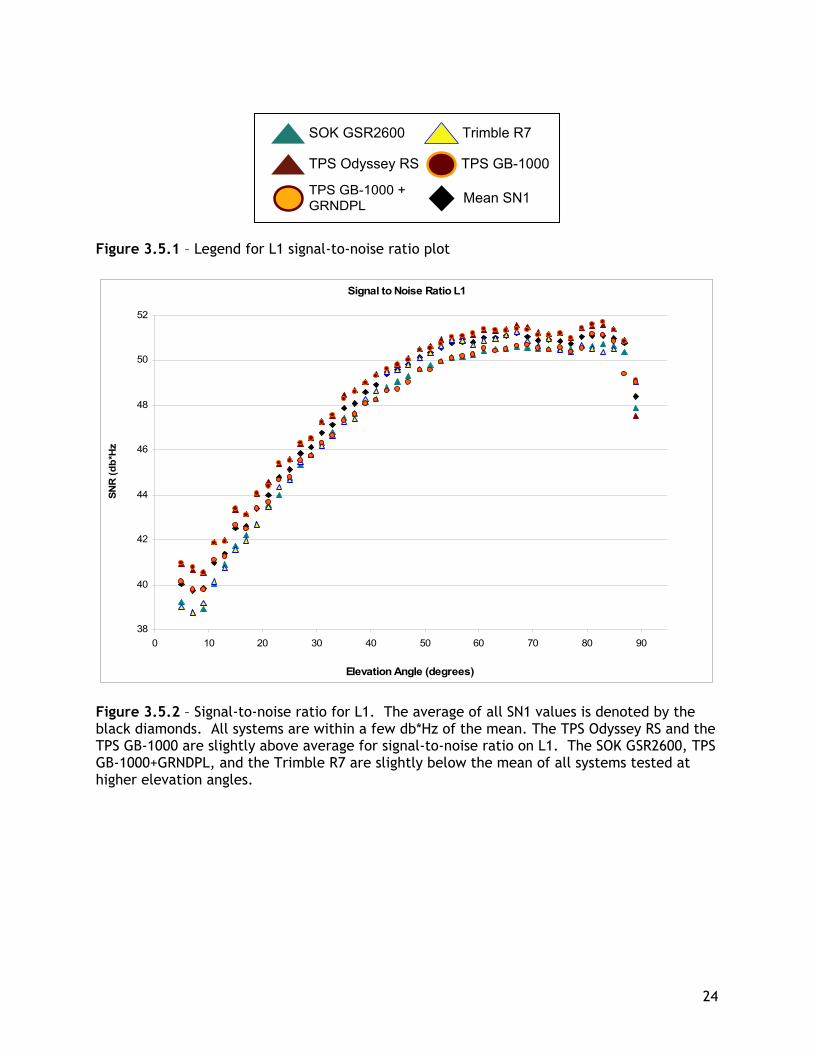
Figure 3.5.2 – Signal-to-noise ratio for L1. The average of all SN1 values is denoted by the black diamonds. All systems are within a few db*Hz of the mean. The TPS Odyssey RS and the TPS GB-1000 are slightly above average for signal-to-noise ratio on L1. The SOK GSR2600, TPS GB-1000+GRNDPL, and the Trimble R7 are slightly below the mean of all systems tested at higher elevation angles.
25
SOK GSR2600
TPS Odyssey RS TPS GB-1000
Mean SN2
Trimble R7
TPS GB-1000 +GRNDPL
Figure 3.5.3 – Legend for L2 signal-to-noise ratio plot.
Signal-to-Noise Ratio L2
18
21
24
27
30
33
36
39
42
45
48
0 10 20 30 40 50 60 70 80 90
Elevation Angle (degrees)
SN2
(db*
Hz
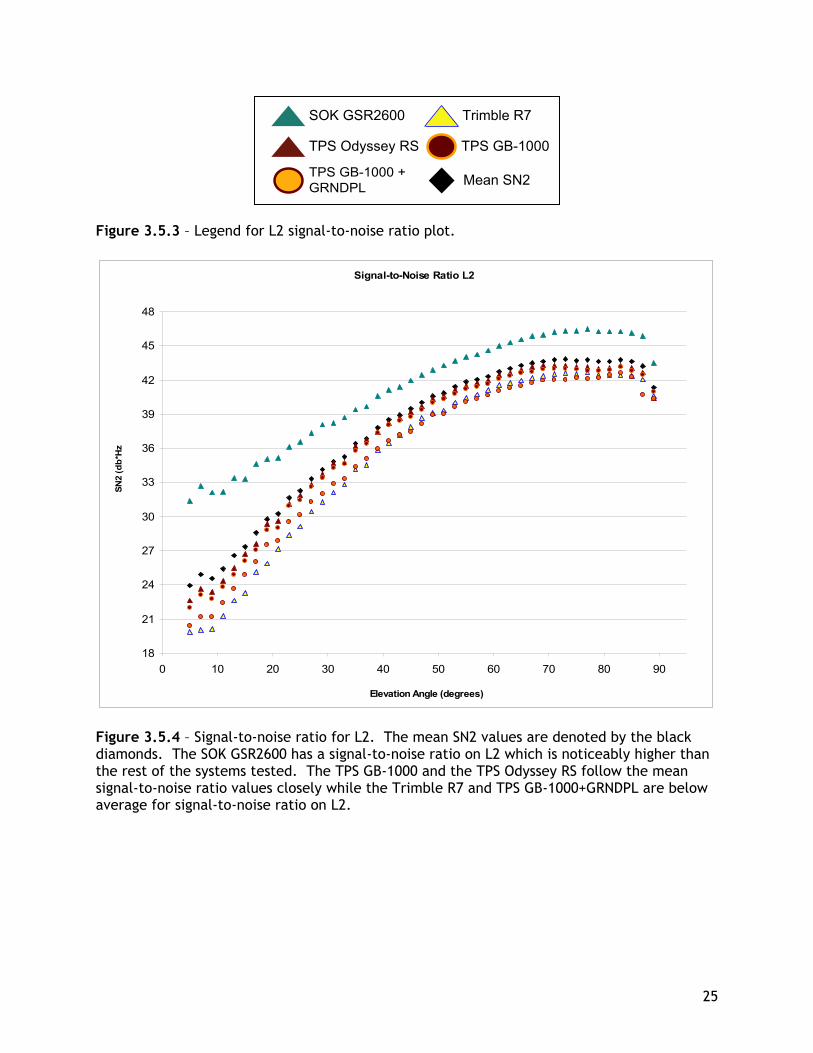
Figure 3.5.4 – Signal-to-noise ratio for L2. The mean SN2 values are denoted by the black diamonds. The SOK GSR2600 has a signal-to-noise ratio on L2 which is noticeably higher than the rest of the systems tested. The TPS GB-1000 and the TPS Odyssey RS follow the mean signal-to-noise ratio values closely while the Trimble R7 and TPS GB-1000+GRNDPL are below average for signal-to-noise ratio on L2.
26
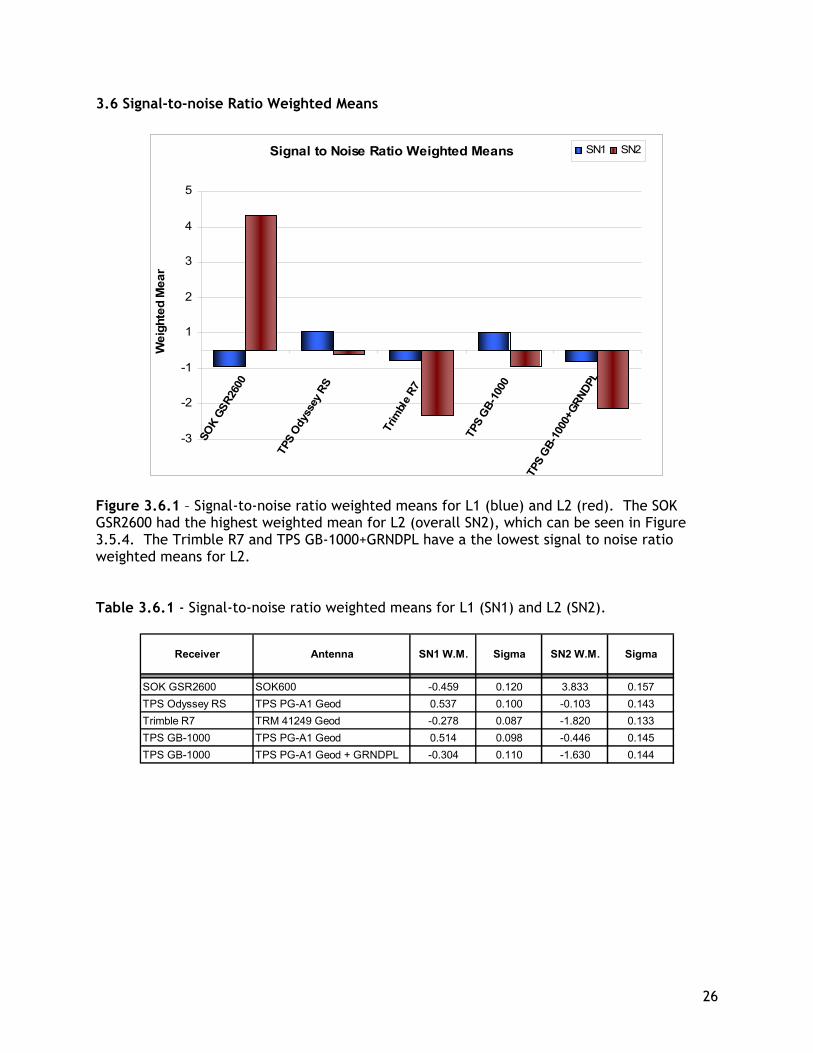
3.6 Signal-to-noise Ratio Weighted Means
Signal to Noise Ratio Weighted Means
-3
-2
-1
1
2
3
4
5SO
K GS
R260
0
TPS
Odyss
ey R
S
Trim
ble R
7
TPS
GB-10
00
TPS
GB-10
00+G
RNDP
L
Wei
ghte
d M
ean
SN1 SN2
Figure 3.6.1 – Signal-to-noise ratio weighted means for L1 (blue) and L2 (red). The SOK GSR2600 had the highest weighted mean for L2 (overall SN2), which can be seen in Figure 3.5.4. The Trimble R7 and TPS GB-1000+GRNDPL have a the lowest signal to noise ratio weighted means for L2. Table 3.6.1 - Signal-to-noise ratio weighted means for L1 (SN1) and L2 (SN2).
Receiver Antenna SN1 W.M. Sigma SN2 W.M. Sigma
SOK GSR2600 SOK600 -0.459 0.120 3.833 0.157TPS Odyssey RS TPS PG-A1 Geod 0.537 0.100 -0.103 0.143Trimble R7 TRM 41249 Geod -0.278 0.087 -1.820 0.133TPS GB-1000 TPS PG-A1 Geod 0.514 0.098 -0.446 0.145TPS GB-1000 TPS PG-A1 Geod + GRNDPL -0.304 0.110 -1.630 0.144
27
4.0 Power Consumption 4.1 Average Steady State Power Consumption Power consumption was tested using custom data acquisition hardware and LabView. All receivers were tested with internal batteries removed and/or disconnected. Two tests were run, the first to measure the steady state power consumption and the second to measure the approximate power on and power off voltages. Also noted are the antenna bias voltages from the receiver, the operating range of the receiver and antenna, and the power port configuration. The antenna was mounted on the roof of the UNAVCO, Inc. building and isolated from any ground loops. The DC power cables provided by each manufacturer were connected to mating plugs on the test hardware. Each receiver/antenna combination was tested as a unique and separate entity except for the TPS GB-1000+GRNDPL. The TPS GB-1000+GRNDPL was not independently tested since the addition of a groundplane does not change the power consumption of the receiver. For the first test, sampling was started after 12.5 minutes allowing the receiver to acquire all available satellites and begin performing normal internal operations. Data was sampled at 30Hz for 5 minutes then averaged to get the steady state power consumption. The average value was then calculated for each system by averaging the two unique values obtained for each manufacturer. For the second test, sampling was run continuously as the input voltage was slowly increased through the turn on point then slowly decreased through the turn off point. This was repeated several times to observe repeatability and receiver operation at the turn on/turn off points. Summary: The Trimble R7 and the SOK GSR2600 had the lowest power consumption of the five systems tested, consuming less than 3 Watts while tracking all available satellites. The TPS GB-1000 with and without groundplane had the highest steady state power consumption of 4.7 Watts. All systems tested consumed less than 5 Watts as per the requirements in the RFP. The SOK GSR2600 does not automatically power on after a power failure. The user must depress the power button on the front of the receiver to power the unit on after a power failure. Sokkia has stated that they have a firmware version which will fix this problem, although it was not provided for testing. Please see vendor response for more information. The TPS GB-1000 has a shutoff voltage of 5.7 Volts. However, in order for the receiver to automatically power on when power is restored to the system, the input voltage to the receiver must drop below 2.5 Volts. Once the receiver shuts off, there is no load draining the battery, therefore the battery voltage will not drop to 2.5 Volts and thus the receiver will not automatically power on when power is restored to the system. Please see vendor response for more details. The Trimble R7 and the TPS Odyssey RS both automatically power on when power is restored to the system. Powers on/off voltages are a concern in medium to long term deployments where a battery/solar panel combination is used. Permanent damage to a 12 Volt battery will occur if it is discharged below about 10 Volts. User interaction to power the unit on after a power failure and with drained batteries is difficult when the system is deployed remotely.
28
Average Power Consumption (Watts)
2
2.5
3
3.5
4
4.5
5
0 1 2 3 4 5 6
Test Number
pow
er c
onsu
m. (
Wat
ts)
SOK GSR2600 TPS Odyssey RS Trimble R7 TPS GB-1000 TPS GB-1000+GRNDPL
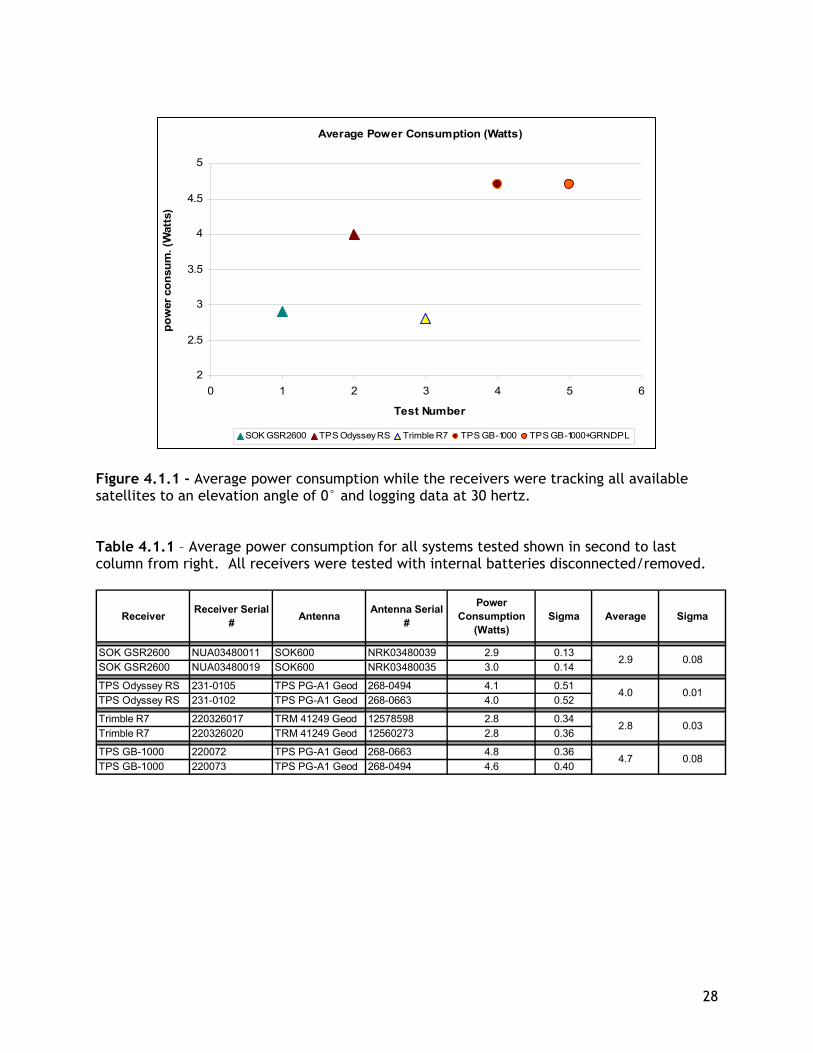
Figure 4.1.1 - Average power consumption while the receivers were tracking all available satellites to an elevation angle of 0° and logging data at 30 hertz. Table 4.1.1 – Average power consumption for all systems tested shown in second to last column from right. All receivers were tested with internal batteries disconnected/removed.
Receiver Receiver Serial # Antenna Antenna Serial
#
Power Consumption
(Watts)Sigma Average Sigma
SOK GSR2600 NUA03480011 SOK600 NRK03480039 2.9 0.13SOK GSR2600 NUA03480019 SOK600 NRK03480035 3.0 0.14
TPS Odyssey RS 231-0105 TPS PG-A1 Geod 268-0494 4.1 0.51TPS Odyssey RS 231-0102 TPS PG-A1 Geod 268-0663 4.0 0.52
Trimble R7 220326017 TRM 41249 Geod 12578598 2.8 0.34Trimble R7 220326020 TRM 41249 Geod 12560273 2.8 0.36
TPS GB-1000 220072 TPS PG-A1 Geod 268-0663 4.8 0.36TPS GB-1000 220073 TPS PG-A1 Geod 268-0494 4.6 0.40
0.084.7
2.9 0.08
0.01
2.8
4.0
0.03
29
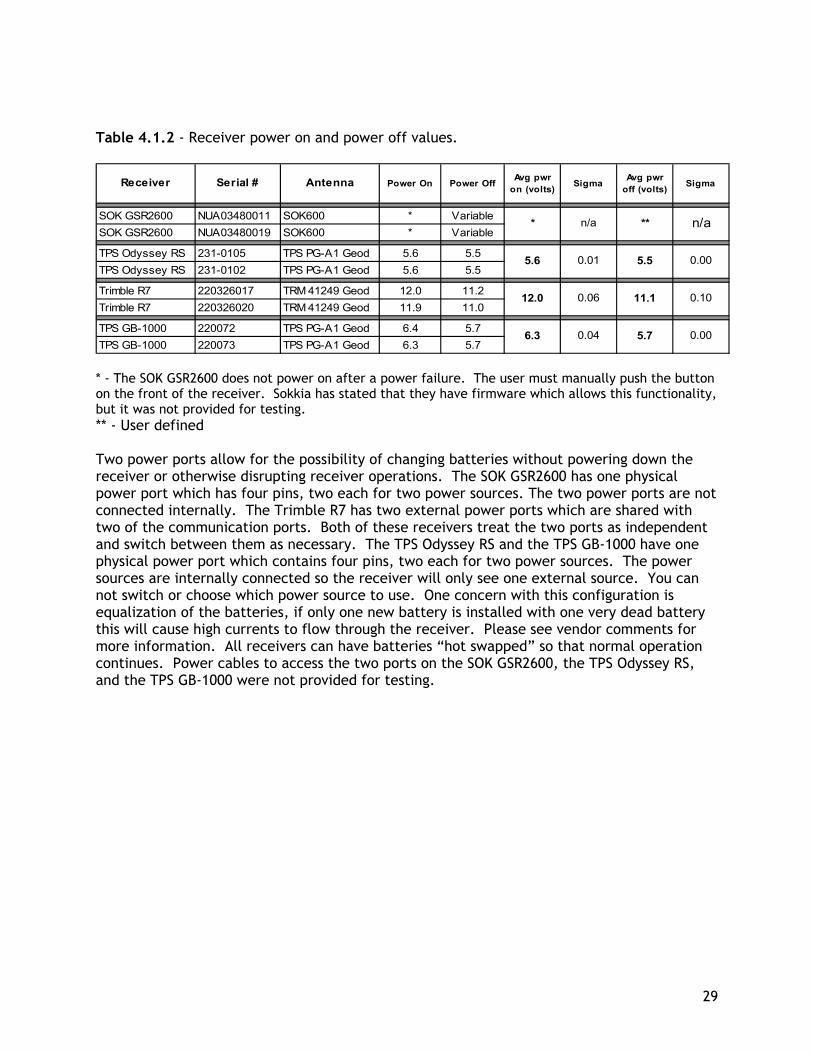
Table 4.1.2 - Receiver power on and power off values.
Receiver Serial # Antenna Power On Power Off Avg pwr on (volts) Sigma Avg pwr
off (volts) Sigma
SOK GSR2600 NUA03480011 SOK600 * VariableSOK GSR2600 NUA03480019 SOK600 * Variable
TPS Odyssey RS 231-0105 TPS PG-A1 Geod 5.6 5.5TPS Odyssey RS 231-0102 TPS PG-A1 Geod 5.6 5.5
Trimble R7 220326017 TRM 41249 Geod 12.0 11.2Trimble R7 220326020 TRM 41249 Geod 11.9 11.0
TPS GB-1000 220072 TPS PG-A1 Geod 6.4 5.7TPS GB-1000 220073 TPS PG-A1 Geod 6.3 5.7
n/a
0.00
0.10
0.00
**
5.5
11.1
5.7
* n/a
5.6 0.01
12.0 0.06
6.3 0.04
* - The SOK GSR2600 does not power on after a power failure. The user must manually push the button on the front of the receiver. Sokkia has stated that they have firmware which allows this functionality, but it was not provided for testing. ** - User defined Two power ports allow for the possibility of changing batteries without powering down the receiver or otherwise disrupting receiver operations. The SOK GSR2600 has one physical power port which has four pins, two each for two power sources. The two power ports are not connected internally. The Trimble R7 has two external power ports which are shared with two of the communication ports. Both of these receivers treat the two ports as independent and switch between them as necessary. The TPS Odyssey RS and the TPS GB-1000 have one physical power port which contains four pins, two each for two power sources. The power sources are internally connected so the receiver will only see one external source. You can not switch or choose which power source to use. One concern with this configuration is equalization of the batteries, if only one new battery is installed with one very dead battery this will cause high currents to flow through the receiver. Please see vendor comments for more information. All receivers can have batteries “hot swapped” so that normal operation continues. Power cables to access the two ports on the SOK GSR2600, the TPS Odyssey RS, and the TPS GB-1000 were not provided for testing.
30
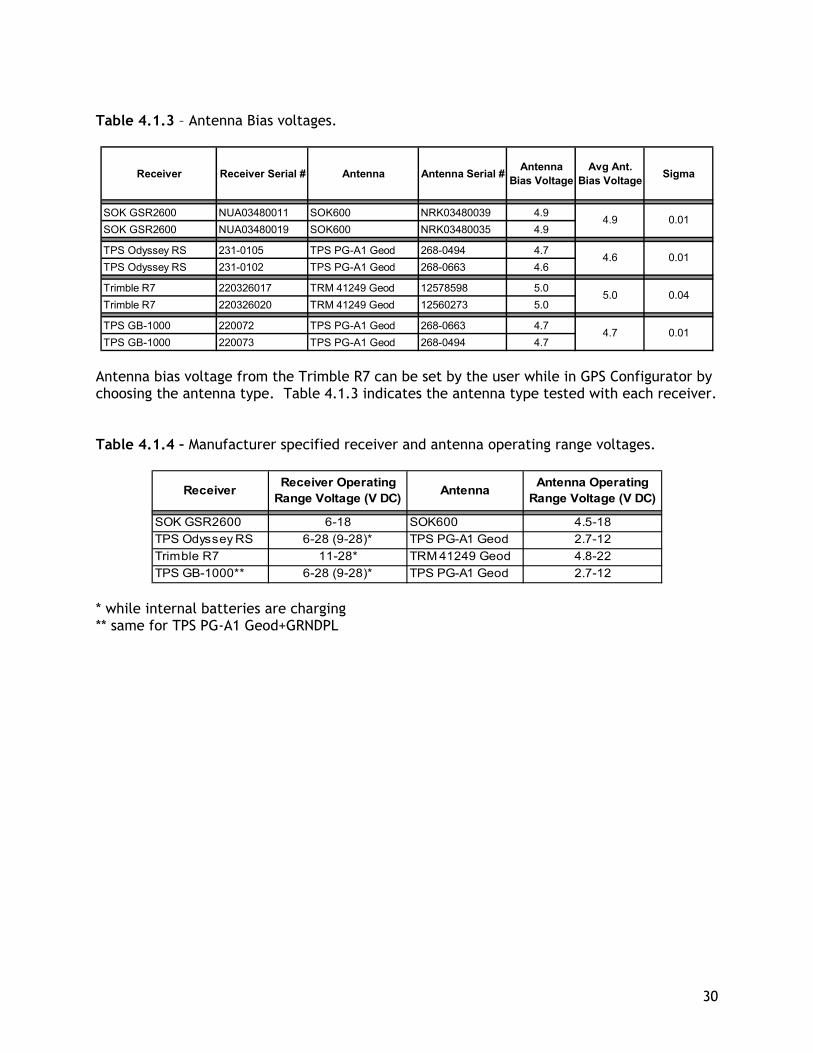
Table 4.1.3 – Antenna Bias voltages.
Receiver Receiver Serial # Antenna Antenna Serial # Antenna Bias Voltage
Avg Ant. Bias Voltage Sigma
SOK GSR2600 NUA03480011 SOK600 NRK03480039 4.9SOK GSR2600 NUA03480019 SOK600 NRK03480035 4.9
TPS Odyssey RS 231-0105 TPS PG-A1 Geod 268-0494 4.7TPS Odyssey RS 231-0102 TPS PG-A1 Geod 268-0663 4.6
Trimble R7 220326017 TRM 41249 Geod 12578598 5.0Trimble R7 220326020 TRM 41249 Geod 12560273 5.0
TPS GB-1000 220072 TPS PG-A1 Geod 268-0663 4.7TPS GB-1000 220073 TPS PG-A1 Geod 268-0494 4.7
4.9 0.01
4.6 0.01
0.045.0
4.7 0.01
Antenna bias voltage from the Trimble R7 can be set by the user while in GPS Configurator by choosing the antenna type. Table 4.1.3 indicates the antenna type tested with each receiver. Table 4.1.4 – Manufacturer specified receiver and antenna operating range voltages.
Receiver Receiver Operating Range Voltage (V DC) Antenna Antenna Operating
Range Voltage (V DC)
SOK GSR2600 6-18 SOK600 4.5-18TPS Odyssey RS 6-28 (9-28)* TPS PG-A1 Geod 2.7-12Trimble R7 11-28* TRM 41249 Geod 4.8-22TPS GB-1000** 6-28 (9-28)* TPS PG-A1 Geod 2.7-12
* while internal batteries are charging ** same for TPS PG-A1 Geod+GRNDPL
31
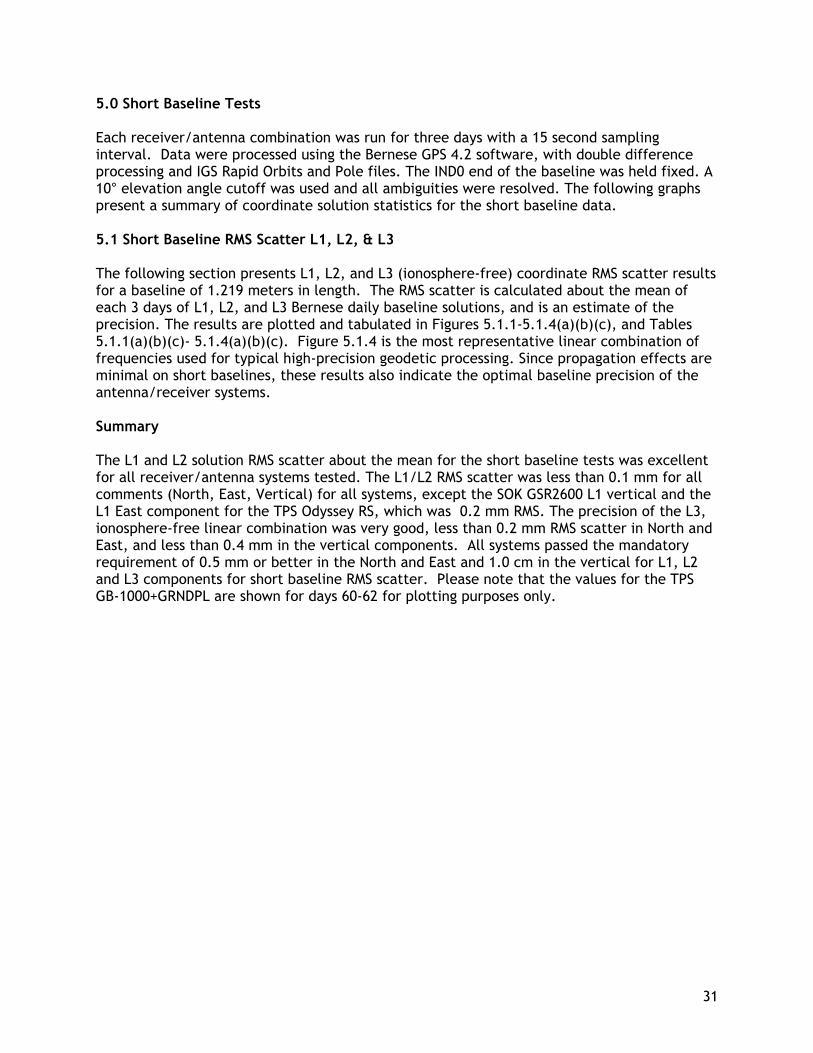
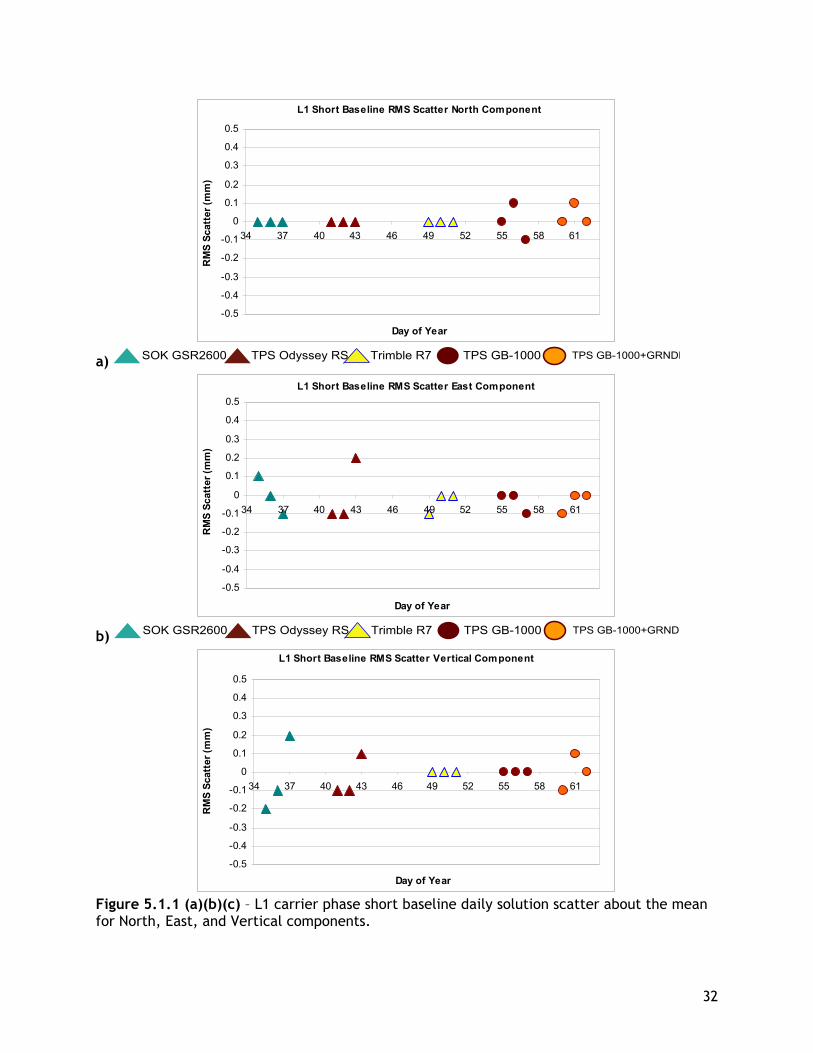
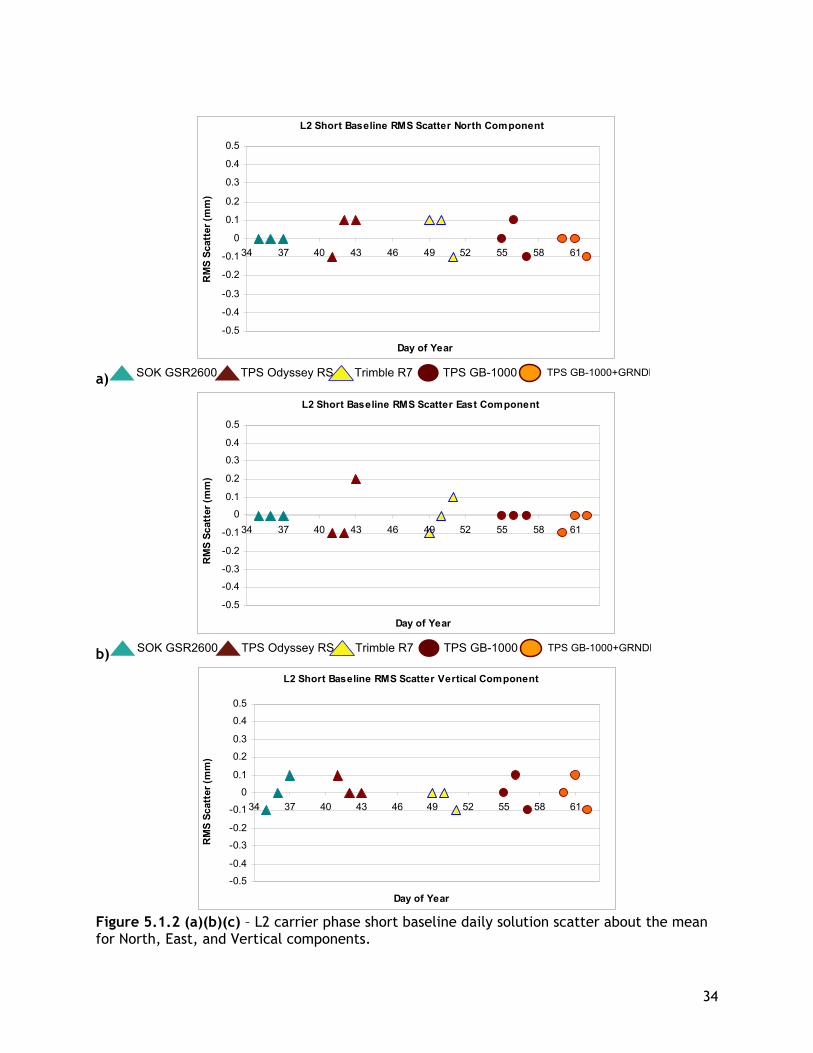
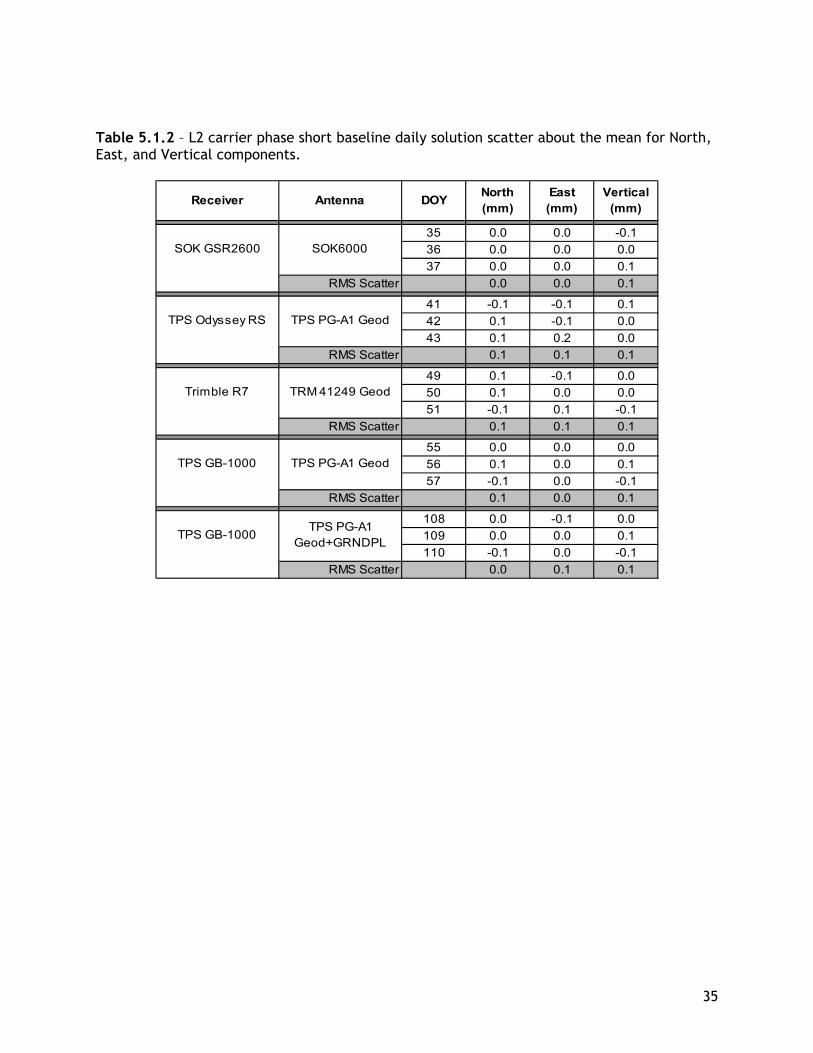
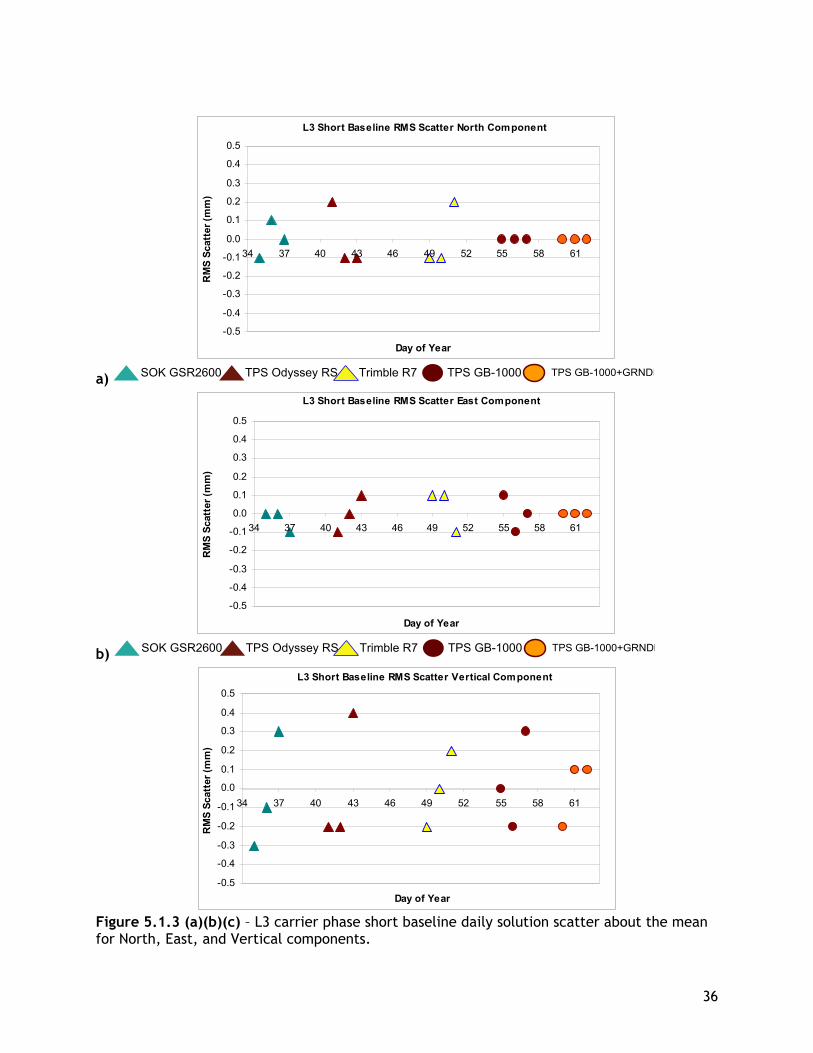
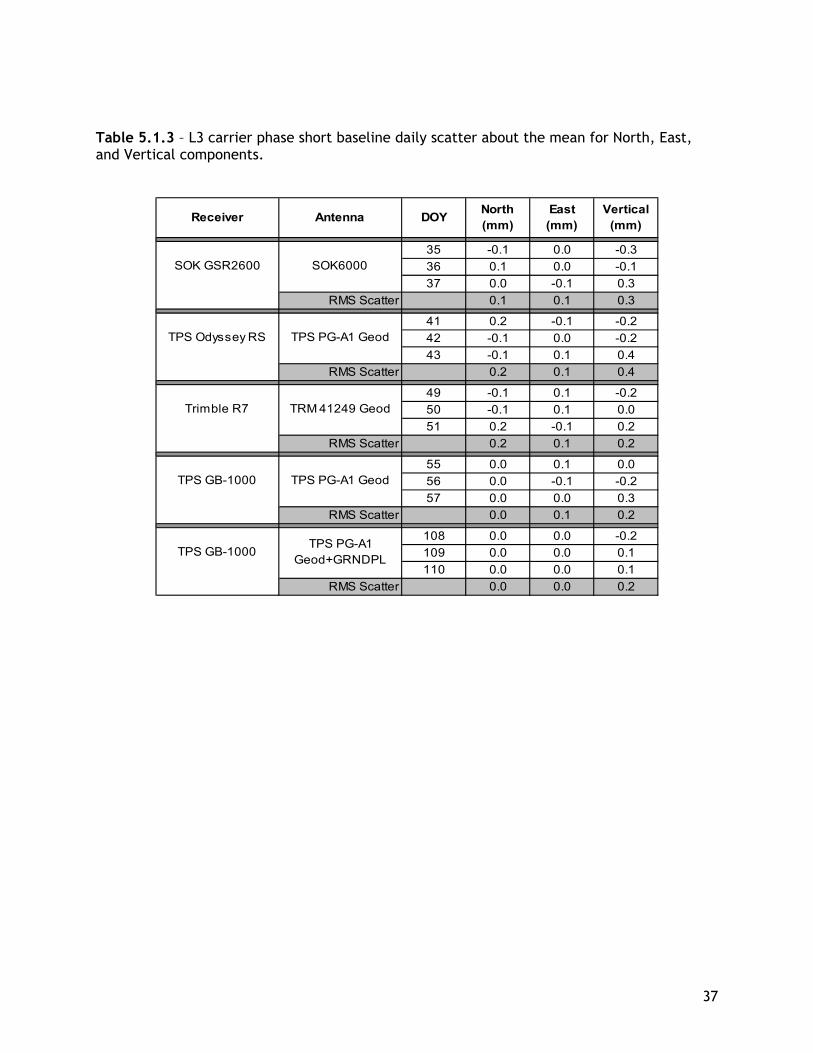
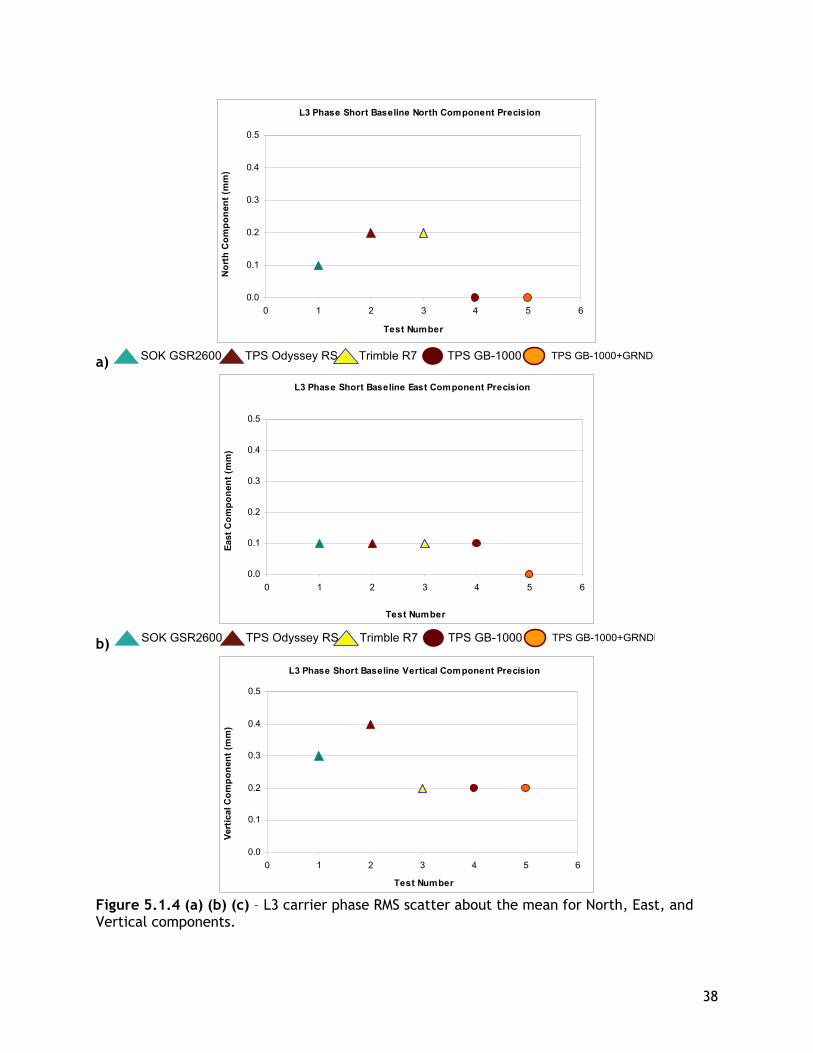
5.0 Short Baseline Tests Each receiver/antenna combination was run for three days with a 15 second sampling interval. Data were processed using the Bernese GPS 4.2 software, with double difference processing and IGS Rapid Orbits and Pole files. The IND0 end of the baseline was held fixed. A 10° elevation angle cutoff was used and all ambiguities were resolved. The following graphs present a summary of coordinate solution statistics for the short baseline data. 5.1 Short Baseline RMS Scatter L1, L2, & L3 The following section presents L1, L2, and L3 (ionosphere-free) coordinate RMS scatter results for a baseline of 1.219 meters in length. The RMS scatter is calculated about the mean of each 3 days of L1, L2, and L3 Bernese daily baseline solutions, and is an estimate of the precision. The results are plotted and tabulated in Figures 5.1.1-5.1.4(a)(b)(c), and Tables 5.1.1(a)(b)(c)- 5.1.4(a)(b)(c). Figure 5.1.4 is the most representative linear combination of frequencies used for typical high-precision geodetic processing. Since propagation effects are minimal on short baselines, these results also indicate the optimal baseline precision of the antenna/receiver systems. Summary The L1 and L2 solution RMS scatter about the mean for the short baseline tests was excellent for all receiver/antenna systems tested. The L1/L2 RMS scatter was less than 0.1 mm for all comments (North, East, Vertical) for all systems, except the SOK GSR2600 L1 vertical and the L1 East component for the TPS Odyssey RS, which was 0.2 mm RMS. The precision of the L3, ionosphere-free linear combination was very good, less than 0.2 mm RMS scatter in North and East, and less than 0.4 mm in the vertical components. All systems passed the mandatory requirement of 0.5 mm or better in the North and East and 1.0 cm in the vertical for L1, L2 and L3 components for short baseline RMS scatter. Please note that the values for the TPS GB-1000+GRNDPL are shown for days 60-62 for plotting purposes only.
32
L1 Short Baseline RMS Scatter North Component
-0.5
-0.4
-0.3
-0.2
-0.1
0
0.1
0.2
0.3
0.4
0.5
34 37 40 43 46 49 52 55 58 61
Day of Year
RM
S Sc
atte
r (m
m)
a) SOK GSR2600 TPS Odyssey RS TPS GB-1000Trimble R7 TPS GB-1000+GRNDP
L1 Short Baseline RMS Scatter East Component
-0.5
-0.4
-0.3
-0.2
-0.1
0
0.1
0.2
0.3
0.4
0.5
34 37 40 43 46 49 52 55 58 61
Day of Year
RM
S Sc
atte
r (m
m)
b) SOK GSR2600 TPS Odyssey RS TPS GB-1000Trimble R7 TPS GB-1000+GRNDP
L1 Short Baseline RMS Scatter Vertical Component
-0.5
-0.4
-0.3
-0.2
-0.1
0
0.1
0.2
0.3
0.4
0.5
34 37 40 43 46 49 52 55 58 61
Day of Year
RM
S Sc
atte
r (m
m)
Figure 5.1.1 (a)(b)(c) – L1 carrier phase short baseline daily solution scatter about the mean for North, East, and Vertical components.
33
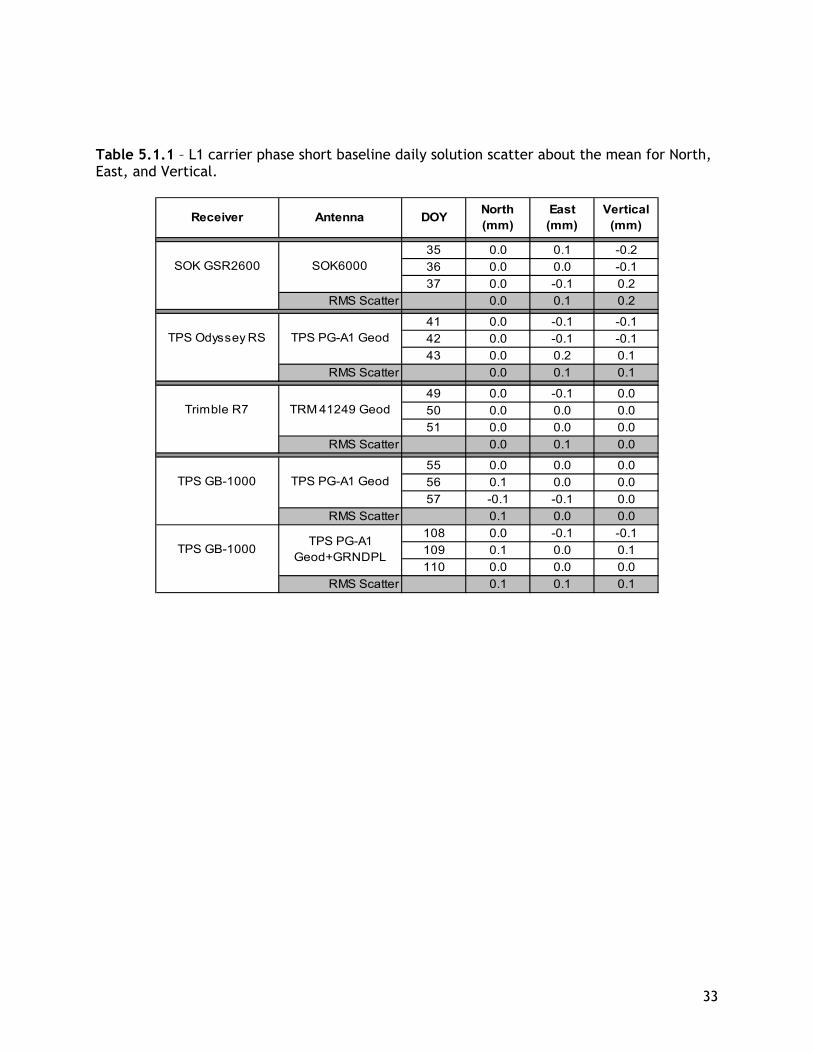
Table 5.1.1 – L1 carrier phase short baseline daily solution scatter about the mean for North, East, and Vertical.
Receiver Antenna DOY North (mm)
East (mm)
Vertical (mm)
35 0.0 0.1 -0.236 0.0 0.0 -0.137 0.0 -0.1 0.2
RMS Scatter 0.0 0.1 0.2
41 0.0 -0.1 -0.142 0.0 -0.1 -0.143 0.0 0.2 0.1
RMS Scatter 0.0 0.1 0.1
49 0.0 -0.1 0.050 0.0 0.0 0.051 0.0 0.0 0.0
RMS Scatter 0.0 0.1 0.0
55 0.0 0.0 0.056 0.1 0.0 0.057 -0.1 -0.1 0.0
RMS Scatter 0.1 0.0 0.0108 0.0 -0.1 -0.1109 0.1 0.0 0.1110 0.0 0.0 0.0
RMS Scatter 0.1 0.1 0.1
TPS GB-1000TPS PG-A1
Geod+GRNDPL
Trimble R7 TRM 41249 Geod
TPS PG-A1 GeodTPS GB-1000
SOK GSR2600
TPS Odyssey RS TPS PG-A1 Geod
SOK6000
34
L2 Short Baseline RMS Scatter North Component
-0.5
-0.4
-0.3
-0.2
-0.1
0
0.1
0.2
0.3
0.4
0.5
34 37 40 43 46 49 52 55 58 61
Day of Year
RM
S Sc
atte
r (m
m)
a) SOK GSR2600 TPS Odyssey RS TPS GB-1000Trimble R7 TPS GB-1000+GRNDP
L2 Short Baseline RMS Scatter East Component
-0.5
-0.4
-0.3
-0.2
-0.1
0
0.1
0.2
0.3
0.4
0.5
34 37 40 43 46 49 52 55 58 61
Day of Year
RM
S Sc
atte
r (m
m)
b) SOK GSR2600 TPS Odyssey RS TPS GB-1000Trimble R7 TPS GB-1000+GRNDP
L2 Short Baseline RMS Scatter Vertical Component
-0.5
-0.4
-0.3
-0.2
-0.1
0
0.1
0.2
0.3
0.4
0.5
34 37 40 43 46 49 52 55 58 61
Day of Year
RM
S Sc
atte
r (m
m)
Figure 5.1.2 (a)(b)(c) – L2 carrier phase short baseline daily solution scatter about the mean for North, East, and Vertical components.
35
Table 5.1.2 – L2 carrier phase short baseline daily solution scatter about the mean for North, East, and Vertical components.
Receiver Antenna DOY North (mm)
East (mm)
Vertical (mm)
35 0.0 0.0 -0.136 0.0 0.0 0.037 0.0 0.0 0.1
RMS Scatter 0.0 0.0 0.1
41 -0.1 -0.1 0.142 0.1 -0.1 0.043 0.1 0.2 0.0
RMS Scatter 0.1 0.1 0.1
49 0.1 -0.1 0.050 0.1 0.0 0.051 -0.1 0.1 -0.1
RMS Scatter 0.1 0.1 0.1
55 0.0 0.0 0.056 0.1 0.0 0.157 -0.1 0.0 -0.1
RMS Scatter 0.1 0.0 0.1
108 0.0 -0.1 0.0109 0.0 0.0 0.1110 -0.1 0.0 -0.1
RMS Scatter 0.0 0.1 0.1
TPS GB-1000TPS PG-A1
Geod+GRNDPL
Trimble R7 TRM 41249 Geod
TPS GB-1000 TPS PG-A1 Geod
SOK GSR2600 SOK6000
TPS Odyssey RS TPS PG-A1 Geod
36
L3 Short Baseline RMS Scatter North Component
-0.5
-0.4
-0.3
-0.2
-0.1
0.0
0.1
0.2
0.3
0.4
0.5
34 37 40 43 46 49 52 55 58 61
Day of Year
RM
S Sc
atte
r (m
m)
a) SOK GSR2600 TPS Odyssey RS TPS GB-1000Trimble R7 TPS GB-1000+GRNDP
L3 Short Baseline RMS Scatter East Component
-0.5
-0.4
-0.3
-0.2
-0.1
0.0
0.1
0.2
0.3
0.4
0.5
34 37 40 43 46 49 52 55 58 61
Day of Year
RM
S Sc
atte
r (m
m)
b) SOK GSR2600 TPS Odyssey RS TPS GB-1000Trimble R7 TPS GB-1000+GRNDP
L3 Short Baseline RMS Scatter Vertical Component
-0.5
-0.4
-0.3
-0.2
-0.1
0.0
0.1
0.2
0.3
0.4
0.5
34 37 40 43 46 49 52 55 58 61
Day of Year
RM
S Sc
atte
r (m
m)
Figure 5.1.3 (a)(b)(c) – L3 carrier phase short baseline daily solution scatter about the mean for North, East, and Vertical components.
37
Table 5.1.3 – L3 carrier phase short baseline daily scatter about the mean for North, East, and Vertical components.
Receiver Antenna DOY North (mm)
East (mm)
Vertical (mm)
35 -0.1 0.0 -0.336 0.1 0.0 -0.137 0.0 -0.1 0.3
RMS Scatter 0.1 0.1 0.3
41 0.2 -0.1 -0.242 -0.1 0.0 -0.243 -0.1 0.1 0.4
RMS Scatter 0.2 0.1 0.4
49 -0.1 0.1 -0.250 -0.1 0.1 0.051 0.2 -0.1 0.2
RMS Scatter 0.2 0.1 0.2
55 0.0 0.1 0.056 0.0 -0.1 -0.257 0.0 0.0 0.3
RMS Scatter 0.0 0.1 0.2
108 0.0 0.0 -0.2109 0.0 0.0 0.1110 0.0 0.0 0.1
RMS Scatter 0.0 0.0 0.2
TPS GB-1000TPS PG-A1
Geod+GRNDPL
SOK GSR2600 SOK6000
TPS Odyssey RS TPS PG-A1 Geod
Trimble R7 TRM 41249 Geod
TPS GB-1000 TPS PG-A1 Geod
38
L3 Phase Short Baseline North Component Precision
0.0
0.1
0.2
0.3
0.4
0.5
0 1 2 3 4 5
Test Number
Nor
th C
ompo
nent
(mm
)
6
a) SOK GSR2600 TPS Odyssey RS TPS GB-1000Trimble R7 TPS GB-1000+GRNDP
L3 Phase Short Baseline East Component Precision
0.0
0.1
0.2
0.3
0.4
0.5
0 1 2 3 4 5
Test Number
East
Com
pone
nt (m
m)
6
b) SOK GSR2600 TPS Odyssey RS TPS GB-1000Trimble R7 TPS GB-1000+GRNDP
L3 Phase Short Baseline Vertical Component Precision
0.0
0.1
0.2
0.3
0.4
0.5
0 1 2 3 4 5
Test Number
Vert
ical
Com
pone
nt (m
m)
6
Figure 5.1.4 (a) (b) (c) – L3 carrier phase RMS scatter about the mean for North, East, and Vertical components.
39
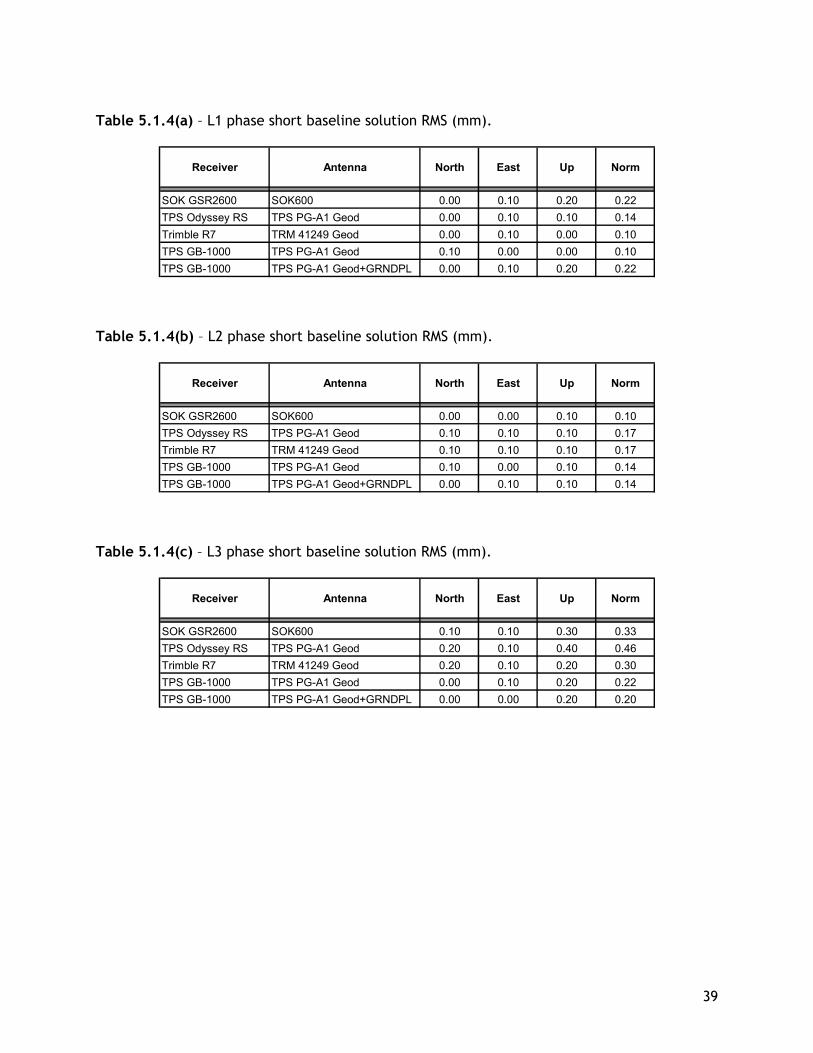
Table 5.1.4(a) – L1 phase short baseline solution RMS (mm).
Receiver Antenna North East Up Norm
SOK GSR2600 SOK600 0.00 0.10 0.20 0.22TPS Odyssey RS TPS PG-A1 Geod 0.00 0.10 0.10 0.14Trimble R7 TRM 41249 Geod 0.00 0.10 0.00 0.10TPS GB-1000 TPS PG-A1 Geod 0.10 0.00 0.00 0.10TPS GB-1000 TPS PG-A1 Geod+GRNDPL 0.00 0.10 0.20 0.22
Table 5.1.4(b) – L2 phase short baseline solution RMS (mm).
Receiver Antenna North East Up Norm
SOK GSR2600 SOK600 0.00 0.00 0.10 0.10TPS Odyssey RS TPS PG-A1 Geod 0.10 0.10 0.10 0.17Trimble R7 TRM 41249 Geod 0.10 0.10 0.10 0.17TPS GB-1000 TPS PG-A1 Geod 0.10 0.00 0.10 0.14TPS GB-1000 TPS PG-A1 Geod+GRNDPL 0.00 0.10 0.10 0.14
Table 5.1.4(c) – L3 phase short baseline solution RMS (mm).
Receiver Antenna North East Up Norm
SOK GSR2600 SOK600 0.10 0.10 0.30 0.33TPS Odyssey RS TPS PG-A1 Geod 0.20 0.10 0.40 0.46Trimble R7 TRM 41249 Geod 0.20 0.10 0.20 0.30TPS GB-1000 TPS PG-A1 Geod 0.00 0.10 0.20 0.22TPS GB-1000 TPS PG-A1 Geod+GRNDPL 0.00 0.00 0.20 0.20
40
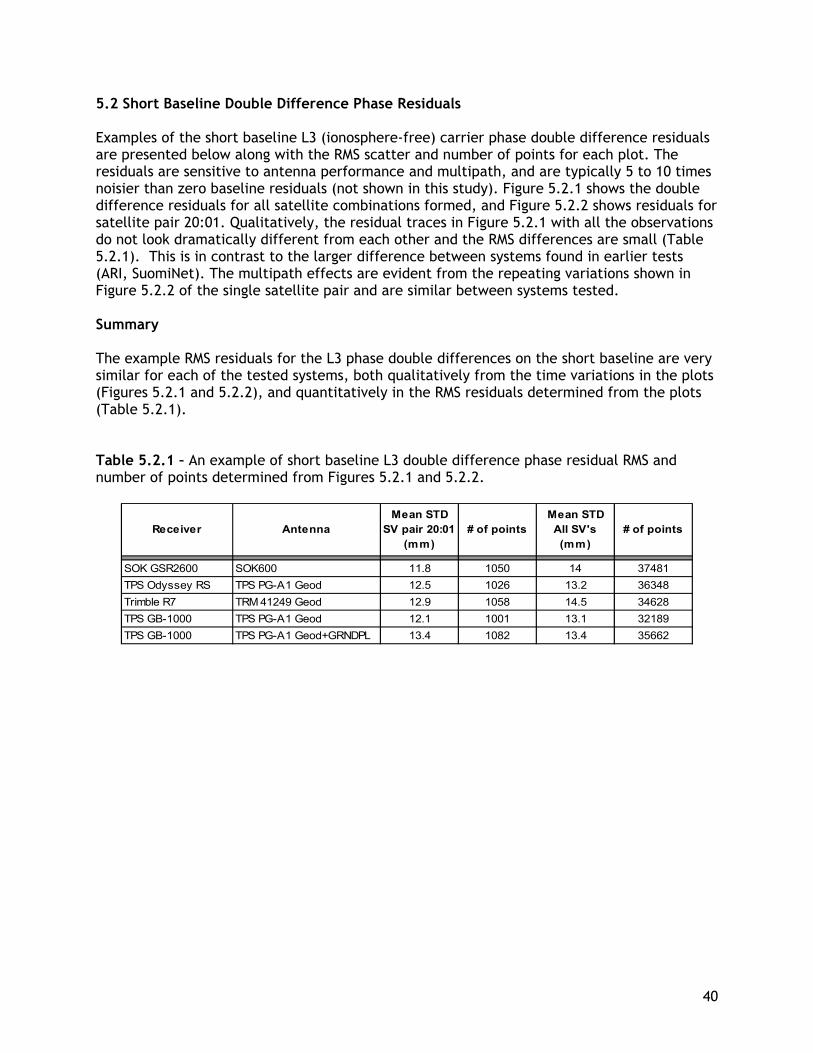
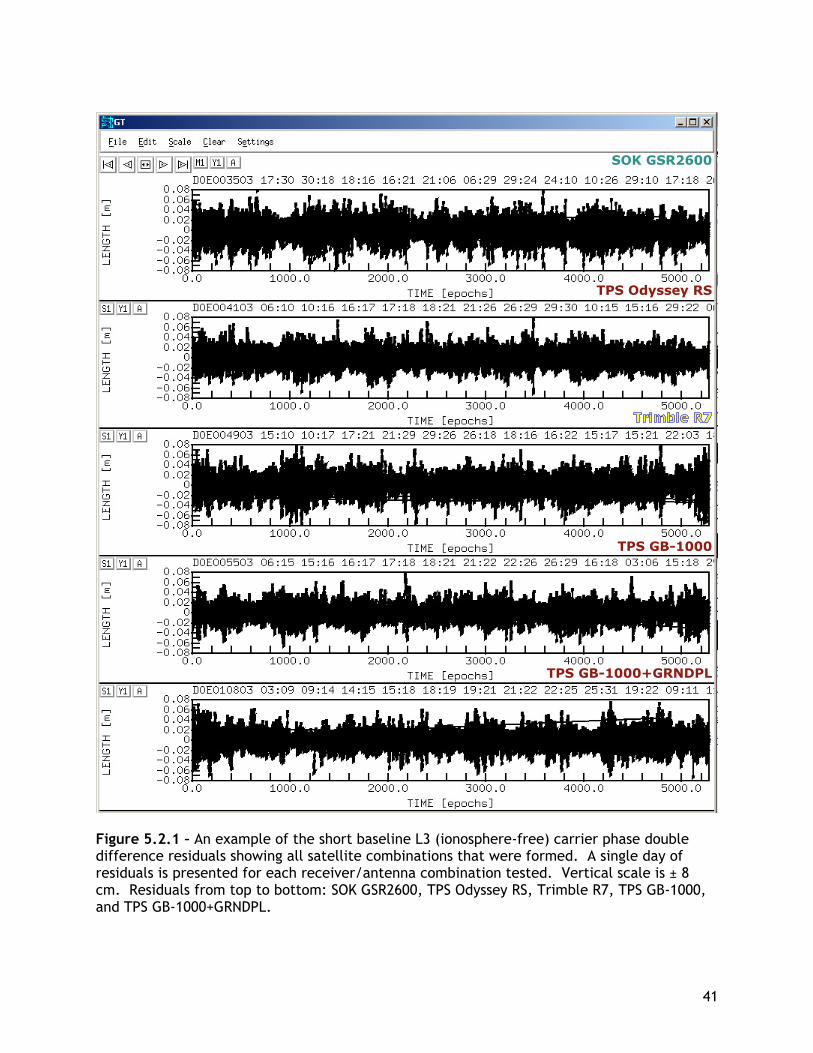
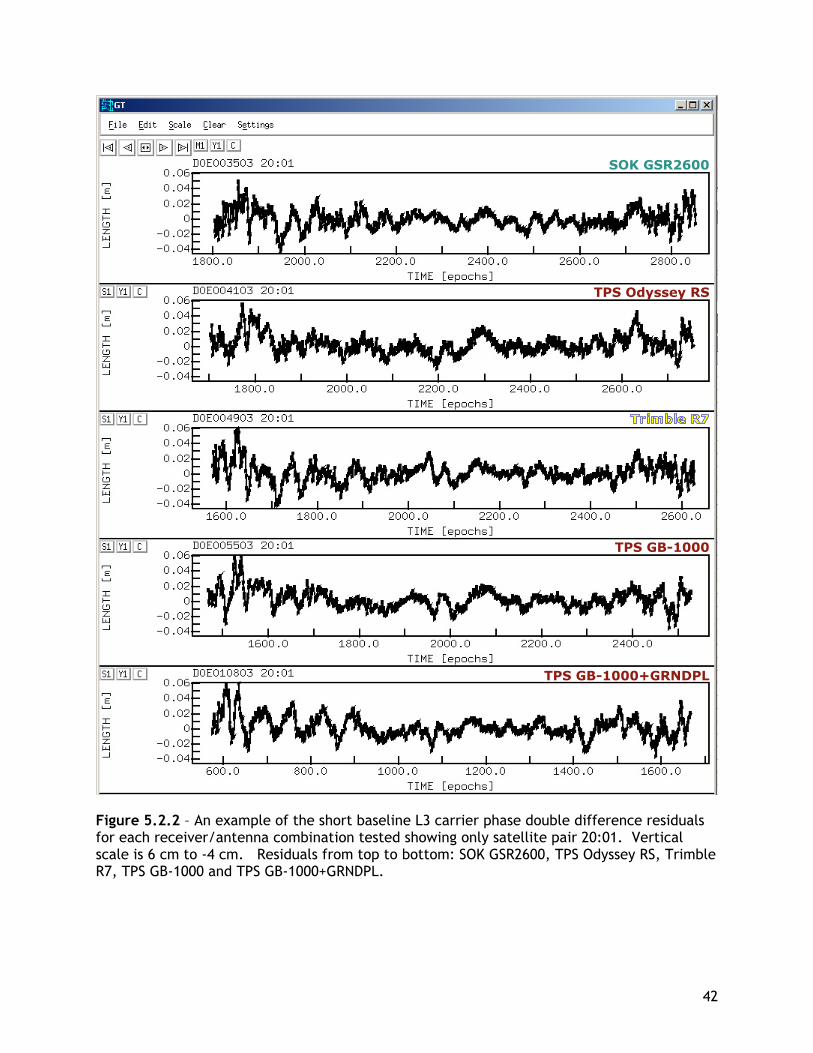
5.2 Short Baseline Double Difference Phase Residuals Examples of the short baseline L3 (ionosphere-free) carrier phase double difference residuals are presented below along with the RMS scatter and number of points for each plot. The residuals are sensitive to antenna performance and multipath, and are typically 5 to 10 times noisier than zero baseline residuals (not shown in this study). Figure 5.2.1 shows the double difference residuals for all satellite combinations formed, and Figure 5.2.2 shows residuals for satellite pair 20:01. Qualitatively, the residual traces in Figure 5.2.1 with all the observations do not look dramatically different from each other and the RMS differences are small (Table 5.2.1). This is in contrast to the larger difference between systems found in earlier tests (ARI, SuomiNet). The multipath effects are evident from the repeating variations shown in Figure 5.2.2 of the single satellite pair and are similar between systems tested. Summary The example RMS residuals for the L3 phase double differences on the short baseline are very similar for each of the tested systems, both qualitatively from the time variations in the plots (Figures 5.2.1 and 5.2.2), and quantitatively in the RMS residuals determined from the plots (Table 5.2.1). Table 5.2.1 – An example of short baseline L3 double difference phase residual RMS and number of points determined from Figures 5.2.1 and 5.2.2.
Receiver AntennaMean STD
SV pair 20:01 (mm)
# of pointsMean STD All SV's (mm)
# of points
SOK GSR2600 SOK600 11.8 1050 14 37481TPS Odyssey RS TPS PG-A1 Geod 12.5 1026 13.2 36348Trimble R7 TRM 41249 Geod 12.9 1058 14.5 34628TPS GB-1000 TPS PG-A1 Geod 12.1 1001 13.1 32189TPS GB-1000 TPS PG-A1 Geod+GRNDPL 13.4 1082 13.4 35662
41
SOK GSR2600
TPS GB-1000
TPS GB-1000+GRNDPL
TPS Odyssey RS
Figure 5.2.1 – An example of the short baseline L3 (ionosphere-free) carrier phase double difference residuals showing all satellite combinations that were formed. A single day of residuals is presented for each receiver/antenna combination tested. Vertical scale is ± 8 cm. Residuals from top to bottom: SOK GSR2600, TPS Odyssey RS, Trimble R7, TPS GB-1000, and TPS GB-1000+GRNDPL.
42
SOK GSR2600
TPS GB-1000
TPS GB-1000+GRNDPL
TPS Odyssey RS
Figure 5.2.2 – An example of the short baseline L3 carrier phase double difference residuals for each receiver/antenna combination tested showing only satellite pair 20:01. Vertical scale is 6 cm to -4 cm. Residuals from top to bottom: SOK GSR2600, TPS Odyssey RS, Trimble R7, TPS GB-1000 and TPS GB-1000+GRNDPL.
43
6.0 Automated GIPSY (AUTOGIPSY) Processing All data files were processed using the Jet Propulsion Laboratory’s (JPL) AUTOGIPSY service available on the Internet (http://milhouse.jpl.nasa.gov/ag/agfaq.html). GIPSY is a substantially different processing package compared to the Bernese package since it is point positioning and Kalman Filter based, whereas Bernese is double difference and least squares based. With GIPSY, cycle-slips are cleaned on a single file basis whereas with Bernese this is done in double difference mode. We used AUTOGIPSY which provides only point positioning without ambiguity resolution. Ambiguity resolution requires full GIPSY processing which was not available for this test. The purpose of this test was to make sure that the files could be processed with GIPSY. We submitted each RINEX file (as logged, tracking down to 0 degrees) from IND0 and INE0 for each of the test days. The returned output solution files were then reviewed. All of the files could be processed successfully. The coordinate solutions from the “.gd” files show a formal error of less than 2 mm North, 4 mm East and 10 mm Vertical, which are within expected AUTOGIPSY uncertainties.
44
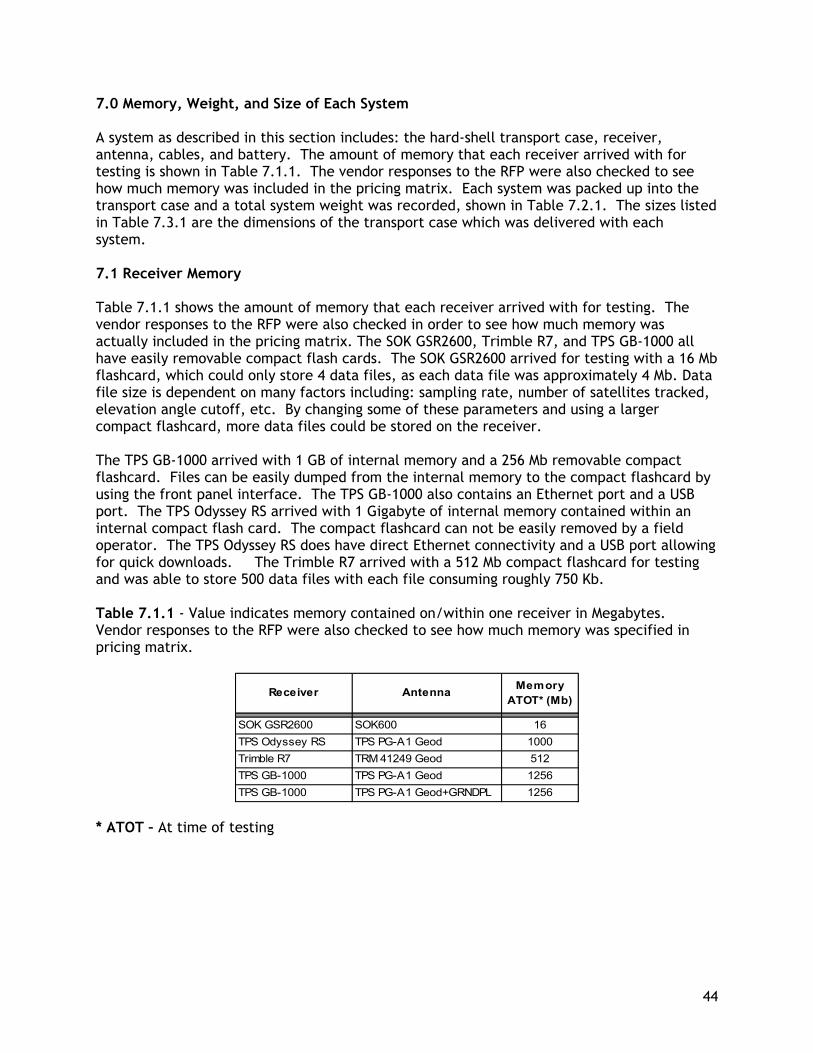
7.0 Memory, Weight, and Size of Each System A system as described in this section includes: the hard-shell transport case, receiver, antenna, cables, and battery. The amount of memory that each receiver arrived with for testing is shown in Table 7.1.1. The vendor responses to the RFP were also checked to see how much memory was included in the pricing matrix. Each system was packed up into the transport case and a total system weight was recorded, shown in Table 7.2.1. The sizes listed in Table 7.3.1 are the dimensions of the transport case which was delivered with each system. 7.1 Receiver Memory Table 7.1.1 shows the amount of memory that each receiver arrived with for testing. The vendor responses to the RFP were also checked in order to see how much memory was actually included in the pricing matrix. The SOK GSR2600, Trimble R7, and TPS GB-1000 all have easily removable compact flash cards. The SOK GSR2600 arrived for testing with a 16 Mb flashcard, which could only store 4 data files, as each data file was approximately 4 Mb. Data file size is dependent on many factors including: sampling rate, number of satellites tracked, elevation angle cutoff, etc. By changing some of these parameters and using a larger compact flashcard, more data files could be stored on the receiver. The TPS GB-1000 arrived with 1 GB of internal memory and a 256 Mb removable compact flashcard. Files can be easily dumped from the internal memory to the compact flashcard by using the front panel interface. The TPS GB-1000 also contains an Ethernet port and a USB port. The TPS Odyssey RS arrived with 1 Gigabyte of internal memory contained within an internal compact flash card. The compact flashcard can not be easily removed by a field operator. The TPS Odyssey RS does have direct Ethernet connectivity and a USB port allowing for quick downloads. The Trimble R7 arrived with a 512 Mb compact flashcard for testing and was able to store 500 data files with each file consuming roughly 750 Kb. Table 7.1.1 - Value indicates memory contained on/within one receiver in Megabytes. Vendor responses to the RFP were also checked to see how much memory was specified in pricing matrix.
Receiver Antenna Memory ATOT* (Mb)
SOK GSR2600 SOK600 16TPS Odyssey RS TPS PG-A1 Geod 1000Trimble R7 TRM 41249 Geod 512TPS GB-1000 TPS PG-A1 Geod 1256TPS GB-1000 TPS PG-A1 Geod+GRNDPL 1256
* ATOT – At time of testing
45
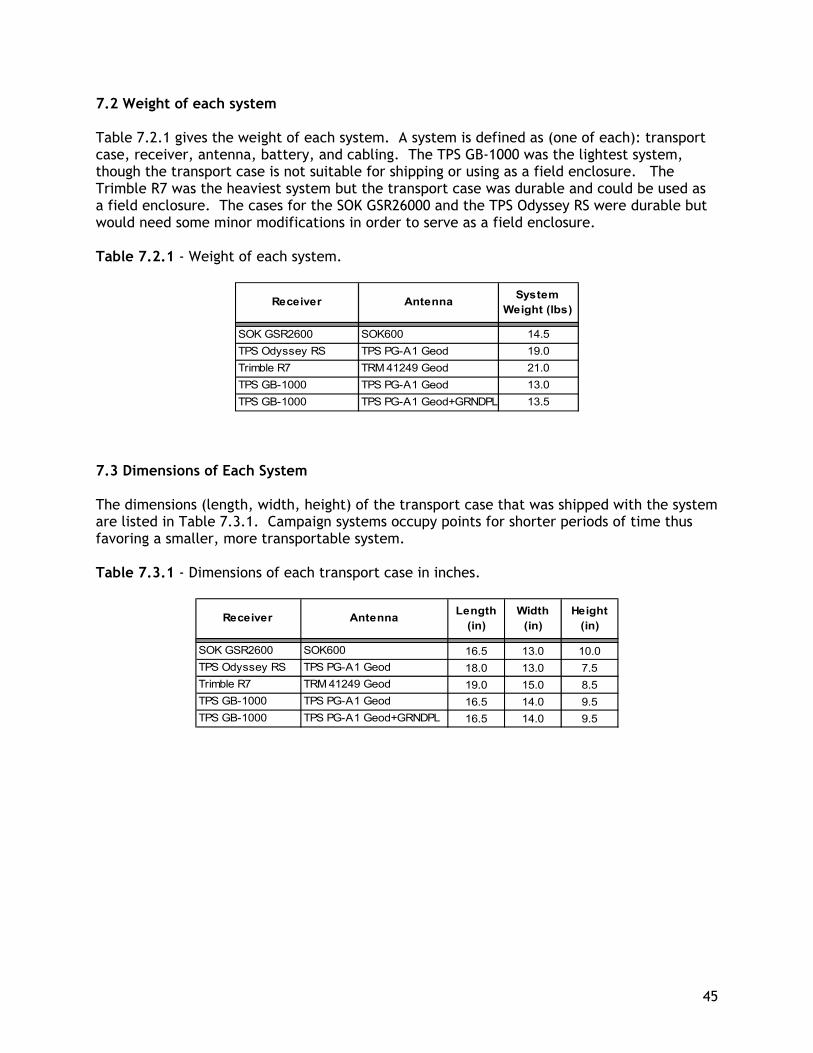
7.2 Weight of each system Table 7.2.1 gives the weight of each system. A system is defined as (one of each): transport case, receiver, antenna, battery, and cabling. The TPS GB-1000 was the lightest system, though the transport case is not suitable for shipping or using as a field enclosure. The Trimble R7 was the heaviest system but the transport case was durable and could be used as a field enclosure. The cases for the SOK GSR26000 and the TPS Odyssey RS were durable but would need some minor modifications in order to serve as a field enclosure. Table 7.2.1 - Weight of each system.
Receiver Antenna System Weight (lbs)
SOK GSR2600 SOK600 14.5TPS Odyssey RS TPS PG-A1 Geod 19.0Trimble R7 TRM 41249 Geod 21.0TPS GB-1000 TPS PG-A1 Geod 13.0TPS GB-1000 TPS PG-A1 Geod+GRNDPL 13.5
7.3 Dimensions of Each System The dimensions (length, width, height) of the transport case that was shipped with the system are listed in Table 7.3.1. Campaign systems occupy points for shorter periods of time thus favoring a smaller, more transportable system. Table 7.3.1 - Dimensions of each transport case in inches.
Receiver Antenna Length (in)
Width (in)
Height (in)
SOK GSR2600 SOK600 16.5 13.0 10.0TPS Odyssey RS TPS PG-A1 Geod 18.0 13.0 7.5Trimble R7 TRM 41249 Geod 19.0 15.0 8.5TPS GB-1000 TPS PG-A1 Geod 16.5 14.0 9.5TPS GB-1000 TPS PG-A1 Geod+GRNDPL 16.5 14.0 9.5
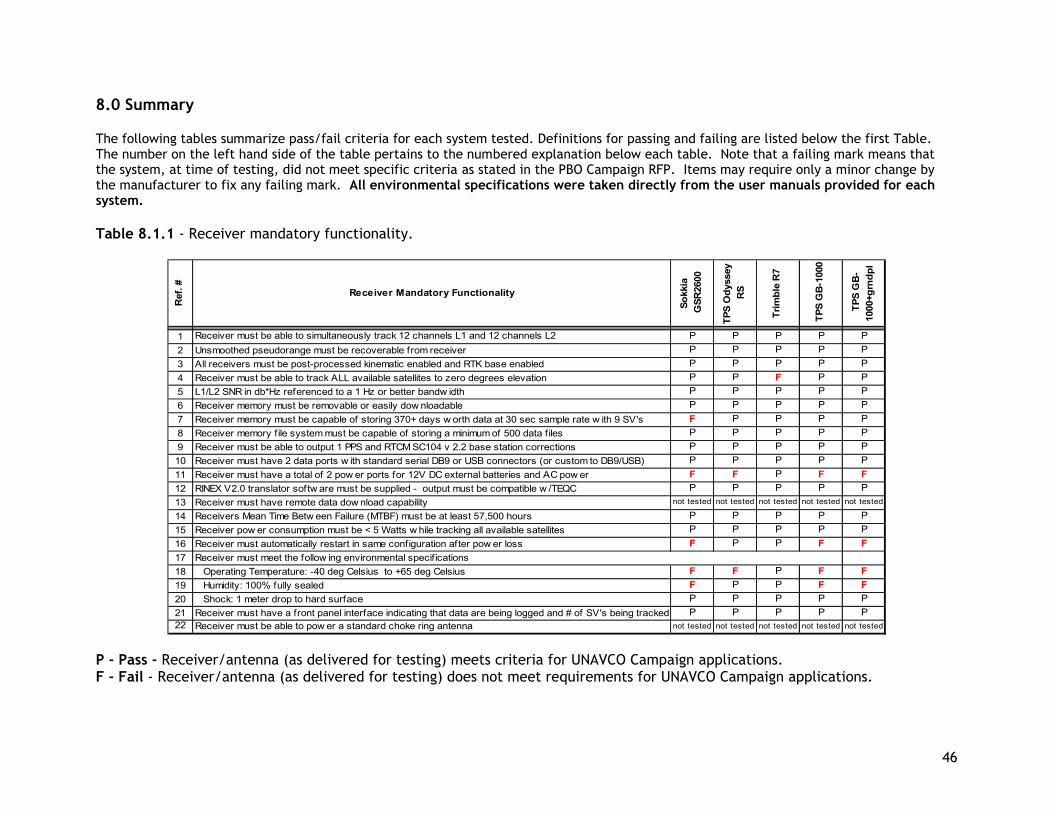
8.0 Summary The following tables summarize pass/fail criteria for each system tested. Definitions for passing and failing are listed below the first Table. The number on the left hand side of the table pertains to the numbered explanation below each table. Note that a failing mark means that the system, at time of testing, did not meet specific criteria as stated in the PBO Campaign RFP. Items may require only a minor change by the manufacturer to fix any failing mark. All environmental specifications were taken directly from the user manuals provided for each system. Table 8.1.1 - Receiver mandatory functionality.
Ref
. # Receiver Mandatory Functionality
Sokk
ia
GSR
2600
TPS
Ody
ssey
R
S
Trim
ble
R7
TPS
GB
-100
0
TPS
GB
-10
00+g
rndp
l
1 Receiver must be able to simultaneously track 12 channels L1 and 12 channels L2 P P P P P2 Unsmoothed pseudorange must be recoverable from receiver P P P P P3 All receivers must be post-processed kinematic enabled and RTK base enabled P P P P P4 Receiver must be able to track ALL available satellites to zero degrees elevation P P P P5 L1/L2 SNR in db*Hz referenced to a 1 Hz or better bandw idth P P P P P6 Receiver memory must be removable or easily dow nloadable P P P P P7 Receiver memory must be capable of storing 370+ days w orth data at 30 sec sample rate w ith 9 SV's P P P P8 Receiver memory f ile system must be capable of storing a minimum of 500 data files P P P P P9 Receiver must be able to output 1 PPS and RTCM SC104 v 2.2 base station corrections P P P P P10 Receiver must have 2 data ports w ith standard serial DB9 or USB connectors (or custom to DB9/USB) P P P P P11 Receiver must have a total of 2 pow er ports for 12V DC external batteries and AC pow er P12 RINEX V2.0 translator softw are must be supplied - output must be compatible w /TEQC13 Receiver must have remote data dow nload capability not tested not tested not tested not tested not tested
14 Receivers Mean Time Betw een Failure (MTBF) must be at least 57,500 hours P P P P P15 Receiver pow er consumption must be < 5 Watts w hile tracking all available satellites P P P P P16 Receiver must automatically restart in same configuration after pow er loss P P17 Receiver must meet the follow ing environmental specifications18 Operating Temperature: -40 deg Celsius to +65 deg Celsius P19 Humidity: 100% fully sealed P P20 Shock: 1 meter drop to hard surface P P21 Receiver must have a front panel interface indicating that data are being logged and # of SV's being tracked P P P P P22 Receiver must be able to pow er a standard choke ring antenna not tested not tested not tested not tested not tested
F
F
F F F FP P P P P
F F F
F F F FF F F
P P P
P - Pass - Receiver/antenna (as delivered for testing) meets criteria for UNAVCO Campaign applications. F - Fail - Receiver/antenna (as delivered for testing) does not meet requirements for UNAVCO Campaign applications.
46
47
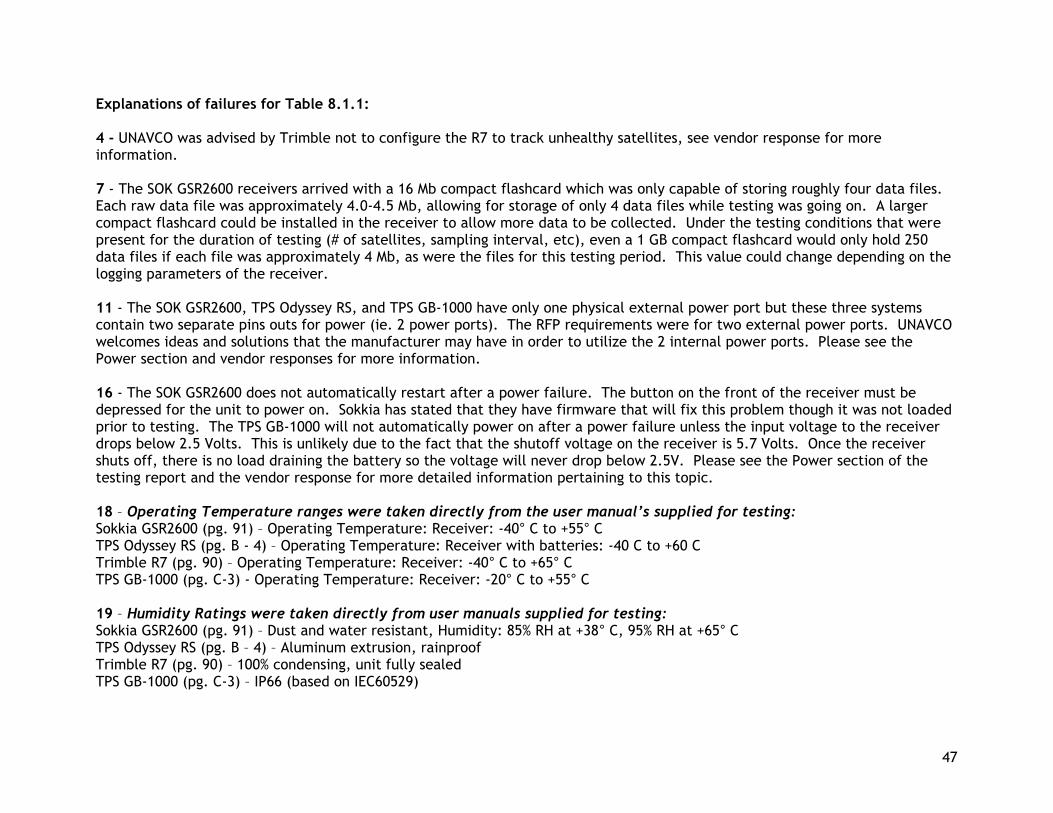
Explanations of failures for Table 8.1.1: 4 - UNAVCO was advised by Trimble not to configure the R7 to track unhealthy satellites, see vendor response for more information. 7 - The SOK GSR2600 receivers arrived with a 16 Mb compact flashcard which was only capable of storing roughly four data files. Each raw data file was approximately 4.0-4.5 Mb, allowing for storage of only 4 data files while testing was going on. A larger compact flashcard could be installed in the receiver to allow more data to be collected. Under the testing conditions that were present for the duration of testing (# of satellites, sampling interval, etc), even a 1 GB compact flashcard would only hold 250 data files if each file was approximately 4 Mb, as were the files for this testing period. This value could change depending on the logging parameters of the receiver. 11 - The SOK GSR2600, TPS Odyssey RS, and TPS GB-1000 have only one physical external power port but these three systems contain two separate pins outs for power (ie. 2 power ports). The RFP requirements were for two external power ports. UNAVCO welcomes ideas and solutions that the manufacturer may have in order to utilize the 2 internal power ports. Please see the Power section and vendor responses for more information. 16 - The SOK GSR2600 does not automatically restart after a power failure. The button on the front of the receiver must be depressed for the unit to power on. Sokkia has stated that they have firmware that will fix this problem though it was not loaded prior to testing. The TPS GB-1000 will not automatically power on after a power failure unless the input voltage to the receiver drops below 2.5 Volts. This is unlikely due to the fact that the shutoff voltage on the receiver is 5.7 Volts. Once the receiver shuts off, there is no load draining the battery so the voltage will never drop below 2.5V. Please see the Power section of the testing report and the vendor response for more detailed information pertaining to this topic. 18 – Operating Temperature ranges were taken directly from the user manual’s supplied for testing: Sokkia GSR2600 (pg. 91) – Operating Temperature: Receiver: -40° C to +55° C TPS Odyssey RS (pg. B - 4) – Operating Temperature: Receiver with batteries: -40 C to +60 C Trimble R7 (pg. 90) – Operating Temperature: Receiver: -40° C to +65° C TPS GB-1000 (pg. C-3) - Operating Temperature: Receiver: -20° C to +55° C 19 – Humidity Ratings were taken directly from user manuals supplied for testing: Sokkia GSR2600 (pg. 91) – Dust and water resistant, Humidity: 85% RH at +38° C, 95% RH at +65° C TPS Odyssey RS (pg. B – 4) – Aluminum extrusion, rainproof Trimble R7 (pg. 90) – 100% condensing, unit fully sealed TPS GB-1000 (pg. C-3) – IP66 (based on IEC60529)
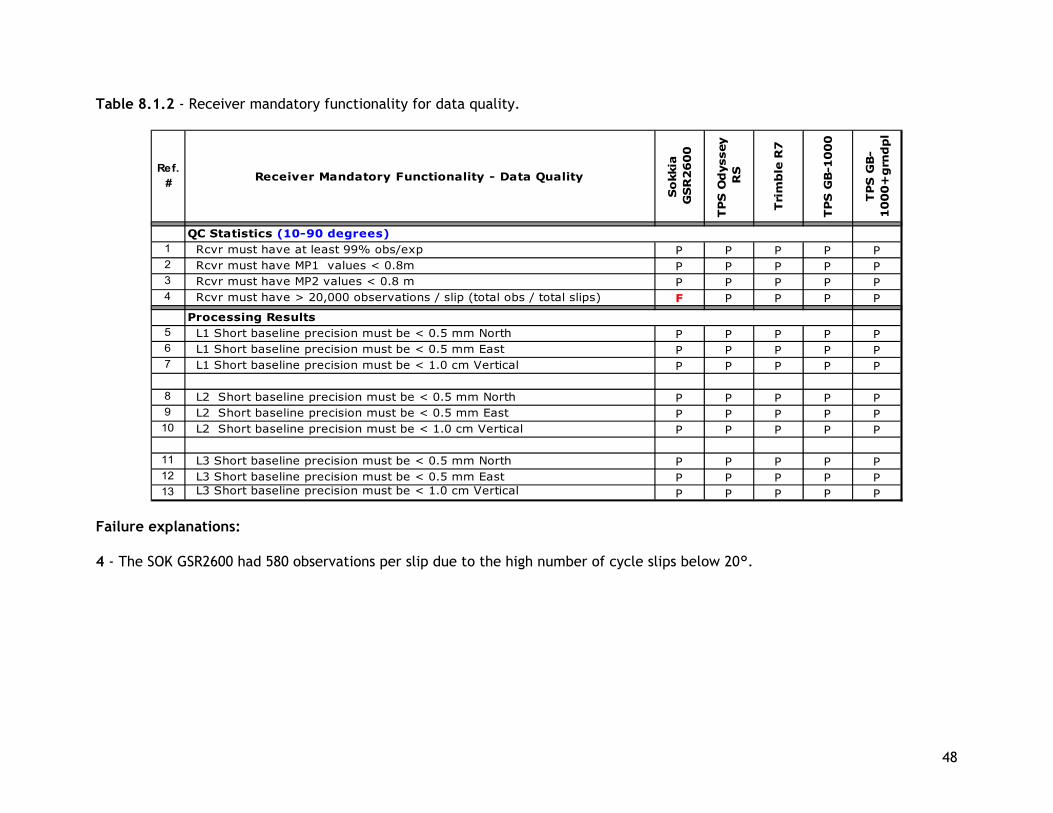
Table 8.1.2 - Receiver mandatory functionality for data quality.
Ref. # Receiver Mandatory Functionality - Data Quality
So
kkia
G
SR
26
00
TP
S O
dyssey
RS
Tri
mb
le R
7
TP
S G
B-1
00
0
TP
S G
B-
10
00
+g
rnd
pl
QC Statistics (10-90 degrees)1 Rcvr must have at least 99% obs/exp P P P P P2 Rcvr must have MP1 values < 0.8m P P P P P3 Rcvr must have MP2 values < 0.8 m P P P P P4 Rcvr must have > 20,000 observations / slip (total obs / total slips) P P P P
Processing Results5 L1 Short baseline precision must be < 0.5 mm North P P P P P6 L1 Short baseline precision must be < 0.5 mm East P P P P P7 L1 Short baseline precision must be < 1.0 cm Vertical P P P P P
8 L2 Short baseline precision must be < 0.5 mm North P P P P P9 L2 Short baseline precision must be < 0.5 mm East P P P P P10 L2 Short baseline precision must be < 1.0 cm Vertical P P P P P
11 L3 Short baseline precision must be < 0.5 mm North P P P P P12 L3 Short baseline precision must be < 0.5 mm East P P P P P13 L3 Short baseline precision must be < 1.0 cm Vertical P P P P P
F
Failure explanations: 4 - The SOK GSR2600 had 580 observations per slip due to the high number of cycle slips below 20°.
48
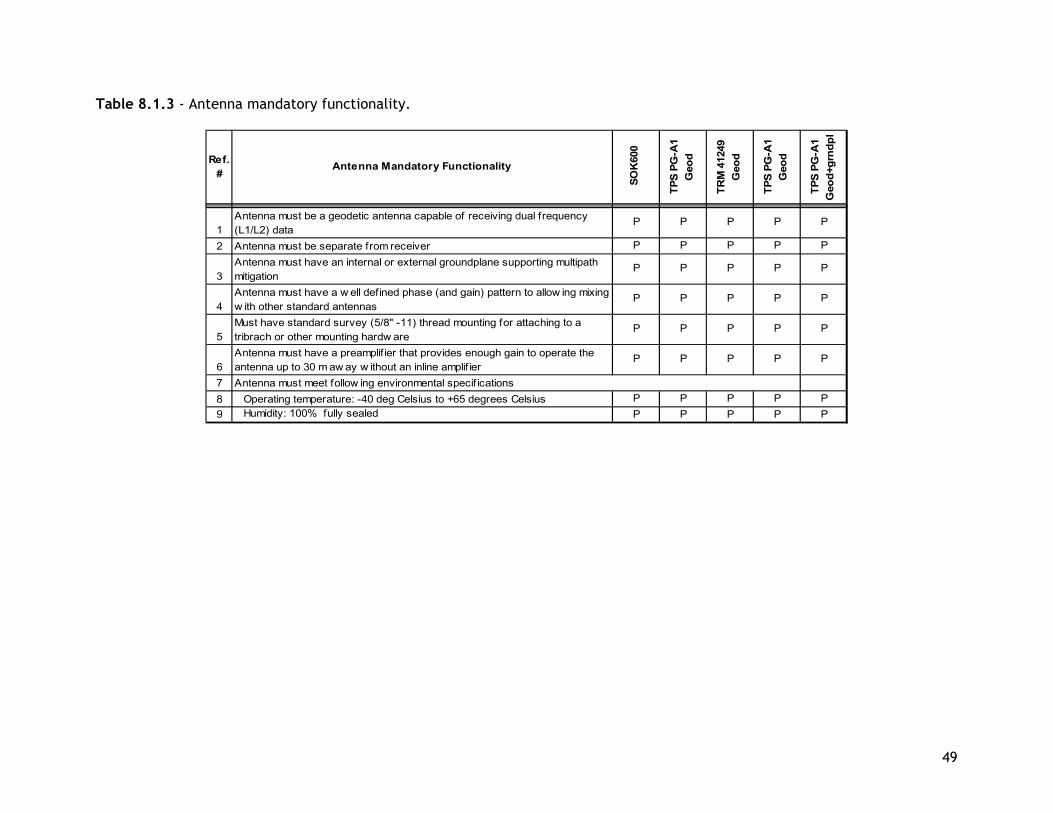
Table 8.1.3 - Antenna mandatory functionality.
Ref. #
Antenna Mandatory Functionality
SOK
600
TPS
PG-A
1 G
eod
TRM
412
49
Geo
d
TPS
PG-A
1 G
eod
TPS
PG-A
1 G
eod+
grnd
pl
1Antenna must be a geodetic antenna capable of receiving dual frequency (L1/L2) data
P P P P P
2 Antenna must be separate from receiver P P P P P
3Antenna must have an internal or external groundplane supporting multipath mitigation
P P P P P
4Antenna must have a w ell defined phase (and gain) pattern to allow ing mixing w ith other standard antennas
P P P P P
5Must have standard survey (5/8" -11) thread mounting for attaching to a tribrach or other mounting hardw are
P P P P P
6Antenna must have a preamplif ier that provides enough gain to operate the antenna up to 30 m aw ay w ithout an inline amplif ier
P P P P P
7 Antenna must meet follow ing environmental specif ications8 Operating temperature: -40 deg Celsius to +65 degrees Celsius P P P P P9 Humidity: 100% fully sealed P P P P P
49
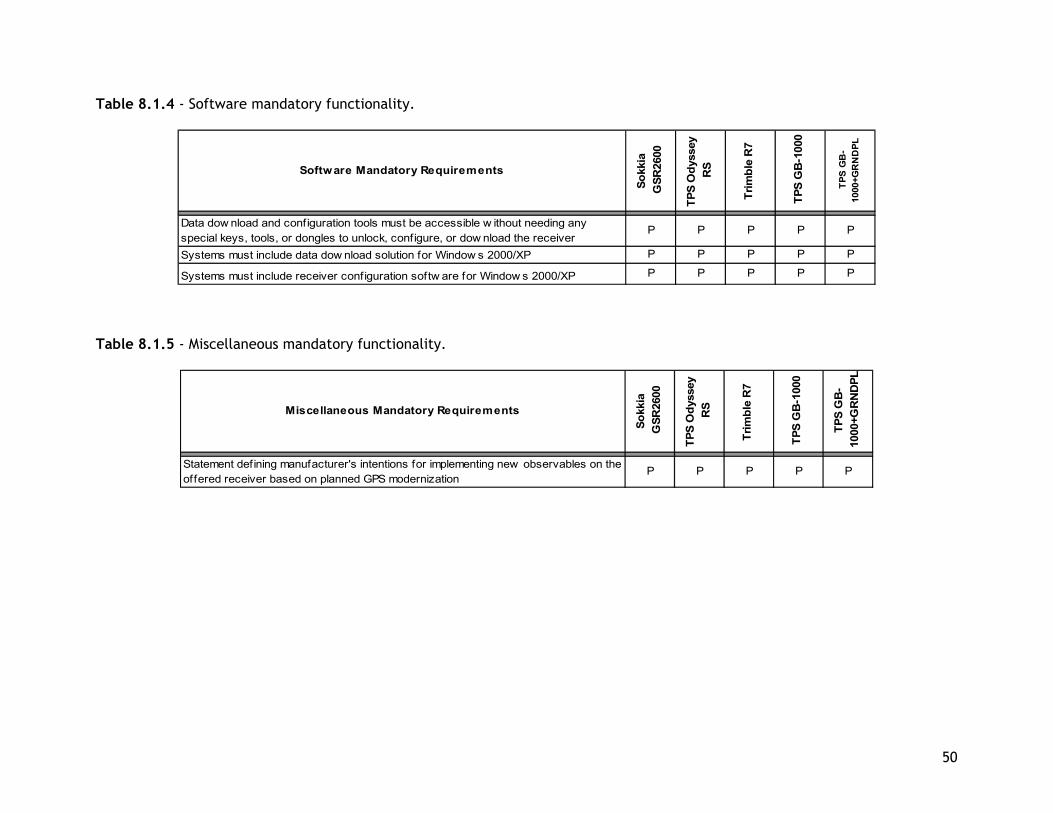
Table 8.1.4 - Software mandatory functionality.
Software Mandatory Requirements
Sokk
ia
GSR
2600
TPS
Ody
ssey
R
S
Trim
ble
R7
TPS
GB
-100
0
TPS
GB
-10
00+G
RN
DPL
Data dow nload and configuration tools must be accessible w ithout needing any special keys, tools, or dongles to unlock, configure, or dow nload the receiver
P P P P P
Systems must include data dow nload solution for Window s 2000/XP P P P P P
Systems must include receiver configuration softw are for Window s 2000/XP P P P P P Table 8.1.5 - Miscellaneous mandatory functionality.
Miscellaneous Mandatory Requirements
Sokk
ia
GSR
2600
TPS
Ody
ssey
R
S
Trim
ble
R7
TPS
GB
-100
0
TPS
GB
-10
00+G
RN
DPL
Statement defining manufacturer's intentions for implementing new observables on the offered receiver based on planned GPS modernization
P P P P P
50
51
9.0 Acknowledgements Funding for receiver specification and testing was made possible through the EAR 0321760 grant to UNAVCO, Inc. from the National Science Foundation (NSF). We wish to thank: Tom Morris, Morgan Smith, Sergey Organov, and Dmitry Kolosov from Topcon Positioning Systems; Brian Frohring and Daniel Wallace from Trimble Navigation Ltd.; and Kirk Burnell, Wil Anderson, and Naush Ladha from Point, Inc. for their assistance during the receiver / antenna testing. 10.0 References Estey, L., Meertens, C., (1999). TEQC: The multipurpose toolkit for GPS/GLONASS data. GPS Solutions Vol. 3, No. 1 pp.44-49. Meertens, C., Andreatta, V., Borenstein, S., Gallaher, W., (October 2003). GPS Receiver and Antenna Testing in Support of the Plate Boundary Observatory (PBO). UNAVCO Report. Jackson, M., Meertens, C., Andreatta, V., VanHove, T., (2000). SuomiNet GPS Receiver and Antenna Testing Report. UNAVCO Report. Rocken, C., Meertens, C., Stephens, B., Braun, J., VanHove, T., Perry, S., Ruud, O., McCallum, M., & Richardson, J., (1995). UNAVCO Academic Research Infrastructure (ARI) Receiver and Antenna Test Report. UNAVCO Boulder Facility Internal Report. Hofmann-Wellenhof B., Lichtenegger, H., and Collins, J. GPS Theory and Practice: Fourth edition. New York. Springer-Verlag Wien,. 1992. PP (93-95:206-216). Topcon Positioning Systems. October, 2002. Odyssey-RS Operator’s Manual. Part number 7010-0511. Topcon Positioning Systems. January 2003. GB-1000 Operator’s Manual. Part number 31-050402-01 Rev A. Point, Inc. June 26, 2002. Sokkia GSR2600 Operations Manual. Part Number 750-1-0093 Rev 1. Trimble Navigation Limited. September 2003. Trimble R7/R8 User’s Guide. Version 1.00 Rev A.
52
11.0 Vendor Responses
11.1 - Point, Inc.
POINT INC.
Point, Inc.’s Response to the UNAVCO Receiver Evaluation in Support of the Plate Boundary
Observatory (PBO)
53
1.0 General POINT, Inc., manufacturers of the Sokkia GSR2600 GPS receiver system would like to thank UNAVCO for the opportunity to take part in the tender for the 2004 GPS Campaign in support of the Plate Boundary Observatory (PBO).
2.0 Response to UNAVCO Report With regards to the GPS system evaluation, there are several items that need to be clarified: 2.1 Receiver Mandatory Functionality (Table 8.1.1) 2.1.1 Item 7 - Receiver Memory For the evaluation, POINT supplied a standard GSR2600 with our standard 16MB Compact Flash card. The GSR2600 supports various capacity CF cards. For the first article delivery we intend to ship a 1 GB CF Card, which suitable for 500 days of logging at a 30 second rate. The CF Card bay on the GSR2600 is user accessible and new cards can easily be installed. 2.1.2 Item 8 – File System This was either not tested or not tested correctly. The supplied 16 MB CF Card is capable of storing many files – pending overall storage. It is quite capable of storing 500 files as it operates on the receiver the same as it does on a PC. 2.1.3 Item 10 – Enable/Disable Multipath Rejection This requirement was not included in the original technical requirements document – we were not aware that it was a requirement. 2.1.4 Item 12 – 2 Power Ports The GSR2600 is capable of input power from 2 separate batteries and is capable of in the field “hot-swapping” while the receiver is powered on and tracking satellites without interruption. When the receiver is running and connected to 2 batteries, each battery is treated as an independent power source. 2.1.5 Item 17 – Restart Configuration After Power Loss The supplied receiver firmware is suited to our typical customers and was not modified to for this functionality. This firmware enables receivers to power-on only when the power button is pressed. Thus, if power is lost, the receiver will only power-on after the power button is pressed. For the first article delivery we intend to provide firmware that will power-on the receiver as soon as adequate voltage is supplied. Thus, if power is lost, the receiver will power-on as soon as adequate voltage is supplied. (Adequate voltage to either of the two power inputs on the power port would work.) This configuration would work appropriately with a solar powered battery array and with one of the lowest power requirements of the receivers tested, the GSR2600 is an ideal candidate for remote applications.
2.1.6 Item 20 - Humidity The GSR2600 meets the requirement of 100% humidity and is fully sealed. The receiver was also tested to the IPX-7 standard that includes submersion under 1 meter of water for 30 minutes.
54
2.2 Receiver Mandatory Functionality – Data Quality (Table 8.1.1)
2.2.1 Cycle Slips The supplied receiver firmware has been optimized for typical survey fieldwork in support of RTK and post-processing applications. It has performed very well and has passed the test of our standard customers, surveyors who perform fieldwork on a day-in and day-out basis. However, the firmware was not modified to suit the very specific testing and evaluation as required by UNAVCO and as such, on the surface, the performance of the receiver firmware did not meet UNAVCO’s criteria. This was somewhat expected and we believe that additional work on our part in tuning the firmware will improve the observations per slip performance that UNAVCO uses as an evaluation criteria.
2.3 Appendix A Issues The appendix has several misrepresentations in it, likely due to product unfamiliarity. To set the record straight:
2.3.1 Compact Flash Door Construction The design of the door was intended so that customers have convenient access to the CF Card and for field-worthiness. The GSR2600 has been in service for over 2 years now with no Compact Flash door failures.
2.3.2 Antenna Height Measurement A customized tape measure is provided to simplify measuring so only one hand is needed. However, a standard construction tape measure can and is frequently used by our customers.
2.3.3 Download Software Com Port Selection This item has been addressed in more recent build of the evaluation software that was provided.
2.3.4 File Logging and Naming Convention The issue of a new file creation at UTC rollover has been addressed in a more recent build of the evaluation software. And as mentioned, session programming is possible to take into account UTC rollover.
2.3.5 AC Power The GSR2600 can be run from an AC power source. However, an AC power adaptor was not included in the test configuration sent to UNAVCO but is available on request.
2.3.6 Field Shipping Case The field shipping case provided is a customized shipping case intended to house all components of a standard system and to be used for transporting the equipment. It includes cutouts for the receiver, antenna, tribrach, tape measure and other various pieces. It was not designed to be used as a field operating case and was not intended to house the specific larger capacity battery shipped as part of the test configuration for UNAVCO.
55
2.4 Miscellaneous
2.4.1 GIPSY Processing We suspect that the cause for the processing issues here are possibly due to some mismatch between the RINEX produced by the evaluation software and the GIPSY software. We’d like the opportunity to provide another set of RINEX files from an updated version of software.
3.0 Summary Once again, POINT would like to thank UNAVCO for the opportunity to take part in the tender for the 2004 GPS Campaign in support of the Plate Boundary Observatory (PBO). Being involved in this exercise has been a worthwhile experience and we look forward to participating in future tenders/evaluations. If there are any follow-up questions, please contact us, as we are more than willing to discuss. A special thanks to the UNAVCO staff in the Boulder office who were involved in the product evaluation including: Victoria Andreatta, Charles Meertens, Jim Greenberg and Warren Gallaher.
Best Regards,
Wil Anderson, President
Kirk Burnell, Application Engineer – Product Specialist
Naush Ladha, Calgary Operations

56
11.2 - Topcon
Topcon Positioning Systems
Response to UNAVCO Campaign Receiver Test Report
57
Topcon Positioning Systems wishes to express our appreciation to UNAVCO for the invitation to participate in the PBO Campaign Receiver evaluation. It is our continued pleasure to work with the staff at UNAVCO. The UNAVCO approach to evaluation campaigns always attempts to be thorough and unbiased. Topcon continues to benefit from participating in such tests. Topcon has provided two receiver systems for evaluation; the Odyssey RS and the new GB1000. Topcon is committed to using the most advanced techniques possible for tracking all available and useful signals. This is reflected in the overall performance of our receivers and their ability to provide not only quality GPS results, but also, with the addition of GLONASS observables, superior GNSS based results as well. The GLONASS constellation now enjoys a long-term commitment from the International Community and is becoming well populated. Recent tests conducted globally in several locations in the United States, Russia, and Munich, Germany have yielded repeatable, precise results where a GPS only solution would have been impossible. Our performance demonstrates Topcon’s commitment to pursue available signals and our experience allowing us to successfully combine this data from different systems. Though the UNAVCO’s present receiver requirements are for GPS only, the Topcon receivers proposed are immediately capable of GPS+ performance (all signals available, specifically GLONASS). This performance is readily available if UNAVCO decides in the future to pursue such benefits. The UNAVCO report indicates how far our community has advanced in such technologies. Topcon appreciates UNAVCO for recognizing the new innovations of our industry and the performance of our product. Topcon would like to address some specific items from the UNAVCO Campaign Receiver test report. Signal Tracking and Receiver Performance:
• The ability to provide quality observations and raw data from Topcon receivers-antennas has been demonstrated in the report. The results demonstrated by the UNAVCO test are specific to GPS. However, Topcon systems enjoy this same performance for all other signals presently available; GLONASS being the primary other than GPS.
Odyssey RS Removable Memory
• The Odyssey RS is capable of 1GB of memory storage. However, as noted in the report, there is no easy access to removing memory cards. This design is inherently more rugged as there are no external openings required to provide access to a removable card. The receiver does come standard with both USB and Ethernet ports, either of which provide for very rapid data download without having to disturb the receiver. In addition, Topcon PDA CE-based software for receiver download is readily available for simplicity in managing receivers and data in the field, via a simple handheld device.
PG-A1 Antenna Height Measurement
• The original design requirements of the PG-A1 antenna were for an easy to use Rover antenna with geodetic qualities. This still pertains but a concern was listed in the
58
report of measuring antenna heights on a traditional tripod set at short setups. This does not appear to be an issue for most standard sets. However, Topcon does provide now, as noted in the UNAVCO report, a variation to this antenna with slightly larger, removable ground-plane. This configuration allows for easy HI measurements. The small, but efficient, ground-plane behaves geodetically with the benefit of being removable for mobile applications but allows for easy HI measurements of any slant measurements regardless of the short tripod setup.
• Pictures, dimensions, and sample antennas/ground-planes have been provided to UNAVCO to confirm HI measurements are no longer an issue. Furthermore, the removable ground-plane provides a tidy ergonomic solution, behaving consistently with industry expected geodetic multi-path mitigation standards.
GB1000 Power Management
• Topcon understands UNAVCO’s power requirements. A remote receiver, even semi-permanent, must automatically power-on again after a power-down event.
• The GB1000 test receivers provided for testing were first line prototypes. The goal was
to provide a receiver with removable memory. These receivers were provided to meet UNAVCO testing deadlines but were not complete in our internal power board functionality testing. We provided these receivers ahead of schedule for UNAVCO’s test. After further review, we acknowledge the incorrect power board configurations for these prototypes. We (Topcon) fully understand the requirement of “power down” and “automatic power-up” behavior. In regards to the GB1000 receiver, Topcon guarantees proper automatic power-up of the receiver in the release version of the GB1000 receiver. We can provide confirmation of this behavior if the Topcon GB1000 is further considered as a final solution for UNAVCO.
GB1000 Transport Case
• The present transport case for the GB1000 is an adaptation of existing Topcon Total
Station cases. The design has proven to work well historically with the sensitive optical equipment Topcon manufactures and ships. However, if there are concerns regarding the case quality of the GB1000, a modified case, as used for the Odyssey RS, will be substituted.
Topcon is most appreciative of the opportunity to participate in the PBO Campaign Receiver bid. We welcome any additional requests for clarification on items in your report, comments by your team, or other participants in the evaluation.
59
11.3 - Trimble
Trimble Navigation Limited 7403 Church Ranch Blvd. Suite #100 Westminster, CO 80021 (720) 887 6100 phone (720) 887 6101 fax
Formal Response to UNAVCO 2004 GPS Campaign System Test Report
For the Plate Boundary Observatory (PBO) Submitted by Trimble Navigation Limited
22 April 2004
60
Trimble would very much like to thank UNAVCO, Inc., for the opportunity to participate in the PBO Campaign System testing and evaluation program. We are pleased to be able to provide additional comments regarding the Trimble R7 receiver which was tested along with the Trimble Zephyr Geodetic antenna. The Trimble R7 incorporates Maxwell 5 technology and design enhancements into the established Trimble 5700 platform. The Trimble 5700 set the standard for combining low power operation with exceptional GPS performance. In addition, the Trimble 5700 has proven reliability in reference station and field system applications worldwide. Building on this base, the Trimble R7 adds Maxwell 5 technology to support L2C tracking along with other enhancements including flexible antenna power to support any survey quality antenna model produced by Trimble. We believe that the enhanced power levels and signal characteristics of L2C will be especially useful in UNAVCO campaign applications. We have verified operation of the Trimble R7, R8 and NetRS receivers with the L2C signal using a GPS simulator. We are also very pleased that the Trimble R7 has been used by the Joint Program Office (JPO) to perform interoperability testing of the Block IIR-M GPS satellite payload prior to launch. By verifying that the signal from the Block IIR-M satellite could be acquired and tracked and that survey quality GPS observables could be logged, we can provide additional assurance of L2C performance when the Block IIR-M space vehicles (SVs) are launched. The Zephyr Geodetic antenna has been designed and manufactured to meet the most demanding GPS environments. This antenna incorporates patented Stealth multipath reduction technology and our multi-point feed antenna element in a lightweight sealed enclosure. We believe the Trimble Zephyr Geodetic GPS antenna fits the UNAVCO campaign needs extremely well. As mentioned in the test report, Trimble did not recommend enabling the "ignore health" mode for the purposes of this test campaign. Although the Trimble R7 supports the use of data from SVs that are flagged as unhealthy for position estimation, this mode has not been fully qualified for GPS observables logging. The addition of a mode to support the logging of GPS observables from unhealthy SVs while not using those observables in position estimation is a straightforward firmware revision that will be provided with the BINEX logging firmware release. As can be seen from the test report, the Trimble R7 meets or exceeds all other functional and performance requirements. The receiver provides full support for the specified turn-on and turnoff voltages for proper support of operation with 12V lead acid battery based power supplies in campaign or reference station applications. In addition to the stated requirements, the Trimble R7 system supports dual file logging, local or remote configuration using Windows or Unix/Linux based software, and support for remote firmware update. Data can be transferred to a PC via the Compact Flash card or via serial or USB. The Trimble T01 internal file format offers an alternative with a 60% greater storage capacity than the standard BINEX format.

61
Further, with the addition of appropriate accessories, the Trimble R7 can be used as a high performance RTK rover, making the Trimble R7 a flexible choice to meet the varying needs of UNAVCO, Inc., campaign projects. We again thank UNAVCO, Inc., for the opportunity to participate in this test effort. We are very pleased to offer the Trimble R7 receiver and Zephyr Geodetic antenna, as this system has been developed to support geodetic accuracy in a wide range of fixed station and field applications. We are committed to the continued support of scientific applications and will make every necessary effort to ensure the success of the PBO project. If you have any questions, please do not hesitate to contact either of us at any time. It would be a pleasure to be a partner of UNAVCO, Inc., in support of PBO campaign system operations. Kind regards, Brian Frohring Daniel Wallace Trimble Navigation Limited
62
Appendix A – User observations of Campaign Systems Tested Systems were operated in field settings and the testing lab by a number of UNAVCO engineers. The observations below are based on their comments. Sokkia GSR2600 with SOK600 Geodetic antenna The SOK GSR2600 has an extruded powder coated aluminum housing which is resistant to dust and water. It can handle 85% relative humidity at 38° C, and 95% relative humidity at 65° C. The door protecting the compact flash is made of plastic and seems flimsy. The receiver arrived for testing with a 16 Mb compact flashcard, enabling storage of four data files which does not meet the RFP requirement. The GSR2600 does not automatically power on after a power failure. The user must depress the button on the front of the receiver to power it on. Sokkia has stated that they have firmware which solves this problem, but it was not supplied for testing. Multipath mitigation can not be configured because it is embedded in the hardware of the receiver. The antenna height can not be measured with a standard height stick when the antenna is setup on a tripod with a standard UNAVCO tribrach (Leica tribrach with Sokkia rotating optical plummet). The height is measured with a special measuring tape which was not provided for testing. Some users had problems getting the receiver to communicate with the software through the USB to serial adapter. The DL4 software does not recognize anything above COM2. Newer computers do not come with a standard DB9 serial port; a USB to serial adapter must be used. These devices get assigned numbers greater than 2 (COM3, COM4, COM5). There is no direct USB download capability on the receiver. The compact flashcard can be removed and placed in a PC card reader in order to download the data. Once a logging session was started, the receiver continued to log to the same data file, and did not create a new file at UTC rollover. The SOK GSR2600 does not have internal batteries. The unit can be powered directly by an AC power source but one was not provided for testing. The unit has one physical power port which contains 2 sets of pin outs for a total of two ports. These two power ports are not internally connected. The hard-shell transport case is durable but would need modifications to the foam inserts to accommodate the receiver while connected to the battery and antenna. The box would also require a cable port for the antenna cable. The only obvious cutout in the box was for the antenna. It was not obvious where the other pieces of equipment should go. Topcon Odyssey RS with PG-A1 Geodetic Antenna The Topcon Odyssey RS has an extruded aluminum housing and is fully sealed. The receiver is shock and vibration resistant. The receiver arrived for testing with 1 GB of onboard memory installed. The memory card and internal batteries can not be easily removed by an operator in the field. The Odyssey RS has 3 serial ports, a USB port, and an Ethernet port. Dongles are used to access these ports, and are included with each system. The receiver has two LED’s on the front, one indicating that data is being recorded to the internal memory, and the other indicating number of satellites being tracked.
63
The antenna connector is on the opposite side of the receiver housing. This makes the unit difficult to transport in a backpack when cables are attached and will place undue stress on the cables. The antenna height could not be measured with a standard height stick when the antenna is setup on a tripod with a standard UNAVCO tribrach (Leica tribrach with Sokkia rotating optical plummet). The small diameter of the antenna made it impossible to measure directly from a point on the ground to the reference mark on the antenna. Topcon has stated that they have a fixed height tripod to use with the antenna, and recently developed an attachable groundplane. The attachable groundplane was provided to UNAVCO in order to verify that the antenna height could be measured, the results have been included in this testing report. The software provided was intuitive and easy to use. There is a GUI interface in PC-CDU, or a user can choose manual mode in which individual GRIL commands are sent. A configuration file can also be uploaded to the receiver in manual mode using PC-CDU. Data logging can also be commenced by depressing the function button on the front of the receiver (MINTER mode). The hard-shell transport case provided for testing is durable, but would require modifications to the foam inserts in order to accommodate the cables coming out of both ends of the receiver. The box would also require a cable port for the antenna cable to pass through while the case is shut. The Odyssey RS has one external power port, and one internal power port that supports the internal batteries. The power ports are connected internally and there is no way to tell the receiver which one to use. The batteries (and memory) can not be easily removed by an operator in the field. Trimble R7 with Zephyr Geodetic Antenna (TRM 41249 Geod) The Trimble R7 has a cast aluminum housing and is fully sealed. The unit is submersible to one meter for 30 minutes. The unit is shock and vibration resistant. The access doors to the compact flash and batteries are metal and seal with a mechanical click. Each receiver arrived for testing with 512 Mb of memory. Communication with the receiver is accomplished using Trimble propriety software using a GUI interface or command line syntax. A configuration file can also be uploaded to the receiver, and data logging can also be commenced by depressing the button on the front of the receiver. The software provided was intuitive and easy to use. The antenna height was obtained using a standard height stick while the antenna was situated on a UNAVCO tribrach and standard tripod. The storage box requires little modification to be used as a field enclosure. The box already has cable cutouts and can be latched and completely closed while the receiver is inside and connected to the antenna.
64
Topcon GB-1000 with TPS PG-A1 Geodetic Antenna The Topcon GB-1000 has an injection molded plastic housing and is shock and vibration resistant. The receivers arrived with 1 gigabyte of internal memory and a 256 megabyte removable compact flashcard. The receiver has a front panel interface which has eight operating keys, and a cursor key used for selecting parameters and navigating menus. The GB-1000 has a serial port, a USB port, and an Ethernet port. The ports are protected by rubber dustcovers that do not seem to be securely attached. If the unit were dropped, the battery door has the potential to break off. It was noted that the voltage for the TPS GB-1000 must drop below 2.25-2.5 Volts in order for the unit to automatically power on after a power failure. If the input voltage fails to fall below this level the receiver will not auto power on. The antenna height could not be measured with a standard height stick when the antenna is setup on a tripod with a standard UNAVCO tribrach (Leica tribrach with Sokkia rotating optical plummet). The small diameter of the antenna made it impossible to measure directly from a point on the ground to the reference mark on the antenna. Topcon has stated that they have a fixed height tripod to use with the antenna, and recently developed an attachable groundplane. The attachable groundplane allows the antenna height to be measured and the data has been included in this testing report. The software provided was intuitive and easy to use. There is a GUI interface in PC-CDU, or a user can choose manual mode in which individual GRIL commands are sent. A configuration file can also be uploaded to the receiver in manual mode using PC-CDU. Data logging can also be commenced by depressing the function button on the front of the receiver (MINTER mode). The hard-shell transport case shipped with the receiver can fit a survey controller and tribrach, but is not durable enough for shipping or for use as a field enclosure. The overall quality of the box is poor. The quality and design of the clips that keep the box closed are not adequate for UNAVCO campaign applications.
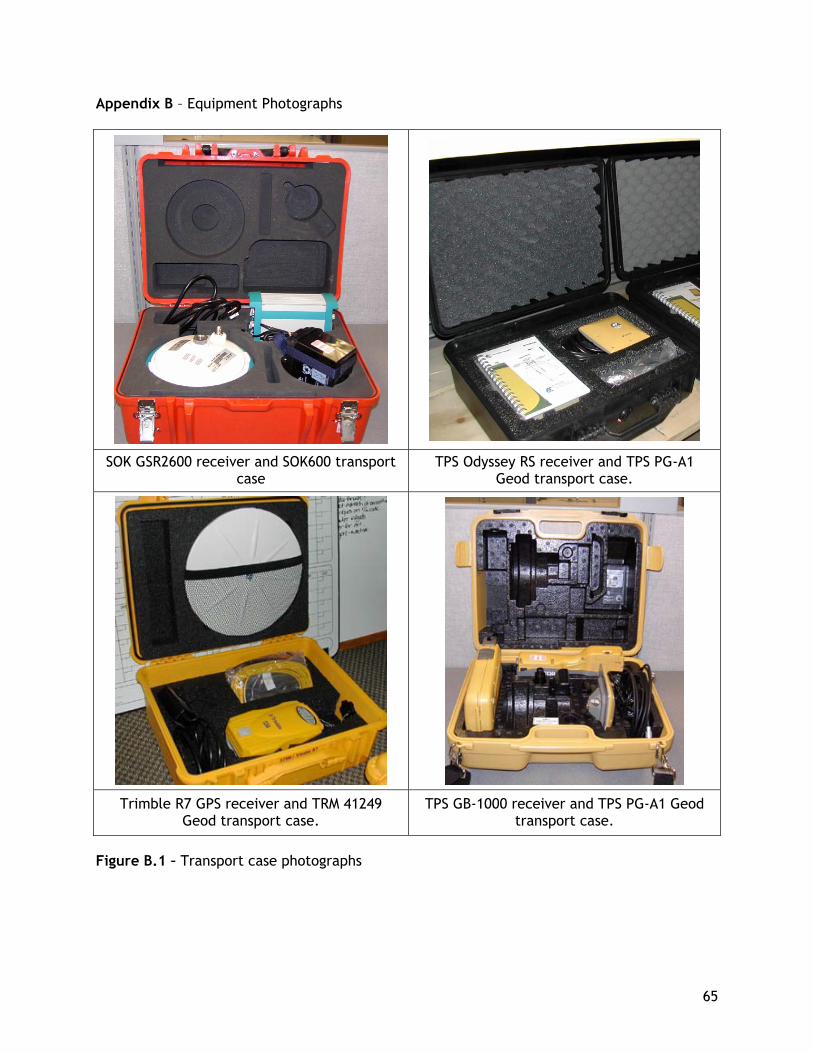
65
Appendix B – Equipment Photographs
SOK GSR2600 receiver and SOK600 transport case
TPS Odyssey RS receiver and TPS PG-A1 Geod transport case.
Trimble R7 GPS receiver and TRM 41249 Geod transport case.
TPS GB-1000 receiver and TPS PG-A1 Geod transport case.
Figure B.1 – Transport case photographs
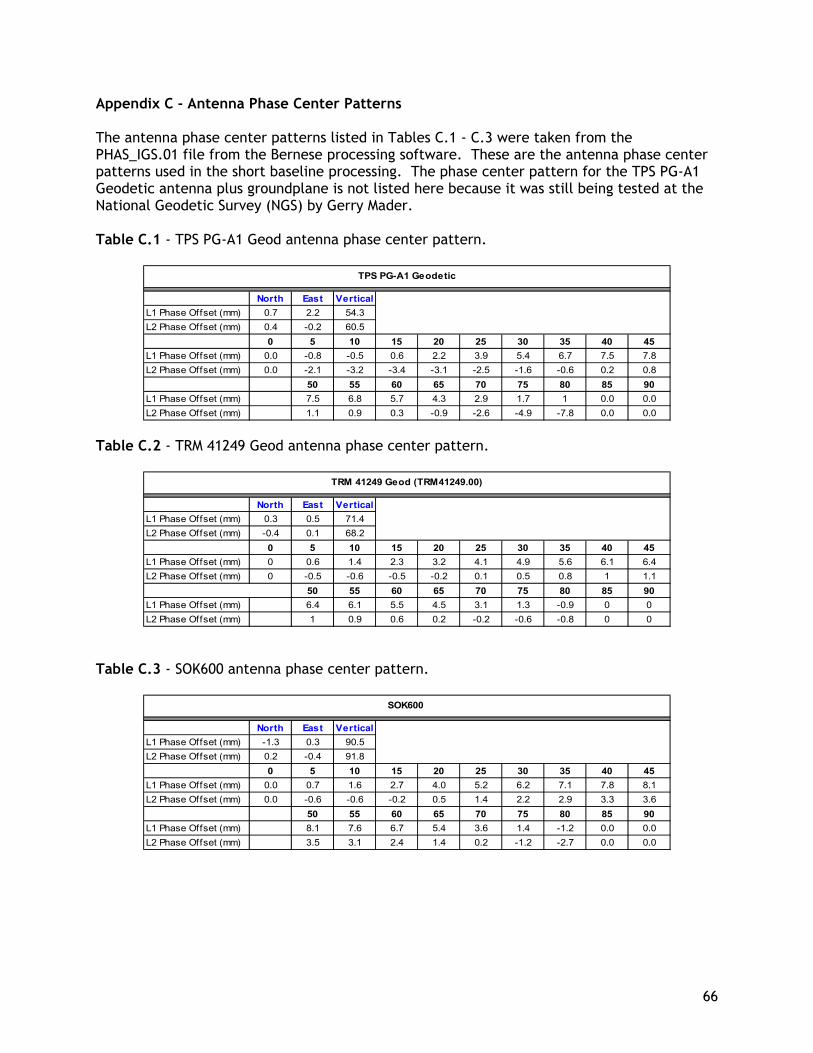
66
Appendix C - Antenna Phase Center Patterns The antenna phase center patterns listed in Tables C.1 - C.3 were taken from the PHAS_IGS.01 file from the Bernese processing software. These are the antenna phase center patterns used in the short baseline processing. The phase center pattern for the TPS PG-A1 Geodetic antenna plus groundplane is not listed here because it was still being tested at the National Geodetic Survey (NGS) by Gerry Mader. Table C.1 - TPS PG-A1 Geod antenna phase center pattern.
North East VerticalL1 Phase Offset (mm) 0.7 2.2 54.3L2 Phase Offset (mm) 0.4 -0.2 60.5
0 5 10 15 20 25 30 35 40 45L1 Phase Offset (mm) 0.0 -0.8 -0.5 0.6 2.2 3.9 5.4 6.7 7.5 7.8L2 Phase Offset (mm) 0.0 -2.1 -3.2 -3.4 -3.1 -2.5 -1.6 -0.6 0.2 0.8
50 55 60 65 70 75 80 85 90L1 Phase Offset (mm) 7.5 6.8 5.7 4.3 2.9 1.7 1 0.0 0.0L2 Phase Offset (mm) 1.1 0.9 0.3 -0.9 -2.6 -4.9 -7.8 0.0 0.0
TPS PG-A1 Geodetic
Table C.2 - TRM 41249 Geod antenna phase center pattern.
North East VerticalL1 Phase Offset (mm) 0.3 0.5 71.4L2 Phase Offset (mm) -0.4 0.1 68.2
0 5 10 15 20 25 30 35 40 45L1 Phase Offset (mm) 0 0.6 1.4 2.3 3.2 4.1 4.9 5.6 6.1 6.4L2 Phase Offset (mm) 0 -0.5 -0.6 -0.5 -0.2 0.1 0.5 0.8 1 1.1
50 55 60 65 70 75 80 85 90L1 Phase Offset (mm) 6.4 6.1 5.5 4.5 3.1 1.3 -0.9 0 0L2 Phase Offset (mm) 1 0.9 0.6 0.2 -0.2 -0.6 -0.8 0 0
TRM 41249 Geod (TRM41249.00)
Table C.3 - SOK600 antenna phase center pattern.
North East VerticalL1 Phase Offset (mm) -1.3 0.3 90.5L2 Phase Offset (mm) 0.2 -0.4 91.8
0 5 10 15 20 25 30 35 40 45L1 Phase Offset (mm) 0.0 0.7 1.6 2.7 4.0 5.2 6.2 7.1 7.8 8.1L2 Phase Offset (mm) 0.0 -0.6 -0.6 -0.2 0.5 1.4 2.2 2.9 3.3 3.6
50 55 60 65 70 75 80 85 90L1 Phase Offset (mm) 8.1 7.6 6.7 5.4 3.6 1.4 -1.2 0.0 0.0L2 Phase Offset (mm) 3.5 3.1 2.4 1.4 0.2 -1.2 -2.7 0.0 0.0
SOK600