UNAUDITED RESULTS FOR THE SIX MONTHS ENDED 30 JUNE …
61
UNAUDITED RESULTS FOR THE SIX MONTHS ENDED 30 JUNE 2021 Highlights Post-IFRS 16 (1) Basis For the six months ended 30 June 2021 EUR million For the six months ended 30 June 2020 EUR million Reported currency change Total Revenue (2) 4,901 5,021 -2% Total EBITDA (2) 3,095 2,193 +41% Total EBIT (2) 1,669 934 +79% Profit attributable to ordinary shareholders 1,774 803 +121% Pre-IFRS 16 (1) Basis For the six months ended 30 June 2021 EUR million For the six months ended 30 June 2020 EUR million Local currenies change Reported currency change Total Revenue (2) 4,901 5,021 -2% -2% Total EBITDA (2) 2,645 1,753 +51% +51% Total EBIT (2) 1,616 913 +77% +77% Profit attributable to ordinary shareholders 1,777 834 +113% +113% Note 1: The Group believes that the precedent lease accounting standard International Accounting Standard 17 “Leases” (“IAS 17”) basis (“Pre-IFRS 16 basis”) metrics, which are not intended to be a substitute for, or superior to, the reported metrics on a International Financial Reporting Standard 16 “Leases” basis (“Post-IFRS16 basis”), better reflect management’s view of the Group’s underlying operational performance. IAS 17 basis metrics financial information is regularly reviewed by management and used for resource allocation, performance assessment and internal decision-making. As a result, the Group has provided an alternative presentation of the Group’s EBITDA, EBIT and profit attributable to ordinary shareholders prepared under the Pre- IFRS 16 basis relating to the accounting for leases for the six months ended 30 June 2020 and 2021. Unless otherwise specified, the discussion of the Group’s operating results in this results announcement is on a Pre-IFRS 16 basis as mentioned above. Note 2: Total revenue, EBITDA and EBIT include the Group’s proportionate share of joint ventures’ respective items. CKHGT 2021 Interim Results Operations Review Page 1 of 61
Transcript of UNAUDITED RESULTS FOR THE SIX MONTHS ENDED 30 JUNE …

UNAUDITED RESULTS FOR THE SIX MONTHS ENDED 30 JUNE 2021
Highlights
Post-IFRS 16 (1) BasisFor the six months
ended 30 June 2021EUR million
For the six months ended 30 June 2020
EUR millionReported currency
change
Total Revenue (2) 4,901 5,021 -2%Total EBITDA (2) 3,095 2,193 +41%Total EBIT (2) 1,669 934 +79%Profit attributable to ordinary shareholders 1,774 803 +121%
Pre-IFRS 16 (1) BasisFor the six months
ended 30 June 2021EUR million
For the six months ended 30 June 2020
EUR millionLocal currenies
changeReported currency
change
Total Revenue (2) 4,901 5,021 -2% -2%Total EBITDA (2) 2,645 1,753 +51% +51%Total EBIT (2) 1,616 913 +77% +77%
Profit attributable to ordinary shareholders 1,777 834 +113% +113%
Note 1: The Group believes that the precedent lease accounting standard International Accounting Standard 17 “Leases” (“IAS 17”) basis (“Pre-IFRS 16 basis”) metrics, which are not intended to be a substitute for, or superior to, the reported metrics on a International Financial Reporting Standard 16 “Leases” basis (“Post-IFRS16 basis”), better reflect management’s view of the Group’s underlying operational performance. IAS 17 basis metrics financial information is regularly reviewed by management and used for resource allocation, performance assessment and internal decision-making. As a result, the Group has provided an alternative presentation of the Group’s EBITDA, EBIT and profit attributable to ordinary shareholders prepared under the Pre-IFRS 16 basis relating to the accounting for leases for the six months ended 30 June 2020 and 2021. Unless otherwise specified, the discussion of the Group’s operating results in this results announcement is on a Pre-IFRS 16 basis as mentioned above.
Note 2: Total revenue, EBITDA and EBIT include the Group’s proportionate share of joint ventures’ respective items.
CKHGT 2021 Interim Results Operations Review
Page 1 of 61

Management Discussion and Analysis
CK Hutchison Group Telecom
In million30 June 2021
EUR30 June 2020
EUR ChangeLocal currencies
change
Total Revenue 4,901 5,021 -2% -2% Total Margin 3,424 3,586 -5% -5%
Total CACs (869) (860) -1%Less: Handset revenue 665 646 +3%
Total CACs (net of handset revenue) (204) (214) +5%Operating Expenses (1,526) (1,619) +6%Gain on disposal of tower assets 2,620 – +100%Impairment of goodwill (1,669) – -100% EBITDA (1) 2,645 1,753 +51% +51% Depreciation & Amortisation (1,029) (840) -23% EBIT (1) 1,616 913 +77% +77%
Note 1: Under Post-IFRS 16 basis, EBITDA was €3,095 million (30 June 2020: €2,193 million); EBIT was €1,669 million (30 June 2020: €934 million).
On a Pre-IFRS 16 basis, Revenue of CK Hutchison Group Telecom of €4,901 million was 2% lower than same period last year. EBITDA and EBIT of €2,645 million and €1,616 million were 51% and 77% higher than the same period last year respectively, primarily due to the recognition of €2,620 million disposal gain on the tower assets in Italy and Sweden, partly offset by a non-cash impairment of goodwill on the Group’s Italian telecommunication business of €1,669 million.
On a Pre-IFRS 16 basis, profit attributable to ordinary shareholders for the six months ended 30 June 2021 of €1,777 million increased 113% from same period in 2020, primarily reflecting aforementioned higher EBIT contribution, as well as the recognition of deferred tax credit arising from the revision of the UK corporate tax rates of £262 million by 3UK in the first half of 2021. In the first half of 2020, a similar deferred tax credit of £106 million was recognised.
CKHGT 2021 Interim Results Operations Review
Page 2 of 61

CKH Group Telecom4
Modified at: 02-08-2021 15:51
33 Group Europe (2)
In million30 June 2021
EUR30 June 2020 (3)
EUR ChangeLocal currencies
change
Total Revenue 4,616 4,765 -3% -4% Total Margin 3,263 3,399 -4% -5%
Total CACs (841) (830) -1%Less: Handset revenue 647 629 +3%
Total CACs (net of handset revenue) (194) (201) +3%Operating Expenses (1,489) (1,551) +4%
Opex as a % of total margin 46% 46%
EBITDA 1,580 1,647 -4% -5%EBITDA Margin % (4) 40% 40%
Depreciation & Amortisation (980) (784) -25% EBIT 600 863 -30% -31%
EBITDA per above 1,580 1,647 -4% -5%Proforma contribution from tower assets – 51Reported EBITDA (5) 1,580 1,698 -7% -8%
EBIT per above 600 863 -30% -31%Proforma contribution from tower assets – 44Reported EBIT (5) 600 907 -34% -34% Note 2: 3 Group Europe results above is before one-off items in 1H 2021, which represented gain on disposal of tower assets completed in 1H 2021 of €2.6 billion and non-
cash impairment of goodwill of the Group’s Italian telecommunication business of €1.7 billion (1H 2020: nil).
Note 3: As the disposals of tower assets in Denmark, Austria and Ireland were completed in December 2020 and in Sweden was completed in January 2021, comparison was made against normalised 1H 2020 results which exclude the proforma contribution from tower assets of these operations for comparability purpose. The % changes in EBITDA and EBIT are compared against the normalised 1H 2020 numbers.
Note 4: EBITDA margin % represents EBITDA as a percentage of total revenue (excluding handset revenue).
Note 5: Under Post-IFRS 16 basis, EBITDA was €2,002 million (30 June 2020: €2,113 million); EBIT was €646 million (30 June 2020: €928 million).
3 Group Europe’s total revenue and margin of €4,616 million and €3,263 million were 3% and 4% lower against the same period last year respectively, primarily reflecting lower customer base in Italy due to intense market competition. Encouragingly, the trend has relatively stabilised since Wind Tre launched second brand Very Mobile in mid-2020 to compete in the prepaid segment.
Active customer base as at 30 June 2021 of 38.0 million is 2% lower against the same period last year, mainly due to lower customer bases in both Italy and in the UK, partly offset by net additions in other operations. Management continues to focus on managing churn and the average monthly customer churn rate of the contract customer base maintained at 1.2% for the half year, flat against first half of 2020.
3 Group Europe’s net ARPU and net AMPU of €13.00 and €11.35 respectively are both stable as compared to first half of 2020. Total data usage increased 30% to approximately 3,331 petabytes in first half of 2021. Data usage per active customer was approximately 92.0 gigabytes per user in first half of 2021 compared to 68.6 gigabytes per user in first half of 2020.
3 Group Europe’s results have been adversely impacted by the incremental tower service fees. On a normalised basis, EBITDA and EBIT were 4% and 30% lower year-on-year respectively, mainly driven by lower total margin, partly offset by disciplined spending on customer acquisition cost and operating expenses. Total CACs, net of handset revenue in contract bundled plans, of €194 million and operating expenses of €1,489 million are 3% and 4% lower against first half of 2020, on a normalised basis, respectively. EBIT was further impacted by the increase in depreciation and amortisation from a higher asset base from its significant investments in IT and 5G rollouts.
With the performances of the operations in Italy and the UK both stabilising from various initiatives to improve margins and controlling costs, gradual reopening of most European regions, focus on capturing emerging opportunities by accelerating the rollout of 5G services, together with a well-disciplined and prudent financial, liquidity and cash flow management, and increased emphasis on sustainability, the Group should be able to continue on its current growth trajectory and expects to deliver a solid performance for the full year in 2021.
CKHGT 2021 Interim Results Operations Review
Page 3 of 61
Management Discussion and Analysis
CKH Group Telecom6
Modified at: 02-08-2021 16:09
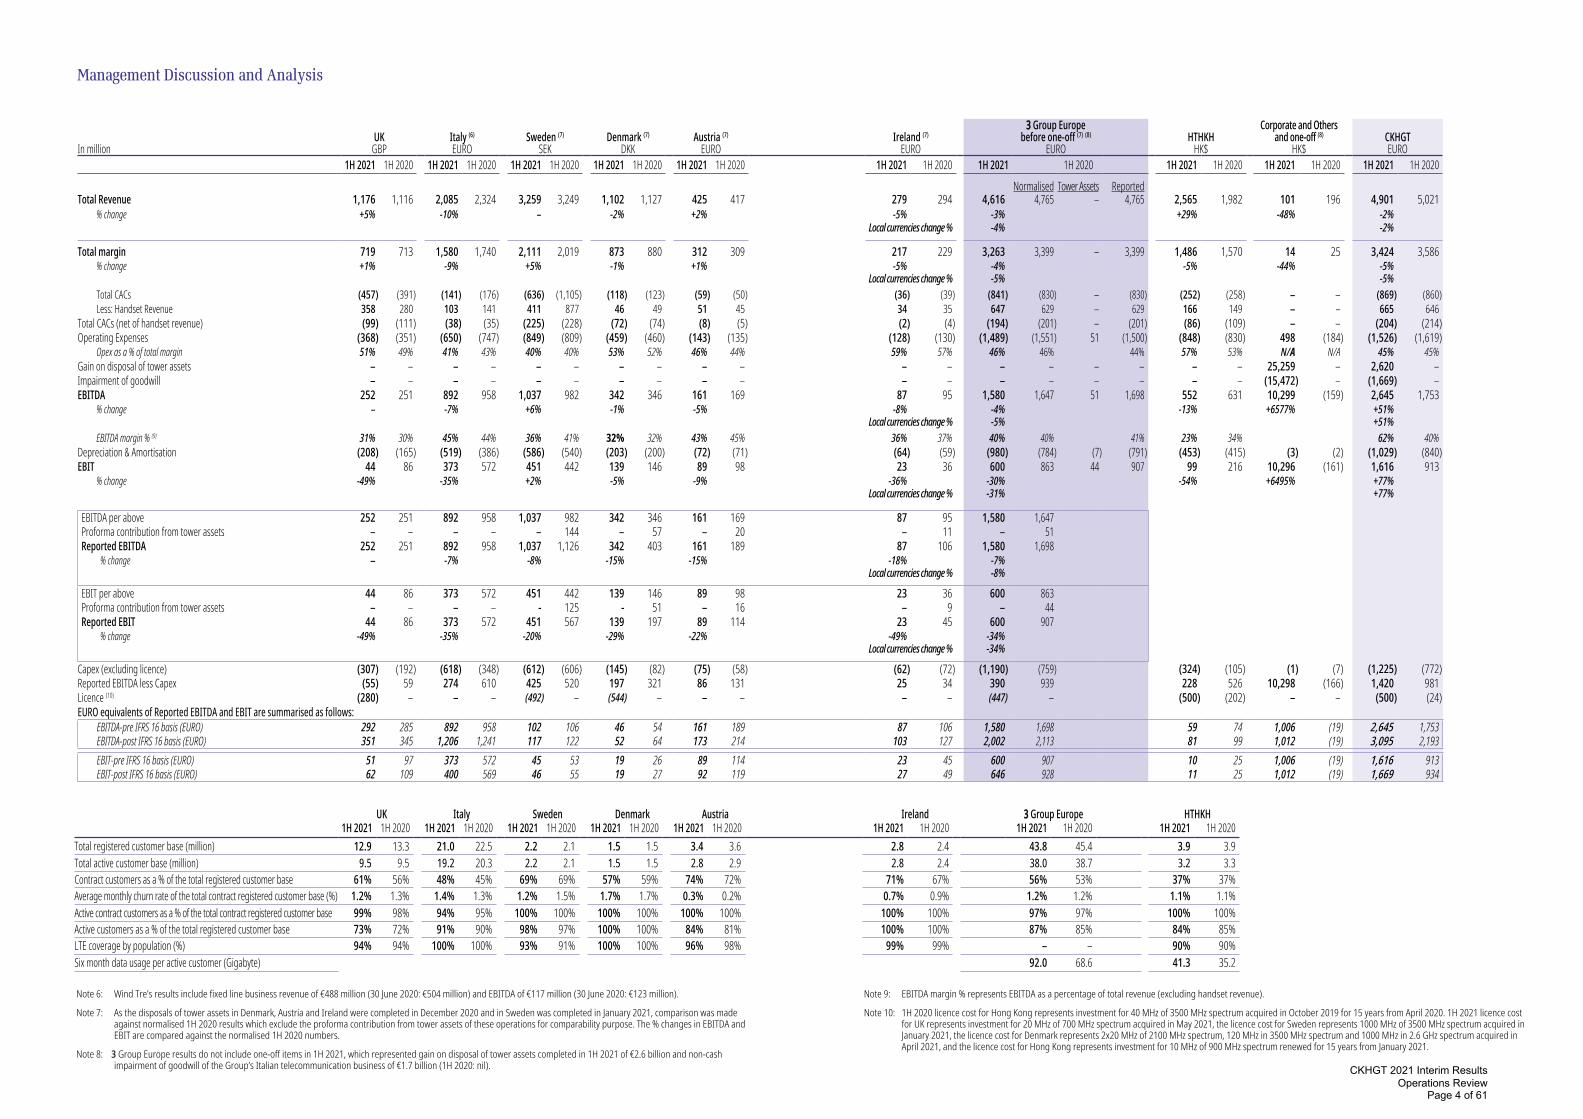
Note 6: Wind Tre’s results include fixed line business revenue of €488 million (30 June 2020: €504 million) and EBITDA of €117 million (30 June 2020: €123 million).
Note 7: As the disposals of tower assets in Denmark, Austria and Ireland were completed in December 2020 and in Sweden was completed in January 2021, comparison was made against normalised 1H 2020 results which exclude the proforma contribution from tower assets of these operations for comparability purpose. The % changes in EBITDA and EBIT are compared against the normalised 1H 2020 numbers.
Note 8: 3 Group Europe results do not include one-off items in 1H 2021, which represented gain on disposal of tower assets completed in 1H 2021 of €2.6 billion and non-cash impairment of goodwill of the Group’s Italian telecommunication business of €1.7 billion (1H 2020: nil).
UK Italy Sweden Denmark Austria Ireland 33 Group Europe HTHKH 1H 2021 1H 2020 1H 2021 1H 2020 1H 2021 1H 2020 1H 2021 1H 2020 1H 2021 1H 2020 1H 2021 1H 2020 1H 2021 1H 2020 1H 2021 1H 2020Total registered customer base (million) 12.9 13.3 21.0 22.5 2.2 2.1 1.5 1.5 3.4 3.6 2.8 2.4 43.8 45.4 3.9 3.9Total active customer base (million) 9.5 9.5 19.2 20.3 2.2 2.1 1.5 1.5 2.8 2.9 2.8 2.4 38.0 38.7 3.2 3.3Contract customers as a % of the total registered customer base 61% 56% 48% 45% 69% 69% 57% 59% 74% 72% 71% 67% 56% 53% 37% 37%Average monthly churn rate of the total contract registered customer base (%) 1.2% 1.3% 1.4% 1.3% 1.2% 1.5% 1.7% 1.7% 0.3% 0.2% 0.7% 0.9% 1.2% 1.2% 1.1% 1.1%Active contract customers as a % of the total contract registered customer base 99% 98% 94% 95% 100% 100% 100% 100% 100% 100% 100% 100% 97% 97% 100% 100%Active customers as a % of the total registered customer base 73% 72% 91% 90% 98% 97% 100% 100% 84% 81% 100% 100% 87% 85% 84% 85%LTE coverage by population (%) 94% 94% 100% 100% 93% 91% 100% 100% 96% 98% 99% 99% – – 90% 90%Six month data usage per active customer (Gigabyte) 92.0 68.6 41.3 35.2
In millionUK
GBPItaly (6)
EUROSweden (7)
SEKDenmark (7)
DKKAustria (7)
EUROIreland (7)
EURO
33 Group Europebefore one-off (7) (8)
EUROHTHKH
HK$
Corporate and Othersand one-off (8)
HK$CKHGTEURO
1H 2021 1H 2020 1H 2021 1H 2020 1H 2021 1H 2020 1H 2021 1H 2020 1H 2021 1H 2020 1H 2021 1H 2020 1H 2021 1H 2020 1H 2021 1H 2020 1H 2021 1H 2020 1H 2021 1H 2020Normalised Tower Assets Reported
Total Revenue 1,176 1,116 2,085 2,324 3,259 3,249 1,102 1,127 425 417 279 294 4,616 4,765 – 4,765 2,565 1,982 101 196 4,901 5,021% change +5% -10% – -2% +2% -5% -3% +29% -48% -2%
Local currencies change % -4% -2%
Total margin 719 713 1,580 1,740 2,111 2,019 873 880 312 309 217 229 3,263 3,399 – 3,399 1,486 1,570 14 25 3,424 3,586% change +1% -9% +5% -1% +1% -5% -4% -5% -44% -5%
Local currencies change % -5% -5%Total CACs (457) (391) (141) (176) (636) (1,105) (118) (123) (59) (50) (36) (39) (841) (830) – (830) (252) (258) – – (869) (860)Less: Handset Revenue 358 280 103 141 411 877 46 49 51 45 34 35 647 629 – 629 166 149 – – 665 646
Total CACs (net of handset revenue) (99) (111) (38) (35) (225) (228) (72) (74) (8) (5) (2) (4) (194) (201) – (201) (86) (109) – – (204) (214)Operating Expenses (368) (351) (650) (747) (849) (809) (459) (460) (143) (135) (128) (130) (1,489) (1,551) 51 (1,500) (848) (830) 498 (184) (1,526) (1,619)
Opex as a % of total margin 51% 49% 41% 43% 40% 40% 53% 52% 46% 44% 59% 57% 46% 46% 44% 57% 53% N/A N/A 45% 45%Gain on disposal of tower assets – – – – – – – – – – – – – – – – – – 25,259 – 2,620 –Impairment of goodwill – – – – – – – – – – – – – – – – – – (15,472) – (1,669) –EBITDA 252 251 892 958 1,037 982 342 346 161 169 87 95 1,580 1,647 51 1,698 552 631 10,299 (159) 2,645 1,753
% change – -7% +6% -1% -5% -8% -4% -13% +6577% +51%Local currencies change % -5% +51%
EBITDA margin % (9) 31% 30% 45% 44% 36% 41% 32% 32% 43% 45% 36% 37% 40% 40% 41% 23% 34% 62% 40%Depreciation & Amortisation (208) (165) (519) (386) (586) (540) (203) (200) (72) (71) (64) (59) (980) (784) (7) (791) (453) (415) (3) (2) (1,029) (840)EBIT 44 86 373 572 451 442 139 146 89 98 23 36 600 863 44 907 99 216 10,296 (161) 1,616 913
% change -49% -35% +2% -5% -9% -36% -30% -54% +6495% +77%Local currencies change % -31% +77%
EBITDA per above 252 251 892 958 1,037 982 342 346 161 169 87 95 1,580 1,647Proforma contribution from tower assets – – – – – 144 – 57 – 20 – 11 – 51Reported EBITDA 252 251 892 958 1,037 1,126 342 403 161 189 87 106 1,580 1,698
% change – -7% -8% -15% -15% -18% -7%Local currencies change % -8%
EBIT per above 44 86 373 572 451 442 139 146 89 98 23 36 600 863Proforma contribution from tower assets – – – – - 125 - 51 – 16 – 9 – 44Reported EBIT 44 86 373 572 451 567 139 197 89 114 23 45 600 907
% change -49% -35% -20% -29% -22% -49% -34%Local currencies change % -34%
Capex (excluding licence) (307) (192) (618) (348) (612) (606) (145) (82) (75) (58) (62) (72) (1,190) (759) (324) (105) (1) (7) (1,225) (772)Reported EBITDA less Capex (55) 59 274 610 425 520 197 321 86 131 25 34 390 939 228 526 10,298 (166) 1,420 981Licence (10) (280) – – – (492) – (544) – – – – – (447) – (500) (202) – – (500) (24)EURO equivalents of Reported EBITDA and EBIT are summarised as follows:
EBITDA-pre IFRS 16 basis (EURO) 292 285 892 958 102 106 46 54 161 189 87 106 1,580 1,698 59 74 1,006 (19) 2,645 1,753EBITDA-post IFRS 16 basis (EURO) 351 345 1,206 1,241 117 122 52 64 173 214 103 127 2,002 2,113 81 99 1,012 (19) 3,095 2,193EBIT-pre IFRS 16 basis (EURO) 51 97 373 572 45 53 19 26 89 114 23 45 600 907 10 25 1,006 (19) 1,616 913EBIT-post IFRS 16 basis (EURO) 62 109 400 569 46 55 19 27 92 119 27 49 646 928 11 25 1,012 (19) 1,669 934
Note 9: EBITDA margin % represents EBITDA as a percentage of total revenue (excluding handset revenue).
Note 10: 1H 2020 licence cost for Hong Kong represents investment for 40 MHz of 3500 MHz spectrum acquired in October 2019 for 15 years from April 2020. 1H 2021 licence cost for UK represents investment for 20 MHz of 700 MHz spectrum acquired in May 2021, the licence cost for Sweden represents 1000 MHz of 3500 MHz spectrum acquired in January 2021, the licence cost for Denmark represents 2x20 MHz of 2100 MHz spectrum, 120 MHz in 3500 MHz spectrum and 1000 MHz in 2.6 GHz spectrum acquired in April 2021, and the licence cost for Hong Kong represents investment for 10 MHz of 900 MHz spectrum renewed for 15 years from January 2021.
CKHGT 2021 Interim Results Operations Review
Page 4 of 61

CKH Group Telecom8
Modified at: 02-08-2021 15:51
Key Business Indicators
Registered Customer Base
Registered Customers at 30 June 2021 (’000)
Registered Customer Growth (%) from 31 December 2020 to 30 June 2021
Registered Customer Growth (%) from 30 June 2020 to 30 June 2021
Non-contract Contract Total Non-contract Contract Total Non-contract Contract Total
United Kingdom 5,074 7,827 12,901 -8% +3% -2% -14% +6% -3%
Italy (11) 10,950 10,044 20,994 -2% -3% -2% -11% -1% -7%
Sweden 709 1,558 2,267 +4% +2% +3% +8% +5% +6%
Denmark 638 844 1,482 +3% -1% +1% +6% -1% +2%
Austria 874 2,495 3,369 -6% -4% -5% -13% -4% -7%
Ireland 813 1,964 2,777 -2% +10% +6% +3% +24% +17%
3 Group Europe Total 19,058 24,732 43,790 -4% – -2% -10% +3% -3%
HTHKH 2,433 1,423 3,856 +1% – +1% - -2% -1%
Active (12) Customer Base
Active Customers at 30 June 2021 (’000)
Active Customer Growth (%) from 31 December 2020 to 30 June 2021
Active Customer Growth (%) from 30 June 2020 to 30 June 2021
Non-contract Contract Total Non-contract Contract Total Non-contract Contract Total
United Kingdom 1,719 7,730 9,449 -22% +3% -3% -25% +6% -1%
Italy (11) 9,751 9,479 19,230 -2% -2% -2% -8% -2% -5%
Sweden 654 1,558 2,212 +4% +2% +3% +11% +5% +7%
Denmark 632 844 1,476 +3% -1% +1% +6% -1% +2%
Austria 355 2,488 2,843 +4% -4% -3% +8% -4% -3%
Ireland 813 1,964 2,777 -2% +10% +6% +3% +24% +17%
3 Group Europe Total 13,924 24,063 37,987 -4% – -1% -9% +3% -2%
HTHKH 1,810 1,423 3,233 -2% – -1% -2% -2% -2%
Note 11: In addition to the above, Wind Tre has 2.9 million fixed line customers.
Note 12: An active customer is one that generated revenue from an outgoing call, incoming call or data/content service in the preceding three months.
CKHGT 2021 Interim Results Operations Review
Page 5 of 61

CKH Group Telecom 9
Modified at: 02-08-2021 15:51
Management Discussion and Analysis
12-month Trailing Average Revenue per Active User (“ARPU”) (13) to 30 June 2021
Non-contract ContractBlended
Total
% Variancecompared to30 June 2020
United Kingdom £4.97 £21.98 £18.24 +3%Italy (16) €10.62 €12.57 €11.58 -1%Sweden SEK116.54 SEK312.78 SEK255.81 -7%Denmark DKK86.38 DKK145.41 DKK120.65 -4%Austria €11.82 €21.93 €20.73 +1%Ireland €14.72 €16.57 €15.99 -14%3 Group Europe Average (16) €10.22 €19.11 €15.75 –HTHKH HK$8.78 HK$194.60 HK$91.05 -3%
12-month Trailing Net Average Revenue per Active User (“Net ARPU”) (14)
to 30 June 2021
Non-contract ContractBlended
Total
% Variancecompared to30 June 2020
United Kingdom £4.97 £15.04 £12.82 +2%Italy €10.62 €11.21 €10.91 -1%Sweden SEK116.54 SEK206.73 SEK180.55 -4%Denmark DKK86.38 DKK134.58 DKK114.36 -4%Austria €11.82 €18.11 €17.36 +1%Ireland €14.72 €12.74 €13.37 -16%3 Group Europe Average €10.22 €14.69 €13.00 -1%HTHKH HK$8.78 HK$171.24 HK$80.71 -2%
12-month Trailing Net Average Margin per Active User (“Net AMPU”) (15)
to 30 June 2021
Non-contract ContractBlended
Total
% Variancecompared to30 June 2020
United Kingdom £4.34 £13.29 £11.32 +3%Italy €9.16 €9.66 €9.41 +2%Sweden SEK100.51 SEK180.59 SEK157.34 -2%Denmark DKK73.01 DKK111.36 DKK95.27 -4%Austria €10.13 €16.09 €15.39 –Ireland €13.50 €11.55 €12.16 -15%3 Group Europe Average €8.86 €12.87 €11.35 +1%HTHKH HK$7.51 HK$148.39 HK$69.89 -4%
Note 13: ARPU equals total monthly revenue, including incoming mobile termination revenue and contributions for a handset/device in contract bundled plans, divided by the average number of active customers during the period.
Note 14: Net ARPU equals total monthly revenue, including incoming mobile termination revenue but excluding contributions for a handset/device in contract bundled plans, divided by the average number of active customers during the period.
Note 15: Net AMPU equals total monthly revenue, including incoming mobile termination revenue but excluding contributions for a handset/device in contract bundled plans, less direct variable costs (including interconnection charges and roaming costs) (i.e. net customer service margin), divided by the average number of active customers during the period.
Note 16: Wind Tre’s ARPU for the period ended 30 June 2020 has been restated to conform with the definition of 3 Italy before the merger with WIND.
CKHGT 2021 Interim Results Operations Review
Page 6 of 61

CKH Group Telecom10
Modified at: 02-08-2021 15:51
Management Discussion and Analysis
United Kingdom3 UK’s EBITDA remains flat in local currency compared to the same period last year, mainly driven by improvements in other margins from MVNOs, together with lower costs associated to acquisition and retention activities due to lockdown, fully offset the lower net customer service margin from lower weighted average customer base. EBIT decreased by 49% in local currency compared to the same period last year, mainly due to increased depreciation from higher asset base driven by IT investments and accelerated 5G network rollout.
Italy Wind Tre’s EBITDA decreased by 7% compared to the same period last year, mainly driven by intense competition resulting in revenue decline of 10%, partly offset by cost savings and certain dispute settlement benefit. EBIT decreased by 35% against the first half of 2020 due to higher depreciation and amortisation from the enlarged asset base as network enhancement continues.
SwedenSweden, where the Group has a 60% interest, on a normalised basis and in local currency, reported EBITDA and EBIT growth of 6% and 2% respectively when compared to same period last year, primarily driven by 5% growth in total margin from customer base growth, together with stringent control on total CACs, partly offset by higher operating costs and depreciation and amortisation from enlarged network base and new spectrum licence acquired in early 2021.
DenmarkThe operation in Denmark, where the Group has a 60% interest, reported local currency EBITDA and EBIT decreased by 1% and 5% respectively on a normalised basis, primarily driven by the 1% decrease in total margin as a result of a more adverse lockdown impact with all shops being closed for two months during the first half of 2021.
AustriaOn a normalised basis, EBITDA and EBIT in local currency decreased by 5% and 9% respectively compared to the same period last year, primarily driven by higher network related expenses due to network expansion, higher total CACs and operating costs, partly offset by higher contribution in other margin from MVNOs.
IrelandOn a normalised basis, EBITDA and EBIT in local currency decreased by 8% and 36% respectively compared to the same period last year driven by 5% lower total margin mainly due to lower net AMPU from reduced out of bundle spend and the dilutive impact of higher mix of low value Internet of things (IoT) customers, which more than offsets the base growth. The adverse variance is partly offset by stringent control on total CACs and operating cost. EBIT also reflected higher depreciation and amortisation from an enlarged asset base.
Hutchison Telecommunications Hong Kong Holdings Total revenue of HK$2,565 million was 29% higher as compared to the same period last year, primarily driven by increase in hardware sales, partly offset by lower net customer service revenue as roaming service revenue continued to be impacted by the prolonged travel restrictions. EBITDA of HK$552 million was 13% lower as compared to the same period last year, mainly due to lower interest income from lower bank deposit interest rates and lower net customer service margin. EBIT of HK$99 million was 54% lower than the first half of 2020 due to higher depreciation and amortisation from an enlarged asset base.
CKHGT 2021 Interim Results Operations Review
Page 7 of 61

CKH Group Telecom 11
Modified at: 02-08-2021 15:51
Management Discussion and Analysis
Capital Expenditure and Licences
1H 2021
EUR million Fixed assetsTelecommunications
licencesBrand names and
other rights Total
United Kingdom 355 325 – 680Italy 298 – 320 618Sweden 60 49 – 109Denmark 20 73 – 93Austria 75 – – 75Ireland 62 – – 62Hong Kong 35 53 – 88Corporate and others – – – –Total 905 500 320 1,725
1H 2020
EUR million Fixed assetsTelecommunications
licencesBrand names and
other rights Total
United Kingdom 213 – – 213Italy 264 – 84 348Sweden 57 – – 57Denmark 11 – – 11Austria 58 – – 58Ireland 72 – – 72Hong Kong 12 24 – 36Corporate and others – – 1 1Total 687 24 85 796
For the first half of 2021, the Group’s capital expenditure, excluding licences, of €1,225 million increased by €453 million (+59%) compared to the first half of 2020, primarily due to the continued 5G network rollout and network enhancement in most of the operations, as well as recognition of a right of use on 5G spectrum as part of a network partnership in Italy during 1H 2021. Capex, excluding licences, as a percentage of total revenue was 25% in 1H 2021 (1H 2020: 15%).
Total spectrum spending of €500 million in the first half of 2021 represented the 700 MHz spectrum in the UK acquired in May 2021, 3500 MHz spectrum in Sweden acquired in January 2021, 2100 MHz spectrum, 3500 MHz spectrum and 2.6 GHz spectrum in Denmark acquired in April 2021, as well as 900 MHz spectrum licence renewal cost in Hong Kong from January 2021. The spectrum spending of €24 million in first half of 2020 represented the 3500 MHz spectrum licence cost for Hong Kong acquired in October 2019 for 15 years from 2020.
CKHGT 2021 Interim Results Operations Review
Page 8 of 61

CK Hutchison Group TelecomFinancial Performance Summary
Pre-IFRS 16 (1)
Unaudited Results for the six months ended
30 June 2021
Pre-IFRS 16 (1)
Unaudited Results for the six months ended
30 June 2020 Change
Local currencies
changeEUR million EUR million % %
Total Revenue (2)
3 Group Europe 4,616 4,765 -3% -4%- UK 1,357 1,274 7% 5%- Italy 2,085 2,324 -10% -10%- Sweden 322 304 6% –- Denmark 148 152 -3% -2%- Austria 425 417 2% 2%- Ireland 279 294 -5% -5%
Hong Kong 275 234 18% 29%Corporate and others 10 22 -55% -55%
Total Revenue 4,901 5,021 -2% -2%EBITDA (2)
3 Group Europe 1,580 1,698 -7% -8%- UK 292 285 2% –- Italy 892 958 -7% -7%- Sweden 102 106 -4% -8%- Denmark 46 54 -15% -15%- Austria 161 189 -15% -15%- Ireland 87 106 -18% -18%
Hong Kong 59 74 -20% -13%Corporate and others 1,006 (19) 5395% 5395%
Total EBITDA 2,645 1,753 51% 51%
EBIT (2)
3 Group Europe 600 907 -34% -34%- UK 51 97 -47% -49%- Italy 373 572 -35% -35%- Sweden 45 53 -15% -20%- Denmark 19 26 -27% -29%- Austria 89 114 -22% -22%- Ireland 23 45 -49% -49%
Hong Kong 10 25 -60% -54%Corporate and others 1,006 (19) 5395% 5395%
Total EBIT 1,616 913 77% 77%
Interest expenses and other finance costs (2) (63) (67) 6%
Profit Before Tax 1,553 846 84%Tax (2)
Current tax (20) (16) -25%Deferred tax 264 33 700%
(1,28) 1,589 -181% -181%
244 17 1335% -181%
Profit after tax 1,797 863 108%Non-controlling interests (20) (29) 31%
Profit attributable to ordinary shareholders (“NPAT”) 1,777 834 113% 113%
Note 1: The Group believes that the precedent lease accounting standard International Accounting Standard 17 “Leases” (“IAS 17”) basis (“Pre-IFRS 16 basis”) metrics, which are not intended to be a substitute for, or superior to, the reported metrics on a International Financial Reporting Standard 16 “Leases” basis (“Post-IFRS 16 basis”), better reflect management’s view of the Group’s underlying operational performance. IAS 17 basis metrics financial information is regularly reviewed by management and used for resource allocation, performance assessment and internal decision-making. As a result, the Group has provided an alternative presentation of the Group’s EBITDA, EBIT, interest expenses and other finance costs, tax, non-controlling interests and profit attributable to ordinary shareholders prepared under the Pre-IFRS 16 basis relating to the accounting for leases for the six months ended 30 June 2020 and 2021. Unless otherwise specified, the discussion of the Group’s operating results in this results announcement is on a Pre-IFRS 16 basis as mentioned above.
Note 2: Total revenue, EBITDA, EBIT, interest expenses and other finance costs and tax include the Group’s proportionate share of joint ventures’ respective items.
CKHGT 2021 Interim Results Financial Performance Summary
Page 9 of 61

CK Hutchison Group TelecomFinancial Performance Summary
Post-IFRS 16 Unaudited Results for the six months ended
30 June 2021
Post-IFRS 16 Unaudited Results for the six months ended
30 June 2020 ChangeEUR million EUR million %
Total Revenue (1)
3 Group Europe 4,616 4,765 -3%- UK 1,357 1,274 7%- Italy 2,085 2,324 -10%- Sweden 322 304 6%- Denmark 148 152 -3%- Austria 425 417 2%- Ireland 279 294 -5%
Hong Kong 275 234 18%Corporate and others 10 22 -55%
Total Revenue 4,901 5,021 -2%
EBITDA (1)
3 Group Europe 2,002 2,113 -5%- UK 351 345 2%- Italy 1,206 1,241 -3%- Sweden 117 122 -4%- Denmark 52 64 -19%- Austria 173 214 -19%- Ireland 103 127 -19%
Hong Kong 81 99 -18%Corporate and others 1,012 (19) 5426%
Total EBITDA 3,095 2,193 41%
EBIT (1)
3 Group Europe 646 928 -30%- UK 62 109 -43%- Italy 400 569 -30%- Sweden 46 55 -16%- Denmark 19 27 -30%- Austria 92 119 -23%- Ireland 27 49 -45%
Hong Kong 11 25 -56%Corporate and others 1,012 (19) 5426%
Total EBIT 1,669 934 79%
Interest expenses and other finance costs (1) (116) (121) 4%
Profit Before Tax 1,553 813 91%Tax (1)
Current tax (21) (14) -50%Deferred tax 262 33 694%
(1,28) 1,589 -181%
241 19 1168%
Profit after tax 1,794 832 116%Non-controlling interests (20) (29) 31%
Profit attributable to ordinary shareholders (“NPAT”) 1,774 803 121%
Note 1: Total revenue, EBITDA, EBIT, interest expenses and other finance costs and tax include the Group’s proportionate share of joint ventures’ respective items.
CKHGT 2021 Interim Results Financial Performance Summary
Page 10 of 61

Report on Review of Interim Financial Statements TO THE BOARD OF DIRECTORS OF CK HUTCHISON GROUP TELECOM HOLDINGS LIMITED (incorporated in the Cayman Islands with limited liability)
Introduction We have reviewed the interim financial statements set out on pages 12 to 61, which comprises the condensed consolidated statement of financial position of CK Hutchison Group Telecom Holdings Limited (the “Company”) and its subsidiaries (together, the “Group”) as at 30 June 2021 and the condensed consolidated income statement, the condensed consolidated statement of comprehensive income, the condensed consolidated statement of changes in equity and the condensed consolidated statement of cash flows for the six-month period then ended, and a summary of significant accounting policies and other explanatory notes. The directors of the Company are responsible for the preparation and presentation of these interim financial statements in accordance with International Accounting Standard 34 “Interim Financial Reporting”. Our responsibility is to express a conclusion on these interim financial statements based on our review and to report our conclusion solely to you, as a body, in accordance with our agreed terms of engagement and for no other purpose. We do not assume responsibility towards or accept liability to any other person for the contents of this report.
Scope of Review We conducted our review in accordance with International Standard on Review Engagements 2410, “Review of Interim Financial Information Performed by the Independent Auditor of the Entity”. A review of interim financial statements consists of making inquiries, primarily of persons responsible for financial and accounting matters, and applying analytical and other review procedures. A review is substantially less in scope than an audit conducted in accordance with International Standards on Auditing and consequently does not enable us to obtain assurance that we would become aware of all significant matters that might be identified in an audit. Accordingly, we do not express an audit opinion.
Conclusion Based on our review, nothing has come to our attention that causes us to believe that the interim financial statements of the Group are not prepared, in all material respects, in accordance with International Accounting Standard 34 “Interim Financial Reporting”. PricewaterhouseCoopers Certified Public Accountants Hong Kong, 5 August 2021
CKHGT 2021 Interim Results Independent Auditor’s Report
Page 11 of 61
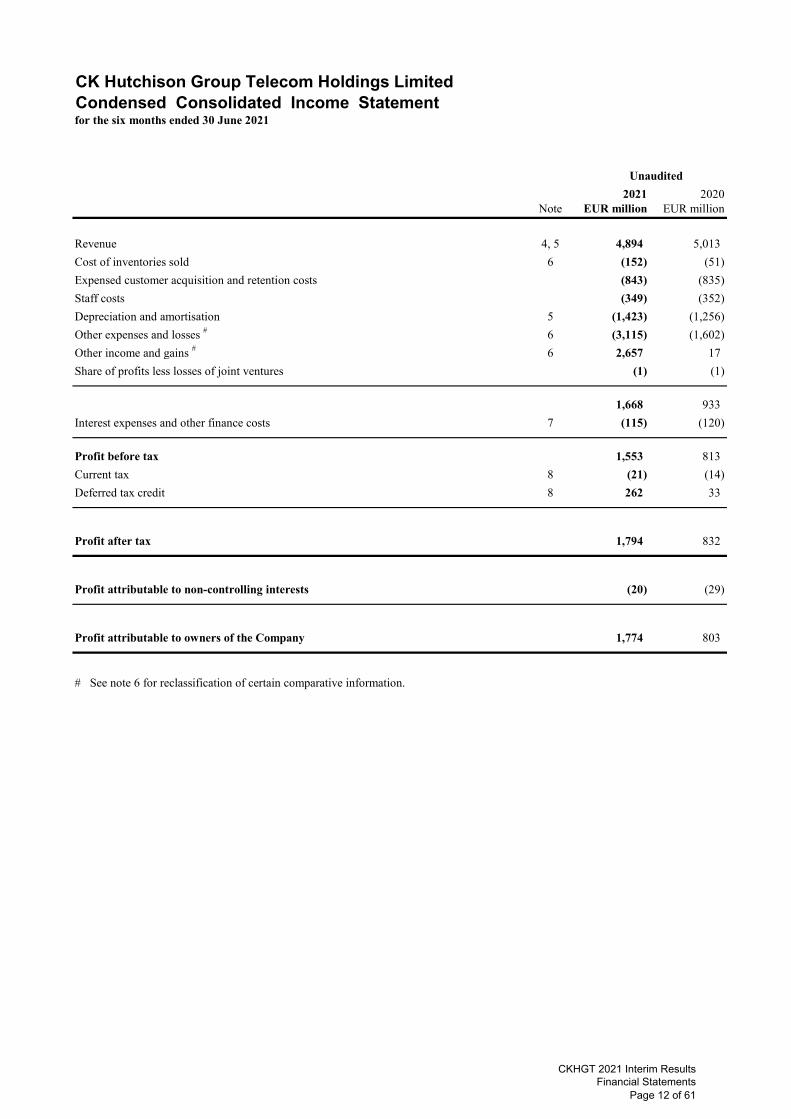
CK Hutchison Group Telecom Holdings LimitedCondensed Consolidated Income Statementfor the six months ended 30 June 2021
2021 2020Note EUR million EUR million
Revenue 4, 5 4,894 5,013
Cost of inventories sold 6 (152) (51)
Expensed customer acquisition and retention costs (843) (835)
Staff costs (349) (352)
Depreciation and amortisation 5 (1,423) (1,256)
Other expenses and losses # 6 (3,115) (1,602)
Other income and gains # 6 2,657 17
Share of profits less losses of joint ventures (1) (1)
1,668 933
Interest expenses and other finance costs 7 (115) (120)
Profit before tax 1,553 813
Current tax 8 (21) (14)
Deferred tax credit 8 262 33
Profit after tax 1,794 832
Profit attributable to non-controlling interests (20) (29)
Profit attributable to owners of the Company 1,774 803
# See note 6 for reclassification of certain comparative information.
Unaudited
CKHGT 2021 Interim Results Financial Statements
Page 12 of 61

CK Hutchison Group Telecom Holdings LimitedCondensed Consolidated Statement of Comprehensive Incomefor the six months ended 30 June 2021
2021 2020EUR million EUR million
Profit after tax 1,794 832
Other comprehensive income (losses)
Items that will not be reclassified to profit or loss - -
Items that may be reclassified to profit or lossGains on cash flow hedges recognised directly in reserves 19 2 Gains (losses) on translating overseas subsidiaries’ net assets recognised directly in reserves 349 (340) Losses previously in exchange reserve related to subsidiaries disposed
during the period recognised in income statement 31 - Tax relating to items that may be reclassified to profit or loss - -
399 (338)
Other comprehensive income (losses), net of tax 399 (338)
Total comprehensive income 2,193 494
Total comprehensive income attributable to non-controlling interests (30) (19)
Total comprehensive income attributable to owners of the Company 2,163 475
Unaudited
CKHGT 2021 Interim Results Financial Statements
Page 13 of 61

CK Hutchison Group Telecom Holdings LimitedCondensed Consolidated Statement of Financial Positionat 30 June 2021
Unaudited Audited30 June 31 December
2021 2020Note EUR million EUR million
Non-current assetsFixed assets 9 7,282 7,400 Right-of-use assets 10 2,199 2,438 Telecommunications licences 11 7,323 6,760 Brand names and other rights 12 4,051 3,908 Goodwill 13 11,626 14,080 Interests in joint ventures 14 33 33 Deferred tax assets 15 2,108 1,784 Other non-current assets 16 798 813
35,420 37,216
Current assetsCash and cash equivalents 17 6,549 3,752 Inventories 183 182 Trade receivables and other current assets 18 3,121 3,149
9,853 7,083 Assets classified as held for sale 19 - 132
9,853 7,215
Current liabilities Bank and other debts 20 604 - Current tax liabilities 34 67 Lease liabilities 10 693 662 Trade payables and other current liabilities 21 4,206 4,566
5,537 5,295 Liabilities directly associated with assets classified as held for sale 19 - 30
5,537 5,325
Net current assets 4,316 1,890
Total assets less current liabilities 39,736 39,106
Non-current liabilitiesBank and other debts 20 7,746 8,942 Lease liabilities 10 1,741 2,019 Deferred tax liabilities 15 27 28 Pension obligations 23 72 75 Other non-current liabilities 24 1,845 1,921
11,431 12,985
Net assets 28,305 26,121
CKHGT 2021 Interim Results Financial Statements
Page 14 of 61

CK Hutchison Group Telecom Holdings LimitedCondensed Consolidated Statement of Financial Positionat 30 June 2021
Unaudited Audited30 June 31 December
2021 2020Note EUR million EUR million
Capital and reservesShare capital 25 - - Share premium 25 20,917 20,917 Reserves 26 6,187 4,024
Equity attributable to owners of the Company 27,104 24,941 Non-controlling interests 1,201 1,180
Total equity 28,305 26,121
CKHGT 2021 Interim Results Financial Statements
Page 15 of 61

CK Hutchison Group Telecom Holdings LimitedCondensed Consolidated Statement of Changes in Equityfor the six months ended 30 June 2021
Share capital Non- Unauditedand share controlling Total
premium (a) Reserves (b) Subtotal interests equityEUR million EUR million EUR million EUR million EUR million
At 1 January 2021 20,917 4,024 24,941 1,180 26,121
Profit for the period - 1,774 1,774 20 1,794
Other comprehensive incomeGains on cash flow hedges recognised directly in reserves - 19 19 - 19 Gains on translating overseas subsidiaries’ net
assets recognised directly in reserves - 339 339 10 349 Losses previously in exchange reserves related to subsidiaries
disposed during the period recognised in income statement - 31 31 - 31 Tax relating to components of other comprehensive income - - - - -
Other comprehensive income, net of tax - 389 389 10 399
Total comprehensive income - 2,163 2,163 30 2,193
Transactions with owners in their capacity as owners:Dividends paid to non-controlling interests - - - (9) (9)
At 30 June 2021 20,917 6,187 27,104 1,201 28,305
At 1 January 2020 20,917 1,591 22,508 1,265 23,773
Profit for the period - 803 803 29 832
Other comprehensive income (losses)Gains on cash flow hedges recognised directly in reserves - 2 2 - 2 Losses on translating overseas subsidiaries’ net
assets recognised directly in reserves - (330) (330) (10) (340) Tax relating to components of other comprehensive income (losses) - - - - -
Other comprehensive income (losses), net of tax - (328) (328) (10) (338)
Total comprehensive income - 475 475 19 494
Transactions with owners in their capacity as owners:Dividends paid to non-controlling interests - - - (39) (39)
At 30 June 2020 20,917 2,066 22,983 1,245 24,228
(a) See note 25 for details on share capital and share premium.(b) See note 26 for details on reserves.(c) During the six months ended 30 June 2021 and 2020, no dividend has been paid or declared by the Company.
Attributable toOwners of the Company
CKHGT 2021 Interim Results Financial Statements
Page 16 of 61
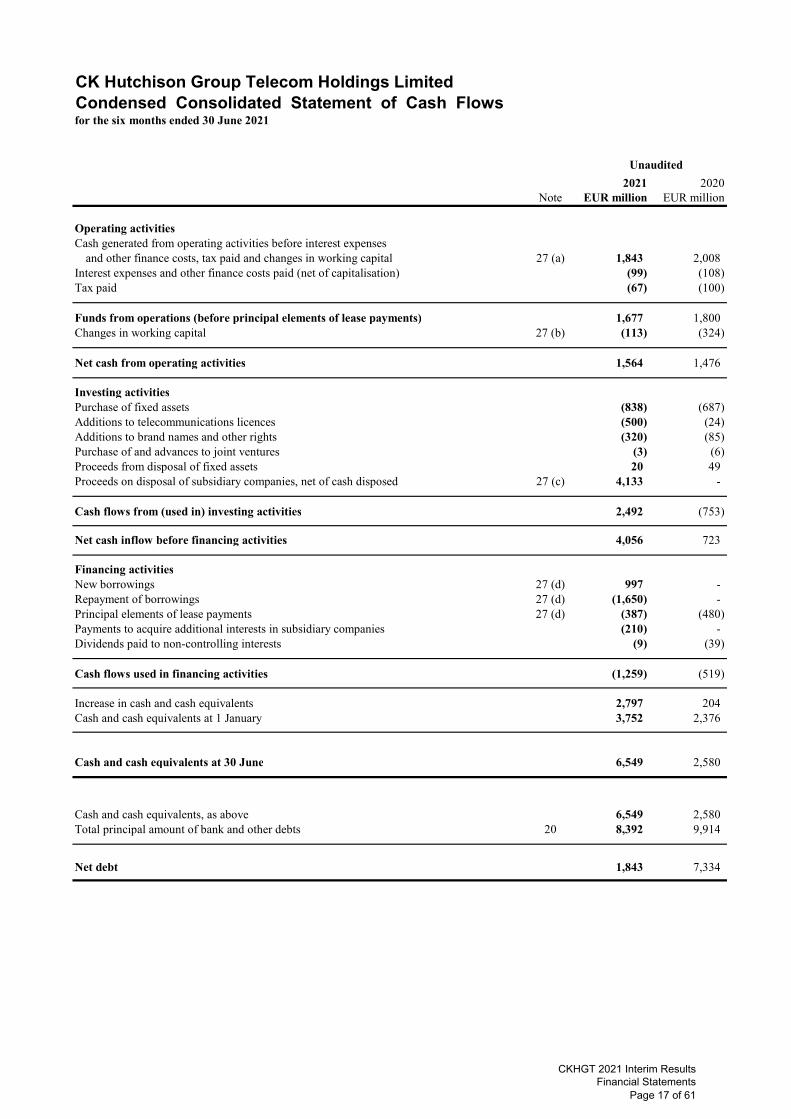
CK Hutchison Group Telecom Holdings LimitedCondensed Consolidated Statement of Cash Flows for the six months ended 30 June 2021
2021 2020Note EUR million EUR million
Operating activitiesCash generated from operating activities before interest expenses
and other finance costs, tax paid and changes in working capital 27 (a) 1,843 2,008 Interest expenses and other finance costs paid (net of capitalisation) (99) (108) Tax paid (67) (100)
Funds from operations (before principal elements of lease payments) 1,677 1,800 Changes in working capital 27 (b) (113) (324)
Net cash from operating activities 1,564 1,476
Investing activitiesPurchase of fixed assets (838) (687) Additions to telecommunications licences (500) (24) Additions to brand names and other rights (320) (85) Purchase of and advances to joint ventures (3) (6) Proceeds from disposal of fixed assets 20 49 Proceeds on disposal of subsidiary companies, net of cash disposed 27 (c) 4,133 -
Cash flows from (used in) investing activities 2,492 (753)
Net cash inflow before financing activities 4,056 723
Financing activitiesNew borrowings 27 (d) 997 - Repayment of borrowings 27 (d) (1,650) - Principal elements of lease payments 27 (d) (387) (480) Payments to acquire additional interests in subsidiary companies (210) - Dividends paid to non-controlling interests (9) (39)
Cash flows used in financing activities (1,259) (519)
Increase in cash and cash equivalents 2,797 204 Cash and cash equivalents at 1 January 3,752 2,376
Cash and cash equivalents at 30 June 6,549 2,580
Cash and cash equivalents, as above 6,549 2,580 Total principal amount of bank and other debts 20 8,392 9,914
Net debt 1,843 7,334
Unaudited
CKHGT 2021 Interim Results Financial Statements
Page 17 of 61

2021 2020EUR million EUR million
Sale of goods 807 685 Revenue from services 4,084 4,317 Interest 3 11
4,894 5,013
Six months ended 30 June
CK Hutchison Group Telecom Holdings LimitedNotes to the Interim Financial Statements
1 General information
CK Hutchison Group Telecom Holdings Limited (the “Company”) is a limited liability company incorporated in the Cayman Islands and is an indirect wholly owned subsidiary of CK Hutchison Holdings Limited (“CKHH”), which is a limited company incorporated in the Cayman Islands and whose shares are listed on The Stock Exchange of Hong Kong Limited (“Stock Exchange”). The interim condensed consolidated financial statements of the Company and its subsidiaries (collectively, the “Group”) as at and for the six months ended 30 June 2021 (the “Interim Financial Statements”) were authorised for issue by the Company’s board of directors on 5 August 2021.
The Operations Review, issued as part of the Group’s 2021 Interim Results announcement, includes discussions and analysis of the performance of the Group’s businesses for the current period and other important events that occurred since the end of the 2020 financial year.
2 Use of judgements, estimates and assumptions
In preparing the Interim Financial Statements, the Group has made accounting related estimates based on assumptions about current and, for some estimates, future economic and market conditions that the Group considers are relevant and reasonable. It is reasonably possible that actual conditions could differ significantly from our expectations, given the road to post-pandemic normal and economic recovery will not be straightforward. Hence, our accounting estimates and assumptions could change over time in response to how economic and market conditions develop. Note 34 sets out further information on our significant accounting judgements, estimates and assumptions applied in preparing the Interim Financial Statements.
3 Basis of preparation
The Interim Financial Statements have been prepared in accordance with International Accounting Standard 34 “Interim Financial Reporting”, issued by the International Accounting Standards Board (“IASB”). They do not include all of the information required for a complete set of financial statements prepared in accordance with International Financial Reporting Standards (“IFRSs”). The Interim Financial Statements should be read in conjunction with the consolidated financial statements of the Group as at and for the year ended 31 December 2020 (the “2020 Annual Financial Statements”), which have been prepared in accordance with IFRSs.
The accompanying financial statements and notes are unaudited. The results reported in the Interim Financial Statements should not be regarded as necessarily indicative of results that may be expected for the entire year.
Management has assessed the potential cash generation of the Group, the liquidity of the Group and existing funding available to the Group. On the basis of these assessments, management has determined that, at the date on which the Interim Financial Statements were authorised for issue, the use of the going concern basis of accounting to prepare the Interim Financial Statements is appropriate.
The significant accounting policies adopted in preparing the Interim Financial Statements are described in note 35.
4 Revenue
(a) An analysis of revenue of the Company and subsidiary companies is as follows:
CKHGT 2021 Interim Results Financial Statements
Page 18 of 61
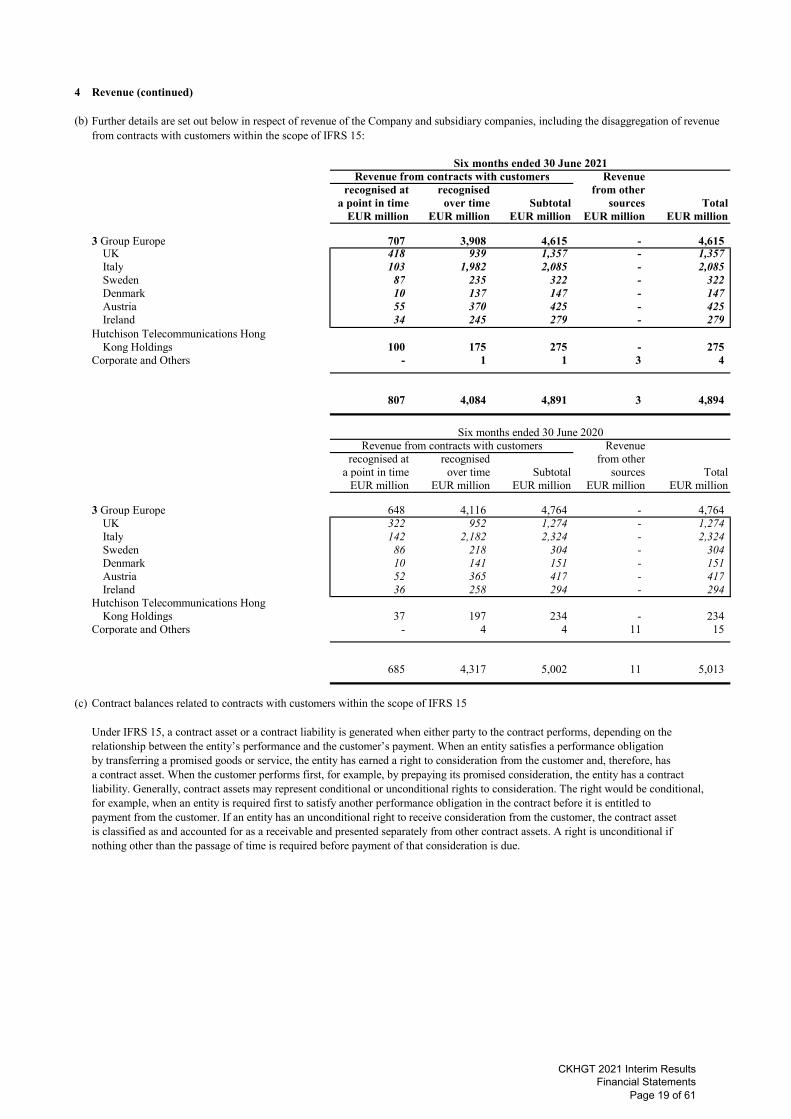
4 Revenue (continued)
(b)
Revenuerecognised at recognised from other
a point in time over time Subtotal sources TotalEUR million EUR million EUR million EUR million EUR million
3 Group Europe 707 3,908 4,615 - 4,615 UK 418 939 1,357 - 1,357 Italy 103 1,982 2,085 - 2,085 Sweden 87 235 322 - 322 Denmark 10 137 147 - 147 Austria 55 370 425 - 425 Ireland 34 245 279 - 279
Hutchison Telecommunications Hong Kong Holdings 100 175 275 - 275
Corporate and Others - 1 1 3 4
807 4,084 4,891 3 4,894
Revenuerecognised at recognised from other
a point in time over time Subtotal sources TotalEUR million EUR million EUR million EUR million EUR million
3 Group Europe 648 4,116 4,764 - 4,764 UK 322 952 1,274 - 1,274 Italy 142 2,182 2,324 - 2,324 Sweden 86 218 304 - 304 Denmark 10 141 151 - 151 Austria 52 365 417 - 417 Ireland 36 258 294 - 294
Hutchison Telecommunications Hong Kong Holdings 37 197 234 - 234
Corporate and Others - 4 4 11 15
685 4,317 5,002 11 5,013
(c) Contract balances related to contracts with customers within the scope of IFRS 15
Under IFRS 15, a contract asset or a contract liability is generated when either party to the contract performs, depending on the relationship between the entity’s performance and the customer’s payment. When an entity satisfies a performance obligation by transferring a promised goods or service, the entity has earned a right to consideration from the customer and, therefore, has a contract asset. When the customer performs first, for example, by prepaying its promised consideration, the entity has a contract liability. Generally, contract assets may represent conditional or unconditional rights to consideration. The right would be conditional, for example, when an entity is required first to satisfy another performance obligation in the contract before it is entitled to payment from the customer. If an entity has an unconditional right to receive consideration from the customer, the contract asset is classified as and accounted for as a receivable and presented separately from other contract assets. A right is unconditional if nothing other than the passage of time is required before payment of that consideration is due.
Further details are set out below in respect of revenue of the Company and subsidiary companies, including the disaggregation of revenue from contracts with customers within the scope of IFRS 15:
Six months ended 30 June 2021
Six months ended 30 June 2020
Revenue from contracts with customers
Revenue from contracts with customers
CKHGT 2021 Interim Results Financial Statements
Page 19 of 61

4 Revenue (continued)
(c) Contract balances related to contracts with customers within the scope of IFRS 15 (continued)
The following table provides information about trade receivables, contract assets and contract liabilities from contracts with customerswithin the scope of IFRS 15.
30 June 31 December2021 2020
EUR million EUR million
Trade receivables (see note 18) 1,024 1,137 Contract assets (see notes 16 and 18) 836 947 Contract liabilities (see note 21) (398) (328)
5 Operating segment information
(a) Description of segments and basis of presentation of segment information
Corporate and Others is presented to reconcile to the totals included in the Group’s income statement and statement of financial position, which covers the activities of other areas of the Group that are not presented separately, and includes centralised procurement, corporate head office operations and the returns earned on the Group’s holdings of cash and cash equivalents.
Saved as disclosed in the notes below, the column headed as Company and Subsidiaries refers to the holding company of the Groupand subsidiary companies’ respective items and the column headed as JV refers to the Group’s share of joint ventures’ respective items.
Contract assets primarily relate to the Group’s rights to consideration for delivered services and devices but not billed at the reporting date. Contract assets are transferred to receivables when the rights become unconditional. This usually occurs when the Group issues an invoice to the customer. Contract liabilities primarily relate to the Group’s unfulfilled performance obligations for which consideration has been received at the reporting date. On fulfilment of its obligations, the contract liability is recognised in revenue in the period when the performance obligations are fulfilled.
The Group manages its businesses by divisions, which are organised by geography. In a manner consistent with the way in which information is reported internally to the Group’s most senior executive management and board of directors for the purposes of making decisions about resource allocation and performance assessment, the Group presents its operating segment information based on its telecom’s operations in Europe under 3 Group Europe (with separate sub-totals for the telecom’s operation in each of the six European countries mentioned above) and in Hong Kong and Macau of the People’s Republic of China under Hutchison Telecommunications Hong Kong Holdings. Accordingly, no separate analysis by geographical location is provided in this note.
The Group is a worldwide operator of mobile telecommunications networks, with operations spanning six European countries and Hong Kong and Macau of the People’s Republic of China. The Group’s telecom’s operations in Europe (“3 Group Europe”) launched commercial operations in 2003 and comprise mobile telecommunications businesses in the UK, Italy, Sweden, Denmark, Austria and Ireland, offering mobile telecommunications services. The Group’s telecom’s operations in Hong Kong has operated telecom networks for over 30 years and comprise an approximately 66.09% interest in Hutchison Telecommunications Hong Kong Holdings Limited (“HTHKH”), which is listed on the Stock Exchange. HTHKH is a mobile telecommunications operator that provides services in Hong Kong and Macau of the People’s Republic of China.
In 2019, the Group has adopted the IFRS 16 “Leases” accounting standard (which relates to accounting for leases) for its statutory reporting but its management reporting has remained on the precedent lease accounting standard International Accounting Standard 17 “Leases” (“IAS 17”). The Group believes that the IAS 17 basis metrics, which are not intended to be a substitute for, or superior to, the reported metrics on a IFRS 16 basis (“Post-IFRS 16 basis”), better reflect management’s view of the Group’s underlying operational performances. IAS 17 basis metrics financial information is regularly reviewed by management and used for resource allocation, performance assessment and internal decision-making. Accordingly, segmental information is presented on a IAS 17 basis (“Pre-IFRS 16 basis”), except where indicated otherwise, together with reconciliations to the total under the Post-IFRS 16 basis. In addition, section (c) of this note sets out reconciliation from Pre-IFRS 16 basis metrics to Post-IFRS 16 basis metrics for the Group’s consolidated income statement, consolidated statement of comprehensive income, and consolidated statement of cash flows for the current and comparative periods, and the Group’s consolidated statement of financial position as at 30 June 2021 and 31 December 2020.
CKHGT 2021 Interim Results Financial Statements
Page 20 of 61
5 Operating segment information (continued)
(b) Segment results, assets and liabilities
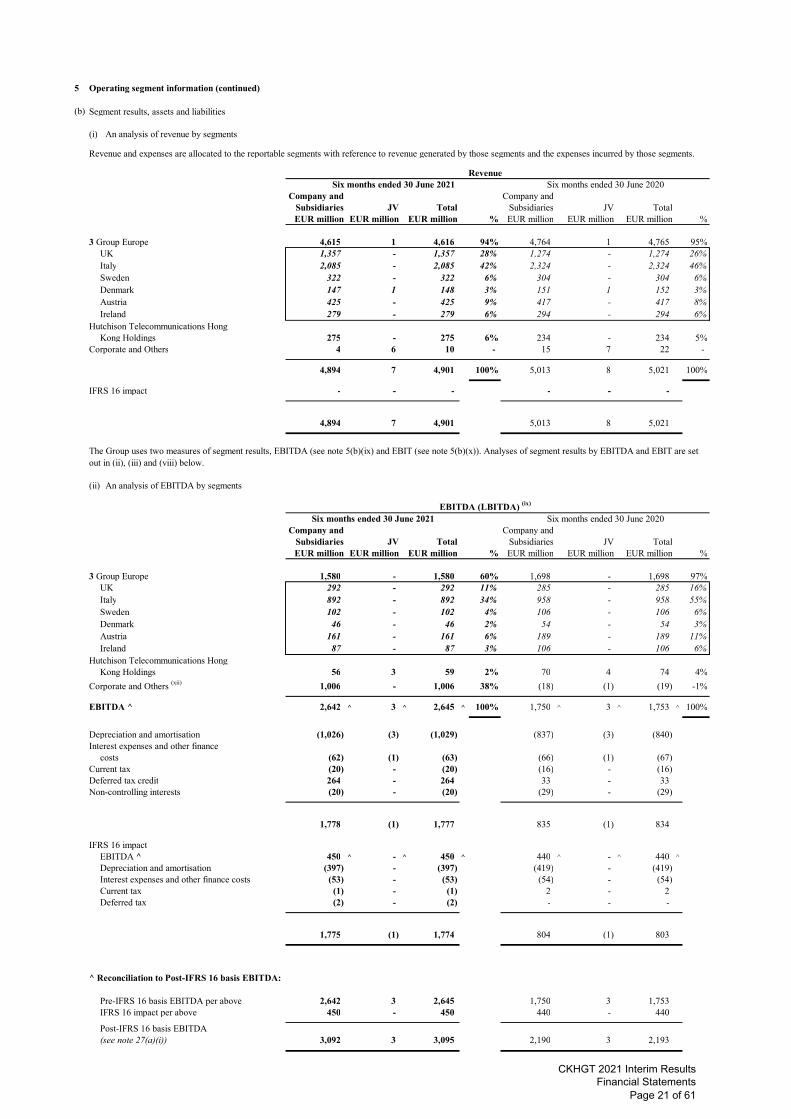
(i) An analysis of revenue by segments
Revenue and expenses are allocated to the reportable segments with reference to revenue generated by those segments and the expenses incurred by those segments.
Revenue
Company and Company andSubsidiaries JV Total Subsidiaries JV TotalEUR million EUR million EUR million % EUR million EUR million EUR million %
3 Group Europe 4,615 1 4,616 94% 4,764 1 4,765 95%UK 1,357 - 1,357 28% 1,274 - 1,274 26%Italy 2,085 - 2,085 42% 2,324 - 2,324 46%Sweden 322 - 322 6% 304 - 304 6%Denmark 147 1 148 3% 151 1 152 3%Austria 425 - 425 9% 417 - 417 8%Ireland 279 - 279 6% 294 - 294 6%
Hutchison Telecommunications Hong Kong Holdings 275 - 275 6% 234 - 234 5%
Corporate and Others 4 6 10 - 15 7 22 -
4,894 7 4,901 100% 5,013 8 5,021 100%
IFRS 16 impact - - - - - -
4,894 7 4,901 5,013 8 5,021
(ii) An analysis of EBITDA by segments
EBITDA (LBITDA) (ix)
Company and Company andSubsidiaries JV Total Subsidiaries JV TotalEUR million EUR million EUR million % EUR million EUR million EUR million %
3 Group Europe 1,580 - 1,580 60% 1,698 - 1,698 97%UK 292 - 292 11% 285 - 285 16%Italy 892 - 892 34% 958 - 958 55%Sweden 102 - 102 4% 106 - 106 6%Denmark 46 - 46 2% 54 - 54 3%Austria 161 - 161 6% 189 - 189 11%Ireland 87 - 87 3% 106 - 106 6%
Hutchison Telecommunications Hong Kong Holdings 56 3 59 2% 70 4 74 4%
Corporate and Others (xii) 1,006 - 1,006 38% (18) (1) (19) -1%
EBITDA ^ 2,642 ^ 3 ^ 2,645 ^ 100% 1,750 ^ 3 ^ 1,753 ^ 100%
Depreciation and amortisation (1,026) (3) (1,029) (837) (3) (840) Interest expenses and other finance
costs (62) (1) (63) (66) (1) (67) Current tax (20) - (20) (16) - (16) Deferred tax credit 264 - 264 33 - 33 Non-controlling interests (20) - (20) (29) - (29)
1,778 (1) 1,777 835 (1) 834
IFRS 16 impactEBITDA ^ 450 ^ - ^ 450 ^ 440 ^ - ^ 440 ^
Depreciation and amortisation (397) - (397) (419) - (419) Interest expenses and other finance costs (53) - (53) (54) - (54) Current tax (1) - (1) 2 - 2 Deferred tax (2) - (2) - - -
1,775 (1) 1,774 804 (1) 803
^ Reconciliation to Post-IFRS 16 basis EBITDA:
Pre-IFRS 16 basis EBITDA per above 2,642 3 2,645 1,750 3 1,753 IFRS 16 impact per above 450 - 450 440 - 440
Post-IFRS 16 basis EBITDA (see note 27(a)(i)) 3,092 3 3,095 2,190 3 2,193
Six months ended 30 June 2021 Six months ended 30 June 2020
Six months ended 30 June 2021 Six months ended 30 June 2020
The Group uses two measures of segment results, EBITDA (see note 5(b)(ix) and EBIT (see note 5(b)(x)). Analyses of segment results by EBITDA and EBIT are set out in (ii), (iii) and (viii) below.
CKHGT 2021 Interim Results Financial Statements
Page 21 of 61

5 Operating segment information (continued)
(b) Segment results, assets and liabilities (continued)
(iii) An analysis of EBIT by segments
EBIT (LBIT) (x)
Company and Company andSubsidiaries JV Total Subsidiaries JV TotalEUR million EUR million EUR million % EUR million EUR million EUR million %
3 Group EuropeEBITDA before the following
non-cash items: 1,580 - 1,580 1,698 - 1,698 Depreciation (569) - (569) (491) - (491) Amortisation of licence fees, other
rights, customer acquisition and retention costs (411) - (411) (300) - (300)
EBIT - 3 Group Europe 600 - 600 37% 907 - 907 99%UK 51 - 51 3% 97 - 97 10%Italy 373 - 373 23% 572 - 572 63%Sweden 45 - 45 3% 53 - 53 6%Denmark 19 - 19 1% 26 - 26 3%Austria 89 - 89 6% 114 - 114 12%Ireland 23 - 23 1% 45 - 45 5%
Hutchison Telecommunications Hong Kong Holdings 10 - 10 1% 24 1 25 3%
Corporate and Others (xii) 1,006 - 1,006 62% (18) (1) (19) -2%
EBIT ^ 1,616 ^ - ^ 1,616 ^ 100% 913 ^ - ^ 913 ^ 100%
Interest expenses and other finance costs (62) (1) (63) (66) (1) (67)
Current tax (20) - (20) (16) - (16) Deferred tax credit 264 - 264 33 - 33 Non-controlling interests (20) - (20) (29) - (29)
1,778 (1) 1,777 835 (1) 834
IFRS 16 impactEBIT ^ 53 ^ - ^ 53 ^ 21 ^ - ^ 21 ^
Interest expenses and other finance costs (53) - (53) (54) - (54)
Current tax (1) - (1) 2 - 2 Deferred tax (2) - (2) - - -
1,775 (1) 1,774 804 (1) 803
^ Reconciliation to Post-IFRS 16 basis EBIT:
Pre-IFRS 16 basis EBIT per above 1,616 - 1,616 913 - 913 IFRS 16 impact per above 53 - 53 21 - 21
Post-IFRS 16 basis EBIT 1,669 - 1,669 934 - 934
Six months ended 30 June 2021 Six months ended 30 June 2020
CKHGT 2021 Interim Results Financial Statements
Page 22 of 61
5 Operating segment information (continued)
(b) Segment results, assets and liabilities (continued)
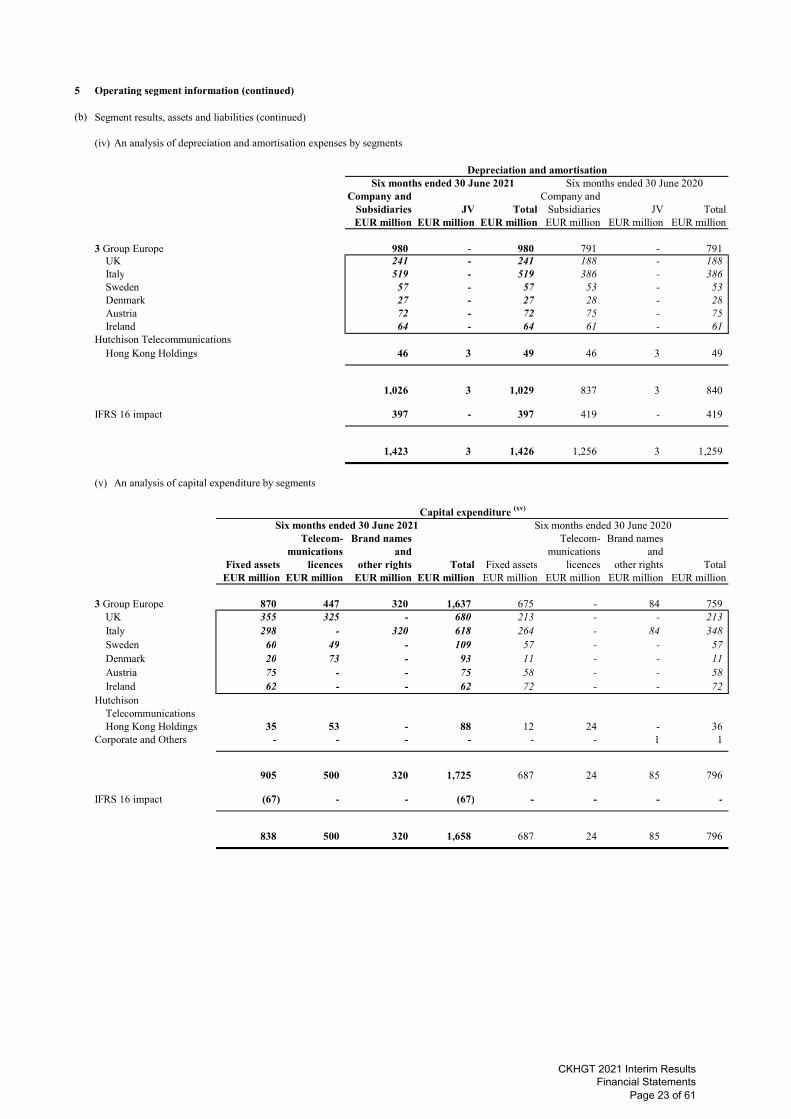
(iv) An analysis of depreciation and amortisation expenses by segments
Company and Company andSubsidiaries JV Total Subsidiaries JV TotalEUR million EUR million EUR million EUR million EUR million EUR million
3 Group Europe 980 - 980 791 - 791 UK 241 - 241 188 - 188 Italy 519 - 519 386 - 386 Sweden 57 - 57 53 - 53 Denmark 27 - 27 28 - 28 Austria 72 - 72 75 - 75 Ireland 64 - 64 61 - 61
Hutchison Telecommunications Hong Kong Holdings 46 3 49 46 3 49
1,026 3 1,029 837 3 840
IFRS 16 impact 397 - 397 419 - 419
1,423 3 1,426 1,256 3 1,259
(v) An analysis of capital expenditure by segments
Telecom- Brand names Telecom- Brand namesmunications and munications and
Fixed assets licences other rights Total Fixed assets licences other rights TotalEUR million EUR million EUR million EUR million EUR million EUR million EUR million EUR million
3 Group Europe 870 447 320 1,637 675 - 84 759 UK 355 325 - 680 213 - - 213 Italy 298 - 320 618 264 - 84 348 Sweden 60 49 - 109 57 - - 57 Denmark 20 73 - 93 11 - - 11 Austria 75 - - 75 58 - - 58 Ireland 62 - - 62 72 - - 72
Hutchison TelecommunicationsHong Kong Holdings 35 53 - 88 12 24 - 36
Corporate and Others - - - - - - 1 1
905 500 320 1,725 687 24 85 796
IFRS 16 impact (67) - - (67) - - - -
838 500 320 1,658 687 24 85 796
Six months ended 30 June 2020Six months ended 30 June 2021
Depreciation and amortisationSix months ended 30 June 2021 Six months ended 30 June 2020
Capital expenditure (xv)
CKHGT 2021 Interim Results Financial Statements
Page 23 of 61

5 Operating segment information (continued)
(b) Segment results, assets and liabilities (continued)
(vi) An analysis of total assets by segments
30 June 2021 31 December 2020EUR million EUR million
Segment assets (xiii)
3 Group Europe 33,354 35,236
UK 7,307 6,460
Italy 19,690 22,379
Sweden 1,974 1,942
Denmark 462 458
Austria 2,255 2,304
Ireland 1,666 1,693
Hutchison Telecommunications Hong Kong Holdings 1,713 1,654
Corporate and Others 6,006 3,225
41,073 40,115
IFRS 16 impact on segment assets 2,059 2,367
Interests in joint ventures 33 33
Deferred tax assets 2,108 1,784
Assets classified as held for sale (xiv) - 132
Total assets 45,273 44,431
(vii) An analysis of total liabilities by segments30 June 2021 31 December 2020EUR million EUR million
Segment liabilities (xiii)
3 Group Europe 4,021 4,158
UK 894 1,088
Italy 2,440 2,350
Sweden 107 105
Denmark 101 143
Austria 272 267
Ireland 207 205
Hutchison Telecommunications Hong Kong Holdings 167 175
Corporate and Others 249 468
4,437 4,801
IFRS 16 impact on segment liabilities 2,275 2,521
Current and non-current borrowings and other non-current liabilities 10,195 10,863
Current and deferred tax liabilities 61 95
Liabilities directly associated with assets classified as held for sale (xiv) - 30
Total liabilities 16,968 18,310
CKHGT 2021 Interim Results Financial Statements
Page 24 of 61
5 Operating segment information (continued)
(b) Segment results, assets and liabilities (continued)
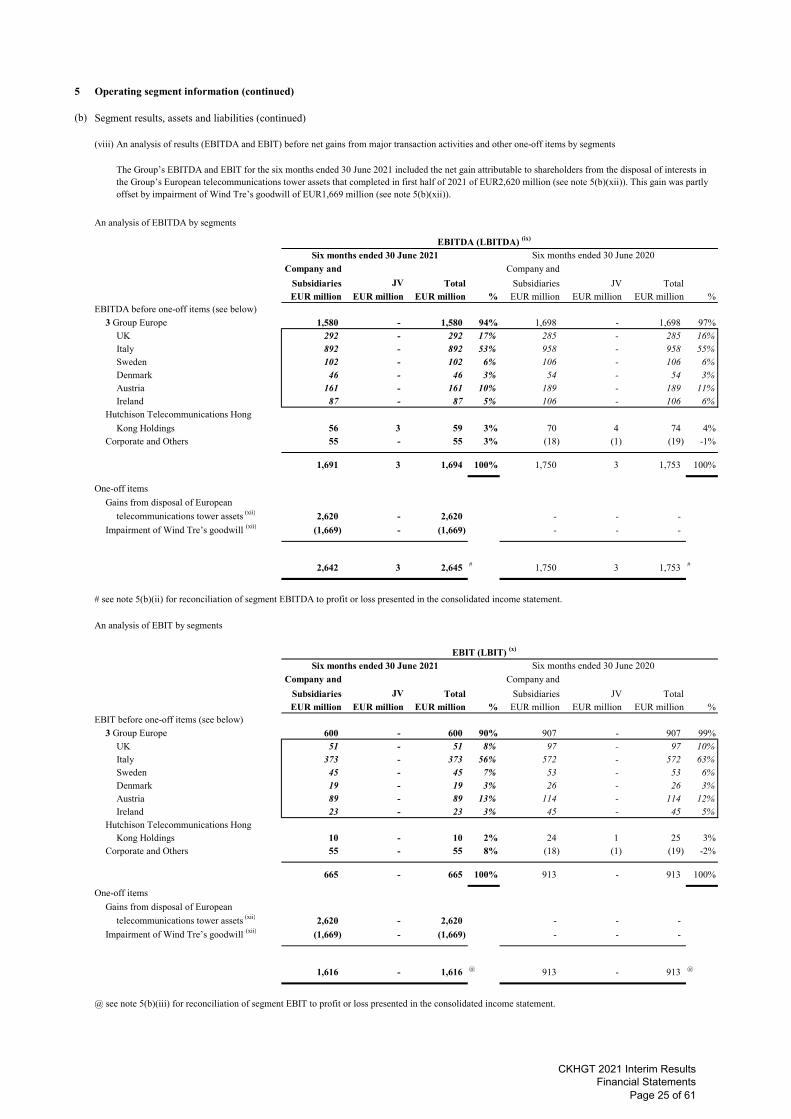
(viii) An analysis of results (EBITDA and EBIT) before net gains from major transaction activities and other one-off items by segments
An analysis of EBITDA by segments
EBITDA (LBITDA) (ix)
Six months ended 30 June 2021 Six months ended 30 June 2020
Company and Company and
Subsidiaries JV Total Subsidiaries JV TotalEUR million EUR million EUR million % EUR million EUR million EUR million %
EBITDA before one-off items (see below)
3 Group Europe 1,580 - 1,580 94% 1,698 - 1,698 97%UK 292 - 292 17% 285 - 285 16%Italy 892 - 892 53% 958 - 958 55%Sweden 102 - 102 6% 106 - 106 6%Denmark 46 - 46 3% 54 - 54 3%Austria 161 - 161 10% 189 - 189 11%Ireland 87 - 87 5% 106 - 106 6%
Hutchison Telecommunications Hong
Kong Holdings 56 3 59 3% 70 4 74 4%Corporate and Others 55 - 55 3% (18) (1) (19) -1%
1,691 3 1,694 100% 1,750 3 1,753 100%
One-off items
Gains from disposal of European
telecommunications tower assets (xii) 2,620 - 2,620 - - -
Impairment of Wind Tre’s goodwill (xii) (1,669) - (1,669) - - -
2,642 3 2,645 # 1,750 3 1,753 #
# see note 5(b)(ii) for reconciliation of segment EBITDA to profit or loss presented in the consolidated income statement.
An analysis of EBIT by segments
EBIT (LBIT) (x)
Six months ended 30 June 2021 Six months ended 30 June 2020
Company and Company and
Subsidiaries JV Total Subsidiaries JV TotalEUR million EUR million EUR million % EUR million EUR million EUR million %
EBIT before one-off items (see below)
3 Group Europe 600 - 600 90% 907 - 907 99%UK 51 - 51 8% 97 - 97 10%Italy 373 - 373 56% 572 - 572 63%Sweden 45 - 45 7% 53 - 53 6%Denmark 19 - 19 3% 26 - 26 3%Austria 89 - 89 13% 114 - 114 12%Ireland 23 - 23 3% 45 - 45 5%
Hutchison Telecommunications Hong Kong Holdings 10 - 10 2% 24 1 25 3%
Corporate and Others 55 - 55 8% (18) (1) (19) -2%
665 - 665 100% 913 - 913 100%
One-off items
Gains from disposal of European
telecommunications tower assets (xii) 2,620 - 2,620 - - -
Impairment of Wind Tre’s goodwill (xii) (1,669) - (1,669) - - -
1,616 - 1,616 @ 913 - 913 @
@ see note 5(b)(iii) for reconciliation of segment EBIT to profit or loss presented in the consolidated income statement.
The Group’s EBITDA and EBIT for the six months ended 30 June 2021 included the net gain attributable to shareholders from the disposal of interests in the Group’s European telecommunications tower assets that completed in first half of 2021 of EUR2,620 million (see note 5(b)(xii)). This gain was partly offset by impairment of Wind Tre’s goodwill of EUR1,669 million (see note 5(b)(xii)).
CKHGT 2021 Interim Results Financial Statements
Page 25 of 61

5 Operating segment information (continued)
(b) Segment results, assets and liabilities (continued)
(ix) EBITDA (LBITDA) represents the EBITDA (LBITDA) of the Company and subsidiary companies as well as the Group’s share of the EBITDA (LBITDA) of joint ventures. EBITDA (LBITDA) is defined as earnings (losses) before interest expenses and other finance costs, tax, depreciation and amortisation. Information concerning EBITDA (LBITDA) has been included in the Group’sfinancial information and consolidated financial statements and is used by many industries and investors as one measure of grosscash flow generation. The Group considers EBITDA (LBITDA) to be an important performance measure which is used in the Group’s internal financial and management reporting to monitor business performance. EBITDA (LBITDA) is therefore presentedas a measure of segment results in accordance with IFRS 8. EBITDA (LBITDA) is not a measure of cash liquidity or financialperformance under IFRS and the EBITDA (LBITDA) measures used by the Group may not be comparable to other similarly titledmeasures of other companies. EBITDA (LBITDA) should not necessarily be construed as an alternative to cash flows or resultsfrom operations as determined in accordance with IFRS.
(x) EBIT (LBIT) represents the EBIT (LBIT) of the Company and subsidiary companies as well as the Group’s share of the EBIT (LBIT) of joint ventures. EBIT (LBIT) is defined as earnings (losses) before interest expenses and other finance costs and tax. Information concerning EBIT (LBIT) has been included in the Group’s financial information and consolidated financial statements and is used by many industries and investors as one measure of results from operations. The Group considers EBIT (LBIT) to be an important performance measure which is used in the Group’s internal financial and management reporting to monitor business performance. EBIT (LBIT) is therefore presented as a measure of segment results in accordance with IFRS 8. EBIT (LBIT) is not a measure of financial performance under IFRS and the EBIT (LBIT) measures used by the Group may not be comparable to other similarly titled measures of other companies. EBIT (LBIT) should not necessarily be construed as an alternative to results from operations as determined in accordance with IFRS.
(xi) The Company is a limited company incorporated in the Cayman Islands. The Group does not have any revenue and non-currentassets (other than financial instruments, deferred tax assets and post-employment benefit assets) attributable to the Cayman Islands.The geographical location of customers is based on the location at which the services were provided or goods delivered.
(xii)
(xiii) Segment assets and segment liabilities are measured in the same way as in the financial statements.
Segment assets are assets other than deferred tax assets, assets classified as held for sale and interests in joint ventures.
Segment liabilities are liabilities other than bank and other debts, tax liabilities (including deferred tax liabilities), liabilities directly associated with assets classified as held for sale and other non-current liabilities.
The specified non-current assets are non-current assets other than financial instruments, deferred tax assets and post-employment benefit assets. The geographical location of the specified non-current assets is based on the physical location of the asset (for fixed assets, right-of-use assets and other operating assets), the location of the operation in which they are allocated (for assets classified as held for sale, intangible assets and goodwill), and the location of operations (for interests in joint ventures).
Geographical analysis of the Group’s non-current assets (based on Post-IFRS 16 basis) other than financial instruments, deferredtax assets and post-employment benefit assets is as follows:
30 June 31 December2021 2020
EUR million EUR million
Hong Kong and Macau, the People’s Republic of China 1,101 1,031 UK 7,131 6,256 Italy 18,831 22,016 Sweden 1,911 1,877 Denmark 439 374 Austria 2,151 2,149 Ireland 1,728 1,721 Others 6 3
33,298 35,427
(xiv) See note 19.
(xv) For the purpose of segmental information analysis, expenditures incurred for leases are not regarded as capital expenditures.
Included in the current period balance are disposal gains of EUR2,620 million (EUR2,626 million at Post-IFRS 16 basis) arising from disposal of interests in telecommunications tower assets in Sweden and Italy completed in January and June 2021 respectively and an impairment charge of EUR1,669 million (EUR1,669 million at Post-IFRS 16 basis) against Wind Tre’s goodwill. Both amounts are at EBITDA and EBIT levels and are reported under “Corporate and Others” in the segment results. In the consolidated income statement, the disposal gains are reported in “Other income and gains” and the impairment charge is reported under “Other expenses and losses”. See notes 6(c) and 13.
CKHGT 2021 Interim Results Financial Statements
Page 26 of 61

5 Operating segment information (continued)
(c) Reconciliation from Pre-IFRS 16 basis metrics to Post-IFRS 16 basis metrics
(i) Consolidated income statement
Six months ended 30 June 2020Pre- Effect on Post- Pre- Effect on Post-
IFRS 16 adoption of IFRS 16 IFRS 16 adoption of IFRS 16 basis IFRS 16 basis basis IFRS 16 basis
EUR million EUR million EUR million EUR million EUR million EUR million
Revenue 4,894 - 4,894 5,013 - 5,013 Cost of inventories sold (152) - (152) (51) - (51) Expensed customer acquisition and retention costs (868) 25 (843) (860) 25 (835) Staff costs (349) - (349) (352) - (352) Depreciation and amortisation (1,026) (397) (1,423) (837) (419) (1,256) Other expenses and losses (3,534) 419 (3,115) (2,017) 415 (1,602) Other income and gains 2,651 6 2,657 17 - 17 Share of profits less losses of joint ventures (1) - (1) (1) - (1)
1,615 53 1,668 912 21 933 Interest expenses and other finance costs (62) (53) (115) (66) (54) (120)
Profit before tax 1,553 - 1,553 846 (33) 813 Current tax (20) (1) (21) (16) 2 (14) Deferred tax credit 264 (2) 262 33 - 33
Profit after tax 1,797 (3) 1,794 863 (31) 832
Profit attributable to non-controlling interests (20) - (20) (29) - (29)
Profit attributable to owners of the Company 1,777 (3) 1,774 834 (31) 803
(ii) Consolidated statement of comprehensive income
Six months ended 30 June 2020Pre- Effect on Post- Pre- Effect on Post-
IFRS 16 adoption of IFRS 16 IFRS 16 adoption of IFRS 16 basis IFRS 16 basis basis IFRS 16 basis
EUR million EUR million EUR million EUR million EUR million EUR million
Profit after tax 1,797 (3) 1,794 863 (31) 832
Other comprehensive income (losses)
Items that will not be reclassified to profit or loss - - - - - -
Items that may be reclassified to profit or lossGain on cash flow hedges recognised directly in reserves 19 - 19 2 - 2 Gains (losses) on translating overseas subsidiaries’ net assets
recognised directly in reserves 352 (3) 349 (342) 2 (340) Losses previously in exchange reserve related to subsidiaries
disposed during the period recognised in income statement 31 - 31 - - - Tax relating to items that may be reclassified to profit or loss - - - - - -
402 (3) 399 (340) 2 (338)
Other comprehensive income (losses), net of tax 402 (3) 399 (340) 2 (338)
Total comprehensive income 2,199 (6) 2,193 523 (29) 494
Total comprehensive income attributable to non-controlling interests (30) - (30) (19) - (19) - - - -
Total comprehensive income attributable to owners of the Company 2,169 (6) 2,163 504 (29) 475
Six months ended 30 June 2021
Six months ended 30 June 2021
CKHGT 2021 Interim Results Financial Statements
Page 27 of 61

5 Operating segment information (continued)
(c) Reconciliation from Pre-IFRS 16 basis metrics to Post-IFRS 16 basis metrics (continued)
(iii) Consolidated statement of financial position
Pre- Effect on Post- Pre- Effect on Post-IFRS 16 adoption of IFRS 16 IFRS 16 adoption of IFRS 16
basis IFRS 16 basis basis IFRS 16 basisEUR million EUR million EUR million EUR million EUR million EUR million
Non-current assetsFixed assets 7,361 (79) 7,282 7,414 (14) 7,400 Right-of-use assets - 2,199 2,199 - 2,438 2,438 Telecommunications licences 7,323 - 7,323 6,760 - 6,760 Brand names and other rights 4,051 - 4,051 3,941 (33) 3,908 Goodwill 11,626 - 11,626 14,080 - 14,080 Interests in joint ventures 33 - 33 33 - 33 Deferred tax assets 2,092 16 2,108 1,767 17 1,784 Other non-current assets 779 19 798 788 25 813
33,265 2,155 35,420 34,783 2,433 37,216 Current assetsCash and cash equivalents 6,549 - 6,549 3,752 - 3,752 Inventories 183 - 183 182 - 182 Trade receivables and other current assets 3,201 (80) 3,121 3,198 (49) 3,149
9,933 (80) 9,853 7,132 (49) 7,083 Assets classified as held for sale - - - 103 29 132
9,933 (80) 9,853 7,235 (20) 7,215 Current liabilities Bank and other debts 609 (5) 604 1 (1) - Current tax liabilities 34 - 34 68 (1) 67 Lease liabilities - 693 693 - 662 662 Trade payables and other current liabilities 4,365 (159) 4,206 4,726 (160) 4,566
5,008 529 5,537 4,795 500 5,295 Liabilities directly associated with assets classified as held for sale - - - - 30 30
5,008 529 5,537 4,795 530 5,325 Net current assets 4,925 (609) 4,316 2,440 (550) 1,890 Total assets less current liabilities 38,190 1,546 39,736 37,223 1,883 39,106 Non-current liabilitiesBank and other debts 7,800 (54) 7,746 8,944 (2) 8,942 Lease liabilities - 1,741 1,741 - 2,019 2,019 Deferred tax liabilities 27 - 27 28 - 28 Pension obligations 72 - 72 75 - 75 Other non-current liabilities 1,847 (2) 1,845 1,922 (1) 1,921
9,746 1,685 11,431 10,969 2,016 12,985
Net assets 28,444 (139) 28,305 26,254 (133) 26,121
Capital and reservesShare capital - - - - - - Share premium 20,917 - 20,917 20,917 - 20,917 Reserves 6,324 (137) 6,187 4,155 (131) 4,024 Equity attributable to owners of the Company 27,241 (137) 27,104 25,072 (131) 24,941 Non-controlling interests 1,203 (2) 1,201 1,182 (2) 1,180
Total equity 28,444 (139) 28,305 26,254 (133) 26,121
30 June 2021 31 December 2020
CKHGT 2021 Interim Results Financial Statements
Page 28 of 61
5 Operating segment information (continued)
(c) Reconciliation from Pre-IFRS 16 basis metrics to Post-IFRS 16 basis metrics (continued)
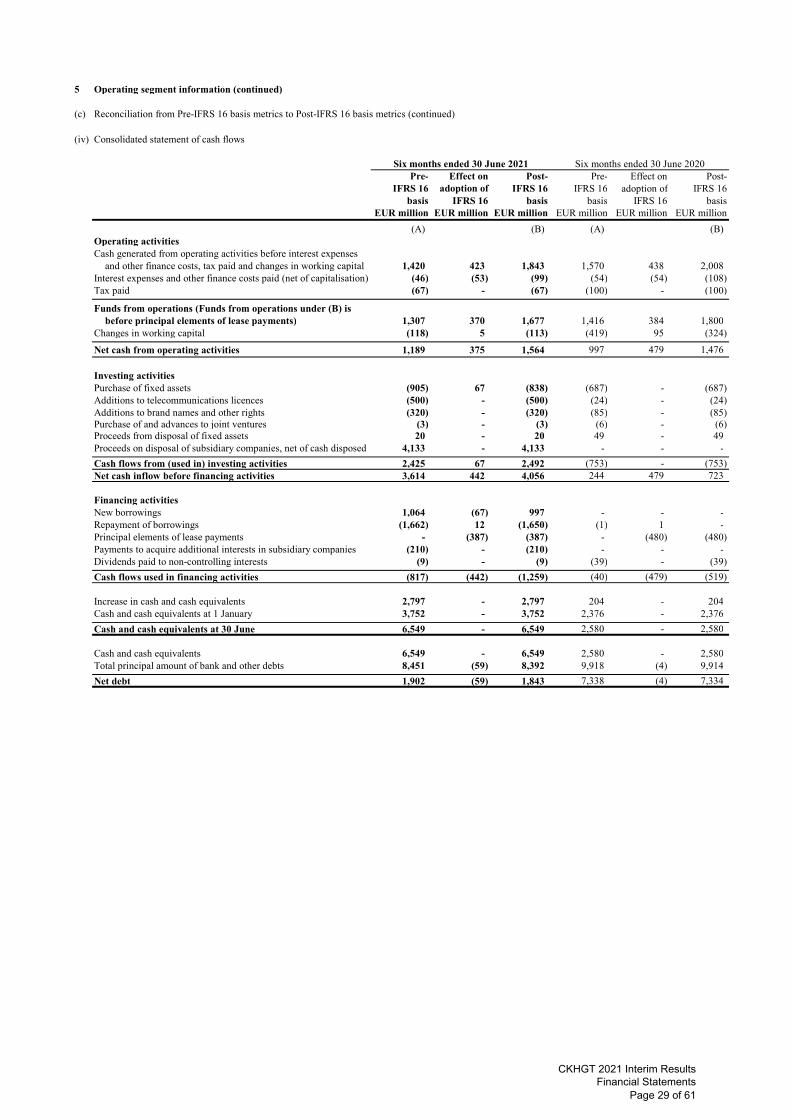
(iv) Consolidated statement of cash flows
Six months ended 30 June 2020Pre- Effect on Post- Pre- Effect on Post-
IFRS 16 adoption of IFRS 16 IFRS 16 adoption of IFRS 16 basis IFRS 16 basis basis IFRS 16 basis
EUR million EUR million EUR million EUR million EUR million EUR million
(A) (B) (A) (B)Operating activitiesCash generated from operating activities before interest expenses
and other finance costs, tax paid and changes in working capital 1,420 423 1,843 1,570 438 2,008 Interest expenses and other finance costs paid (net of capitalisation) (46) (53) (99) (54) (54) (108) Tax paid (67) - (67) (100) - (100)
Funds from operations (Funds from operations under (B) is before principal elements of lease payments) 1,307 370 1,677 1,416 384 1,800
Changes in working capital (118) 5 (113) (419) 95 (324)
Net cash from operating activities 1,189 375 1,564 997 479 1,476
Investing activitiesPurchase of fixed assets (905) 67 (838) (687) - (687) Additions to telecommunications licences (500) - (500) (24) - (24) Additions to brand names and other rights (320) - (320) (85) - (85) Purchase of and advances to joint ventures (3) - (3) (6) - (6) Proceeds from disposal of fixed assets 20 - 20 49 - 49 Proceeds on disposal of subsidiary companies, net of cash disposed 4,133 - 4,133 - - -
Cash flows from (used in) investing activities 2,425 67 2,492 (753) - (753) Net cash inflow before financing activities 3,614 442 4,056 244 479 723
Financing activitiesNew borrowings 1,064 (67) 997 - - - Repayment of borrowings (1,662) 12 (1,650) (1) 1 - Principal elements of lease payments - (387) (387) - (480) (480) Payments to acquire additional interests in subsidiary companies (210) - (210) - - - Dividends paid to non-controlling interests (9) - (9) (39) - (39)
Cash flows used in financing activities (817) (442) (1,259) (40) (479) (519)
Increase in cash and cash equivalents 2,797 - 2,797 204 - 204 Cash and cash equivalents at 1 January 3,752 - 3,752 2,376 - 2,376
Cash and cash equivalents at 30 June 6,549 - 6,549 2,580 - 2,580
Cash and cash equivalents 6,549 - 6,549 2,580 - 2,580 Total principal amount of bank and other debts 8,451 (59) 8,392 9,918 (4) 9,914
Net debt 1,902 (59) 1,843 7,338 (4) 7,334
Six months ended 30 June 2021
CKHGT 2021 Interim Results Financial Statements
Page 29 of 61

6 Presentation of other expenses and losses, other income and gains and cost of goods sold
2021 2020EUR million EUR million
Other expenses and losses:
Cost of providing services (a) 1,001 1,009 Office and general administrative expenses and others 235 398
Advertising and promotion expenses 126 98
Expenses for short-term and low-value assets leases (see note 10(b)) 57 66
Legal and professional fees 27 31
Goodwill impairment (see note 13) 1,669 -
3,115 1,602
2021 2020EUR million EUR million
Other income and gains:
Employment and other subsidies (b) (16) (12)
Gains on disposal of fixed assets (see note 9) (15) (5)
Gains on disposal of European telecommunications tower assets (c) (2,626) -
(2,657) (17)
2021 2020EUR million EUR million
Cost of goods sold:included in “cost of inventories sold” 152 51 included in “expensed customer acquisition and retention costs” 536 509
688 560
(a) Cost of providing services of EUR1,001 million (30 June 2020: EUR1,009 million) includes telecommunication network relatedcosts of EUR756 million (30 June 2020: EUR767 million) and repair and maintenance of EUR245 million (30 June 2020: EUR242 million).
(b) Benefits received from governments and other authorities under COVID-19 related employment and other support schemes.
(c) The amount represents gains arising from the disposal of the Group’s interests in telecommunications tower assets supporting the Group’s mobile telecommunications businesses in Sweden and Italy completed in the current period.
7 Interest expenses and other finance costs
2021 2020EUR million EUR million
Interest on borrowings 40 48 Other finance costs 7 6
47 54 Amortisation of loan facilities fees and premiums or discounts relating to debts 8 5 Unwinding of discount 8 7
63 66 Interest on lease liabilities (see note 10(b)) 52 54
115 120
This note provides additional details in respect of other expenses and losses, other income and gains and cost of goods sold. It follows the presentation format adopted in preparing the 2020 Annual Financial Statements. Accordingly, previously reported information in respect of the comparative period for these items have been reclassified to conform to this presentation.
Six months ended 30 June
Six months ended 30 June
Six months ended 30 June
Six months ended 30 June
CKHGT 2021 Interim Results Financial Statements
Page 30 of 61

8 Tax
2021 2020EUR million EUR million
Current tax chargeEurope 21 14
Deferred tax charge (credit)Europe (267) (38) Outside Europe 5 5
(262) (33)
(241) (19)
Tax has been provided for at the applicable rates on the estimated assessable profits less estimated available tax losses.
During the current period, the UK government announced that from 1 April 2023 the corporate tax rate would change from 19% to 25% which is substantively enacted for IFRS purposes. Deferred tax credit in Europe recognised during the current period includes the one-offimpacts on re-measuring the deferred tax assets balances of the operation in the UK using this new enacted tax rate.
9 Fixed assets
During the six months ended 30 June 2021, the Group has acquired fixed assets with a cost of EUR838 million (30 June 2020: EUR687 million). Fixed assets with a net book value of EUR5 million (30 June 2020: EUR44 million) were disposed of during the period, resulting in a gainof EUR15 million (30 June 2020: EUR5 million) (see note 6).
Telecom-Land and munications Otherbuildings network assets assets Total
EUR million EUR million EUR million EUR millionAt 31 December 2020Cost 112 7,399 3,341 10,852 Accumulated depreciation and impairment (69) (2,600) (783) (3,452)
43 4,799 2,558 7,400
Six months ended 30 June 2021Opening net book value 43 4,799 2,558 7,400 Additions 3 90 745 838 Disposals - (3) (2) (5) Relating to subsidiaries disposed (see note 27(c)) (11) (505) (5) (521) Depreciation charge for the period (4) (452) (130) (586) Transfer between categories - 554 (554) - Exchange translation differences - 62 94 156
Closing net book value 31 4,545 2,706 7,282
At 30 June 2021Cost 108 7,159 3,643 10,910 Accumulated depreciation and impairment (77) (2,614) (937) (3,628)
31 4,545 2,706 7,282
Six months ended 30 June
CKHGT 2021 Interim Results Financial Statements
Page 31 of 61

10 Leases
(a) Group as a lessee - amounts recognised in the consolidated statement of financial position30 June 31 December
2021 2020EUR million EUR million
Right-of-use assetsRetail stores 182 168 Telecommunications network infrastructure sites 1,812 2,109 Other assets 205 161
2,199 2,438
Lease liabilitiesCurrent 693 662 Non-current 1,741 2,019
2,434 2,681
During the six months ended 30 June 2021, the Group entered into new lease agreements. For these new leases, the Group is required tomake fixed monthly payments. On leases that commenced during the six months ended 30 June 2021, the Group has recognisedEUR585 million (30 June 2020: EUR258 million) of right-of-use assets, and EUR585 million (30 June 2020: EUR258 million) of lease liabilities.
(b) Group as a lessee - amounts recognised in the consolidated income statement
2021 2020EUR million EUR million
Expenses relating to short-term leases (included in “Other expenses and losses”) 2 1 Expense relating to leases of low-value assets that are not short term leases
(included in “Other expenses and losses”) 55 65
57 66
Depreciation charge of right-of-use assets (included in “Depreciation and amortisation”) 401 421 Interest on lease liabilities (included in “Interest expenses and other finance costs”) 52 54
Total charges recognised in profit or loss for leases 510 541
Six months ended 30 June
CKHGT 2021 Interim Results Financial Statements
Page 32 of 61

11 Telecommunications licences
The Group’s telecommunications licences in the UK and Italy (except for a licence with carrying value at 30 June 2021 of EUR7 million (31 December 2020: EUR14 million)) are considered to have an indefinite useful life. As at 30 June 2021, telecommunications licences with indefinite useful life in the UK and Italy with a carrying value of EUR2,341 million (31 December 2020: EUR1,901 million) and EUR3,919 million (31 December 2020: EUR3,919 million) have been allocated to the operation in the UK and Italy respectively.
EUR millionAt 31 December 2020Cost 7,283 Accumulated amortisation (523)
6,760
Six months ended 30 June 2021Opening net book value 6,760 Additions 500 Amortisation for the period (59) Exchange translation differences 122
Closing net book value 7,323
At 30 June 2021Cost 7,896 Accumulated amortisation (573)
7,323
12 Brand names and other rights
During the six months ended 30 June 2021, the Group has acquired brand names and other rights with a cost of EUR320 million (30 June 2020: EUR85 million).
Brand names are considered to have an indefinite useful life. The carrying value of brand names at 30 June 2021 of EUR844 million (31 December 2020: EUR844 million), EUR579 million (31 December 2020: EUR547 million) and EUR286 million (31 December 2020: EUR286 million) has been allocated to the operation in Italy, the UK, and Austria, respectively.
Brand names Other rights TotalEUR million EUR million EUR million
At 31 December 2020Cost 2,096 2,716 4,812 Accumulated amortisation - (904) (904)
2,096 1,812 3,908
Six months ended 30 June 2021Opening net book value 2,096 1,812 3,908 Additions - 320 320 Amortisation for the period - (175) (175) Relating to subsidiaries disposed (see note 27(c)) - (36) (36) Exchange translation differences 33 1 34
Closing net book value 2,129 1,922 4,051
At 30 June 2021Cost 2,129 3,005 5,134 Accumulated amortisation - (1,083) (1,083)
2,129 1,922 4,051
During the six months ended 30 June 2021, the Group has acquired telecommunications licences with a cost of EUR500 million (30 June 2020: EUR24 million).
Other rights primarily include operating, service content and connection rights of EUR1,055 million (31 December 2020: EUR869 million) and customer lists of EUR867 million (31 December 2020: EUR943 million). Other rights are amortised over their finite useful lives.
CKHGT 2021 Interim Results Financial Statements
Page 33 of 61
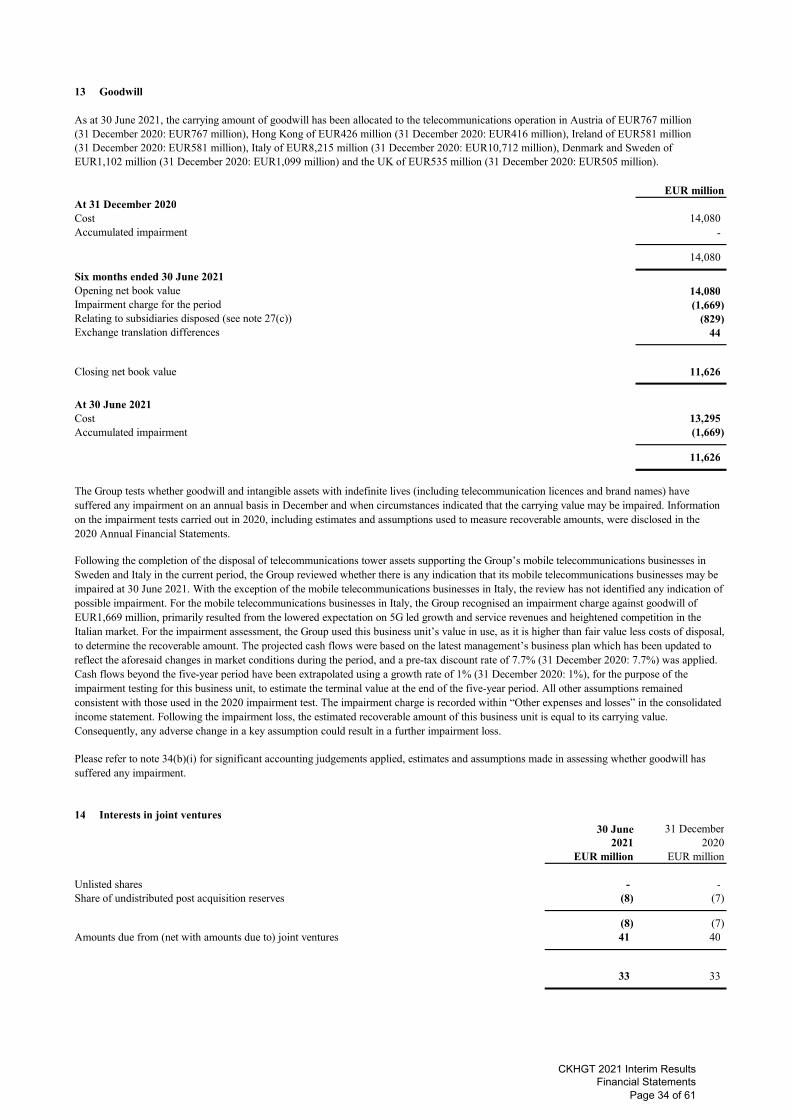
13 Goodwill
As at 30 June 2021, the carrying amount of goodwill has been allocated to the telecommunications operation in Austria of EUR767 million (31 December 2020: EUR767 million), Hong Kong of EUR426 million (31 December 2020: EUR416 million), Ireland of EUR581 million (31 December 2020: EUR581 million), Italy of EUR8,215 million (31 December 2020: EUR10,712 million), Denmark and Sweden of EUR1,102 million (31 December 2020: EUR1,099 million) and the UK of EUR535 million (31 December 2020: EUR505 million).
EUR millionAt 31 December 2020Cost 14,080 Accumulated impairment -
14,080
Six months ended 30 June 2021Opening net book value 14,080 Impairment charge for the period (1,669) Relating to subsidiaries disposed (see note 27(c)) (829) Exchange translation differences 44
Closing net book value 11,626
At 30 June 2021Cost 13,295 Accumulated impairment (1,669)
11,626
14 Interests in joint ventures30 June 31 December
2021 2020EUR million EUR million
Unlisted shares - - Share of undistributed post acquisition reserves (8) (7)
(8) (7) Amounts due from (net with amounts due to) joint ventures 41 40
33 33
The Group tests whether goodwill and intangible assets with indefinite lives (including telecommunication licences and brand names) have suffered any impairment on an annual basis in December and when circumstances indicated that the carrying value may be impaired. Information on the impairment tests carried out in 2020, including estimates and assumptions used to measure recoverable amounts, were disclosed in the 2020 Annual Financial Statements.
Following the completion of the disposal of telecommunications tower assets supporting the Group’s mobile telecommunications businesses in Sweden and Italy in the current period, the Group reviewed whether there is any indication that its mobile telecommunications businesses may be impaired at 30 June 2021. With the exception of the mobile telecommunications businesses in Italy, the review has not identified any indication of possible impairment. For the mobile telecommunications businesses in Italy, the Group recognised an impairment charge against goodwill of EUR1,669 million, primarily resulted from the lowered expectation on 5G led growth and service revenues and heightened competition in the Italian market. For the impairment assessment, the Group used this business unit’s value in use, as it is higher than fair value less costs of disposal, to determine the recoverable amount. The projected cash flows were based on the latest management’s business plan which has been updated to reflect the aforesaid changes in market conditions during the period, and a pre-tax discount rate of 7.7% (31 December 2020: 7.7%) was applied. Cash flows beyond the five-year period have been extrapolated using a growth rate of 1% (31 December 2020: 1%), for the purpose of the impairment testing for this business unit, to estimate the terminal value at the end of the five-year period. All other assumptions remained consistent with those used in the 2020 impairment test. The impairment charge is recorded within “Other expenses and losses” in the consolidated income statement. Following the impairment loss, the estimated recoverable amount of this business unit is equal to its carrying value. Consequently, any adverse change in a key assumption could result in a further impairment loss.
Please refer to note 34(b)(i) for significant accounting judgements applied, estimates and assumptions made in assessing whether goodwill has suffered any impairment.
CKHGT 2021 Interim Results Financial Statements
Page 34 of 61
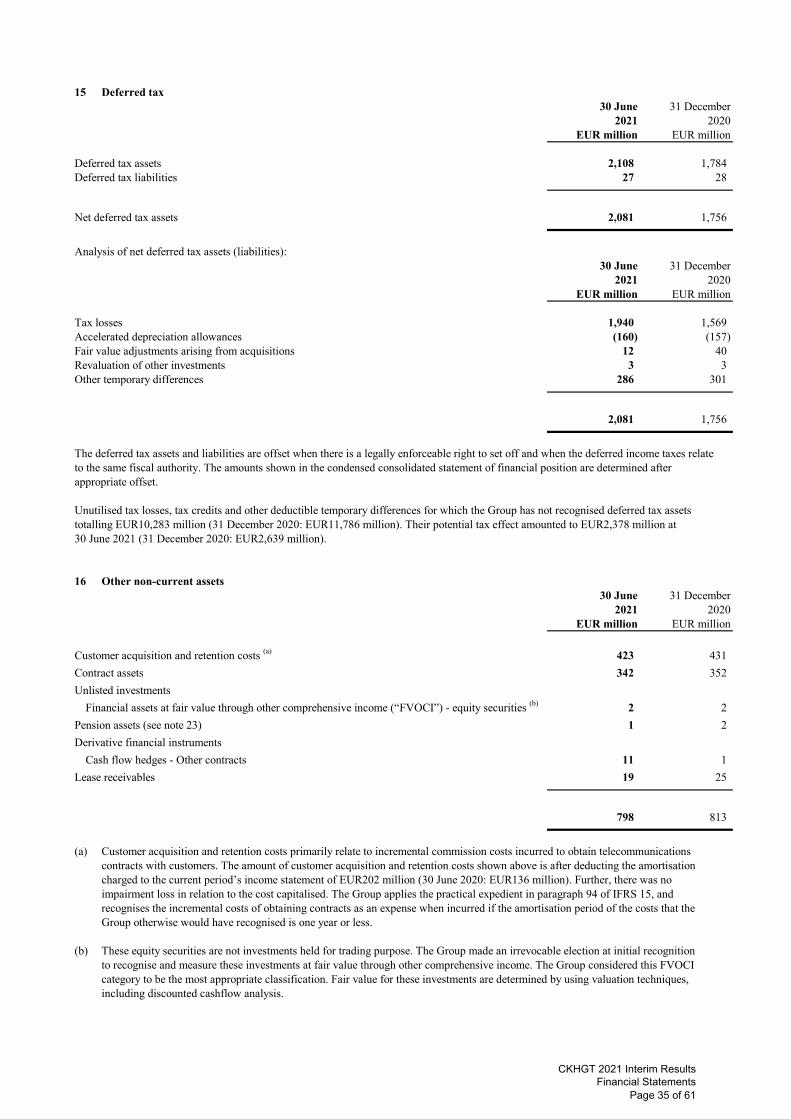
15 Deferred tax30 June 31 December
2021 2020EUR million EUR million
Deferred tax assets 2,108 1,784 Deferred tax liabilities 27 28
Net deferred tax assets 2,081 1,756
Analysis of net deferred tax assets (liabilities):30 June 31 December
2021 2020EUR million EUR million
Tax losses 1,940 1,569 Accelerated depreciation allowances (160) (157) Fair value adjustments arising from acquisitions 12 40 Revaluation of other investments 3 3 Other temporary differences 286 301
2,081 1,756
The deferred tax assets and liabilities are offset when there is a legally enforceable right to set off and when the deferred income taxes relateto the same fiscal authority. The amounts shown in the condensed consolidated statement of financial position are determined after appropriate offset.
Unutilised tax losses, tax credits and other deductible temporary differences for which the Group has not recognised deferred tax assetstotalling EUR10,283 million (31 December 2020: EUR11,786 million). Their potential tax effect amounted to EUR2,378 million at 30 June 2021 (31 December 2020: EUR2,639 million).
16 Other non-current assets30 June 31 December
2021 2020EUR million EUR million
Customer acquisition and retention costs (a) 423 431
Contract assets 342 352
Unlisted investments
Financial assets at fair value through other comprehensive income (“FVOCI”) - equity securities (b) 2 2
Pension assets (see note 23) 1 2
Derivative financial instruments
Cash flow hedges - Other contracts 11 1
Lease receivables 19 25
798 813
(a) Customer acquisition and retention costs primarily relate to incremental commission costs incurred to obtain telecommunications contracts with customers. The amount of customer acquisition and retention costs shown above is after deducting the amortisation charged to the current period’s income statement of EUR202 million (30 June 2020: EUR136 million). Further, there was no impairment loss in relation to the cost capitalised. The Group applies the practical expedient in paragraph 94 of IFRS 15, and recognises the incremental costs of obtaining contracts as an expense when incurred if the amortisation period of the costs that the Group otherwise would have recognised is one year or less.
(b) These equity securities are not investments held for trading purpose. The Group made an irrevocable election at initial recognitionto recognise and measure these investments at fair value through other comprehensive income. The Group considered this FVOCIcategory to be the most appropriate classification. Fair value for these investments are determined by using valuation techniques, including discounted cashflow analysis.
CKHGT 2021 Interim Results Financial Statements
Page 35 of 61

17 Cash and cash equivalents30 June 31 December
2021 2020EUR million EUR million
Cash at bank and in hand 3,833 1,080 Short term bank deposits 2,716 2,672
6,549 3,752
The carrying amounts of cash and cash equivalents approximate their fair values.
18 Trade receivables and other current assets30 June 31 December
2021 2020EUR million EUR million
Trade receivables (a) 1,374 1,394 Less: loss allowance provision (350) (257)
1,024 1,137
Amounts due from CKHH group entities (b) - 7 Other current assets
Derivative financial instrumentsCash flow hedges - Other contracts 17 5
Contract assets 494 595 Prepayments 1,287 1,050 Other receivables 284 336 Current tax receivables 15 19
3,121 3,149
(a) Trade receivables are stated at the expected recoverable amount, net of any provision for estimated impairment losses where it is deemedthat a receivable may not be fully recoverable. The carrying amounts of these assets approximate their fair values.
At the end of the period / year, the ageing analysis of the trade receivables presented based on the invoice date, is as follows:
30 June 31 December2021 2020
EUR million EUR million
Less than 31 days 833 914 Within 31 to 60 days 65 66 Within 61 to 90 days 26 29 Over 90 days 450 385
1,374 1,394
(b) At 31 December 2020, the amounts due from CKHH group entities were trading in nature, unsecured, interest free and had no fixedterms of repayment.
CKHGT 2021 Interim Results Financial Statements
Page 36 of 61
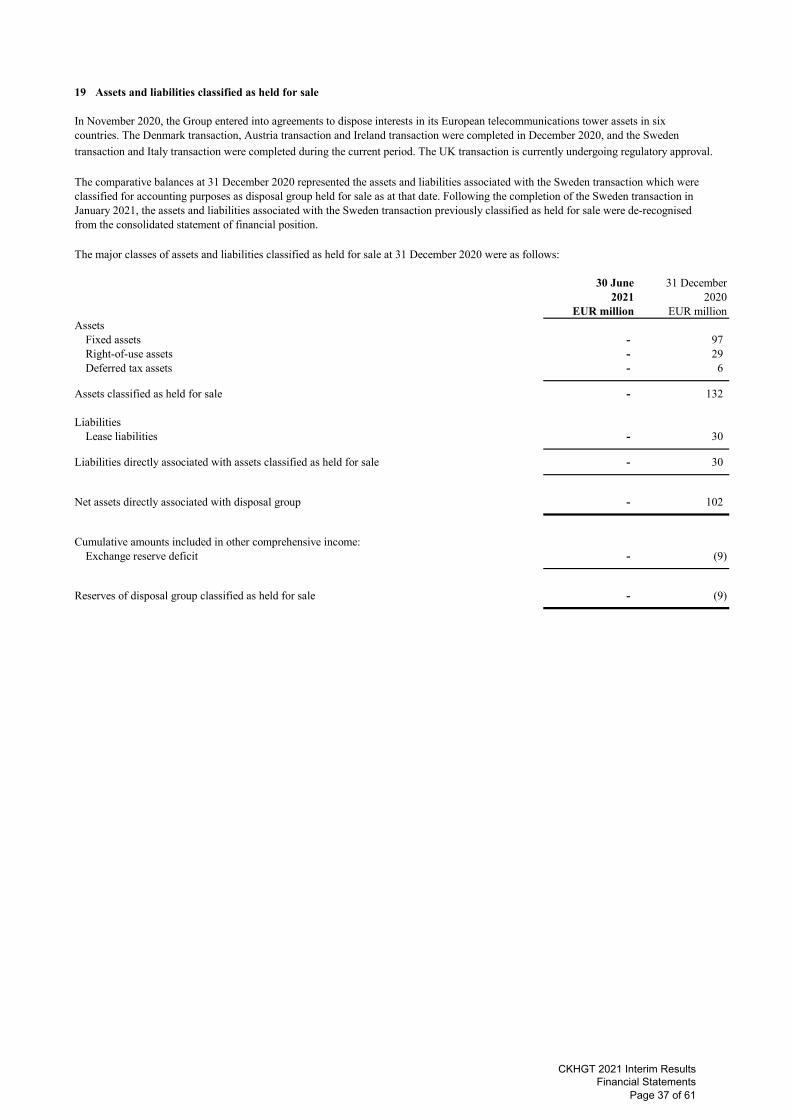
19 Assets and liabilities classified as held for sale
In November 2020, the Group entered into agreements to dispose interests in its European telecommunications tower assets in sixcountries. The Denmark transaction, Austria transaction and Ireland transaction were completed in December 2020, and the Sweden
transaction and Italy transaction were completed during the current period. The UK transaction is currently undergoing regulatory approval.
The comparative balances at 31 December 2020 represented the assets and liabilities associated with the Sweden transaction which were classified for accounting purposes as disposal group held for sale as at that date. Following the completion of the Sweden transaction inJanuary 2021, the assets and liabilities associated with the Sweden transaction previously classified as held for sale were de-recognisedfrom the consolidated statement of financial position.
The major classes of assets and liabilities classified as held for sale at 31 December 2020 were as follows:
30 June 31 December2021 2020
EUR million EUR millionAssets
Fixed assets - 97 Right-of-use assets - 29 Deferred tax assets - 6
Assets classified as held for sale - 132
LiabilitiesLease liabilities - 30
Liabilities directly associated with assets classified as held for sale - 30
Net assets directly associated with disposal group - 102
Cumulative amounts included in other comprehensive income:Exchange reserve deficit - (9)
Reserves of disposal group classified as held for sale - (9)
CKHGT 2021 Interim Results Financial Statements
Page 37 of 61

20 Bank and other debts
30 June 2021 31 December 2020Current Non-current Current Non-currentportion portion Total portion portion Total
EUR million EUR million EUR million EUR million EUR million EUR millionPrincipal amounts
Bank loans 605 2,600 3,205 - 3,854 3,854 Notes and bonds - 5,187 5,187 - 5,134 5,134
605 7,787 8,392 - 8,988 8,988 Unamortised loan facilities fees and
premiums or discounts related to debts (1) (41) (42) - (46) (46)
604 7,746 8,350 - 8,942 8,942
Bank and other debts at principal amount are scheduled for repayment by calendar year as follows:
Bank Notes andloans bonds Total
EUR million EUR million EUR million
2021, remainder of year - - - 2022 1,055 - 1,055 2023 1,100 1,500 2,600 2024 1,050 - 1,050 2025 - - - 2026 to 2030 - 2,586 2,586 2031 and thereafter - 1,101 1,101
3,205 5,187 8,392 Less: current portion (605) - (605)
2,600 5,187 7,787
Bank Notes andloans bonds Total
EUR million EUR million EUR million
2021 - - - 2022 2,704 - 2,704 2023 100 1,500 1,600 2024 1,050 - 1,050 2025 - - - 2026 to 2030 - 2,553 2,553 2031 and thereafter - 1,081 1,081
3,854 5,134 8,988 Less: current portion - - -
3,854 5,134 8,988
30 June 2021
31 December 2020
CKHGT 2021 Interim Results Financial Statements
Page 38 of 61

21 Trade payables and other current liabilities30 June 31 December
2021 2020EUR million EUR million
Trade payables (a) 1,124 1,103
Amounts due to CKHH group entities (b) 8 -
Other current liabilities
Contract liabilities 398 328
Obligations for telecommunications licences and other rights 103 90
Provisions (see note 22) 139 191
Expenses and other accruals 1,751 1,944
Other payables 683 910
4,206 4,566
(a) At the end of the period / year, the ageing analysis of the trade payables is as follows:30 June 31 December
2021 2020EUR million EUR million
Less than 31 days 997 875 Within 31 to 60 days 4 40 Within 61 to 90 days 2 6 Over 90 days 121 182
1,124 1,103
(b) At 30 June 2021, the amounts due to CKHH group entities are trading in nature, unsecured, interest free and have no fixed terms ofrepayment.
22 Provisions30 June 31 December
2021 2020EUR million EUR million
Provision for commitments, onerous contracts and other guarantees 715 805 Closure obligation 1 1 Assets retirement obligation 159 208 Other provisions 105 120
980 1,134
Provisions are analysed as:Current portion (see note 21) 139 191 Non-current portion (see note 24) 841 943
980 1,134
The provision for commitments, onerous contracts and other guarantees represents the unavoidable costs of meeting these commitments and obligations after deducting the associated, expected future benefits and / or estimated recoverable value. The provision for closure obligations represents the estimated costs to execute integration plans and store closures. The provision for assets retirement obligations represents the present value of the estimated future costs of dismantling and removing fixed assets when they are no longer used and restoring the sites on which they are located.
CKHGT 2021 Interim Results Financial Statements
Page 39 of 61

23 Pension obligations
30 June 31 December2021 2020
EUR million EUR million
Present value of defined benefit obligations 98 99 Fair value of plan assets 27 26
Net defined benefit liabilities 71 73
Amounts recognised in the consolidated statement of financial position are as follows:
Other non-current assets (see note 16) 1 2 Pension obligations 72 75
Net defined benefit liabilities 71 73
24 Other non-current liabilities30 June 31 December
2021 2020EUR million EUR million
Obligations for telecommunications licences and other rights 628 595 Other non-current liabilities 376 383 Provisions (see note 22) 841 943
1,845 1,921
The Group operates a number of defined benefit and defined contribution plans, the assets of which are held independently of the Group’s assets in trustee administered funds. The Group’s major defined benefit plans are in Hong Kong and Italy. The amounts recognised in the consolidated statement of financial position are determined as follows:
CKHGT 2021 Interim Results Financial Statements
Page 40 of 61

25 Share capital and share premium
Share ShareNumber capital premium Total
of shares EUR EUR EUR
Authorised:Ordinary shares of EUR1 each 40,000 40,000 - 40,000
Share ShareNumber capital premium Total
of shares EUR million EUR million EUR millionIssued and fully paid:Ordinary shares
At 31 December 2020 and 30 June 2021 64 - 20,917 20,917
26 Reserves
Retained Exchange Hedging Merger Other capital
profit reserve reserve reserve (a) reserve (b) TotalEUR million EUR million EUR million EUR million EUR million EUR million
At 1 January 2021 6,733 420 8 (3,028) (109) 4,024
Profit for the period 1,774 - - - - 1,774
Other comprehensive incomeGains on cash flow hedges recognised directly
in reserves - - 19 - - 19 Gains on translating overseas subsidiaries’ net
assets recognised directly in reserves - 339 - - - 339 Losses previously in exchange reserves related
to subsidiaries disposed during the periodrecognised in income statement - 31 - - - 31
Tax relating to components of other comprehensive income - - - - - -
Other comprehensive income, net of tax - 370 19 - - 389
At 30 June 2021 8,507 790 27 (3,028) (109) 6,187
Retained Exchange Hedging Merger Other capitalprofit reserve reserve reserve (a) reserve (b) Total
EUR million EUR million EUR million EUR million EUR million EUR million
At 1 January 2020 3,912 820 (4) (3,028) (109) 1,591
Profit for the period 803 - - - - 803
Other comprehensive income (losses)Gains on cash flow hedges recognised directly
in reserves - - 2 - - 2 Losses on translating overseas subsidiaries’ net
assets recognised directly in reserves - (330) - - - (330) Tax relating to components of other comprehensive
income (losses) - - - - - -
Other comprehensive income (losses), net of tax - (330) 2 - - (328)
At 30 June 2020 4,715 490 (2) (3,028) (109) 2,066
(a)
(b) Relating to transactions with non-controlling interests.
Attributable to owners of the Company
Merger reserve represents the difference between the capital contributions from CKHH group entities to the Group pursuant to the reorganisation completed in 2019 and the consideration paid by the Group for acquisition of the CKHH Group’s telecommunication businesses in Europe and Hong Kong.
Six months ended 30 June 2020
Attributable to owners of the Company
Six months ended 30 June 2021
CKHGT 2021 Interim Results Financial Statements
Page 41 of 61

27 Notes to condensed consolidated statement of cash flows
(a) Reconciliation of profit after tax to cash generated from operating activities before interest expenses and other finance costs, tax paid and changes in working capital
2021 2020EUR million EUR million
Profit after tax 1,794 832 Less: share of profits less losses of joint ventures 1 1
1,795 833 Adjustments for:
Current tax 21 14 Deferred tax credit (262) (33) Interest expenses and other finance costs 115 120 Depreciation and amortisation 1,423 1,256
EBITDA of Company and subsidiaries (i) 3,092 2,190 Goodwill impairment (see note 13) 1,669 - Gains on disposal of fixed assets (15) (5) Gains on disposal of European telecommunications tower assets (see note 6(c)) (2,626) - Customer acquisition and retention costs capitalised in the period (191) (182) Other non-cash items (86) 5
1,843 2,008
2021 2020EUR million EUR million
(i) Reconciliation of EBITDA:
EBITDA of Company and subsidiaries 3,092 2,190
Share of EBITDA of joint venturesShare of profits less losses of joint ventures (1) (1) Adjustments for:
Depreciation and amortisation 3 3 Interest expenses and other finance costs 1 1
3 3
EBITDA (see notes 5(b)(ii)) 3,095 2,193
(b) Changes in working capital
2021 2020EUR million EUR million
Decrease in inventories 1 3 Decrease (increase) in trade receivables and other current assets (55) 108 Decrease in trade payables and other current liabilities (275) (567) Other non-cash items 216 132
(113) (324)
Six months ended 30 June
Six months ended 30 June
Six months ended 30 June
CKHGT 2021 Interim Results Financial Statements
Page 42 of 61
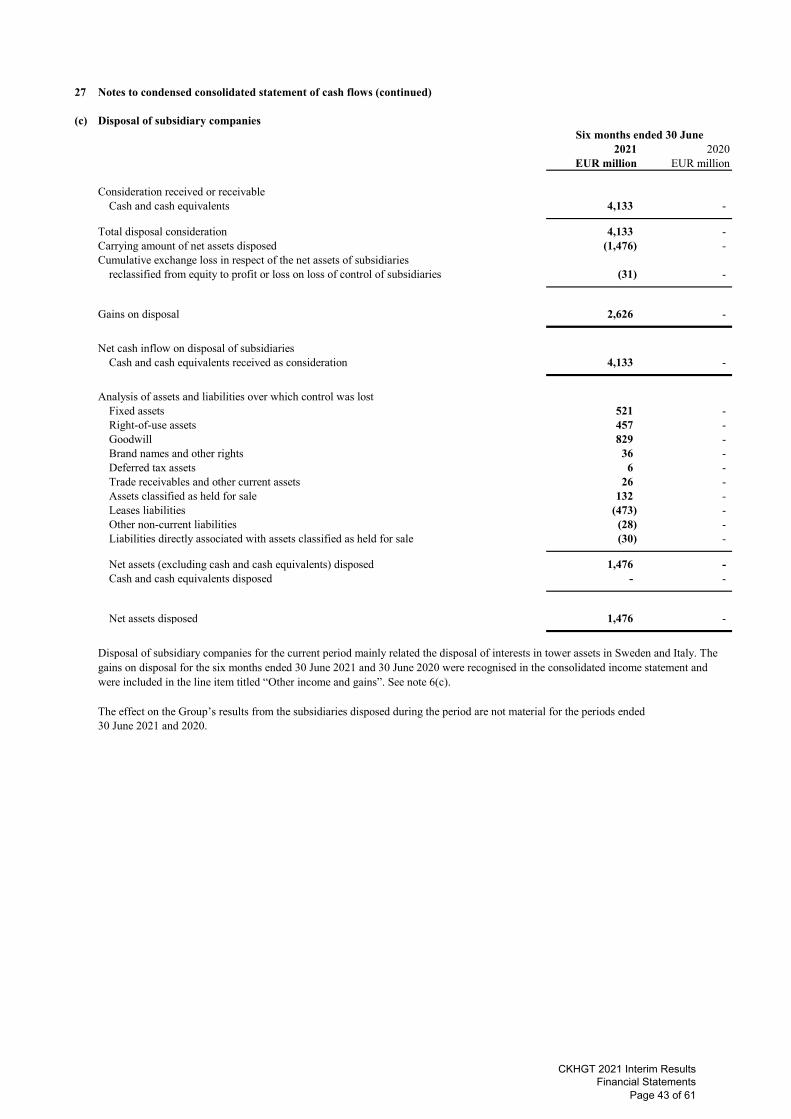
27 Notes to condensed consolidated statement of cash flows (continued)
(c) Disposal of subsidiary companies
2021 2020EUR million EUR million
Consideration received or receivableCash and cash equivalents 4,133 -
Total disposal consideration 4,133 - Carrying amount of net assets disposed (1,476) - Cumulative exchange loss in respect of the net assets of subsidiaries
reclassified from equity to profit or loss on loss of control of subsidiaries (31) -
Gains on disposal 2,626 -
Net cash inflow on disposal of subsidiariesCash and cash equivalents received as consideration 4,133 -
Analysis of assets and liabilities over which control was lostFixed assets 521 - Right-of-use assets 457 - Goodwill 829 - Brand names and other rights 36 - Deferred tax assets 6 - Trade receivables and other current assets 26 - Assets classified as held for sale 132 - Leases liabilities (473) - Other non-current liabilities (28) - Liabilities directly associated with assets classified as held for sale (30) -
Net assets (excluding cash and cash equivalents) disposed 1,476 - Cash and cash equivalents disposed - -
Net assets disposed 1,476 -
The effect on the Group’s results from the subsidiaries disposed during the period are not material for the periods ended 30 June 2021 and 2020.
Disposal of subsidiary companies for the current period mainly related the disposal of interests in tower assets in Sweden and Italy. The gains on disposal for the six months ended 30 June 2021 and 30 June 2020 were recognised in the consolidated income statement and were included in the line item titled “Other income and gains”. See note 6(c).
Six months ended 30 June
CKHGT 2021 Interim Results Financial Statements
Page 43 of 61

27 Notes to condensed consolidated statement of cash flows (continued)
(d) Reconciliation of liabilities arising from financing activities
The following table sets out an analysis of the cash flows and non-cash flows changes in liabilities arising from financing activities:
Bank and Leaseother debts liabilities Total
EUR million EUR million EUR million
At 1 January 2021 8,942 2,681 11,623 Financing cash flows
New borrowings 997 - 997 Repayment of borrowings (1,650) - (1,650) Principal elements of lease payments - (387) (387)
Other changesAmortisation of loan facilities fees and premiums or discounts
relating to debts (see note 7) 8 - 8 Remeasurement of lease liabilities - (23) (23) Increase in lease liabilities from entering into new leases
during the period (see note 10) - 585 585 Interest on lease liabilities (see note 7) - 52 52 Interest element of lease liabilities paid (included in “net cash
from operating activities”) - (47) (47) Relating to subsidiaries disposed (see note 27(c)) - (473) (473) Exchange translation differences 53 46 99
At 30 June 2021 8,350 2,434 10,784
At 1 January 2020 9,911 3,205 13,116 Financing cash flows
Principal elements of lease payments - (480) (480) Other changes
Amortisation of loan facilities fees and premiums or discounts relating to debts (see note 7) 5 - 5
Remeasurement of lease liabilities - (86) (86) Increase in lease liabilities from entering into new leases
during the period (see note 10) - 258 258 Interest on lease liabilities (see note 7) - 54 54 Interest element of lease liabilities paid (included in “net cash
from operating activities”) - (55) (55) Exchange translation differences (57) (22) (79)
At 30 June 2020 9,859 2,874 12,733
CKHGT 2021 Interim Results Financial Statements
Page 44 of 61

28 Contingent liabilities and guarantees
At 30 June 2021, the Group had provided performance and other guarantees of EUR507 million (31 December 2020: EUR470 million).
29 Commitments
There have been no material changes in the total amount of capital commitments since 31 December 2020 except for the amounts taken up during the period in the normal course of business.
30 Related parties transactions
(a) Key management personnel remuneration
The remuneration for the directors of the Company (being the key management personnel) for the current and comparative periodsare borne by CKHH group entities.
(b) Saved as disclosed elsewhere in the Interim Financial Statements, the following transactions occurred with other related parties:
2021 2020
EUR million EUR million
Sales of contract assets (handset receivables) to CKHH group entities (i) 314 306
Exchange gains (losses) hedged to CKHH group entities (ii) (7) 12
(i)
(ii)
31 Legal proceedings
At 30 June 2021, the Group is not engaged in any material litigation or arbitration proceedings, and no material litigation or claim isknown by the Group to be pending or threatened against it.
During the period, the Group has entered into handset receivable agreements with CKHH group entities which resulted in the sale of certain contract assets (unbilled handset receivables) for which the Group was paid at the carrying cost of the contract assets sold, being the face value of the underlying unbilled handset receivables less the related allowance to cover the credit and late payment risk.
During the period, the Group has entered into a foreign exchange economic hedge agreement with CKHH group entities which resulted in the transfer of foreign exchange exposure in relation to a notional amount of US$125 million as at30 June 2021 (30 June 2020: US$200 million).
Six months ended 30 June
CKHGT 2021 Interim Results Financial Statements
Page 45 of 61

32 Fair value measurements
(a) Carrying amounts and fair values of financial assets and financial liabilities
The fair values of financial assets and financial liabilities, together with the carrying amounts in the consolidated statement of financial position, are as follows:
Carrying Fair Carrying FairClassification under amounts values amounts values
Note IFRS 9 EUR million EUR million EUR million EUR million
Financial assetsUnlisted investments
Unlisted equity securities 16 FVOCI 2 2 2 2 Derivative financial instruments
Cash flow hedges - Other contracts 16 & 18 Fair value - hedges 28 28 6 6 Lease receivables 16 Amortised cost 19 19 25 25 Cash and cash equivalents 17 Amortised cost 6,549 6,549 3,752 3,752 Trade receivables 18 Amortised cost 1,024 1,024 1,137 1,137 Other receivables 18 Amortised cost 284 284 336 336 Amounts due from joint ventures Amortised cost 41 41 43 43 Amounts due from CKHH group entities 18 Amortised cost - - 7 7
7,947 7,947 5,308 5,308
Financial liabilitiesBank and other debts (i) 20 Amortised cost 8,350 8,500 8,942 9,206 Trade payables 21 Amortised cost 1,124 1,124 1,103 1,103 Expenses and other accruals 21 Amortised cost 1,751 1,751 1,944 1,944 Other payables 21 Amortised cost 683 683 910 910 Lease liabilities 10 Amortised cost 2,434 2,434 2,681 2,681 Obligations for telecommunications licences
and other rights 21 & 24 Amortised cost 731 731 685 685 Amounts due to joint ventures Amortised cost - - 3 3 Amounts due to CKHH group entities 21 Amortised cost 8 8 - -
15,081 15,231 16,268 16,532
Representing: Financial assets measured at
Amortised cost 7,917 7,917 5,300 5,300 FVOCI 2 2 2 2 Fair value - hedges 28 28 6 6
7,947 7,947 5,308 5,308
Financial liabilities measured atAmortised cost 15,081 15,231 16,268 16,532
(i) The fair values of the bank and other debts are based on market quotes or estimated using discounted cash flow calculations based upon theGroup’s current incremental borrowing rates for similar types of borrowings with maturities consistent with those remaining for the debt being valued.
30 June 2021 31 December 2020
CKHGT 2021 Interim Results Financial Statements
Page 46 of 61

32 Fair value measurements (continued)
(b) Financial assets and financial liabilities measured at fair value
Fair value hierarchy
The table below analyses recurring fair value measurements for financial assets and financial liabilities. These fair value measurementsare categorised into different levels in the fair value hierarchy based on the inputs to valuation techniques used. The different levelsare defined as follows:
Level 1: Quoted prices (unadjusted) in active markets for identical assets or liabilities;Level 2: Inputs other than quoted prices included within Level 1 that are observable for the assets or liabilities, either directly
(i.e. as prices) or indirectly (i.e. derived from prices); andLevel 3: Inputs for the assets or liabilities that are not based on observable market data (i.e. unobservable inputs).
Level 1 Level 2 Level 3 Total Level 1 Level 2 Level 3 Total
Note EUR million EUR million EUR million EUR million EUR million EUR million EUR million EUR million
Financial assetsUnlisted investments
Unlisted equity securities 16 - - 2 2 - - 2 2 Derivative financial instruments
Cash flow hedges - Other contracts 16 & 18 - 28 - 28 - 6 - 6
- 28 2 30 - 6 2 8
The fair value of financial assets and financial liabilities that are not traded in active market is determined by using valuation techniques. Specific valuation techniques used to value financial assets and financial liabilities include discounted cash flow analysis, are used to determine fair value for the financial assets and financial liabilities.
During the six months ended 30 June 2021 and 2020, there were no transfers between the Level 1 and Level 2 fair value measurements, and no transfers into or out of Level 3 from or to Level 1 or Level 2 fair value measurements.
Level 3 fair values
During the six months ended 30 June 2021 and 2020, there were no movements of the balance of financial assets and financial liabilitiesmeasured at fair value based on Level 3.
The fair value of financial assets and financial liabilities that are grouped under Level 3 is determined by using valuation techniques including discounted cash flow analysis. In determining fair value, specific valuation techniques are used with reference to inputssuch as dividend stream and other specific input relevant to those particular financial assets and financial liabilities.
Changing unobservable inputs used in Level 3 valuation to reasonable alternative assumptions would not have significant impact onthe Group’s profit or loss.
33 Rounding of amounts
All amounts disclosed in the financial statements and notes have been rounded off to the nearest million currency units unless otherwise stated.
30 June 2021 31 December 2020
CKHGT 2021 Interim Results Financial Statements
Page 47 of 61

34 Significant accounting judgements, estimates and assumptions
(a) Significant judgements in applying the Group’s accounting policies
(i) Basis of consolidation and classification of investee entities
(ii) Allocation of revenue for bundled telecommunications transactions with customers
(iii) Determination of lease term
•
•
•
If there are significant penalties to terminate (or not extend), the Group is typically reasonably certain to extend (or not terminate).
In applying the Group’s accounting policies, which are described in note 35, the directors are required to make judgements that have asignificant impact on the amounts recognised and to make estimates and assumptions about the carrying amounts of assets and liabilities thatare not readily apparent from other sources. The estimates and associated assumptions are based on historical experience and other factorsthat are considered to be relevant and reasonable under the circumstance. Although our current estimates contemplate current and, asapplicable, expected future conditions, it is reasonably possible that actual conditions could differ from our expectations. Uncertainty aboutthese judgements, estimates and assumptions could result in outcomes that require a material adjustment to the carrying amount of assets orliabilities affected and the amount and timing of results of operations, cash flows and disclosures in future periods.
The following are the significant judgements, apart from those involving estimations (which are presented separately below), that the directors have made in the process of applying the Group’s accounting policies and that have the most significant effect on the amounts recognised in financial statements.
The determination of the Group’s level of control over another entity will require exercise of judgement under certain circumstances. The Company controls an entity when it is exposed, or has rights, to variable returns from its involvement with the investee and has the ability to affect those returns through its power over the investee. The Group also considers, in particular, whether it obtains benefits, including non-financial benefits, from its power to control the entity. As such, the classification of the entity as a subsidiary, a joint venture, a joint operation, an associate or a cost investment might require the application of judgement through the analysis of various indicators, such as the percentage of ownership interest held in the entity, the representation on the entity’s board of directors and various other factors including, if relevant, the existence of agreement with other shareholders, applicable statutes and regulations and their requirements, the practical ability to exercise control.
The Group has bundled transactions under contract with customers including sales of both services and hardware (for example handsets). Revenue is allocated to the respective element in an amount that reflects the consideration to which the Group expects to be entitled in exchange for the services and device. Device revenue is recognised at the inception of the contract upon delivery to the customer and services revenue is recognised throughout the contract period as the services are provided. Significant judgement is required in assessing fair values of both of these elements by considering inter alia, standalone selling price, the consideration to which the Group expects to be entitled in exchange for transferring the services and hardware to the customer, and other relevant observable market data. Changes in the allocation may cause the revenue recognised for sales of services and hardware to change individually but not the total bundled revenue from a specific customer throughout its contract term. The Group periodically re-assesses the allocation of the elements as a result of changes in market conditions.
In determining the lease term, the Group considers all facts and circumstances that create an economic incentive to exercise an extension option, or not exercise a termination option. Extension options (or periods after termination options) are only included in the lease term if the lease is reasonably certain to be extended (or not terminated). The following factors are normally the most relevant:
If any leasehold improvements are expected to have a significant remaining value, the Group is typically reasonably certain to extend (or not terminate).Otherwise, the Group considers other factors including historical lease durations and the costs and business disruption required to replace the leased asset.
The lease term is reassessed if an option is actually exercised (or not exercised) or the Group becomes obliged to exercise (or not exercise) it. The assessment of reasonable certainty is only revised if a significant event or a significant change in circumstances occurs, which affects this assessment, and that is within the control of the lessee.
CKHGT 2021 Interim Results Financial Statements
Page 48 of 61

34 Significant accounting judgements, estimates and assumptions (continued)
(a) Significant judgements in applying the Group’s accounting policies (continued)
(iv) Business combinations
(b) Key sources of estimation uncertainty
(i) Impairment of goodwill and long-lived assets
As disclosed in note 35(c), the Group applies the provisions of IFRS 3 to transactions and other events that meet the definition of a business combination within the scope of IFRS 3. When the Group completes a business combination, the identifiable assets acquired and the liabilities assumed, including intangible assets, contingent liabilities and commitments, are recognised at their fair value. Judgement is required to determine the fair values of the assets acquired, the liabilities assumed, the date of acquisition, and the purchase consideration, and on the allocation of the purchase consideration to the identifiable assets and liabilities. If the purchase consideration exceeds the fair value of the net assets acquired then the incremental amount paid is recognised as goodwill. If the purchase price consideration is lower than the fair value of the net assets acquired then the difference is recorded as a gain in the income statement. Allocation of the purchase consideration between finite lived assets and indefinite lived assets such as goodwill affects the subsequent results of the Group as finite lived intangible assets are amortised, whereas indefinite lived intangible assets, including goodwill, are not amortised.
The key assumptions concerning the future and other key sources of estimation uncertainty at the reporting date, that have a significant risk of causing a material adjustment to the carrying amounts of assets and liabilities within the next financial year, are described below.
The Group based its estimates and assumptions on parameters available when the consolidated financial statements were prepared. Existing circumstances and assumptions about future developments, however, may change due to market changes or circumstances arising that are beyond the control of the Group. Revisions to accounting estimates and assumptions are recognised prospectively and could impact fair value and carrying amounts of assets and liabilities, amount and timing of results of operations and cash flows in future periods.
Goodwill and intangible assets that have an indefinite useful life (including telecommunication licences and brand names) are not subject to amortisation and are tested for impairment annually and when there is indication that the asset may be impaired. Other assets are reviewed for impairment to determine whether there is any indication that the carrying value of these assets may not be recoverable and have suffered an impairment loss. If any such indication exists, the recoverable amount of the asset is estimated in order to determine the extent, if any, of the impairment loss. An impairment loss is recognised for the amount by which the asset’s carrying amount exceeds its recoverable amount. The recoverable amount is the higher of an asset’s fair value less costs of disposal and value in use. For the purposes of assessing impairment, assets are grouped at the lowest levels for which there are separately identifiable cash inflows which are largely independent of the cash inflows from other assets or groups of assets (cash-generating units). Non-financial assets other than goodwill that suffered an impairment are reviewed for possible reversal of the impairment at the end of each reporting period.
In assessing whether these assets have suffered any impairment, the carrying value of the asset or its respective business unit is compared with its recoverable amount, which is the higher of the fair value less costs of disposal and value in use. Fair value is derived, when available and appropriate, by making reference to performance metrics (such as revenue, EBITDA, earnings) and valuation multiples (such as EV/EBITDA, EV/S, P/E) of completed transactions of comparable businesses or comparable public companies, or by making reference to traded prices and with consideration for possible premiums, or is measured using discounted cash flow projections (Level 3 of the IFRS 13 fair value hierarchy). The selection of comparable companies requires management judgement and is based on a number of factors, including comparable companies’ location, sizes, growth rates, industries, and development stages.
In determining the value in use of the investment, discounted cash flow models will be used to estimate the present value of the estimated future cash flows expected to be generated from the operations and from the ultimate disposal of the investment. The cash flows used in the financial projections (discounted cash flow models) are based on the latest approved financial budgets for the next five years. The Group prepared the financial budgets reflecting current and prior year performances and experience, market development expectations, including the expected market share and growth momentum, and where available and appropriate, observable market data. There are a number of estimates and assumptions involved for the preparation of the budget, the cash flow projections for the period covered by the approved budget and the estimated terminal value at the end of the budget period. Significant estimates and assumptions inherent in the discounted cash flow models include the amount and timing of future cash flows attributable to the respective business unit. Other key estimates and assumptions, where applicable, include the respective business unit’s projected revenue, costs, gross margin, inventory level, working capital and capital investments, as well as the discount rate and long term growth rate applied, and the estimated terminal value assumptions.
It is reasonably possible that the judgements, estimates and assumptions described above could change in future periods. Further, unanticipated market or macroeconomic events and circumstances may occur, which could affect the accuracy or validity of the estimates and assumptions. Changes to the judgements. estimates and assumptions can significantly affect the carrying amount of the investment in future periods.
CKHGT 2021 Interim Results Financial Statements
Page 49 of 61

34 Significant accounting judgements, estimates and assumptions (continued)
(b) Key sources of estimation uncertainty (continued)
(ii) Pension costs and estimation of defined benefit pension obligation
(iii) Provisions for commitments, onerous contracts and other guarantees
(iv) Provision for income tax and recognition of deferred tax asset
The Group operates several defined benefit plans. Pension costs for defined benefit plans are assessed using the projected unit credit method in accordance with IAS 19, “Employee Benefits”. Under this method, the cost of providing pensions is charged to the income statement so as to spread the regular cost over the future service lives of employees in accordance with the advice of the actuaries who carry out a full valuation of the plans. The liability or asset recognised in the consolidated statement of financial position in respect of defined benefit pension plans is the present value of the defined benefit obligation at the end of the reporting period less the fair value of the plan assets. The present value of the defined benefit obligation is measured by discounting the estimated future cash outflows using interest rates determined by reference to market yields at the end of the reporting period based on government agency or high quality corporate bonds with currency and term similar to the estimated term of benefit obligations. Remeasurements arising from defined benefit plans are recognised in other comprehensive income in the period in which they occur and reflected immediately in retained profit. Remeasurements comprise actuarial gains and losses, the return on plan assets (excluding amounts included in net interest on the net defined benefit liability (asset)) and any change in the effect of the asset ceiling (excluding amounts included in net interest on the net defined benefit liability (asset)).
Management appoints actuaries to carry out full valuations of these pension plans to determine the pension obligations that are required to be disclosed and accounted for in the financial statements in accordance with the IFRS requirements.
The actuaries use assumptions and estimates in determining the fair value of the defined benefit plans and evaluate and update these assumptions on an annual basis. Judgement is required to determine the principal actuarial assumptions to determine the present value of defined benefit obligations and service costs. Changes to the principal actuarial assumptions can significantly affect the present value of plan obligations and service costs in future periods.
The Group has entered into a number of procurement, supply and other contracts related to specific assets in the ordinary course of its business. Where the unavoidable costs of meeting the obligations under these procurement and supply contracts exceed the associated, expected future net benefits, an onerous contract provision is recognised. The calculation of these provisions will involve the use of estimates and assumptions. These onerous provisions are calculated by taking the unavoidable costs that will be incurred under the contract and deducting any estimate revenues or predicted income to be derived from the assets, or by taking the unavoidable costs that will be incurred under the guarantee and deducting any estimated recoverable value.
The Group is subject to income taxes in numerous jurisdictions. Significant judgement and estimate are required in determining the worldwide provision for income taxes. There are many transactions and calculations for which the ultimate tax determination is uncertain during the ordinary course of business. The Group recognises liabilities for anticipated tax audit issues based on estimates of whether additional taxes will be due. Where the final tax outcome of these matters is different from the amounts that were previously recorded, such differences will impact the income tax and deferred tax provisions in the period in which such determination is made.
Deferred tax is recognised, using the liability method, on temporary differences arising between the tax bases of assets and liabilities and their carrying values in the financial statements. Deferred tax assets are recognised to the extent it is probable that future taxable profits will be available against which the deductible temporary differences and the carry forward of unused tax losses and tax credits can be utilised, based on all available evidence. Recognition primarily involves judgement regarding the future financial performance of the particular legal entity or tax group. A variety of other factors are also evaluated in considering whether there is convincing evidence that it is probable that some portion or all of the deferred tax assets will ultimately be realised, such as the existence of taxable temporary differences, group relief, tax planning strategies and the periods in which estimated tax losses can be utilised.
The ultimate realisation of deferred tax assets recognised for certain of the Group’s businesses depends principally on these businesses maintaining profitability and generating sufficient taxable profits to utilise the underlying unused tax losses. It may be necessary for some or all of the deferred tax assets recognised to be reduced and charged to the income statement if there is a significant adverse change in the projected performance and resulting projected taxable profits of these businesses. Judgement is required to determine key assumptions adopted in the taxable profit and loss projections and changes to key assumptions used and estimates made can significantly affect these taxable profit and loss projections.
CKHGT 2021 Interim Results Financial Statements
Page 50 of 61
34 Significant accounting judgements, estimates and assumptions (continued)
(b) Key sources of estimation uncertainty (continued)
(v) Estimation of useful life: Fixed assets
(vi) Estimation of useful life: Telecommunications licences, other licences, brand names, trademarks and other rights
(vii) Estimation of the amortisation period: Customer acquisition and retention costs
Telecommunications licences, other licences, brand names, trademarks and other rights with a finite useful life are carried at cost less accumulated amortisation and are reviewed for impairment annually. Telecommunications licences, other licences, brand names, trademarks and other rights that are considered to have an indefinite useful life are not amortised and are tested for impairment annually and when there is indication that they may be impaired. Certain brand names related to Retail and Telecommunications are considered to have an indefinite useful life as there is no foreseeable limit to the period over which they are expected to generate net cash inflows.
Depreciation of operating assets constitutes a substantial operating cost for the Group. The cost of fixed assets is charged as depreciation expense over the estimated useful lives of the respective assets using the straight-line method. The Group periodically reviews changes in technology and industry conditions, asset retirement activity and residual values to determine adjustments to estimated remaining useful lives and depreciation rates. Actual economic lives may differ from estimated useful lives. Periodic reviews could result in a change in depreciable lives and therefore depreciation expense in future periods.
Judgement is required to estimate the useful lives of the telecommunications licences, other licences, brand names, trademarks and other rights. The actual economic lives of these assets may differ from the current contracted or expected usage periods, which could impact the amount of amortisation expense charged to the income statement. In addition, governments from time to time revise the terms of licences to change, amongst other terms, the contracted or expected licence period, which could also impact the amount of amortisation expense charged to the income statement.
In accordance with IFRS 15, customer acquisition and retention costs, which comprise the net costs to acquire and retain customers, are expensed and recognised in the income statement in the period in which they are incurred, where (i) the costs are incurred; (ii) the costs are incremental of obtaining a contract and they are expected to be recovered; and (iii) the costs relate directly to the contract, generate resources used in satisfying the contract and are expected to be recovered, then they are capitalised and amortised over the customer contract period. Appropriate allowances are recognised if the carrying amounts of the capitalised costs exceed the remaining amount that the Group expects to receive less any directly related costs that have not been recognised as expenses.
Judgement is required to determine the amount of the provision and the amortisation period. The actual amount to be received from the customer and customer period may differ from the expected amount and the contract periods, which could impact the amount of expense charged to the income statement.
CKHGT 2021 Interim Results Financial Statements
Page 51 of 61

35 Significant accounting policies
In the current period, the Group has adopted two amendments to IFRSs, namely (i) Amendments to IFRS 9, IAS 39, IFRS 7, IFRS 4 and IFRS 16: Interest Rate Benchmark Reform - Phase 2, and (ii) Amendment to IFRS 16: COVID-19-Related Rent Concessions beyond 30 June 2021.
Interest Rate Benchmark Reform - Phase 2
The Interest Rate Benchmark Reform - Phase 2 amendments include the following practical expedients:•
•
•
COVID-19-Related Rent Concessions beyond 30 June 2021
New standards and interpretations not yet adopted
The Group has early adopted Amendment to IFRS 16: COVID-19-Related Rent Concessions beyond 30 June 2021 ahead of its effective date. The amendment extends, by one year, the original amendment issued by IASB in May 2020. It permits lessees, as a practical expedient, not to assess whether particular rent concessions occurring as a direct consequence of the COVID-19 pandemic are lease modifications and instead to account for those rent concessions as if they are not lease modifications. The amendment does not affect lessors. This amendment had no significant impact on the Interim Financial Statements.
The Phase 2 amendments address issues that might affect financial reporting during the reform of interest rate benchmarks, including the effects of changes to contractual cash flows or hedging relationships arising from the replacement of an interest rate benchmark with an alternative benchmark rate (replacement issues). The Phase 2 amendments are effective for annual periods beginning on or after 1 January 2021 and are to be applied retrospectively. Restatement of prior periods is not required.
A practical expedient to require contractual changes, or changes to cash flows that are directly required by the reform of interest rate benchmarks, to be treated as changes to a floating interest rate, equivalent to a movement in a market rate of interest.Permit changes required by reform of interest rate benchmarks to be made to hedge designation and hedge documentation without the hedging relationship being discontinued.Provide temporary relief to entities from having to meet the separately identifiable requirement when an alternative nearly risk-free interest rate instrument is designated as a hedge of a risk component.
The Phase 2 amendments had no impact on the Interim Financial Statements. The Group intends to use the practical expedients in future periods if they become applicable.
The Interest Rate Benchmark Reform amendments to IFRSs were issued by IASB in two phases. The Phase 1 amendments deal with pre-replacement issues (issues affecting financial reporting in the period before the replacement of an existing interest rate benchmark). The Phase 1 amendments provide temporary exceptions to specific hedge accounting requirements, to avoid entities having to discontinue hedging relationships solely due to the uncertainty arising from the reform of interest rate benchmarks. These amendments apply to annual reporting periods beginning on or after 1 January 2020, and were addressed in Amendments to IFRS 7, IFRS 9 and IAS 39: Interest Rate Benchmark Reform, which the Group had adopted in 2020.
The adoption of these two amendments to IFRSs does not have a material impact on the Group’s 2021 financial statements. Other than these changes the accounting policies and methods of computation used in the preparation of the Interim Financial Statements are consistent with those used in the 2020 Annual Financial Statements.
Certain new accounting standards and interpretations have been published that are not mandatory for the current reporting period and have not been early adopted by the Group. These standards are not expected to have a material impact on the Group in the current or future reporting periods and on foreseeable future transactions.
CKHGT 2021 Interim Results Financial Statements
Page 52 of 61

35 Significant accounting policies (continued)
(a)
(b)
(c)
Under the equity method, an investment in a joint venture is recognised initially in the consolidated statement of financial position at cost and adjusted thereafter to recognise the Group’s share of the profit or loss and other comprehensive income of the joint venture. When the Group’s share of losses of a joint venture exceeds the Group’s interest in that joint venture (which includes any long-term interests that, in substance, form part of the Group’s net investment in the joint venture), the Group discontinues recognising its share of further losses. Additional losses are recognised only to the extent that the Group has incurred legal or constructive obligations or made payments on behalf of the joint venture.
Set out below is a description of the significant accounting policies adopted in the preparation of these financial statements to the extent they have not already been disclosed in the other notes elsewhere in these financial statements. These policies have been consistently applied to all the periods presented, unless otherwise stated.
Subsidiary companies
Subsidiaries are entities over which the Group has control. The Group controls an entity when the Group is exposed to, or has rights to, variable returns from its involvement with the entity and has the ability to affect those returns through its power to direct the activities of the entity. Subsidiaries are fully consolidated from the date on which control is transferred to the Group. They are deconsolidated from the date that control ceases. The acquisition method of accounting is used to account for business combinations by the Group.
Intercompany transactions, balances and unrealised gains on transactions between group companies are eliminated. Unrealised losses are also eliminated unless the transaction provides evidence of an impairment of the transferred asset. Accounting policies of subsidiaries have been changed where necessary to ensure consistency with the policies adopted by the Group.
Non-controlling interests in the results and equity of subsidiaries are shown separately in the consolidated income statement, consolidated statement of comprehensive income, consolidated statement of changes in equity and consolidated statement of financial position respectively.
Joint arrangements
A joint arrangement is an arrangement of which two or more parties have joint control and over which none of the participating parties has unilateral control. Investments in joint arrangements are classified either as joint operations or joint ventures, depending on the contractual rights and obligations each investor has. Joint operations arise where the investors have rights to the assets and obligations for the liabilities of an arrangement. The Group recognises its direct right to the assets, liabilities, revenue and expenses of joint operations and its share of any jointly held or incurred assets, liabilities, revenues and expenses. Joint ventures arise where the investors have rights to the net assets of the arrangement.
The results and net assets of joint ventures are incorporated in these financial statements using the equity method of accounting, except when the investment is classified as held for sale, in which case it is accounted for under IFRS 5, Non-current assets held for sale and discontinued operations. The total carrying amount of such investments is reduced to recognise any identified impairment loss in the value of individual investments.
An investment in a joint venture is accounted for using the equity method from the date on which the investee becomes a joint venture. On acquisition of the investment in a joint venture, any excess of the cost of the investment over the Group’s share of the net fair value of the identifiable assets and liabilities of the investee is recognised as goodwill, which is included within the carrying amount of the investment. Any excess of the Group’s share of the net fair value of the identifiable assets and liabilities over the cost of the investment, after reassessment, is recognised immediately in profit or loss in the period in which the investment is acquired.
Business combinations
The Group applies the provisions of IFRS 3, Business combinations, to transactions and other events that meet the definition of a business combination within the scope of IFRS 3. Where the acquisition method of accounting is used to account for business combinations, the consideration transferred is the sum of the acquisition date fair values of the assets transferred, equity instruments issued or liabilities incurred by the Group to former owners of the acquiree and the amount of any non-controlling interest in the acquiree. For each business combination, the non-controlling interest in the acquiree is measured at either fair value or at the proportionate share of the acquiree’s identifiable net assets. Acquisition-related costs are generally recognised in profit or loss as incurred.
CKHGT 2021 Interim Results Financial Statements
Page 53 of 61

35 Significant accounting policies (continued)
(c)
(d) Business combinations under common control
(e) Goodwill
Goodwill is initially recognised and measured as set out in note 35(c) Business combinations.
The Group’s policy for goodwill arising on the acquisition of a joint venture is described in note 35(b) above.
The Group applies the predecessor values accounting to account for combination of entities or businesses under common control. The financial statements incorporate the financial statement items of the combining entities or businesses in which the common control combination occurs as if they had been obtained from the date when the combining entities or business first came under the control of the controlling party.
The net assets of the combining entities or businesses are combined using the existing book values from the controlling parties’ perspective. No amount is recognised in respect of goodwill or excess of acquirer’s interest in the net fair value of the acquiree’s identifiable assets, liabilities, contingent liabilities over cost at the time of common control combination, to the extent of the combination of the controlling party’s interest. All differences between the cost of acquisition (fair value of consideration paid) and the amounts at which the assets and liabilities are recorded have been recognised directly in equity.
When a business combination is achieved in stages, the Group’s previously held interests (including joint operations) in the acquired entity are remeasured to its acquisition-date fair value and the resulting gain or loss, if any, is recognised in profit or loss. Amounts arising from interests in the acquiree prior to the acquisition date that have previously been recognised in other comprehensive income are reclassified to profit or loss, where such treatment would be appropriate if that interest were disposed of.
Business combinations are initially accounted for on a provisional basis. The Group retrospectively adjusts the provisional amounts recognised and also recognises additional assets or liabilities during the measurement period (see above), based on new information obtained about the facts and circumstances that existed as of the acquisition date.
Goodwill is not amortised but is subject to impairment test annually and when there is indication that the carrying value may not be recoverable. For the purpose of impairment testing, goodwill is allocated to each of the Group’s cash-generating units (or groups of cash-generating units) expected to benefit from the synergies of the combination. Cash-generating units to which goodwill has been allocated are tested for impairment annually, or more frequently when there is an indication that the unit may be impaired. If the recoverable amount of the cash-generating unit is less than the carrying amount of the unit, the impairment loss is allocated first to reduce the carrying amount of any goodwill allocated to the unit and then to the other assets of the unit pro-rata on the basis of the carrying amount of each asset in the unit. An impairment loss recognised for goodwill is not reversed in a subsequent period.
On disposal of a cash-generating unit, the attributable amount of goodwill is included in the determination of the profit or loss on disposal (but does not include any attributable goodwill previously eliminated against reserves).
Business combinations (continued)
When the consideration transferred by the Group in a business combination includes a contingent consideration arrangement, the contingent consideration is measured at its acquisition-date fair value and included as part of the consideration transferred in a business combination. Changes in fair value of the contingent consideration that qualify as measurement period adjustments are adjusted retrospectively, with corresponding adjustments against goodwill. Measurement period adjustments are adjustments that arise from additional information obtained during the ‘measurement period’ (which cannot exceed one year from the acquisition date) about facts and circumstances that existed at the acquisition date.
The subsequent accounting for changes in the fair value of the contingent consideration that do not qualify as measurement period adjustments depends on how the contingent consideration is classified. Contingent consideration that is classified as equity is not remeasured at subsequent reporting dates and its subsequent settlement is accounted for within equity. Other contingent consideration is remeasured to fair value at subsequent reporting dates with changes in fair value recognised in profit or loss.
The difference between the fair value of the consideration transferred, the amount of any non-controlling interest in the acquiree and the fair value of any pre-existing investment in the acquiree over the acquisition date fair value of assets acquired and the liabilities assumed is recognised as goodwill. If the consideration transferred and the fair value of pre-existing investment in the acquiree is less than the fair value of the identifiable net assets acquired, being a bargain purchase to the Group, the difference is recognised as a gain directly in profit or loss by the Group on the acquisition date, but only after a reassessment of the identification and measurement of the net assets acquired, the non-controlling interest in the acquiree, if any, the consideration transferred and the Group’s previously held equity interest in the acquiree.
CKHGT 2021 Interim Results Financial Statements
Page 54 of 61

35 Significant accounting policies (continued)
(f) Non-current assets (or disposal groups) held for sale and discontinued operations
Non-current assets (or disposal groups) are classified as held for sale if their carrying amount will be recovered principally through asale transaction rather than through continuing use and a sale is considered highly probable. They are measured at the lower of their carrying amount and fair value less costs to sell, except for assets such as deferred tax assets, assets arising from employee benefitsand financial assets that are carried at fair value and contractual rights under insurance contracts, which are specifically exempt from this requirement.
An impairment loss is recognised for any initial or subsequent write-down of the asset (or disposal group) to fair value less costs to sell. A gain is recognised for any subsequent increases in fair value less costs to sell of an asset (or disposal group), but not in excessof any cumulative impairment loss previously recognised. A gain or loss not previously recognised by the date of the sale of the non-current asset (or disposal group) is recognised at the date of derecognition.
Non-current assets (including those that are part of a disposal group) are not depreciated or amortised while they are classified as held for sale. Interest and other expenses attributable to the liabilities of a disposal group classified as held for sale continue to be recognised.
Non-current assets classified as held for sale and the assets of a disposal group classified as held for sale are presented separately from the other assets in the statement of financial position. The liabilities of a disposal group classified as held for sale are presented separately from other liabilities in the statement of financial position.
A discontinued operation is a component of the entity that has been disposed of or is classified as held for sale and that represents a separate major line of business or geographical area of operations, is part of a single co-ordinated plan to dispose of such a line of business or area of operations, or is a subsidiary acquired exclusively with a view to resale. The results of discontinued operations are presented separately in the income statement.
(g) Fixed assets
Fixed assets are stated at cost less depreciation and any impairment loss. Buildings are depreciated on the basis of an expected life of 50 years, or the remainder thereof, or over the remaining period of the lease of the underlying leasehold land, whichever is less. The period of the lease includes the period for which a right to renewal is attached.
Depreciation of other fixed assets is provided on the straight-line basis to write off their costs over their estimated useful lives. Theprincipal annual rates used for these purposes are as follows:
Motor vehicles 20 - 25%Plant, machinery and equipment 3 ⅓ - 20% Telecommunications equipment 2.5 - 20%Leasehold improvements Over the unexpired period of the lease or 15%, whichever is greater
The gain or loss on disposal or retirement of a fixed asset is the difference between the net sales proceeds and the carrying amount.
(h) Leases
(i) Group as a lessee
• fixed payments (including in-substance fixed payments), less any lease incentives receivable.• variable lease payment that are based on an index or a rate.• amounts expected to be payable by the lessee under residual value guarantees.• the exercise price of a purchase option if the lessee is reasonably certain to exercise that option.• payments of penalties for terminating the lease, if the lease term reflects the lessee exercising that option.
Leases are recognised as a right-of-use asset and a corresponding liability at the date at which the leased asset is available for use by the Group. Each lease payment is allocated between the lease liability and interest on lease liability. The interest on lease liability is charged to profit or loss over the lease period so as to produce a constant periodic rate of interest on the remaining balance of the lease liability for each period. The right-of-use asset is depreciated over the shorter of the asset’s useful life and the lease term on a straight-line basis.
Assets and liabilities arising from a lease are initially measured on a present value basis. Lease liabilities include the net present value of the following lease payments:
The lease payments are discounted using the interest rate implicit in the lease. If that rate cannot be determined, the lessee’s incremental borrowing rate is used, being the rate that the lessee would have to pay to borrow the funds necessary to obtain an asset of similar value in a similar economic environment with similar terms and conditions.
CKHGT 2021 Interim Results Financial Statements
Page 55 of 61

35 Significant accounting policies (continued)
(h) Leases (continued)
(i) Group as a lessee (continued)
Right-of-use assets are measured at cost comprising the following:• the amount of the initial measurement of lease liability.• lease payments made at or before the commencement date less any lease incentives received.• initial direct costs and restoration costs.
(ii) Group as a lessor
(i) Telecommunications licences, other licences, brand names, trademarks and other rights
Separately acquired telecommunications licences, other licences, brand names, trademarks and other rights are carried at historical cost. Telecommunications licences, other licences, brand names, trademarks and other rights with a finite useful life are carried atcost less accumulated amortisation. Amortisation is calculated using the straight-line method to allocate the cost of these assets over their estimated useful lives:
Telecommunications licences and other licences 2 to 20 years Brand names, trademarks and other rights 2 to 20 years
Telecommunications licences, other licences, brand names, trademarks and other rights that are considered to have indefinite usefullives to the Group are not amortised and are tested for impairment annually and when there is indication that they may be impaired.
(j) Customer acquisition and retention costs
Customer acquisition and retention costs (“CACs”) comprise the net costs to acquire and retain customers, which are mainly mobile telecommunication 3G and LTE customers. CACs are expensed and recognised in the income statement in the period in which they areincurred, except (i) the costs are incremental of obtaining a contract and they are expected to be recovered; and (ii) the costs relate directly to the contract, generate resources used in satisfying the contract and are expected to be recovered, then they are capitalised and amortised over the customer contract period. Appropriate allowance are recognised if the carrying amounts of the capitalised costs exceed the remaining amount that the Group expects to receive less any directly related costs that have not been recognised as expenses.
(k) Contractual customer relationships
Separately acquired contractual customer relationships are carried at historical cost. These contractual customer relationships are carried at cost less accumulated amortisation. Amortisation is calculated using the straight-line method from five to fifteen years overthe expected useful life of the customer relationship.
However, when the Group is an intermediate lessor the sublease are classified as a finance lease or as an operating lease with reference to the right-of-use asset arising from the head lease, not with reference to the underlying asset.
A lease is classified as a finance lease if it transfers substantially all the risks and rewards incidental to the ownership of an underlying asset to the lessee. If this is not the case, the lease is classified as an operating lease.
Payments associated with short-term leases and leases of low-value assets are recognised on a straight-line basis as an expense in profit or loss. Short-term leases are leases with a lease term of 12 months or less. Low-value assets comprise small items of office furniture and certain IT-equipment.
Some leases contain variable payment terms that are linked to sales generated from a store. For individual retail stores, lease payments are on the basis of variable payment terms and there is a wide range of sales percentages applied. Variable payment terms are used for a variety of reasons, including minimising the fixed costs base for newly established stores. Variable lease payments that depend on sales are recognised in profit or loss in the period in which the condition that triggers those payments occurs.
Extension and termination options are included in a number of leases across the Group. These terms are used to maximise operational flexibility in terms of managing contracts. The majority of extension and termination options held are exercisable only by the Group and not by the respective lessor. In determining the lease term, management considers all facts and circumstances that create an economic incentive to exercise an extension option, or not exercise a termination option. Extension options (or periods after termination options) are only included in the lease term if the lease is reasonably certain to be extended (or not terminated).
CKHGT 2021 Interim Results Financial Statements
Page 56 of 61

35 Significant accounting policies (continued)
(l) Deferred tax
Deferred tax is recognised, using the liabilities method, on temporary differences arising between the tax bases of assets and liabilities and their carrying amounts in the financial statements. Deferred tax assets are recognised to the extent that it is probable that future taxable profit will be available against which the deductible temporary differences and the carry forward of unused tax losses and tax credits can be utilised.
(m) Unlisted investments
“Unlisted investments” disclosed under other non-current assets, are investments in unlisted equity securities. These investments are recognised and de-recognised on the date the Group commits to purchase or sell the investments or when they expire.
(i) Measurement
Debt instrument financial assets subsequent to initial recognition are measured as follows:
(ii) Impairment
(n) Derivative financial instruments and hedging activities
Derivative financial instruments are utilised by the Group in the management of its foreign currency and interest rate exposures. Derivative financial instruments are recognised at fair value. At the end of each reporting period the fair value is remeasured. The gain or loss on remeasurement to fair value is recognised immediately in profit or loss, except where the derivatives qualify for cash flow hedge accounting or hedges of net investment in a foreign operation, in which case recognition of any resultant gain or loss depends on the nature of the item being hedged.
For the purpose of hedge accounting, hedges are classified as:
• Fair value hedges when hedging the exposure to changes in the fair value of a recognised asset or liability or an unrecognised firm commitment.
• Cash flow hedges when hedging the exposure to variability in cash flows that is either attributable to a particular risk associated with a recognised asset or liability or a highly probable forecast transaction or the foreign currency risk in an unrecognised firm commitment.
• Hedges of a net investment in a foreign operation (net investment hedges).
Under the expected loss approach, the Group assesses on a forward looking basis the expected credit losses associated with its financial assets. The impairment methodology applied depends on whether there has been a significant increase in credit risk. The impairment model under IFRS 9 applies to debt instruments measured at amortised cost and at FVOCI, contract assets under IFRS 15, lease receivables, loan commitments and certain financial guarantee contracts. The Group applies the simplified approach to recognise lifetime expected losses for trade receivables, due from customers and contract assets. As regards lease receivables, loan commitments, financial guarantee contracts, and certain other financial assets (which are presented under unlisted investments) the Group considers that they have low credit risk and hence recognises 12-month expected credit losses for such items.
Financial assets at fair value through other comprehensive income (“FVOCI”): Assets that are held for collection of contractual cash flows and for selling the financial assets, where the assets’ cash flows represent solely payments of principal and interest, are measured at FVOCI. Movements in the carrying amount are taken through other comprehensive income, except for the recognition of impairment losses and reversals, interest revenue and foreign exchange gains and losses which are recognised in profit or loss. When the financial asset is derecognised, the cumulative gain or loss previously recognised in other comprehensive income is reclassified from equity to, and recognised in, profit or loss.
Financial assets at fair value through profit or loss (“FVPL”): Assets that do not meet the criteria for amortised cost or FVOCI, or designated as FVPL using fair value option, are measured at FVPL. A gain or loss on a debt instrument that is subsequently measured at FVPL is recognised in profit or loss in the period in which it arises.
Equity instrument financial assets are measured at fair value at and subsequent to initial recognition. Changes in the fair value of these financial assets are normally recognised in profit or loss. Dividends from such investments are recognised in profit or loss when the Group’s right to receive payments is established. Where an election is made to present fair value gains and losses on equity investments in other comprehensive income, there is no subsequent reclassification of fair value gains and losses to profit or loss following the derecognition of the investment.
Amortised cost: Assets that are held for collection of contractual cash flows where those cash flows represent solely payments of principal and interest are measured at amortised cost. Interest income from these financial assets, impairment losses, foreign exchange gains and losses, and gain or loss arising on derecognition are recognised directly in profit or loss.
CKHGT 2021 Interim Results Financial Statements
Page 57 of 61

35 Significant accounting policies (continued)
(n) Derivative financial instruments and hedging activities (continued)
At the inception of a hedge relationship, the Group formally designates and documents the hedge relationship to which it wishes to apply hedge accounting and the risk management objective and strategy for undertaking the hedge.
At the inception of the hedging, the Group documents the economic relationship between hedging instruments and hedged items, including whether changes in the cash flows of the hedging instruments are expected to offset changes in the cash flows of hedges items. The Group documents its risk management objective and strategy for undertaking its hedge transactions.
The full fair value of a hedging derivative is classified as a non-current asset or liability when the remaining maturity of the hedged itemis more than 12 months; it is classified as a current asset or liability when the remaining maturity of the hedged item is less than 12 months.Trading derivatives are classified as a current asset or liability.
Hedges that meet all the qualifying criteria for hedge accounting are accounted for, as described below:
Fair value hedges
The change in the fair value of a hedging instrument is recognised in the statement of profit or loss as other expense. The change in the fair value of the hedged item attributable to the risk hedged is recorded as part of the carrying value of the hedged item and is also recognised in the statement of profit or loss as other expense.
For fair value hedges relating to items carried at amortised cost, any adjustment to carrying value is amortised through profit or loss over the remaining term of the hedge using the effective interest rate (“EIR”) method. The EIR amortisation may begin as soon as an adjustment exists and no later than when the hedged item ceases to be adjusted for changes in its fair value attributable to the risk being hedged.
If the hedged item is derecognised, the unamortised fair value is recognised immediately in profit or loss.
When an unrecognised firm commitment is designated as a hedged item, the subsequent cumulative change in the fair value of the firm commitment attributable to the hedged risk is recognised as an asset or liability with a corresponding gain or loss recognised in profit or loss.
Cash flow hedges
Where a derivative financial instrument is designated as a hedging instrument in a cash flow hedge, the effective portion of any gain or loss on the derivative financial instrument is recognised in other comprehensive income and accumulated separately in equity in the hedging reserve. The ineffective portion of any gain or loss is recognised immediately in profit or loss.
If a hedge of a forecast transaction subsequently results in the recognition of a non-financial asset such as inventory, the associated gain or loss is reclassified from equity to be included in the initial cost of the non-financial asset. For all other hedged forecast transactions, the amount accumulated in the hedging reserve is reclassified from equity to profit or loss in the same period or periods during which the hedged cash flows affect profit or loss (such as when a forecast sale occurs or interest expense is recognised).
If a hedge no longer meets the criteria for hedge accounting (including when the hedging instrument expires or is sold, terminated or exercised), then hedge accounting is discontinued prospectively. When hedge accounting is discontinued, but the hedged forecast transaction is still expected to occur, the amount that has been accumulated in the hedging reserve remains in equity until the transaction occurs and it is recognised in accordance with the above policy. If the hedged transaction is no longer expected to take place, the amount that has been accumulated in the hedging reserve is reclassified from equity to profit or loss immediately.
Hedge of net investments in foreign operations
The effective portion of any foreign exchange gain or loss on the derivative financial instruments is recognised in other comprehensive income and accumulated in equity in the exchange reserve until the disposal of the foreign operation, at which time the cumulative gain or loss is reclassified from equity to profit or loss. The ineffective portion is recognised immediately in profit or loss.
CKHGT 2021 Interim Results Financial Statements
Page 58 of 61

35 Significant accounting policies (continued)
(o) Cash and cash equivalents
Cash and cash equivalents comprise cash on hand and demand deposits, and other short-term highly liquid investments that are readily convertible to a known amount of cash and are subject to an insignificant risk of changes in value.
(p) Inventories
Inventories consist mainly of retail goods. The carrying value of retail stock is mainly determined using the weighted average cost method. Inventories are stated at the lower of cost and net realisable value. Cost includes all direct expenditure and other appropriate attributable costs incurred in bringing inventories to their present location and condition.
(q) Trade and other receivables, and contract assets
Trade receivables are recognised when the Group’s right to consideration is unconditional that only the passage of time is required before the payment is due.
Contract assets primarily relate to the Group’s rights to consideration for delivered goods or services but not billed at the reporting date. The contract assets are transferred to receivables when the rights become unconditional. This usually occurs when the Group issues an invoice to the customer.
Trade and other receivables and contract assets are initially recognised at fair value and subsequently measured at amortised cost using the effective interest method, less allowances for expected credit losses. The Group measured the loss allowance for its trade and other receivables and contract assets at an amount equal to the lifetime expected credit losses. Appropriate allowance for estimated irrecoverable amounts are recognised in the income statement when there is objective evidence that the asset is impaired. Trade andother receivables and contract assets are written off to the extent that there is no reasonable expectation of recovery.
(r) Borrowings and borrowing costs
Borrowings and debt instruments are initially measured at fair value, net of transaction costs, and are subsequently carried at amortised cost. Any difference between the proceeds (net of transaction costs) and the settlement or redemption amount is recognised over the period of the borrowings using the effective interest method.
Borrowing costs directly attributable to the acquisition, construction or production of qualifying assets, which are assets that necessarily take a substantial period of time to get ready for their intended use or sale, are added to the cost of those assets, until such time as the assets are substantially ready for their intended use or sale. All other borrowing costs are recognised in the income statement in the period in which they are incurred.
(s) Trade and other payables, and contract liabilities
Trade and other payables and contract liabilities are initially recognised at fair value and subsequently measured at amortised costusing the effective interest method.
The contract liabilities primarily relate to the advance consideration received from customers, where the Group has the unconditional right to considerations before the goods or services are delivered. They are released and revenues are recognised when theperformance obligations are satisfied upon transferring of goods and services to customers.
(t) Share capital
Share capital issued by the Company are recorded in equity at the proceeds received, net of direct issue costs.
(u) Provisions
Provisions are recognised when it is probable that an outflow of economic benefits will be required to settle a present obligation as a result of past events and a reliable estimate can be made of the amount of the obligation.
(v) Asset impairment
Assets that have an indefinite useful life are tested for impairment annually and when there is indication that they may be impaired. Assets that are subject to depreciation and amortisation are reviewed for impairment to determine whether there is any indication that the carrying value of these assets may not be recoverable and have suffered an impairment loss. If any such indication exists, the recoverable amount of the asset is estimated in order to determine the extent of the impairment loss, if any. The recoverable amount is the higher of an asset’s fair value less costs to dispose and value in use. Such impairment loss is recognised in the income statement except where the asset is carried at valuation and the impairment loss does not exceed the revaluation surplus for that asset, in which case it is treated as a revaluation decrease.
CKHGT 2021 Interim Results Financial Statements
Page 59 of 61

35 Significant accounting policies (continued)
(w) Pension plans
Pension plans are classified into defined benefit and defined contribution plans. The pension plans are generally funded by the relevant group companies taking into account the recommendations of independent qualified actuaries and by payments from employees for contributory plans.
The Group’s contributions to the defined contribution plans are charged to the income statement in the year incurred.
Pension costs for defined benefit plans are assessed using the projected unit credit method. Under this method, the cost of providing pensions is charged to the income statement so as to spread the regular cost over the future service lives of employees in accordance with the advice of the actuaries who carry out a full valuation of the plans. The liability or asset recognised in the consolidated statement of financial position in respect of defined benefit pension plans is the present value of the defined benefit obligation at the end of thereporting period less the fair value of the plan assets. The present value of the defined benefit obligation is measured by discounting the estimated future cash outflows using interest rates determined by reference to market yields at the end of the reporting period based on government agency or high quality corporate bonds with currency and term similar to the estimated term of benefit obligations.
Remeasurements arising from defined benefit plans are recognised in other comprehensive income in the period in which they occurand reflected immediately in retained profit. Remeasurements comprise actuarial gains and losses, the return on plan assets (excluding amounts included in net interest on the net defined benefit liability (asset)) and any change in the effect of the asset ceiling (excluding amounts included in net interest on the net defined benefit liability (asset)).
Pension costs are charged to the income statement within staff costs.
(x) Share-based payments
The Company and its subsidiary companies do not have share option scheme as at 30 June 2021 and 31 December 2020 but one of the Company’s subsidiary companies issued equity-settled share-based compensation plans. Equity-settled share-based paymentsare measured at fair value (excluding the effect of non-market-based vesting conditions) at the date of grant. The fair value determinedat the grant date of the equity-settled share-based payments is expensed on a straight-line basis over the vesting period, based on therespective group company’s estimate of their shares that will eventually vest and adjusted for the effect of non-market-based vesting conditions.
(y) Foreign exchange
Transactions in foreign currencies are converted at the rates of exchange ruling at the transaction dates. Monetary assets and liabilities are translated at the rates of exchange ruling at the end of the reporting period.
The financial statements of foreign operations are translated into Euro using the period / year end rates of exchange for thestatement of financial position items and the average rates of exchange for the period / year for the income statement items. Exchange differences are recognised in other comprehensive income and accumulated under the heading of exchange reserve. Exchange differences arising from foreign currency borrowings and other currency instruments designated as hedges of such overseas investments, are recognised in other comprehensive income and accumulated under the heading of exchange reserve.
Exchange differences arising from translation of inter-company loan balances between group entities are recognised in othercomprehensive income and accumulated under the heading of exchange reserve when such loans form part of the Group’s net investment in a foreign entity. On the disposal of a foreign operation (i.e. a disposal of the Group’s entire interest in a foreign operation, or a disposal involving loss of control over a subsidiary that includes a foreign operation, a disposal involving loss of joint control over a joint venture that includes a foreign operation, or a disposal involving loss of significant influence over an associate that includes a foreign operation), all of the exchange gains or losses accumulated in exchange reserve in respect of that operation attributable to the owners of the Company are transferred out of the exchange reserve and are recognised in the income statement.
In addition, in relation to a partial disposal of a subsidiary that does not result in the Group losing control over the subsidiary that includes a foreign operation, the proportionate share of accumulated exchange differences are re-attributed to non-controlling interests and are not recognised in the income statement. For all other partial disposals (i.e. partial disposals of associates or joint ventures that do not result in the Group losing significant influence or joint control), the proportionate share of the accumulated exchange differences is transferred out of the exchange reserve and are recognised in the income statement.
All other exchange differences are recognised in the income statement.
CKHGT 2021 Interim Results Financial Statements
Page 60 of 61
35 Significant accounting policies (continued)
(z) Revenue recognition
Revenue is measured at the fair value of the consideration received and receivable and represents amounts receivable for goods and services provided in the normal course of business. Revenue from contracts with customers is measured based on the consideration specified in a contract with a customer and exclude amounts collected on behalf of third parties. The Group recognises revenue when it transfers control over a product or service to a customer.
Revenue represents amounts earned for services rendered and for the sale of mobile and related devices. The Group recognises revenue for mobile devices when it transfers the control over the device to the customer which is usually the time the customer signs up to a contract. The Group recognises revenue for mobile telecommunication services as the services are rendered. Monthly recurring charges and additional airtime used by contract customers are invoiced and recorded as part of a periodic billing cycle and recognised as revenue over the related access period. Unbilled revenue resulting from services already provided from the billing cycle date to the end of each period is accrued, and unearned monthly access charges relating to periods after each accounting period are deferred. Products and services may be sold separately or in a bundled transaction. Revenue from the sale of prepaid credit is deferred until such time as the customer uses the airtime, or the credit expires.
For bundled transactions under contract comprising the provision of telecommunications services and sale of a device (e.g. handsets), the elements are accounted for separately if they are distinct. A product or service is distinct if they are separately identifiable from other items in the bundled package and if the customer can benefit from it. The revenue is allocated to the respective element in an amount that reflects the consideration to which the Group expects to be entitled in exchange for the services and device, where device revenue is recognised at the inception of the contract upon delivery to the customer and services revenue is recognised throughout the contract period as the services are provided.
Other service income is recognised when the service is rendered. Customer service revenue is mobile telecommunications service revenue, and where a customer is invoiced for a bundled transaction under contract, the invoiced amount less amounts related to accrued device revenue and also less other service income. Total revenue arising from telecommunications services comprises of service revenue, sale of device revenue and other service income.
Dividend income from investments in securities is recognised when the Group’s right to receive payment is established.
Interest income is recognised on a time proportion basis using the effective interest method.
CKHGT 2021 Interim Results Financial Statements
Page 61 of 61