UMTA/TX-89/2005-1F Diane Bullard Technical Report 2005-1F€¦ · • Labor Efficiency (Total...
295
TECHNICAL REPORT STANDARD TITLE PAGE 1. Report No. 2. Government Accession No. 3. Recipient's Catalog No. UMTA/TX-89/2005-1F 4. Title and Subtitle The Development of Standard Transit Profiles for Texas 7. Author(s) Diane L. Bullard 9. Performing Organization Name and Address Texas Transportation Institute The Texas A&M University System College Station, Texas 77843-3135 12. Sponsoring Agency Name and Address Texas State Department of Highways and Public Transportation Transportation Planning Division P. O. Box 5051 Austin, Texas 78763 15. Supplementary Notes 5. Report Date November 1989 6. Performing Organization Code 8. Performing Organization Report No. Technical Report 2005-1F 10. Work Unit No. 11. Contract or Grant No. Study 2-10-89-2005 13. Type of Report and Period Covered Final: September 1988 - November 1989 14. Sponsoring Agency Code Research performed in cooperation with DOT, UMTA. 16. Abstract An extensive amount of financial and operational data on the public transit systems of Texas is presently being published by a variety of governmental agencies and industry associations. However, the manner in which much of this data is collected and published reduces its potential usefulness to transit operators and planning agencies. In response to this problem, standard transit system profiles are developed for the eighteen municipal systems of Texas. The transit system profiles were intended to include a range of financial, operational and performance variables in order to provide an overview of each system's characteristics. The development of these profiles will allow transit operators and planning agencies to: 1) monitor trends and evaluate changes in a transit system's performance over time; and 2) compare the financial and operational performance of one agency with that of similar operations in the state. 17. Key Words public transit, public transportation, transit profiles, transit performance, transit efficiency, transit effectiveness 18. Distribution Statement No restrictions. This document is available to the public through the: National Technical Information Service 5285 Port Royal Road Springfield, Virginia 22161 19. Security Classif. (of the report) Unclassified 20. Security Classif. (of this page) Unclassified 21. No. of Pages 22. Price 296 Form DOT F 1700..7 <"')
Transcript of UMTA/TX-89/2005-1F Diane Bullard Technical Report 2005-1F€¦ · • Labor Efficiency (Total...

TECHNICAL REPORT STANDARD TITLE PAGE
1. Report No. 2. Government Accession No. 3. Recipient's Catalog No.
UMTA/TX-89/2005-1F
4. Title and Subtitle
The Development of Standard Transit Profiles for Texas
7. Author(s)
Diane L. Bullard
9. Performing Organization Name and Address
Texas Transportation Institute The Texas A&M University System College Station, Texas 77843-3135
12. Sponsoring Agency Name and Address
Texas State Department of Highways and Public Transportation
Transportation Planning Division P. O. Box 5051 Austin, Texas 78763
15. Supplementary Notes
5. Report Date
November 1989
6. Performing Organization Code
8. Performing Organization Report No.
Technical Report 2005-1F
10. Work Unit No.
11. Contract or Grant No.
Study 2-10-89-2005
13. Type of Report and Period Covered
Final: September 1988 - November 1989
14. Sponsoring Agency Code
Research performed in cooperation with DOT, UMTA.
16. Abstract
An extensive amount of financial and operational data on the public transit systems of Texas is presently being published by a variety of governmental agencies and industry associations. However, the manner in which much of this data is collected and published reduces its potential usefulness to transit operators and planning agencies. In response to this problem, standard transit system profiles are developed for the eighteen municipal systems of Texas. The transit system profiles were intended to include a range of financial, operational and performance variables in order to provide an overview of each system's characteristics. The development of these profiles will allow transit operators and planning agencies to: 1) monitor trends and evaluate changes in a transit system's performance over time; and 2) compare the financial and operational performance of one agency with that of similar operations in the state.
17. Key Words
public transit, public transportation, transit profiles, transit performance, transit efficiency, transit effectiveness
18. Distribution Statement
No restrictions. This document is available to the public through the: National Technical Information Service 5285 Port Royal Road Springfield, Virginia 22161
19. Security Classif. (of the report)
Unclassified 20. Security Classif. (of this page)
Unclassified 21. No. of Pages 22. Price
296
Form DOT F 1700..7 <"')


I -
THE DEVELOPMENT OF
STANDARD TRANSIT PROFILES
FOR TEXAS
By
Diane L. Bullard
Associate Research Planner
Technical Report 2005-1F
Technical Study 2-10-89-2005
Sponsored by the
Texas State Department of Highways and Public Transportation
in cooperation with the
U.S. Department of Transportation
Urban Mass Transportation Administration
Texas Transportation Institute
The Texas A&M University System
College Station, Texas 77843-3135
November 1989
The preparation of this study of was financed in part through a grant from the
Urban Mass Transportation Administration,
United States Department of Transportation under the
Urban Mass Transportation Act of 1964, as amended.
---------------------- ------- -----

METRIC (51*) CONVERSION FACTORS
APPROXIMATE CONVERSIONS TO SI UNITS Symbol When You Know Multiply 8y To Find
In ft yd ml
In' ft' yd' mi' ac
oz Ib T
Inches feet yards miles
square inches square feet square yards square miles acres
LENGTH
2.54 0.3048 0.914 1.61
AREA
645.2 0.0929 0.836 2.59 0.395
millimetres metres metres kilometres
millimetres squared metres squared metres squared kilometres squared hectares
MASS (weight)
ounces 28.35 pounds 0.454 short tons (2000 Ib) 0.907
VOLUME
grams kilograms megagrams
fl oz fluid ounces 29.57 millilitres gal gallons 3.785 litres ft, cubic feet 0.0328 metres cubed yd' cubic yards 0.0765 metres cubed
NOTE: Volumes greater than 1000 L shall be shown in m'.
TEMPERATURE (exact)
Fahrenheit 5/9 (after temperature subtracting 32)
Celsius temperature
* SI Is the symbol for the International System of Measurements
Symbol
mm m m km
mm' m' m' km' ha
g kg Mg
mL L m' m'
.. -
... -
E u
.. ..
.. ..
::
•
APPROXIMATE CONVERSIONS TO SI UNITS Symbol When You Know Multiply By To Find
mm m m
km
mm" m" km" ha
g kg Mg
mL L m' m'
millimetres metres metres kilometres
millimetres squared metres squared kilometres squared hectores (10 000 m')
LENGTH
0.039 3.28 1.09 0.621
AREA
0.0016 10.764 0.39 2.53
inches feet yards miles
square inches square feet square miles acres
MASS (weight)
grams 0.0353 kilograms 2.205 megagrams (1 000 kg) 1.103
millilitres litres metres cubed metres cubed
VOLUME
0.034 0.264 35.315 1.308
ounces pounds short tons
fluid ounces gallons cubic feet cubic yards
TEMPERATURE (exact)
°C Celsius 9/5 (then Fahrenheit temperature temperature add 32)
OF of 32 . 98.6 212
-~rl~lr'~IT?~I~I~II~~~lr'~I~~~l~t~11~~~I~I~I~1~LILI~I~I~~~1 1/ _~ I -do I 0 20 I f40 i ~ i 80 i 100
°C 37 OC
These factors conform to the requirement of FHWA Order 5190.1A.
SY/Ilbol
in ft yd mi
in' ft" mi" ac
oz Ib T
floz gal
ft' yd'

----------------
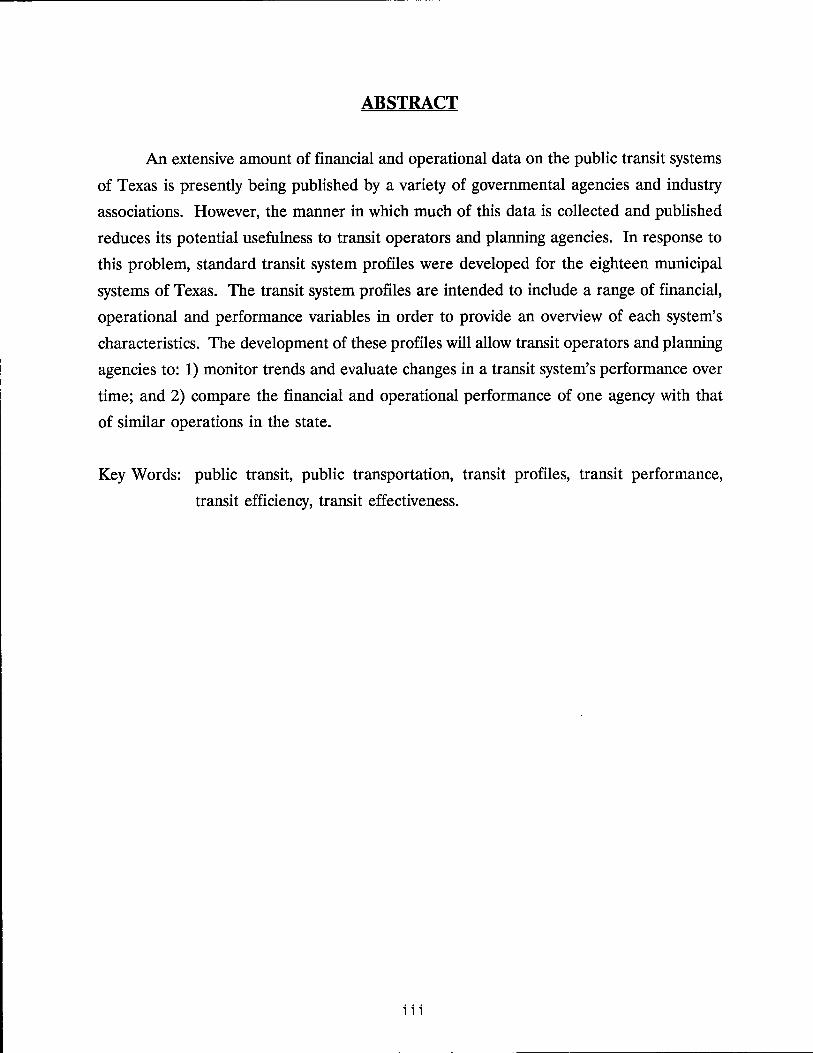
ABSTRACT
An extensive amount of financial and operational data on the public transit systems
of Texas is presently being published by a variety of governmental agencies and industry
associations. However, the manner in which much of this data is collected and published
reduces its potential usefulness to transit operators and planning agencies. In response to
this problem, standard transit system profiles were developed for the eighteen municipal
systems of Texas. The transit system profiles are intended to include a range of financial,
operational and performance variables in order to provide an overview of each system's
characteristics. The development of these profiles will allow transit operators and planning
agencies to: 1) monitor trends and evaluate changes in a transit system's performance over
time; and 2) compare the financial and operational performance of one agency with that
of similar operations in the state.
Key Words: public transit, public transportation, transit profiles, transit performance,
transit efficiency, transit effectiveness.
iii
IMPLEMENTATION STATEMENT
In order to provide the best transportation service possible, transit and planning
agencies must continuously monitor and evaluate the efficiency and effectiveness of transit
system operations. The transit profiles developed as part of this study can be used by the
SDHPT for statewide transit planning, for technical assistance, as background for transit
legislation and in special programs. (Note: Because of the limitations inherent in this type
of work, the performance profiles should not be used to determine funding levels for state
funds or federal funds administered by the Department.)
Transit operators will be able to compare their own financial and operating
performance with that of similar operations. In addition, transit operators will be able to
use the data to monitor trends and evaluate changes in their own performance over time.
The profiles can also be useful in quantifying transit system goals and objectives.
DISCLAIMER
The contents of this report reflect the views of the author who is responsible for the
opinions, findings and conclusions presented herein. The contents do not necessarily reflect
the official views of the Texas State Department of Highways and Public Transportation or
the Urban Mass Transportation Administration. This report does not constitute a standard,
specification or regulation.
iv

SUMMARY
In recent years, rising costs and limited budgets have resulted in the need for transit
properties to continually monitor and evaluate various aspects of the services they provide.
In many instances, transit managers and planners could benefit from examining statistics
from similar operations. In an effort to address this need, standard transit profiles for the
eighteen municipal systems of Texas were developed.
Using the State Department of Highway and Public Transportation's Texas Transit
Statistics as the basis for the profiles, individual transit system performance profiles in the
following five categories were developed:
• Cost Efficiency (Total Vehicle Hours/Total Operating Expense);
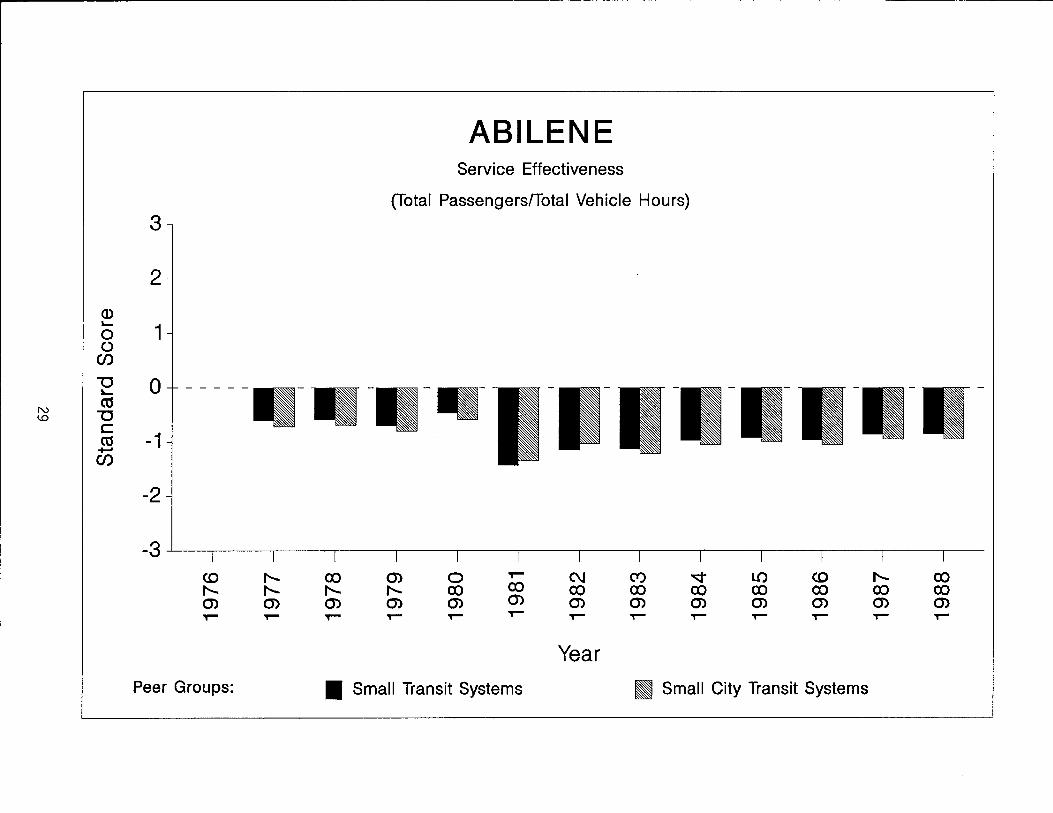
• Service Effectiveness (Total Passengers/Total Vehicle Hours);
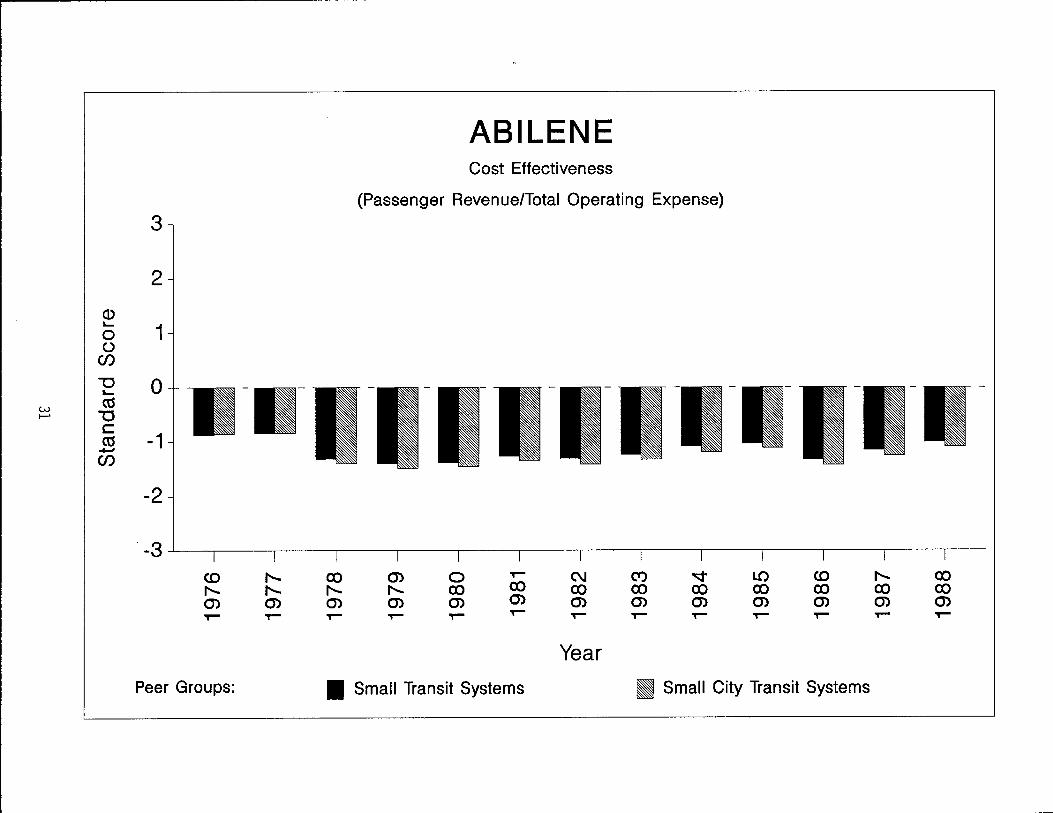
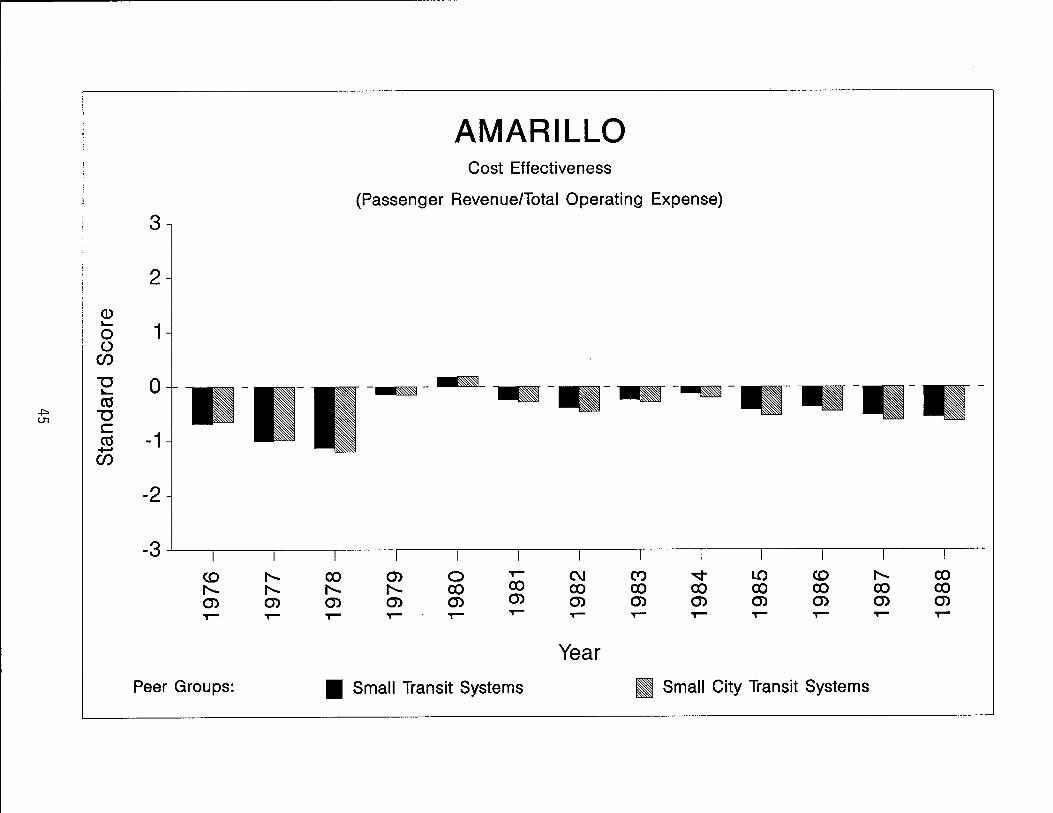
• Cost Effectiveness (Passenger Revenue/Total Operating Expense);
• Labor Efficiency (Total Vehicle Hours/Average Number of Employees); and
• Vehicle Efficiency (Total Vehicle Miles/Average Number of Buses).
In general, these profiles span 12 to 13 years of transit operations (1976-1988) and
permit each transit agency to monitor and evaluate trends in its performance over time.
While this information is probably the single most important use of the transit profiles, it
is also desirable for an agency to compare its performance to that of similar operations.
To do this, transit agencies were assigned to peer groups. Each agency was assigned to two
different peer groups; one group was formed according to the fleet size of the transit
system, and the other was formed according to the size of the metropolitan area served.
This peer group comparison required that an average group performance be estimated for
each indicator; each agency's scores were then compared with the group average.
The transit profiles developed as part of this study should help transit and planning
agencies to monitor trends and identify strengths and weaknesses in various areas of overall
transit system performance. Transit operators will also be able to compare the financial
and operational performance of their system to that of similar operations in the state.
v

--------------------------------

I ---
TABLE OF CONTENTS
Abstract . . . . . . . . . . . . . . . . . . . . . . . . . . . . . . . . . . . . . . . . . . . . . . . . . . . . . . . . 111
Implementation Statement . . . . . . . . . . . . . . . . . . . . . . . . . . . . . . . . . . . . . . . . . .. IV
Disclaimer ...................................................... IV
Summary ....................................................... V
Chapter 1. Introduction ............................................ 1
Organization of This Report .................................... 2
Chapter 2. Conceptual Plan for Developing Transit System Profiles ............ 3
Review of Existing Data ....................................... 3
Transit Systems Included in Profiles . . . . . . . . . . . . . . . . . . . . . . . . . . . . . .. 5
Variables Included in Data Base ................................. 6
Efficiency and Effectiveness in Measuring Transit Performance ........... 6
Computerization of Profiles . . . . . . . . . . . . . . . . . . . . . . . . . . . . . . . . . . . . . 19
Chapter 3. Transit System Profiles .................................... 21
Abilene ................................................... 23
Amarillo ................................................... 37
Austin .................................................... 51
Beaumont .................................................. 65
Brownsville . . . . . . . . . . . . . . . . . . . . . . . . . . . . . . . . . . . . . . . . . . . . . . . . . 79
Corpus Christi .............................................. 93
Dallas ................................................... 107
El Paso .................................................. 121
Fort Worth ................................................ 135
Galveston ................................................. 149
Houston . . . . . . . . . . . . . . . . . . . . . . . . . . . . . . . . . . . . . . . . . . . . . . . . . . 163
vii
----------------------------~-----
r------------ ~ ~ -~----------- ---------------------,
I..aredo . . . . . . . . . . . . . . . . . . . . . . . . . . . . . . . . . . . . . . . . . . . . . . . . . . . 177
Lubbock . . . . . . . . . . . . . . . . . . . . . . . . . . . . . . . . . . . . . . . . . . . . . . . . . . 191
Port Arthur ............................................... 205
San Angelo ................................................ 219
San Antonio . . . . . . . . . . . . . . . . . . . . . . . . . . . . . . . . . . . . . . . . . . . . . . . 233
Waco .................................................... 247
Wichita Falls .............................................. 261
Chapter 4. Recommendations ....................................... 275
References . . . . . . . . . . . . . . . . . . . . . . . . . . . . . . . . . . . . . . . . . . . . . . . . . . . . . 279
Appendix ...................................................... 281
viii

,---------------------------- ---- --
CHAPTER 1 INTRODUCTION
An extensive amount of financial and operational data on the public transit systems
of Texas is presently being published by a variety of governmental agencies and industry
associations. Unfortunately, the manner in which much of this data is collected and
published reduces its potential usefulness to transit operators and planning agencies. Many
of the transit and planning agencies across the state simply do not have the resources
available to perform the analyses necessary to get the full benefit from all the data that is
published.
In response to this problem, the Texas State Department of Highways and Public
Transportation (SDHPT) contracted with the Texas Transportation Institute (TTl) to
develop standard transit profiles for Texas. These profiles would be patterned after those
developed in California.
The primary goal of this study was to use existing data sources to develop a set of
profiles for the transit systems of Texas that could be updated annually. To achieve this
goal, a work program based on the following basic objectives was followed:
• To design the profiles to meet as closely as possible the needs of the transit
operators and planning agencies;
• To make the profiles as comprehensive as possible within time and budget
constraints, recognizing that provision of too much information would reduce the
usefulness of the profiles;
• To explore methods of computerizing the profiles; and
1
• To recommend procedures for maintaining, updating and improving the transit
system data base and profiles.
The development of these profiles would allow transit operators and planning
agencies to:
• Monitor trends and evaluate changes in a transit system's performance over time;
and
• Compare the financial and operational performance of one agency with that of
similar operations in the state.
Or&anization of This Report
Following this introduction, Chapter 2 describes the conceptual plan for developing
the transit system profiles. Chapter 3 presents the individual transit system statistical and
performance profiles, and Chapter 4 presents recommendations for improving the data base
and transit system profiles. Following these chapters, an address list of the eighteen
municipal transit agencies in Texas is included in the Appendix.
2

CHAPTER 2 CONCEPTUAL PLAN FOR
DEVELOPING TRANSIT SYSTEM PROFILES
Review of Existina: Data Sources
The first task in the process of developing transit system profiles was to identify and
review existing sources that could be used as the basis for developing the profiles. Three
major sources of transit system data were identified:
• Data collected by the SDHPT for use in compiling the Texas Transit Statistics;
• Data collected by the Urban Mass Transportation Administration (UMTA) for use
in compiling the National Urban Mass Transportation Statistics Section 15 Annual
Reports; and
• Data collected by the American Public Transit Association (APTA) for use in
compiling APTA's reports on Transit Operating and Financial Statistics.
All three of these agencies' reports are published annually and are readily available to
transit operators and planning agencies. Both the APTA and UMTA data are national in
scope, and both are extremely comprehensive; the statistics published by the SDHPT are
statewide in nature and somewhat less comprehensive than either the UMTA or APTA
statistics.
Originally, it was hoped that data from all three of these sources could be collected,
edited and merged into a single computer file for use in developing the transit system
profiles. This was not possible, however, due to major differences in reporting time periods
and definitions of terms. For instance, UMTA and APTA data are reported on a transit
3
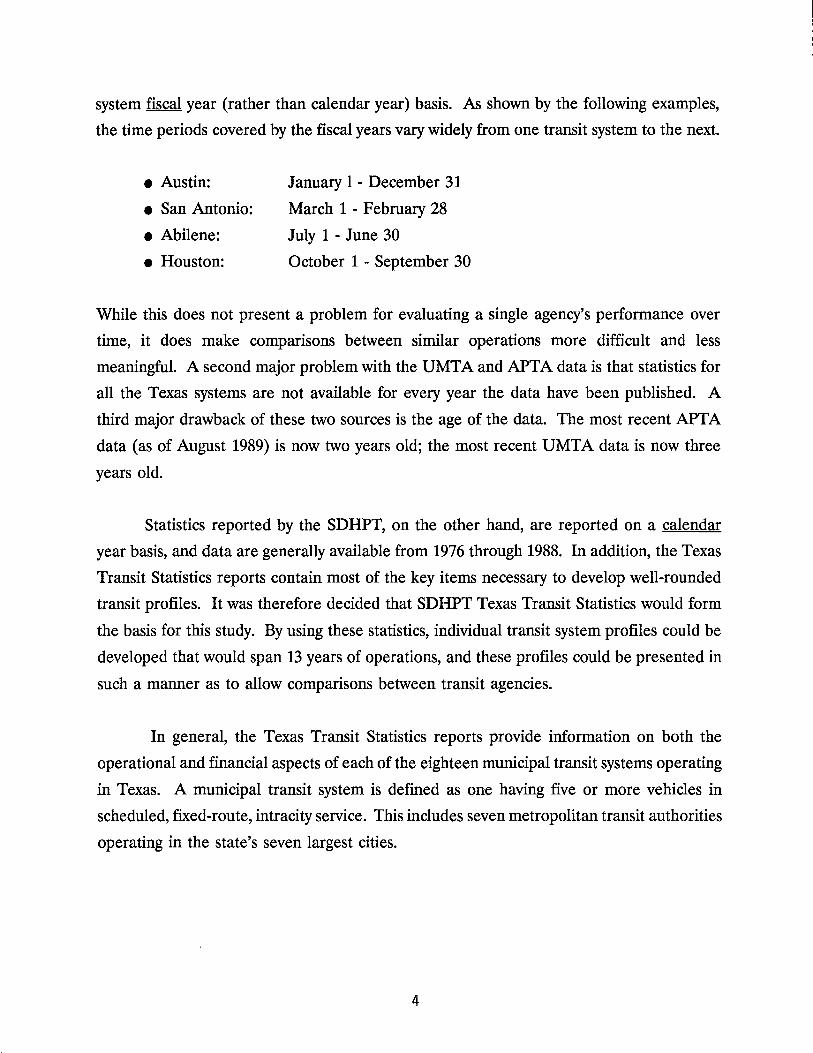
system fiscal year (rather than calendar year) basis. As shown by the following examples,
the time periods covered by the fiscal years vary widely from one transit system to the next.
• Austin:
• San Antonio:
• Abilene:
• Houston:
January I - December 31
March 1 - February 28
July 1 - June 30
October 1 - September 30
While this does not present a problem for evaluating a single agency's performance over
time, it does make comparisons between similar operations more difficult and less
meaningful. A second major problem with the UMTA and APTA data is that statistics for
all the Texas systems are not available for every year the data have been published. A
third major drawback of these two sources is the age of the data. The most recent APTA
data (as of August 1989) is now two years old; the most recent UMTA data is now three
years old.
Statistics reported by the SDHPT, on the other hand, are reported on a calendar
year basis, and data are generally available from 1976 through 1988. In addition, the Texas
Transit Statistics reports contain most of the key items necessary to develop well-rounded
transit profiles. It was therefore decided that SDHPT Texas Transit Statistics would form
the basis for this study. By using these statistics, individual transit system profiles could be
developed that would span 13 years of operations, and these profiles could be presented in
such a manner as to allow comparisons between transit agencies.
In general, the Texas Transit Statistics reports provide information on both the
operational and financial aspects of each of the eighteen municipal transit systems operating
in Texas. A municipal transit system is defined as one having five or more vehicles in
scheduled, fixed-route, intracity service. This includes seven metropolitan transit authorities
operating in the state's seven largest cities.
4

Additional data collected quarterly and semi-annually by the SDHPT on Sections
16B(2)/18 transportation providers in the state was also reviewed for possible inclusion in
the transit profiles. An analysis of the data, however, revealed a number of problems that
precluded inclusion of these transportation providers in the transit profiles. First,
insufficient information was available to develop the profiles as outlined in the following
sections of this chapter. Second, many of the Sections 16B(2)/18 providers fail to file
reports each quarter. Thus, yearly totals for those systems are low which, in turn, makes
it impossible to: (1) monitor trends in a system's performance over time, or (2) make
comparisons between similar systems. Data reliability is also a serious consideration.
Unreported in-kind services (e.g., vehicle maintenance at the City yard) are much more
likely with small systems and may seriously distort financial and performance measures.
Transit Systems Included in Profiles
The determination of which transit systems would be profiled in this study was
largely determined by the availability of complete, reliable financial and operational data.
This was also the case for the development of transit profiles in California. In California,
the decision was made to prepare a comprehensive listing of the state's public and
paratransit operators including address and ridership information. Then, for the largest
operators, detailed information was provided in the following categories: 1) general system
characteristics; 2) fleet operations; 3) financial data and vehicle needs; 4) employee data;
and 5) performance statistics. A similar scenario was followed in this study. D-ll of the
SDHPT presently maintains a comprehensive listing of: 1) rural and non-urbanized
transportation services (Sections 16B(2)/18 providers); and 2) paratransit operators in the
state (including taxicab systems, human services transportation systems, and other
paratransit services such as airport ground transportation, employer operated transit and
commuter services). This study, then, focused on profiling more detailed information on
the larger municipal systems in the areas as outlined above for California. (Note: Technical
Study 2008, to be peiformed by TTl during FY 1989-90, will focus on measuring transit
peiformance of rural and non-urbanized systems.)
5

Variables Included in Data Base
The transit system profiles were intended to include a range of operating, financial
and performance variables providing an overview of each system's characteristics. Variables
selected included those that the transit industry has traditionally found to be most useful
in assessing system operations:
• Total passengers;
• Total vehicle miles;
• Total vehicle hours;
• Average number of buses on regular routes (during peak periods);
• Average number of employees;
• Total operating revenue;
• Passenger revenue;
• Total operating expense;
• Net public operating cost;
• Total public capital cost; and
• Total public expense.
Efficiency and Effectiveness in Measurin2 Transit Performance
In using the SDHPT Texas Transit Statistics as the basis for developing standard
transit system profiles, sufficient information is available to calculate more than 50 different
indicators of transit system performance. For the purposes of this study, however, this list
has been narrowed to a set of 5 indicators that measure various aspects of transit system
efficiency and effectiveness adapted from the Irvine Performance Evaluation Method
(IPEM).
IPEM was developed, in part, to assist UMTA with conducting Triennial Reviews
of transit agencies required under the Surface Transportation Act of 1982. Its other
purpose is to provide transit managers with a simple but reliable procedure for
6

systematically evaluating the performance of their organizations against systems which are
similar to theirs. A summary of the attributes of the IPEM procedure is presented in the
following pages (1,2,3.). *
The concept of efficiency as it is employed in IPEM can be defined as the
relationship between resources used and the output or level of service produced.
Effectiveness can be defined as the use of output to accomplish goals, or the value the
public actually derives from services. Briefly stated, efficiency is "doing things right;"
effectiveness is "doing the right things."
The IPEM system recognizes that efficiency in public transit is an elusive concept
because many goals are outlined which can be contradictory. Increasing transit ridership
is the most frequently stated goal, and this has led to the pursuit of costly, peak-hour service
in many cities.
Other goals have been to reduce auto congestion and pollution in cities, provide
mobility for the transit-dependent, and to subsidize fares for the poor and elderly. Over
the years, the unintended consequence of pursuing these conflicting objectives has been such
an inflation in transit operating costs that it is now being directly questioned whether transit
has been "doing the right thing" in pursuing them. Moreover, judging the performance of
agencies by these criteria, many have done poorly, in substantial part because they have
little control over the external factors which affect transit performance. For example,
managers in small or medium-sized, low-density communities will have little ability to
significantly increase the community's preference for transit services. As a result, it is
difficult to reliably evaluate transit performance in terms of effectiveness. Goals conflict,
and appropriate measures are frequently poor or non-existent.
In contrast to effectiveness, the efficiency with which a transit agency utilizes
resources can be accurately measured. As managers choose when and how to allocate
resources, the efficiency of management's performance can be reliably assessed.
* Numbers in parentheses denote references listed at the end of the report.
7

,---
Because the efficiency of transit is that aspect of its performance which can be most
confidently measured, the emphasis in IPEM is on evaluation of efficiency, although
indicators are employed which measure effectiveness. The assumption in IPEM is that
public transit managers can make their greatest contribution by being efficient -- by
supplying the greatest amount of service for the least amount of resources. Managers must
ensure that service supports the economic, social, and environmental goals of the
community, since their agencies depend on the support of the communities they serve.
However, if transit is to be expected to perform well, the demands made of it must be
better related to its capacity to meet its goals efficiently. Where this occurs, performance
can be reliably evaluated and managers can be realistically held accountable.
In using the IPEM procedure to evaluate performance, the underlying idea is that
a small set of diagnostic indicators, which track an agency's performance over time as well
as compare it with systems that are similar to it, will provide a balanced assessment of how
efficiently and effectively the system is being operated. The indicators do not capture every
activity of an agency, but they do indicate progress or deficiency in key areas.
The IPEM procedure consists of two main features: a set of performance indicators
that measure the efficiency and effectiveness of a transit agency; and a peer-group typology
that classifies agencies for the purposes of comparison according to their degree of
similarity to each other. Peer-group comparison requires that average group performance
be estimated on each indicator; an individual agency's scores are then compared with the
group averages. These comparison scores are termed "standard scores." Information from
the SDHPT Texas Transit Statistics constitutes the data base for the procedure in this study.
IPEM Performance Indicators
IPEM employs nine indicators to measure a system's performance. The indicators
measure specific dimensions of transit efficiency and effectiveness. The performance
indicators were selected through the statistical procedure of principal components factor
analysis.
8

Factor analysis organizes an unwieldy number of variables into a manageable form.
Through statistical procedures, it arranges the variables into groups composed of variables
that are highly correlated with each other (that is, closely related), called factors or
components or dimensions. From each group (factor), a single variable that is descriptive
or representative of the variables composing the group is selected for use in subsequent
statistical analysis. In the development of IPEM, 48 performance indicators based on
Section 15 data formed the original set of variables. Factor analysis arranged these
variables into seven groups. The variable best representing each group was selected for use
in the study. Two more indicators were added later to improve informativeness.
The seven performance dimensions are cost efficiency, service effectiveness, cost
effectiveness, labor efficiency, vehicle efficiency, maintenance efficiency, and safety. The
indicators and the performance concepts they ope rationalize are listed in Table 1. The first
three of the seven indicators (which measure output per cost, utilization of service and
revenue generation per expense) were judged by statistical means to be the most
informative and global measures available in the set.
Table 1.
IPEM "Marker" Variables Best Representing the Underlying Performance Concept
Performance Concept Performance Indicator
1. Cost Efficiency (Output per Cost) Total Vehicle Hours per Total Operating Expense
2. Service Effectiveness (Utilization of Service) Total Passengers per Total Vehicle Hours
3. Cost Effectiveness (Revenue Generation per $ Expense) Passenger Revenue per Total Operating Expense
4. Labor Efficiency Total Vehicle Hours per Average Number of Employees
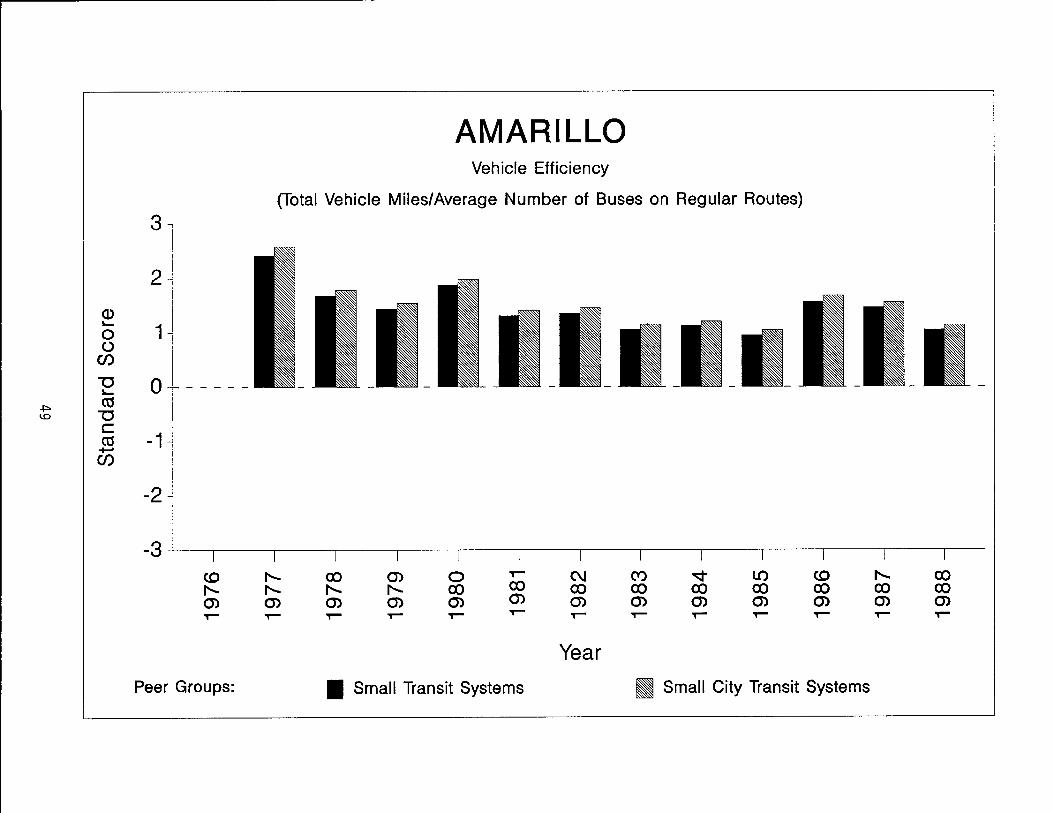
5. Vehicle Efficiency
6. Maintenance Efficiency
7. Safety
Total Vehicle Miles per Average Number of Buses on Regular Routes
Total Vehicle Miles per Maintenance Employee
Total Vehicle Miles per Dollar Maintenance Expense
Total Vehicle Miles per Total Accidents
Total Vehicle Miles per Dollar of Collision & Liability Expense
Cost Efficiency. Computed as vehicle hours per operating expense (Total Vehicle
Hours/Total Operating Expense), this indicator measures the number of output units
produced for each dollar of expense. The inverse of the more faIniliar operating cost per
vehicle hour, it is probably the best overall measure of output. The inverted form provides
9

for a better graphic presentation. When a system's performance improves, the bar graph
indicator rises; when performance declines, the bar graph falls.
Service Effectiveness. Measured by passengers per hour (Total Passengers/Total
Vehicle Hours), this indicator reports how much service is utilized. Hours rather than miles
are used as the denominator because the former are more consistent under varying
conditions.
Cost Effectiveness. Calculated as the ratio of passenger revenue to total operating
expense (Passenger Revenue/Total Operating Expense ), this indicator reports the
percentage of operating expense recovered from passenger and other operating revenues.
Six additional indicators are used in IPEM to explain performance in more specific
areas of cost and service that are known to make an important impact on overall
performance. Labor and vehicle efficiency are represented by single indicators, whereas two
indicators are used to represent the safety and maintenance dimensions.
Labor Efficiency. Measured as the vehicle hours per employee (Total Vehicle
Hours/Average Number of Employees), this indicator measures the number of output hours
per employee (with employees expressed in terms of employee equivalent hours).
Theoretically, maximum labor efficiency would be 2,080 hours per employee per year, the
equivalent of one hour of service per employee pay hour. However, this is impossible
because total employees includes many employees other than drivers. The indicator is
presented in IPEM as a decimal in units of 10,000; for example, .118 is the equivalent of
1,180 vehicle hours per year for each employee.
Vehicle Efficiency. Calculated as the vehicle miles per bus (Total Vehicle
Miles/Average Number of Buses on Regular Routes), this indicator measures vehicle
efficiency by summarizing the number of miles traveled annually per vehicle. This indicator
is also presented in units of 10,000 (e.g., a vehicle efficiency value of 3.94 is the equivalent
of 39,400 average vehicle miles per year).
10

Maintenance Efficiency. Maintenance efficiency is measured in two ways. The first
is vehicle miles per maintenance employee (Total Vehicle Miles/Total Maintenance
Employees). As such, this indicator measures how efficiently buses are maintained from
a labor standpoint. Systems with very old or very new buses may rate poorly on this
indicator. The indicator is also presented in units of 10,000 (e.g., a value of 7.89 is
equivalent to 78,900 annual vehicle miles per maintenance employee).
Maintenance efficiency can also be computed as vehicle miles per dollar
maintenance expense (Total Vehicle Miles/Total Maintenance Expense). As such, this
indicator was added as a companion maintenance performance measure and is represented
directly (e.g., a value of 3.62 equals 3.62 vehicle miles per maintenance dollar).
Safety. Safety is the second performance dimension that can be measured in two
ways. First, safety can be computed as vehicle miles per collision accident (Total Vehicle
Miles/Total Number of Collision Accidents). This indicator gauges how safely service is
operated. This indicator can be somewhat umeliable for comparing agencies, however,
because of variations in how agencies define and report collision accidents. Actual values
for this indicator are also reported in units of 10,000 (e.g., 2.31 is the equivalent of 23,100
vehicle miles between collision accidents).
A second measure of safety is the vehicle miles per dollar casualty and liability
insurance expense (Total Vehicle Miles/Total Casualty and Liability Insurance Expense).
This indicator was added by IPEM as companion measure of safety. However, because of
the usual lag between the year of an accident and payment of a claim, an agency's expenses
in a given year may not correspond to its accident rate. For this reason (and the lack of
readily available data on casualty and liability insurance expense), this indicator of
performance is not suggested for use in the development of transit profiles for Texas
properties.
11

Application of IPEM Indicators in Measurinl: Transit Performance in Texas
For this study, sufficient data are available from the Texas Transit Statistics to
calculate the first five performance indicators as outlined in the IPEM procedure:
1. Cost Efficiency or Output per Cost
(Total Vehicle Hours/Total Operating Expense)
2. Service Effectiveness or Utilization of Service
(Total Passengers/Total Vehicle Hours)
3. Cost Effectiveness or Revenue Generation per Dollar of Expense
(Passenger Revenue/Total Operating Expense)
4. Labor Efficiency
(Total Vehicle Hours/Average Number of Employees)
5. Vehicle Efficiency
(Total Vehicle Miles/Average Number of Buses on Regular Routes)
As mentioned previously, the first three of these indicators (which measure output per cost,
utilization of service and revenue generation per expense) were judged by statistical means
to be the most informative and global measures available in the set.
Using these five measures of efficiency and effectiveness, profiles summarizing key
financial and operational aspects of each transit agency's performance between the years
of 1976 and 1988 were produced. This will allow each agency to monitor and evaluate
trends in its performance over time.
While this information is probably the single most important use of the transit
profiles, it is also desirable for a transit agency to compare its performance to that of
similar operations. To do this, transit agencies were assigned to peer groups. Each agency
12
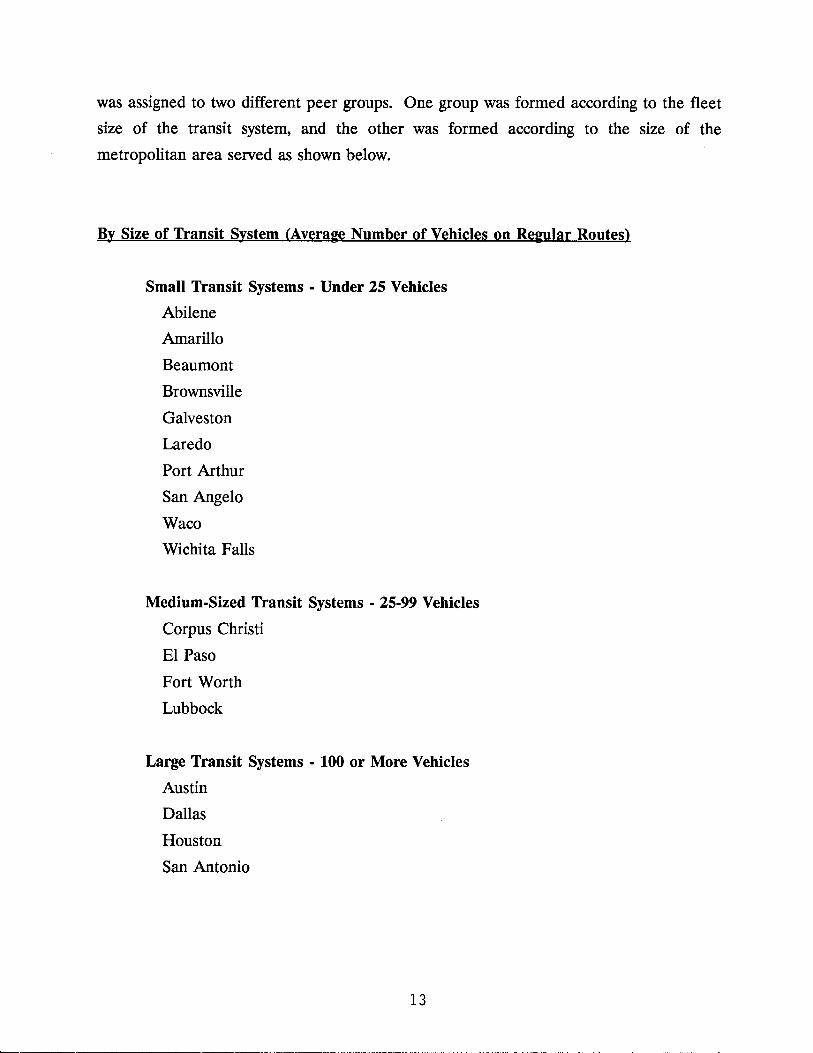
was assigned to two different peer groups. One group was formed according to the fleet
size of the transit system, and the other was formed according to the size of the
metropolitan area served as shown below.
By Size of Transit System (Average Number of Vehicles on Regular Routes)
Small Transit Systems - Under 25 Vehicles
Abilene
Amarillo
Beaumont
Brownsville
Galveston
Laredo
Port Arthur
San Angelo
Waco
Wichita Falls
Medium-Sized Transit Systems - 25-99 Vehicles
Corpus Christi
El Paso
Fort Worth
Lubbock
Large Transit Systems - 100 or More Vehicles
Austin
Dallas
Houston
San Antonio
13
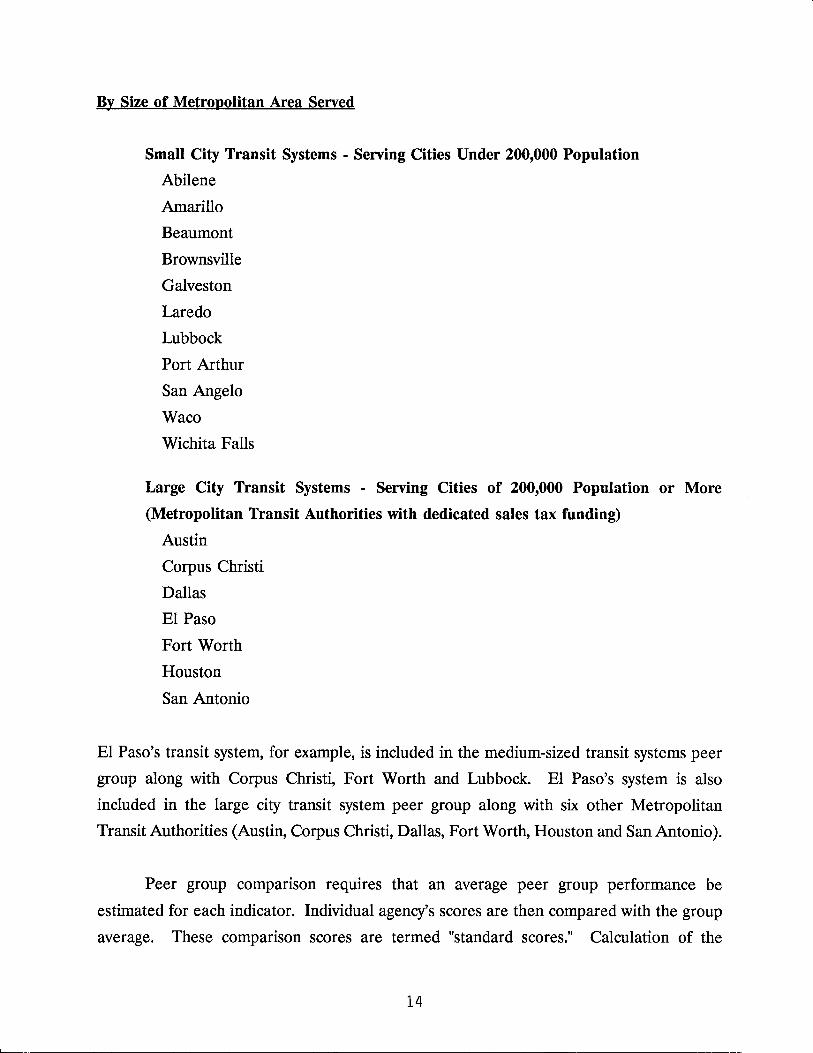
By Size of Metropolitan Area Served
Small City Transit Systems - Serving Cities Under 200,000 Population
Abilene
Amarillo
Beaumont
Brownsville
Galveston
Laredo
Lubbock
Port Arthur
San Angelo
Waco
Wichita Falls
Large City Transit Systems - Serving Cities of 200,000 Population or More
(Metropolitan Transit Authorities with dedicated sales tax funding)
Austin
Corpus Christi
Dallas
EI Paso
Fort Worth
Houston
San Antonio
EI Paso's transit system, for example, is included in the medium-sized transit systems peer
group along with Corpus Christi, Fort Worth and Lubbock. EI Paso's system is also
included in the large city transit system peer group along with six other Metropolitan
Transit Authorities (Austin, Corpus Christi, Dallas, Fort Worth, Houston and San Antonio).
Peer group comparison requires that an average peer group performance be
estimated for each indicator. Individual agency's scores are then compared with the group
average. These comparison scores are termed "standard scores." Calculation of the
14
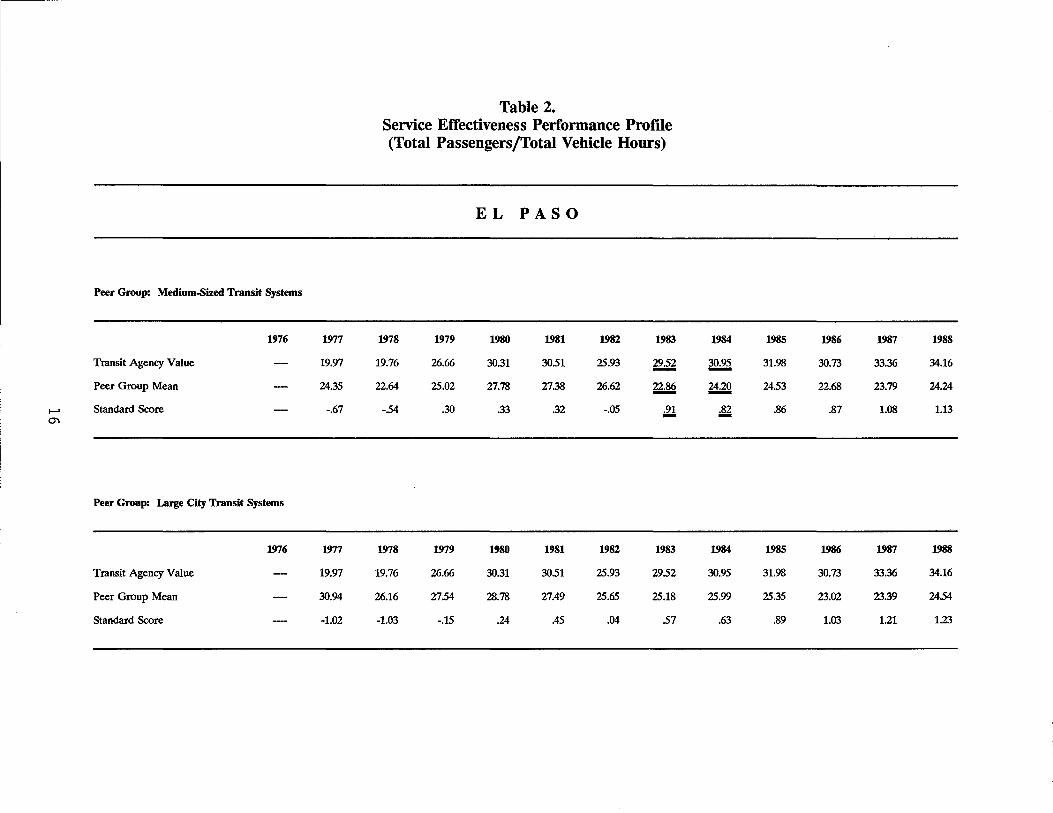
standard scores is obtained by subtracting the peer group average (mean) from the agency
value and dividing by the peer group standard deviation for a particular indicator.
Standard Score Agency Value - Group Mean Peer Group Standard Deviation
In this way, standard scores are calculated for each agency on each indicator, for each year
data are available. Table 2 on the following page illustrates this concept. In this table, El
Paso's service effectiveness is presented and compared to transit systems of similar size (top
half of table) and then to transit systems operating in cities of similar size (lower half of
table). In each instance, the first line represents the agency's values, the second line
contains the averages for the particular peer group and the last line shows the standard
scores. The actual values describe the agency's individual performance both for a single
year and over time, and the standard scores describe its performance compared with its
peers, both for a single year and over time.
A standard score for each of a system's indicators may range from above to below
zero. Zero represents the average (mean) for the peer group on that indicator. A standard
score above zero represents above average performance for the system; a standard score
below zero represents below average performance. In all cases, negative standard scores
indicate comparatively poor (although perhaps explainable) performance. For example, the
reason Transit System "A" (that is almost fully accessible with wheelchair lifts) exhibits
negative standard scores in the area of maintenance efficiency may be because the other
transit systems in the peer group have very few (if any) wheelchair lift-equipped buses in
service and have, therefore, had less maintenance required on their fleets.
Generally, very strong performance exists where a system's scores are between one
and two positive standard deviations. Standard scores exceeding 3 standard deviations are
statistically improbable and may suggest a borderline case where an agency is being
inappropriately compared with other agencies and is achieving scores that are unrealistic.
Standard scores also allow the use of graphs to compare a system visually with its
peers. Figure 1 illustrates the graph of the standard scores for the agency in Table 2.
15
,------------------------------------------------------------------------------------------------------------- ------
I-' (j)
Peer Group: Medium-Sized Transit Systems
1976
Transit Agency Value
Peer Group Mean
Standard Score
Peer Group: Large City Transit Systems
Transit Agency Value
Peer Group Mean
Standard Score
1976
1977
19.97
24.35
-.67
1977
19.97
30.94
-1.02
Table 2. Service Effectiveness Performance Profile (Total Passengers/Total Vehicle Hours)
1978
19.76
22.64
-.54
1978
19.76
26.16
-1.03
1979
26.66
25.02
.30
1979
26.66
2754
-.15
EL PASO
1980
30.31
27.78
.33
1980
30.31
28.78
.24
1981
3051
27.38
.32
1981
3051
27.49
.45
1982
25.93
26.62
-.05
1982
25.93
25.65
.04
1983
~
~
.91 -
1983
2952
25.18
.57
1984
30.95 -~
.82 -
1984
30.95
25.99
.63
1985
31.98
2453
.86
1985
31.98
25.35
.89
1986
30.73
22.68
.87
1986
30.73
23.02
1.03
1987
33.36
23.79
1.08
1987
33.36
23.39
1.21
1988
34.16
24.24
1.13
1988
34.16
2454
1.23
EL PASO Service Effectiveness
(Total Passengers/Total Vehicle Hours)
3
2
(]) ..... 1 0
() CJ)
"'0 0 - - - - -..... (tf
I--' "'0 '-.l c -1 (tf .......
CJ)
-2
-3 <.0 ,...... co ,...... ,...... ,...... 0') 0') 0') .,-- .,-- .,--
Year Peer Groups: • Medium-Sized Transit Systems • Large City Transit Systems
Figure 1.
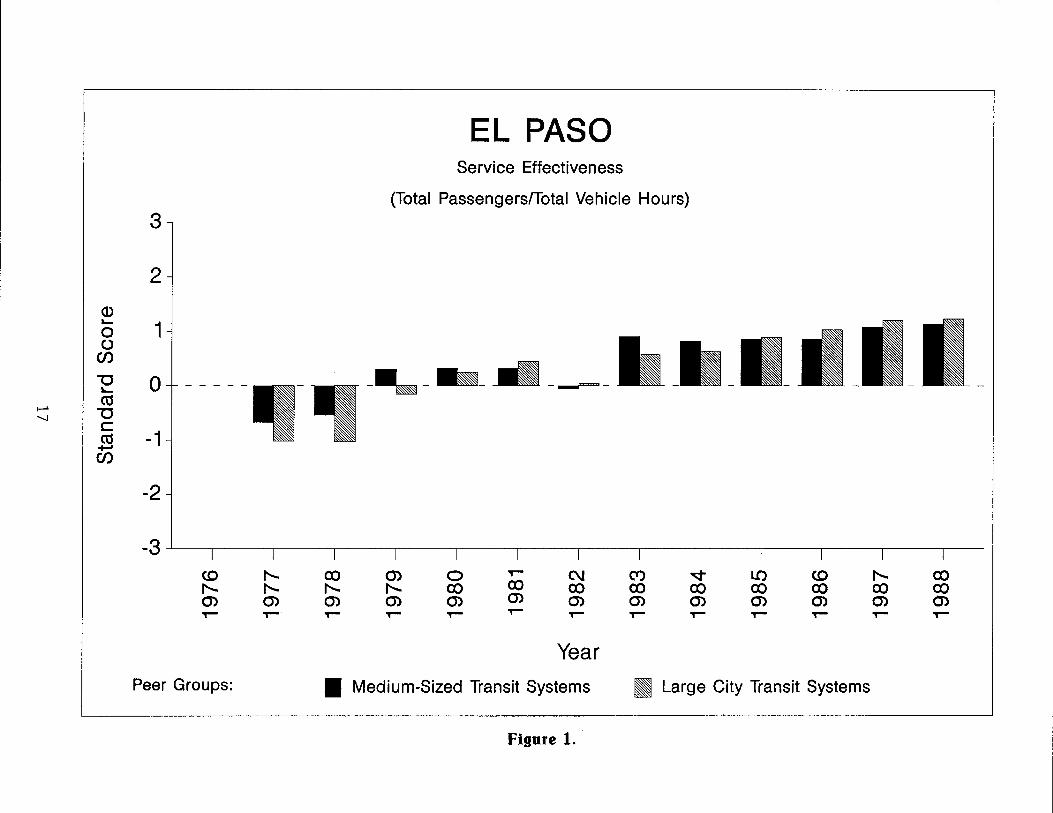
As shown in Figure 1, each year is represented by two different bars; one bar
describes the agency's performance as compared to transit systems of similar size, and the
other bar describes its performance compared to transit systems operating in cities of
similar size. Ideally, a system would have positive scores on each indicator, and these
scores would be improving each year against the mean for the peer group.
The preceding example illustrates how the evaluation of a system's performance is
enhanced by having both the trends in actual values and the comparative data obtained
through the peer group generated standard scores. This example also shows how the
standard scores may vary depending on make-up of the peer group. The standard scores
suggest the range within which an agency may be expected to perform well, and perhaps
more important, indicate when it is doing poorly.
However, standard scores can be deceptive because they reflect variations in
aggregated data, and they may imply improvement or decline in an agency's performance
that is not real. For example, in Table 2, the actual passenger trips per vehicle hour
increased in 1984, but the peer group's average increased at a higher rate, so the agency's
standard score decreased in 1984. In this instance, the standard score implies a loss of
performance that did not occur in real terms. Thus, both the actual values and standard
scores are important in any evaluation of an agency's performance.
From a management perspective, the actual values provide information with which
to monitor improvement or decline in performance from one year to the next. In this
respect, they are more informative than the standard scores. The standard scores, however,
are helpful as benchmarks for what an agency might achieve.
The developers of the IPEM procedure note that several points about IPEM should
be stated in concluding the description of the system. First, IPEM provides an indication
of "high" or "low," "good" or "poor" performance in terms of what the systems in a given
peer group are presently achieving over a given period of years. Systems are compared
against their peers, not against all systems, and no fixed or national standard is presumed
that all transit systems should meet. In addition, IPEM provides for evaluation of those
18

aspects of performance that are quantifiable; it cannot account for intangible factors such
as employee or passenger satisfaction, nor can it provide an assessment of how well a
system meets the individual transit needs of its service area (although IPEM may be
informative to management attempting to make such types of evaluations. For example,
passenger and revenue statistics may indirectly reflect customer satisfaction).
Computerization of Profiles
Transit system data (yearly totals) from published Texas Transit Statistics were
entered onto Texas A&M University's mainframe computer. The transit system
performance profiles (standard scores) were produced using the Statistical Analysis System
(SAS) statistical package. The data base and all SAS programs will be transferred onto a
computer tape compatible with the SDHPT's mainframe computer facilities upon final
approval of the study. The data base and performance profiles can then be easily updated
and maintained annually by SDHPT staff with a minimum level programming time.
Transit system reports submitted to the SDHPT for the calculation of the Texas
Transit Statistics are presently maintained by D-ll on a microcomputer using dBaseIII + . Copies of the data on floppy disks can easily be made for those transit operators who desire
to perform further evaluations of various aspects of transit performance.
19

-------------------
CHAPTER 3 TRANSIT SYSTEM PROFILES
This chapter presents individual profiles on the eighteen municipal transit systems
in Texas. For each system, a table summarizing data collected for 1976 through 1988 is
included for an overall transit agency statistical profile spanning thirteen years of operation.
N ext, transit agency performance profiles are presented in the following five
categories:
• Cost Efficiency;
• Service Effectiveness;
• Cost Effectiveness;
• Labor Efficiency; and
• Vehicle Efficiency
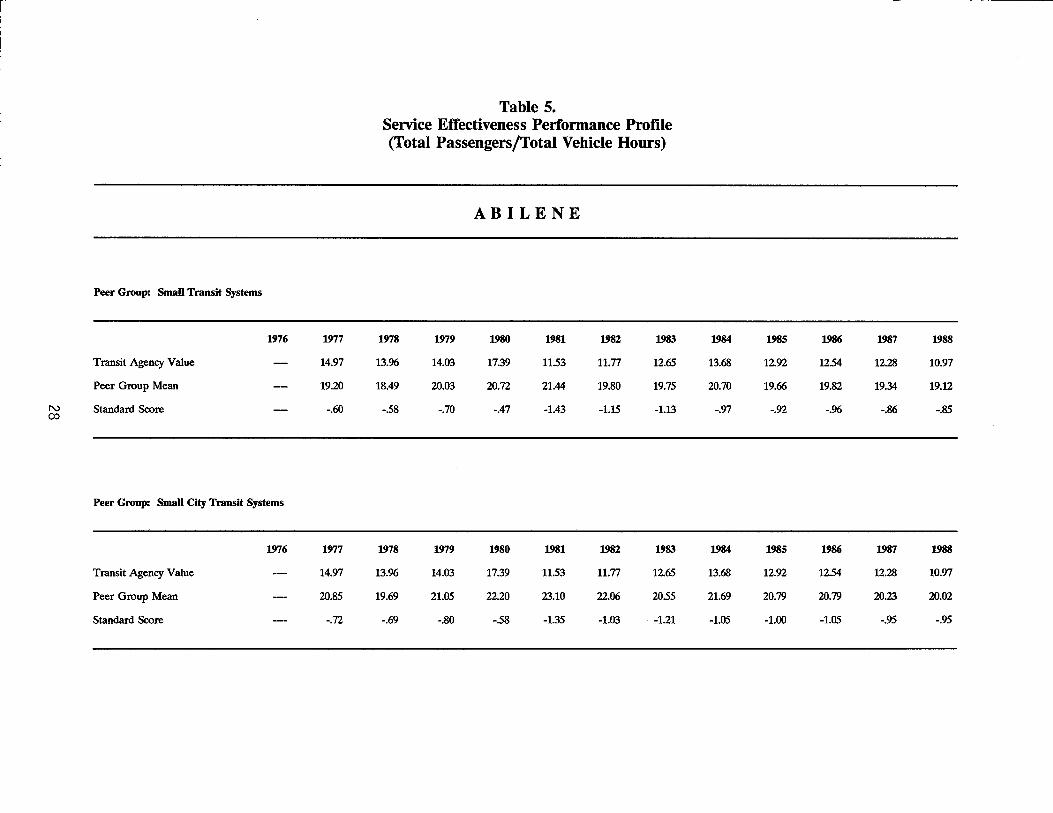
For each performance category, a two-part table is included in which the first line of each
part represents the transit agency's values for that specific performance dimension. The
second line contains the averages for the particular peer group, and the last line presents
the standard scores. The actual transit agency values describe the agency's individual
performance both for a single year and over time, and the standard scores describe its
performance compared with its peers, both for a single year and over time. Following each
table is a graphic representation of the agency's performance profiles (standard scores).
In reviewing the transit system statistical profiles, it should be noted that data on
total vehicle hours, average number of buses on regular routes and average number of
employees is generally not available for 1976. Therefore, Cost Efficiency, Service
Effectiveness, Labor Efficiency and Vehicle Efficiency Performance Profiles could not be
calculated for 1976.
21


ABILENE
23

----------------------------~------------------------ -------------- ---------------------

Table 3. Transit System Statistical Prorde
ABILENE
1976 1977 1978 1979 1980 1981 1982 1983 1984 1985 1986 1987 1988
Total Passengers 181,908 254,402 288,750 298,386 314,838 344,207 421,640 418,923 437,719 423,416 424,053 403,935 359,158
Total Vehicle Miles 234,064 277,705 317,669 352,837 309,902 462,606 501,279 463,627 449,640 472,131 478,194 428,129 462,637
Total Vehicle Hours 16,991 20,678 21,272 18,102 29,848 35,814 33,129 32,004 32,764 33,818 32,893 32,738
Average No. Buses on Regular Routes 6 6 6 6 11 13 13 12 13 12 10 10
Average N No. Employees 13 15 16 16 26 30 30 26 25 26 29 28 (J1
Total Operating Revenue ($) 49,803 49,662 47,965 38,699 45,725 82,676 111,753 129,186 129,220 145,599 152,753 130,257 125,194
Passenger Revenue ($) 49,803 49,662 47,965 38,699 45,725 82,676 111,631 127,383 129,198 145,599 124,657 112,398 106,419
Total Operating Expense ($) 181,753 181,355 240,862 297,742 406,867 664,715 778,692 831,904 794,228 840,752 925,964 820,065 809,157
Net Public Operating Cost ($) 131,950 131,693 192,897 259,043 361,142 582,039 666,939 702,718 665,008 695,153 773,211 689,808 683,963
Total Public Capital Cost ($) 1,759,500 361,454 618,362 3,609 6,751 157,924 8,008
Total Public Expense ($) 131,950 131,693 192,897 259,043 361,142 2,341,539 1,028,393 1,321,080 668,617 701,904 931,135 689,808 691,971
Source: Texas Transit Statistics and Abilene Transit System

r---------------------------------- --
N 0'1
Peer Group: SmaU Transit Systems
1976
Transit Agency Value
Peer Group Mean
Standard Score
Peer Group: SmaU City Transit Systems
Transit Agency Value
Peer Group Mean
Standard Score
1976
1977
.094
.087
.43
1977
.094
.087
.45
Table 4. Cost Efficiency Performance Profile
(Total Vehicle Hours/Total Operating Expense)
1978
.086
.089
-.14
1978
.086
.088
-.09
1979
.071
.066
.39
1979
.071
.066
.44
ABILENE
1980
.044
.055
-1.00
1980
.044
.055
-1.01
1981
.045
.048
-.37
1981
.045
.048
-.39
1982
.046
.051
-.28
1982
.046
.051
-.29
1983
.040
.045
-.54
1983
.040
.045
-.54
1984
.040
.041
-.12
1984
.040
.042
-.16
1985
.039
.040
-.19
1985
.039
.041
-.32
1986
.037
.039
-.43
1986
.037
.039
-.48
1987
.040
.038
53
1987
.040
.038
.47
1988
.040
.037
.75
1988
.040
.037
.71

....-------------------------------------------------- --------
Q) L.-
a ()
en "0 L.-
etS "0 c etS
+"'" en
ABILENE Cost Efficiency
(Total Vehicle Hours/Total Operating Expense) 3
2
1
o _____ 111_~= _111- -.--- .--.--1
-2
-3~--~--~----~----~--~----~--~~--~----~--~----~----~--~---
(0 f'-... co m 0 T""" C\J (Y) oq- LO (0 f'-... co f'-... f'-... f'-... f'-... co co co co co co co co co m m m m m m m m m m m m m T""" T""" T""" T""" T""" T""" T""" T""" T""" T""" T""" T""" T"""
Year Peer Groups: • Small Transit Systems • Small City Transit Systems
Peer Group: Small Transit Systems
1976
Transit Agency Value
Peer Group Mean
N CO
Standard Score
Peer Group: Small City Transit Systems
1976
Transit Agency Value
Peer Group Mean
Standard Score
1977
14.97
19.20
-.60
1977
14.97
20.85
-.72
Table 5. Service Effectiveness Performance Profile (Total Passengers/Total Vehicle Hours)
1978
13.%
18.49
-.58
1978
13.96
19.69
-.69
1979
14.03
20.03
-.70
1979
14.03
21.05
-.80
ABILENE
1980
17.39
20.72
-.47
1980
17.39
22.20
-.58
1981
11.53
21.44
-1.43
1981
11.53
23.10
-1.35
1982
11.77
19.80
-1.15
1982
11.77
22.06
-1.03
1983
12.65
19.75
-1.13
1983
12.65
20.55
-1.21
1984
13.68
20.70
-.97
1984
13.68
21.69
-1.05
1985
12.92
19.66
-.92
1985
12.92
20.79
-1.00
1986
12.54
19.82
-.%
1986
12.54
20.79
-1.05
1987
12.28
19.34
-.86
1987
12.28
20.23
-.95
1988
10.97
19.12
-.85
1988
10.97
20.02
-.95
ABILENE Service Effectiveness
(Total Passengers/Total Vehicle Hours)
3
2
Q) ~
1 0 (.)
Cf)
-a 0 - - - - -~
as -a c
-1 as +"'" Cf)
-2
-3 <.0 f'... CO m 0 or- C\J (Y) ..q- LO <.0 f'... CO f'... f'... f'... f'... CO CO CO CO CO CO CO CO CO m m m m m m m m m m m m m or- or- or- or- or- or- or- or- or- or- or- or- or-
Year Peer Groups: • Small Transit Systems • Small City Transit Systems

I I
I
Peer Group: Small Transit Systems
1976 1977
Transit Agency Value .27 .27
Peer Group Mean 51 .48
w Standard Score -.89 -.85 0
Peer Group: Small City Transit Systems
1976 1977
Transit Agency Value .27 .27
Peer Group Mean .49 .46
Standard Score -.86 -.84
Table 6. Cost Effectiveness Performance Profile
(Passenger Revenue/Total Operating Expense)
ABILENE
1978 1979 1980 1981 1982 1983
.20 .13 .11 .12 .14 .15
.39 .34 .34 .33 .33 .33
-1.32 -1.41 -1.39 -1.27 -1.31 -1.24
1978 1979 1980 1981 1982 1983
.20 .13 .11 .12 .14 .15
.39 .34 .34 .33 .34 .34
-1.40 -1.49 -1.46 -1.35 -1.42 -1.33
1984 1985 1986 1987 1988
.16 .17 .13 .14 .13
.33 .30 .29 .27 .27
-1.09 -1.04 -1.33 -1.16 -1.01
1984 1985 1986 1987 1988
.16 .17 .13 .14 .13
.34 .31 .29 .28 .28
-1.19 -1.12 -1.43 -1.26 -1.10
ABILENE Cost Effectiveness
(Passenger RevenuelTotal Operating Expense)
3
2
CD ..... 1 0
0 (/)
"'0 0 ..... w «S ........ ""C
c -1 «S
+-' (/)
-2
-3 CD ,..... co m 0 T""" C\J (Y) ..q LO CD ,..... co ,..... ,..... ,..... ,..... co co co co co co co co co m m m m m m m m m m m m m T""" T""" T""" T""" T""" T""" T""" T""" T""" T""" T""" T""" T"""
Year
Peer Groups: • Small Transit Systems • Small City Transit Systems

Table 7. Labor Efficiency Performance Profile
(Total Vehicle Hours/Average Number of Employees)
ABILENE
Peer Group: SmaU Transit Systems
1976 1977 1978 1979 1980 1981 1982 1983 1984 1985 1986 1987 1988
Transit Agency Value .131 .138 .133 .113 .115 .119 .110 .123 .131 .130 .113 .117
Peer Group Mean .131 .140 .129 .125 .122 .131 .122 .123 .124 .122 .116 .119
w Standard Score -.03 -.10 .11 -.42 -.25 -.30 -.40 .01 .30 .41 -.26 -.18 N
Peer Group: smaU City Transit Systems
1976 1977 1978 1979 1980 1981 1982 1983 1984 1985 1986 1987 1988
Transit Agency Value .131 .138 .133 .113 .115 .119 .110 .123 .131 .130 .113 .117
Peer Group Mean .130 .139 .128 .124 .121 .128 .120 .121 .123 .121 .116 .119
Standard Score .06 -.04 .13 -.41 -.24 -.25 -.36 .06 .36 .49 -.25 -.20

ABILENE Labor Efficiency
(Total Vehicle Hours/Average Number of Employees)
3
2
CD I.-
1 0 0
(/)
-0 0 r- - - - - -to- -W
ct1 w "'C
~---- -------~-.. - .. -----c
-1 ct1 ...... (/)
-2
-3 I I I I I I I I I I I I I
<.0 f'.. co Q) 0 T""" C\J (Y) oq- LO <.0 f'.. co f'.. f'.. f'.. f'.. co co co co co co co co co Q) Q) Q) Q) Q) Q) Q) Q) Q) Q) Q) Q) Q) T""" T""" T""" T""" T""" T""" T""" T""" T""" T""" T""" T""" T"""
Year Peer Groups: • Small Transit Systems • Small City Transit Systems

Peer Group: Small Transit Systems
1976
Transit Agency Value
Peer Group Mean
w Standard Score ..j:::>
Peer Group: Small City Transit Systems
1976
Transit Agency Value
Peer Group Mean
Standard Score
Table 8. Vehicle Efficiency Performance Profile
(Total Vehicle Miles/Average Number of Buses on Regular Routes)
1977
4.63
4.22
.46
1977
4.63
4.19
52
1978
5.29
4.66
.77
1978
5.29
458
.88
1979
5.88
451
1.30
1979
5.88
4.45
1.40
ABILENE
1980
5.17
459
.73
1980
5.17
4.52
.82
1981
4.21
451
-.37
1981
4.21
4.47
-.34
1982
3.86
4.37
-55
1982
3.86
4.34
-55
1983
357
4.46
-1.09
1983
357
4.43
-1.10
1984
3.75
4.45
-.78
1984
3.75
4.43
-.80
1985
3.63
4.54
-1.13
1985
3.63
4.47
-1.03
1986
3.98
4.45
-.81
1986
3.98
4.41
-.76
1987
4.28
4.44
-.28
1987
4.28
4.40
-.21
1988
4.63
4.65
-.04
1988
4.63
458
.08

CD ~
0 () (/)
"'0 ~
w ct1 U1 "'0
c ct1
+-" (/)
ABILENE Vehicle Efficiency
(Total Vehicle Miles/Average Number of Buses on Regular Routes)
3
2
1
0 - - - - ----1
-2
-3 <0 ,...... ,...... ,...... 0) 0) .,- .,-
Peer Groups:
o ex) 0) .,-
-.-
• Small Transit Systems
C\I ex) 0) .,-
Year
LO ex) 0) .,-
-.. -
• Small City Transit Systems
""""'" -
ex) ex) 0) .,-


AMARILLO
37

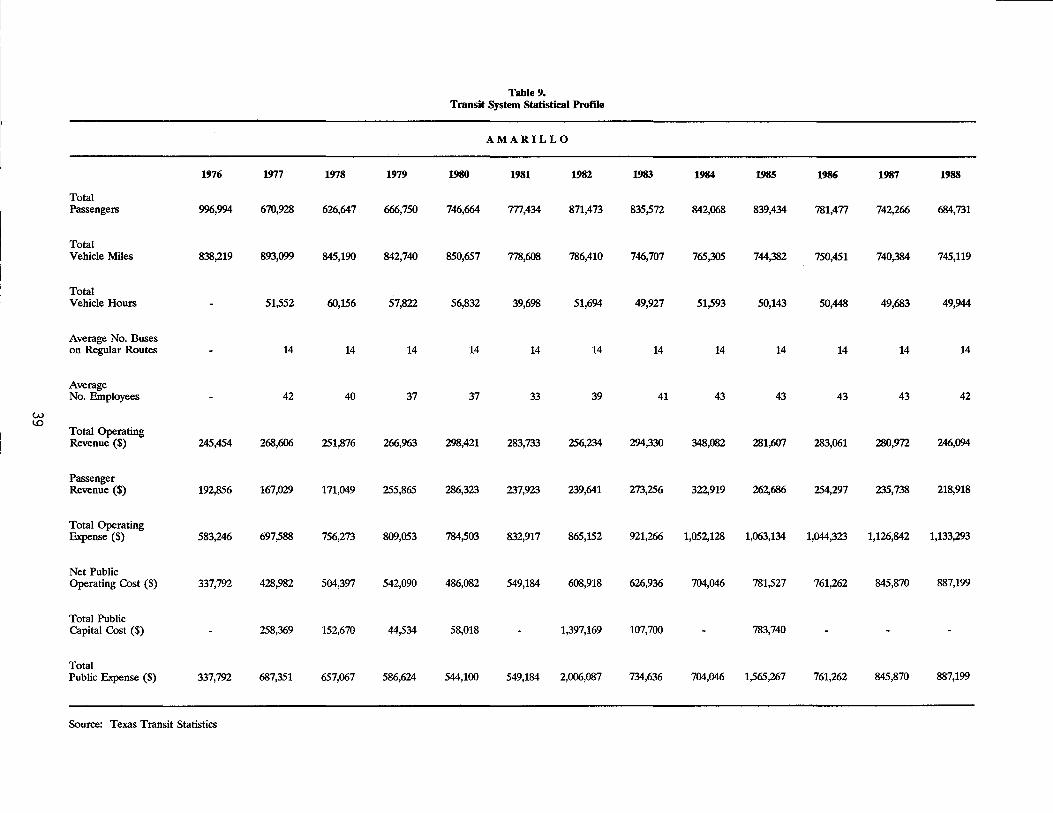
Table 9. Transit System Statistical Prorde
AMARILLO
1976 1977 1978 1979 1980 1981 1982 1983 1984 1985 1986 1987 1988
Total Passengers 996,994 670,928 626,647 666,750 746,664 777,434 871,473 835,572 842,068 839,434 781,477 742,266 684,731
Total Vehicle Miles 838,219 893,099 845,190 842,740 850,657 778,608 786,410 746,707 765,305 744,382 750,451 740,384 745,119
Total Vehicle Hours 51,552 60,156 57,822 56,832 39,698 51,694 49,927 51,593 50,143 50,448 49,683 49,944
Average No. Buses on Regular Routes 14 14 14 14 14 14 14 14 14 14 14 14
Average No. Employees 42 40 37 37 33 39 41 43 43 43 43 42
w 1.0
Total Operating Revenue ($) 245,454 268,606 251,876 266,%3 298,421 283,733 256,234 294,330 348,082 281,607 283,061 280,972 246,094
Passenger Revenue ($) 192,856 167,029 171,049 255,865 286,323 237,923 239,641 273,256 322,919 262,686 254,297 235,738 218,918
Total Operating Expense ($) 583,246 697,588 756,273 809,053 784,503 832,917 865,152 921,266 1,052,128 1,063,134 1,044,323 1,126,842 1,133,293
Net Public Operating Cost ($) 337,792 428,982 504,397 542,090 486,082 549,184 608,918 626,936 704,046 781,527 761,262 845,870 887,199
Total Public Capital Cost ($) 258,369 152,670 44,534 58,018 1,397,169 107,700 783,740
Total Public Expense ($) 337,792 687,351 657,067 586,624 544,100 549,184 2,006,087 734,636 704,046 1,565,267 761,262 845,870 887,199
Source: Texas Transit Statistics

Peer Group: Small Transit Systems
1976 1977
Transit Agency Value .074
Peer Group Mean .087
.j:::. Standard Score -.80
0
Peer Group: Small City Transit Systems
1976 1977
Transit Agency Value .074
Peer Group Mean .087
Standard Score -.87
Table 10. Cost Efficiency Performance Profile
(Total Vehicle Hours/Total Operating Expense)
AMARILLO
1978 1979 1980 1981 1982 1983
.080 .071 .072 .048 .060 .054
.089 .066 .055 .048 .051 .045
-.41 .39 159 -.05 .45 .98
1978 1979 1980 1981 1982 1983
.080 .071 .072 .048 .060 .054
.088 .066 .055 .048 .051 .045
-.37 .44 1.70 -.04 .48 1.06
1984 1985 1986 1987 1988
.049 .047 .048 .044 .044
.041 .040 .039 .038 .037
.91 1.11 1.79 1.34 1.46
1984 1985 1986 1987 1988
.049 .047 .048 .044 .044
.042 .041 .039 .038 .037
.92 .91 1.86 1.31 1.44

AMARILLO Cost Efficiency
(Total Vehicle HourslTotal Operating Expense) 3
2
Q) L...
1 0 (,)
en ------ ----0 0 - - - - -L...
+::> ctS
I-' -0 c
-1 ctS +-' en
-2
-3 <0 f'.. co 0> 0 or- C\J (Y) ~ LO <0 f'.. co f'.. f'.. f'.. f'.. co co co co co co co co co 0> 0> 0> 0> 0> 0> 0> 0> 0> 0> 0> 0> 0> or- or- or- T""" or- T""" or- or- or- T""" or- T""" or-
Year Peer Groups: • Small Transit Systems • Small City Transit Systems

Peer Group: Small Transit Systems
1976 1977
Transit Agency Value 13.01
Peer Group Mean 19.20
~ Standard Score -.88 N
Peer Group: Small City Transit Systems
1976 1977
Transit Agency Value 13.01
Peer Group Mean 20.85
Standard Score -.95
Table 11. Service Effectiveness Performance Profile (Total Passengers/Total Vehicle Hours)
1978
10.42
18.49
-1.04
1978
10.42
19.69
-1.13
1979
1153
20.03
-.99
1979
1153
21.05
-1.08
AMARI LLO
1980 1981
13.14 1958
20.72 21.44
-1.07 -.27
1980 1981
13.14 1958
22.20 23.10
-1.09 -.41
1982
16.86
19.80
-.42
1982
16.86
22.06
-52
1983
16.74
19.75
-.48
1983
16.74
2055
-58
1984
16.32
20.70
-.60
1984
16.32
21.69
-.70
1985
16.74
19.66
-.40
1985
16.74
20.79
-51
1986
15.49
19.82
-57
1986
15.49
20.79
-.67
1987
14.94
19.34
-53
1987
14.94
20.23
-.63
1988
13.71
19.12
-57
1988
13.71
20.02
-.66

3
2
Q) L...
1 0 0
Cf)
"'0 0 - - - - -~
ro -I==> "'0 w c
ctS -1 +-' Cf)
-2
-3 <0 f'... f'... f'... 0> 0> ,.- ,.-
Peer Groups:
AMARILLO Service Effectiveness
(Total Passengers/Total Vehicle Hours)
co 0> f'... f'... 0> 0> ,.- ,.-
o co 0> ,.-
-. -111-
C\I co 0> ,.-
Year
• Small Transit Systems
-II1II-
<0 co 0> ,.-
• Small City Transit Systems

Peer Group: SmaU Transit Systems
1976 1977
Transit Agency Value .33 .24
Peer Group Mean 51 .48
+::> Standard Score -.68 -1.00 +::>
Peer Group: Small City Transit Systems
1976 1977
Transit Agency Value .33 .24
Peer Group Mean .49 .46
Standard Score -.64 -.99
Table 12. Cost Effectiveness Performance Profile
(Passenger Revenue/Total Operating Expense)
AMARILLO
1978 1979 1980 1981 1982 1983
.23 .32 .36 .29 .28 .30
.39 .34 .34 .33 .33 .33
-1.13 -.14 .18 -.25 -.39 -.24
1978 1979 1980 1981 1982 1983
.23 .32 .36 .29 .28 .30
.39 .34 .34 .33 .34 .34
-1.20 -.15 .19 -.28 -.46 -.29
1984 1985 1986 1987 1988
.31 .25 .24 .21 .19
.33 .30 .29 .27 .27
-.13 -.42 -.37 -52 -.55
1984 1985 1986 1987 1988
.31 .25 .24 .21 .19
.34 .31 .29 .28 .28
-.20 -.53 -.45 -.61 -.63
AMARILLO Cost Effectiveness
(Passenger Revenue/Total Operating Expense)
3
2
Q) ..... 1 0
0 (/)
'U 0 ..... «1
..j:» 'U U1
- L -~-III-_---- -1lI-c
-1 «1 +-' (/)
-2
-3 co "'- CO 0> 0 ,.- C\I Ct') ..q- LO CO "'- CO "'- "'- "'- "'- CO CO CO CO CO CO CO CO CO 0> 0> 0> 0> 0> 0> 0> 0> 0> 0> 0> 0> 0> ,.- ,.- ,.- ,.- ,.- ,.- ,.- ,.- ,.- ,.- ,.- ,.- ,.-
Year
Peer Groups: • Small Transit Systems II Small City Transit Systems

Table 13. Labor Efficiency Performance Profile
(Total Vehicle Hours/Average Number of Employees)
AMARILLO
Peer Group: Small Transit Systems
1976 1977 1978 1979 1980 1981 1982 1983 1984 1985 1986 1987 1988
Transit Agency Value .123 .150 .156 .154 .120 .133 .122 .120 .117 .117 .116 .119
Peer Group Mean .131 .140 .129 .125 .122 .131 .122 .123 .124 .122 .116 .119
+::> Standard Score -53 .40 .72 1.02 -.05 .05 .00 -.10 -.31 -.25 -.08 -.02
'"
Peer Group: Small City Transit Systems
1976 1977 1978 1979 1980 1981 1982 1983 1984 1985 1986 1987 1988
Transit Agency Value .123 .150 .156 .154 .120 .133 .122 .120 .117 .117 .116 .119
Peer Group Mean .130 .139 .128 .124 .121 .128 .120 .121 .123 .121 .116 .119
Standard Score -.46 .48 .78 1.10 -.03 .11 .05 -.05 -.28 -.18 -.05 -.03

3
2
CD ~
1 0 ()
(f)
"0 0 - - - - -.... ~
ro '-J "0
c -1 ro
~
(f)
-2
-3 CD f'... f'... f'... 0') 0') ~ ~
Peer Groups:
AMARILLO Labor Efficiency
(Total Vehicle Hours/Average Number of Employees)
----
co f'... 0') .,...-
o co 0') .,...-
.,...-co 0') .,...-
'@W' ___ =- _-= __ _
C\J co 0') .,...-
Year
Ct) co 0') ~
"¢ co 0') .,...-
LO co 0') .,...-
-~-= --=-
CD co 0') ~
f'... co 0') .,...-
• Small Transit Systems • Small City Transit Systems
co co 0') .,...-

Table 14. Vehicle Efficiency Performance Profile
(Total Vehicle Miles/Average Number of Buses on Regular Routes)
AMARILLO
Peer Group: Small Transit Systems
1976 1977 1978 1979 1980 1981 1982 1983 1984 1985 1986 1987 1988
Transit Agency Value 6.38 6.04 6.02 6.08 556 5.62 5.33 5.47 5.32 5.36 5.29 5.32
Peer Group Mean 4.22 4.66 451 4.59 451 4.37 4.46 4.45 454 4.45 4.44 4.65
~ Standard Score 2.42 1.68 1.43 1.88 1.31 1.35 1.06 1.12 .95 1.57 1.46 1.05 DO
Peer Group: Small City Transit Systems
1976 1977 1978 1979 1980 1981 1982 1983 1984 1985 1986 1987 1988
Transit Agency Value 6.38 6.04 6.02 6.08 556 5.62 5.33 5.47 5.32 5.36 5.29 5.32
Peer Group Mean 4.19 458 4.45 452 4.47 4.34 4.43 4.43 4.47 4.41 4.40 4.58
Standard Score 2.58 1.78 154 1.98 1.41 1.45 1.15 1.20 1.05 1.68 1.56 1.14
AMARILLO Vehicle Efficiency
(Total Vehicle Miles/Average Number of Buses on Regular Routes)
3
2
CD 10.....
1 0 0
(f)
"'0 0 - - - - -10.....
+::> a:s ~ "'0
c -1 a:s ......
(f)
-2
-3 CD f'... ex) 0> 0 ,.- C\J ('t') ..q- LO CD f'... ex)
f'... f'... f'... f'... ex) ex) co ex) ex) co ex) ex) co 0> 0> 0> 0> 0> 0> 0> 0> 0> 0> 0> 0> 0> ,.- ,.- ,.- ,.- ,.- ,.- ,.- ,.- ,.- ,.- ,.- ,.- ,.-
Year
Peer Groups: • Small Transit Systems II Small City Transit Systems


AUSTIN
51


Table 15-Transit System Statistical Profile
AUSTIN
1976 1977 1978 1979 1980 1981 1982 1983 1984 1985 1986 1987 1988
Total Passengers 6,066,TII 6,199,344 6,016,524 5,940,126 5,842,987 5,142,578 4,742,369 4,363,230 5,048,309 5,778,005 8,548,455 10,156,311 14,710,349
Total Vehicle Miles 2,543,760 2,887,674 2,844,565 2,911,148 2,968,808 2,742,958 2,973,686 2,979,608 3,086,637 4,010,310 6,148,469 9,203,384 10,627,273
Total Vehicle Hours 186,593 230,919 242,766 242,474 221,314 234,634 230,237 232,827 311,674 505,797 715,470 806,406
Average No. Buses on Regular Routes 44 56 63 63 63 64 67 67 97 172 193 214
Average No. Employees 182 192 196 201 195 208 217 225 348 649 697 687
Ul w
Total Operating Revenue ($) 955,303 1,115,976 1,022,067 1,191,382 1,563,623 1,654,824 1,841,027 1,767,858 1,966,119 2,376,568 2,912,366 3,291,988 4,481,839
Passenger Revenue ($) 811,067 1,017,854 935,086 1,145,590 1,533,272 1,621,599 1,802,819 1,723,735 1,918,344 2,323,628 2,602,753 2,990,474 3,271,985
Total Operating Expense ($) 2,592,850 3,141,218 3,649,372 4,611,683 5,322,807 5,862,421 6,490,619 6,662,587 7,833,8% 11,092,623 31,238,152 35,549,627 35,392,TI4
Net Public Operating Cost ($) 1,637,547 2,025,242 2,627,305 3,420,301 3,759,184 4,207,597 4,649,592 4,894,729 5,867,m 8,716,055 28,325,786 32,257,639 30,910,935
Total Public Capital Cost ($) 11,920 2,117,147 27,099 2,705,392 1,590,446 405,502 99,116 5,840,268 19,2%,907 11,320,080 6,184,506
Total Public Expense ($) 1,637,547 2,037,162 4,744,452 3,447,400 3,759,184 6,912,989 6,240,038 5,300,231 5,966,893 14,556,323 47,622,693 43,577,719 37,095,441
Source: Texas Transit Statistics and Capital Area Metropolitan Transit Authority

Peer Group: Large Transit Systems
1976 1977
Transit Agency Value .059
Peer Group Mean .051
(J1 Standard Score 1.41 ~
Peer Group: Large City Transit Systems
1976 1977
Transit Agency Value .059
Peer Group Mean .069
Standard Score -.23
Table 16. Cost Efficiency Performance Profile
(Total Vehicle Hours/Total Operating Expense)
AUSTIN
1978 1979 1980 1981 1982 1983
.063 .053 .046 .038 .036 .035
.052 .043 .036 .030 .029 .028
1.01 1.11 .91 .88 .86 .91
1978 1979 1980 1981 1982 1983
.063 .053 .046 .038 .036 .035
.060 .047 .039 .033 .031 .031
.12 59 .71 57 .79 54
1984 1985 1986 1987 1988
.030 .028 .016 .020 .023
.026 .024 .021 .022 .022
.60 .65 -.68 -.24 .09
1984 1985 1986 1987 1988
.030 .028 .016 .020 .023
.029 .026 .024 .023 .022
.06 .40 -1.21 -53 .08

3
2
CD "- 1 0 0
en "0 0 - - - - -"-as
0"1 "0 0"1
c -1 as
+J
en
-2
-3 <0 ,...... 0) T"""
Peer Groups:
,...... ,...... 0) T"""
AUSTIN Cost Efficiency
(Total Vehicle Hours/Total Operating Expense)
o co 0) T"""
• Large Transit Systems
C\I CO 0) T"""
Year
--.-
1M Large City Transit Systems
§§§"I _

Peer Group: Large Transit Systems
1976
Transit Agency Value
Peer Group Mean
U1 Standard Score 0"1
Peer Group: Large City Transit Systems
1976
Transit Agency Value
Peer Group Mean
Standard Score
1977
33.22
38.30
-.64
1977
33.22
30.94
.21
Table 17. Service Effectiveness Performance Profile (Total Passengers/Total Vehicle Hours)
1978
26.05
30.76
-1.45
1978
26.05
26.16
-.02
1979
24.47
30.99
-1.35
1979
24.47
27.54
-51
AUSTIN
1980
24.10
31.83
-1.44
1980
24.10
28.78
-.74
1981
23.24
30.67
-1.36
1981
23.24
27.49
-.63
1982
20.21
29.44
-1.43
1982
20.21
25.65
-.75
1983
18.95
28.34
-1.36
1983
18.95
25.18
-.81
1984
21.68
29.18
-1.09
1984
21.68
25.99
-55
1985
18.54
27.87
-1.45
1985
18.54
25.35
-.91
1986
16.90
25.23
-1.34
1986
16.90
23.02
-.82
1987
14.20
24.43
-1.27
1987
14.20
23.39
-1.12
1988
18.24
25.96
-1.09
1988
18.24
24.54
-.80

Q) ...-0 0
Cf)
"'0 ...-ctj
"'0 c ctj +-' Cf)
AUSTIN Service Effectiveness
(Total Passengers/Total Vehicle Hours)
3
2
1
0 -----.--r -1
-2
-3~--~--~----~----~--~----~--~~--~----~--~----~----~--~---
<D
"'" Q) ~
Peer Groups:
co "'" Q) ~
Q)
"'" Q) ~
o CO Q) ~
~
CO Q) ~
• Large Transit Systems
C\J CO Q) T"""
Year
Ct) CO Q) ~
LO CO Q) T"""
<D CO Q) T"""
~ Large City Transit Systems
co CO Q) ~

Peer Group: Large Transit Systems
1976 1977
Transit Agency Value .31 .32
Peer Group Mean 52 .49
(J"1 Standard Score -1.45 -1.25 ex>
Peer Group: Large City Transit Systems
1976 1977
Transit Agency Value .31 .32
Peer Group Mean 55 53
Standard Score -1.03 -.88
Table 18. Cost Effectiveness Performance Profile
(Passenger Revenue/Total Operating Expense)
AUSTIN
1978 1979 1980 1981 1982 1983
.26 .25 .29 .28 .28 .26
.40 .37 .36 .36 .35 .33
-.91 -.72 -53 -52 -.45 -52
1978 1979 1980 1981 1982 1983
.26 .25 .29 .28 .28 .26
.43 .39 .37 .36 .34 .34
-1.02 -.95 -.70 -.60 -53 -.77
1984 1985 1986 1987 1988
.24 .21 .08 .08 .09
.28 .26 .22 .21 .22
-.65 -.93 -1.35 -1.46 -1.47
1984 1985 1986 1987 1988
.24 .21 .08 .08 .09
.32 .28 .25 .24 .23
-.98 -.98 -1.47 -1.16 -1.21

AUSTIN Cost Effectiveness
(Passenger Revenue/Total Operating Expense)
3
2
Q) ..... 1 0
0 Cf)
"'0 0 -.-..... U1
as <..0 "'0
c -1 as
+-' Cf)
-2
-3 CD f'... ex:> 0> 0 T""" C\J (V) ~ LO CD f'... ex:> f'... f'... f'... f'... ex:> ex:> ex:> ex:> co co co ex:> ex:> 0> 0> 0> 0> 0> 0> 0> 0> 0> 0> 0> 0> 0> T""" T""" T""" T""" T""" T""" T""" T""" T""" T""" T""" T""" T"""
Year Peer Groups: • Large Transit Systems II Large City Transit Systems

Peer Group: Large Transit Systems
1976
Transit Agency Value
Peer Group Mean
0) Standard Score 0
Peer Group: Large City Transit Systems
1976
Transit Agency Value
Peer Group Mean
Standard Score
Table 19. Labor Efficiency Performance Profile
(Total Vehicle Hours/Average Number of Employees)
1977
.103
.102
.10
1977
.103
.118
-.42
1978
.120
.116
.55
1978
.120
.126
-.23
1979
.124
.112
.94
1979
.124
.117
.63
AUSTIN
1980
.121
.106
.95
1980
.121
.110
.85
1981
.113
.105
.82
1981
.113
.108
.60
1982
.113
.104
.84
1982
.113
.107
.65
1983
.106
.104
.16
1983
.106
.105
.08
1984
.103
.101
.19
1984
.103
.102
.23
1985
.090
.098
-.85
1985
.090
.098
-1.20
1986
.078
.100
-.95
1986
.078
.097
-1.12
1987
.103
.104
-.08
1987
.103
.101
.12
1988
.117
.109
.37
1988
.117
.101
.88
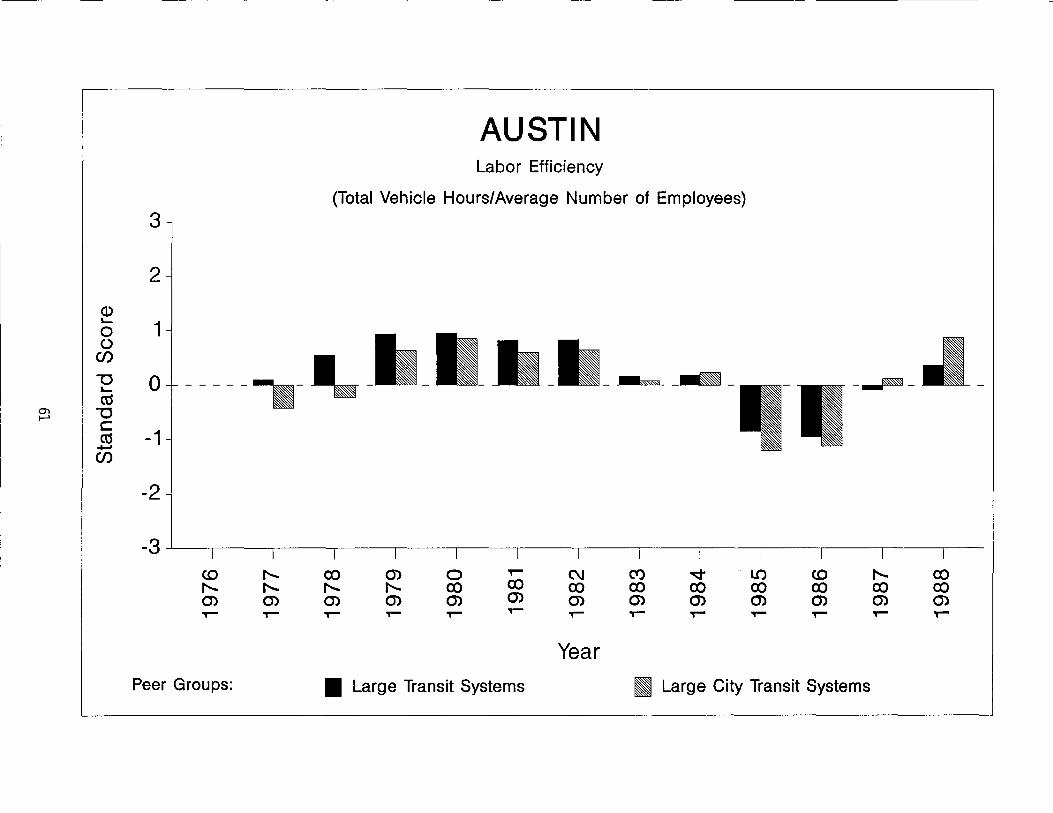
AUSTIN Labor Efficiency
(Total Vehicle Hours/Average Number of Employees)
3
2
<D ~
1 0 ()
en
------.-1.-"'0 0 ~
ro 0'1 "'0 I-'
--.1-c
-1 ro +-' en
-2
-3 <0 r-.... co 0) 0 T""" C\J ('t) ..q LO <0 r-.... co r-.... r-.... r-.... r-.... co co co co co co co co co 0) 0) 0) 0) 0) 0) 0) 0) 0) 0) 0) 0) 0) T""" 'T"'"" T""" ,- T"""
,-T""" T""" T""" ,- T""" T""" T"""
Year Peer Groups: • Large Transit Systems II Large City Transit Systems

Table 20. Vehicle Efficiency Performance Profile
(Total Vehicle Miles/Average Number of Buses on Regular Routes)
AUSTIN
Peer Group: Large Transit Systems
1976 1977 1978 1979 1980 1981 1982 1983 1984 1985 1986 1987 1988
Transit Agency Value 6.56 5.08 4.62 4.71 4.35 4.65 4.45 4.61 4.13 3.57 4.77 4.97
Peer Group Mean 2.85 4.49 4.31 4.17 4.23 4.39 4.63 4.53 4.48 3.88 3.97 4.40 4.34
0'\ Standard Score 1.41 1.22 1.01 .56 -.03 .01 -.05 .10 .42 -.79 .54 1.31 N
Peer Group: Large City Transit Systems
1976 1977 1978 1979 1980 1981 1982 1983 1984 1985 1986 1987 1988
Transit Agency Value 6.56 5.08 4.62 4.71 4.35 4.65 4.45 4.61 4.13 3.57 4.77 4.97
Peer Group Mean 2.85 4.60 4.50 4.46 4.46 4.48 4.57 4.42 4.40 4.09 4.22 4.71 4.57
Standard Score 1.63 .71 .18 .25 -.11 .06 .02 .23 .08 -1.05 .07 .60
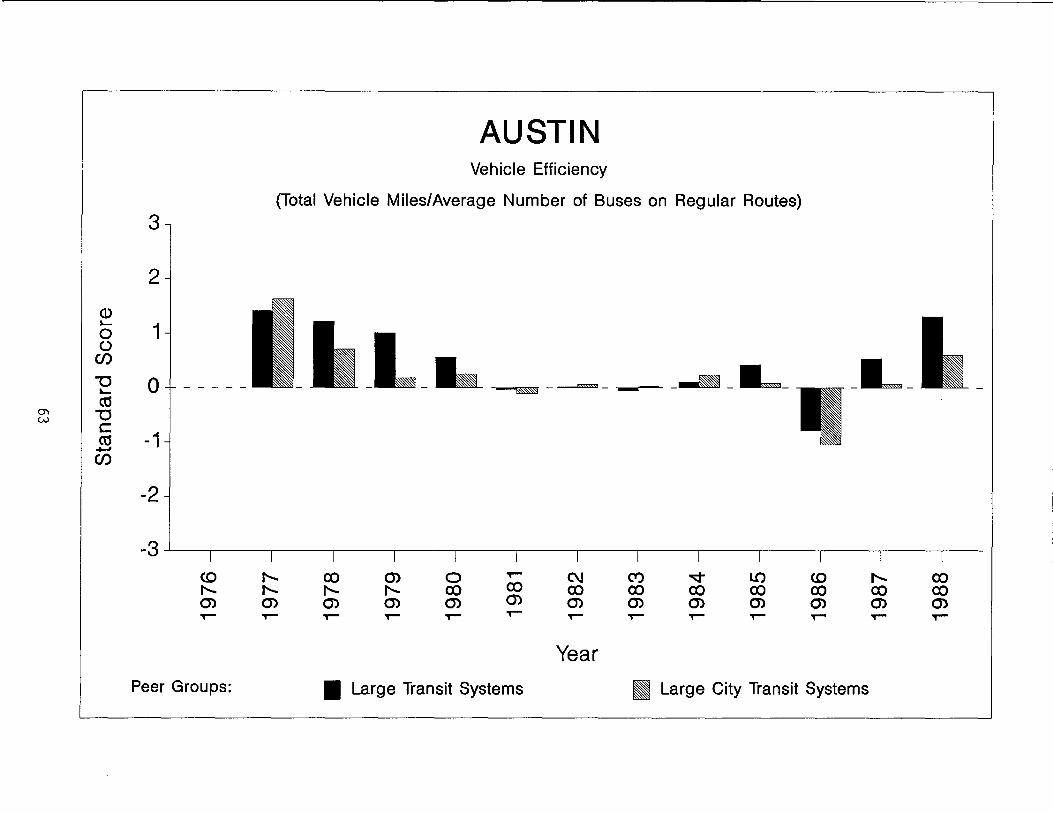
3
2
Q.) "'- 1 0 ()
CJ)
"0 0 - - - - -"'-Cd
0'1 "0 w c -1 Cd ......
CJ)
-2
-3 <0 f'.. 0) .,..-
Peer Groups:
AUSTIN Vehicle Efficiency
(Total Vehicle Miles/Average Number of Buses on Regular Routes)
f'.. f'.. 0) .,..-
o CO 0) .,..-
""""'---
C\J CO 0) .,..-
Year
<0 CO 0) .,..-
• Large Transit Systems II Large City Transit Systems
CO CO 0) .,..-


BEAUMONT
65


Table 21. Transit System Statistical Prorde
BEAUMONT
1976 1977 1978 1979 1980 1981 1982 1983 1984 1985 1986 1987 1988
Total Passengers 1,126,018 1,293,266 1,238,641 1,316,571 1,497,805 1,579,775 1,525,783 1,507,800 1,466,626 1,380,762 1,167,414 1,081,187 1,086,207
Total Vehicle Miles 697,468 588,047 561,414 561,913 615,422 642,648 643,462 662,845 678,675 676,816 574,537 589,850 589,246
Total Vehicle Hours 52,725 53,673 53,494 58,834 64,462 67,939 67,838 65,311 63,833 51,038 45,665 49,360
Average No. Buses on Regular Routes 14 13 14 16 15 15 15 16 16 14 13 11
Average No. Employees 35 36 36 41 43 46 45 43 42 37 37 38
0'1
" Total Operating Revenue ($) 263,349 272,984 264,035 291,586 329,238 411,875 470,792 444,028 468,731 436,562 370,836 345,406 342,031
Passenger Revenue ($) 263,349 272,532 263,939 290,941 327,717 411,572 468,603 441,988 468,431 436,562 370,836 345,406 342,031
Total Operating Expense ($) 664,228 635,406 661,958 749,284 1,019,595 1,175,820 1,214,301 1,473,048 1,493,920 1,538,271 1,356,668 1,370,562 1,416,532
Net Public Operating Cost ($) 400,879 362,422 397,923 457,698 690,357 763,945 743,509 1,029,020 1,025,189 1,101,709 985,832 1,025,156 1,074,501
Total Public Capital Cost ($) 1,661,764 815,253 359,142 72,450 81,477 10,837 80,159 104,111
Total Public Expense ($) 2,062,643 1,177,675 397,923 457,698 1,049,499 836,395 824,986 1,039,857 1,025,189 1,101,709 1,065,991 1,129,267 1,074,501
Source: Texas Transit Statistics

O"l (X)
Peer Group: Small Transit Systems
1976
Transit Agency Value
Peer Group Mean
Standard Score
Peer Group: Small City Transit Systems
Transit Agency Value
Peer Group Mean
Standard Score
1976
1977
.083
.087
-.23
1977
.083
.087
-.26
Table 22. Cost Efficiency Performance Profile
(Total Vehicle Hours/Total Operating Expense)
1978
.081
.089
-.34
1978
.081
.088
-.30
1979
.071
.066
.38
1979
.071
.066
.43
BEAUMONT
1980
.058
.055
.22
1980
.058
.055
.27
1981
.055
.048
.80
1981
.055
.048
.85
1982
.056
.051
.25
1982
.056
.051
.27
1983
.046
.045
.12
1983
.046
.045
.16
1984
.044
.041
.28
1984
.044
.042
.26
1985
.041
.040
.21
1985
.041
.041
.06
1986
.038
.039
-.23
1986
.038
.039
-.26
1987
.033
.038
-.87
1987
.033
.038
-.96
1988
.035
.037
-.36
1988
.035
.037
-.44

---------------------------------------------- -,
BEAUMONT Cost Efficiency
(Total Vehicle Hours/Total Operating Expense) 3
2
Q) "- 1 0 (,)
(f) .-------u 0 - - - - -"-as Q) u I.D c
as -1 ......
___ TIT ___ --"= -.--(f)
-2
-3 <0 f'.. en m 0 ,- C\J (Y) .q LO <0 f'.. en f'.. f'.. f'.. f'.. en en co co co en en co co m m m m m m m m m m m m m ,- ,- ,- ,- ,- T""" T""" T""" ,- ,- ,- ,- ,-
Year Peer Groups: • Small Transit Systems • Small City Transit Systems

-.....J 0
Peer Group: Small Transit Systems
1976
Transit Agency Value
Peer Group Mean
Standard Score
Peer Group: Small City Transit Systems
Transit Agency Value
Peer Group Mean
Standard Score
1976
1977
2453
19.20
.76
1977
2453
20.85
.45
Table 23. Service Effectiveness Performance Profile (Total Passengers/Total Vehicle Hours)
1978
23.08
18.49
59
1978
23.08
19.69
.41
1979
24.61
20.03
54
1979
24.61
21.05
.40
BEAUMONT
1980
25.46
20.72
.67
1980
25.46
22.20
.39
1981
2451
21.44
.44
1981
24.51
23.10
.16
1982
22.46
19.80
.38
1982
22.46
22.06
.04
1983
22.23
19.75
.39
1983
22.23
2055
.26
1984
22.46
20.70
.24
1984
22.46
21.69
.10
1985
21.63
19.66
.27
1985
21.63
20.79
.11
1986
22.87
19.82
.40
1986
22.87
20.79
.26
1987
23.68
19.34
53
1987
23.68
20.23
.41
1988
22.01
19.12
.30
1988
22.01
20.02
.21

(» ~
0 0 en 'U ~
ctS --...J 'U I-'
c ctS +-' en
3
2
1
0
-1
-2
-3 I
<0 ,..... 0') ,-
Peer Groups:
I ,..... ,..... 0') ,-
I
co ,..... 0') ,-
BEAUMONT Service Effectiveness
(Total Passengers/Total Vehicle Hours)
I
0') ,..... 0') ,-
I
o co 0') ,-
I ,-co 0') ,-
I
C\J co 0') ,-
Year
I Ct') co 0') ,-
I ..qco 0') ,-
I
LO co 0') ,-
I
<0 co 0') ,-
• Small Transit Systems • Small City Transit Systems
I ,..... co 0') ,-
I
co co 0') ,-

Peer Group: Small Transit Systems
1976 1977
Transit Agency Value .40 .43
Peer Group Mean 51 .48
"'-.J Standard Score -.43 -.20 N
Peer Group: Small City Transit Systems
1976 1977
Transit Agency Value .40 .43
Peer Group Mean .49 .46
Standard Score -.38 -.15
Table 24. Cost Effectiveness Performance Profile
(Passenger Revenue/Total Operating Expense)
BEAUMONT
1978 1979 1980 1981 1982 1983
.40 .39 .32 .35 .39 .30
.39 .34 .34 .33 .33 .33
.07 .35 -.09 .15 .37 -.22
1978 1979 1980 1981 1982 1983
.40 .39 .32 .35 .39 .30
.39 .34 .34 .33 .34 .34
.07 .37 -.09 .15 .32 -.27
1984 1985 1986 1987 1988
.31 .28 .27 .25 .24
.33 .30 .29 .27 .27
-.09 -.11 -.11 -.15 -.20
1984 1985 1986 1987 1988
.31 .28 .27 .25 .24
.34 .31 .29 .28 .28
-.15 -.24 -.18 -.23 -.26

-...J W
CD ..... 0 ()
(/)
"'0 ..... as
"'0 c as +-' (/)
3
2
1
0 ---~
-1
-2
-3 I I
<.0 r-.... r-.... r-.... Q) Q) r- T"-
Peer Groups:
BEAUMONT Cost Effectiveness
(Passenger RevenuelTotal Operating Expense)
__ =s",,""'-'" ----\==~,,- --~~~--- -a -~--_ -= --u- -L -
I I I I I I I I I I I
co Q) 0 r- C\J ('t')
""" LO <.0 r-.... co
r-.... r-.... co co co co co co co co co Q) Q) Q) Q) Q) Q) Q) Q) Q) Q) Q) T"- T"- T"- r- r- T"- r- r- T"- T"- T"-
Year
• Small Transit Systems • Small City Transit Systems

Table 25. Labor Efficiency Performance Profile
(Total Vehicle Hours/Average Number of Employees)
BEAUMONT
Peer Group: Small Transit Systems
1976 1977 1978 1979 1980 1981 1982 1983 1984 1985 1986 1987 1988
Transit Agency Value .151 .149 .149 .143 .150 .148 .151 .152 .152 .138 .123 .130
Peer Group Mean .131 .140 .129 .125 .122 .131 .122 .123 .124 .122 .116 .119
--.J Standard Score 1.22 .35 52 .66 1.05 .45 1.01 1.04 1.19 .82 .61 .90 ~
Peer Group: Small City Transit Systems
1976 1977 1978 1979 1980 1981 1982 1983 1984 1985 1986 1987 1988
Transit Agency Value .151 .149 .149 .143 .150 .148 .151 .152 .152 .138 .123 .130
Peer Group Mean .130 .139 .128 .124 .121 .128 .120 .121 .123 .121 .116 .119
Standard Score 1.35 .42 56 .72 1.12 52 1.10 1.13 1.29 .91 .67 .94
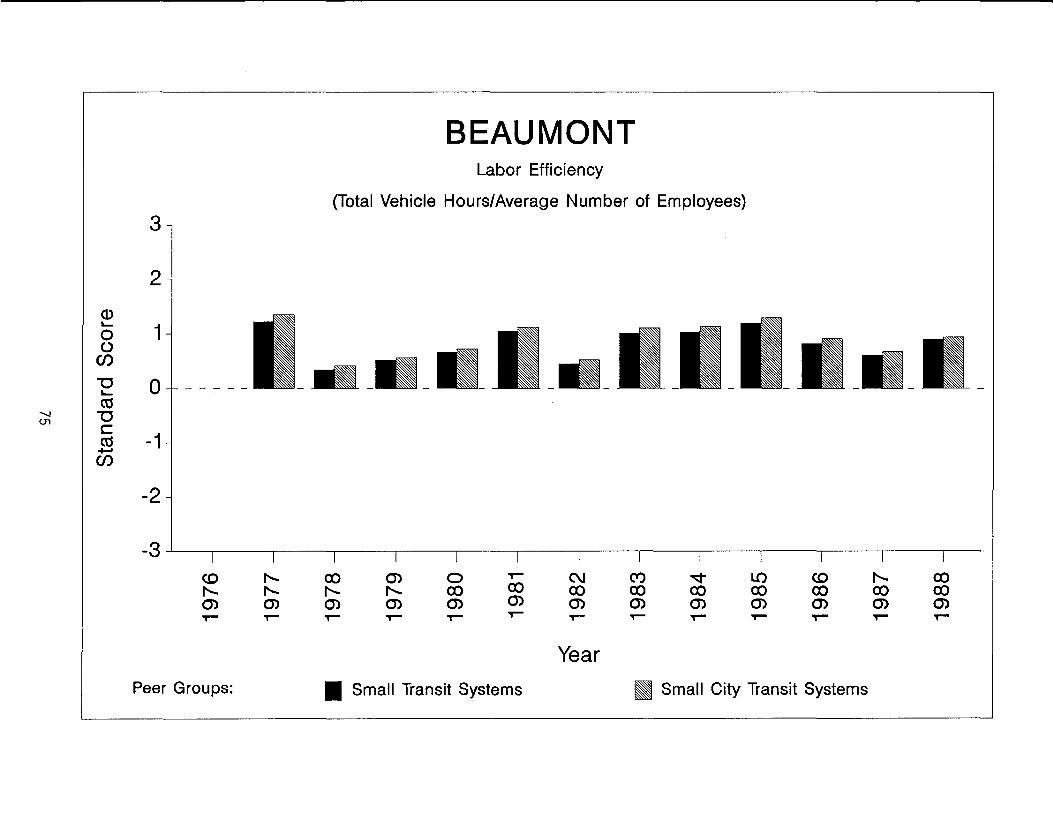
BEAUMONT Labor Efficiency
(Total Vehicle Hours/Average Number of Employees) 3
2
CD ~
1 0 (,)
(f) ---- ---"'C 0 - - - - -~
ctS -...J "'C U1 c
ctS -1 +oJ (f)
-2
-3 <.0 f'.... ex) m 0 ,- C\J ('t') ..q LO <.0 f'.... ex) f'.... f'.... f'.... f'.... ex) ex) ex) ex) ex) ex) ex) ex) ex) m m m m m m m m m m m m m ,- ,- ,- ,- ,- ,- ,- ,- ,- T""" ,- ,- ,-
Year Peer Groups: • Small Transit Systems • Small City Transit Systems
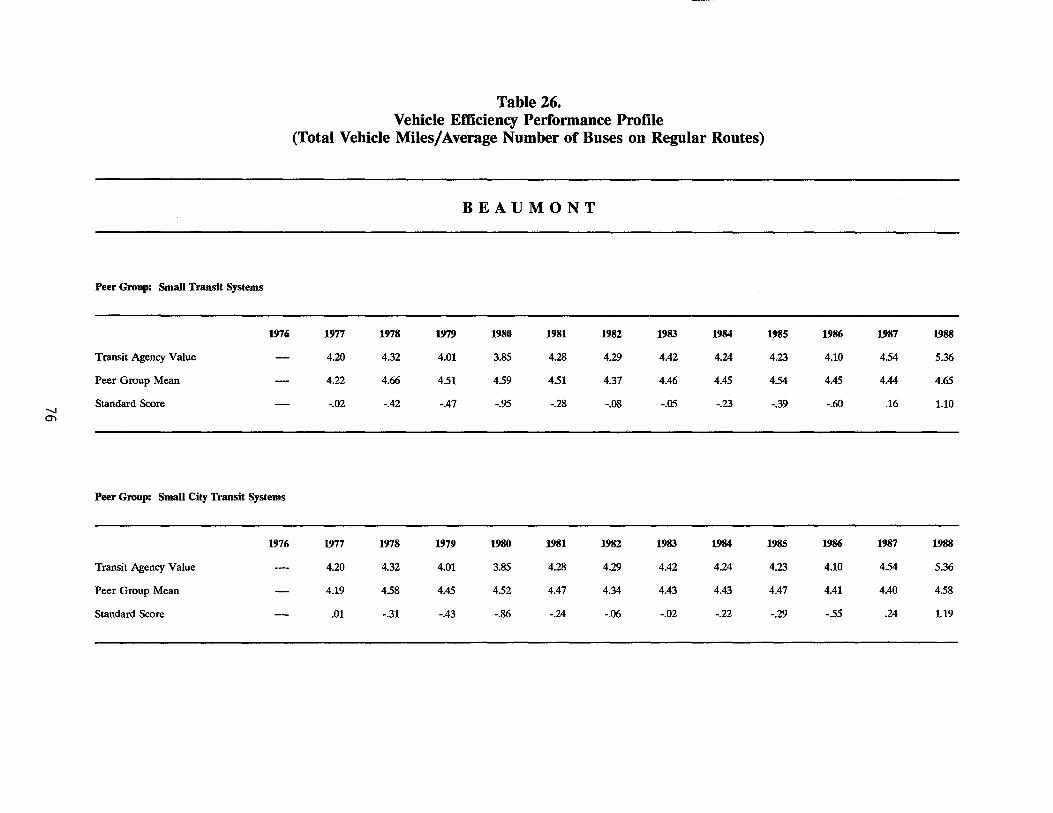
Table 26. Vehicle Efficiency Performance Profile
(Total Vehicle Miles/Average Number of Buses on Regular Routes)
BEAUMONT
Peer Group: SmaU Transit Systems
1976 1977 1978 1979 1980 1981 1982 1983 1984 1985 1986 1987 1988
Transit Agency Value 4.20 4.32 4.01 3.85 4.28 4.29 4.42 4.24 4.23 4.10 454 5.36
Peer Group Mean 4.22 4.66 451 459 451 4.37 4.46 4.45 454 4.45 4.44 4.65
Standard Score '-l
-.02 -.42 -.47 -.95 -.28 -.08 -.05 -.23 -.39 -.60 .16 1.10 0'1
Peer Group: SmaU City Transit Systems
1976 1977 1978 1979 1980 1981 1982 1983 1984 1985 1986 1987 1988
Transit Agency Value 4.20 4.32 4.01 3.85 4.28 4.29 4.42 4.24 4.23 4.10 4.54 5.36
Peer Group Mean 4.19 4.58 4.45 452 4.47 4.34 4.43 4.43 4.47 4.41 4.40 4.58
Standard Score .01 -.31 -.43 -.86 -.24 -.06 -.02 -.22 -.29 -55 .24 1.19

3
2
Q) L-
1 0 0
Cf)
"'0 0 - - - - -L-
aj '-J "'0 '-J
C aj -1 +-' Cf)
-2
-3 co f'... 0) ..--
Peer Groups:
BEAUMONT Vehicle Efficiency
(Total Vehicle Miles/Average Number of Buses on Regular Routes)
f'... f'... 0) ..--
.--.- __ - _SSS=\\S\I- __ -
co f'... 0) ..--
0) f'... 0) ..--
o co 0) ..--
..--co 0) ..--
• Small Transit Systems
C\J co 0) ..--
Year
('t') co 0) ..--
LO co 0) ..--
co co 0) ..--
• Small City Transit Systems
f'... co 0'> ..--
co co 0) ..--

...----------------------------

.--~~~----- ----- -
BROWNSVILLE
79

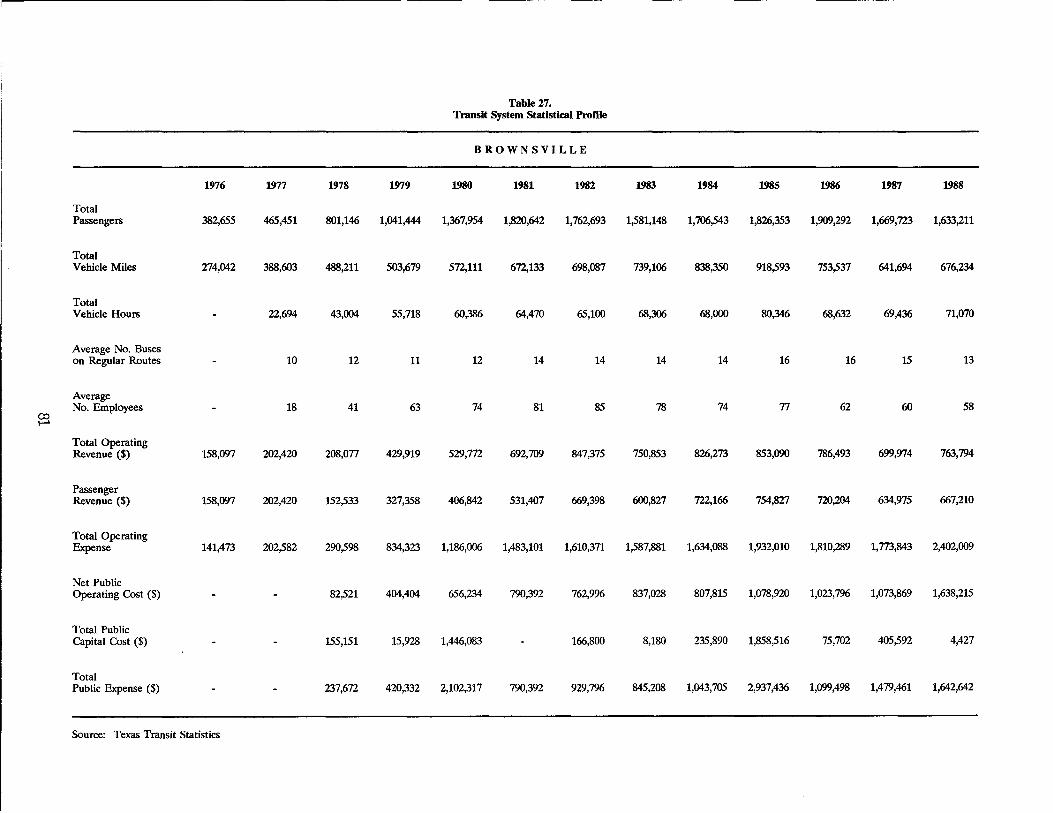
Table 27. Transit System Statistical Profde
BROWNSVILLE
1976 1977 1978 1979 1980 1981 1982 1983 1984 1985 1986 1987 1988
Total Passengers 382,655 465,451 801,146 1,041,444 1,367,954 1,820,642 1,762,693 1,581,148 1,706,543 1,826,353 1,909,292 1,669,723 1,633,211
Total Vehicle Miles 274,042 388,603 488,211 503,679 572,111 672,133 698,087 739,106 838,350 918,593 753,537 641,694 676,234
Total Vehicle Hours 22,694 43,004 55,718 60,386 64,470 65,100 68,306 68,000 80,346 68,632 69,436 71,070
Average No. Buses on Regular Routes 10 12 11 12 14 14 14 14 16 16 15 13
Average No. Employees 18 41 63 74 81 85 78 74 77 62 60 58
(X) I-'
Total Operating Revenue ($) 158,097 202,420 208,077 429,919 529,772 692,709 847,375 750,853 826,273 853,090 786,493 699,974 763,794
Passenger Revenue ($) 158,097 202,420 152,533 327,358 406,842 531,407 669,398 600,827 722,166 754,827 720,204 634,975 667,210
Total Operating Expense 141,473 202,582 290,598 834,323 1,186,006 1,483,101 1,610,371 1,587,881 1,634,088 1,932,010 1,810,289 1,773,843 2,402,009
Net Public Operating Cost ($) 82,521 404,404 656,234 790,392 762,996 837,028 807,815 1,078,920 1,023,7% 1,073,869 1,638,215
Total Public Capital Cost ($) 155,151 15,928 1,446,083 166,800 8,180 235,890 1,858,516 75,702 405,592 4,427
Total Public Expense ($) 237,672 420,332 2,102,317 790,392 929,796 845,208 1,043,705 2,937,436 1,099,498 1,479,461 1,642,642
Source: Texas Transit Statistics
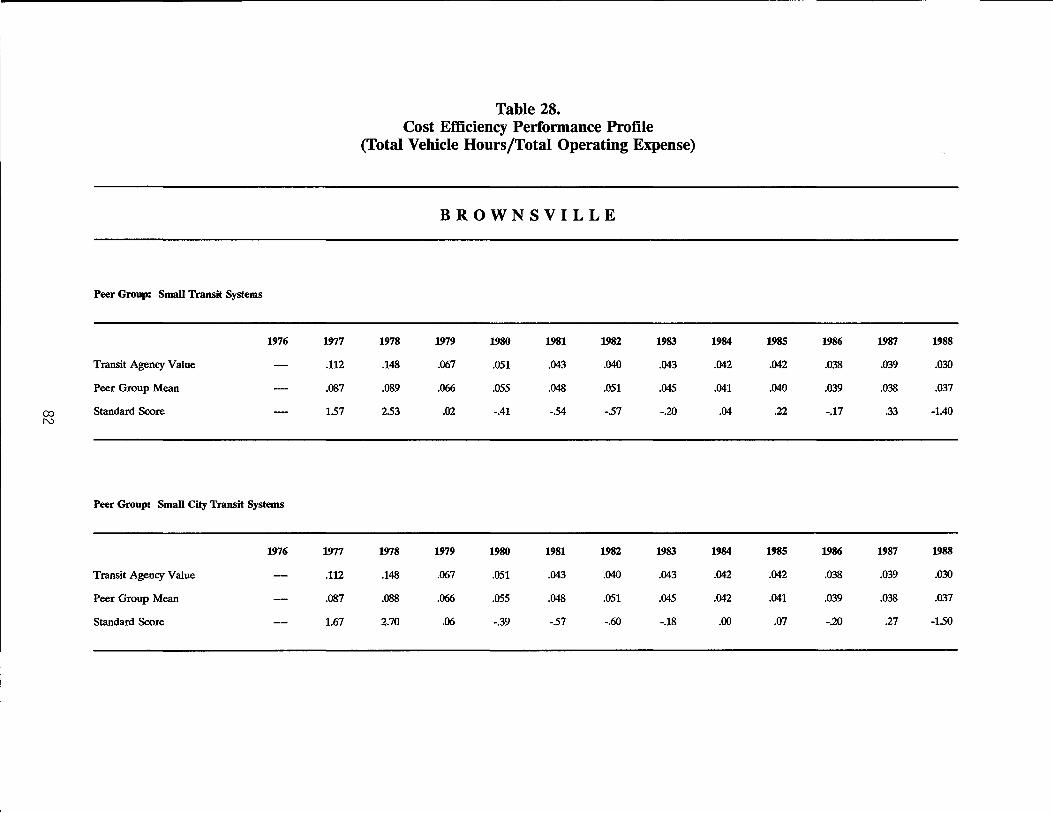
Peer Group: Small Transit Systems
1976 1977
Transit Agency Value .112
Peer Group Mean .087
00 Standard Score 157 1'0
Peer Group: Small City Transit Systems
1976 1977
Transit Agency Value .112
Peer Group Mean .087
Standard Score 1.67
Table 28. Cost Efficiency Performance Profile
(Total Vehicle Hours/Total Operating Expense)
BROWNSVILLE
1978 1979 1980 1981 1982 1983
.148 JJ67 .051 .043 .040 .043
.089 .066 .055 .048 .051 .045
253 .02 -.41 -.54 -57 -.20
1978 1979 1980 1981 1982 1983
.148 JJ67 .051 .043 .040 .043
.088 .066 .055 .048 .051 .045
2.70 .06 -.39 -.57 -.60 -.18
1984 1985 1986 1987 1988
.042 .042 .038 .039 .030
.041 .040 .039 .038 .037
.04 .22 -.17 .33 -1.40
1984 1985 1986 1987 1988
.042 .042 .038 .039 .030
.042 .041 .039 .038 .037
.00 .07 -.20 .27 -150

3
2
Q) L-
1 0 0
Cf)
"'0 0 - - - - -L-
etS co "'0 w c
-1 etS ..... Cf)
-2
-3 <0 r-.... 0) T"""
Peer Groups:
r-.... r-.... 0) T"""
co r-.... 0) T"""
BROWNSVILLE Cost Efficiency
(Total Vehicle Hours/Total Operating Expense)
=---
o co 0) T"""
C\I co 0) ,...
Year
_ _ _____ lw§§:::§1'''' ___ = ..
~== ---
• Small Transit Systems • Small City Transit Systems
co co 0) ,...
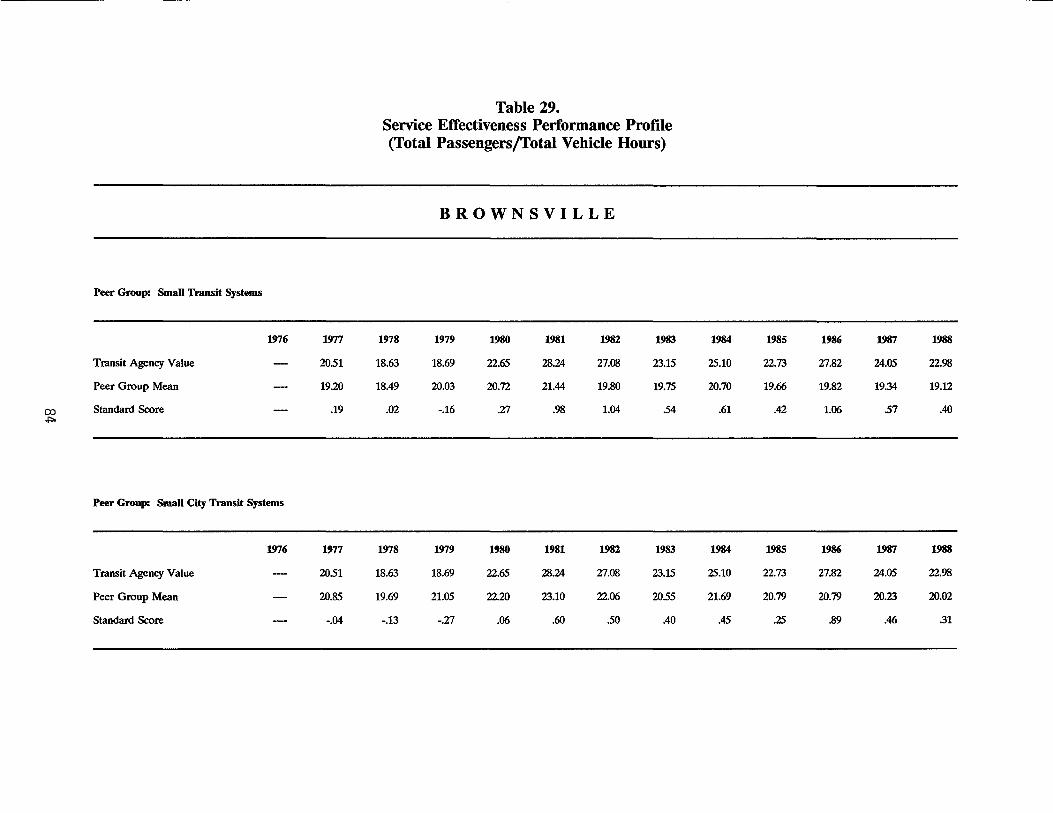
Peer Group: Small Transit Systems
1976
Transit Agency Value
Peer Group Mean
00 Standard Score ..j:::>
Peer Group: Smau City Transit Systems
1976
Transit Agency Value
Peer Group Mean
Standard Score
1977
20.51
19.20
.19
1977
20.51
20.85
-.04
Table 29. Service Effectiveness Performance Profile (Total Passengers/Total Vehicle Hours)
1978
18.63
18.49
.02
1978
18.63
19.69
-.13
BROWNSVILLE
1979
18.69
20.03
-.16
1979
18.69
21.05
-.27
1980
22.65
20.72
.27
1980
22.65
22.20
.06
1981
28.24
21.44
.98
1981
28.24
23.10
.60
1982
27.08
19.80
1.04
1982
27.08
22.06
.50
1983
23.15
19.75
.54
1983
23.15
20.55
.40
1984
25.10
20.70
.61
1984
25.10
21.69
.45
1985
22.73
19.66
.42
1985
22.73
20.79
.25
1986
27.82
19.82
1.06
1986
27.82
20.79
.89
1987
24.05
19.34
.57
1987
24.05
20.23
.46
1988
22.98
19.12
.40
1988
22.98
20.02
.31
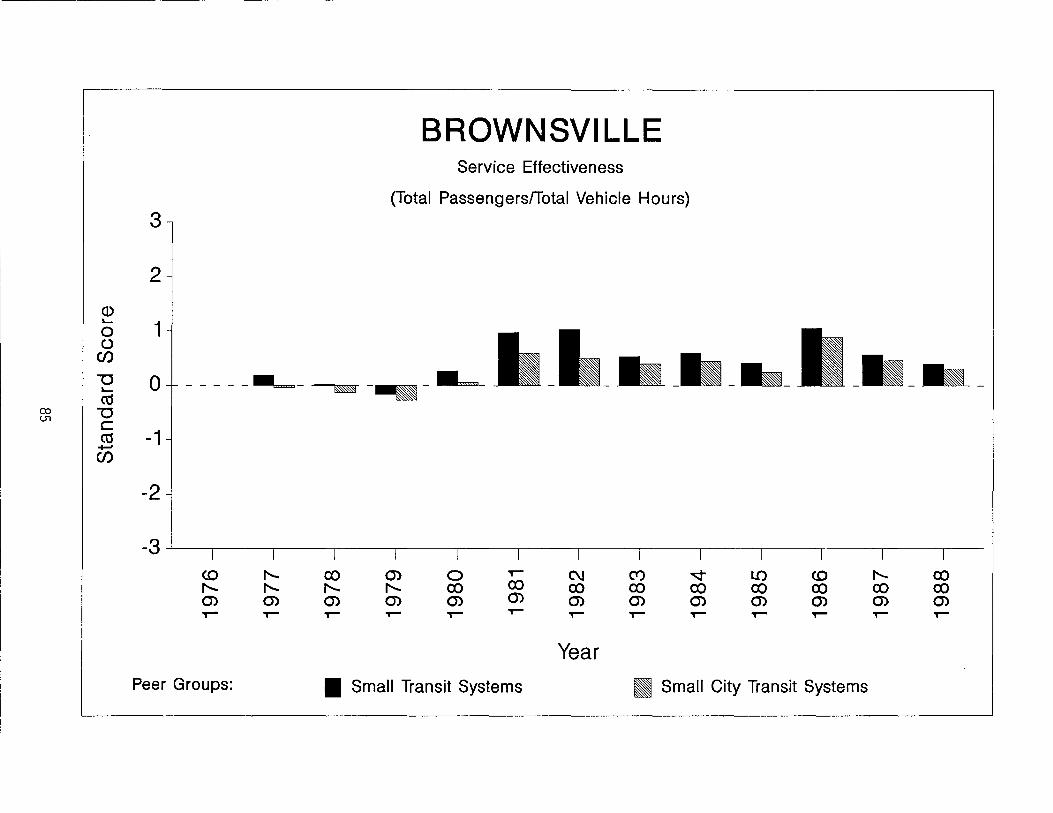
3
2
Q) L..
1 0 ()
(/)
"'0 0 - - - - -L..
('\j 00 "'0 (J1 c
('\j -1 +-' (/)
-2
-3 CO I"'---I"'--- I"'---Q') Q') ~ ~
Peer Groups:
BROWNSVILLE Service Effectiveness
(Total Passengers/Total Vehicle Hours)
~ - U---
o ex:> Q') ~
~
ex:> Q') ~
C\J ex:> Q') ~
Year
_IR_
(V) ex:> Q') ~
LO ex:> Q') ~
CO ex:> Q') ~
• Small Transit Systems • Small City Transit Systems
I"'--ex:> Q') ~
-----
ex:> ex:> Q') ~
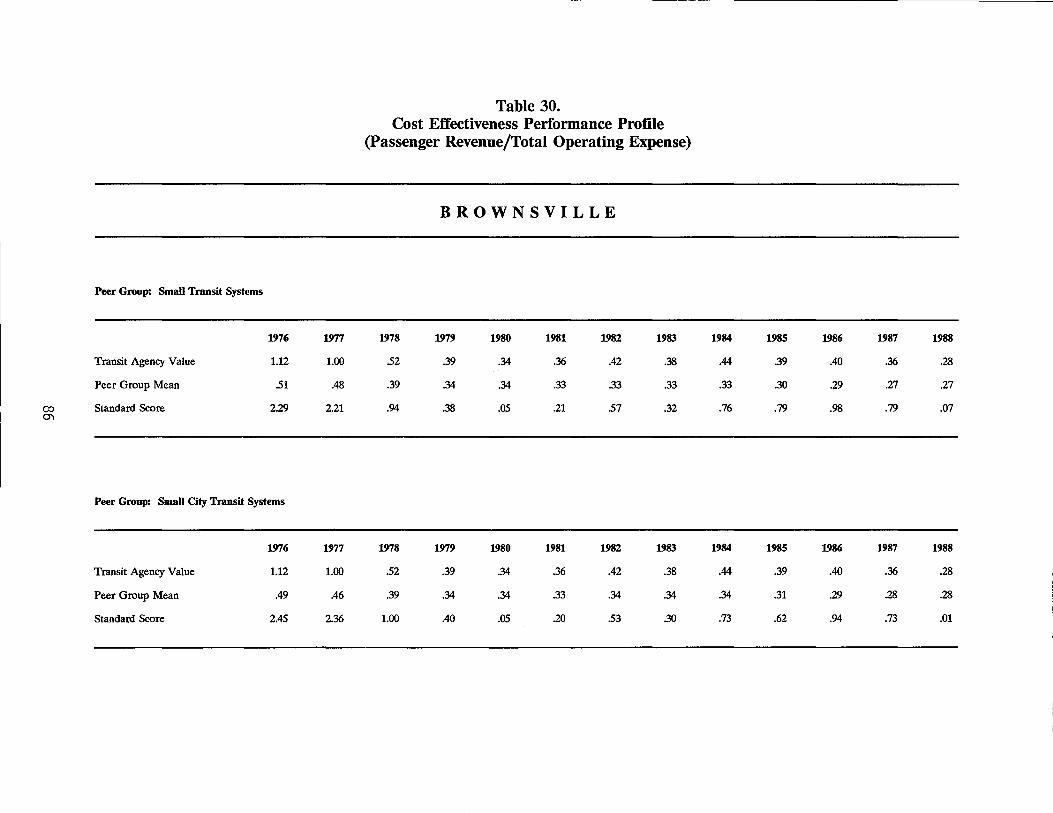
Peer Group: Small Transit Systems
1976 1977
Transit Agency Value 1.12 1.00
Peer Group Mean .51 .48
00 Standard Score 2.29 2.21 0'1
Peer Group: Small City Transit Systems
1976 1977
Transit Agency Value 1.12 1.00
Peer Group Mean .49 .46
Standard Score 2.45 2.36
Table 30. Cost Effectiveness Performance Profile
(Passenger Revenue/Total Operating Expense)
BROWNSVILLE
1978 1979 1980 1981 1982 1983
.52 .39 .34 .36 .42 .38
.39 .34 .34 .33 .33 .33
.94 .38 .05 .21 .57 .32
1978 1979 1980 1981 1982 1983
.52 .39 .34 .36 .42 .38
.39 .34 .34 .33 .34 .34
1.00 .40 .05 .20 .53 .30
1984 1985 1986 1987 1988
.44 .39 .40 .36 .28
.33 .30 .29 .27 .27
.76 .79 .98 .79 .07
1984 1985 1986 1987 1988
.44 .39 .40 .36 .28
.34 .31 .29 .28 .28
.73 .62 .94 .73 .01

BROWNSVILLE Cost Effectiveness
(Passenger Revenue/Total Operating Expense) 3
2
<D '- 1 0 0
CJ)
"'0 --- ---0 '-(tj
en "'0 " c
-1 (tj +-' CJ)
-2
-3 <0 f'-... co m 0 T""" C\J Ct) "¢ LO <0 f'-... co f'-... f'-... f'-... f'-... co co co co co co co co co m m m m m m m m m m m m m T""" T""" T""" T""" T""" T""" T""" ,.- T""" T""" T""" T""" T"""
Year Peer Groups: • Small Transit Systems • Small City Transit Systems

Table 31. Labor Efficiency Performance Profile
(Total Vehicle Hours/Average Number of Employees)
BROWNSVILLE
Peer Group: Small Transit Systems
1976 1977 1978 1979 1980 1981 1982 1983 1984 1985 1986 1987 1988
Transit Agency Value .126 .105 .088 .082 .080 .077 .088 .092 .104 .111 .116 .123
Peer Group Mean .131 .140 .129 .125 .122 .131 .122 .123 .124 .122 .116 .119
CO Standard Score -.32 -1.41 CO
-1.05 -1.54 -1.55 -1.42 -1.19 -1.10 -.84 -.59 -.06 .29
Peer Group: Small City Transit Systems
1976 1977 1978 1979 1980 1981 1982 1983 1984 1985 1986 1987 1988
Transit Agency Value .126 .105 .088 .082 .080 .077 .088 .092 .104 .111 .116 .123
Peer Group Mean .130 .139 .128 .124 .121 .128 .120 .121 .123 .121 .116 .119
Standard Score -.24 -1.41 -1.10 -1.58 -1.61 -1.41 -1.19 -1.09 -.82 -.54 -.04 .29
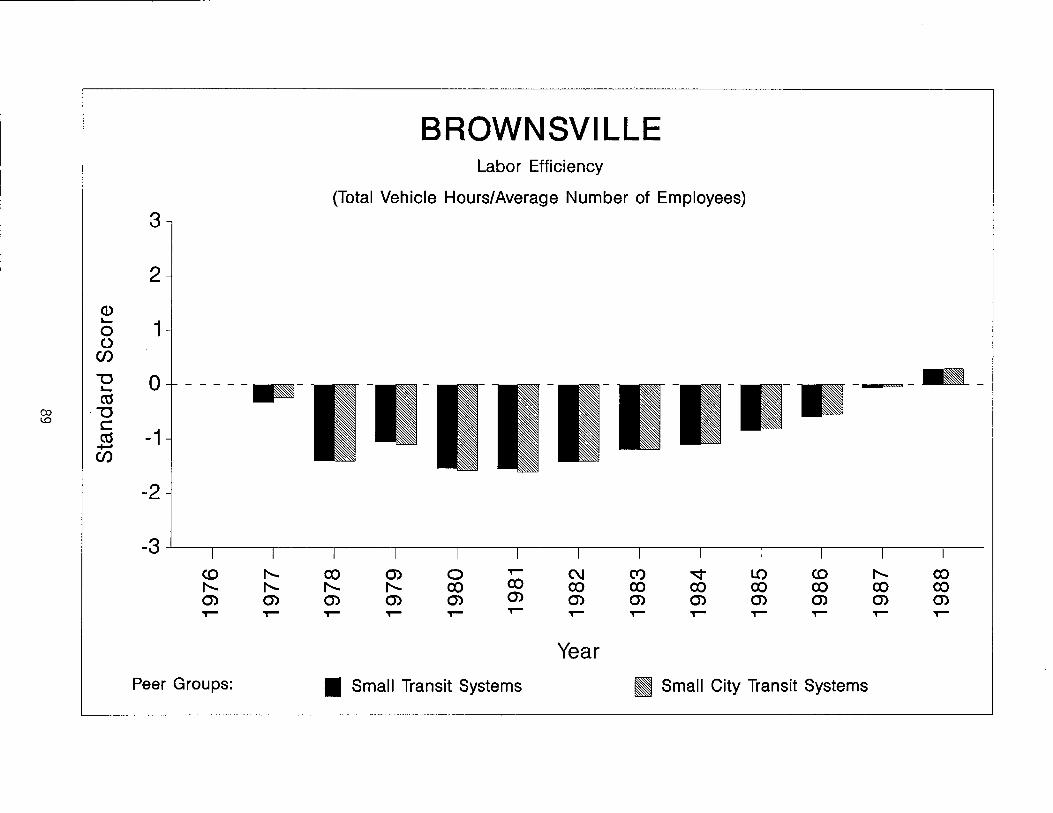
3
2
Q) ~
1 0 ()
Cf)
"'0 0 - - - - - .. -~
ctS OJ "'0 <.0 C
ctS -1 +-" Cf)
-2
-3 CD f'-... f'-... f'-... 0> 0> ,-- ,--
Peer Groups:
BROWNSVILLE Labor Efficiency
(Total Vehicle Hours/Average Number of Employees)
co 0> f'-... f'-... 0> 0> ,-- ,--
o co 0> ,--
,--co 0> ,--
C\J co 0> ,--
Year
(t) co 0> ,--
-.:;:t co 0> ,--
LO co 0> ,--
CD co 0> ,--
-=----
f'-... co 0> ,--
co co 0> ,--
• Small Transit Systems 11 Small City Transit Systems

Table 32. Vehicle Efficiency Performance Profile
(Total Vehicle Miles/Average Number of Buses on Regular Routes)
BROWNSVILLE
Peer Group: SmaU Transit Systems
1976 1977 1978 1979 1980 1981 1982 1983 1984 1985 1986 1987 1988
Transit Agency Value 3.89 4.07 4.58 4.77 4.80 4.99 5.28 5.99 5.74 4.71 4.28 5.20
Peer Group Mean 4.22 4.66 4.51 4.59 4.51 4.37 4.46 4.45 4.54 4.45 4.44 4.65
I.D Standard Score -.37 -.73 .07 .22 .36 .67 1.00 1.69 1.48 .44 -.29 .86 0
Peer Group: SmaU City Transit Systems
1976 1977 1978 1979 1980 1981 1982 1983 1984 1985 1986 1987 1988
Transit Agency Value 3.89 4.07 4.58 4.77 4.80 4.99 5.28 5.99 5.74 4.71 4.28 5.20
Peer Group Mean 4.19 4.58 4.45 4.52 4.47 4.34 4.43 4.43 4.47 4.41 4.40 4.58
Standard Score -.36 -.62 .12 .31 .43 .73 1.08 1.80 1.57 .53 -.21 .95

Q) "-0 ()
en ""0 "-as
\.0 ""0 I--' C as +-' en
BROWNSVILLE Vehicle Efficiency
(Total Vehicle Miles/Average Number of Buses on Regular Routes) 3
2
1
0 - - - - ----1
-2
-3 <0 I'--I'-- I'--0) 0) ,... ,-
Peer Groups:
co I'--0) ,...
'TIT _ "- ----
o co 0) ,...
,... co 0) ,...
• Small Transit Systems
C\I co 0) ,-
Year
,-
.qco 0) ,...
LO co 0) ,-
.. -.. -
<0 co 0) ,...
I'-co 0) ,...
• Small City Transit Systems
co co 0) ,...


CORPUS CHRISTI
93


Table 33. Transit System Statistical Prome
CORPUS CHRISTI
1976 1977 1978 1979 1980 1981 1982 1983 1984 1985 1986 1987 1988
Total Passengers 1,505,819 1,950,384 1,810,691 1,749,217 1,880,581 1,603,596 1,589,075 1,490,242 1,557,506 1,565,615 1,758,644 3,042,824 2,682,813
Total Vehicle Miles 1,333,819 1,475,713 1,279,983 1,297,796 1,377,939 1,271,899 1,422,308 1,327,697 1,286,664 1,236,739 1,894,864 2,644,915 2,477,438
Total Vehicle Hours 92,885 94,353 94,740 99,471 92,713 104,579 100,916 98,037 94,796 134,630 169,190 152,779
Average No. Buses on Regular Routes 29 26 26 28 27 30 29 29 27 39 43 43
Average No. Employees 82 79 80 91 90 94 97 93 93 153 162 178
~ U1
Total Operating Revenue ($) 507,783 905,922 1,059,454 1,279,876 1,603,917 1,634,858 1,824,443 1,603,030 1,893,606 876,499 799,843 809,748 722,193
Passenger Revenue ($) 407,884 534,819 562,895 684,234 764,697 740,816 908,820 892,858 946,609 876,499 799,843 809,748 722,193
Total Operating Expense ($) 1,223,726 1,697,440 1,923,037 2,330,934 2,770,374 3,381,029 3,752,919 3,399,337 3,091,111 3,943,521 5,202,648 8,357,838 8,706,320
Net Public Operating Cost ($) 715,988 791,518 863,583 1,051,058 1,166,457 1,746,171 1,928,476 1,796,307 1,197,505 3,067,022 4,402,805 7,548,090 7,984,127
Total Public Capital Cost ($) 910,790 116,008 65,752 39,183 957,976 2,487,300 1,362,200 1,433 410,188 513,316 2,368,852 2,608,336 1,243,917
Total Public Expense ($) 1,626,778 907,526 929,335 1,090,241 2,124,433 4,233,471 3,290,676 1,797,740 1,607,693 3,580,338 6,771,657 10,156,426 9,228,044
Source: Texas Transit Statistics
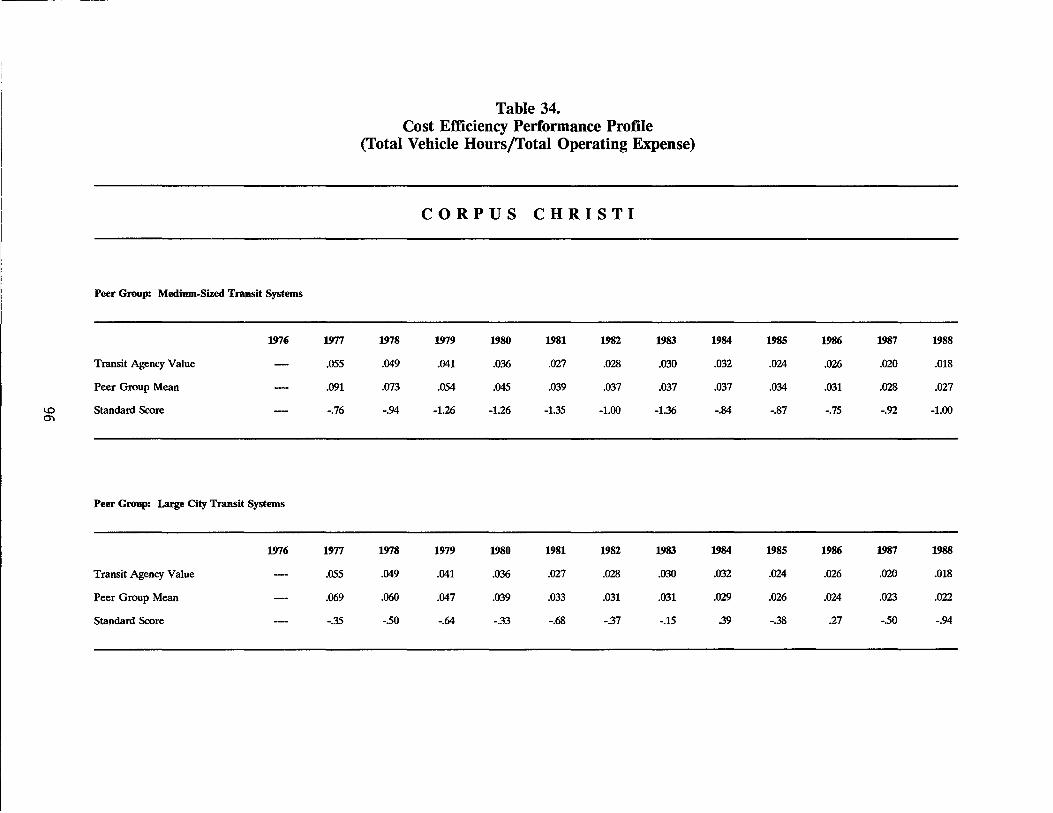
Peer Group: Medium-Sized Transit Systems
1976 1977
Transit Agency Value .055
Peer Group Mean .091
~ Standard Score -.76 0'1
Peer Group: Large City Transit Systems
1976 1977
Transit Agency Value .055
Peer Group Mean .069
Standard Score -.35
Table 34. Cost Efficiency Performance Profile
(Total Vehicle Hours/Total Operating Expense)
CORPUS CHRISTI
1978 1979 1980 1981 1982 1983
.049 .041 .036 .027 .028 .030
.073 .054 .045 .039 .037 .037
-.94 -1.26 -1.26 -1.35 -1.00 -1.36
1978 1979 1980 1981 1982 1983
.049 .041 .036 .027 .028 .030
.060 .047 .039 .033 .031 .031
-.50 -.64 -.33 -.68 -.37 -.15
1984 1985 1986 1987 1988
.032 .024 .026 .020 .018
.037 .034 .031 .028 .027
-.84 -.87 -.75 -.92 -1.00
1984 1985 1986 1987 1988
.032 .024 .026 .020 .018
.029 .026 .024 .023 .022
.39 -.38 .27 -.50 -.94

3
2
Q) 10-
1 0 () en u 0 -----r-Io..
m ~ u -....J c
m -1 +-" en
-2
-3 <D ,..... ,..... ,..... m m T""" T"""
Peer Groups:
to ,..... m T"""
CORPUS CHRISTI Cost Efficiency
(Total Vehicle Hours/Total Operating Expense)
m ,..... m T"""
o to m T"""
T"""
to m T"""
C\J to m T"""
Year
(t) to m T"""
~ to m T"""
L{) to m T"""
<D to m T"""
• Medium-Sized Transit Systems • Large City Transit Systems
,..... to m T"""
to to m T"""

~--------------------------------------------------------------------------------------------------------~~~~~~--------------
Peer Group: Medium-Sized Transit Systems
1976 1977
Transit Agency Value 21.00
Peer Group Mean 24.35
1..0 Standard Score -.51 00
Peer Group: Large City Transit Systems
1976 1977
Transit Agency Value 21.00
Peer Group Mean 30.94
Standard Score -.92
Table 35. Service Effectiveness Performance Profile (Total Passengers/Total Vehicle Hours)
CORPUS CHRISTI
1978 1979 1980 1981 1982 1983
19.19 18.46 18.91 17.30 15.19 14.77
22.64 25.02 27.78 27.38 26.62 22.86
-.65 -1.22 -1.15 -1.02 -.89 -1.11
1978 1979 1980 1981 1982 1983
19.19 18.46 18.91 17.30 15.19 14.77
26.16 27.54 28.78 27.49 25.65 25.18
-1.12 -1.51 -1.57 -1.51 -1.44 -1.36
1984 1985 1986 1987 1988
15.89 16.52 13.06 17.98 17.56
24.20 24.53 22.68 23.79 24.24
-1.01 -.92 -1.04 -.65 -.76
1984 1985 1986 1987 1988
15.89 16.52 13.06 17.98 17.56
25.99 25.35 23.02 23.39 24.54
-1.29 -1.18 -1.33 -.66 -.89
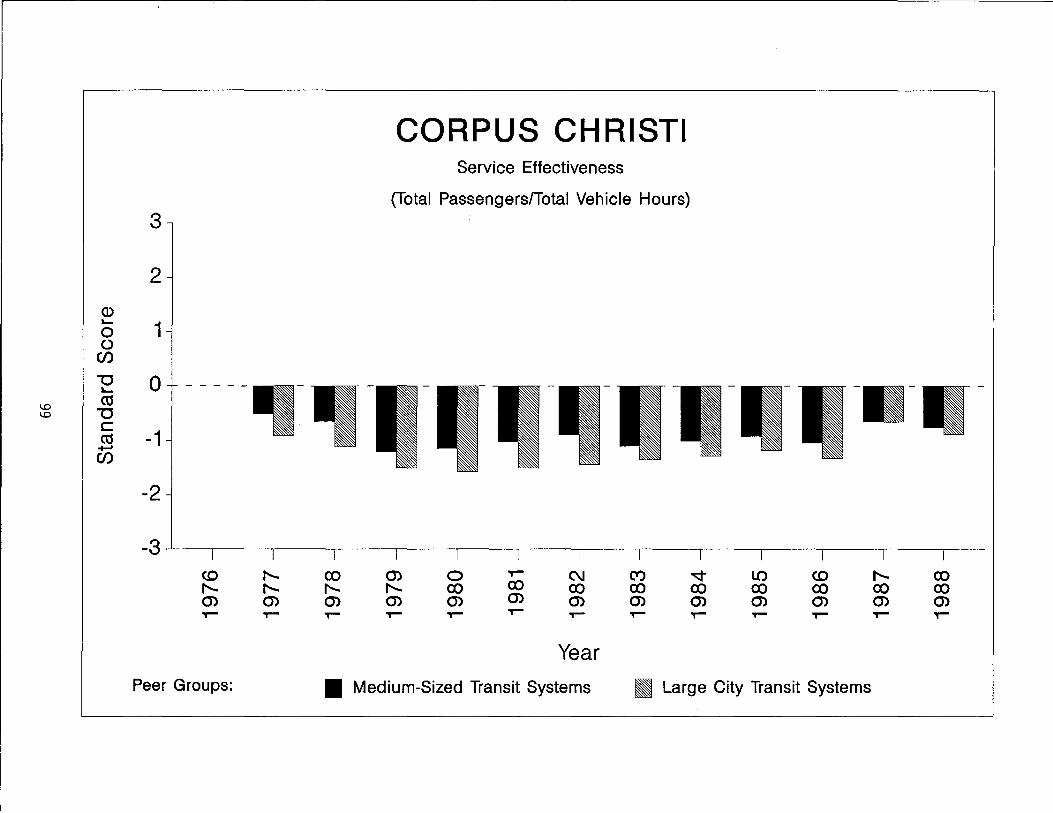
CORPUS CHRISTI Service Effectiveness
(Total Passengers/Total Vehicle Hours) 3
2
<D "- 1 0 0 en
"'0 0 - - - - -"-
\.0 ctS \.0 "'0
c -1 ctS
+-' en
-2
-3 CD f'.. f'.. f'.. 0) 0)
co 0> 0 T""" C\J (V) ..q- LO CD f'.. co f'.. f'.. co co co co co co co co co 0) 0> 0) 0) 0) 0) 0) 0) 0) 0) 0)
T""" T""" T""" T""" T""" T""" T""" T""" T""" T""" T""" T""" T"""
Year Peer Groups: • Medium-Sized Transit Systems • Large City Transit Systems

I-' 0 0
~~-~~-~-------------------------------------------------
Peer Group: Medium-Sized Transit Systems
1976 1977
Transit Agency Value .33 .32
Peer Group Mean 53 52
Standard Score -.63 -.66
Peer Group: Large City Transit Systems
1976 1977
Transit Agency Value .33 .32
Peer Group Mean 55 53
Standard Score -.94 -.92
Table 36. Cost Effectiveness Performance Profile
(Passenger Revenue/Total Operating Expense)
CORPUS CHRISTI
1978 1979 1980 1981 1982 1983
.29 .29 .28 .22 .24 .26
.45 .40 .38 .35 .36 .37
-.88 -.80 -.95 -1.32 -1.43 -1.41
1978 1979 1980 1981 1982 1983
.29 .29 .28 .22 .24 .26
.43 .39 .37 .36 .34 .34
-.80 -.65 -.80 -1.04 -.82 -.73
1984 1985 1986 1987 1988
.31 .22 .15 .10 .08
.39 .36 .31 .30 .27
-1.37 -1.18 -1.29 -1.20 -1.29
1984 1985 1986 1987 1988
.31 .22 .15 .10 .08
.32 .28 .25 .24 .23
-.19 -.81 -.85 -1.06 -1.29

CORPUS CHRISTI Cost Effectiveness
(Passenger Revenue/Total Operating Expense) 3
2
Q) 10-
1 0 0
(/)
"'0 0 10-
ct1 I-' "'0 0 I-' C
ct1 -1 +-" (/)
-2
-3 <0 r-..... r-..... r-..... (J') (J')
co (J') 0 ~ C\J (Y) "¢ LO <0 r-..... co r-..... r-..... co co co co co co co co co (J') (J') (J') (J') (J') (J') (J') (J') (J') (J') (J')
~ ~ ~ ~ ~ ~ ~ ~ ~ ~ ~ ~ ~
Year Peer Groups: • Medium-Sized Transit Systems • Large City Transit Systems

Peer Group: Medium-Sized Transit Systems
1976
Transit Agency Value
Peer Group Mean
~ Standard Score 0 N
Peer Group: Large City Transit Systems
1976
Transit Agency Value
Peer Group Mean
Standard Score
Table 37. Labor Efficiency Performance Profile
(Total Vehicle Hours/Average Number of Employees)
1977 1978
.113 .119
.135 .136
-.48 -.56
1977 1978
.113 .119
.118 .126
-.13 -.27
CORPUS CHRISTI
1979 1980
.118 .109
.123 .115
-.65 -1.09
1979 1980
.118 .109
.117 .110
.15 -.06
1981
.103
.113
-1.25
1981
.103
.108
-.53
1982
.111
.110
.31
1982
.111
.107
.47
1983 1984
.104 .105
.106 .103
-.27 .56
1983 1984
.104 .105
.105 .102
-.14 .46
1985
.102
.102
.00
1985
.102
.098
.49
1986
.088
.097
-1.09
1986
.088
.097
-.54
1987
.104
.100
.37
1987
.104
.101
.23
1988
.086
.098
-.76
1988
.086
.101
-.81

I-' o w
Q) "-o ()
CJ)
"'0 "-a:s
"'0 c a:s ......
CJ)
CORPUS CHRISTI Labor Efficiency
(Total Vehicle Hours/Average Number of Employees)
3
2
1
-1
- --- _.-o -----r-r -.--r -2
-3~~----~--~----~--~~--~----~--~----~--~----~--~----~--
f'-... co 0) 0 ~ C\J Ct) -q- LO co f'-... co f'-... f'-... f'-... co co co co co co co co co 0) 0) 0) 0) 0) 0) 0) 0) 0) 0) 0) 0) or- ~ or- or- ~ ~ or- ~ or- ~ or- ~
Year
Peer Groups: • Medium-Sized Transit Systems II Large City Transit Systems

Table 38. Vehicle Efficiency Performance Profile
(Total Vehicle Miles/Average Number of Buses on Regular Routes)
CORPUS CHRISTI
Peer Group: Medium-Sized Transit Systems
1976 1977 1978 1979 1980 1981 1982 1983 1984 1985 1986 1987 1988
Transit Agency Value 5.09 4.92 4.99 4.92 4.71 4.74 458 4.44 458 4.86 6.15 5.76
Peer Group Mean 453 452 4.62 452 4.47 4.39 4.25 4.27 4.20 4.41 4.83 4.62
- Standard Score 59 .40 .32 .35 .22 .41 52 .35 .72 .72 1.38 1.32 0 .j:::o
Peer Group: Large City Transit Systems
1976 1977 1978 1979 1980 1981 1982 1983 1984 1985 1986 1987 1988
Transit Agency Value 5.09 4.92 4.99 4.92 4.71 4.74 4.58 4.44 458 4.86 6.15 5.76
Peer Group Mean 2.85 4.60 450 4.46 4.46 4.48 4.57 4.42 4.40 4.09 4.22 4.71 457
Standard Score .40 52 .59 .46 .19 .13 .13 .04 .85 1.04 1.75 1.81
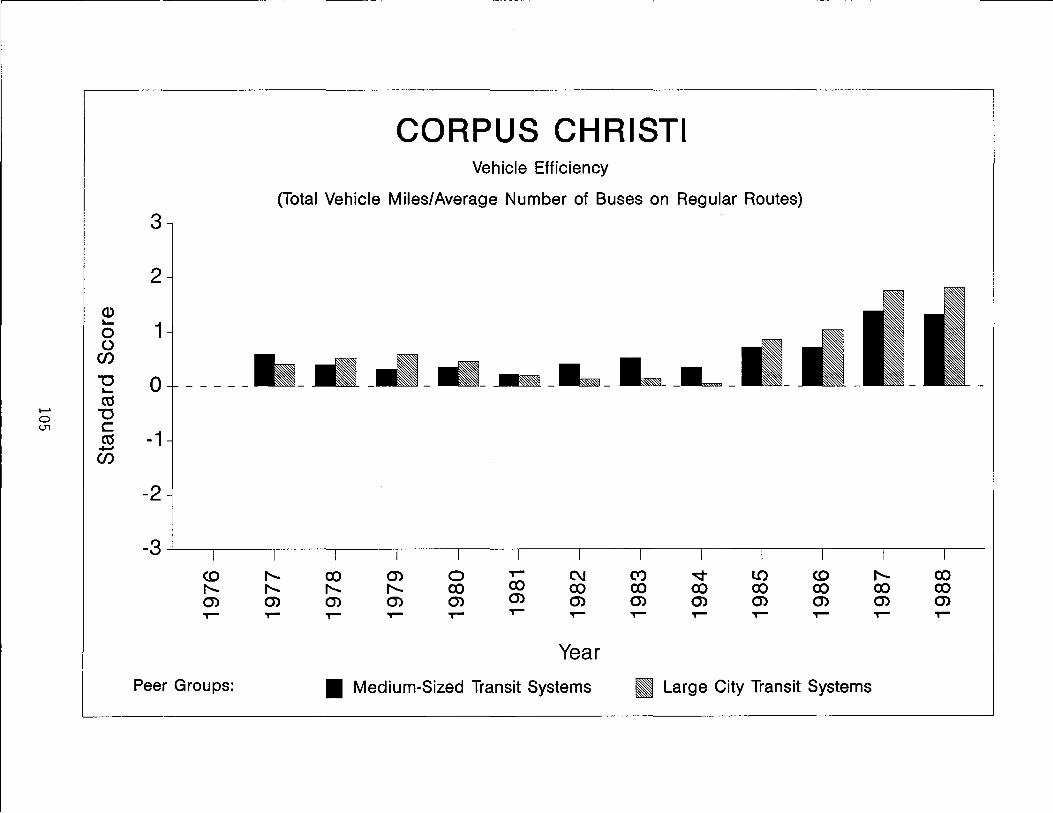
CORPUS CHRISTI Vehicle Efficiency
(Total Vehicle Miles/Average Number of Buses on Regular Routes)
3
2
(l.) ~
1 0 0
Cf)
"'C 0 ~
_____ ~_JdI_~_~_ ~_~_~_~_ ct$
I-' "'C 0 lT1 C
ct$ -1 +-' Cf)
-2
-3 <0 I"- co 0> 0 ~ C\J ('t') ~ LO <0 I"- co l"- I"- l"- I"- co co co co co co co co co 0> (j) (j) 0> (j) 0> (j) 0> 0> (j) (j) (j) (j) .,- .,- ~ ~ ~ ~ ~ .,- ~ ~ .,- ~ ~
Year
Peer Groups: • Medium-Sized Transit Systems • Large City Transit Systems


DALLAS
107

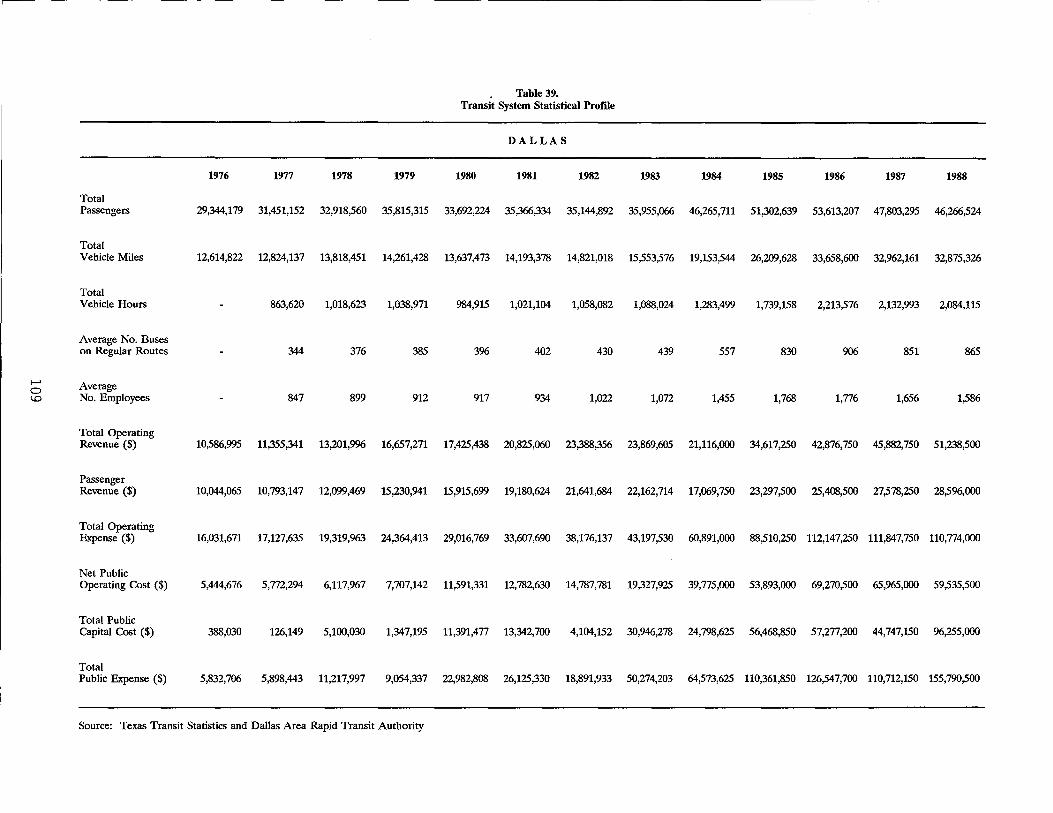
Table 39. Transit System Statistical Prome
DALLAS
1976 1977 1978 1979 1980 1981 1982 1983 1984 1985 1986 1987 1988
Total Passengers 29,344,179 31,451,152 32,918,560 35,815,315 33,692,224 35,366,334 35,144,892 35,955,066 46,265,711 51,302,639 53,613,207 47,803,295 46,266,524
Total Vehicle Miles 12,614,822 12,824,137 13,818,451 14,261,428 13,637,473 14,193,378 14,821,018 15,553,576 19,153,544 26,209,628 33,658,600 32,962,161 32,875,326
Total Vehicle Hours 863,620 1,018,623 1,038,971 984,915 1,021,104 1,058,082 1,088,024 1,283,499 1,739,158 2,213,576 2,132,993 2,084,115
Average No. Buses on Regular Routes 344 376 385 3% 402 430 439 557 830 906 851 865
I-' Average 0 ~ No. Employees 847 899 912 917 934 1,022 1,072 1,455 1,768 1,776 1,656 1,586
Total Operating Revenue ($) 10,586,995 11,355,341 13,201,996 16,657,271 17,425,438 20,825,060 23,388,356 23,869,605 21,116,000 34,617,250 42,876,750 45,882,750 51,238,500
Passenger Revenue ($) 10,044,065 10,793,147 12,099,469 15,230,941 15,915,699 19,180,624 21,641,684 22,162,714 17,069,750 23,297,500 25,408,500 27,578,250 28,596,000
Total Operating Expense ($) 16,031,671 17,127,635 19,319,963 24,364,413 29,016,769 33,607,690 38,176,137 43,197,530 60,891,000 88,510,250 112,147,250 111,847,750 110,774,000
Net Public Operating Cost ($) 5,444,676 5,772,294 6,117,%7 7,707,142 11,591,331 12,782,630 14,787,781 19,327,925 39,775,000 53,893,000 69,270,500 65,965,000 59,535,500
Total Public Capital Cost ($) 388,030 126,149 5,100,030 1,347,195 11,391,477 13,342,700 4,104,152 30,946,278 24,798,625 56,468,850 57,277,200 44,747,150 96,255,000
Total Public Expense ($) 5,832,706 5,898,443 11,217,997 9,054,337 22,982,808 26,125,330 18,891,933 50,274,203 64,573,625 110,361,850 126,547,700 110,712,150 155,790,500
Source: Texas Transit Statistics and DaJlas Area Rapid Transit Authority

Peer Group: Large Transit Systems
1976
Transit Agency Value
Peer Group Mean
~ Standard Score ~
0
Peer Group: Large City Transit Systems
1976
Transit Agency Value
Peer Group Mean
Standard Score
1977
.050
.051
-.19
1977
.050
.069
-.46
Table 40. Cost Efficiency Performance Profile
(Total Vehicle Hours/Total Operating Expense)
1978
.053
.052
.10
1978
.053
.060
-.34
1979
.043
.043
-.10
1979
.043
.047
-.43
DALLAS
1980
.034
.036
-.20
1980
.034
.039
-55
1981
.030
.030
-.01
1981
.030
.033
-.32
1982
.028
.029
-.11
1982
.028
.031
-.39
1983
.025
.028
-.34
1983
.025
.031
-.80
1984
.021
.026
-.78
1984
.021
.029
-1.33
1985
.020
.024
-.77
1985
.020
.026
-1.21
1986
.020
.021
-.22
1986
.020
.024
-.67
1987
.019
.022
-.41
1987
.019
.023
-.74
1988
.019
.022
-.54
1988
.019
.022
-.69
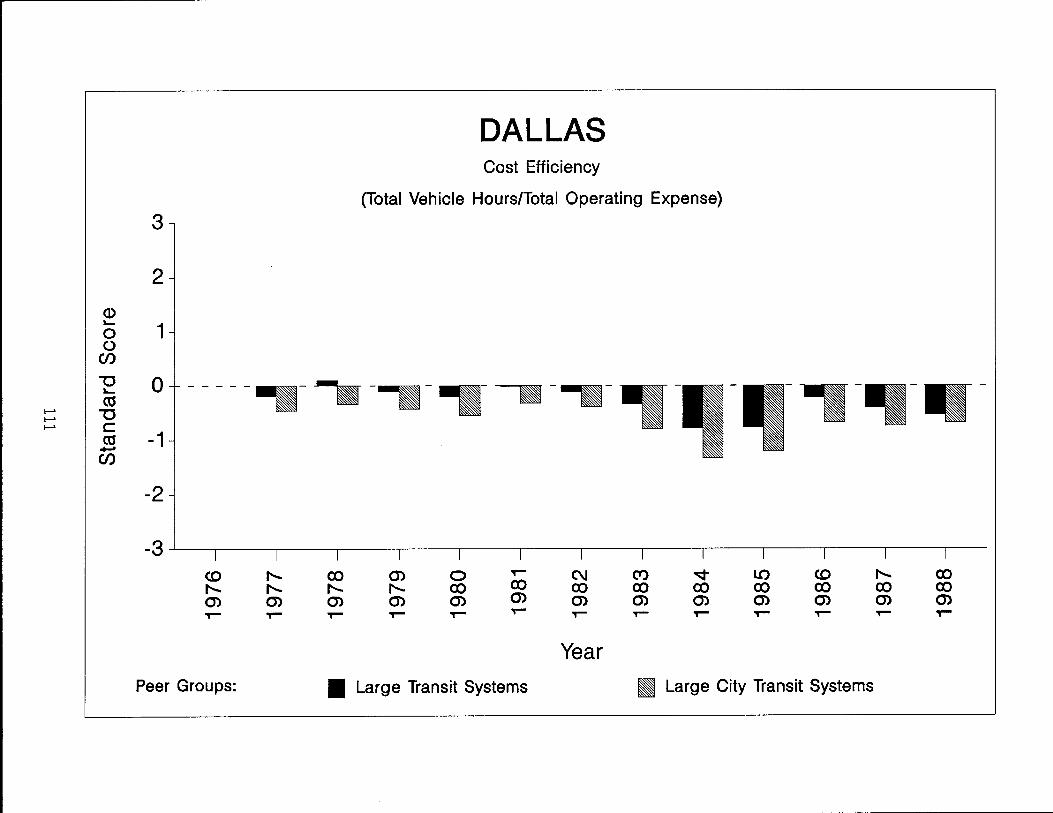
3
2
Q)
o 1 o en
o
-1
-2
DALLAS Cost Efficiency
(Total Vehicle Hours/Total Operating Expense)
- - - - - ... -~ -,-,-
-3~~~--~----~--~~--~----~--~----~----~--~----~----~--~---
<0 ,..... co 0'> 0 T""" C\J (Y) ..q LO <0 ,..... co ,..... ,..... ,..... ,..... co co co co co co co co co en en en en en 0'> en 0'> en en en en en T""" T""" T""" T""" T""" T""" T""" T""" T""" T""" T""" T""" T"""
Year Peer Groups: • Large Transit Systems • Large City Transit Systems

Peer Group: Large Transit Systems
1976
Transit Agency Value
Peer Group Mean
I-' Standard Score I-' N
Peer Group: Large City Transit Systems
1976
Transit Agency Value
Peer Group Mean
Standard Score
1977
36.42
38.30
-.24
1977
36.42
30.94
.51
Table 41. Service Effectiveness Performance Profile (Total Passengers/Total Vehicle Hours)
1978
32.32
30.76
.48
1978
32.32
29.16
.99
1979
34.47
30.99
.72
1979
34.47
27.54
1.16
DALLAS
1980
34.21
31.83
.44
1980
34.21
28.78
.86
1981
34.64
30.67
.73
1981
34.64
27.49
1.06
1982
33.22
29.44
.59
1982
33.22
25.65
1.04
1983
33.05
28.34
.68
1983
33.05
25.18
1.03
1984
36.05
29.18
1.00
1984
36.05
25.99
1.28
1985
29.50
27.87
.25
1985
29.50
25.35
.56
1986
24.22
25.23
-.16
1986
24.22
23.02
.16
1987
22.41
24.43
-.25
1987
22.41
23.39
-.12
1988
22.20
25.96
-.53
1988
22.20
24.54
-.30

DALLAS Service Effectiveness
(Total Passengers/Total Vehicle Hours)
3
2
Q) ~
1 0 0
-.I-(/) -----JII-"'0 0 ~
ct1 ...... "'0 ...... w C
ct1 -1 ...... (/)
-2
-3 co f'... ex) (j) 0 T""" C\J (t) ~ LO CO f'... CO f'... f'... f'... f'... ex) CO CO ex) CO ex) ex) ex) CO (j) (j) (j) (j) (j) (j) (j) (j) (j) (j) (j) (j) (j) T""" T""" T""" T""" T""" T""" T""" T""" T""" T""" T""" T""" T"""
Year Peer Groups: • Large Transit Systems • Large City Transit Systems

Peer Group: Large Transit Systems
1976 1977
Transit Agency Value .63 .63
Peer Group Mean .52 .49
I-' Standard Score .75 1.08 I-' .j::::.
Peer Group: Large City Transit Systems
1976 1977
Transit Agency Value .63 .63
Peer Group Mean .55 .53
Standard Score .34 .45
Table 42. Cost Effectiveness Performance Profile
(Passenger Revenue/Total Operating Expense)
DALLAS
1978 1979 1980 1981 1982 1983
.63 .63 .55 .57 .57 .51
.40 .37 .36 .36 .35 .33
1.43 1.48 1.39 1.36 1.35 1.37
1978 1979 1980 1981 1982 1983
.63 .63 .55 .57 .57 .51
.43 .39 .37 .36 .34 .34
1.15 1.55 1.44 1.64 1.81 1.56
1984 1985 1986 1987 1988
.28 .26 .23 .25 .26
.28 .26 .22 .21 .22
.11 .12 .06 .39 .42
1984 1985 1986 1987 1988
.28 .26 .23 .25 .26
.32 .28 .25 .24 .23
-.52 -.26 -.20 .06 .24
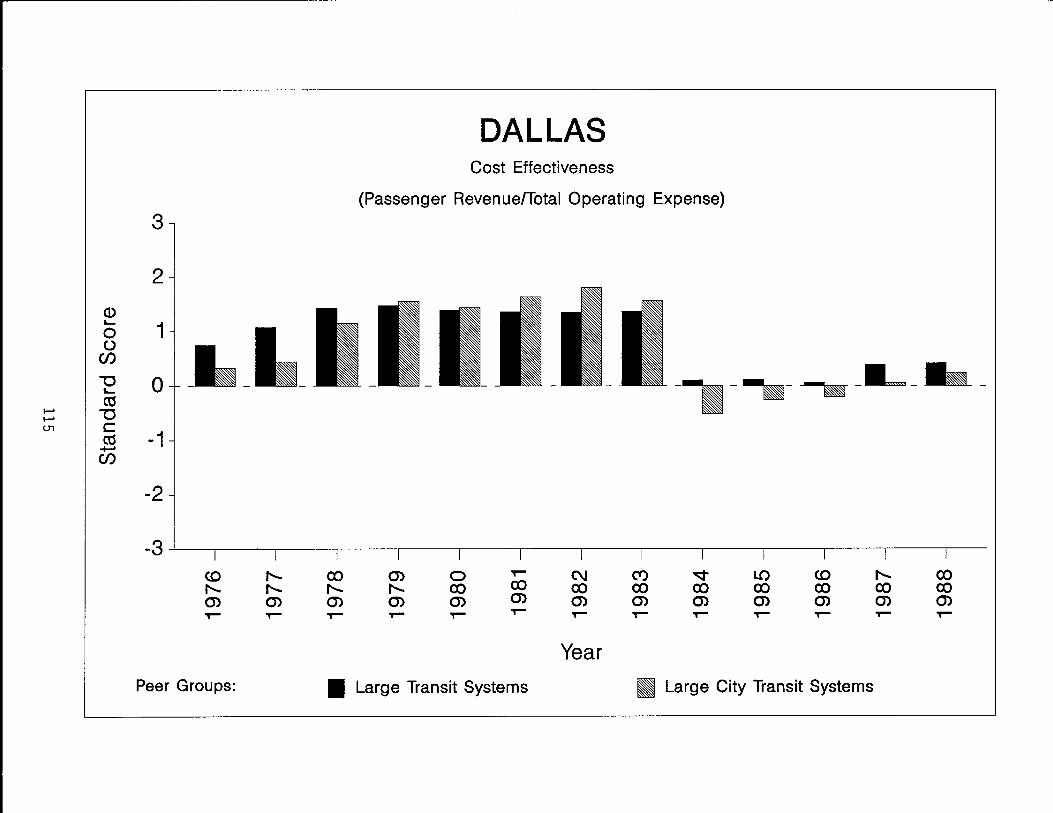
DALLAS Cost Effectiveness
(Passenger Revenue/Total Operating Expense)
3
2
1
o --.--.--1
-2
-3~~~--~----~--~----~----~--~----~----~--~----~----~--~---
<0 ,...... co 0> 0 T""" C\J C*') ~ LO <0 ,...... co ,...... ,...... ,...... ,...... co co co co co co co co co 0> 0> 0> 0> 0> 0> 0> 0> 0> 0> 0> 0> en T""" T""" T""" T""" T""" T""" T""" T""" T""" T""" T""" T""" T"""
Year
Peer Groups: • Large Transit Systems • Large City Transit Systems

Table 43. Labor Efficiency Performance Profile
(Total Vehicle Hours/Average Number of Employees)
DALLAS
Peer Group: Large Transit Systems
1976 1977 1978 1979 1980 1981 1982 1983 1984 1985 1986 1987 1988
Transit Agency Value .102 .113 .114 .107 .109 .104 .101 .088 .098 .125 .129 .131
Peer Group Mean .102 .116 .112 .106 .105 .104 .104 .101 .098 .100 .104 .109
...... Standard Score .02 -.31 .14 .08 .40 -.05 -.29 -1.18 .03 1.04 1.15 1.01
...... 0)
Peer Group: Large City Transit Systems
1976 1977 1978 1979 1980 1981 1982 1983 1984 1985 1986 1987 1988
Transit Agency Value .102 .113 .114 .107 .109 .104 .101 .088 .098 .125 .129 .131
Peer Group Mean .118 .126 .117 .110 .108 .107 .105 .102 .098 .097 .101 .101
Standard Score -.44 -.52 -.24 -.21 .15 -.44 -.41 -1.61 .01 1.59 1.67 1.63

DALLAS Labor Efficiency
(Total Vehicle Hours/Average Number of Employees)
3
2
1
o -----~-wtl-~- ._L_-._..-_ -1
-2
-3~--~--~----~----~--~----~--~~--~----~--~----~----~--~---
Peer Groups:
co f'-... en ,.-
o co en ,.-
,.-co en ,--
• Large Transit Systems
C\J co en ,--
Year
Ct) co en ,--
LO co en ,.-
CD co en ,.-
• Large City Transit Systems
f'-... co en ,.-
co co en ,.-

Table 44. Vehicle Efficiency Performance Profile
(Total Vehicle Miles/Average Number of Buses on Regular Routes)
DALLAS
Peer Group: Large Transit Systems
1976 1977 1978 1979 1980 1981 1982 1983 1984 1985 1986 1987 1988
Transit Agency Value 3.73 3.68 3.70 3.44 3.53 3.45 3.54 3.44 3.16 3.72 3.87 3.80
Peer Group Mean 2.85 4.49 4.31 4.17 4.23 4.39 4.63 4.53 4.48 3.88 3.97 4.40 4.34
I-' Standard Score -.52 -1.00 -1.02 -.90 -.63 -.76 -.65 -.85 -1.20 -.51 -.76 -1.13 I-' (X)
Peer Group: Large City Transit Systems
1976 1977 1978 1979 1980 1981 1982 1983 1984 1985 1986 1987 1988
Transit Agency Value 3.73 3.68 3.70 3.44 3.53 3.45 3.54 3.44 3.16 3.72 3.87 3.80
Peer Group Mean 2.85 4.60 4.50 4.46 4.46 4.48 4.57 4.42 4.40 4.09 4.22 4.71 4.57
Standard Score -.72 -1.02 -.85 -1.01 -.79 -.89 -.76 -1.03 -1.63 -.82 -1.01 -1.18

DALLAS Vehicle Efficiency
(Total Vehicle Miles/Average Number of Buses on Regular Routes) 3
2
Q) ~
1 0 0
(f)
"'0 0 - - - - -~
«S I-' "'0 I-' C ~
«S -1 ...... (f)
-2
-3 <0 f'-... CO 0> 0 T""" C\I (Y) .q- LO <0 f'-... CO f'-... f'-... f'-... f'-... CO CO CO CO CO CO CO CO CO 0> 0> 0> 0> 0> 0> 0> 0> 0> 0> 0> 0> 0> T""" T""" T""" T""" T""" T""" T""" T""" T""" T""" T""" T""" T"""
Year Peer Groups: • Large Transit Systems • Large City Transit Systems


EL PASO
121

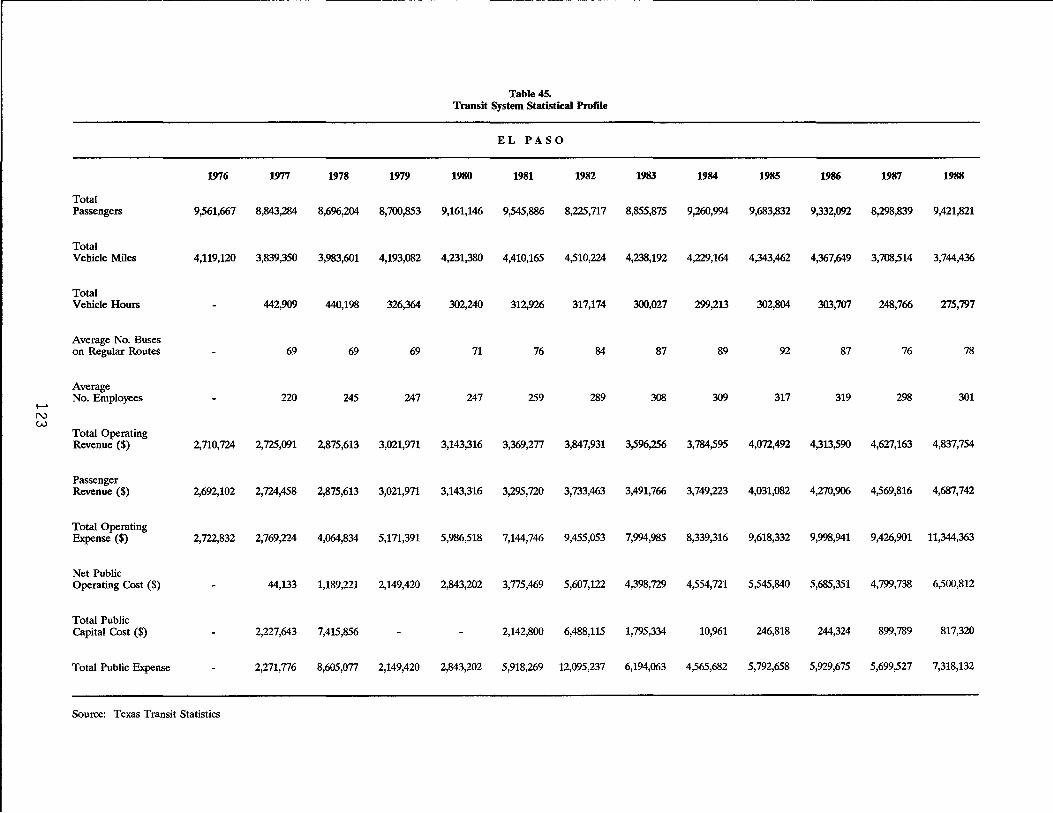
Table 45. Transit System Statistical ProfIle
EL PASO
1976 1977 1978 1979 1980 1981 1982 1983 1984 1985 1986 1987 1988
Total Passengers 9,561,667 8,843,284 8,6%,204 8,700,853 9,161,146 9,545,886 8,225,717 8,855,875 9,260,994 9,683,832 9,332,092 8,298,839 9,421,821
Total Vehicle Miles 4,119,120 3,839,350 3,983,601 4,193,082 4,231,380 4,410,165 4,510,224 4,238,192 4,229,164 4,343,462 4,367,649 3,708,514 3,744,436
Total Vehicle Hours 442,909 440,198 326,364 302,240 312,926 317,174 300,027 299,213 302,804 303,707 248,766 275,797
Average No. Buses on Regular Routes 69 69 69 71 76 84 87 89 92 87 76 78
Average
....... No. Employees 220 245 247 247 259 289 308 309 317 319 298 301
N W
Total Operating Revenue ($) 2,710,724 2,725,091 2,875,613 3,021,971 3,143,316 3,369,277 3,847,931 3,5%,256 3,784,595 4,072,492 4,313,590 4,627,163 4,837,754
Passenger Revenue ($) 2,692,102 2,724,458 2,875,613 3,021,971 3,143,316 3,295,720 3,733,463 3,491,766 3,749,223 4,031,082 4,270,906 4,569,816 4,687,742
Total Operating Expense ($) 2,722,832 2,769,224 4,064,834 5,171,391 5,986,518 7,144,746 9,455,053 7,994,985 8,339,316 9,618,332 9,998,941 9,426,901 11,344,363
Net Public Operating Cost ($) 44,133 1,189,221 2,149,420 2,843,202 3,775,469 5,607,122 4,398,729 4,554,721 5,545,840 5,685,351 4,799,738 6,500,812
Total Public Capital Cost ($) 2,227,643 7,415,856 2,142,800 6,488,115 1,795,334 10,961 246,818 244,324 899,789 817,320
Total Public Expense 2,271,776 8,605,077 2,149,420 2,843,202 5,918,269 12,095,237 6,194,063 4,565,682 5,792,658 5,929,675 5,699,527 7,318,132
Source: Texas Transit Statistics

..... -------------------------------------------------------------------
Peer Group: Medium-Sized Transit Systems
1976 1977
Transit Agency Value .160
Peer Group Mean .091
I-' Standard Score 1.43 N ~
Peer Group: Large City Transit Systems
1976 1977
Transit Agency Value .160
Peer Group Mean .069
Standard Score 2.25
Table 46. Cost Efficiency Performance Profile
(Total Vehicle Hours/Total Operating Expense)
EL PASO
1978 1979 1980 1981 1982 1983
.108 .063 .050 .044 .034 .038
.073 .054 .045 .039 .037 .037
1.35 .85 .76 52 -.39 .19
1978 1979 1980 1981 1982 1983
.108 .063 .050 .044 .034 .038
.060 .047 .039 .033 .031 .031
2.09 1.67 1.24 1.31 .42 .97
1984 1985 1986 1987 1988
.036 .031 .030 .026 .024
.037 .034 .031 .028 .027
-.12 -.21 -.06 -.23 -.29
1984 1985 1986 1987 1988
.036 .031 .030 .026 .024
.029 .026 .024 .023 .022
1.06 1.04 .96 .75 .37

3
2
Q) "- 1 0 ()
en '"0 0 - - - - -"-ctS
........ '"0 N (J1 C
ctS -1 +oJ en
-2
-3 (0 f'.. m .,.....
Peer Groups:
f'.. f'.. m .,.....
EL PASO Cost Efficiency
(Total Vehicle Hours/Total Operating Expense)
en m f'.. f'.. m m .,..... .,.....
o en m .,.....
C\J en m .,.....
Year
• Medium-Sized Transit Systems
LO en m .,.....
III Large City Transit Systems

I-' N 0"'1
Peer Group: Medium-Sized Transit Systems
1976
Transit Agency Value
Peer Group Mean
Standard Score
Peer Group: Large City Transit Systems
Transit Agency Value
Peer Group Mean
Standard Score
1976
1977
19.97
24.35
-.67
1977
19.97
30.94
-1.02
Table 47. Service Effectiveness Perfonnance Profile (Total Passengers/Total Vehicle Hours)
1978
19.76
22.64
-.54
1978
19.76
26.16
-1.03
1979
26.66
25.02
.30
1979
26.66
27.54
-.15
EL PASO
1980
30.31
27.78
.33
1980
30.31
28.78
.24
1981
3051
27.38
.32
1981
3051
27.49
.45
1982
25.93
26.62
-.05
1982
25.93
25.65
.04
1983
2952
22.86
.91
1983
29.52
25.18
57
1984 1985
30.95 31.98
24.20 2453
.82 .86
1984 1985
30.95 31.98
25.99 25.35
.63 .89
1986
30.73
22.68
.87
1986
30.73
23.02
1.03
1987
33.36
23.79
1.08
1987
33.36
23.39
1.21
1988
34.16
24.24
1.13
1988
34.16
2454
1.23

3
2
Q) !to...
1 0 0
Cf)
"0 0 - - - - -'-
....... ro N "0 -...J C
ro -1 +-' Cf)
-2
-3 CD f'... f'... f'... 0) 0) T""" T"""
Peer Groups:
EL PASO Service Effectiveness
(Total Passengers/Total Vehicle Hours)
co f'... 0) T"""
o co 0) T"""
T"""
co 0) T"""
C\J co (J') T"""
Year
• Medium-Sized Transit Systems
Ct) co 0) T"""
~ co 0) T"""
LO co 0) T"""
CD co 0) T"""
• Large City Transit Systems
f'... co 0) T"""
co co (J') T"""

Peer Group: Medium-Sized Transit Systems
1976 1977
Transit Agency Value .99 .98
Peer Group Mean .53 .52
I-' Standard Score 1.48 1.48 N OJ
Peer Group: Large City Transit Systems
1976 1977
Transit Agency Value .99 .98
Peer Group Mean .55 .53
Standard Score 1.92 1.98
Table 48. Cost Effectiveness Performance Profile
(Passenger Revenue/Total Operating Expense)
EL PASO
1978 1979 1980 1981 1982 1983
.71 .58 .53 .46 .39 .44
.45 .40 .38 .35 .36 .37
1.44 1.45 1.39 1.10 .46 .95
1978 1979 1980 1981 1982 1983
.71 .58 .53 .46 .39 .44
.43 .39 .37 .36 .34 .34
1.62 1.28 1.25 .81 .42 .87
1984 1985 1986 1987 1988
.45 .42 .43 .48 .41
.39 .36 .31 .30 .27
.94 .54 1.00 1.13 .97
1984 1985 1986 1987 1988
.45 .42 .43 .48 .41
.32 .28 .25 .24 .23
1.66 1.83 1.59 1.85 1.59

EL PASO Cost Effectiveness
(Passenger Revenue/Total Operating Expense)
3
2
Q) 10-
1 0 ()
en '"0 0 10- ---ctS
I-' '"0 N C ~
ctS -1 ....... en
-2
-3 co f'-... f'-... f'-... 0> 0>
CD 0> 0 .,.... C'\I Ct') ~ LO co f'-... CD
f'-... f'-... CD CD CD CD CD CD CD CD CD 0> 0> (j,) 0> 0> (j,) 0> 0> (j,) (j,) 0> .,.... .,.... .,.... .,.... .,.... T""" T""" T""" .,.... .,.... .,.... T""" .,....
Year
Peer Groups: • Medium-Sized Transit Systems • Large City Transit Systems

Table 49. Labor Efficiency Performance Profile
(Total Vehicle Hours/Average Number of Employees)
EL PASO
Peer Group: Medium-Sized Transit Systems
1976 1977 1978 1979 1980 1981 1982 1983 1984 1985 1986 1987 1988
Transit Agency Value .201 .180 .132 .122 .121 .110 J)97 JJ97 .096 .095 .083 .092
Peer Group Mean .135 .136 .123 .115 .113 .110 .106 .103 .102 .097 .100 .098
I-' Standard Score 1.49 1.49 1.40 1.32 1.09 -.19 -1.04 -1.43 -.91 -.22 -1.31 -.39 w a
Peer Group: Large City Transit Systems
1976 1977 1978 1979 1980 1981 1982 1983 1984 1985 1986 1987 1988
Transit Agency Value .201 .180 .132 .122 .121 .110 .097 .097 .096 .095 .083 .092
Peer Group Mean .118 .126 .117 .110 .108 .107 .105 .102 .098 .097 .101 .101
Standard Score 2.23 2.20 1.35 .99 1.38 .29 -.84 -57 -.38 -.12 -1.01 -50

3
2
CD "- 1 0 ()
en 'U 0 - - - - -"-(t1
~ 'U w c ~
-1 (t1 +oJ en
-2
-3 CD f'-.. f'-.. f'-.. 0> 0> T""" T"""
Peer Groups:
EL PASO Labor Efficiency
(Total Vehicle Hours/Average Number of Employees)
co f'-.. 0> T"""
0> f'-.. 0> T"""
o co 0> T"""
T"""
co 0> T"""
-.--
C\J co 0> T"""
Year
• Medium-Sized Transit Systems
CD co 0> T"""
., Large City Transit Systems
--.-
co co 0> T"""

...... w N
Table 50. Vehicle Efficiency Performance Profile
(Total Vehicle Miles/Average Number of Buses on Regular Routes)
Peer Group: Medium-Sized Transit Systems
1976
Transit Agency Value
Peer Group Mean
Standard Score
Peer Group: Large City Transit Systems
1976
Transit Agency Value
Peer Group Mean 2.85
Standard Score
1977
5.56
4.53
1.09
1977
5.56
4.60
.80
1978
5.77
452
1.23
1978
5.77
450
156
1979
6.08
4.62
1.26
1979
6.08
4.46
1.81
EL PASO
1980
5.96
452
1.25
1980
5.96
4.46
1.50
1981
5.80
4.47
1.26
1981
5.80
4.48
1.09
1982
5.37
4.39
1.13
1982
5.37
457
.63
1983
4.87
4.25
.98
1983
4.87
4.42
.38
1984
4.75
4.27
1.05
1984
4.75
4.40
.38
1985
4.72
4.20
.99
1985
4.72
4.09
1.10
1986
5.02
4.41
.98
1986
5.02
4.22
1.31
1987
4.88
4.83
.05
1987
4.88
4.71
.21
1988
4.80
4.62
.21
1988
4.80
457
.34

EL PASO Vehicle Efficiency
(Total Vehicle Miles/Average Number of Buses on Regular Routes) 3
2
CD ..... 1 0
() (/)
"'0 0 ..... - - - - - -- '-Ctj
I-' "'0 w w c
-1 Ctj ...... (/)
-2
-3 <D f'... f'... f'... 0') 0')
co 0') 0 ,- C\.I Ct) -q- LO <D f'... co f'... f'... co co co co co co co co co 0') 0') 0') 0') 0') 0') 0') 0') 0') 0') 0')
,- ,- ,- T""" ,- T""" T""" T""" ,- T""" ,- ,- ,-
Year Peer Groups: • Medium-Sized Transit Systems • Large City Transit Systems


FORT WORTH
135


Table 51. Transit System Statistical Profile
FORT WORTH
1976 1977 1978 1979 1980 1981 1982 1983 1984 1985 1986 1987 1988
Total Passengers 4,506,%9 5,070,943 5,205,118 5,957,961 6,339,043 5,953,789 5,768,771 5,200,488 5,393,768 5,377,947 4,947,252 4,507,907 4,883,583
Total Vehicle Miles 2,949,792 3,040,422 3,089,734 3,147,997 3,169,175 3,409,456 3,420,013 3,336,725 3,703,825 3,854,497 3,866,547 4,064,602 4,059,655
Total Vehicle Hours 226,483 246,486 251,540 254,153 270,756 279,714 279,577 293,517 307,275 301,323 306,739 301,419
Average No. Buses on Regular Routes 85 86 90 93 103 102 98 101 101 103 94 99
Average No. Employees 215 206 214 223 245 246 237 284 312 311 312 325
~
w '-J
Total Operating Revenue ($) 1,631,987 2,666,755 2,930,431 3,390,200 4,078,700 4,940,300 5,148,800 5,202,328 6,088,975 6,417,316 7,686,951 10,744,128 7,317,091
Passenger Revenue ($) 1,509,120 1,605,938 1,695,623 1,884,000 2,219,800 2,665,500 2,747,500 2,859,021 3,360,353 3,209,913 3,155,399 2,799,465 2,720,841
Total Operating Expense ($) 3,377,286 3,678,887 4,134,836 4,986,800 5,974,000 7,0%,600 7,459,700 7,510,459 8,673,462 10,361,%9 11,287,324 11,758,216 11,573,226
Net Public Operating Cost ($) 1,745,299 1,012,132 1,204,405 1,596,600 1,895,300 2,156,300 2,310,900 2,308,131 2,584,487 3,944,653 3,600,373 1,014,088 4,256,135
Total Public Capital Cost ($) 454,446 41,731 187,084 400,000 586,054 14,376,070 2,215,423 1,852,111 1,132,194 3,101,722
Total Public Expense ($) 1,745,299 1,466,578 1,246,136 1,783,684 1,895,300 2,556,300 2,896,954 16,684,201 4,799,910 5,796,764 4,732,567 4,115,810 4,256,135
Source: Texas Transit Statistics
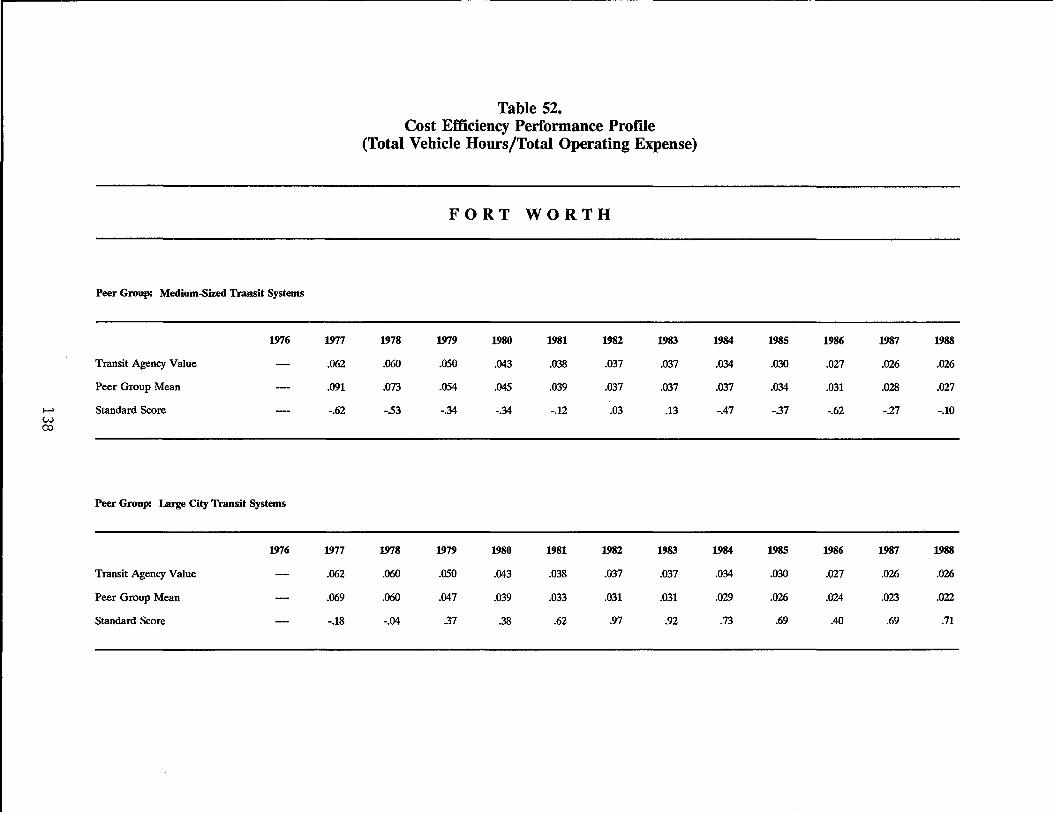
Peer Group: Medium-Sized Transit Systems
1976
Transit Agency Value
Peer Group Mean
~ Standard Score w CO
Peer Group: Large City Transit Systems
1976
Transit Agency Value
Peer Group Mean
Standard Score
1977
.062
.091
-.62
1977
.062
.069
-.18
Table 52. Cost Efficiency Performance Profile
(Total Vehicle Hours/Total Operating Expense)
1978
.060
.073
-53
1978
.060
.060
-.04
FORT WORTH
1979
.050
.054
-.34
1979
.050
.047
.37
1980
.043
.045
-.34
1980
.043
.039
.38
1981
.038
.039
-.12
1981
.038
.033
.62
1982
.037
.037
.03
1982
.037
.031
.97
1983
.037
.037
.13
1983
.037
.031
.92
1984
.034
.037
-.47
1984
.034
.029
.73
1985
.030
.034
-.37
1985
.030
.026
.69
1986
.027
.031
-.62
1986
.027
.024
.40
1987
.026
.028
-.27
1987
.026
.023
.69
1988
.026
.027
-.10
1988
.026
.022
.71

Q) -0 u
CJ)
-c -as t-' -c w I..C C
as ..... CJ)
3
2
1
0
-1
-2
-3 I
CO I"-0> ~
Peer Groups:
I
ex:> I"-0> ~
FORT WORTH Cost Efficiency
(Total Vehicle Hours/Total Operating Expense)
I
0> I"-0> ~
I
o ex:> 0> ~
I ~
ex:> 0> ,.--
I
C\J OJ 0> ~
I (Y') ex:> 0> ~
I
~ ex:> 0> ~
I L() ex:> 0> ~
I
CO ex:> 0> ~
Year
• Medium-Sized Transit Systems • Large City Transit Systems
I
I"OJ 0> ~
I
ex:> ex:> 0> ~

Peer Group: Medium-Sized Transit Systems
1976 1977
Transit Agency Value 22.39
Peer Group Mean 24.35
...... Standard Score -.30 +» 0
Peer Group: Large City Transit Systems
1976 1977
Transit Agency Value 22.39
Peer Group Mean 30.94
Standard Score -.79
Table 53. Service Effectiveness Performance Profile (Total Passengers/Total Vehicle Hours)
FORT WORTH
1978 1979 1980 1981 1982 1983
21.12 23.69 24.94 21.99 20.62 18.60
22.64 25.02 27.78 27.38 26.62 22.86
-.29 -.25 -.37 -.55 -.47 -.58
1978 1979 1980 1981 1982 1983
21.12 23.69 24.94 21.99 20.62 18.60
26.16 27.54 28.78 27.49 25.65 25.18
-.81 -.64 -.61 -.82 -.69 -.86
1984 1985 1986 1987 1988
18.38 17.50 16.42 14.70 16.20
24.20 24.53 22.68 23.79 24.24
-.71 -.81 -.68 -1.02 -.92
1984 1985 1986 1987 1988
18.38 17.50 16.42 14.70 16.20
25.99 25.35 23.02 23.39 24.54
-.97 -1.05 -.88 -1.06 -1.06
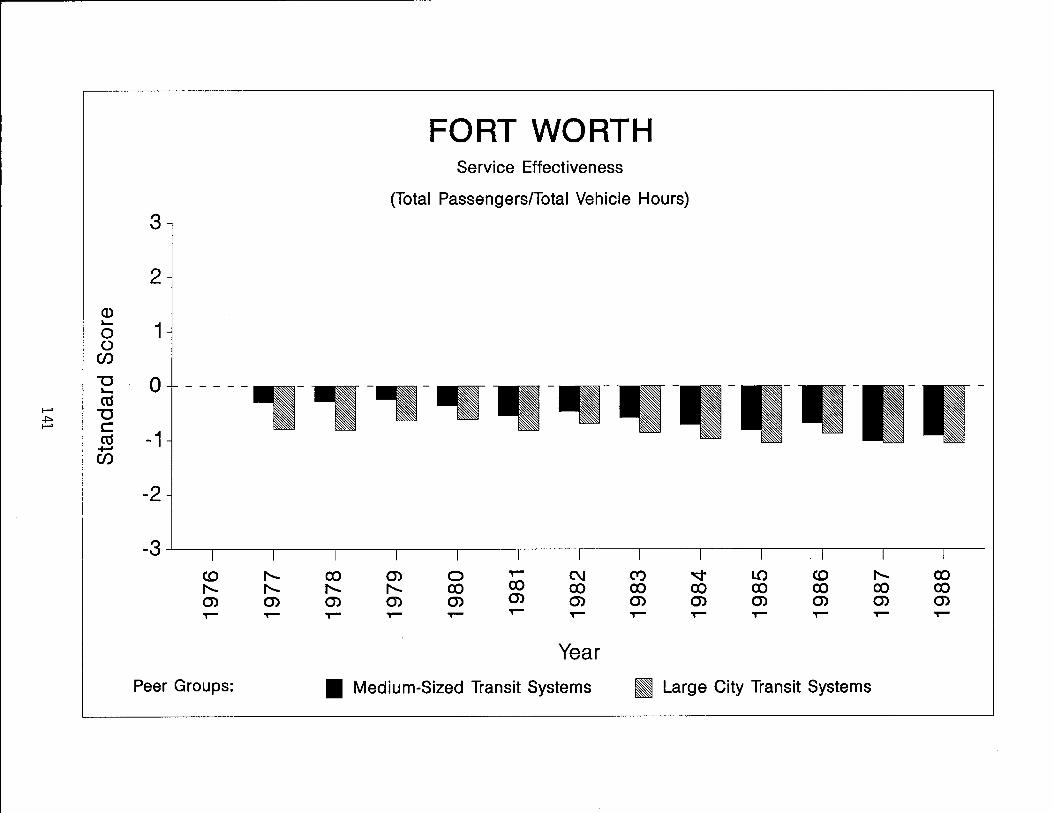
3
2
Q)
(; 1 () if)
o
-1
-2
FORT WORTH Service Effectiveness
(Total Passengers/Total Vehicle Hours)
-----,-,-,-.
-3~~~--~----~--~~--~----~--~----~----~--~----~----~--~---
co en 0 ~ C\I (Y)
""" LO <0 r-.... co
r-.... r-.... co co co co co co co co co en en en en en en en en en en en ~ ~ ~ ~ ~ ~ ~ ~ ~ ~ ~
Year
Peer Groups: • Medium-Sized Transit Systems II Large City Transit Systems
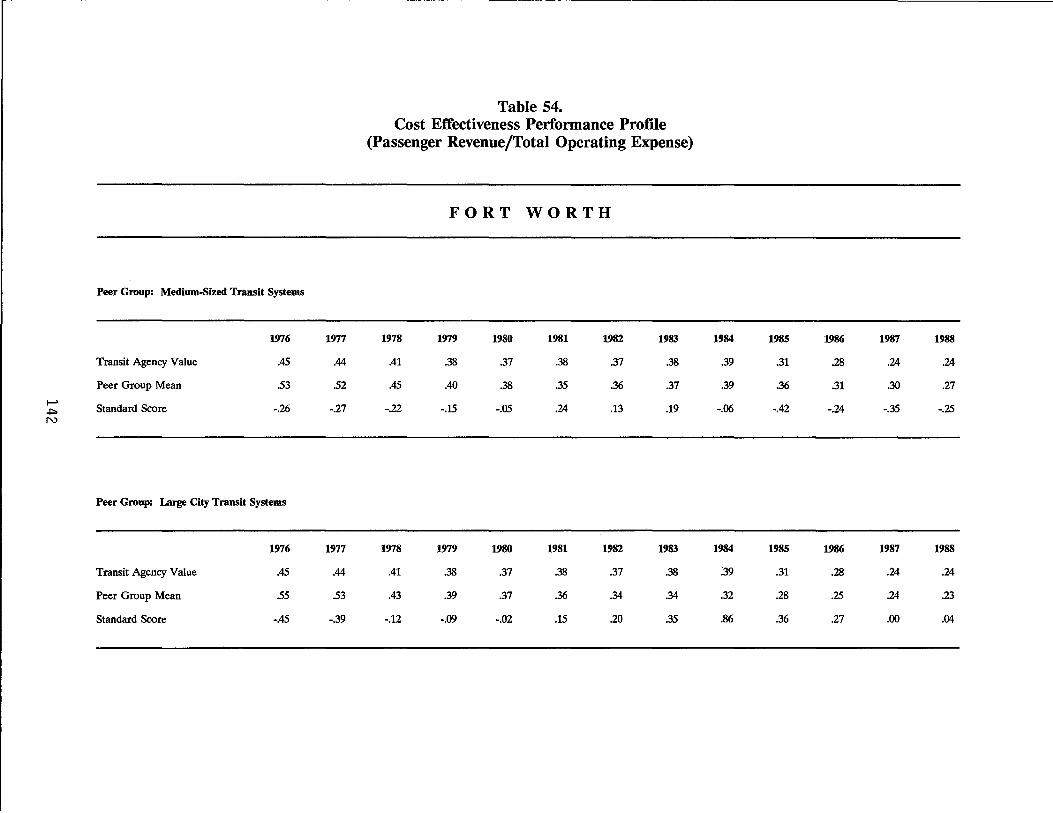
Peer Group: Medium-Sized Transit Systems
1976 1977
Transit Agency Value .45 .44
Peer Group Mean 53 52
I-' Standard Score -.26 -.27 ~
N
Peer Group: Large City Transit Systems
1976 1977
Transit Agency Value .45 .44
Peer Group Mean 55 53
Standard Score -.45 -.39
Table 54. Cost Effectiveness Performance Profile
(Passenger Revenue/Total Operating Expense)
FORT WORTH
1978 1979 1980 1981 1982 1983
.41 .38 .37 .38 .37 .38
.45 .40 .38 .35 .36 .37
-.22 -.15 -.05 .24 .13 .19
1978 1979 1980 1981 1982 1983
.41 .38 .37 .38 .37 .38
.43 .39 .37 .36 .34 .34
-.12 -.09 -.02 .15 .20 .35
1984 1985 1986 1987 1988
.39 .31 .28 .24 .24
.39 .36 .31 .30 .27
-.06 -.42 -.24 -.35 -.25
1984 1985 1986 1987 1988
:39 .31 .28 .24 .24
.32 .28 .25 .24 .23
.86 .36 .27 .00 .04
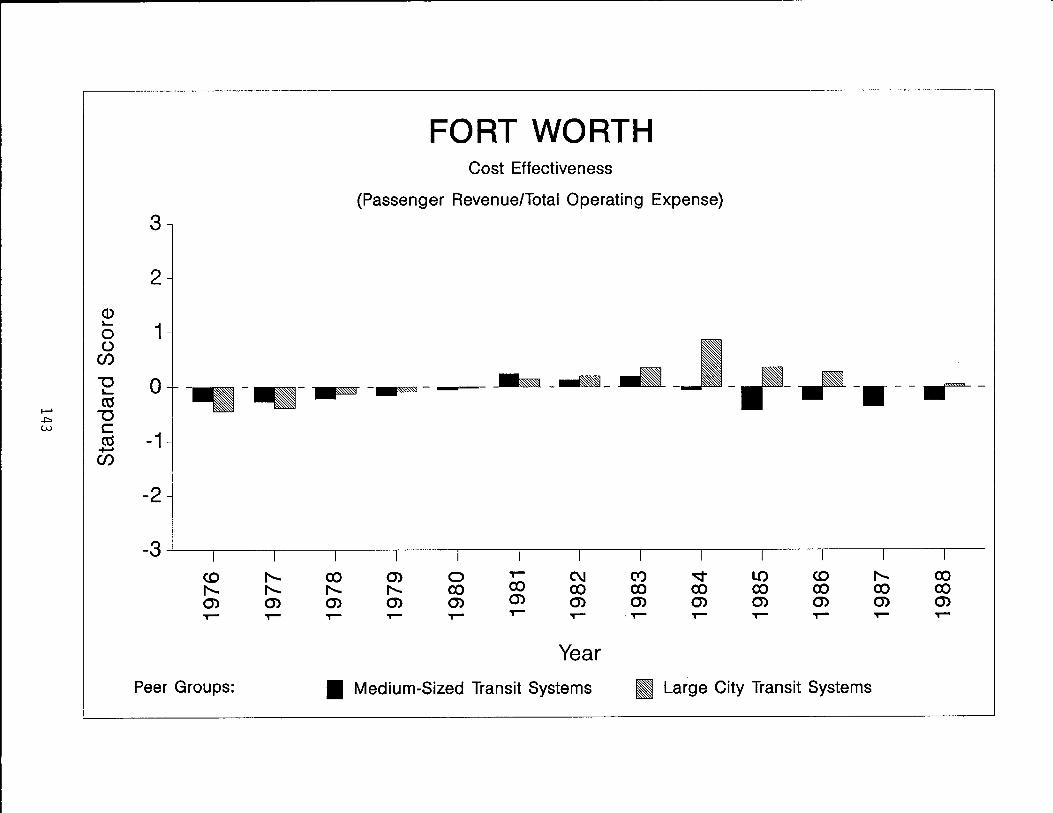
CD "-o ()
(f)
"'0 "-ctS
"'0 c ctS +-' (f)
FORT WORTH Cost Effectiveness
(Passenger Revenue/Total Operating Expense)
3
2
1
-o -. - .----~~""~"" - -"""" - --- ~--- .' -~-rl- JI- -. --..----1
-2
-3 I I
<0 f'-... f'-... f'-... 0) 0) ~ ~
Peer Groups:
I I
co 0) f'-... f'-... 0) 0) ~ ~
I
o co 0) ~
I I
C\I co 0) ~
Year
• Medium-Sized Transit Systems
I Ct) co 0)
I
LO co 0) ~
I
<0 co 0) ~
• Large City Transit Systems
I
co co 0) ~

Table 55. Labor Efficiency Performance Profile
(Total Vehicle Hours/Average Number of Employees)
FORT WORTH
Peer Group: Medium-Sized Transit Systems
1976 1977 1978 1979 1980 1981 1982 1983 1984 1985 1986 1987 1988
Transit Agency Value .105 .120 .118 .114 .111 .114 .118 .103 .098 .f1J7 .098 .093
Peer Group Mean .135 .136 .123 .115 .113 .110 .106 .103 .102 .097 .100 .098
~ Standard Score -.66 -.56 -.78 -.23 -.27 1.13 1.35 .08 -.49 -.01 -.12 -.32 ..j::> ..j::>
Peer Group: Large City Transit Systems
1976 1977 1978 1979 1980 1981 1982 1983 1984 1985 1986 1987 1988
Transit Agency Value .105 .120 .118 .114 .111 .114 .118 .103 .098 .f1J7 .098 .093
Peer Group Mean .118 .126 .117 .110 .108 .107 .105 .102 .098 .097 .101 .101
Standard Score -.34 -.26 .08 .32 .28 .76 1.33 .21 .02 -.02 -.13 -.44

3
2
Q)
(; 1 o
(f)
o
-1
-2
FORT WORTH Labor Efficiency
(Total Vehicle Hours/Average Number of Employees)
-----p- r -r= -.. -.;-- . -.---
-3~~----~----~--~----~--~----~----~--~----~--~----~--~---
f'... co 0> 0 T'"- C\J Ct) ..q- LO co f'... co f'... f'... f'... co co co co co co co co co 0> 0> 0> 0> 0> 0> 0> 0> 0> 0> 0> 0> T'"- T'"- T'"- T'"- T'"- T'"- T'"- T'"- T'"- T'"- T'"- T'"-
Year Peer Groups: • Medium-Sized Transit Systems • Large City Transit Systems

Table 56. Vehicle Efficiency Performance Profile
(Total Vehicle Miles/Average Number of Buses on Regular Routes)
FORT WORTH
Peer Group: Medium-Sized Transit Systems
1976 1977 1978 1979 1980 1981 1982 1983 1984 1985 1986 1987 1988
Transit Agency Value 358 359 350 3.41 3.31 3.35 3.40 3.67 3.82 3.75 4.32 4.10
Peer Group Mean 453 452 4.62 452 4.47 4.39 4.25 4.27 4.20 4.41 4.83 4.62
....... Standard Score -1.01 -.91 -.97 -.% -1.10 -1.20 -1.32 -1.33 -.74 -1.05 -53 -.60 +::> O"l
Peer Group: Large City Transit Systems
1976 1977 1978 1979 1980 1981 1982 1983 1984 1985 1986 1987 1988
Transit Agency Value 358 359 350 3.41 3.31 3.35 3.40 3.67 3.82 3.75 4.32 4.10
Peer Group Mean 2.85 4.60 450 4.46 4.46 4.48 457 4.42 4.40 4.09 4.22 4.71 457
Standard Score -.85 -1.12 -1.08 -1.04 -.97 -.97 -.88 -.78 -.48 -.75 -.47 -.72
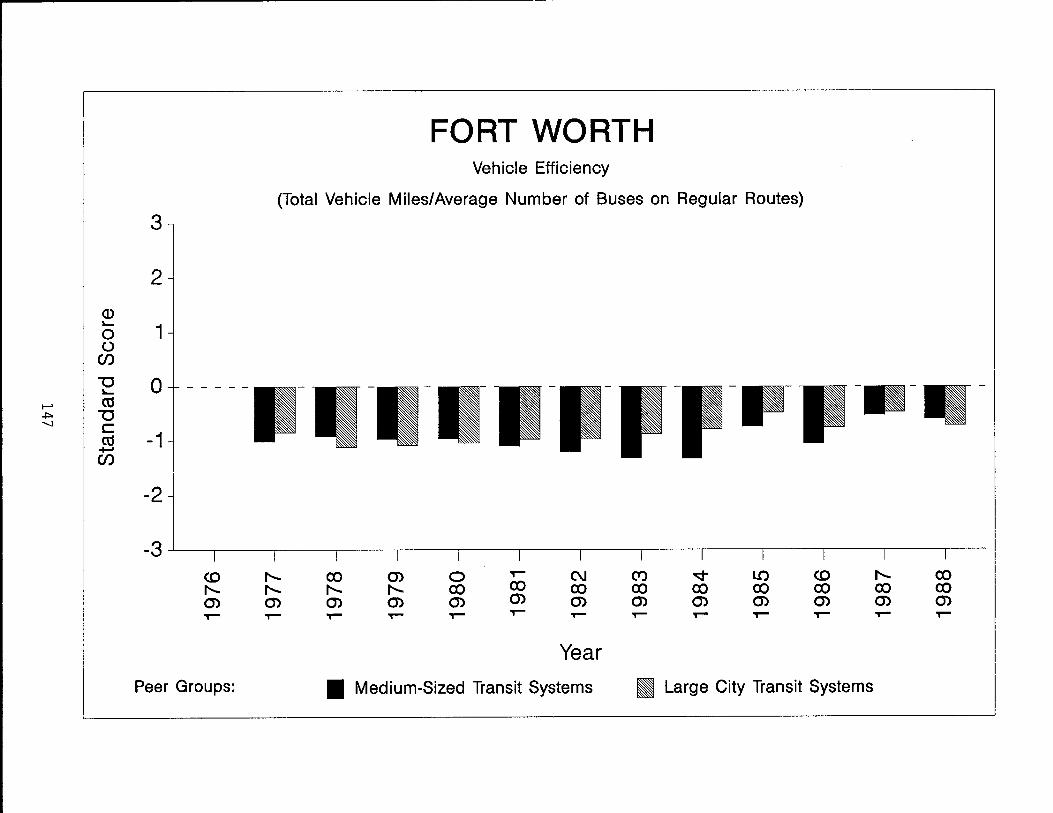
FORT WORTH Vehicle Efficiency
(Total Vehicle Miles/Average Number of Buses on Regular Routes)
3
2
<D ~
1 0 0
Cf)
"'0 0 - - - - -~
~ as .j:::. "'0 -.....J C
as -1 ........ Cf)
-2
-3 <D f'-... f'-... f'-... 0) 0)
co 0) 0 T""" ('-I CW) ..q LO <D f'-... co f'-... f'-... co co co co co co co co co 0) 0) 0) 0) 0) 0) 0) 0) 0) 0) 0)
T""" T""" T""" T""" T""" T""" T""" T""" T""" T""" T""" T""" T"""
Year
Peer Groups: • Medium-Sized Transit Systems • Large City Transit Systems


GALVESTON
149


Table 57. Transit System Statistical Prome
GALVESTON
1976 1977 1978 1979 1980 1981 1982 1983 1984 1985 1986 1987 1988
Total Passengers 1,077,341 1,224,627 1,341,083 1,590,320 1,149,671 1,057,873 963,666 876,159 846,137 665,073 699,873 792,479 835,568
Total Vehicle Miles 514,254 509,862 533,370 536,211 452,058 426,107 433,364 436,758 433,441 379,136 367,873 418,194 412,171
Total Vehicle Hours 55,007 53,462 49,673 47,640 49,848 45,459 43,115 37,212 32,713 31,921 31,312
Average No. Buses on Regular Routes 15 11 11 11 11 11 11 10 8 8 9 9
Average No. Employees 54 32 32 32 32 32 32 31 30 29 28 28
I-' U"1 I-'
Total Operating Revenue ($) 391,526 377,993 371,111 380,227 401,921 422,327 447,882 419,638 392,056 2%,123 306,575 320,572 332,954
Passenger Revenue ($) 390,342 376,210 368,641 379,346 401,921 421,461 447,191 418,862 391,798 295,892 297,031 309,634 318,075
Total Operating Expense ($) 594,902 619,160 647,196 755,293 853,108 851,552 942,175 901,704 971,455 919,646 911,262 942,590 901,551
Net Public Operating Cost ($) 203,376 241,167 276,085 375,066 451,187 429,225 494,293 482,066 579,399 623,523 604,687 622,018 568,597
Total Public Capital Cost ($) 45,401 48,016 3,182 21,386 5,090 1,231,661 1,510,076 326,324 399,628 552,725 7,138,458 2,705,361
Total Public Expense ($) 248,777 289,183 279,267 396,452 456,277 1,660,886 494,293 1,992,142 905,723 1,023,151 1,157,412 7,760,476 3,273,958
Source: Texas Transit Statistics

Peer Group: Small Transit Systems
1976 1977
Transit Agency Value
Peer Group Mean .087
I-' Standard Score CJ1 N
Peer Group: Small City Transit Systems
1976 1977
Transit Agency Value
Peer Group Mean .087
Standard Score
Table 58. Cost Efficiency Performance Profile
(Total Vehicle Hours/Total Operating Expense)
1978
.085
.089
-.17
1978
.085
.088
-.13
1979
.071
.066
.34
1979
.071
.066
.38
GALVESTON
1980
.058
.055
.27
1980
.058
.055
.32
1981
.056
.048
.94
1981
.056
.048
.99
1982
.053
.051
.09
1982
.053
.051
.10
1983
.050
.045
.58
1983
.050
.045
.64
1984
.044
.041
.36
1984
.044
.042
.34
1985
.040
.040
.04
1985
.040
.041
-.09
1986
.036
.039
-.55
1986
.036
.039
-.60
1987
.034
.038
-.76
1987
.034
.038
-.85
1988
.035
.037
-.38
1988
.035
.037
-.46

I-' (J1
w
3
2
Q) o 1 o
Cf)
o
-1
-2
GALVESTON Cost Efficiency
(Total Vehicle HourslTotal Operating Expense)
- - - - - - - - - ~~ -- - -- -----mk== ---
-3~--~--~----~----~--~----~--~~--~----~--~----~----~--~---
CD f'-.- co m 0 ~ C\J Ct) ~ LO CD f'-.- co f'-.- f'-.- f'-.- f'-.- co co co co co co co co co m m m m m m m m m m m m m ~ ~ ~ ~ ~ ~ T""" T""" ~ ~ ~ ~ ~
Year Peer Groups: • Small Transit Systems • Small City Transit Systems
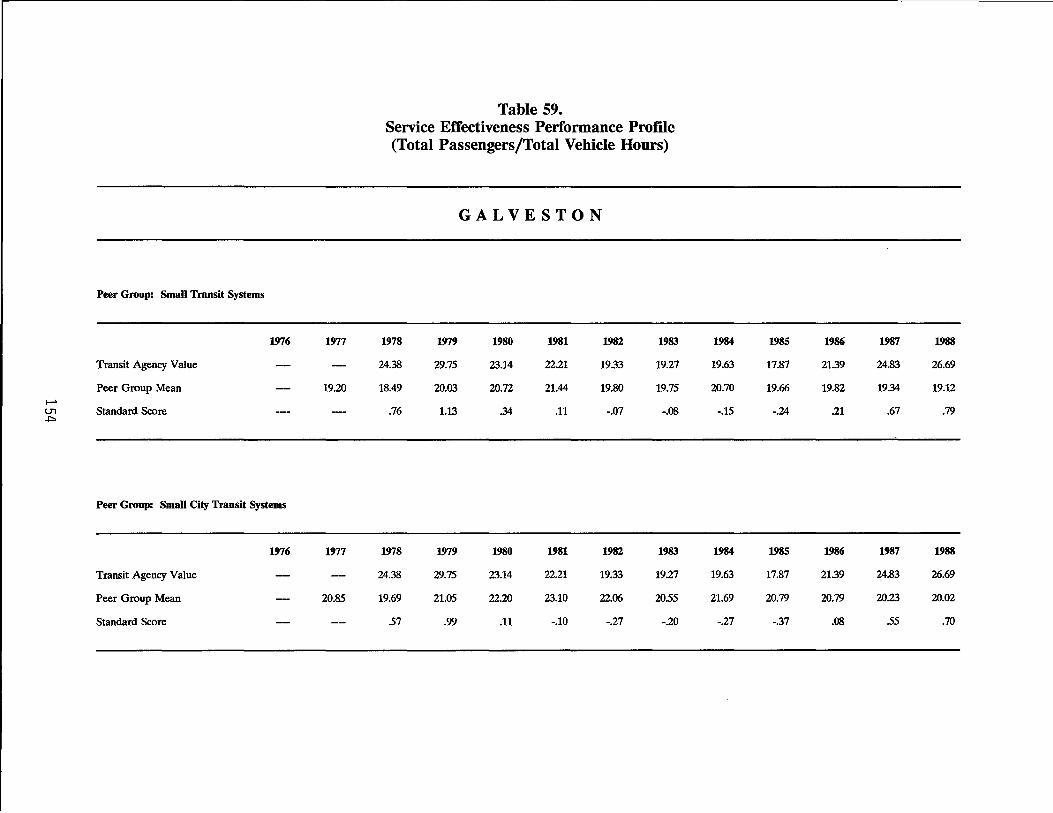
Peer Group: Small Transit Systems
1976 1977
Transit Agency Value
Peer Group Mean 19.20 I-' U1 Standard Score +'>
Peer Group: Small City Transit Systems
1976 1977
Transit Agency Value
Peer Group Mean 20.85
Standard Score
Table 59. Service Effectiveness Performance Profile (Total Passengers/Total Vehicle Hours)
GALVESTON
1978 1979 1980 1981 1982 1983
24.38 29.75 23.14 22.21 19.33 19.27
18.49 20.03 20.72 21.44 19.80 19.75
.76 1.13 .34 .11 -.07 -.os
1978 1979 1980 1981 1982 1983
24.38 29.75 23.14 22.21 19.33 19.27
19.69 21.05 22.20 23.10 22.06 2055
57 .99 .11 -.10 -.27 -.20
1984 1985 1986 1987 1988
19.63 17.87 21.39 24.83 26.69
20.70 19.66 19.82 19.34 19.12
-.15 -.24 .21 .67 .79
1984 1985 1986 1987 1988
19.63 17.87 21.39 24.83 26.69
21.69 20.79 20.79 20.23 20.02
-.27 -.37 .os 55 .70
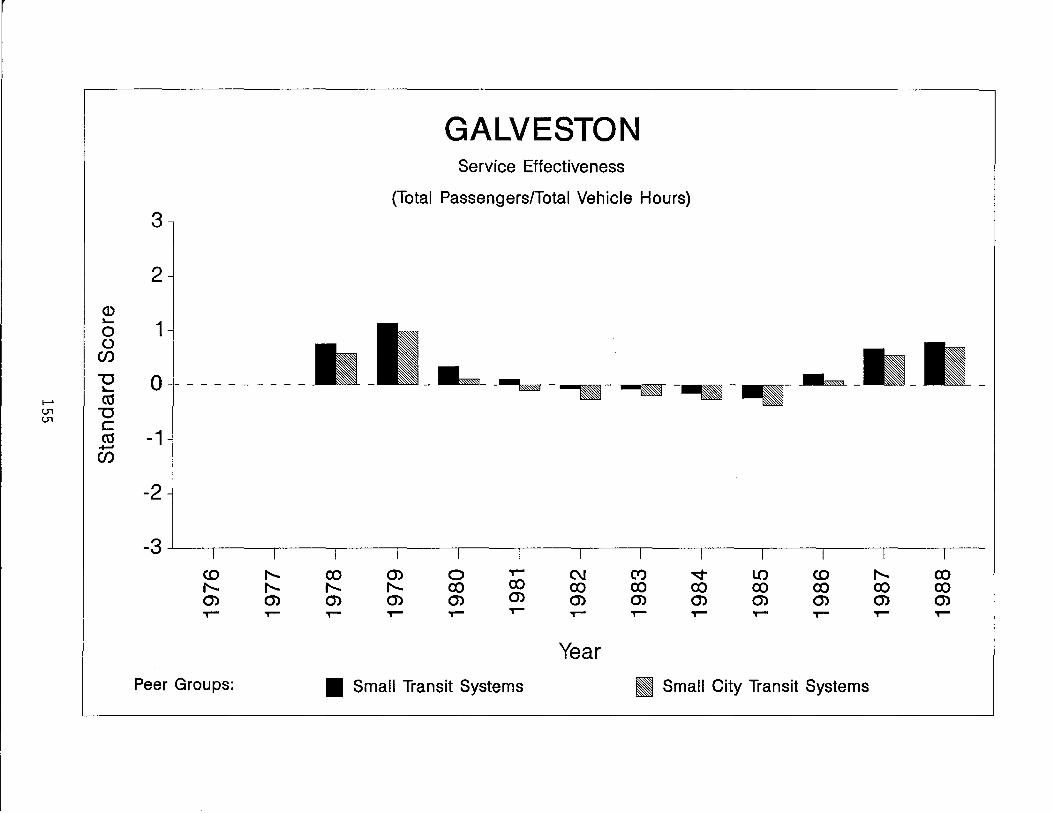
GALVESTON Service Effectiveness
(Total Passengers/Total Vehicle Hours) 3
2
Q) 10-
1 0 () (/)
"'0 0 - - - - - - - - -10-
f-' «' -~-
---.~- --~-.-(J1 "'0 (J1
C «' -1 ....... (/)
-2
-3 <D f'... co 0> 0 ,-- C\J Ct) ~ LO <D f'... co f'... f'... f'... f'... co co co co co co co co co 0> 0> 0> 0> 0> 0> 0> 0> 0> 0> 0> 0> 0> ,-- ,-- ,-- ,-- ,-- ,-- ,.- ,.- ,-- ,.- ,-- ,.- ,--
Year Peer Groups: • Small Transit Systems • Small City Transit Systems

Peer Group: Small Transit Systems
1976 1977
Transit Agency Value .66 .61
Peer Group Mean 51 .48
~ Standard Score 55 56 U1 0'1
Peer Group: Small City Transit Systems
1976 1977
Transit Agency Value .66 .61
Peer Group Mean .49 .46
Standard Score .64 .64
Table 60. Cost Effectiveness Performance Profile
(Passenger Revenue/Total Operating Expense)
GALVESTON
1978 1979 1980 1981 1982 1983
57 50 .47 .49 .47 .46
.39 .34 .34 .33 .33 .33
1.25 1.13 .85 1.07 .98 .91
1978 1979 1980 1981 1982 1983
.57 50 .47 .49 .47 .46
.39 .34 .34 .33 .34 .34
1.33 1.19 .89 1.11 .95 .92
1984 1985 1986 1987 1988
.40 .32 .33 .33 .35
.33 .30 .29 .27 .27
51 .21 .35 53 .62
1984 1985 1986 1987 1988
.40 .32 .33 .33 .35
.34 .31 .29 .28 .28
.46 .07 .29 .46 59
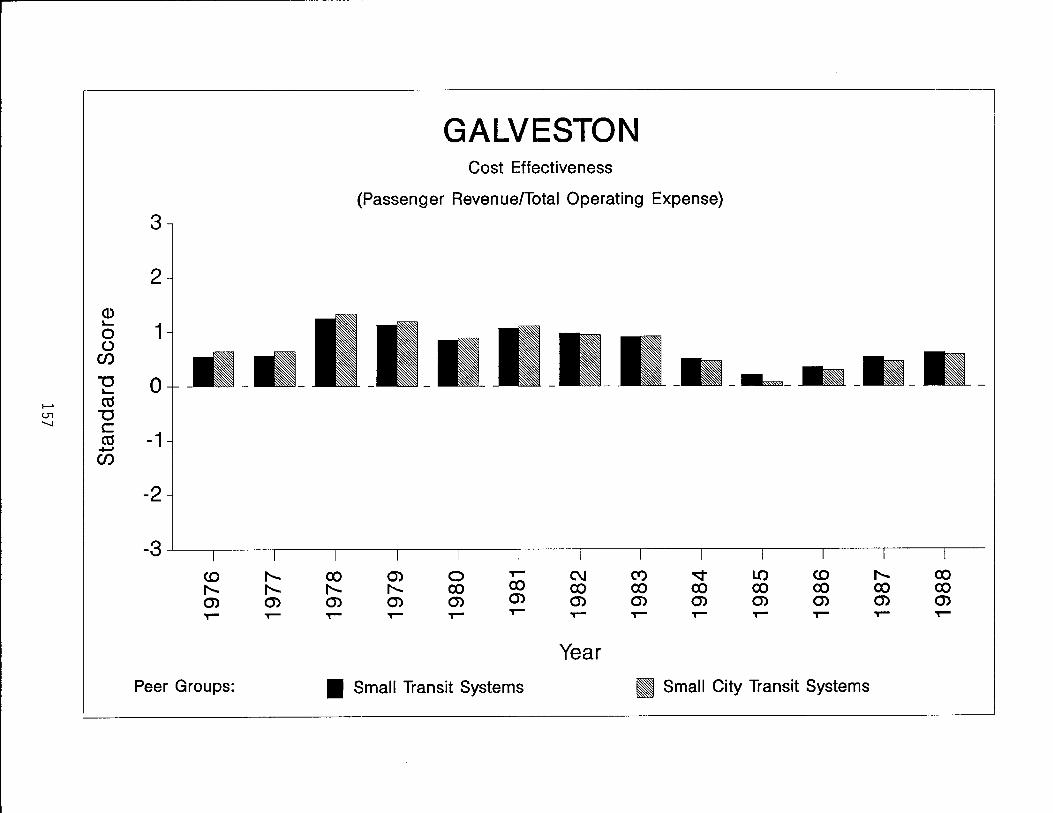
GALVESTON Cost Effectiveness
(Passenger Revenue/Total Operating Expense)
3
2
Q) lo.-
1 0 () (/) ---1J 0
"%§l _____
lo.-
I-' as 01 1J '-J C
as -1 +-' (/)
-2
-3 <D ,....... co 0> 0 T"""
'" (Y) ~ LO <D ,....... co ,....... ,....... ,....... ,....... co co co co co co co co co 0> 0> 0> 0> 0> 0> 0> 0> 0> 0> 0> 0> 0> T""" T""" T""" T""" T""" T""" T""" ~ T""" T""" T""" T""" T"""
Year
Peer Groups: • Small Transit Systems • Small City Transit Systems
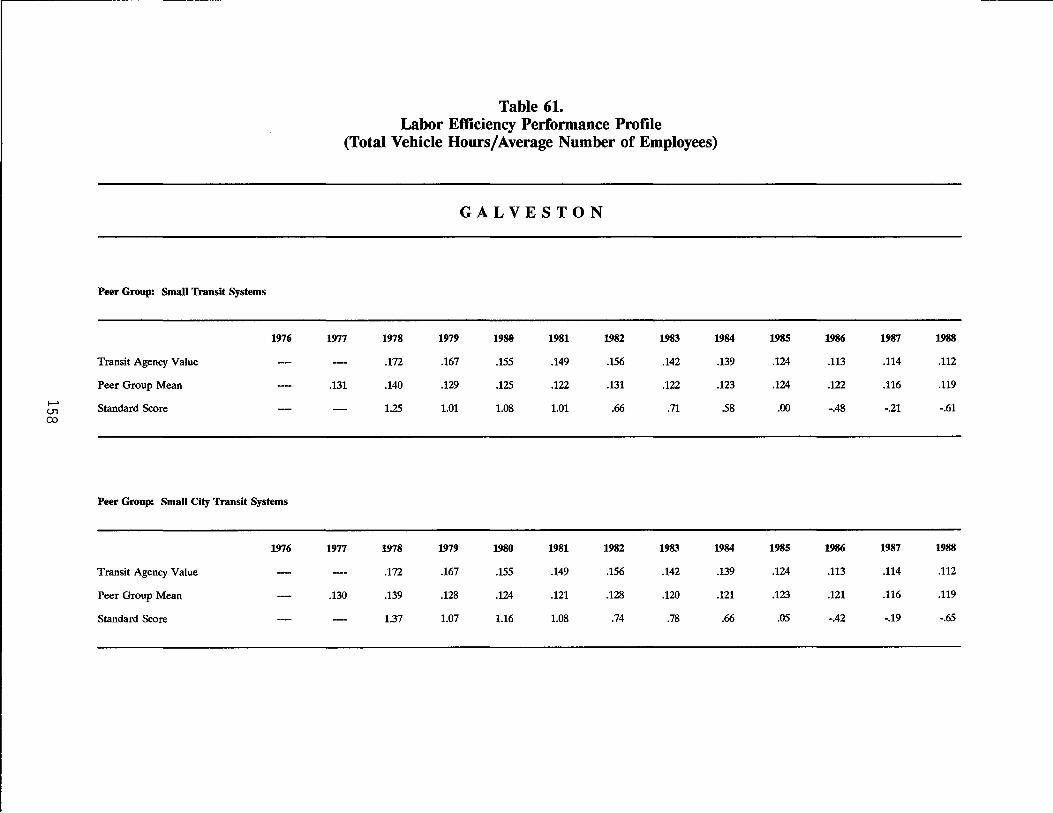
Table 61. Labor Efficiency Performance Profile
(Total Vehicle Hours/Average Number of Employees)
GALVESTON
Peer Group: Small Transit Systems
1976 1977 1978 1979 1980 1981 1982 1983 1984 1985 1986 1987 1988
Transit Agency Value .172 .167 .155 .149 .156 .142 .139 .124 .113 .114 .112
Peer Group Mean .131 .140 .129 .125 .122 .131 .122 .123 .124 .122 .116 .119
I-' Standard Score 1.25 1.01 1.08 1.01 .66 .71 58 .00 -.48 -.21 -.61 U1 ex>
Peer Group: Small City Transit Systems
1976 1977 1978 1979 1980 1981 1982 1983 1984 1985 1986 1987 1988
Transit Agency Value .172 .167 .155 .149 .156 .142 .139 .124 .113 .114 .112
Peer Group Mean .130 .139 .128 .124 .121 .128 .120 .121 .123 .121 .116 .119
Standard Score 1.37 1.07 1.16 1.08 .74 .78 .66 .05 -.42 -.19 -.65

3
2
Q) ~
1 0 ()
Cf)
"'0 0 - - - - - - - - -~
I-' as U1 "'0 1.0 C
as -1 +-' Cf)
-2
-3 <0 f'... f'... f'... (J') (J') .,.- .,.-
Peer Groups:
GALVESTON Labor Efficiency
(Total Vehicle Hours/Average Number of Employees)
ex) f'... (J') .,.-
(J') f'... (J') .,.-
o ex) (J') .,.-
.,.-ex) (J') .,.-
• Small Transit Systems
C\J ex) (J') .,.-
Year
('/') ex) (J') .,.-
~ ex) (J') .,.-
- - -=- --
L() ex) (J') .,.-
<0 ex) (J') .,.-
II Small City Transit Systems
.-
f'... ex) (J') .,.-
ex) ex) (J') .,.-

Table 62. Vehicle Efficiency Performance Profile
(Total Vehicle Miles/Average Number of Buses on Regular Routes)
GALVESTON
Peer Group: Small Transit Systems
1976 1977 1978 1979 1980 1981 1982 1983 1984 1985 1986 1987 1988
Transit Agency Value 3.40 4.85 4.87 4.11 3.87 3.94 3.97 4.33 4.74 4.60 4.65 4.58
Peer Group Mean 4.22 4.66 4.51 4.59 4.51 4.37 4.46 4.45 4.54 4.45 4.44 4.65
I--' Standard Score -.92 .23 .35 -.62 -.78 -.46 -.60 -.13 .24 .25 .35 -.11 0) 0
Peer Group: Small City Transit Systems
1976 1977 1978 1979 1980 1981 1982 1983 1984 1985 1986 1987 1988
Transit Agency Value 3.40 4.85 4.87 4.11 3.87 3.94 3.97 4.33 4.74 4.60 4.65 4.58
Peer Group Mean 4.19 4.58 4.45 4.52 4.47 4.34 4.43 4.43 4.47 4.41 4.40 4.58
Standard Score -.93 .33 .42 -.52 -.76 -.46 -.59 -.12 .34 .33 .43 .01

3
2
<D 10-
1 0 ()
C/)
"0 0 - - - - -10-
~ ro 0) "0 ~ c
ro -1 ........ C/)
-2
-3 <.0 ,..... 0) T"""
Peer Groups:
GALVESTON Vehicle Efficiency
(Total Vehicle Miles/Average Number of Buses on Regular Routes)
-.- -~-
._ ~ _IILW ____
,..... ,..... 0) T"""
o co 0) T"""
• Small Transit Systems
C\I co 0) T"""
Year
LO co 0) T"""
• Small City Transit Systems
co co 0> T"""

HOUSTON
163

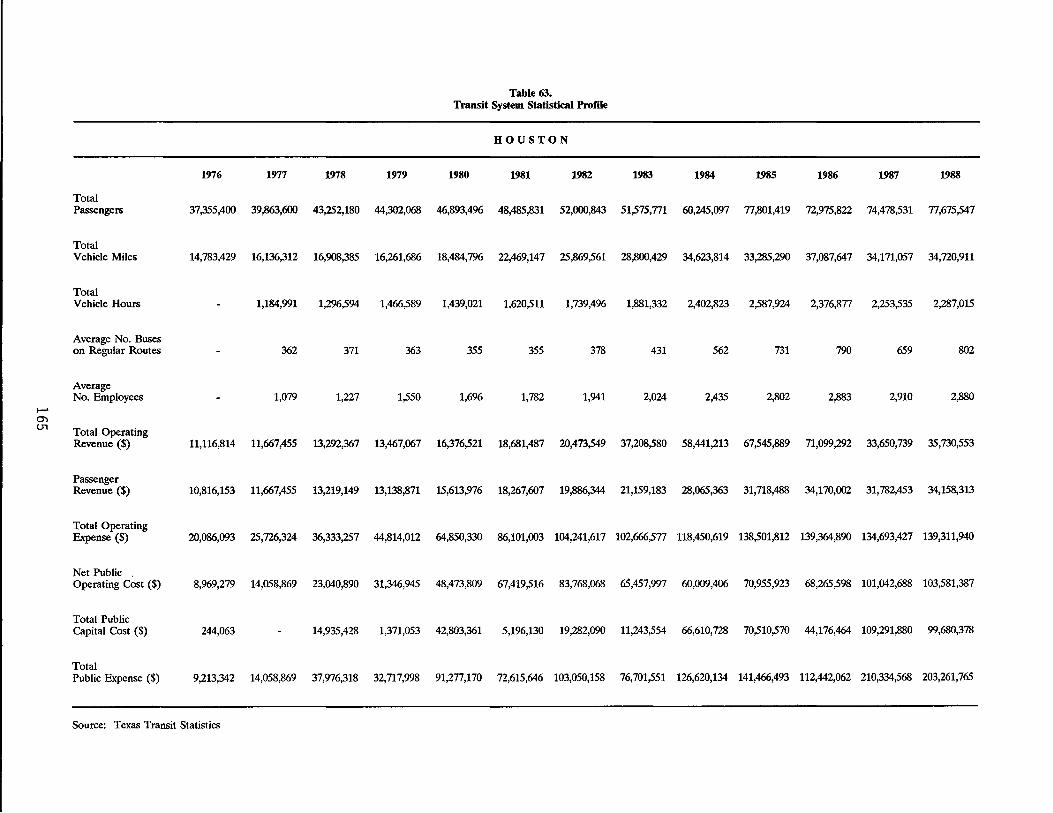
Table 63. Transit System Statistical Profile
HOUSTON
1976 1977 1978 1979 1980 1981 1982 1983 1984 1985 1986 1987 1988
Total Passengers 37,355,400 39,863,600 43,252,180 44,302,068 46,893,4% 48,485,831 52,000,843 51,575,771 60,245,097 77,801,419 72,975,822 74,478,531 77,675,547
Total Vehicle Miles 14,783,429 16,136,312 16,908,385 16,261,686 18,484,7% 22,469,147 25,869,561 28,800,429 34,623,814 33,285,290 37,087,647 34,171,057 34,720,911
Total Vehicle Hours 1,184,991 1,296,594 1,466,589 1,439,021 1,620,511 1,739,496 1,881,332 2,402,823 2,587,924 2,376,877 2,253,535 2,287,015
Average No. Buses on Regular Routes 362 371 363 355 355 378 431 562 731 790 659 802
Average No. Employees 1,079 1,227 1,550 1,696 1,782 1,941 2,024 2,435 2,802 2,883 2,910 2,880
~
0""1 (J1
Total Operating Revenue ($) 11,116,814 11,667,455 13,292,367 13,467,067 16,376,521 18,681,487 20,473,549 37,208,580 58,441,213 67,545,889 71,099,292 33,650,739 35,730,553
Passenger Revenue ($) 10,816,153 11,667,455 13,219,149 13,138,871 15,613,976 18,267,607 19,886,344 21,159,183 28,065,363 31,718,488 34,170,002 31,782,453 34,158,313
Total Operating Expense ($) 20,086,093 25,726,324 36,333,257 44,814,012 64,850,330 86,101,003 104,241,617 102,666,577 118,450,619 138,501,812 139,364,890 134,693,427 139,311,940
Net Public Operating Cost ($) 8,969,279 14,058,869 23,040,890 31,346,945 48,473,809 67,419,516 83,768,068 65,457,997 60,009,406 70,955,923 68,265,598 101,042,688 103,581,387
Total Public Capital Cost ($) 244,063 14,935,428 1,371,053 42,803,361 5,196,130 19,282,090 11,243,554 66,610,728 70,510,570 44,176,464 109,291,880 99,680,378
Total Public Expense ($) 9,213,342 14,058,869 37,976,318 32,717,998 91,277,170 72,615,646 103,050,158 76,701,551 126,620,134 141,466,493 112,442,062 210,334,568 203,261,765
Source: Texas Transit Statistics

Peer Group: Large Transit Systems
1976 1977
Transit Agency Value .046
Peer Group Mean .051
I-' Standard Score -.% Q) Q)
Peer Group: Large City Transit Systems
1976 1977
Transit Agency Value .046
Peer Group Mean .069
Standard Score -.56
Table 64. Cost Efficiency Performance Profile
(Total Vehicle Hours/Total Operating Expense)
HOUSTON
1978 1979 1980 1981 1982 1983
.036 .033 .022 .019 .017 .018
.052 .043 .036 .030 .029 .028
-1.38 -1.30 -1.32 -1.40 -1.37 -1.26
1978 1979 1980 1981 1982 1983
.036 .033 .022 .019 .017 .018
.060 .047 .039 .033 .031 .031
-1.08 -1.45 -1.81 -1.72 -1.93 -1.78
1984 1985 1986 1987 1988
.020 .019 .017 .017 .016
.026 .024 .021 .022 .022
-.91 -.93 -.57 -.80 -.92
1984 1985 1986 1987 1988
.020 .019 .017 .017 .016
.029 .026 .024 .023 .022
-1.46 -1.40 -1.08 -1.22 -1.16

HOUSTON Cost Efficiency
(Total Vehicle Hours/Total Operating Expense)
3
2
Q) to.....
1 0 0 en u 0 - - - - -to.....
I-' CO 0'1 U '-.l c
-1 co +-' en
-2
-3 <.0 f'... to m 0 ~ C\I (Y) ..q LO <.0 f'... to f'... f'... f'... f'... to to to to to to to to to m m m m m m m m m m m m m ~ ~ ~ ~ ~ ~ ~ ~ ~ ~ ~ ~ ~
Year Peer Groups: • Large Transit Systems • Large City Transit Systems
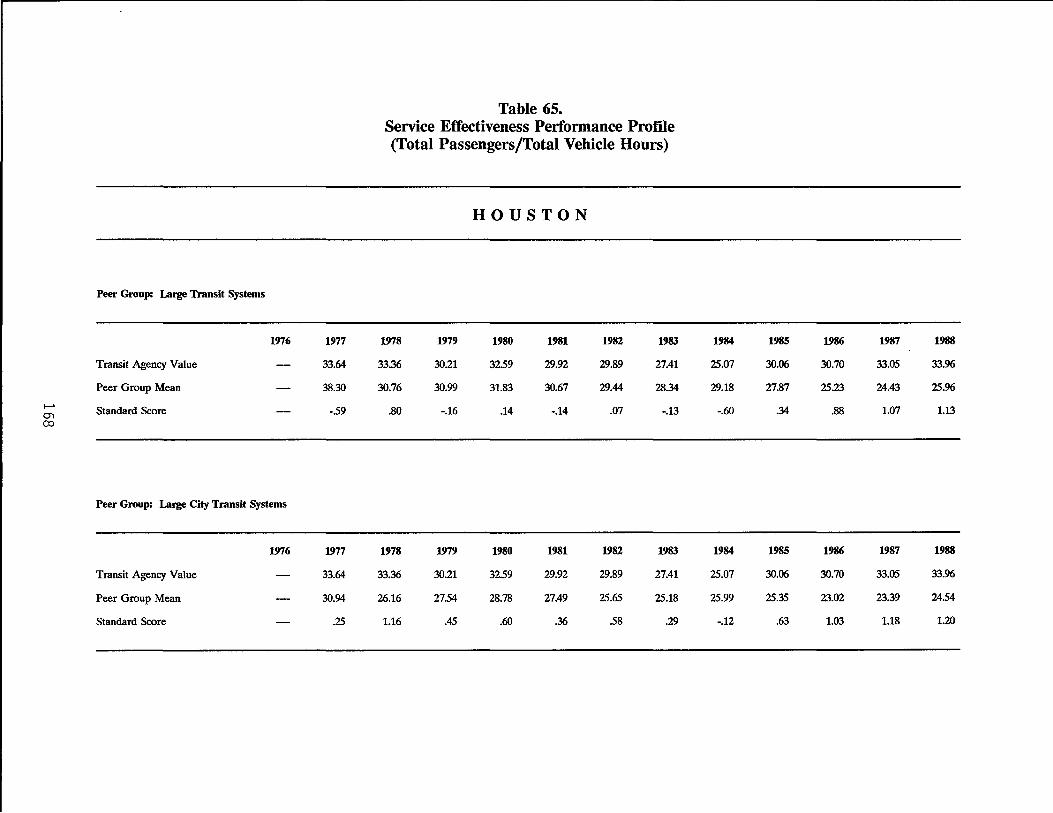
Peer Group: Large Transit Systems
1976
Transit Agency Value
Peer Group Mean
I-' Standard Score (j)
co
Peer Group: Large City Transit Systems
1976
Transit Agency Value
Peer Group Mean
Standard Score
1977
33.64
38.30
-.59
1977
33.64
30.94
.25
Table 65. Service Effectiveness Performance Profile (Total Passengers/Total Vehicle Hours)
1978
33.36
30.76
.80
1978
33.36
26.16
1.16
1979
30.21
30.99
-.16
1979
30.21
27.54
.45
HOUSTON
1980
3259
31.83
.14
1980
3259
28.78
.60
1981
29.92
30.67
-.14
1981
29.92
27.49
.36
1982
29.89
29.44
.07
1982
29.89
25.65
58
1983
27.41
28.34
-.13
1983
27.41
25.18
.29
1984
25.07
29.18
-.60
1984
25.07
25.99
-.12
1985
30.06
27.87
.34
1985
30.06
25.35
.63
1986
30.70
25.23
.88
1986
30.70
23.02
1.03
1987
33.05
24.43
1.07
1987
33.05
23.39
1.18
1988
33.%
25.%
1.13
1988
33.%
2454
1.20
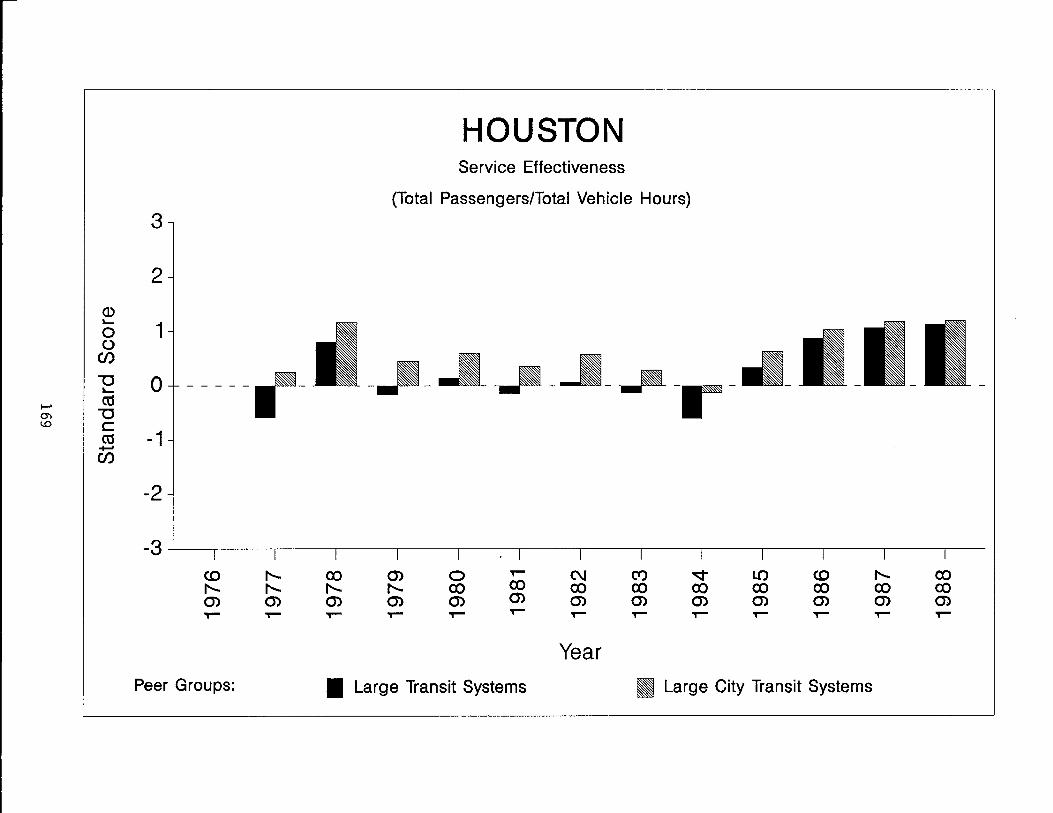
3
2
<D "'- 1 0 0
CJ)
"'0 0 - - - - -.--"'-I-' ctS 0""1 "'0 1.0 C
ctS -1 ...... CJ)
-2
-3 c.o r-..... r-..... r-..... 0) 0) ,- T"""
Peer Groups:
HOUSTON Service Effectiveness
(Total Passengers/Total Vehicle Hours)
ex) r-..... 0) T"""
o CO 0) T"""
T""" ex) Q) T"""
• Large Transit Systems
C'\I CO 0) T"""
Year
Ct) ex) 0) T"""
oqex) 0) T"""
LO CO 0) T"""
c.o CO 0) T"""
• Large City Transit Systems
r-..... ex) 0) T"""
ex) CO 0) T"""

Peer Group: Large Transit Systems
1976 1977
Transit Agency Value 54 .45
Peer Group Mean .52 .49
I-' Standard Score .13 -.27 "-.J
0
Peer Group: Large City Transit Systems
1976 1977
Transit Agency Value 54 .45
Peer Group Mean .55 .53
Standard Score -.05 -.32
Table 66. Cost Effectiveness Performance Profile
(Passenger Revenue/Total Operating Expense)
HOUSTON
1978 1979 1980 1981 1982 1983
.36 .29 .24 .21 .19 .21
.40 .37 .36 .36 .35 .33
-.23 -.46 -.88 -.93 -.99 -.92
1978 1979 1980 1981 1982 1983
.36 .29 .24 .21 .19 .21
.43 .39 .37 .36 .34 .34
-.39 -.65 -1.10 -1.09 -1.24 -1.25
1984 1985 1986 1987 1988
.24 .23 .25 .24 .25
.28 .26 .22 .21 .22
-.82 -.55 .24 .27 .27
1984 1985 1986 1987 1988
.24 .23 .25 .24 .25
.32 .28 .25 .24 .23
-1.08 -.72 -.03 -.02 .12

3
2
CD "- 1 0 0
en "'0 0 - ----"-
I--' ctS '..I "'0 I--' C
ctS -1 +-' en
-2
-3 <0 f'.. f'.. f'.. 0> 0> ,- ,-
Peer Groups:
HOUSTON Cost Effectiveness
(Passenger Revenue/Total Operating Expense)
co f'.. 0> ,-
0> f'.. 0> ,-
o co 0> ,-
,-co 0> ,-
• Large Transit Systems
C\J co 0> ,-
Year
Ct) co 0> ,-
"'¢ co 0> ,-
LO co 0> ,-
-------~-
<0 co 0> ,-
f'.. co 0> ,-
co co 0> ,-
• Large City Transit Systems

Table 67. Labor Efficiency Performance Profile
(Total Vehicle Hours/Average Number of Employees)
HOUSTON
Peer Group: Large Transit Systems
1976 1977 1978 1979 1980 1981 1982 1983 1984 1985 1986 1987 1988
Transit Agency Value .110 .106 .095 .085 .091 .090 .093 .099 .092 .082 .077 .079
Peer Group Mean .102 .116 .112 .106 .105 .104 .104 .101 .098 .100 .104 .109
I-' Standard Score 1.16 -1.25 -1.41 -1.40 -1.45 -1.39 -1.13 -.24 -57 -.76 -1.27 -1.35 -.....J N
Peer Group: Large City Transit Systems
1976 1977 1978 1979 1980 1981 1982 1983 1984 1985 1986 1987 1988
Transit Agency Value .110 .106 .095 .085 .091 .090 .093 .099 .092 .082 .077 .079
Peer Group Mean .118 .126 .117 .110 .108 .107 .105 .102 .098 .097 .101 .101
Standard Score -.22 -.83 -1.92 -2.03 -1.83 -2.09 -1.31 -.35 -.82 -.86 -1.37 -1.15
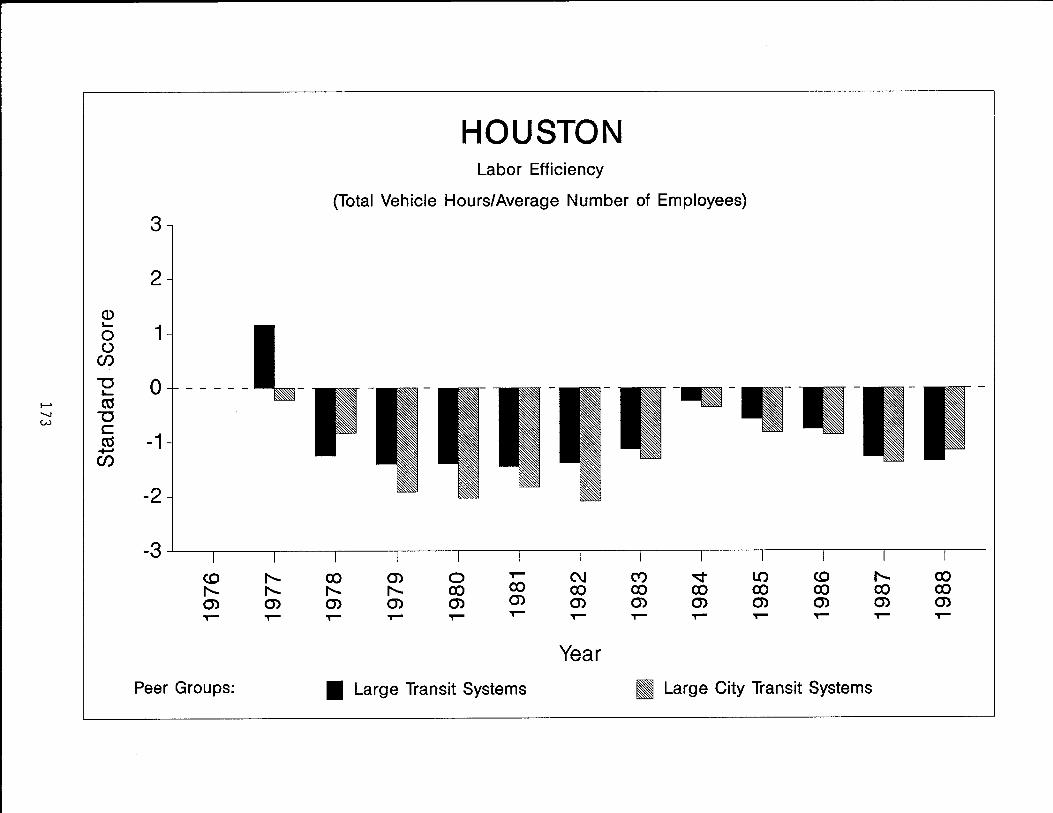
3
2
Q) 10-
1
-----1.-0 ()
Cf)
"'0 0 10-......, CO -...J "'0 w c
co -1 ..... Cf)
-2
-3 <0 f'.. f'.. f'.. 0> 0> .,.- .,.-
Peer Groups:
HOUSTON Labor Efficiency
(Total Vehicle Hours/Average Number of Employees)
co 0> f'.. f'.. 0> 0> .,.- .,.-
o co 0> .,.-
.,.-co 0> .,.-
• Large Transit Systems
C\I co 0> .,.-
Year
Ct) co 0> .,.-
-qco 0> .,.-
LO co 0> .,.-
<0 co 0> .,.-
I] Large City Transit Systems
f'.. co 0> .,.-
co co 0> .,.-

Table 68. Vehicle Efficiency Performance Profile
(Total Vehicle Miles/Average Number of Buses on Regular Routes)
HOUSTON
Peer Group: Large Transit Systems
1976 1977 1978 1979 1980 1981 1982 1983 1984 1985 1986 1987 1988
Transit Agency Value 4.46 4.56 4.48 5.21 6.33 6.84 6.68 6.16 455 4.69 5.19 4.33
Peer Group Mean 2.85 4.49 4.31 4.17 4.23 4.39 4.63 453 4.48 3.88 3.97 4.40 4.34
I-' Standard Score -.03 .39 .69 1.13 1.42 1.41 1.43 1.37 1.12 1.45 1.14 -.02
" ~
Peer Group: Large City Transit Systems
1976 1977 1978 1979 1980 1981 1982 1983 1984 1985 1986 1987 1988
Transit Agency Value 4.46 456 4.48 5.21 6.33 6.84 6.68 6.16 4.55 4.69 5.19 4.33
Peer Group Mean 2.85 4.60 450 4.46 4.46 4.48 457 4.42 4.40 4.09 4.22 4.71 4.57
Standard Score -.12 .07 .02 .75 152 1.80 1.94 1.90 .81 .78 58 -.37

HOUSTON Vehicle Efficiency
(Total Vehicle Miles/Average Number of Buses on Regular Routes)
3
2
<D ~
1 0 ()
~_L_ en -a 0 - - - - - -~ iM@j -ctS
......... -a -....J Ul C
ctS -1 +-' en
-2
-3 <D t- ex:> 0) 0 ,- C\J (Y) ~ LO <D t- ex:> t- t- t- t- ex:> ex:> ex:> ex:> ex:> ex:> ex:> ex:> ex:> 0) 0) 0) 0) 0) 0) 0') 0) 0) 0') 0) 0) 0) ,- ,- ,- ,- ,- ,- ,- ,- ,- ,- ,- ,- ,-
Year
Peer Groups: • Large Transit Systems • Large City Transit Systems


LAREDO
177

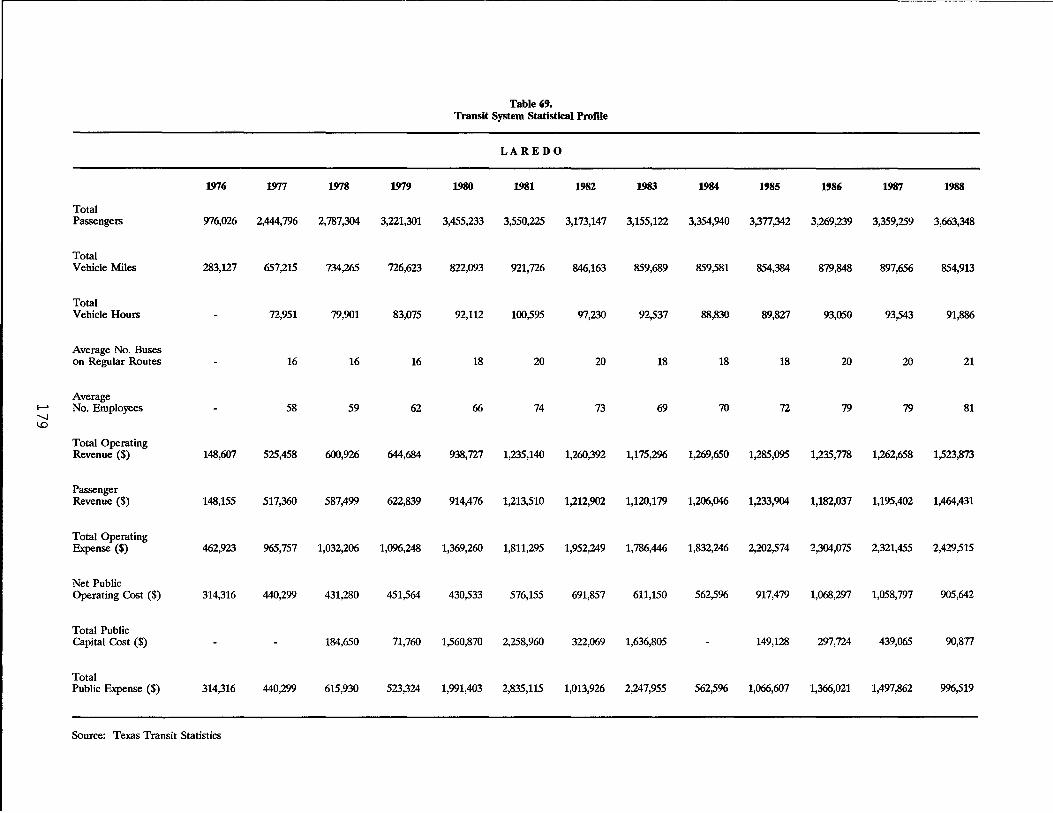
Table 69. Transit System Statistical Profile
LAREDO
1976 1977 1978 1979 1980 1981 1982 1983 1984 1985 1986 1987 1988
Total Passengers 976,026 2,444,796 2,787,304 3,221,301 3,455,233 3,550,225 3,173,147 3,155,122 3,354,940 3,377,342 3,269,239 3,359,259 3,663,348
Total Vehicle Miles 283,127 657,215 734,265 726,623 822,093 921,726 846,163 859,689 859,581 854,384 879,848 897,656 854,913
Total Vehicle Hours 72,951 79,901 83,075 92,112 100,595 97,230 92,537 88,830 89,827 93,050 93,543 91,886
Average No. Buses on Regular Routes 16 16 16 18 20 20 18 18 18 20 20 21
Average I-' '-J
No. Employees 58 59 62 66 74 73 69 70 72 79 79 81
~
Total Operating Revenue ($) 148,607 525,458 600,926 644,684 938,727 1,235,140 1,260,392 1,175,296 1,269,650 1,285,095 1,235,778 1,262,658 1,523,873
Passenger Revenue ($) 148,155 517,360 587,499 622,839 914,476 1,213,510 1,212,902 1,120,179 1,206,046 1,233,904 1,182,037 1,195,402 1,464,431
Total Operating Expense ($) 462,923 965,757 1,032,206 1,096,248 1,369,260 1,811,295 1,952,249 1,786,446 1,832,246 2,202,574 2,304,075 2,321,455 2,429,515
Net Public Operating Cost ($) 314,316 440,299 431,280 451,564 430,533 576,155 691,857 611,150 562,5% 917,479 1,068,297 1,058,797 905,642
Total Public Capital Cost ($) 184,650 71,760 1,560,870 2,258,960 322,069 1,636,805 149,128 297,724 439,065 90,877
Total Public Expense ($) 314,316 440,299 615,930 523,324 1,991,403 2,835,115 1,013,926 2,247,955 562,5% 1,066,607 1,366,021 1,497,862 9%,519
Source: Texas Transit Statistics

Peer Group: Small Transit Systems
1976 1977
Transit Agency Value .076
Peer Group Mean .087
I-' Standard Score -.70 co 0
Peer Group: Small City Transit Systems
1976 1977
Transit Agency Value .076
Peer Group Mean .087
Standard Score -.76
Table 70. Cost Efficiency Performance Profile
(Total Vehicle Hours/Total Operating Expense)
LAREDO
1978 1979 1980 1981 1982 1983
.077 .076 .067 .056 .050 .052
.089 .066 .055 .048 .051 .045
-50 .73 1.11 .89 -.08 .73
1978 1979 1980 1981 1982 1983
.077 .076 .067 .056 .050 .052
.088 .066 .055 .048 .051 .045
-.47 .79 1.20 .94 -.07 .80
1984 1985 1986 1987 1988
.048 .041 .040 .040 .038
.041 .040 .039 .038 .037
.85 .09 .29 56 .23
1984 1985 1986 1987 1988
.048 .041 .040 .040 .038
.042 .041 .039 .038 .037
.85 -.05 .29 51 .17

3
2
(1) I-
1 0 0 en u 0 - - - - -l-
I-' (tj
ex> U I-' C
(tj -1 +-' en
-2
-3 <0 ,....... ,....... ,....... 0) 0) .,..... .,.....
Peer Groups:
LAREDO Cost Efficiency
(Total Vehicle Hours/Total Operating Expense)
co ,....... 0) .,.....
0) ,....... 0) .,.....
o co 0) .,.....
.,..... co 0) .,.....
• Small Transit Systems
ssssssS!-
C\J co 0) .,.....
Year
Ct) co 0) .,.....
~ co 0) .,.....
bm- ---
LO co 0) .,.....
<0 co 0) .,.....
• Small City Transit Systems
,....... co 0) .,.....
- -
co co 0) .,.....

Peer Group: Small Transit Systems
1976
Transit Agency Value
Peer Group Mean
...... Standard Score ex>
N
Peer Group: Small City Transit Systems
1976
Transit Agency Value
Peer Group Mean
Standard Score
1977
33.51
19.20
2.04
1977
33.51
20.85
1.54
Table 71. Service Effectiveness Performance Profile (Total Passengers/Total Vehicle Hours)
1978
34.88
18.49
2.11
1978
34.88
19.69
1.84
1979
38.78
20.03
2.19
1979
38.78
21.05
2.01
LAREDO
1980
37.51
20.72
2.37
1980
37.51
22.20
1.84
1981
35.29
21.44
2.00
1981
35.29
23.10
1.42
1982
32.64
19.80
1.83
1982
32.64
22.06
1.05
1983
34.10
19.75
2.29
1983
34.10
20.55
2.08
1984
37.77
20.70
2.35
1984
37.77
21.69
2.11
1985
37.60
19.66
2.45
1985
37.60
20.79
2.13
1986
35.13
19.82
2.02
1986
35.13
20.79
1.82
1987
35.91
19.34
2.01
1987
35.91
20.23
1.88
1988
39.87
19.12
2.17
1988
39.87
20.02
2.07
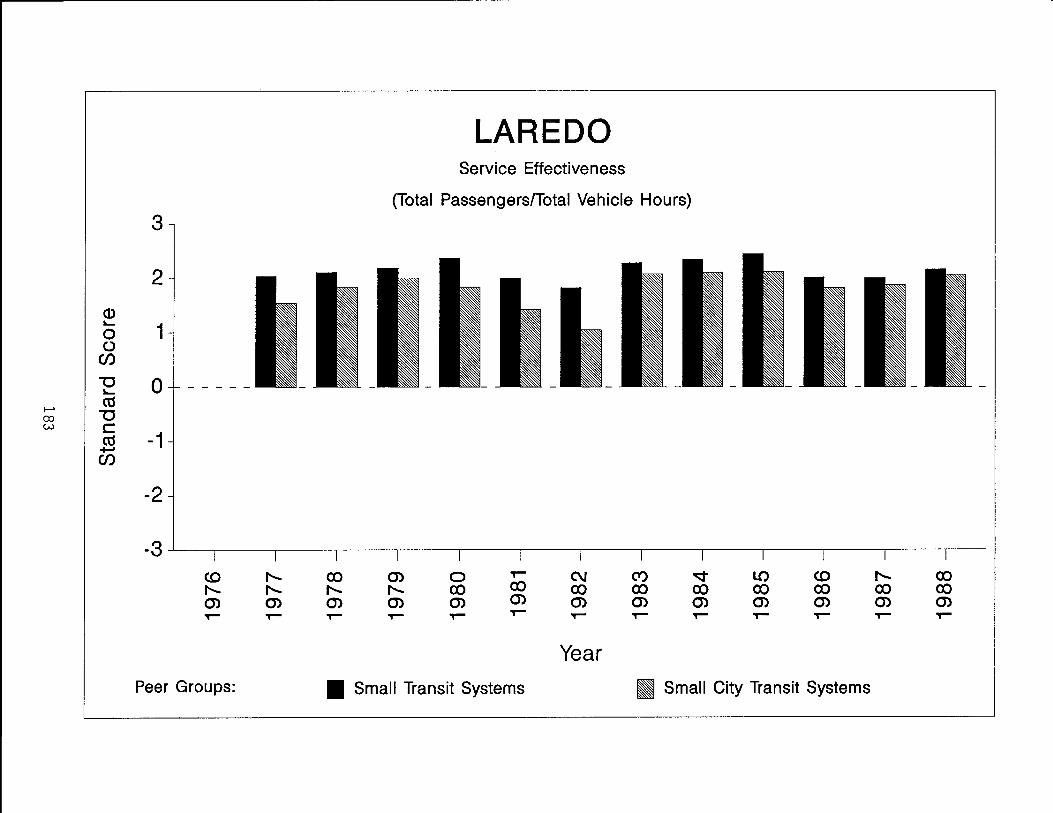
LAREDO Service Effectiveness
(Total Passengers/Total Vehicle Hours)
3
2
Q) ..... 1 0
() (/)
"'0 0 - - - - -..... I--'
ctS co "'0 w c
ctS -1 +-' (/)
-2
-3 <0 ,....... CO (j) 0 .,- C\J Ct') -q- LO <0 ,....... ,....... ,....... ,....... CO CO CO CO CO CO CO (j) (j) (j) (j) (j) (j) (j) (j) (j) (j) (j)
,....... co co co (j) (j)
.,- .,- .,- .,- .,- T""" .,- .,- .,- .,- .,- T""" .,-
Year Peer Groups: • Small Transit Systems • Small City Transit Systems
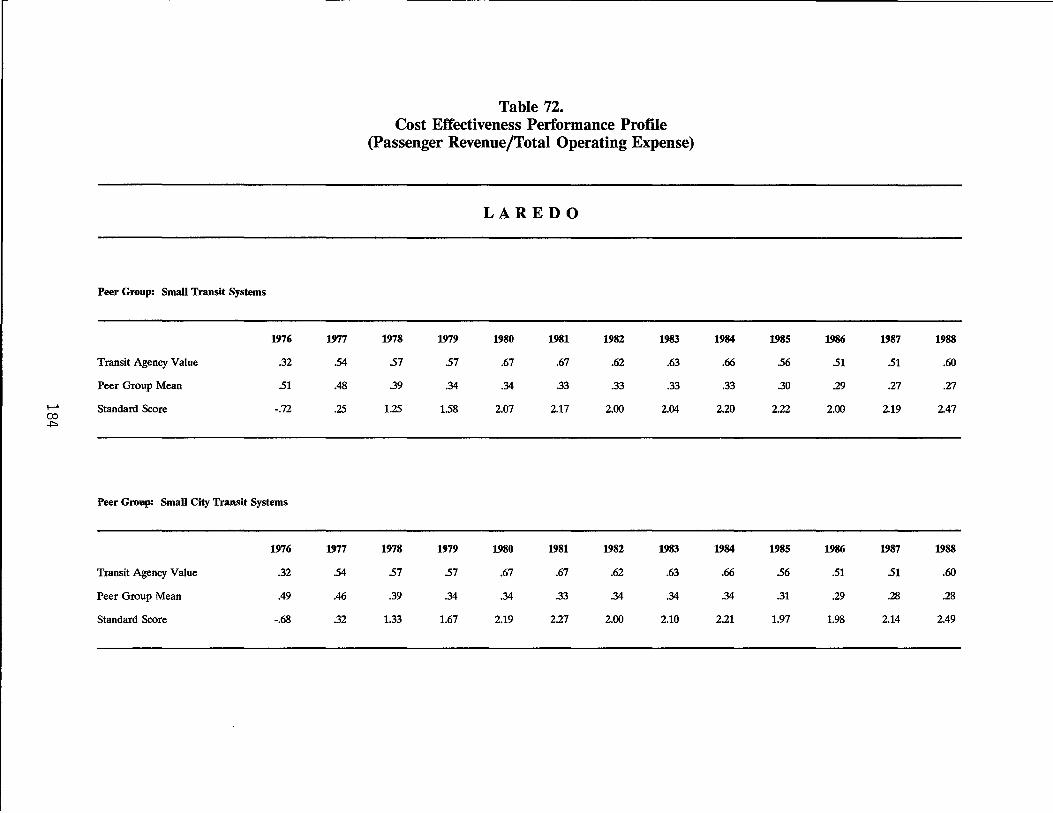
I-' m .j:::>
Peer Group: Small Transit Systems
1976
Transit Agency Value .32
Peer Group Mean 51
Standard Score -.72
Peer Group: Small City Transit Systems
Transit Agency Value
Peer Group Mean
Standard Score
1976
.32
.49
-.68
1977
.54
.48
.25
1977
54
.46
.32
Table 72. Cost Effectiveness Performance Profile
(Passenger Revenue/Total Operating Expense)
1978
57
.39
1.25
1978
57
.39
1.33
1979
57
.34
1.58
1979
57
.34
1.67
LAREDO
1980
.67
.34
2.07
1980
.67
.34
2.19
1981
.67
.33
2.17
1981
.67
.33
2.27
1982
.62
.33
2.00
1982
.62
.34
2.00
1983
.63
.33
2.04
1983
.63
.34
2.10
1984
.66
.33
2.20
1984
.66
.34
2.21
1985
56
.30
2.22
1985
56
.31
1.97
1986
51
.29
2.00
1986
.51
.29
1.98
1987
51
.27
2.19
1987
51
.28
2.14
1988
.60
.27
2.47
1988
.60
.28
2.49

LAREDO Cost Effectiveness
(Passenger Revenue/Total Operating Expense) 3
2
CD 10-
1 0 0 en
"'0 0 10-
a:s I-' "'0 00 (J"1 c
a:s -1 +"' en
-2
-3 <.0 f'-... co (J) 0 T""" C\J ('f') -.:::t LO <.0 f'-... co f'-... f'-... f'-... f'-... co co co co co co co co co (J) (J) (J) (J) (J) (J) (J) (J) (J) (J) (J) (J) (J) T""" T""" T""" T""" T""" T""" T""" T""" T""" T""" T""" T""" T"""
Year Peer Groups: • Small Transit Systems • Small City Transit Systems

Table 73. Labor Efficiency Performance Profile
(Total Vehicle Hours/Average Number of Employees)
LAREDO
Peer Group: Small Transit Systems
1976 1977 1978 1979 1980 1981 1982 1983 1984 1985 1986 1987 1988
Transit Agency Value .126 .135 .134 .140 .136 .133 .134 .127 .125 .118 .118 .113
Peer Group Mean .131 .140 .129 .125 .122 .131 .122 .123 .124 .122 .116 .119
I-' Standard Score -.34 -.20 .14 52 53 .07 .43 .14 .03 -.22 .17 -.47 00 0"1
Peer Group: Small City Transit Systems
1976 1977 1978 1979 1980 1981 1982 1983 1984 1985 1986 1987 1988
Transit Agency Value .126 .135 .134 .140 .136 .133 .134 .127 .125 .118 .118 .113
Peer Group Mean .130 .139 .128 .124 .121 .128 .120 .121 .123 .121 .116 .119
Standard Score -.26 -.14 .16 .58 58 .13 50 .21 .08 -.16 .21 -51

LAREDO Labor Efficiency
(Total Vehicle Hours/Average Number of Employees)
3
2
Q) ..... 1 0
0 CJ)
"'0 0 - --- - - - -.-- ~ ..... ....... a:s
Em __ _
--=-=--~-"-
co "'0 '-J C a:s -1 +-' CJ)
-2
-3 <D
""'" co 0) 0 T""" C\J Ct) ~ LO <D
""'" co
""'" ""'" ""'" ""'" co co co co co co co co co
0) 0) 0) 0) 0) 0) 0) 0) 0) 0) en 0) 0)
T""" 'T""" T""" 'T""" 'T""" 'T""" 'T""" 'T""" T""" 'T""" T""" 'T""" 'T"""
Year Peer Groups: • Small Transit Systems ~ Small City Transit Systems

Peer Group: Small Transit Systems
1976
Transit Agency Value
Peer Group Mean
...... Standard Score CO CO
Peer Group: Small City Transit Systems
1976
Transit Agency Value
Peer Group Mean
Standard Score
Table 74. Vehicle Efficiency Performance Profile
(Total Vehicle Miles/Average Number of Buses on Regular Routes)
1977
4.11
4.22
-.13
1977
4.11
4.19
-.10
1978
4.59
4.66
-.09
1978
459
458
.02
1979
454
451
.03
1979
454
4.45
.09
LAREDO
1980 1981
457 4.61
459 4.51
-.03 .13
1980 1981
457 4.61
452 4.47
.06 .18
1982
4.23
4.37
-.15
1982
4.23
4.34
-.13
1983
4.78
4.46
.38
1983
4.78
4.43
.44
1984
4.78
4.45
.36
1984
4.78
4.43
.40
1985
4.75
4.54
.25
1985
4.75
4.47
.35
1986
4.40
4.45
-.09
1986
4.40
4.41
-.02
1987
4.49
4.44
.08
1987
4.49
4.40
.16
1988
4.07
4.65
-.91
1988
4.07
458
-.77

LAREDO Vehicle Efficiency
(Total Vehicle Miles/Average Number of Buses on Regular Routes) 3
2
CD .... 1 0
() Cf) -----"'C 0 - - - - - = - """'"
m
-•
- "3W -**'''*'' @..~ .... f-' ctS co "'C 1.0 C
ctS -1 +-' Cf)
-2
-3 c:o ,...... co Q) 0 T""" C\J (Y) ~ LO c:o ,...... co ,...... ,...... ,...... ,...... co co co co co co co co co Q) Q) Q) Q) Q) Q) Q) Q) Q) Q) Q) Q) Q) T""" T""" T""" T""" T""" T""" T""" T""" T""" T""" T""" T""" T"""
Year Peer Groups: • Small Transit Systems • Small City Transit Systems


LUBBOCK
191

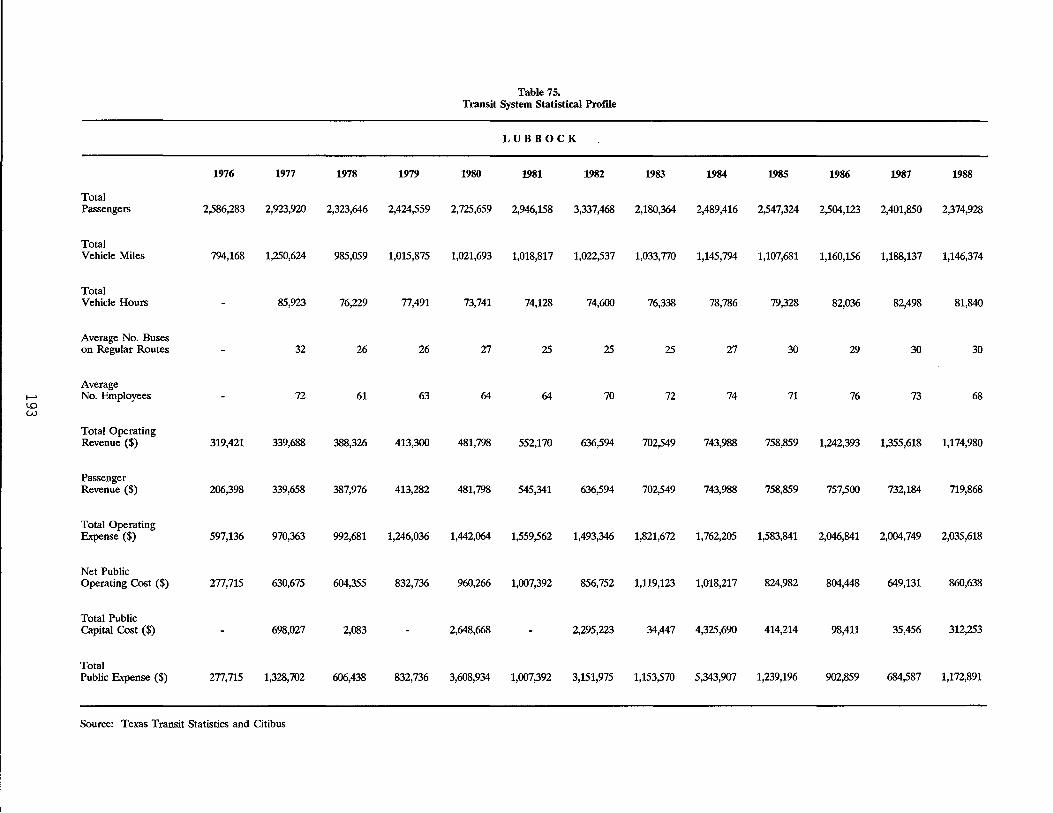
Table 75. Transit System Statistical Prome
LUBBOCK
1976 1977 1978 1979 1980 1981 1982 1983 1984 1985 1986 1987 1988
Total Passengers 2,586,283 2,923,920 2,323,646 2,424,559 2,725,659 2,946,158 3,337,468 2,180,364 2,489,416 2,547,324 2,504,123 2,401,850 2,374,928
Total Vehicle Miles 794,168 1,250,624 985,059 1,015,875 1,021,693 1,018,817 1,022,537 1,033,770 1,145,794 1,107,681 1,160,156 1,188,137 1,146,374
Total Vehicle Hours 85,923 76,229 77,491 73,741 74,128 74,600 76,338 78,786 79,328 82,036 82,498 81,840
Average No. Buses on Regular Routes 32 26 26 27 25 25 25 27 30 29 30 30
Average I-' No. Employees 72 61 63 64 64 70 72 74 71 76 73 68 ~ w
Total Operating Revenue ($) 319,421 339,688 388,326 413,300 481,798 552,170 636,594 702,549 743,988 758,859 1,242,393 1,355,618 1,174,980
Passenger Revenue ($) 206,398 339,658 387,976 413,282 481,798 545,341 636,594 702,549 743,988 758,859 757,500 732,184 719,868
Total Operating Expense ($) 597,136 970,363 992,681 1,246,036 1,442,064 1,559,562 1,493,346 1,821,672 1,762,205 1,583,841 2,046,841 2,004,749 2,035,618
Net Public Operating Cost ($) 277,715 630,675 604,355 832,736 960,266 1,007,392 856,752 1,119,123 1,018,217 824,982 804,448 649,131 860,638
Total Public Capital Cost ($) 698,027 2,083 2,648,668 2,295,223 34,447 4,325,690 414,214 98,411 35,456 312,253
Total Public Expense ($) 277,715 1,328,702 606,438 832,736 3,608,934 1,007,392 3,151,975 1,153,570 5,343,907 1,239,196 902,859 684,587 1,172,891
Source: Texas Transit Statistics and Citibus

Peer Group: Medium-Sized Transit Systems
1976 1977
Transit Agency Value .089
Peer Group Mean .091 -\.0 Standard Score -.05 ~
Peer Group: Small City Transit Systems
1976 1977
Transit Agency Value .089
Peer Group Mean .087
Standard Score .11
Table 76. Cost Efficiency Performance Profile
(Total Vehicle Hours/Total Operating Expense)
LUBBOCK
1978 1979 1980 1981 1982 1983
.077 .062 .051 .048 .050 .042
.073 .054 .045 .039 .037 .037
.13 .76 .85 .95 1.36 1.05
1978 1979 1980 1981 1982 1983
.077 .062 .051 .048 .050 .042
.088 .066 .055 .048 .051 .045
-.49 -.32 -.37 -.06 -.07 -.31
1984 1985 1986 1987 1988
.045 .050 .040 .041 .040
.037 .034 .031 .028 .027
1.43 1.44 1.43 1.42 1.38
1984 1985 1986 1987 1988
.045 .050 .040 .041 .040
.042 .041 .039 .038 .037
.38 1.35 .23 .69 .65

LUBBOCK Cost Efficiency
(Total Vehicle Hours/Total Operating Expense)
3
2
Q) L..
1 0 0
en "0 0 - - - - - ~ L..
I-' ro ~ "0 U1 c::
ro -1 +-' en
-2
-3 f'.. co 0> 0 T""" C\J Ct) "¢' LO co f'.. co f'.. f'.. f'.. co co co co co co co co co 0> 0> 0> 0> 0> 0> 0> 0> 0> 0> 0> 0> T""" T""" T""" T""" T""" T""" T""" T""" T""" T""" T""" T"""
Year Peer Groups: • Medium-Sized Transit Systems Ii Small City Transit Systems

I-' ~ 0'\
Peer Group: Medium-Sized Transit Systems
1976
Transit Agency Value
Peer Group Mean
Standard Score
Peer Group: Small City Transit Systems
Transit Agency Value
Peer Group Mean
Standard Score
1976
1977
34.03
24.35
1.48
1977
34.03
20.85
1.60
Table 77. Service Effectiveness Performance Profile (Total Passengers/Total Vehicle Hours)
1978
30.48
22.64
1.48
1978
30.48
19.69
1.31
1979
31.29
25.02
1.16
1979
31.29
21.05
1.16
LUBBOCK
1980
36.%
27.78
1.19
1980
36.96
22.20
1.78
1981
39.74
27.38
1.25
1981
39.74
23.10
1.94
1982
44.74
26.62
1.41
1982
44.74
22.06
2.26
1983
28.56
22.86
.78
1983
28.56
20.55
1.23
1984
31.60
24.20
.90
1984
31.60
21.69
1.30
1985
32.11
24.53
.87
1985
32.11
20.79
1.43
1986
30.52
22.68
.85
1986
30.52
20.79
1.24
1987
29.11
23.79
.60
1987
29.11
20.23
1.07
1988
29.02
24.24
.55
1988
29.02
20.02
.94
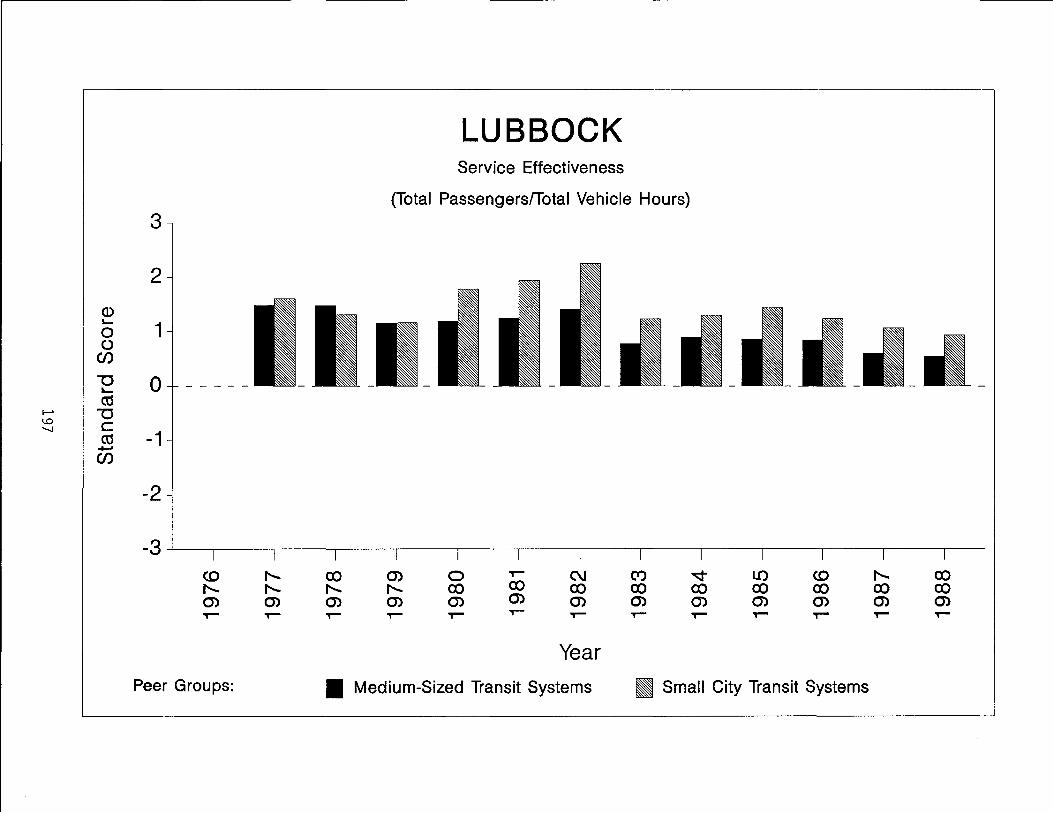
LUBBOCK Service Effectiveness
(Total Passengers/Total Vehicle Hours)
3
2
Q) '- 1 0 ()
CJ)
u 0 - - - - -'-a:s I--' u 1..0 C '-J
-1 a:s +-' CJ)
-2
-3 <D f'.. ex) en 0 T""" C\J cr:> ~ LO <D f'.. ex)
f'.. f'.. f'.. f'.. ex) ex) ex) ex) ex) ex) ex) ex) ex)
en en en en en en en en en en en en en T""" T""" T""" T""" T""" T""" T""" T""" T""" T""" T""" T""" T"""
Year
Peer Groups: • Medium-Sized Transit Systems • Small City Transit Systems

Peer Group: Medium-Sized Transit Systems
1976 1977
Transit Agency Value .35 .35
Peer Group Mean .53 .52 ......
Standard Score -.59 1.0 -.55 00
Peer Group: Small City Transit Systems
1976 1977
Transit Agency Value .35 .35
Peer Group Mean .49 .46
Standard Score -.58 -.50
Table 78. Cost Effectiveness Performance Profile
(Passenger Revenue/Total Operating Expense)
LUBBOCK
1978 1979 1980 1981 1982 1983
.39 .33 .33 .35 .43 .39
.45 .40 .38 .35 .36 .37
-.33 -.50 -.40 -.02 .85 .26
1978 1979 1980 1981 1982 1983
.39 .33 .33 .35 .43 .39
.39 .34 .34 .33 .34 .34
.01 -.04 -.01 .14 .61 .35
1984 1985 1986 1987 1988
.42 .48 .37 .37 .35
.39 .36 .31 .30 .27
.50 1.06 .52 .41 .57
1984 1985 1986 1987 1988
.42 .48 .37 .37 .35
.34 .31 .29 .28 .28
.59 1.32 .69 .79 .59

LUBBOCK Cost Effectiveness
(Passenger Revenue/Total Operating Expense)
3
2
Q) 10-
1 0 0
CJ)
"'0 0 10-
t-' ro \.0 "'0 \.0 C
ro -1 --
-.1---- --=-IIIr-CJ)
-2
-3 <D I'-0)
I'- co 0) 0 ~ C\J Ct) ~ to <D I'- co I'- I'- I'- co co co co co co co co co 0) 0) 0) 0) 0) 0) 0) 0) 0) 0) 0) 0)
~ ~ ~ ~ ~ ~ ~ ~ ~ ~ ~ ~ ~
Year
Peer Groups: • Medium-Sized Transit Systems • Small City Transit Systems

Table 79. Labor Efficiency Performance Profile
(Total Vehicle Hours/Average Number of Employees)
LUBBOCK
Peer Group: Medium-Sized Transit Systems
1976 1977 1978 1979 1980 1981 1982 1983 1984 1985 1986 1987 1988
Transit Agency Value .119 .125 .123 .115 .116 .107 .106 .106 .112 .108 .113 .120
Peer Group Mean .135 .136 .123 .115 .113 .110 .106 .103 .102 .097 .100 .098
N Standard Score -.35 -.37 .03 .00 .43 -1.26 -.04 .80 1.39 1.33 1.06 1.47 0 0
Peer Group: Small City Transit Systems
1976 1977 1978 1979 1980 1981 1982 1983 1984 1985 1986 1987 1988
Transit Agency Value .119 .125 .123 .115 .116 .107 .106 .106 .112 .108 .113 .120
Peer Group Mean .130 .139 .128 .124 .121 .128 .120 .121 .123 .121 .116 .119
Standard Score -.68 -.58 -.14 -.33 -.20 -.59 -.52 -.55 -.49 -.68 -.29 .10
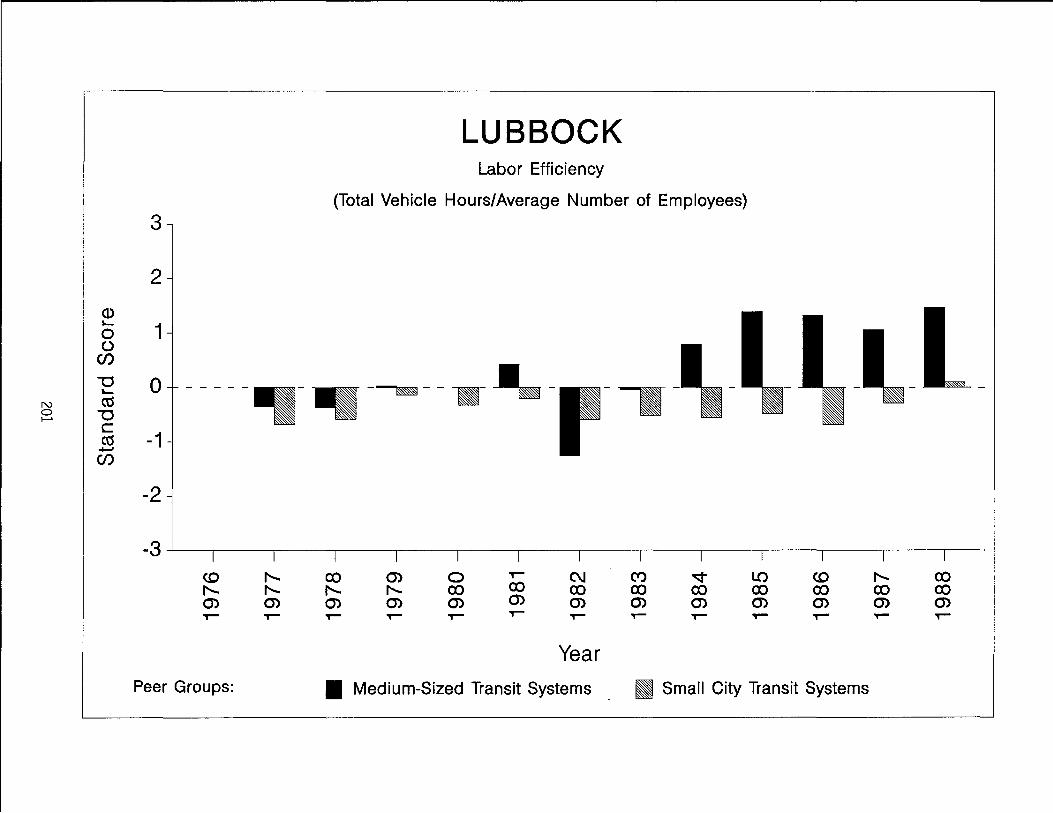
LUBBOCK Labor Efficiency
(Total Vehicle Hours/Average Number of Employees)
3
2
Q) .... 1 0
0 en "'0 0 ....
N a:s 0 "'0 ~ c
-1 a:s +-'
--.--.------.--.- ----~-en
-2
-3
"'"' co 0) 0 or- C\I C'*') .q- L() c:o "'"' co
"'"' "'"' "'"' co co co co co co co co co
0) 0) 0) 0) 0) 0) 0) 0) 0) 0) 0) 0) or- or- or- or- or- or- or- or- or- or- or- or-
Year Peer Groups: • Medium-Sized Transit Systems • Small City Transit Systems

Table 80. Vehicle Efficiency Performance Profile
(Total Vehicle Miles/Average Number of Buses on Regular Routes)
LUBBOCK
Peer Group: Medium-Sized Transit Systems
1976 1977 1978 1979 1980 1981 1982 1983 1984 1985 1986 1987 1988
Transit Agency Value 3.91 3.79 3.91 3.78 4.08 4.09 4.14 4.24 3.69 4.00 3.% 3.82
Peer Group Mean 453 452 4.62 452 4.47 4.39 4.25 4.27 4.20 4.41 4.83 4.62
N Standard Score -.66 -.72 -.61 -.63 -.38 -.34 -.18 -.07 -.98 -.65 -.91 -.92 C> N
Peer Group: Small City Transit Systems
1976 1977 1978 1979 1980 1981 1982 1983 1984 1985 1986 1987 1988
Transit Agency Value 3.91 3.79 3.91 3.78 4.08 4.09 4.14 4.24 3.69 4.00 3.96 3.82
Peer Group Mean 4.19 458 4.45 452 4.47 4.34 4.43 4.43 4.47 4.41 4.40 458
Standard Score -.33 -.96 -.53 -.94 -51 -.29 -.38 -.22 -.% -.73 -.77 -US

N o w
LUBBOCK Vehicle Efficiency
(Total Vehicle Miles/Average Number of Buses on Regular Routes) 3
2
Q)
(; 1 o
(f)
"0 ..... ctS
"0 c ctS +-' (f)
o -----p- 111-·- y--.-
-1
-2
-3~--~--~----~--~~--~----~--~----~----~--~----~----~--~---
f"- CO 0) 0 T""" C\J (Y) ~ LO <0 f"- CO f"- f"- f"- CO CO CO CO CO CO CO CO CO 0) 0) 0) 0) 0) 0) 0) 0) 0) 0) 0) 0) T""" T""" T""" T""" T""" T""" T""" T""" T""" T""" T""" T"""
Year Peer Groups: • Medium-Sized Transit Systems I] Small City Transit Systems


PORT ARTHUR
205


Table 8L Transit System Statistical Profile
PORT ARTHUR
1976 1977 1978 1979 1980 1981 1982 1983 1984 1985 1986 1987 1988
Total Passengers 150,986 280,542 292,595 278,529 273,886 307,164 342,664 317,788 307,694 269,614
Total Vehicle Miles 117,883 197,481 197,986 199,380 199,178 205,561 294,703 291,445 291,514 293,607
Total Vehicle Hours 8,432 14,336 14,266 14,337 14,261 14,714 21,043 20,675 20,666 20,811
Average No. Buses on Regular Routes 4 4 4 4 4 5 6 6 6 6
Average N 0
No. Employees 17 18 18 18 18 19 22 21 22 22
-....J
Total Operating Revenue ($) 29,531 76,387 %,806 110,776 106,6% 140,875 134,693 125,148 123,751 128,829
Passenger Revenue ($) 29,531 76,387 %,806 110,776 106,446 117,637 134,693 125,148 123,427 128,829
Total Operating Expense ($) 249,469 418,307 505,109 630,138 591,886 732,291 757,246 691,076 711,408 672,441
Net Public Operating Cost ($) 219,938 341,920 408,303 519,362 485,190 591,416 622,553 565,928 587,657 543,612
Total Public Capital Cost ($) 636,445 85,319 531,740 68,762 163,746 529,418 4,625
Total Public Expense ($) 856,383 427,239 408,303 519,362 1,016,930 660,178 786,299 1,095,346 592,282 543,612
Note: Port Arthur's Transit System began operation in 1979. Source: Texas Transit Statistics

Peer Group: SmaU Transit Systems
1976 1977
Transit Agency Value
Peer Group Mean .087 N a Standard Score CO
Peer Group: Small City Transit Systems
1976 1977
Transit Agency Value
Peer Group Mean .087
Standard Score
Table 82. Cost Efficiency Performance Profile
(Total Vehicle Hours/Total Operating Expense)
PORT ARTHUR
1978 1979 1980 1981 1982 1983
.034 .034 .028 .023 .024
.089 .066 .055 .048 .051 .045
-255 -1.95 -2.34 -151 -2.21
1978 1979 1980 1981 1982 1983
.034 .034 .028 .023 .024
.088 .066 .055 .048 .051 .045
-2.64 -2.01 -2.47 -158 -2.29
1984 1985 1986 1987 1988
.020 .028 .030 .029 .031
.041 .040 .039 .038 .037
-251 -1.98 -1.68 -1.75 -1.13
1984 1985 1986 1987 1988
.020 .028 .030 .029 .031
.042 .041 .039 .038 .037
-2.66 -2.00 -1.79 -1.86 -1.23
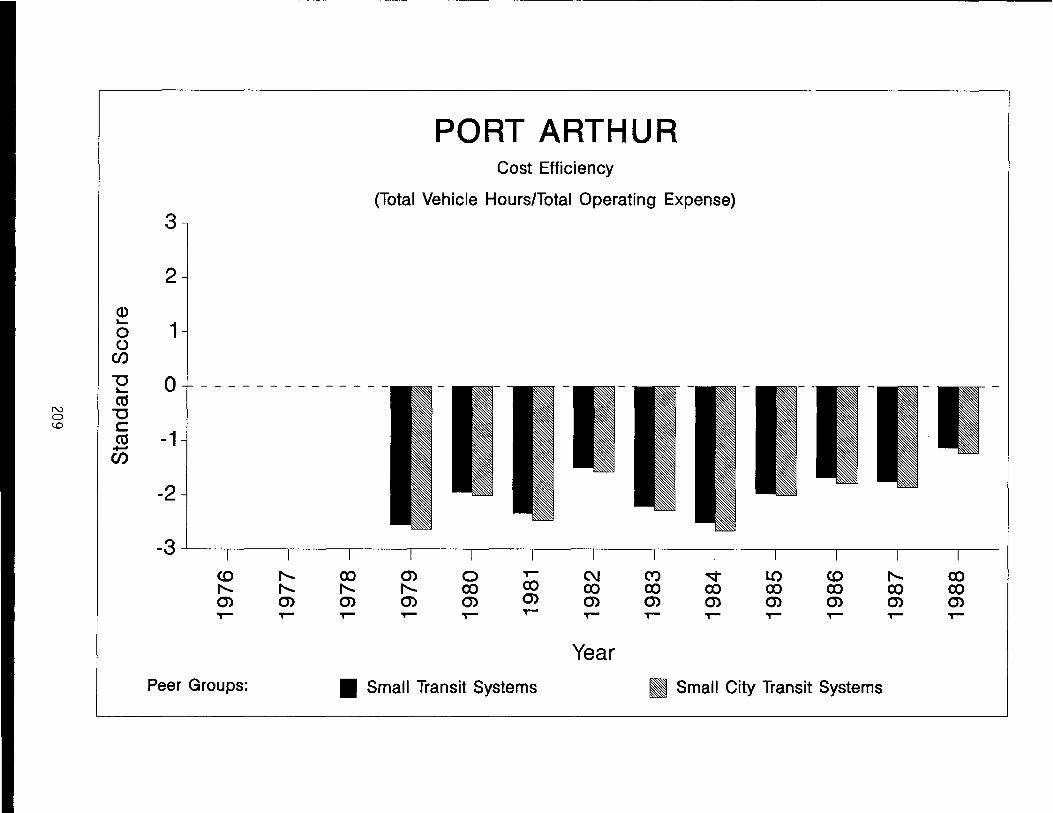
N o ~
3
2
CD o 1 o
(/)
o
-1
-2
PORT ARTHUR Cost Efficiency
(Total Vehicle Hours/Total Operating Expense)
-3~--~--~----~----~--~----~--~~--~----~--~----~----~--~---
<.0 f'.. (J) T"""
Peer Groups:
co f'.. (J) T"""
(J) f'.. (J) 'T"'""
o CO (J) T"""
T"""
CO (J) 'T"'""
• Small Transit Systems
C\J CO (J) 'T"'""
Year
C") CO (J) 'T"'""
LO co (J) 'T"'""
<.0 CO (J) T"""
• Small City Transit Systems
f'.. CO 0') 'T"'""
CO CO (J) 'T"'""

N I-' 0
Peer Group: Small Transit Systems
1976
Transit Agency Value
Peer Group Mean
Standard Score
Peer Group: Small City Transit Systems
Transit Agency Value
Peer Group Mean
Standard Score
1976
1977
19.20
1977
20.85
Table 83. Service Effectiveness Performance Profile (Total Passengers/Total Vehicle Hours)
1978
18.49
1978
19.69
PORT ARTHUR
1979
17.91
20.03
-.25
1979
17.91
21.05
-.36
1980
19.57
20.72
-.16
1980
19.57
22.20
-.32
1981
20.51
21.44
-.13
1981
20.51
23.10
-.30
1982
19.43
19.80
-.05
1982
19.43
22.06
-.26
1983
19.21
19.75
-.09
1983
19.21
20.55
-.21
1984
20.88
20.70
.02
1984
20.88
21.69
-.11
1985
16.28
19.66
-.46
1985
16.28
20.79
-.57
1986
15.37
19.82
-.59
1986
15.37
20.79
-.69
1987
14.89
19.34
-.54
1987
14.89
2023
-.64
1988
12.96
19.12
-.64
1988
12.96
20.02
-.74

3
2
Q)
o 1 o
(/)
o
-1
-2
PORT ARTHUR Service Effectiveness
(Total Passengers/Total Vehicle Hours)
- - - - - - - - - - - - - --= y- .- --~-
-3~--~--~----~----~--~----~--~----~----~--~----~----~--~---
<D I"- co 0) 0 ~ C\J Ct) ~ LO <D I"- co l"- I"- l"- I"- co co co co co co co co co 0) 0) 0) 0) 0) 0) 0) 0) 0) 0) 0) 0) 0) ~ ~ ~ ~ ~ ~ ~ ~ ~ ~ ~ ~ ~
Year Peer Groups: • Small Transit Systems • Small City Transit Systems

N ....... N
Peer Group: Small Transit Systems
1976
Transit Agency Value
Peer Group Mean 51
Standard Score
Peer Group: Small City Transit Systems
Transit Agency Value
Peer Group Mean
Standard Score
1976
.49
1977
.48
1977
.46
Table 84. Cost Effectiveness Performance Profile
(Passenger Revenue/Total Operating Expense)
1978
.39
1978
.39
PORT ARTHUR
1979
.12
.34
-1.49
1979
.12
.34
-157
1980
.18
.34
-.95
1980
.18
.34
-1.00
1981 1982
.19 .18
.33 .33
-.85 -1.09
1981 1982
.19 .18
.33 .34
-.91 -1.18
1983
.18
.33
-1.05
1983
.18
.34
-1.14
1984
.16
.33
-1.11
.16
.34
-1.20
1985
.18
.30
-1.00
1985
.18
.31
-1.08
1986
.18
.29
-.92
1986
.18
.29
-1.01
1987
.17
.27
-.84
1987
.17
.28
-.93
1988
.19
.27
-57
1988
.19
.28
-.64

N ~
W
PORT ARTHUR Cost Effectiveness
(Passenger Revenue/Total Operating Expense)
3
2
(])
o 1 ()
(f)
o
-1
-2
-3~--~--~----~----~--~----~--~----~----~--~----~----~--~---
<0 I'-.. 0') T"""
Peer Groups:
0') I'-.. 0') T"""
o ex) 0') T"""
• Small Transit Systems
C\J ex) 0') T"""
Year
('t') ex) 0') T"""
LO ex) 0') T"""
<0 ex) 0') T"""
• Small City Transit Systems
ex) ex) 0') T"""

.---~~~~~~~~~~-~~---------------------------~~~~~~~~~~~~~~~~~~~~~~~~~~~~~~~~~~~~--------
Peer Group: Small Transit Systems
1976
Transit Agency Value
Peer Group Mean
N Standard Score I--' +»
Peer Group: Small City Transit Systems
1976
Transit Agency Value
Peer Group Mean
Standard Score
Table 85. Labor Efficiency Performance Profile
(Total Vehicle Hours/Average Number of Employees)
1977 1978
.131 .140
1977 1978
.130 .139
PORT ARTHUR
1979
.050
.129
-2.07
1979
.050
.128
-2.17
1980
.080
.125
-1.61
1980
.080
.124
-1.65
1981
.079
.122
-1.57
1981
.079
.121
-1.63
1982
.080
.131
-1.34
1982
.080
.128
-1.32
1983
.079
.122
-1.48
1983
.079
.120
-1.49
1984
.077
.123
-1.62
1984
.077
.121
-1.62
1985
.096
.124
-1.21
1985
.096
.123
-1.21
1986
.098
.122
-1.22
1986
.098
.121
-1.18
1987
.094
.116
-1.97
1987
.094
.116
-2.03
1988
.095
.119
-2.05
1988
.095
.119
-2.17

3
2
Q)
o 1 o
Cf)
o
-1
-2
-------------------
PORT ARTHUR Labor Efficiency
(Total Vehicle Hours/Average Number of Employees)
-3~--~--~----~----~--~----~--~~--~----~--~----~----~--~---
co f'.. 0'> T"""
Peer Groups:
co f'.. 0'> T"""
0'> f'.. 0'> T"""
o co 0'> T"""
T"""
co 0'> T"""
• Small Transit Systems
C\J co 0'> T"""
Year
Ct) co 0'> T"""
~ co 0'> T"""
LO co 0'> T"""
co co 0'> T"""
• Small City Transit Systems
f'.. co 0'> T"""
co co 0'> T"""

N t--' 0"1
Peer Group: Small Transit Systems
1976
Transit Agency Value
Peer Group Mean
Standard Score
Peer Group: Small City Transit Systems
Transit Agency Value
Peer Group Mean
Standard Score
1976
Table 86. Vehicle Efficiency Performance Profile
(Total Vehicle Miles/Average Number of Buses on Regular Routes)
1977 1978
4.22 4.66
1977 1978
4.19 458
PORT ARTHUR
1979
2.95
451
-1.48
1979
2.95
4.45
-1.48
1980
4.94
459
.44
1980
4.94
452
.53
1981
4.95
451
55
1981
4.95
4.47
.62
1982
4.98
4.37
.67
1982
4.98
4.34
.73
1983
4.98
4.46
.63
1983
4.98
4.43
.70
1984
4.11
4.45
-.38
1984
4.11
4.43
-.37
1985
4.91
454
.45
1985
4.91
4.47
55
1986
4.86
4.45
.70
1986
4.86
4.41
.79
1987 1988
4.86 4.89
4.44 4.65
.71 .38
1987 1988
4.86 4.89
4.40 458
.81 .48

PORT ARTHUR Vehicle Efficiency
(Total Vehicle Miles/Average Number of Buses on Regular Routes)
3
2
1
o ---.,- -----1
-2
-3~--~--~----~----~--~----~--~----~----~--~----~----~--~---
<.0 r-.... co 0> 0 ~ C\J Ct) ~ LO <.0 r-.... co r-.... r-.... r-.... r-.... co co co co co co co co co 0> 0> 0> 0> 0> 0> 0> 0> 0> 0> 0> 0> 0> ~ ~ ~ ~ ~ ~ ~ ~ ~ ~ ~ ~ ~
Year Peer Groups: • Small Transit Systems • Small City Transit Systems


SAN ANGELO
219

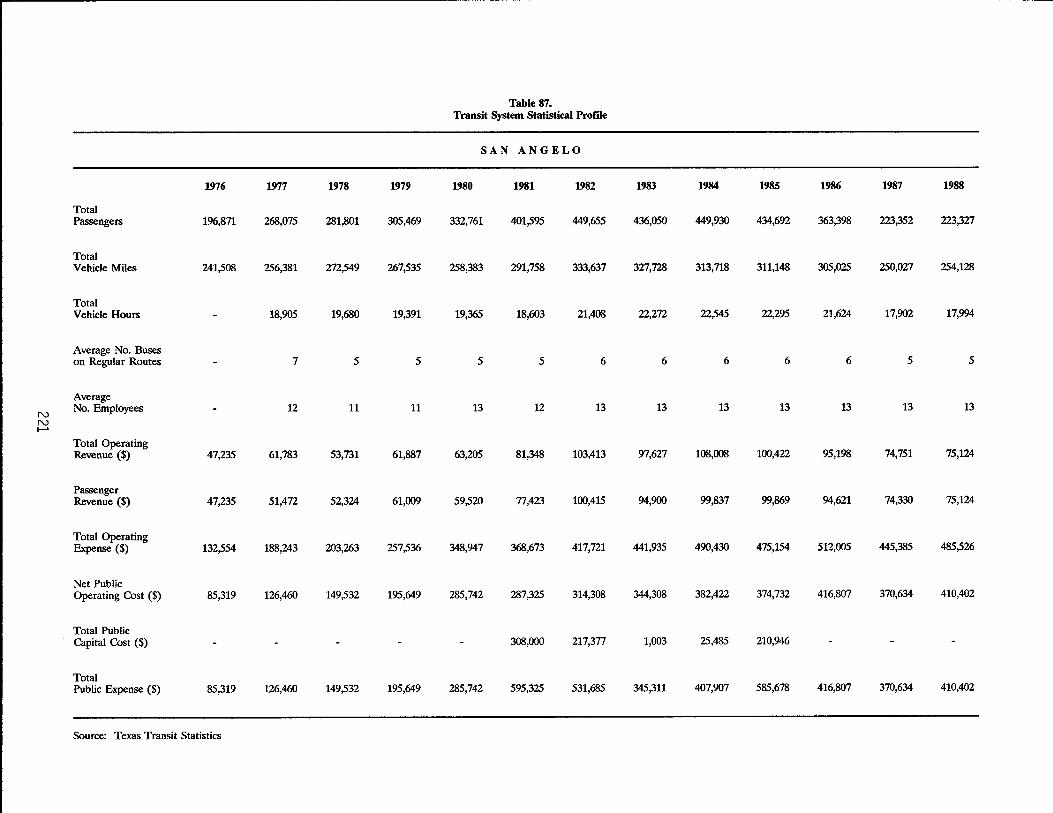
Table 87. Transit System Statistical Prorde
SAN ANGELO
1976 1977 1978 1979 1980 1981 1982 1983 1984 1985 1986 1987 1988
Total Passengers 196,871 268,075 281,801 305,469 332,761 401,595 449,655 436,050 449,930 434,692 363,398 223,352 223,327
Total Vehicle Miles 241,508 256,381 272,549 267,535 258,383 291,758 333,637 327,728 313,718 311,148 305,025 250,027 254,128
Total Vehicle Hours 18,905 19,680 19,391 19,365 18,603 21,408 22,272 22,545 22,295 21,624 17,902 17,994
Average No. Buses on Regular Routes 7 5 5 5 5 6 6 6 6 6 5 5
Average
N No. Employees 12 11 11 13 12 13 13 13 13 13 13 13
N ~
Total Operating Revenue ($) 47,235 61,783 53,731 61,887 63,205 81,348 103,413 97,627 108,008 100,422 95,198 74,751 75,124
Passenger Revenue ($) 47,235 51,472 52,324 61,009 59,520 77,423 100,415 94,900 99,837 99,869 94,621 74,330 75,124
Total Operating Expense ($) 132,554 188,243 203,263 257,536 348,947 368,673 417,721 441,935 490,430 475,154 512,005 445,385 485,526
Net Public Operating Cost ($) 85,319 126,460 149,532 195,649 285,742 287,325 314,308 344,308 382,422 374,732 416,807 370,634 410,402
Total Public Capital Cost ($) 308,000 217,377 1,003 25,485 210,946
Total Public Expense ($) 85,319 126,460 149,532 195,649 285,742 595,325 531,685 345,311 407,907 585,678 416,807 370,634 410,402
Source: Texas Transit Statistics

Peer Group: Small Transit Systems
1976 1977
Transit Agency Value .100
Peer Group Mean .087 N N Standard Score .85 N
Peer Group: Small City Transit Systems
1976 1977
Transit Agency Value .100
Peer Group Mean .087
Standard Score .90
Table 88. Cost Efficiency Performance Profile
(Total Vehicle Hours/Total Operating Expense)
SAN ANGELO
1978 1979 1980 1981 1982 1983
JJ97 .075 .055 .050 .051 .050
.089 .066 .055 .048 .051 .045
.33 .69 .02 .29 .00 58
1978 1979 1980 1981 1982 1983
.097 .075 .055 .050 .051 .050
.088 .066 .055 .048 .051 .045
.40 .75 .05 .31 .01 .64
1984 1985 1986 1987 1988
.046 .047 .042 .040 .037
.041 .040 .039 .038 .037
55 1.07 .64 .54 .08
1984 1985 1986 1987 1988
.046 .047 .042 .040 .037
.042 .041 .039 .038 .037
.54 .88 .65 .49 .01
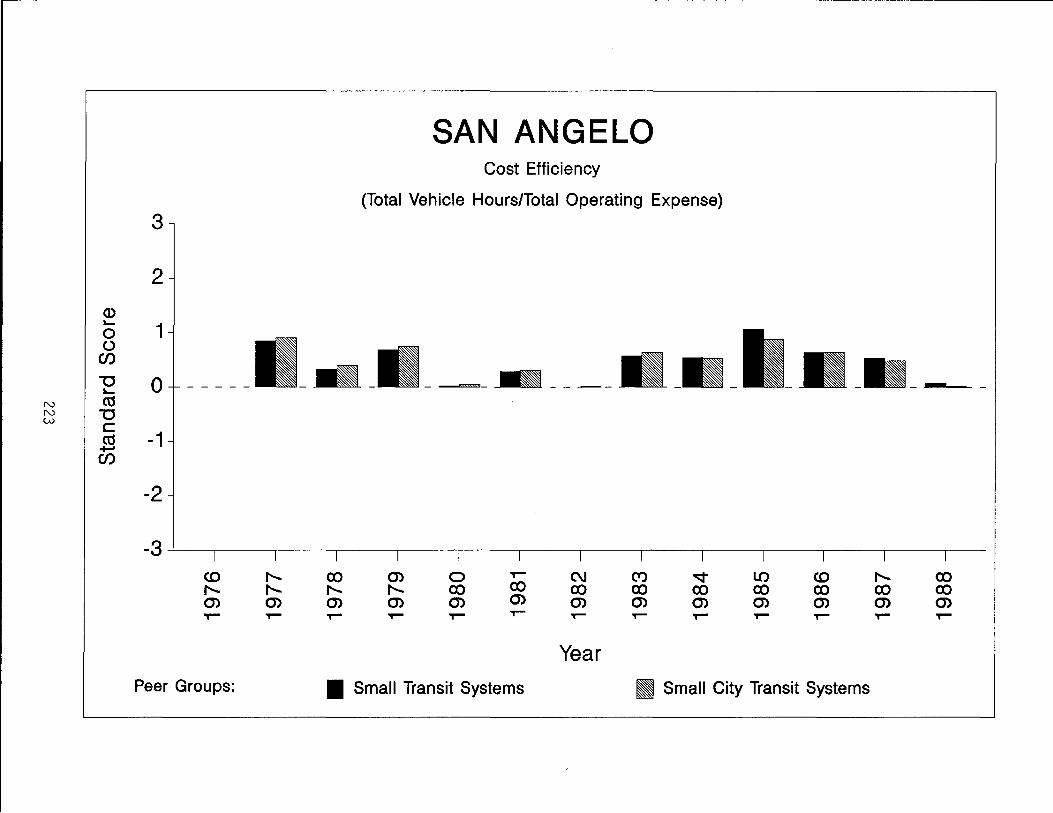
SAN ANGELO Cost Efficiency
(Total Vehicle HourslTotal Operating Expense) 3
2
Q) ~
1 0 ()
en u 0 - - - - - ---- ------~
N ro N u W c
ro -1 ...... en
-2
-3 <.0 f'... co m 0 ,-- C\J (Y) ~ LO c:o f'... co f'... f'... f'... f'... co co co co co co co co co m m m m m m m m m m m m m ,-- ,-- ,-- ,-- ,-- ,-- ,-- ,-- ,-- ,-- ,-- ,-- ,--
Year Peer Groups: • Small Transit Systems • Small City Transit Systems
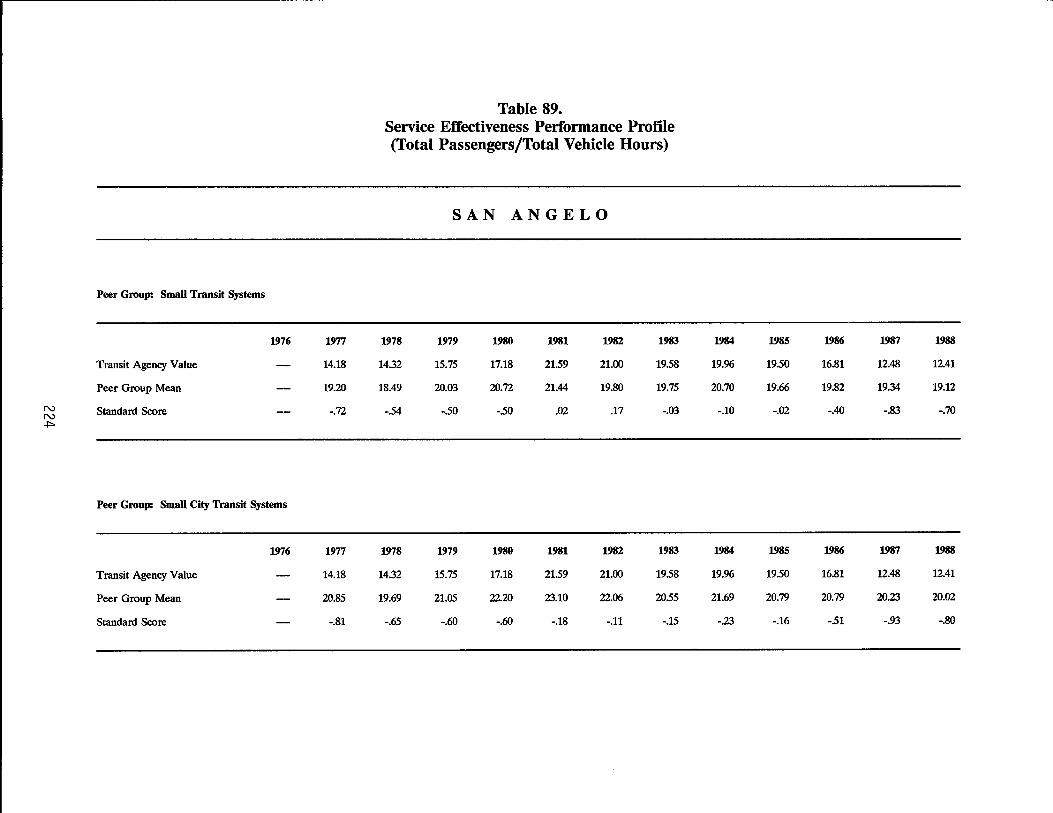
Peer Group: Small Transit Systems
1976
Transit Agency Value
Peer Group Mean
N Standard Score N .p.
Peer Group: Small City Transit Systems
1976
Transit Agency Value
Peer Group Mean
Standard Score
1977
14.18
19.20
-.72
1977
14.18
20.85
-.81
Table 89. Service Effectiveness Performance Profile (Total Passengers/Total Vehicle Hours)
1978
14.32
18.49
-54
1978
14.32
19.69
-.65
SAN ANGELO
1979
15.75
20.03
-50
1979
15.75
21.05
-.60
1980
17.18
20.72
-50
1980
17.18
22.20
-.60
1981
2159
21.44
.02
1981
2159
23.10
-.18
1982
21.00
19.80
.17
1982
21.00
22.06
-.11
1983
1958
19.75
-.03
1983
1958
2055
-.15
1984
19.96
20.70
-.10
1984
19.%
21.69
-.23
1985
1950
19.66
-.02
1985
1950
20.79
-.16
1986
16.81
19.82
-.40
1986
16.81
20.79
-51
1987
12.48
19.34
-.83
1987
12.48
20.23
-.93
1988
12.41
19.12
-.70
1988
12.41
20.02
-.80

3
2
Q) I-
1 0 0
(J)
"'0 0 - - - - -~
~ N "'0 N U1 C
~ -1 +-' (J)
-2
-3 <.0 f'.. f'.. f'.. (j) (j) T""" T"""
Peer Groups:
co f'.. (j) T"""
SAN ANGELO Service Effectiveness
(Total Passengers/Total Vehicle Hours)
.- - - -~=- --. - ----,a= .. -
(j) f'.. (j) T"""
o co (j) T"""
T"""
co (j) T"""
C\J co 0') T"""
Year
(t) co (j) T"""
-qco (j) T"""
LO co (j) T"""
<.0 co (j) T"""
• Small Transit Systems • Small City Transit Systems
f'.. co (j) T"""
co co (j) T"""

Peer Group: Small Transit Systems
1976
Transit Agency Value .36
Peer Group Mean 51
N Standard Score -58 N 0'>
Peer Group: Small City Transit Systems
1976
Transit Agency Value .36
Peer Group Mean .49
Standard Score -54
------------------------------------------------------------------------------------------------
1977
.27
.48
-.85
1977
.27
.46
-.84
Table 90. Cost Effectiveness Performance Profile
(Passenger Revenue/Total Operating Expense)
SAN ANGELO
1978 1979 1980 1981 1982 1983
.26 .24 .17 .21 .24 .21
.39 .34 .34 .33 .33 .33
-.92 -.68 -1.03 -.73 -.64 -.81
1978 1979 1980 1981 1982 1983
.26 .24 .17 .21 .24 .21
.39 .34 .34 .33 .34 .34
-.97 -.72 -1.08 -.78 -.72 -.88
1984 1985 1986 1987 1988
.20 .21 .18 .17 .15
.33 .30 .29 .27 .27
-.82 -.73 -.89 -.90 -.84
1984 1985 1986 1987 1988
.20 .21 .18 .17 .15
.34 .31 .29 .28 .28
-.91 -.82 -.98 -.99 -.92

SAN ANGELO Cost Effectiveness
(Passenger RevenuelTotal Operating Expense)
3
2
Q) ~
1 0 0
CJ)
"'0 0 ~
N ro N "'0 '-I C
ro -1 +-' CJ)
-2
-3 <0 f'-... co 0> 0 ,- C\J Ct) oq- LO <0 f'-... co f'-... f'-... f'-... f'-... co co co co co co co co co 0> 0> 0> 0> 0> 0> 0> 0> 0> 0> 0> 0> 0> ,- ,- ,- ,- ,- ,- ,- ,- ,- ,- ,- ,- ,-
Year Peer Groups: • Small Transit Systems II Small City Transit Systems
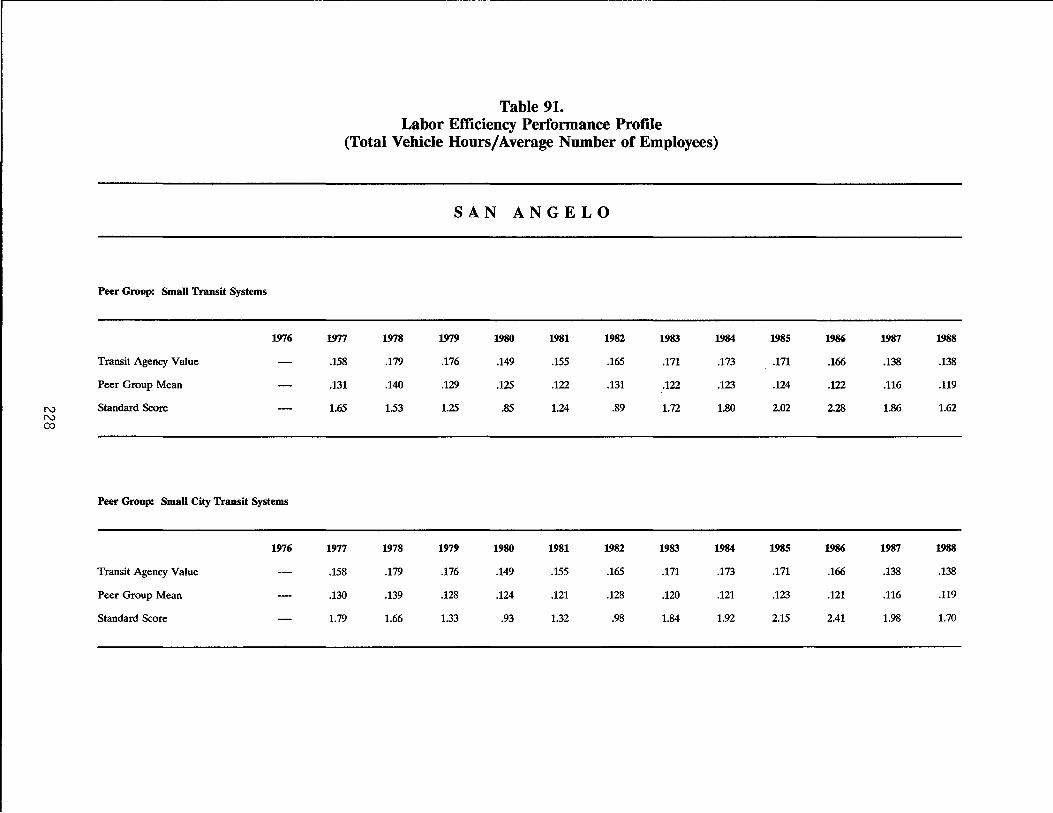
Table 91. Labor Efficiency Performance Profile
(Total Vehicle Hours/Average Number of Employees)
SAN ANGELO
Peer Group: Small Transit Systems
1976 1977 1978 1979 1980 1981 1982 1983 1984 1985 1986 1987 1988
Transit Agency Value .158 .179 .176 .149 .155 .165 .171 .173 .171 .166 .138 .138
Peer Group Mean .131 .140 .129 .125 .122 .131 .122 .123 .124 .122 .116 .119
N Standard Score 1.65 153 1.25 .85 1.24 .89 1.72 1.80 2.02 2.28 1.86 1.62 N CO
Peer Group: Small City Transit Systems
1976 1977 1978 1979 1980 1981 1982 1983 1984 1985 1986 1987 1988
Transit Agency Value .158 .179 .176 .149 .155 .165 .171 .173 .171 .166 .138 .138
Peer Group Mean .130 .139 .128 .124 .121 .128 .120 .121 .123 .121 .116 .119
Standard Score 1.79 1.66 1.33 .93 1.32 .98 1.84 1.92 2.15 2.41 1.98 1.70
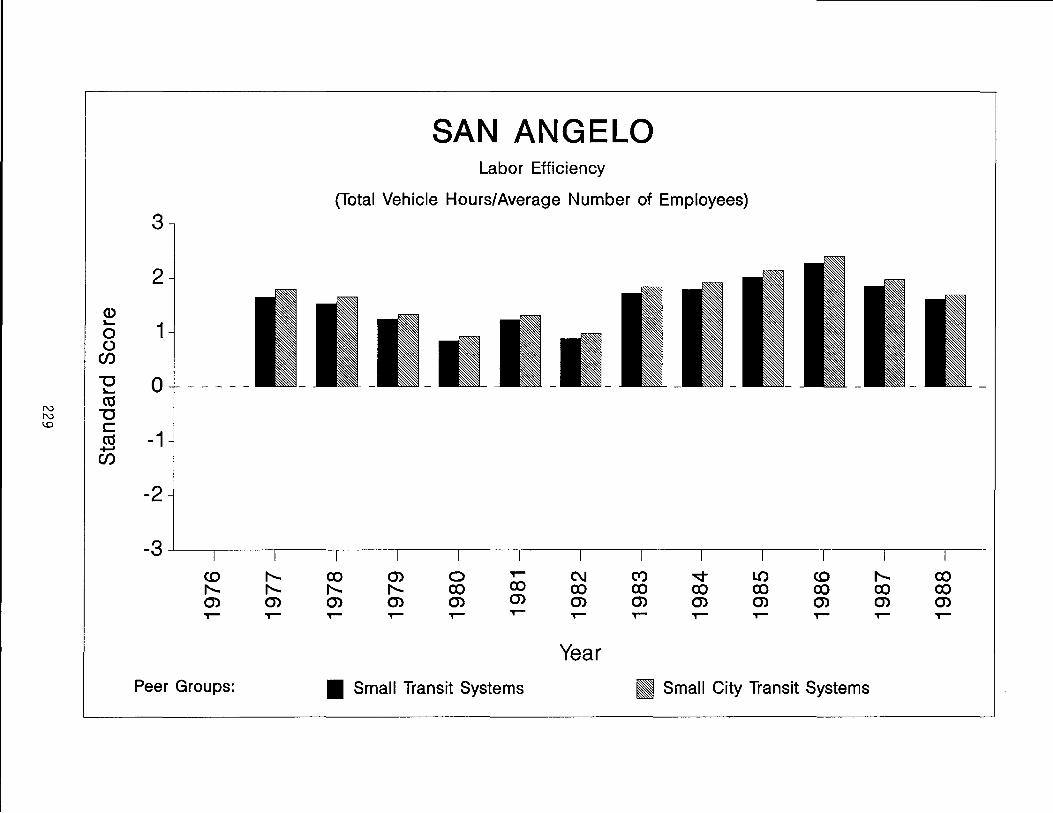
SAN ANGELO Labor Efficiency
(Total Vehicle Hours/Average Number of Employees)
3
2
Q) L...
1 0 0
(J)
u 0 - - - - -L...
N ~
N U 1.0 C
~ -1 ...... if)
-2
-3 CD f'... ex> 0) 0 ,- C\J Ct) -q- LO CD f'... ex> f'... f'... f'... f'... ex> ex> ex> ex> ex> ex> ex> ex> ex> 0) 0) 0) 0) 0) 0) 0) 0) 0) 0) 0) 0) 0) T""" T""" ,- ,- T"""
,- ,- ,- ,- ,- T""" ,- ,-
Year Peer Groups: • Small Transit Systems • Small City Transit Systems

Table 92. Vehicle Efficiency Performance Profile
(Total Vehicle Miles/Average Number of Buses on Regular Routes)
SAN ANGELO
Peer Group: Small Transit Systems
1976 1977 1978 1979 1980 1981 1982 1983 1984 1985 1986 1987 1988
Transit Agency Value 3.66 5.45 5.35 5.17 5.84 556 5.46 5.23 5.19 5.08 5.00 5.08
Peer Group Mean 4.22 4.66 451 4.59 451 4.37 4.46 4.45 454 4.45 4.44 4.65
N Standard Score -.63 .96 .80 .73 1.65 1.29 1.22 .85 .79 1.09 .96 .67 w 0
Peer Group: Small City Transit Systems
1976 1977 1978 1979 1980 1981 1982 1983 1984 1985 1986 1987 1988
Transit Agency Value 3.66 5.45 5.35 5.17 5.84 556 5.46 5.23 5.19 5.08 5.00 5.08
Peer Group Mean 4.19 458 4.45 452 4.47 4.34 4.43 4.43 4.47 4.41 4.40 458
Standard Score -.62 1.07 .88 .82 1.76 1.38 1.31 .92 .89 1.19 1.05 .77

SAN ANGELO Vehicle Efficiency
(Total Vehicle Miles/Average Number of Buses on Regular Routes)
3
2
Q) ..... 1 0
0 (/)
"'0 0 - - - - -..... N as w "'0 - c
as -1 ...... (/)
-2
-3 <.0 f'.. co 0) 0 T""" C\I C'I') ..q LO <.0 f'.. co f'.. f'.. f'.. f'.. co co co co co co co co co 0) 0) 0) 0) 0) 0) 0) 0) 0) 0) 0) 0) 0) T""" T""" T""" T""" T""" T""" T""" T""" T""" T""" T""" T""" T"""
Year Peer Groups: • Small Transit Systems • Small City Transit Systems


SAN ANTONIO
233


Table 93. Transit System Statistical Profile
SAN ANTONIO
1976 1977 1978 1979 1980 1981 1982 1983 1984 1985 1986 1987 1988
Total Passengers 27,515,172 28,078,283 31,371,380 35,800,138 37,899,279 36,788,542 36,911,551 36,990,033 39,086,908 38,307,252 36,305,407 35,450,377 39,926,434
Total Vehicle Miles 7,364,024 8,466,719 13,563,610 14,278,936 14,653,420 14,782,313 15,209,471 15,419,202 16,579,025 16,709,482 18,028,321 18,463,972 20,040,468
Total Vehicle Hours 562,520 1,002,097 1,028,497 1,040,939 1,054,851 1,071,541 1,089,272 1,152,679 1,148,254 1,247,834 1,263,508 1,356,766
Average No. Buses on Regular Routes 258 262 346 370 413 442 423 448 446 455 462 490 470
Average N No. Employees 608 605 808 886 931 981 972 928 1,002 1,025 1,078 1,161 1,251 w Ul
Total Operating Revenue ($) 6,204,876 8,836,538 7,311,834 7,3%,186 9,528,767 13,882,419 14,555,6% 13,976,654 16,889,902 17,504,418 18,524,114 17,989,745 20,310,679
Passenger Revenue ($) 5,998,402 6,145,480 6,498,663 7,174,878 8,934,799 11,240,609 11,429,533 11,217,756 11,936,879 12,294,750 12,457,402 11,798,831 12,748,540
Total Operating Expense ($) 9,976,603 11,254,343 18,348,113 22,414,414 24,529,753 30,237,565 31,432,322 33,180,696 35,180,650 37,709,789 38,099,101 41,617,137 44,008,523
Net Public Operating Cost ($) 3,771,727 2,417,805 10,036,279 15,018,228 15,000,986 16,355,146 16,876,626 19,204,042 18,290,748 20,205,371 19,574,987 23,627,392 23,697,844
Total Public Capital Cost ($) 4,539,527 1,730,703 18,556,180 1,239,138 571,705 3,925,498 17,090,589 5,222,503 10,166,385 11,283,944 6,471,717
Total Public Expense ($) 3,771,727 2,417,805 15,575,806 16,748,931 33,557,166 17,594,284 17,448,331 23,129,540 35,381,337 25,427,874 29,741,372 34,911,336 30,169,561
Source: Texas Transit Statistics and Via Metropolitan Transit Authority

N w 0'1
Peer Group: Large Transit Systems
1976
Transit Agency Value
Peer Group Mean
Standard Score
Peer Group: Large City Transit Systems
Transit Agency Value
Peer Group Mean
Standard Score
1976
1977
.050
.051
-.26
1977
.050
.069
-.47
Table 94. Cost Efficiency Performance Profile
(Total Vehicle Hours/Total Operating Expense)
1978
.055
.052
.26
1978
.055
.060
-.26
SAN ANTONIO
1979
.046
.043
.29
1979
.046
.047
-.10
1980
.042
.036
.61
1980
.042
.039
.37
1981
.035
.030
53
1981
.035
.033
.22
1982
.034
.029
.62
1982
.034
.031
.50
1983
.033
.028
.68
1983
.033
.031
.30
1984
.033
.026
1.09
1984
.033
.029
55
1985
.030
.024
1.05
1985
.030
.026
.85
1986
.033
.021
1.47
1986
.033
.024
1.33
1987
.030
.022
1.46
1987
.030
.023
1.55
1988
.031
.022
1.36
1988
.031
.022
1.63

SAN ANTONIO Cost Efficiency
(Total Vehicle Hours/Total Operating Expense)
3
2
Q) L...
1 0 ()
(J)
1J 0 L...
N ctS w 1J ...... c:
ctS -1 +oJ
-I. _____ • ________ k L _
(J)
-2
-3 co f'... ex) m 0 T""" C\J ('tj ...q LO co f'... ex) f'... f'... f'... f'... ex) ex) ex) ex) ex) ex) ex) ex) ex) m m m m m m m m m m m m m T""" T""" T""" T""" T""" T""" T""" T""" T""" T""" T""" T""" T"""
Year Peer Groups: • Large Transit Systems • Large City Transit Systems

N w OJ
Peer Group: Large Transit Systems
1976
Transit Agency Value
Peer Group Mean
Standard Score
Peer Group: Large City Transit Systems
Transit Agency Value
Peer Group Mean
Standard Score
1976
1977
49.92
38.30
1.48
1977
49.92
30.94
1.76
Table 95. Service Effectiveness Performance Profile (Total Passengers/Total Vehicle Hours)
1978
31.31
30.76
.17
1978
31.31
26.16
.83
SAN ANTONIO
1979
34.81
30.99
.79
1979
34.81
27.54
1.21
1980
36.41
31.83
.85
1980
36.41
28.78
1.21
1981
34.88
30.67
.77
1981
34.88
27.49
1.09
1982
34.45
29.44
.78
1982
34.45
25.65
1.21
1983
33.96
28.34
.81
1983
33.%
25.18
1.14
1984
33.91
29.18
.69
1984
33.91
25.99
1.01
1985
33.36
27.87
.85
1985
33.36
25.35
1.07
1986
29.09
25.23
.62
1986
29.09
23.02
.81
1987
28.06
24.43
.45
1987
28.06
23.39
.57
1988
29.43
25.%
.49
1988
29.43
24.54
.62
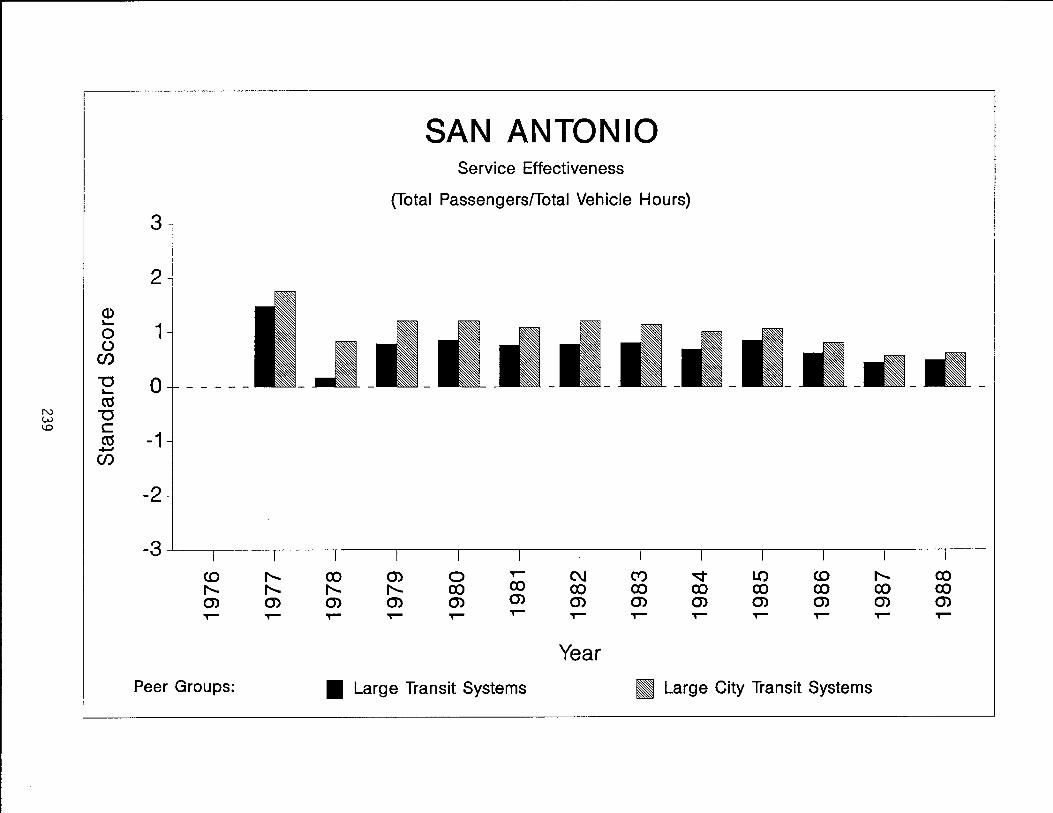
SAN ANTONIO Service Effectiveness
(Total Passengers/Total Vehicle Hours)
3
2
Q) ~
1 0 0
--'-en _atl_ "'0 0 - - - - -~
ct1 N "'0 w \.0 C
ct1 -1 +-' en
-2
-3 <0 f'... ex:> 0) 0 ~ C\I (Y) ..q LO <0 f'... ex:> f'... f'... f'... f'... ex:> ex:> ex:> ex:> ex:> co co ex:> co 0) 0) 0) 0) 0) 0) 0) 0) 0) 0) 0) 0) 0) ~ ~ ~ ~ ~ ~ ~ ~ ~ ~ ~ ~ ~
Year
Peer Groups: • Large Transit Systems til Large City Transit Systems

Peer Group: Large Transit Systems
1976 1977
Transit Agency Value .60 .55
Peer Group Mean .52 .49
N ~
Standard Score .57 .44 0
Peer Group: Large City Transit Systems
1976 1977
Transit Agency Value .60 .55
Peer Group Mean .55 .53
Standard Score .22 .08
Table 96. Cost Effectiveness Performance Profile
(Farebox Revenue/Total Operating Expense)
SAN ANTONIO
1978 1979 1980 1981 1982 1983
.35 .32 .36 .37 .36 .34
.40 .37 .36 .36 .35 .33
-.29 -.30 .03 .09 .09 .07
1978 1979 1980 1981 1982 1983
.35 .32 .36 .37 .36 .34
.43 .39 .37 .36 .34 .34
-.44 -.47 -.08 .13 .16 -.04
1984 1985 1986 1987 1988
.34 .33 .33 .28 .29
.28 .26 .22 .21 .22
1.37 1.35 1.05 .81 .78
1984 1985 1986 1987 1988
.34 .33 .33 .28 .29
.32 .28 .25 .24 .23
.24 .58 .69 .34 .51
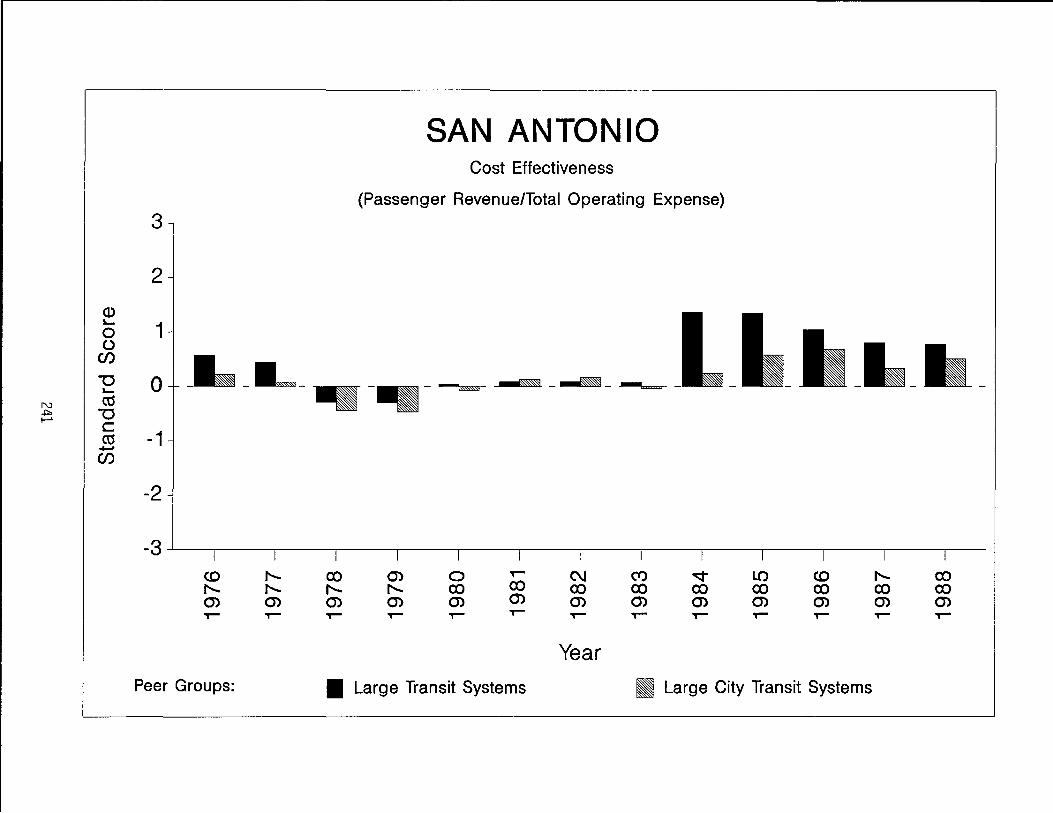
SAN ANTONIO Cost Effectiveness
(Passenger RevenuelTotal Operating Expense) 3
2
Q)
_L_ ....
1 0 () _L_ (/)
L_L_-._._ -0 0 ~ ®Wl - ~ -.... N ro .j:::> '"0 I--'
C ro -1 +-' (/)
-2
-3 (0 f'-... co 0> 0 ,-- C\I Ct) ~ L() (0 f'-... co f'-... f'-... f'-... f'-... co co co co co co co co co 0> 0> 0> 0> 0> 0> 0> 0> 0> 0> 0> 0> 0> ,-- ,.- ,-- ,-- ,.- ,-- ,-- ,.- ,-- ,-- ,-- ,-- ,--
Year Peer Groups: • Large Transit Systems • Large City Transit Systems

N .j:>, N
Peer Group: Large Transit Systems
1976
Transit Agency Value
Peer Group Mean
Standard Score
Peer Group: Large City Transit Systems
Transit Agency Value
Peer Group Mean
Standard Score
1976
Table 97. Labor Efficiency Performance Profile
(Total Vehicle Hours/Average Number of Employees)
1977
.093
.102
-1.28
1977
.093
.118
-.68
1978
.124
.116
1.01
1978
.124
.126
-.08
SAN ANTONIO
1979
.116
.112
.32
1979
.116
.117
-.05
1980
.112
.106
.37
1980
.112
.110
.14
1981
.108
.105
.22
1981
.108
.108
-.05
1982
.110
.104
.60
1982
.110
.107
.35
1983
.117
.104
1.27
1983
.117
.105
1.27
1984
.115
.101
1.23
1984
.115
.102
1.62
1985
.112
.098
lAO
1985
.112
.098
1.87
1986
.116
.100
.66
1986
.116
.097
1.08
1987
.109
.104
.21
1987
.109
.101
.49
1988
.108
.109
-.03
1988
.108
.101
.40

3
2
<D L...
1 0 0 en u 0 - - - - -L... aj
N "0 ~ w C
aj -1 +-' en
-2
-3 <.0 f'.. f'.. f'.. Q) Q) T""" T"""
Peer Groups:
SAN ANTONIO Labor Efficiency
(Total Vehicle Hours/Average Number of Employees)
co f'.. Q) T"""
Q) f'.. Q) T"""
o co Q) T"""
T"""
co Q) T"""
C'\I co Q) T"""
Year
('t) co Q) T"""
oo::t co Q) T"""
LO co Q) T"""
<.0 co Q) T"""
_.1 ___ -
f'.. co Q) T"""
co co Q) T"""
• Large Transit Systems • Large City Transit Systems
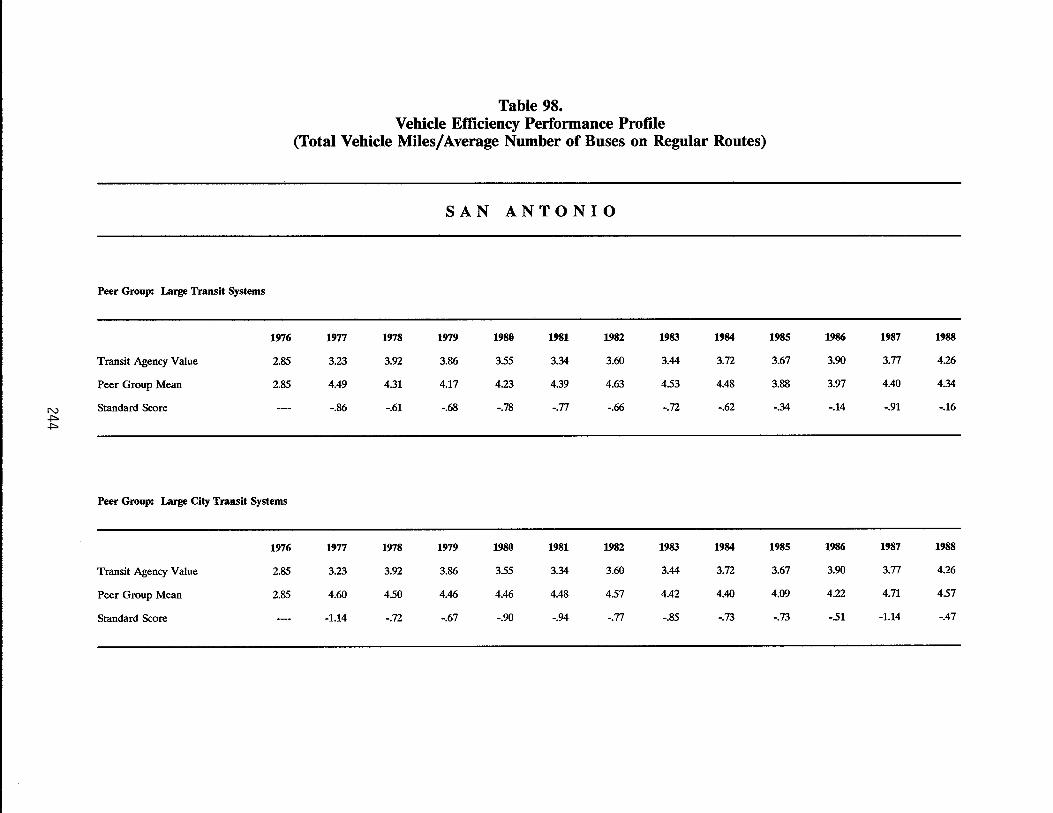
Table 98. Vehicle Efficiency Performance Profile
(Total Vehicle Miles/Average Number of Buses on Regular Routes)
SAN ANTONIO
Peer Group: Large Transit Systems
1976 1977 1978 1979 1980 1981 1982 1983 1984 1985 1986 1987 1988
Transit Agency Value 2.85 3.23 3.92 3.86 3.55 3.34 3.60 3.44 3.72 3.67 3.90 3.77 4.26
Peer Group Mean 2.85 4.49 4.31 4.17 4.23 4.39 4.63 4.53 4.48 3.88 3.97 4.40 4.34
N Standard Score -.86 -.61 -.68 -.78 -.77 -.66 -.72 -.62 -.34 -.14 -.91 -.16 +=> +=>
Peer Group: Large City Transit Systems
1976 1977 1978 1979 1980 1981 1982 1983 1984 1985 1986 1987 1988
Transit Agency Value 2.85 3.23 3.92 3.86 3.55 3.34 3.60 3.44 3.72 3.67 3.90 3.77 4.26
Peer Group Mean 2.85 4.60 4.50 4.46 4.46 4.48 4.57 4.42 4.40 4.09 4.22 4.71 4.57
Standard Score -1.14 -.72 -.67 -.90 -.94 -.77 -.85 -.73 -.73 -.51 -1.14 -.47
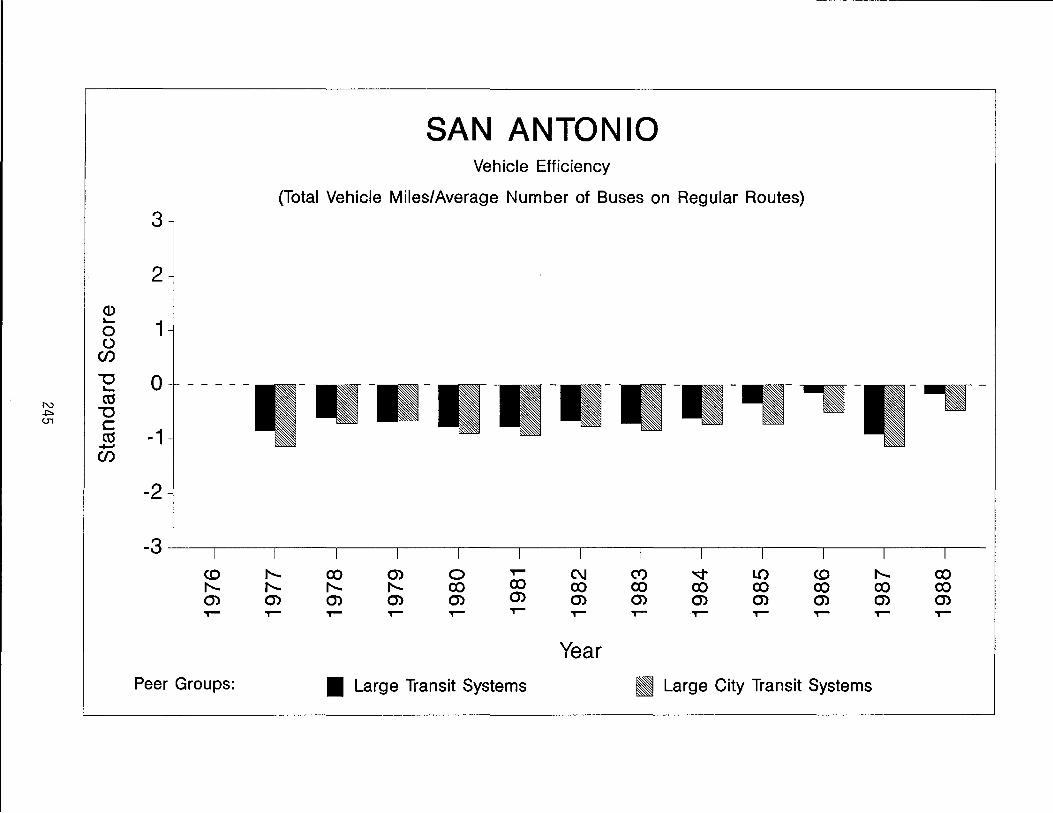
3
2
CD ~
1 0 ()
Cf)
"'0 0 - - - - -~
N Cd ~ "'0 U1 c
Cd -1 +-' Cf)
-2
-3 <.0 f'... (j) ~
Peer Groups:
SAN ANTONIO Vehicle Efficiency
(Total Vehicle Miles/Average Number of Buses on Regular Routes)
f'... f'... (j) ~
co f'... (j) ~
o co (j) ~
~
co (j) ~
• Large Transit Systems
C\I co (j) ~
Year
- .. -,-
LO co (j) ~
<.0 co (j) ~
• Large City Transit Systems
--.--
co co (j) ~


WACO
247


Table 99. Transit System Statistical Profile
WACO
1976 11)77 11)78 11)71) 11)80 11)81 11)82 11)83 11)84 11)85 11)86 11)87 11)88
Total Passengers 714,974 650,679 566,372 593,847 636,234 627,385 585,142 581,202 599,682 609,746 621,566 613,537 610,347
Total Vehicle Miles 480,395 458,389 482,161 474,214 476,287 441,357 347,476 350,848 351,248 350,085 347,022 335,859 331,411
Total Vehicle Hours 34,273 39,140 37,973 38,805 35,947 30,006 30,232 30,025 29,785 29,438 27,921 27,905
Average No. Buses on Regular Routes 11 13 14 13 13 10 10 10 10 10 10 9
N Average ~ No. Employees 32 35 33 35 32 30 30 29 30 28 26 24 1..0
Total Operating Revenue ($) 245,383 213,809 196,818 213,335 264,977 218,421 254,777 234,683 225,482 250,475 217,789 204,736 197,429
Passenger Revenue ($) 244,460 208,583 195,377 213,335 264,977 218,421 228,722 234,683 225,482 224,581 217,789 204,736 197,429
Total Operating Expense ($) 403,716 548,708 556,414 684,893 723,604 797,472 792,293 829,871 848,310 944,617 849,560 843,723 846,919
Net Public Operating Cost ($) 158,333 334,899 359,596 471,558 458,627 579,051 537,516 595,188 622,828 694,142 631,771 638,987 649,490
Total Public Capital Cost ($) 26,456 38,763 376,322 1,615,825 1,397,708 146,044 11,606 191,552 211,406
Total Public Expense ($) 158,333 334,899 386,052 510,321 834,949 2,194,876 1,935,224 741,232 634,434 694,142 631,771 830,539 860,896
Source: Texas Transit Statistics

Peer Group: Small Transit Systems
1976 1977
Transit Agency Value .062
Peer Group Mean .087
N Standard Score -151 (J'1 a
Peer Group: Small City Transit Systems
1976 1977
Transit Agency Value .062
Peer Group Mean .087
Standard Score -1.63
Table 100. Cost Efficiency Performance Profile
(Total Vehicle Hours/Total Operating Expense)
WACO
1978 1979 1980 1981 1982 1983
.070 .055 .054 .045 .038 .036
.089 .066 .055 .048 .051 .045
-.80 -.86 -.16 -.35 -.71 -.90
1978 1979 1980 1981 1982 1983
.070 .055 .054 .045 .038 .036
.088 .066 .055 .048 .051 .045
-.78 -.87 -.13 -.36 -.74 -.92
1984 1985 1986 1987 1988
.035 .032 .035 .033 .033
.041 .040 .039 .038 .037
-.70 -1.38 -.79 -.92 -.73
1984 1985 1986 1987 1988
.035 .032 .035 .033 .033
.042 .041 .039 .038 .037
-.77 -1.44 -.85 -1.01 -.82

3
2
Q) ~
1 0 0
CJ)
"'C 0 - - - - -~
(lj N "'C lT1 - C
(lj -1 ..... CJ)
-2
-3 <.0 f'.-f'.- f'.-m m T""" T"""
Peer Groups:
WACO Cost Efficiency
(Total Vehicle Hours/Total Operating Expense)
to m f'.- f'.-m m T""" T"""
~~. ---
o to m T"""
T"""
to m T"""
• Small Transit Systems
C\J to m T"""
Year
(Y) to m T"""
~ to m T"""
LO to m T"""
<.0 to m T"""
• Small City Transit Systems
f'.to m T"""
to to m T"""
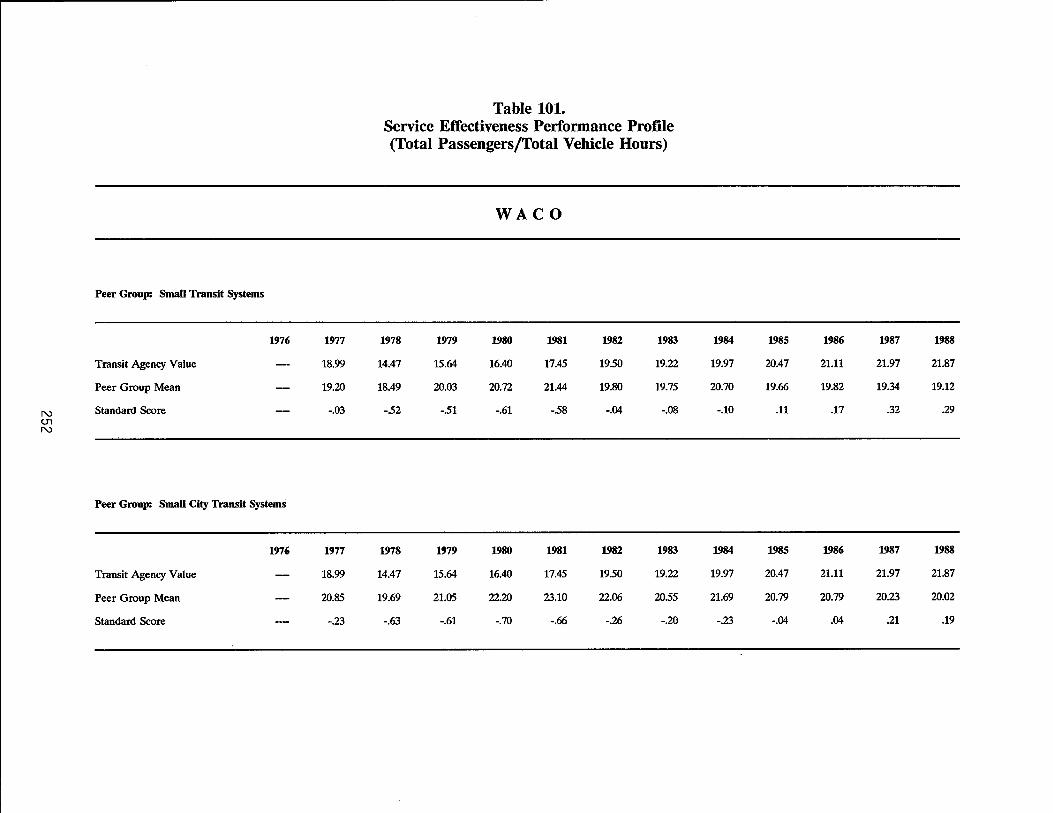
N 01 N
Peer Group: Small Transit Systems
1976
Transit Agency Value
Peer Group Mean
Standard Score
Peer Group: Small City Transit Systems
Transit Agency Value
Peer Group Mean
Standard Score
1976
1977
18.99
19.20
-.03
1977
18.99
20.85
-.23
Table 101. Service Effectiveness Performance Profile (Total Passengers/Total Vehicle Hours)
1978
14.47
18.49
-52
1978
14.47
19.69
-.63
1979
15.64
20.03
-51
1979
15.64
21.05
-.61
WACO
1980
16.40
20.72
-.61
1980
16.40
22.20
-.70
1981
17.45
21.44
-58
1981
17.45
23.10
-.66
1982
1950
19.80
-.04
1982
19.50
22.06
-.26
1983
19.22
19.75
-.08
1983
19.22
2055
-.20
1984
19.97
20.70
-.10
1984
19.97
21.69
-.23
1985
20.47
19.66
.11
1985
20.47
20.79
-.04
1986
21.11
19.82
.17
1986
21.11
20.79
.04
1987
21.97
19.34
.32
1987
21.97
20.23
.21
1988
21.87
19.12
.29
1988
21.87
20.02
.19
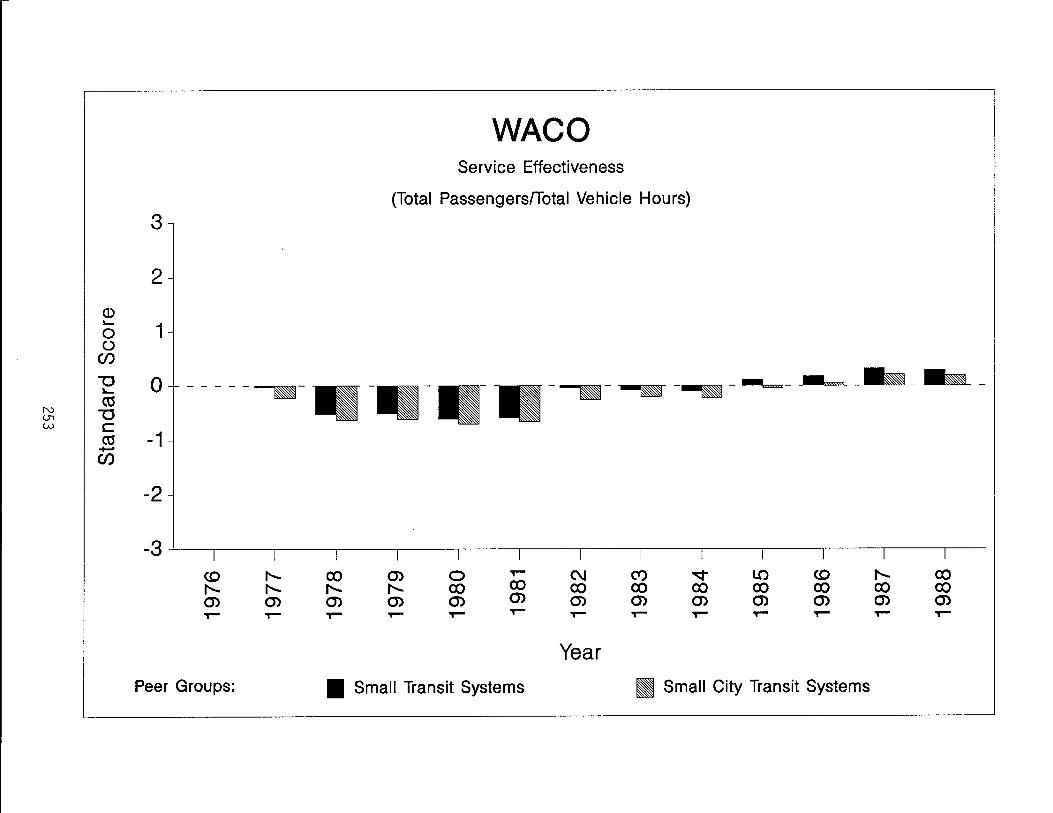
WACO Service Effectiveness
(Total Passengers/Total Vehicle Hours) 3
2
Q) I-
1 0 () (/)
--==- -~- ----"'0 0 - - - - -l- • (\j .- ---.-
N "'0 (JT
w C (\j -1
+-" (/)
-2
-3 <0 f'... CO 0> 0 ~ C\I Ct) ~ LO <0 f'... ex)
f'... f'... f'... f'... CO ex) CO CO CO CO CO CO ex)
en en en 0> en 0> en en en en en en en ~ T""" ~ T""" ~ ~ T""" ~ ~ ~ ~ ~ ~
Year Peer Groups: • Small Transit Systems 11 Small City Transit Systems

Peer Group: SmaU Transit Systems
1976 1977
Transit Agency Value .61 .38
Peer Group Mean .51 .48
N Standard Score .36 -.40 U1 ,!:>.
Peer Group: Small City Transit Systems
1976 1977
Transit Agency Value .61 .38
Peer Group Mean .49 .46
Standard Score .44 -.37
Table 102. Cost Effectiveness Performance Profile
(Passenger Revenue/Total Operating Expense)
WACO
1978 1979 1980 1981 1982 1983
.35 .31 .37 .27 .29 .28
.39 .34 .34 .33 .33 .33
-.27 -.18 .19 -.33 -.31 -.34
1978 1979 1980 1981 1982 1983
.35 .31 .37 .27 .29 .28
.39 .34 .34 .33 .34 .34
-.28 -.18 .20 -.36 -.38 -.39
1984 1985 1986 1987 1988
.27 .24 .26 .24 .23
.33 .30 .29 .27 .27
-.41 -.50 -.26 -.23 -.26
1984 1985 1986 1987 1988
.27 .24 .26 .24 .23
.34 .31 .29 .28 .28
-.48 -.60 -.34 -.31 -.33

N ()"1 ()"1
<D "-o ()
C/)
"'0 ~
C\1 "'0 c a:s
+-" C/)
WACO Cost Effectiveness
(Passenger RevenuelTotal Operating Expense) 3
2
1
o .. _------=-- ----------.- -~- a- __ --1
-2
-3~--~--~----~----~----~----~----~--~----~----~----~----~--~----
<0 f'.. 0) T"""
Peer Groups:
co f'.. 0) T"""
o CO 0) T"""
T"""
CO 0) T"""
• Small Transit Systems
C\I CO 0) T"""
Year
Ct) CO 0) T"""
-qCO 0) T"""
LO co 0) T"""
<0 co 0) T"""
• Small City Transit Systems
f'.. CO 0) T"""
co co 0) T"""
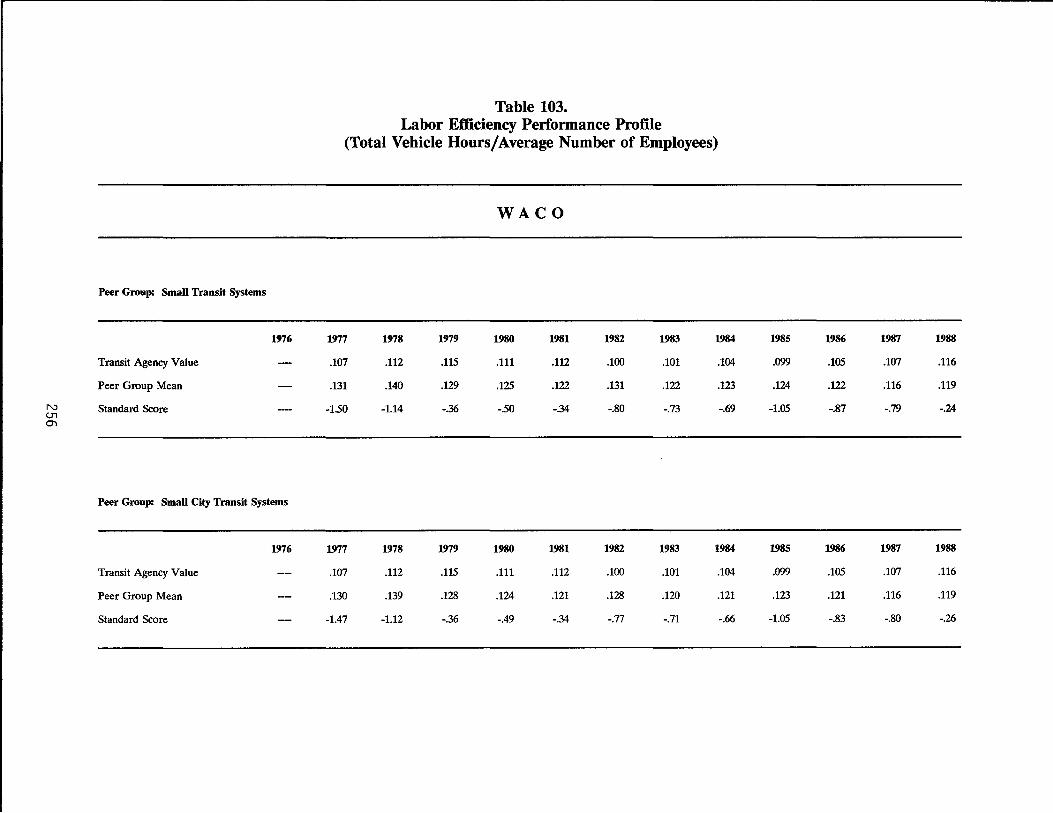
Table 103. Labor Efficiency Performance Profile
(Total Vehicle Hours/Average Number of Employees)
WACO
Peer Group: SmaU Transit Systems
1976 1977 1978 1979 1980 1981 1982 1983 1984 1985 1986 1987 1988
Transit Agency Value .107 .112 .115 .111 .112 .100 .101 .104 .099 .105 .107 .116
Peer Group Mean .131 .140 .129 .125 .122 .131 .122 .123 .124 .122 .116 .119
N Standard Score -1.50 (J1
-1.14 -.36 -50 -.34 -.80 -.73 -.69 -1.05 -.87 -.79 -.24 0'1
Peer Group: SmaU City Transit Systems
1976 1977 1978 1979 1980 1981 1982 1983 1984 1985 1986 1987 1988
Transit Agency Value .107 .112 .115 .111 .112 .100 .101 .104 .099 .105 .107 .116
Peer Group Mean .130 .139 .128 .124 .121 .128 .120 .121 .123 .121 .116 .119
Standard Score -1.47 -1.12 -.36 -.49 -.34 -.77 -.71 -.66 -1.05 -.83 -.80 -.26

r------------------------------------ ------------
3
2
<D 10-
1 0 ()
CI)
"'0 0 - - - - -lo-
N CCS U1 "'0 ~ c
ccs -1 +-' CI)
-2
-3 co f'... f'... f'... 0') 0') T""" T"""
Peer Groups:
WACO Labor Efficiency
(Total Vehicle Hours/Average Number of Employees)
---
co f'... 0') T"""
o co 0') T"""
-.-
T"""
co 0') T"""
• Small Transit Systems
C\J co 0') T"""
Year
LO co 0') T"""
co co 0') T"""
II Small City Transit Systems
a-
co co 0') T"""

Peer Group: Small Transit Systems
1976
Transit Agency Value
Peer Group Mean
N Standard Score <.J1 00
Peer Group: Small City Transit Systems
1976
Transit Agency Value
Peer Group Mean
Standard Score
Table 104. Vehicle Efficiency Performance Profile
(Total Vehicle Miles/Average Number of Buses on Regular Routes)
WACO
1977 1978 1979 1980 1981
4.17 3.71 3.39 3.66 3.40
4.22 4.66 4.51 459 451
-.06 -1.16 -1.06 -1.18 -1.38
1977 1978 1979 1980 1981
4.17 3.71 3.39 3.66 3.40
4.19 458 4.45 452 4.47
-.03 -1.06 -1.05 -1.09 -1.38
1982
3.47
4.37
-.97
1982
3.47
4.34
-.98
1983
351
4.46
-1.16
1983
351
4.43
-1.18
1984
351
4.45
-1.04
1984
351
4.43
-1.07
1985
350
454
-1.29
1985
350
4.47
-1.19
1986
3.47
4.45
-1.70
1986
3.47
4.41
-1.67
1987
3.36
4.44
-1.87
1987
3.36
4.40
-1.83
1988
3.68
4.65
-151
1988
3.68
458
-1.36

WACO Vehicle Efficiency
(Total Vehicle Miles/Average Number of Buses on Regular Routes)
3
2
Q) "- 1 0 ()
Cf)
"'0 0 - - - - -"-
N ctS
U1 "'0 <..0 C
ctS -1 +-' Cf)
-2
-3 <0 f'... co m 0 T""" C\J (Y) ..q LO <0 f'... co f'... f'... f'... f'... co co co co co co co co co m 0) m 0) m m 0) 0) m m 0) 0) m T""" T""" T""" T""" T""" T""" T""" T""" T""" T""" T""" T""" T"""
Year
Peer Groups: • Small Transit Systems • Small City Transit Systems


WICHITA FALLS
261

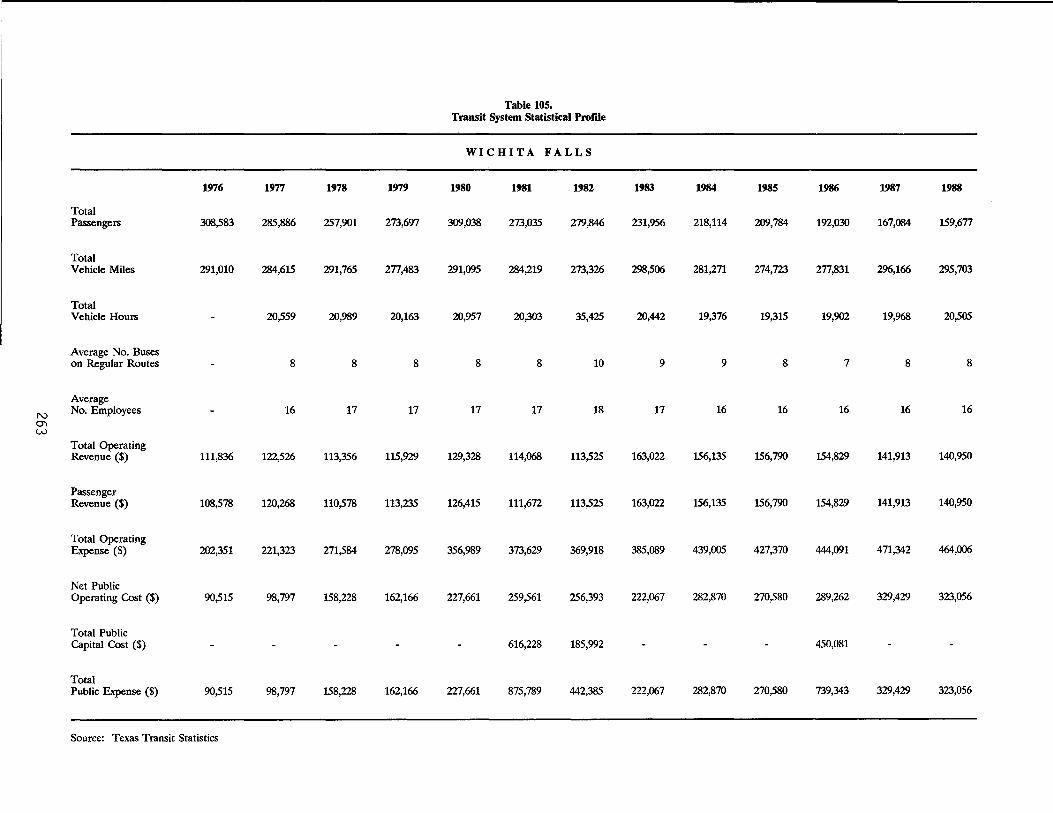
Table 105. Transit System Statistical Frof"de
WICHITA FALLS
1976 1977 1978 1979 1980 1981 1982 1983 1984 1985 1986 1987 1988
Total Passengers 308,583 285,886 257,901 273,697 309,038 273,035 279,846 231,956 218,114 209,784 192,030 167,084 159,677
Total Vehicle Miles 291,010 284,615 291,765 277,483 291,095 284,219 273,326 298,506 281,271 274,723 277,831 2%,166 295,703
Total Vehicle Hours 20,559 20,989 20,163 20,957 20,303 35,425 20,442 19,376 19,315 19,902 19,968 20,505
Average No. Buses on Regular Routes 8 8 8 8 8 10 9 9 8 7 8 8
Average
N No. Employees 16 17 17 17 17 18 17 16 16 16 16 16
0"1 W
Total Operating Revenue ($) 111,836 122,526 113,356 115,929 129,328 114,068 113,525 163,022 156,135 156,790 154,829 141,913 140,950
Passenger Revenue ($) 108,578 120,268 110,578 113,235 126,415 111,672 113,525 163,022 156,135 156,790 154,829 141,913 140,950
Total Operating Expense ($) 202,351 221,323 271,584 278,095 356,989 373,629 369,918 385,089 439,005 427,370 444,091 471,342 464,006
Net Public Operating Cost ($) 90,515 98,797 158,228 162,166 227,661 259,561 256,393 222,067 282,870 270,580 289,262 329,429 323,056
Total Public Capital Cost ($) 616,228 185,992 450,081
Total Public Expense ($) 90,515 98,797 158,228 162,166 227,661 875,789 442,385 222,067 282,870 270,580 739,343 329,429 323,056
Source: Texas Transit Statistics
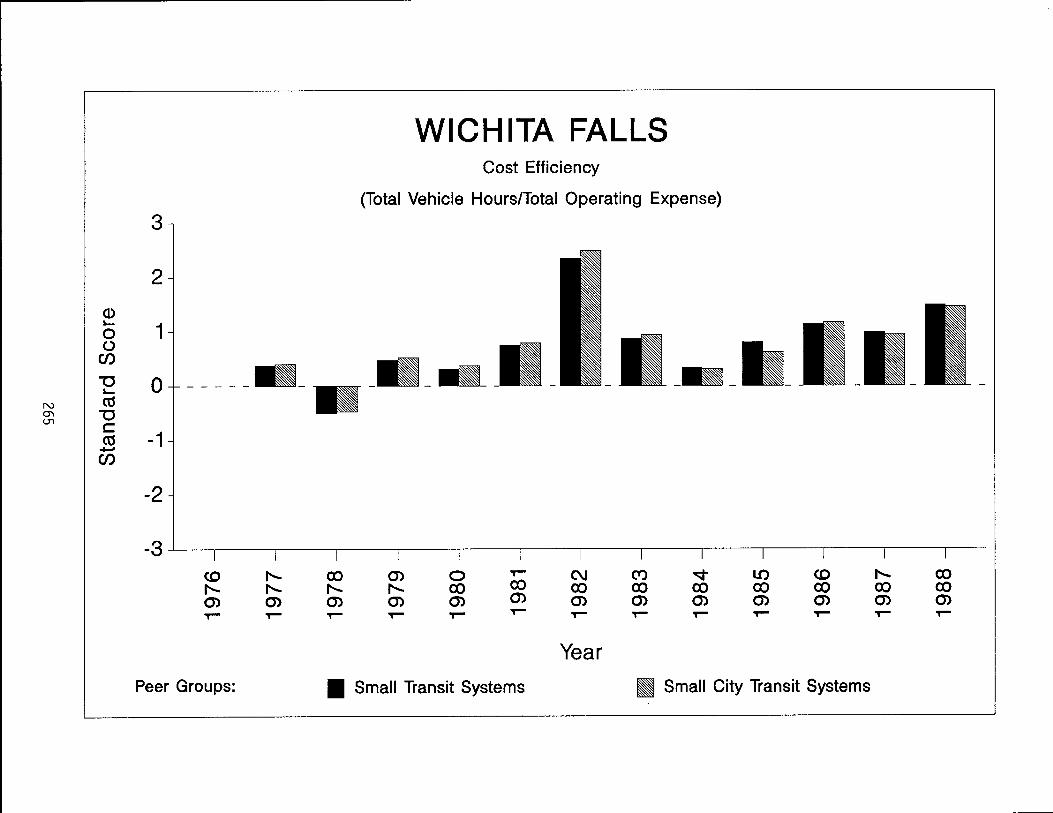
3
2
Q) II-
1 0 (,)
Cf)
"0 0 - - - - ---~
N as 0'1 "0 CJ1 c
as -1 ..... Cf)
-2
-3 <D f'... f'... f'... (j) (j) ~ ~
Peer Groups:
co f'... (j) ~
WICHITA FALLS Cost Efficiency
(Total Vehicle HourslTotal Operating Expense)
(j) f'... (j) ~
---
o co (j) ~
C\J co (j) ~
Year
---
<D co (j) ~
• Small Transit Systems • Small City Transit Systems

Peer Group: Small Transit Systems
1976
Transit Agency Value
Peer Group Mean
N Standard Score 0'1 0'1
Peer Group: Small City Transit Systems
1976
Transit Agency Value
Peer Group Mean
Standard Score
1977
13.91
19.20
-.75
1977
13.91
20.85
-.85
Table 107. Service Effectiveness Performance Profile (Total Passengers/Total Vehicle Hours)
1978
12.29
18.49
-.80
1978
12.29
19.69
-.90
WICHITA FALLS
1979
1357
20.03
-.75
1979
1357
21.05
-.85
1980
14.75
20.72
-.84
1980
14.75
22.20
-.90
1981
13.45
21.44
-1.16
1981
13.45
23.10
-1.13
1982
7.90
19.80
-1.70
1982
7.90
22.06
-1.41
1983
11.35
19.75
-1.34
1983
11.35
2055
-1.41
1984
11.26
20.70
-1.30
1984
11.26
21.69
-1.37
1985
10.86
19.66
-1.20
1985
10.86
20.79
-1.26
1986
9.65
19.82
-1.34
1986
9.65
20.79
-1.41
1987
8.37
19.34
-1.33
1987
8.37
20.23
-1.42
1988
7.79
19.12
-1.18
1988
7.79
20.02
-1.28

WICHITA FALLS Service Effectiveness
(Total Passengers/Total Vehicle Hours)
3
2
CD Jo.....
1 0 ()
CI)
-0 0 - - - - -Jo.....
N as Q) ""0 '-..J
C as -1 ......
CI)
-2
-3 <.0 f'-... co m 0 ~ C\J (Y) ~ LO <.0 f'-... f'-... f'-... f'-... co co co co co co co m m m m m m m m m m m
f'-... CO CO CO m m
~ ~ ~ T""" ~ T""" T""" T""" ~ T""" ~ T""" ~
Year
Peer Groups: • Small Transit Systems Ii Small City Transit Systems

N O'l CO
Peer Group: Small Transit Systems
1976
Transit Agency Value 54
Peer Group Mean 51
Standard Score .10
Peer Group: Small City Transit Systems
Transit Agency Value
Peer Group Mean
Standard Score
1976
54
.49
.17
1977
54
.48
.29
1977
54
.46
.35
Table 108. Cost Effectiveness Performance Profile
(Passenger Revenue/Total Operating Expense)
1978
.41
.39
.12
1978
.41
.39
.13
WICHITA FALLS
1979 1980
.41 .35
.34 .34
.48 .12
1979 1980
.41 .35
.34 .34
51 .12
1981
.30
.33
-.17
1981
.30
.33
-.19
1982
.31
.33
-.18
1982
.31
.34
-.25
1983
.42
.33
.63
1983
.42
.34
.62
1984
.36
.33
.19
1984
.36
.34
.14
1985
.37
.30
59
1985
.37
.31
.43
1986
.35
.29
55
1986
.35
.29
.50
1987
.30
.27
.29
1987
.30
.28
.22
1988
.30
.27
.26
1988
.30
.28
.21
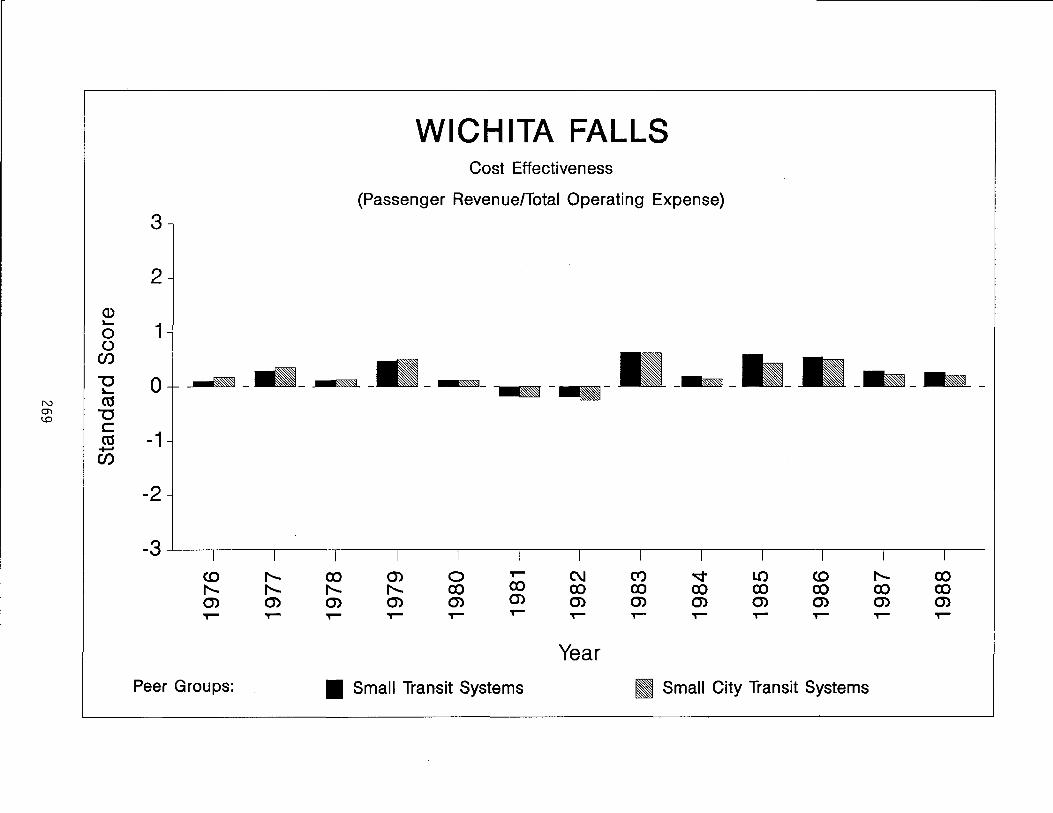
WICHITA FALLS Cost Effectiveness
(Passenger Revenue/Total Operating Expense)
3
2
<D L..
1 0 0
Cf)
u 0 "--- ~ M.~
~ - - ---- .-
N ro O"l u 1.0 c
-1 ro +-' Cf)
-2
-3 <0 ,...... co 0) 0 T""" C\I (Y) ..q LO <0 ,...... co ,...... ,...... ,...... ,...... co co co co co co co co co 0) 0) 0) 0) 0) 0) 0) 0) 0) 0) 0) 0) 0) ~ T""" T""" T""" T""" T""" T""" T""" T""" T""" ~ T""" T"""
Year Peer Groups: • Small Transit Systems • Small City Transit Systems
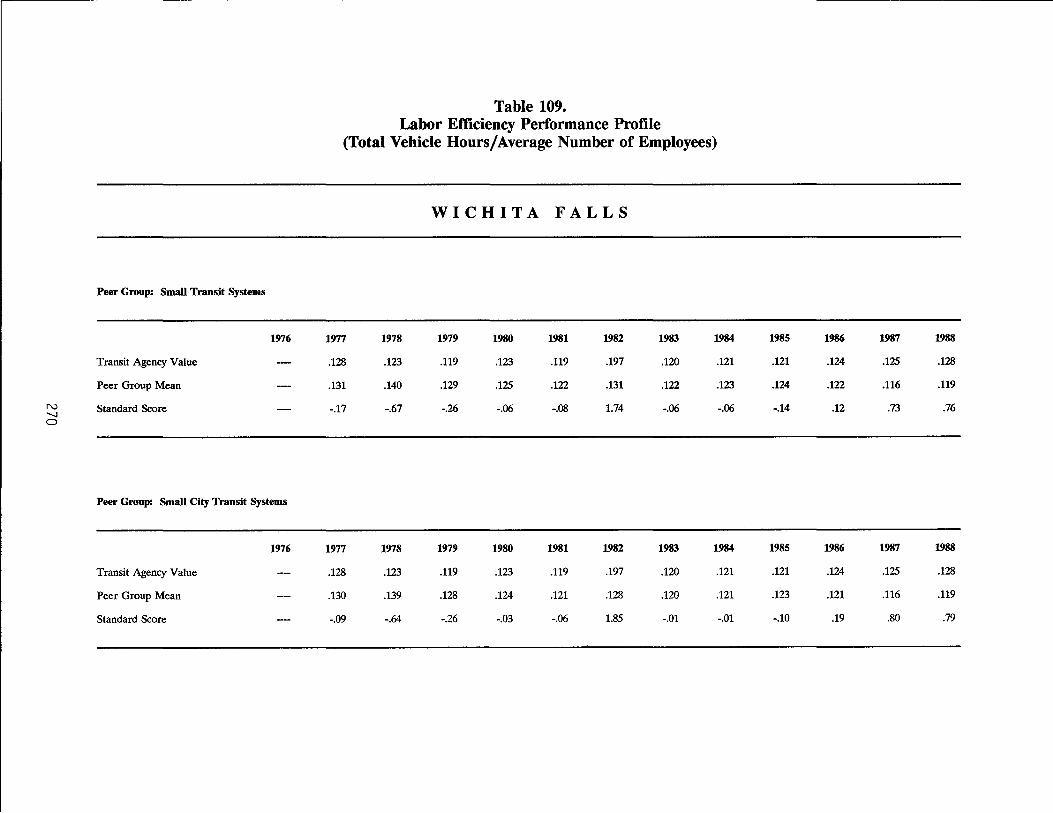
Peer Group: Small Transit Systems
1976
Transit Agency Value
Peer Group Mean
N Standard Score '-.I 0
Peer Group: Small City Transit Systems
1976
Transit Agency Value
Peer Group Mean
Standard Score
Table 109. Labor Efficiency Performance Profile
(Total Vehicle Hours/Average Number of Employees)
1977
.128
.131
-.17
1977
.128
.130
-.09
1978
.123
.140
-.67
1978
.123
.139
-.64
WICHITA FALLS
1979
.119
.129
-.26
1979
.119
.128
-.26
1980
.123
.125
-.06
1980
.123
.124
-.03
1981
.119
.122
-.08
1981
.119
.121
-.06
1982
.197
.131
1.74
1982
.197
.128
1.85
1983
.120
.122
-.06
1983
.120
.120
-.01
1984
.121
.123
-.06
1984
.121
.121
-.01
1985
.121
.124
-.14
1985
.121
.123
-.10
1986
.124
.122
.12
1986
.124
.121
.19
1987
.125
.116
.73
1987
.125
.116
.80
1988
.128
.119
.76
1988
.128
.119
.79

3
2
Q) ~
1 0 0
CJ)
"'0 0 - - - - - &\\W -~
N ctS ...... - "'0 c
-1 ctS +J CJ)
-2
-3 (0 I'-I'- I'-0') 0') ~ ~
Peer Groups:
WICHITA FALLS Labor Efficiency
(Total Vehicle Hours/Average Number of Employees)
co I'-0') ~
a-
0') I'-0') ~
o co 0') ~
--""""",,"" -
~
co 0') ~
C\I co 0') ~
Year
Ct) co 0') ~
LO co m ~
(0 co 0') ~
• Small Transit Systems • Small City Transit Systems
I'co 0') ~
co co 0') ~

Peer Group: Small Transit Systems
1976
Transit Agency Value
Peer Group Mean
N Standard Score ....... N
Peer Group: Small City Transit Systems
1976
Transit Agency Value
Peer Group Mean
Standard Score
~--------------------------------------------------------------------------------------------
Table 110. Vehicle Efficiency Performance Profile
(Total Vehicle Miles/Average Number of Buses on Regular Routes)
1977
3.56
4.22
-.74
1977
356
4.19
-.75
1978
3.65
4.66
-1.24
1978
3.65
458
-1.13
WICHITA FALLS
1979
3.47
451
-.98
1979
3.47
4.45
-.97
1980
3.64
4.59
-1.21
1980
3.64
452
-1.12
1981
355
451
-1.18
1981
355
4.47
-1.18
1982
2.73
4.37
-1.77
1982
2.73
4.34
-1.83
1983
3.32
4.46
-1.39
1983
3.32
4.43
-1.42
1984
3.13
4.45
-1.46
1984
3.13
4.43
-1.52
1985
3.43
454
-1.37
1985
3.43
4.47
-1.27
1986
3.97
4.45
-.84
1986
3.97
4.41
-.78
1987
3.70
4.44
-1.28
1987
3.70
4.40
-1.23
1988
3.70
4.65
-1.49
1988
3.70
458
-1.34
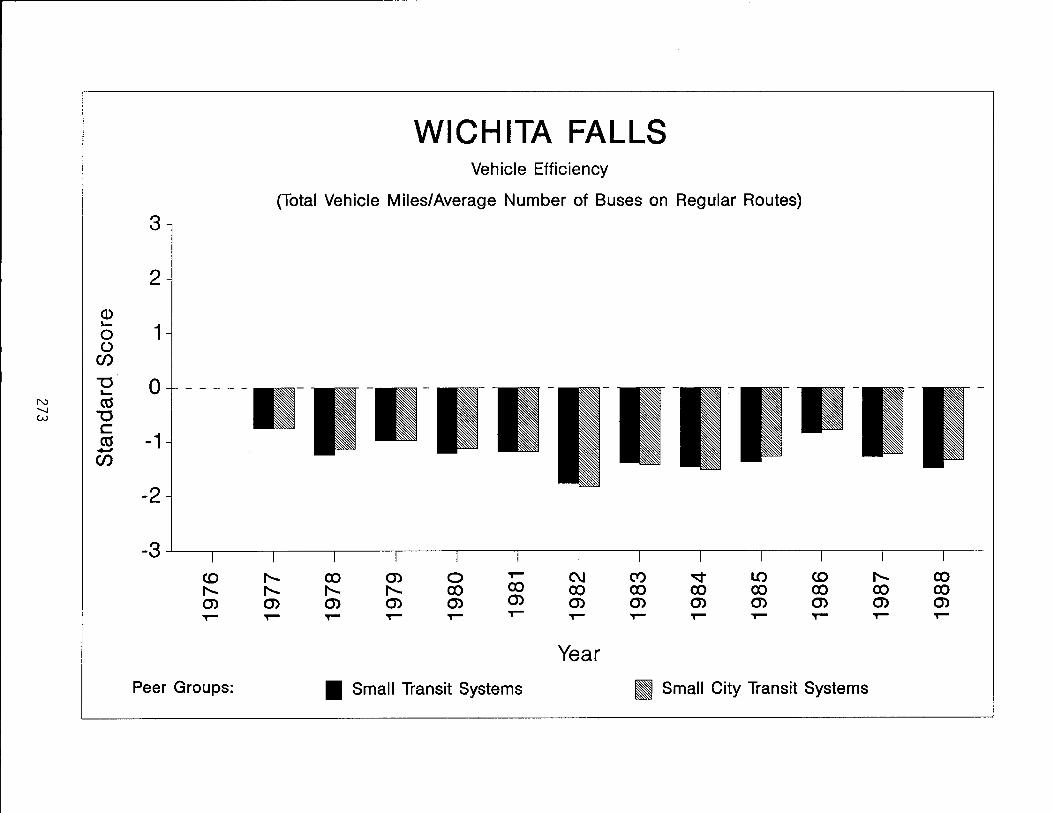
WICHITA FALLS Vehicle Efficiency
(Total Vehicle Miles/Average Number of Buses on Regular Routes)
3
2
Q) 10-
1 0 ()
Cf)
-a 0 - - - - -lo-N a:s '-I -a W
c -1 a:s ...-
Cf)
-2
-3 <.0 f'... co m 0 T""" C\I CI) ~ LO <.0 f'... co f'... f'... f'... f'... co co co co co co co co co m m m m m m m m m m m m m T""" T""" T""" T""" T""" T""" T""" T""" T""" T""" T""" T""" T"""
Year
Peer Groups: • Small Transit Systems II Small City Transit Systems


CHAPTER 4 RECOMMENDATIONS
As indicated in the previous chapter, sufficient data are available from the published
Texas Transit Statistics to develop transit profiles in five different performance categories
(cost efficiency, service effectiveness, cost effectiveness, labor efficiency, and vehicle
efficiency). At the present time, there is not sufficient data to calculate a system's
performance in the areas of maintenance efficiency and safety. Therefore, in order to
improve the data base and thus the transit profiles, it is recommended that D-11 begin
collecting the data necessary to evaluate these items. Beginning in January 1990, it is
suggested that transit operators be requested to report figures on maintenance expense and
collision accidents. With this information, the following two measures of maintenance
efficiency and safety can be calculated:
Maintenance Efficiency = Total Vehicle Miles
Total Maintenance Expense
Safety = Total Vehicle Miles
Total Collision Accidents
Transit agencies are currently reporting figures on maintenance expense and collision
accidents to other sources (UMTA and APTA), so including these items on the monthly
reporting forms sent out by D-11 would not necessitate any additional data collection efforts
on the part of the transit agencies. It is further recommended that the SDHPT begin
reporting the data on maintenance employees it is presently collecting in order that one
additional measure of maintenance efficiency can be calculated:
Maintenance Efficiency = -",T-><o=ta=I~V..:....=eh"",i=c",-"le"--",-,-M=i",-,,le ... s~ ________ _
Average Number of Maintenance Employees
275

This will enable more rounded and complete transit profiles to be developed in subsequent
years.
The transit profiles could also be expanded to include measures of service quality,
such as on-time performance and service reliability, as these represent very important
dimensions of transit performance.
In addition, the State may also want to consider establishing additional peer groups
for the purpose of comparing transit system performance. For example, Census data
(number of vehicles per household, number of households below poverty level, and
population density) might be used in conjunction with the Texas Transit Statistics in
determining additional peer groupings. Transit systems operating in border cities (with high
transit dependency) might also be compared separately from transit systems operating in
other parts of the state; transit systems serving single cities might be compared separately
from transit system operations which are regional in scope.
It has further been suggested that consideration should be given to categorizing
systems by type of service provided. In this way, transit systems providing predominately
fixed-route service would be compared separately from those which provide a large share
of paratransit or demand responsive service. Yet another idea for the large transit systems
is to separate data by major type of service categories. These categories include: 1) local;
2) express/park-and-ride (suburban); 3)paratransit (demand responsive); and 4) charter.
The reason for this is that the very different performance characteristics of each type of
service type can become obscured or distorted when mixed together. It should be noted,
however, that implementation of this idea would create additional data reporting
requirements for the large operators (several of which feel they already have too many).
In addition to the graphic representations of individual transit agency standard
scores, graphs similar to that shown in Figure 2 could also be developed to summarize
peer group performance. As shown in Figure 2, the actual transit agency values (for Austin,
Dallas, Houston and San Antonio) are plotted along with the average (mean) for the peer
group (large transit systems). This graph summarizes: 1) how a particular agency compares
276

r-------------------------------------- ---------
N '-.I '-.I
.-. .80 <I> Ch c:: 8. .70 >< w
g> .60 :;::; ct1 "-<I> 0.. .50 o ct1
.40 ...... t2 -<I> ::l c:: .30 <I> > <I> c:
.20 "-<I> C> c:: <I> .10 Ch Ch ct1
a...
~ 1:1 -A
COST EFFECTIVEN ESS (Passenger Revenue/Total Operating Expense)
A = Austin
D = Dallas
D D D H = Houston
S D D D s = San Antonio
- .. D = Average (Mean) Value
H" "
A ~ - - - - -s - _5 - -5 - -s s s S
A ~ ~ ~ ~ ~ .... ~ - -~ .... ~ __ B _ J A A A
I I I I I I I I I I I I I O~---~------~---~---~------~---~------~---~------~---~---~------~---~ co ,...... co (j) 0 T""" C\.I ('t) ~ LO co ,...... co I"- ,...... I"- ,...... co co co co co co co co co (j) (j) (j) (j) (j) (j) (j) (j) (j) (j) (j) (j) (j) T""" T""" T""" T""" T""" T""" T""" T""" T""" T""" T""" T""" T"""
Year
Peer Group: Large Transit Systems
Figure 2.

to others within the peer group; 2) how it compares to the average for the group; and
3) historical trends in performance.
In summary, the transit profiles developed as part of this study should help transit
and planning agencies to monitor trends and identify strengths and weaknesses in various
areas of overall transit system performance. Agencies can use this information to help
establish goals or minimum levels of performance and a timetable for achieving these levels
of performance.
278
REFERENCES
1. Fielding, Gordon J. et al. Indicators and Peer Groups for Transit Performance
Analysis. Irvine, California: January 1984.
2. de la Rocha, Olivia; Mary E. Brenner; and Gordon J. Fielding. The Irvine
Performance Evaluation Method: An Instructional Manual for Use ill Conducting
Internal Evaluations of Transit Performance. Irvine, California: June 1984.
3. Fielding, Gordon J. and Lee Hansen. Determinants of Superior Performance in
Public Transit. Irvine, California: August, 1987.
279


ABILENE:
AMARILLO:
AUSTIN:
BEAUMONT:
BROWNSVILLE:
APPENDIX TEXAS TRANSIT SYSTEM ADDRESS LIST
JANUARY 1990
Debbie Ruggles General Manager Abilene Transit System 1189 South 2nd St. Abilene, Texas 79602 (915) 676-6403
Wayne Pelton Manager Amarillo Transit Company P.O. Box 1971 Amarillo, Texas 79186 (806) 378-3095
Tony Kouneski General Manager Capital Area Metropolitan Transit Authority P.O. Box 1943 Austin, Texas 78767 (512) 389-7410
William J. Munson Resident Manager Beaumont Transit System 550 Milam Beaumont, Texas 77701 (409) 835-7895
Larry Brown Director of Transit Brownsville Urban System 700 South Iowa Brownsville, Texas 78520 (512) 541-4881
281
CORPUS CHRISTI:
DALLAS:
EL PASO:
FORT WORTH:
GALVESTON:
HOUSTON:
Tom Niskala General Manager Corpus Christi Regional Transit System P.O. Box 23040 Corpus Christi, Texas 78403-3040 (512) 883-2287
Chuck Anderson Executive Director Dallas Area Rapid Transit Authority 601 Pacific Dallas, Texas 75202 (214) 748-3278
Mark J. Dorfman Director Public Transit Administration City of El Paso 700-A San Francisco El Paso, Texas 79901 (915) 522-1220
John Bartosiewicz General Manager The liT' Fort Worth Transportation Authority P.O. Box 1477 Fort Worth, Texas 76101 (817) 870-6200
William Harened General Manager Galveston Island Transit 3115 Market Galveston, Texas 77550 (409) 762-2950
Robert G. MacLennan General Manager Metropolitan Transit Authority P.O. Box 61429 Houston, Texas 77208 (713) 739-4830
282
LAREDO:
LUBBOCK:
PORT ARTHUR:
SAN ANGELO:
SAN ANTONIO:
WACO:
Richard Pulido General Manager Laredo Municipal Transit System P.O. Box 558 Laredo, Texas 78042-0558 (512) 722-0951
John Wilson General Manager Citibus P.O. Box 2000 Lubbock, Texas 79401 (806) 762-6411, Ext. 2380
Tom Kestranek General Manager Port Arthur Transit P.O. Box 1089 Port Arthur, Texas 77640 (409) 983-8787
Carl Miller Manager City Transit Department City of San Angelo 28 North Chadbourne San Angelo, Texas 76903 (915) 655-9952
Wayne Cook General Manager VIA Metropolitan Transit P.O. Box 12489 San Antonio, Texas 78212 (512) 227-5371
George Ravan General Manager Waco Transit System 421 Columbus Avenue Waco, Texas 76703 (817) 753-0113
283

WICHITA FALLS: Robert Parker Director of Traffic and Transportation City of Wichita Falls 2100 Seymour Wichita Falls, Texas 76301 (817) 761-7640, Ext. 288
284