UMore Park Strategic Plan
218
OCTOBER 2006 Sasaki Report to the University of Minnesota Outreach, Research, and Education Park Steering Committee UMORE PARK STRATEGIC PLAN
Transcript of UMore Park Strategic Plan

october 2006
Sasaki Report to the University of Minnesota Outreach, Research, and Education Park Steering Committee
UMore Park Strategic Plan
Sasaki Report to the University of Minnesota Outreach, Research, and Education Park Steering Committee
UMORE PARK STRATEGIC PLAN
Prepared by
Sasaki Associates Inc.
in association with:
Economics Research Associates
Dahlgren, Shardlow & Uban
Fredrikson & Byron, P.A.


22 September 2006
Mr. Charles C. Muscoplat Mr. Larry Laukka Vice President, Statewide Strategic Distinguished Fellow Resource Development Executive Director, UMore Park University of Minnesota 526 McNamara Alumni Center 200 Oak Street, SE Minneapolis, MN 55455
re: Transmittal of UMore Park Strategic Plan Report from Sasaki Associates, Inc. to the UMore Park Steering Committee
Dear Charles and Larry:
The purpose of this letter is to transmit the Sasaki Associates, Inc. (Sasaki) report for the UMore Park Strategic Plan. This report documents key Sasaki findings, analyses and conclusions regarding the vision and recommendations for the future of UMore Park. Sasaki has completed a comprehensive strategic visioning process for this extraordinary urban-rural fringe property located in the City of Rosemount and Empire Township within Dakota County. The results of this process, conducted on behalf of the UMore Park Steering Committee, are documented in this report and the Steering Committee’s Vision/Recommendation Report.
The strategic planning process for UMore Park resulted in the consideration of three distinct scenarios that are plausible options for the Board of Regents to consider in meeting the University’s guiding principles for future use of UMore Park, and to advance the University into the world’s top three public research institutions. As a result of the comprehensive planning process, which has included extensive analysis, research, planning, stakeholder outreach and deliberation, Sasaki strongly and clearly recommends that the University adopt and move forward with Scenario C: Develop a New Community. The balance of this letter summarizes the planning process (“what Sasaki did”); the analysis, research and planning (“what Sasaki found”); and further discussion on the recommended scenario (“what Sasaki concluded”).
1. The Planning Process (“what Sasaki did”) The UMore Park strategic planning process was based on thorough consideration of the following cornerstones:
• Regent’s Principles for UMore Park • “U” Strategic Plan • Site and market analyses • UMore’s history • The stadium land legislation
Sasaki Associates Inc. | 64 Pleasant Street Watertown MA 02472 USA t 617 926 3300 f 617 924 2748 w www.sasaki.com

2 | 22 September 2006
• Faculty workshop and meetings • Community stakeholder workshop and meetings • Sustainability goals
Commencing in February 2006, Sasaki and its team members analyzed regional and site attributes, real estate trends and market conditions, relevant public policies and regulatory issues, development goals of adjacent property owners, and engaged in internal and external stakeholder outreach to assess the opportunities and constraints anticipated in establishing a vision and development concept for UMore Park.
The process revealed that:
• There is strong support of a new type of creative, knowledge-based planned community at UMore Park that would include a broad range of land uses such as residential, commercial, corporate, institutional, civic, cultural, and recreation uses set within a connected open space system. University association with this new community is critical to the full actualization of the UMore project.
• The legacy of UMore Park should be its contribution to the University as it evolves from an agricultural asset to significantly broader public resource and asset for the citizens of Minnesota.
• There is a need for immediate and sustained actions by the University to develop a specific plan and development strategy for UMore Park, and to begin the implementation of the plan in the very near future. There is also an immediate opportunity to create a specific development program and land use plan for UMore Park in cooperation with the City of Rosemount and Empire Township that can leverage significant support and benefits for the property. The University should be proactive versus reactive to the many forces and shapes which are impacting, and will continue to impact, the property. Moreover, this project will continue the University’s legacy of good stewardship of this valuable public resource.
2. Analysis, Research and Planning (“what Sasaki found”) UMore Park is an excellent place and location for a new creative, knowledge-based master planned community that expresses the aspirations and principles of the University. The results of the physical land analysis clearly indicate that the property is highly suitable for the development of a large-scale new community. There are few natural or manmade constraints to develop, and many impressive features that will complement a new community such as good access, topographic factors, vegetation patterns, streams and wetlands.
Regional growth pressures are unabated and UMore Park is evermore in the center of the continuing growth of Dakota County. Development patterns that have been moving toward UMore Park from the west and north are now moving over UMore Park to the south and east. Moreover, the City of Rosemount will soon update its comprehensive

3 | 22 September 2006
plan, which is an opportunity for the University to proactively engage in a planning process to cooperatively define the future vision of UMore Park with the City.
This strategic planning process revealed an opportunity to create a new type of master planned community with the University’s imprimatur. This new community can be an international model for better ways to live, work, learn and play in a sustainable manner, while providing opportunities for mission advancing research, education and outreach.
The new community at UMore Park should be based on three foundations that will define 21st century life:
• Education and lifelong learning, which is needed to prepare children for a more competitive future, and to ease the transitions in life for adults with an ever-increasing life expectancy.
• Healthy living and wellbeing is evermore important to society and can offer an integrated approach to improved quality of life that addresses innovations in food; diet and nutrition; recreation; design for home, work and community; healthcare; mental health; youth services and social work; and care for an aging population.
• Protection of the natural environment and futuristic energy efficiency can be advanced at UMore Park through a strong University association. It will be a place for public-private partnerships with the University to advance research, discovery, design and create new technologies, forms of renewable energy, energy-conserving systems for cold climates, and delivery of more sustainable community services.
3. Recommendations and Next Steps (“what Sasaki concluded”) The strategic planning process created and considered many ideas and concepts for the development and management of UMore Park. The process ultimately identified three distinct scenarios that could be plausible options for the property to meet the guiding principles for UMore Park:
• Scenario A: Hold Land without Development • Scenario B: Sell Land at Wholesale Prices • Scenario C: Develop a New Community with University Signature and Imprimatur
(recommended by Sasaki)
Scenario A: Hold Land without Development In Scenario A, the University would delay action and “land bank” the property without development. The University would assume the role of patient landowner, and choose to hold, but not sell, the land for approximately ten years.
During this period, the University would continue its current land uses; however, it would need to enhance revenue from current and future tenants to fund ongoing

4 | 22 September 2006
operational costs. The University could also begin preparation for future development such as removing existing concrete and reconcile the consequences of the Gopher Ordinance Works.
Scenario B: Sell Land at Wholesale Prices In Scenario B, the University would sell undeveloped land at wholesale prices to developers in minimum-sized parcels, priced according to market conditions, over an extended period of 15 to 20 years. Development of these parcels by others would be subject to predetermined comprehensive plans defined by the City of Rosemount and Empire Township. The property would be used by the University or leased to third parties until sold.
Scenario C: Develop a New Community with the University Signature and Imprimatur (recommended by Sasaki) In Scenario C, which Sasaki strongly endorses, the University would prepare a master plan for a new type of knowledge-based master planned community under University auspices. The new community could eventually include 20,000 to 30,000 residents that are living, working, learning and playing in an internationally significant model environment designed on the principle of lifelong learning, healthy living and energy sustainability.
The University could be the master developer and partner with one or more renowned developers or entities, or with new entities created by the University, to develop the new community. The University would prepare the land for development by building infrastructure and open spaces, and oversee the actual development by builders, either itself or with development partners. The University would manage the comprehensive master planning for the entire 5,000 acres, and would participate in the planning for the adjacent 2,480-acre parcel to the south that is now under joint management of the University and the DNR through 2032. The University has the unique ability to further its research, academic and outreach mission, and imbue the new community with innovative features that will make it an international model for 21st century community planning and development. The University’s signature on the community will substantially increase value and contribute to economic growth in the region and the state.
To realize this recommendation for a new community, the following next steps should be considered:
• Create a UMore Park property development team to complete the necessary planning and pre-development process, and provide ongoing management of the development process.
• Create a concept master plan that defines specific land uses and infrastructure requirements.
5 | 22 September 2006
• Identify a “Phase 1” Mixed-Use Development Plan with specific infrastructure requirements and costs.
• Select a planning consultant to prepare the concept and Phase 1 plan, and a development consultant to bring realistic real estate development experience to this process.
• Determine a governance structure for developing and managing the new community for what is likely to be a twenty-five to thirty-year development period.
• Work with the City of Rosemount, Empire Township and Dakota County to define jurisdictional, planning and service requirements for the new community.
• Prepare a business plan to extract the valuable gravel and to monetize the extensive onsite concrete resources on the property.
• Prepare a business plan with appropriate public, private and institutional partners to share in the funding and construction of mutually-beneficial and collaboratively-owned facilities that are part of the new community.
On behalf of the Sasaki team, we wish to express our sincere appreciation and enthusiasm for being part of this exciting and rewarding strategic planning process for UMore Park. The future of this extraordinary new community is brilliant, and will provide a trail for others to follow into the 21st century.
Respectfully,
Frederick L. Merrill, AICP Willa Small Kuh Principal-in-Charge Project Manager

ACKNOWLEDGEMENTSThe project team would like to acknowledge the following people for
their contribution to the strategic planning process.
University of Minnesota – UMore Park Steering CommitteeCharles C. Muscoplat, Vice President, Statewide Strategic Resource Development
Larry Laukka, Executive Director, UMore Park
Carla Carlson, Assistant Vice President, Statewide Strategic Resource Development
Greg Cuomo, UMore Park Director of Operations (as of October 15, 2006)
Michael W. Denny, Director of Development Services, Capitol Planning and Project Management
Thomas Fisher, Dean, College of Design
L. Steven Goldstein, Vice President for Strategic Initiatives, University of Minnesota Foundation
Kathryn Johnson, Director of Diversity Initiatives, Carlson School of Management
Philip O. Larsen, UMore Park Director of Operations (through October 15, 2006)
Kenneth Larson, Director of Transactional Law Services, Office of the General Counsel
Stuart Mason, Associate Vice President, Asset Management
Dewey Thorbeck, Director, Center for Rural Design
Linda Thrane, Vice President, University Relations
Susan Carlson Weinberg, Director of Real Estate

TABLE OF CONTENTS
EXECUTIVE SUMMARY
INTRODUCTION
1.0 PLANNING PROCESS1.1 Introduction1.2 Overview of the Planning Process 1.3 Matrix of Development Options
2.0 SITE ANALYSIS2.1 Introduction2.2 Site Characteristics and Context 2.3 Site Resources2.4 Tenants, Contracts and Commitments
3.0 UMORE PARK MARKET ANALYSIS ANDDEVELOPMENT STRATEGY3.1 Introduction3.2 Market Analysis and Development Strategy 3.3 Consideration of National Developers and
Successful Development Models
4.0 PROGRAM AND PHYSICAL PLAN OPTIONS4.1 Introduction4.2 Community Design Precedents4.3 Potential Program Elements4.4. Potential for Arts and Culture Parks 4.5 UMore Park Land Use Capacity
APPENDIXA UMore Park Steering Committee Subcommittee Reports B Summary of Recent University Planning StudiesC Gopher Ordinance Works D Land Ownership


1
EXECUTIVESUMMARY
This notebook is record of the efforts undertaken by the
Sasaki Team1 in support of the UMore Park Steering
Committee. The breadth of the study was broad — from
meetings with University officials, neighbors of the site,
and local government officials to ascertain their desires for
the land to the analysis of the land’s potential capacity to
accommodate long-term growth. At times, the Sasaki Team
worked in parallel with the UMore Park Steering Committee:
the Sasaki Team proposed a wide range of potential uses
to be developed on the land while the Steering Committee
investigated how best to fully realize the University’s land
grant mission at UMore Park in this century.
The process was a lively one, with what can only be
described as rigorous discussion around shared values.
What follows is a description of a special community whose
identity is linked to the University, an image that emerged
through this process. With it are recommendations that the
Sasaki Tem feels are critical for the University to undertake
to realize this vision.
KEY FINDINGS AND RECOMMENDATIONS
The following findings and recommendations are respectfully
submitted by the Sasaki Team to the UMore Park Steering
1 The Sasaki Team includes Sasaki Associates (overall project direction, land use plan-ning and institutional strategic planning); Economics Research Associates (market research, financial planning and modeling analysis); DSU Inc (environmental planning and community understanding); and Fredrikson & Byron (legal and regulatory issues).
Committee for their consideration as recommendations
to be submitted to the University of Minnesota’s Board of
Regents.
1. The role of land grant institutions is changing,
specifically their expansion beyond traditional
agricultural programs in the earlier days of agrarian-
based economics. In a paper on the land grant
university’s role in economic development,2 University
President Robert H. Bruininks emphasizes the need
to bring the full portfolio of University research to
the public through education, life-long learning and
engagement. According to President Bruininks, land
grant institutions must now focus broadly on promoting
the health of the population, the environment and
the economy. He identifies the compelling needs and
opportunities of today’s economy as being healthcare,
education and life-long learning, entrepreneurship,
application of new technologies, workforce development,
and support for small businesses. UMore Park
provides the University of Minnesota with an excellent
opportunity to contribute to regional competitiveness,
interdisciplinary innovation and enhanced delivery
systems.3
2. UMore Park’s real estate value is obvious, and growing.
Located in the center of Dakota County, one of the
2 “Regional Economies in Transition: The Role of the Land Grant University in Economic Development”
3 ibid.
EXECUTIVE SUMMARY

UNIVERSITY OF MINNESOTA OUTREACH, RESEARCH AND EDUCATION DEVELOPMENT ANALYSIS2
fastest growing counties in the region, the UMore Park
property extends into the City of Rosemount, where
the population is projected to increase by 60% in the
next fifteen years. According to the Minneapolis Star-
Tribune, “once just another plot of land in a sea of farm
fields, UMore Park is now at ‘the eye of the needle’ as
development expands to the southeast.”4 As a large
contiguous land holding near a major metropolitan
center, UMore Park’s value has outstanding potential. By
developing UMore Park as a mixed-use community, the
University can generate significant revenue to serve its
mission and create a model community that fulfills the
University’s land grant mission.5
3. It is incumbent upon the University to examine
opportunities to support a vision for UMore Park that
is consistent with the University’s land grant mission,
the Regents’ principles and the University’s goals for
strategic positioning. Sale of some of the UMore Park
lands for development of a community will offer the
highest financial value for the use of the land and can be
executed in support of University and UMore Park vision
and mission.
4. At this writing, analysis and research of UMore Park’s
development potential suggests there is broad support
and financial viability to transform UMore Park into
a community that is a model of sustainability and is
closely identified with University of Minnesota with a
focus on education, health and the environment.
The Umore Park Steering Committee should advance
development of its vision of creating a community at
UMore Park as a model of a sustainable community. The
University should engage consultants and developer(s)
to advance the master plan concept, establish
needed approvals and undertake the development.
4 Smetanka, Mary Jane. “U Goes Slowly in Deciding Use of Valuable Land,” Minneapolis Star-Tribune. November 10, 2005.
5 The September 2005 report authored by a Special Executive Committee and entitled “Creating a Lasting Legacy for UMore Park: Advancing the University of Minnesota’s Academic Mission” suggests that financial gain from UMore Park should be invested in supporting the University’s academic priorities for research, engagement and outreach.
The University should offer its intellect, leadership,
and land. Once project plans progress and a financial
profile becomes more certain, the University might
also consider leveraging its access to capital as part
of the transformation of this land to become a model
sustainable community. The academic community should
continue its involvement through the planning process by
further developing the three themes of education, health
and energy, and should provide collective knowledge
for University and the consultants. A master developer
should provide its experience in collaborating with the
University in planning (creating detailed plans and
approvals to support the University vision), securing
independent financing and developing the land.6
5. Three forces compel the consideration of UMore
Park as a community: the opportunity to support the
University’s mission through generation of capital; the
opportunity to create a model community whose quality
of life embraces and reflects the University’s collective
intellect; and the opportunity to contribute to regional
economic development through relationships with local
partners. While the UMore Park Steering Committee
envisions UMore Park to be a sustainable community
(typically described as a condition where the social,
economic and environmental needs of this generation are
satisfied without compromising the opportunity for future
generations to do the same)7, the topics of education,
health and energy emerged during this study as those of
greatest interest in designing the community. Study and
testing of these ideas indicate that opportunities exist
to integrate them into community design. For example,
a healthy society exists only when the community
maintains environmental quality. Through innovative
design and management, the UMore Park community
6 There is the potential for multiple developers ultimately to be involved.
7 The 1987 United Nations Report of the World Commission on Environment and Develop-ment is largely recognized as defining sustainability. In it, the Commission states that “the critical objectives for environment and development policies which follow from the need for sustainable development must include preserving peace, reviving growth and changing its quality, remedying the problems of poverty and satisfying human needs, addressing the problems of population growth and of conserving and enhancing the resource base, reorienting technology and managing risk, and merging environment and economics in decision-making.”

3
and its partners can demonstrate that renewable energy
and resource management contribute to economic
development and healthy ecosystems. Similarly, life-long
learning will be a critical contributor to UMore Park’s
healthy society.
6. 82% of the land at UMore Park does not contain
sensitive natural resources and is suitable for
development. However, most of the acreage is
constrained from development due to limited road
access, lack of utilities, the existence of abandoned
structures, construction debris through the area
previously used for the Gopher Ordinance Works, and/or
potential or actual site contamination.
The University should prepare the site for development
by assessing site contamination and, as relevant to
development decisions, remediating it; demolishing
abandoned, sub-standard structures and contracting to
recycle the significant volume of waste concrete on the
site; developing a plan to mine the site’s gravel, which
is estimated to have a value of up to $21 million8; and
crafting a plan to accommodate agricultural research on
appropriate lands. If it coordinates these activities with
the development of plans that coordinate with public
plans, construction may commence as early as 2008.
7. To ensure that it can effectively lead the development
process, the University should assign an existing entity,
or create a new entity, with administrative powers that
will enable it to effectively interact with the developer
and act with speed and vision as it represents the
University’s interests.
8. The University should maximize the value of the
Umore Park property to substantially contribute to the
University endowment, support the academic mission
and contribute to overall economic development in
the surrounding region. The University’s September
2005 report recommended, “that the financial gain
the University receives from UMore Park operations
should be reinvested into a perpetual endowment that
8 The amount of $21 million is in 2003 dollars.
can be used for generations to fund scholarships and
other academic priorities that are directly linked to the
University’s mission to provide world-class research,
engagement, and outreach”.9
9. UMore Park has been and will continue to be subject to
public demands for use of the land. Portions of the land
were sold in 1971, 1977 and 1981 for non-University
uses. Without a plan of action for University use, the
University will continue to be pressed to partition this
land at the risk of undermining the potential it has to
serve University purposes.
10.The University has determined that any additional
space to accommodate future needs of its Twin Cities
campuses is preferred when located in close proximity
to those campuses. An exception of note are faculty
members already doing their agricultural research
at UMore Park and a range of disciplines of faculty
interested in coupling the development of UMore Park as
a new community with academic research on sustainable
community planning and development.10
11.Dakota County and the municipalities that host UMore
Park – the City of Rosemount and Empire Township
– have a legitimate interest in its future. The University
should consult with these jurisdictions and coordinate
with their regional and community growth plans as
planning for UMore Park progresses. Ensuring that
Dakota County, Rosemount and Empire Township
are well informed and supportive of the University’s
development objectives will expedite the planning
process.
12. The site’s stakeholders, both internal to the University
and in the larger community, appear to be well aware of
the many planning studies undertaken for UMore Park
and seem to agree that the time is right to take action to
transform UMore Park.
9 “Creating a Lasting Legacy for UMore Park: Advancing the University of Minnesota’s Academic Mission,” Executive Report to President Robert Bruininks, 2005.
10 According to the World Commission on Environment and Development (Our Common Future, Oxford University Press, 1987) “Sustainable development seeks to meet the needs and aspirations of the present without compromising the ability to meet those of the future.” Sustainable development pursues economic development while protecting the ecological condition and social stability.
EXECUTIVE SUMMARY

UNIVERSITY OF MINNESOTA OUTREACH, RESEARCH AND EDUCATION DEVELOPMENT ANALYSIS4
The Sasaki Team Vision
The Sasaki Team envisions UMore Park as a community in which the University collaboratively
engages its expertise in teaching, research and outreach across myriad disciplines. It will be a
place to discover, invent, design, build and evaluate the physical, socio-economic and institutional
“infrastructure” of the 21st century. This vision will support the University’s financial goals, further
the University’s mission and provide service to the region.
UMore Park’s identity will be that of a vital community with unique educational foundations – for
the youngest children to the oldest citizens. By focusing on health and well-being, energy, the
environment, and education, residents and visitors will learn first-hand what it means to be part of
a sustainable community. Anchored in the University’s land grant mission of research, outreach and
engagement, this community will be imbued with the spirit of discovery and the opportunity to share
commitments and talents in a unique environment.
The Sasaki Team envisions the community to consist of the best of community design traditions.
Recreation, commerce and residences will be within walking distance of each other. Architectural
character will provide visual interest and demonstrate that energy and resource efficiency can be
achieved with design and building principles that are available to all. A mix of types of residents
and prices will provide for a range of incomes and household types. Housing and social needs of
the elderly will be provided for in ways that are integral to the community. Sufficient density will be
realized throughout the community to provide for preservation of open land within the community.
Life-long learning should be a hallmark of the community’s image. Unique educational experiences
will be available. Infused with the spirit of camaraderie and adventure, they will enrich and enhance
the lives of community residents of all ages. A focal point of the community’s center will be a
partnership among regional libraries and the University. This library will provide information services,
books and publications for learning and enjoyment, access and applications of state-of-the-art
technology and linkages to the University of Minnesota library system, the top-ranked research library
in North America. It will serve the community, based on age-level interests and will offer forums that
feature University researchers and educators to address issues of the day that impact citizens: diet
and nutrition; obesity in children and adults; management of diet-related chronic diseases such as
diabetes, cancer and heart disease; gardening and yard care; relationships of communities to water
quality; alternative energy and Minnesota’s future in biofuels, wind and other renewable energy
options; and energy-efficient homes, vehicles and buildings.
A second tenet of this community will be its commitment to a healthy environment. The new
community will offer a systems approach to quality of life that encompasses food; diet and nutrition;
exercise; community, business and home design; health care; education; mental health; youth;
social work; and progressive care for aging as part of a vibrant community. This picture of health
also recognizes that maintaining water, air and environmental quality, and life-long learning are all
parts of a healthy society. A physical expression of this interest will be a health and wellness complex

5
that serves residents and others through the range of education and wellness, physical activities,
health care (prevention and treatment). The priority focus will be compelling societal health issues,
including obesity, diabetes, heart disease and other diet-related chronic diseases. Emphasis will
be on physical and mental health and wellness across lifetimes, from prenatal to senior needs. A
community-based health and wellness complex will have a unique relationship to University research,
clinical practice, structure and experience in health services, education, family practice and social
services. Existing partnerships and new public and private partners will leverage positive outcomes.
This community-based health ‘system’ will be designed to serve the community while also providing
leadership and vision that extend beyond the region and the state.
The integration of the University of Minnesota’s expertise into the health and wellness complex
and system will incorporate the added enhancement of evaluative research to measure the benefits
of methods and services to individuals, the community and partner organizations. It will integrate
the environment and use of resources into the evaluation of human and community health and
incorporate life-long education, research and programs to encourage people to lead healthier lives.
Finally, the community will uniquely benefit from University discovery and education, paired with
private sector partnerships, that will promote land use and design that best manage energy resources,
protect the environment, and enhance quality of life. UMore Park will conserve energy and produce
renewable energy to serve its needs. The design and integration of efficient systems for energy
generation and use is central to this successful community for tomorrow, whether from current or
renewable sources of energy. Efficient and cost-effective wind- and solar-based energy systems will
ultimately be integrated to make sustainability a tangible element of daily life. Through innovative
design and management of renewable resources, this community and its partners can demonstrate
how renewable energy and resource management contribute to statewide economic development;
sustainable, healthy, and diverse ecosystems; and national energy security.
The community’s leading-edge commitment to energy-efficiency, energy-cost reductions and
sustainability will be expressed through a wind farm located in reasonable proximity to the community
and an adjacent agricultural area for the production of crops that have high potential as biomass as a
renewable energy source. A biomass production facility will ultimately be an outcome of
the application of research. It will be a regional energy resource as well as a
source of new jobs. Related infrastructure that will benefit homeowners
and differentiate this community include water conservation,
efficient and ecological storm water management,
and waste and wastewater treatment.
OVERVIEW OF STRATEGIC PLANNING PROCESS
EXECUTIVE SUMMARY

7
INTRODUCTION
This notebook represents efforts undertaken by, and in
support of, the University of Minnesota Outreach, Research
and Education (UMore) Park Steering Committee during
2006. This planning effort supports the University’s
determination to move forward with development of
UMore Park, creating a place through which the University
will demonstrate leadership in higher education,
renewable energy and environmental protection in a
“landmark development of national importance.”1 This
recommendation, among others found in “Creating a
Lasting Legacy for UMore Park: Advancing the University
of Minnesota’s Academic Mission: An Executive Committee
Report to President Robert Bruininks” (September, 2005),
was presented to the Board of Regents in November
2005. The Board’s endorsement of the report signaled the
creation of the UMore Park Steering Committee and the
start of a process to secure consultant planning support
for the University to fully explore means of realizing the
goals of the 2004-2005 Executive Committee Report and
the Board’s guiding principles for UMore Park (February
2006). The result is this analysis of the valuable role that
UMore Park, the largest land grant parcel within a major
metropolitan area in the country, should play in supporting
the University’s goal of becoming one of the top three public
research universities in the world.
1 “Creating a Lasting Legacy for UMore Park: Advancing the University of Minnesota’s Academic Mission: An executive committee report to President Robert Bruininks”, September 2005
The Sasaki Team assisted the UMore Park Steering
Committee in 2006. The scope of this team’s work included:
• Development of a market analysis to test the viability
and recommend a scale of development at UMore Park;
• Extensive stakeholder engagement within the University
and area communities;
• Analysis of the availability of infrastructure and
government policies in support of development at UMore
Park; and
• Articulation of program (types and scales of
development) that would support the University’s
mission, the vision for UMore Park, and the University
objectives of ensuring that this development is
financially profitable.
In addition to the consultant efforts, as the process evolved
the UMore Park Steering Committee made a commitment
to three themes for UMore Park’s identity in its next
generation: health, education and energy. The Steering
Committee studied each of these topics to create the
framework for understanding how each will be integral to
UMore Park. Steering Committee reports on these topics are
included as an appendix to this notebook.
INTRODUCTION

UNIVERSITY OF MINNESOTA OUTREACH, RESEARCH AND EDUCATION DEVELOPMENT ANALYSIS8
STAKEHOLDER OPINIONS
The Sasaki Team found that stakeholder opinions
about UMore Park are broadly held. Representatives of
government, community residents and businesspeople
engaged in the Sasaki Team’s research and analysis revealed
the following interests and concerns:
• Many people expressed interest in ensuring that
development of the site benefits the University in terms
of continued or expanded research and as an opportunity
for financial gain.
• There was broad agreement that the site should be
developed for a mix of uses (including residential
development), and as a community whose planning ideas
and design are distinct within the marketplace.
• Many stakeholders expressed a desire for the community
to innovate in its design, particularly as relates to the
natural environment.
• Most stakeholders hold affection for the open spaces and
agricultural land at UMore Park. They are proud of the
commercial application of the University’s agricultural
research as a significant contributor to the regional, state
and national economy.
• The time appears to be ripe to implement change at
UMore Park because of the recent growth in the value
of the land for development, current planning and
development occurring in neighboring jurisdictions,
and the compelling strength of the University’s ongoing
strategic planning process.
University personnel, over sixty administrators and faculty
members, convened to inform the process. Participants
represented a wide range of faculty interests, including
agriculture, earth sciences, social sciences, and the
humanities. They reached the following conclusions:
• They support President Bruininks’ perspective on land
grant universities’ historic and current roles relative to
economic development.2 They envision a community
built around the “knowledge economy” and/or “creative
community.” Serving as an international model, the
community also will contribute financially to the
University and will underscore the Midwest’s historical
contribution to innovation
and discovery. Successful planning of this site, they
believe, will easily attract residents and businesses.
• They see this as a unique opportunity to create a model
for engaging the University across disciplines that study
the environment, society, arts and healthy living at a
community scale.
• Researchers want the development of UMore Park to be
a generator of revenue that will reinvest in continued
research.
• They desire to make the site’s legacy of outreach,
research, and engagement more prominent.
2 “Regional Economies in Transition: The Role of the Land Grant University in Economic Development,” presented for discussion by Robert H. Bruininks, President, University of Minnesota, to the NASULGC Board of Directors, September 12-13, 2005.

9
SCENARIOS FOR DEVELOPMENT
As part of the planning process, the Sasaki Team conducted
a real estate market analysis that quantified and projected
the regional market for the next two decades. Using that
model, they recommend three development scenarios to
test the projected financial viability for development at
UMore Park over a twenty-five year timeframe. These three
scenarios are each valid and offer different advantages and
challenges to the University. It was decided to test each
with the expectation that this analysis would help the Sasaki
Team to quantify and qualify the likely outcomes, and
thus enable the consultant Team to present a compelling
argument to the UMore Park Steering Committee in favor of
a selected scenario. The Sasaki Team recommends Scenario
“C” - “Develop a New Community”.
Each of the three options offers potential advantages and
disadvantages to the University, the region, and UMore Park
investors:
Hold Land Without DevelopmentThe first scenario (“A”) is “Hold Land Without
Development.” Here, the University would increase
investment in UMore Park over the next ten years
by removing dilapidated structures, remediating site
contamination and extracting value from the gravel pits and
onsite concrete remains of the Gopher Ordnance Works. It
would continue its research and commercial leasing while
anticipating an increasingly favorable market for developing
the site.
• Outcomes for the University – This option may not
achieve the University’s goals for UMore Park as
envisioned in the September 2005 foundational report
to the University of Minnesota and discussions by the
University Board of Regents (November 2005) that
informed the University leadership conclusion that the
timing was right for the University to take advantage of
its opportunities to change land uses at UMore Park,
developing it to support the University’s mission.
In the previous decade, real estate values in the UMore
Park region have increased at an average rate of 8%
per annum. The University may find that delaying
development of UMore Park will yield greater profit
in the future, depending on outside investment that
otherwise occurs in the region. Banking the land also
would allow the University to use the land for new uses
related to its academic mission if this need emerges in
the next decade.
Pursuing this scenario, the University would, at best,
address the site’s mission by creating a framework plan
during the ten year land bank term with hope of realizing
it thereafter. While this strategy would provide increased
income during the ten year period, it is expected that
the University would reinvest that to prepare the site for
development. As a result, this scenario would not require
the University to invest financially during the first decade
nor would it contribute to the University’s financially.
• Outcomes for the Region – With the exception of water
and sewer infrastructure, the region’s plans assume
continued agricultural activity at UMore Park. (This
activity has historically consumed 10-15% of the total
land.) Under this scenario, adjacent communities’
comprehensive plans will continue to treat UMore Park
as such and may not reflect any University plans to
develop the land. The University will not be in a position
to influence public planning and investment decisions to
its advantage.
• Outcome for Potential Investors – Without a University
plan for its development, parties interested in UMore
Park land will continue to appeal to the University for
sale or transfer of its parcels. Market response to the
availability of UMore Park land in a decade will depend
on the pace of continued speculative investment in the
region, the outcome of any UMore Park land transfers
that might occur in the interim and general market
conditions.
INTRODUCTION

UNIVERSITY OF MINNESOTA OUTREACH, RESEARCH AND EDUCATION DEVELOPMENT ANALYSIS10
Sell Land at Wholesale Prices In the second scenario (“B”) – “Sell Land at Wholesale Prices”
– the University would subdivide the property into large parcels
of land and sell it as quickly as possible. The purchasers of
the large land tracts (assumed to be at least one hundred
acres) would determine future use and pursue approvals. The
market study suggests that it is likely that this would result
predominantly in low-density residential neighborhoods.
Existing University research and commercial leases would be
terminated to accommodate sales. The expected timeframe to
fully transform the site is twenty-five years.
• Outcomes for the University – This scenario allows the
University to sell UMore Park at as rapid a pace as
possible in order to reinvest the capital elsewhere. The
lack of involvement by the University in determining
future ownership and development of this land, however,
challenges the 2005 recommendations of the University’s
Executive Committee for continued involvement in the
land by the University. The Executive Committee urged
the University to act as steward of the land and ensure its
future use is consistent with the University’s mission to
serve the residents of Minnesota.
• Outcomes for the Region – As with the scenario that
would hold land without development, the laissez-faire
attitude of this scenario will frustrate regional planning
efforts. Host and neighboring communities may attempt
to engage the University in a rational process for land
disposition and/or the communities may strengthen
their resolve to control development through stronger
comprehensive planning at the municipal level.
• Outcome for Potential Investors – Without a vision or
criteria for purchase, it is likely that land speculators
and developers will buy UMore Park land, as is currently
happening in the surrounding area, to construct
residential, commercial, and industrial uses. Without a
University plan for the land, its acquisition is anticipated
to yield less profit for the University than if sale and
development is coordinated.
Develop a New CommunityThe third scenario (“C”) – “Develop a New Community”
– calls on the University to develop a master plan,
establishing the design details to inspire decision-making
and capital investment and guide development. To construct
the vision for UMore Park described in this plan as Scenario
C, “Develop a New Community,” the University is called on
to plan with sufficient detail and advance site preparation to
attract a master developer(s) to aid in its execution.3 In this
scenario, the University offers its land, name and intellect
as integral to the identity of the site, and may provide
financial mechanisms to access capital in a preferential way.
The master developer provides the benefits of its experience
in developing a master plan, securing approvals, developing
the land, and its independent access to capital.
• Outcomes for the University – If this scenario is pursued,
the University will enhance its projected revenue stream
by creating a vision for the redeveloped site and the
pace of development. This strategy also will allow the
University to reserve land for its needs—or as a future
reserve for unanticipated needs—at preferred locations.
Engagement of a “master” developer of national
prominence is recommended as necessary to realize
previously unarticulated demand. Thus, this strategy
can redirect existing demand and generate maximum
revenue.
3 This does not prevent the inclusion of additional developers for specific phases of the development and/or parcels.

11INTRODUCTION
• Outcomes for the Region – Creating a new community
that is a national model of sustainability and University-
developer partnership will transform the region. The large
scale of the community needed to support this strategy
will increase the numbers of residents and businesses
in Dakota County above the number projected, and may
have a positive influence on the type and quality of
development in the host and neighboring communities.
• Outcome for Potential Investors – The contemplated
master developer-University relationship will create
investment opportunities that are new and unusual
within the marketplace. Thus, it will allow the University
to attract greater demand than typical development
would and support the University vision of the
community as a model of sustainability. By establishing
a threshold of quality (and perhaps of size), the project
will attract the nation’s and region’s best developers.

IMAGE OF UMORE PARK SITE

CHAPTER 1 THE PLANNING PROCESS 13
PLANNING PROCESS
1.1 INTRODUCTION
In many ways, this study represents a natural progression
in a series of deliberations, largely internal to the University
community, to determine the means of planning for
appropriate use and managing UMore Park. This study
perpetuates the values previously articulated of using
the land to benefit University research, education and
engagement: envisioning Umore Park as a place of real
benefit to the region; and calling for the University’s
continued visibility as owner of the land and as a public
institution with responsibilities of research, education
and engagement benefitting the citizens of the state.
The following principles articulated by the University of
Minnesota Board of Regents in February 2006 guided
decisions and deliberations throughout the planning
process:
• Protect and enhance the value of UMore Park through
timely planning and action.
• Advance the University’s research, education and
engagement mission through the physical and financial
resources that UMore Park will provide over the
long term.
• Improve the long-term financial health of the University
through application of sound fiscal principles and
stewardship. Invest the income generated through
UMore Park in ways that support academic priorities to
supplement and leverage state and private support.
• Retain oversight of UMore Park’s planning and
development and remain accountable for the
master plan.
• Plan in such a way so as to optimize the value of UMore
Park utilizing short-term strategies without restricting
options for long-term strategies.
• Utilize market value as a benchmark in assessing
alternative development strategies.
• Ensure that all planning and development activities
are conducted with the highest standards of fairness,
integrity, and sound business practice.
• Respect the needs of neighboring communities, and
local, regional and state governments.
In the 2006 planning process, more than 120 individuals
shared their concerns and hopes for use of the land. As a
departure from previous efforts, this process placed equal
focus on the land for its own potential as well as for that
of the University. Discussions were robust, often grouping
individuals of different perspectives to provide for debate
and to cultivate awareness across stakeholder parties of
CHAPTER ONE
UNIVERSITY OF MINNESOTA OUTREACH, RESEARCH AND EDUCATION DEVELOPMENT ANALYSIS14
the range of opinions. The outcome indicated a shared
opinion that the land should be developed as a mixed-use
community where the University’s land grant mission of
research, community engagement and education serves as a
national model. Stakeholders articulated different emphasis
on the components and specifics of design, as is evident in
the text of this section.
During the strategic planning process described in the
following section, the UMore Park Steering Committee
challenged itself to identify the ways in which the new
community would identify with the University. The group
agreed to three arenas where University expertise could
add unique value to a new community over the anticipated
25-year development time frame. Education, health and
energy were established as the focus, both as independent
elements and with recognition of the myriad opportunities
to explore synergistic relationships between them. A
subcommittee to the UMore Park Steering Committee
was established for each of the three themes and tasked
with creating a vision to be used as a foundation for
future planning of the new community. These efforts are
summarized in the Appendix to this document.
1.2 OVERVIEW OF THEPLANNING PROCESS
In 2004, the University’s then Vice-President for
Agricultural Policy and Dean of the College of Agricultural,
Food and Environmental Sciences1 was charged to develop
recommendations for the future of UMore Park.2 These
recommendations, detailed in a September 2005 report to
the President, were integral to the identification of a vision
for UMore Park and laid the groundwork for the strategic
plan. As a result of these efforts, in October 2005 the
University issued a request for proposals from professional
planning and development consultants to assist the UMore
Park Steering Committee in assessing UMore Park’s
economic, academic and development potential.
They selected the Sasaki Team of consultants to aid in
their endeavor. The consultant team’s efforts commenced
in February 2006. The consultants analyzed site attributes,
market trends and relevant public investments and policies,
and engaged stakeholders external and internal to the
University to establish a vision for the site.
Approximately sixty UMore Park stakeholders – largely
representatives of local, county and state offices, resident
businesses and neighbors to the site – were consulted. Each
was asked about their values for UMore Park, what they
appreciated and wanted to maintain, and what changes they
would welcome. They were asked to provide comments on
a number of potential land uses for the site. The process
revealed the following interests and concerns:
• University Association with the Site – Many people
expressed interest in ensuring that development of
the site benefit the University in terms of continued
or expanded research and, to a lesser degree, as an
opportunity for financial gain.
1 The position, Vice President for Agricultural Research, was reconfigured in 2006 to Vice President for Statewide Strategic Resource Development, with an ongoing responsibility for UMore Park.
2 “Creating a Lasting Legacy for UMore Park: Advancing the University of Minnesota’s Academic Mission: An executive committee report to President Robert Bruininks,” 2005.

CHAPTER 1 THE PLANNING PROCESS 15
• Image of the Site – The participants see this as an
excellent location to create a model community
that engages the University across all disciplines.
They believe that this is a rare opportunity to study
environment, society, arts and healthy living at a
community scale and that successful planning of the site
will easily attract residents and businesses.
• Legacy of UMore Park – Faculty want the development
of UMore Park to be a generator of revenue that the
University will reinvest in continued research. Many of
the faculty who currently perform research at UMore
Park enjoy its convenience to their Twin Cities campus
base and would like to see that opportunity perpetuated.
• Image of the Site – There was broad agreement that the
site should be developed for a mix of uses (including
residential development), and as a community whose
planning ideas and design are distinct within the
marketplace. Many advocated that it should have
sustainable design elements.
• Legacy of UMore Park – Many stakeholders value
UMore Park as natural land used impart for agricultural
research. They recognize the significant commercial
application that the University of Minnesota agricultural
research contributes to the regional, state and national
economy.
• Timing of the Plan – There was broad consensus that the
time is ripe to implement change at UMore Park due
to the growth in the land’s value for development; the
strength of the University’s strategic planning process;
the timing and directions of current plans for Dakota
County, Rosemount, and Empire Township; and the
analysis of the parcel conducted over the last five years.
A parallel effort was sponsored to engage University
personnel. Over sixty faculty convened to inform the
process. Participants included representation of a wide
range of academic interests, including agriculture, health
sciences, social sciences, and the humanities. They easily
reached the following consensus:
• University Association with the Site – Participants support
the land grant universities’ historic and current roles
relative to economic development. Their ideas for this
site include an international model of a community built
around the “knowledge economy” and/or a “creative
community” that also contributes financially to the
University. Their emotions are linked to the observation
that the "true" Midwest, known for its innovation and
discovery, is the perfect location for this new community;
UMore Park would be the next great area of discovery.
Distinguishing Characteristics of UMore Park as a New Community:
• University of Minnesota identity—excellence in
chosen pursuits
• A model of the land grant mission of “research,
education and engagement” for the new century
• Grounded in the present to improve conditions for
the future
• Educational excellence, life-long learning
• Healthy living
• Sustained by renewable energy sources
• Access to Minneapolis and St. Paul via convenient
public transportation
• Local farms—rich food supplies
• Multiple and pleasant connections to vast open
space network
• Water efficient buildings and land management
practices
• Energy efficient buildings
• Mix of land uses—a “community” of uses and
activities
• Attractive design, as with Minnesota’s best-loved
cities and towns
UNIVERSITY OF MINNESOTA OUTREACH, RESEARCH AND EDUCATION DEVELOPMENT ANALYSIS16
• Timing of the Plan – Regional growth and the University’s
strategic planning have created a greater imperative for
the University to develop this site. Funding generated
the University to become one of the top three public
research institutions in the world.
Further, the UMore Park Steering Committee constituted
itself as three subcommittees to explore ideas for
considering the UMore Park property as a model community
of the future. The University’s nationally recognized
leadership in education, sustainability, and the range
of quality research that contributes to quality of life for
people, their families and their communities could become
the image of UMore Park as a model community. These
subcommittees articulated the framework for education,
health, and energy at UMore Park3.
A real estate market analysis quantified existing demand,
market trends and projected the regional market for the
next two decades. The start of this process recognized
that UMore Park has a market value that would have been
unimaginable a generation ago and its value as raw land
will likely continue to grow at a similar or accelerated rate.
With the UMore Park Steering Committee, the Sasaki Team
identified three development scenarios to test financial
modeling of UMore Park's development potential. Each is
consistent with the stakeholder interest in continued use of
the land by the University and in environmental stewardship
of the most sensitive portion of the site. They differ as a
function of the amount and/or type of development to occur
at UMore Park, the level of risk for the University and the
expected return on investment.
Additional studies undertaken in recent months by the
UMore Park Steering Committee explored both the site
contamination at UMore Park and the opportunity to recycle
the concrete related to the abandoned Gopher Ordinance
Works facility.
3 A summary of their efforts is found in the Appendix to this report.

CHAPTER 1 THE PLANNING PROCESS
mem
oran
dum
17
DATE 3 May 2006TO UMore Park Steering CommitteeFROM Willa Kuh and Fred MerrillPROJECT NAME University of Minnesota UMore ParkPROJECT # 54621.00SUBJECT Faculty and Administrators’ Planning Work Session
Following are notes that summarize the April 24, 2006 UMore Park work session. At this
forum, nearly 60 faculty and administrative leaders from a cross-section of disciplines
participated in considering potential future uses for UMore Park. They did this in the context
of considering the University’s established plans for UMore Park (from 2000 to present) and
President Bruinink’s paper entitled “ Regional Economies in Transition: The Role of the Land
Grant University in Economic Development” (2005).
Faculty and Administrators’ Comments on Opportunities for UMore Park• The assembled support the universities’ historic and current role relative to economic
development. Their vision for this site is that it should be a prime example of a
community built around the “knowledge economy” and/or a “creative community”
that also contributes financially to the University. The "true" Midwest is known for its
innovation and discovery. UMore Park would be the next great area of discovery.
• The assembled see this as an excellent location to create an international model of a
sustainable community that engages the University across all disciplines. This is a rare
opportunity to study at an entire community scale—environment, society, arts, healthy
living. Successful planning of this site will easily attract residents and businesses to the
benefit of the University and region.
• Financial sustainability—researchers want the development of UMore Park generate
revenue to be reinvested in continued research. Such a mechanism can allow the
University to match and fully sponsor externally-supported academic research, including
the research most relevant to this new community.
• The University’s tradition of agricultural research should be included in future plans.
Faculty and Administrators’ Concerns• Faculty and administrators want to ensure that income from future development will
be used to support the University's academic mission as consistent with the goal of
becoming a top public research institution. Income should not be used for budget relief.
• How can the development partnership be structured to ensure prompt decision making
supportive of University goals and objectives? The University needs to work in the near-
term to develop quantitative models that will convince developers of the viability of the
University’s desired innovations.
UNIVERSITY OF MINNESOTA OUTREACH, RESEARCH AND EDUCATION DEVELOPMENT ANALYSIS18
• Should the land be sold or only leased? The University’s interest is in maintaining
sufficient control of land use. Development of UMore Park can become a significant
center for University activity.
• Transportation access to the site is constraining and should be resolved in part through
provision of rail to the site.
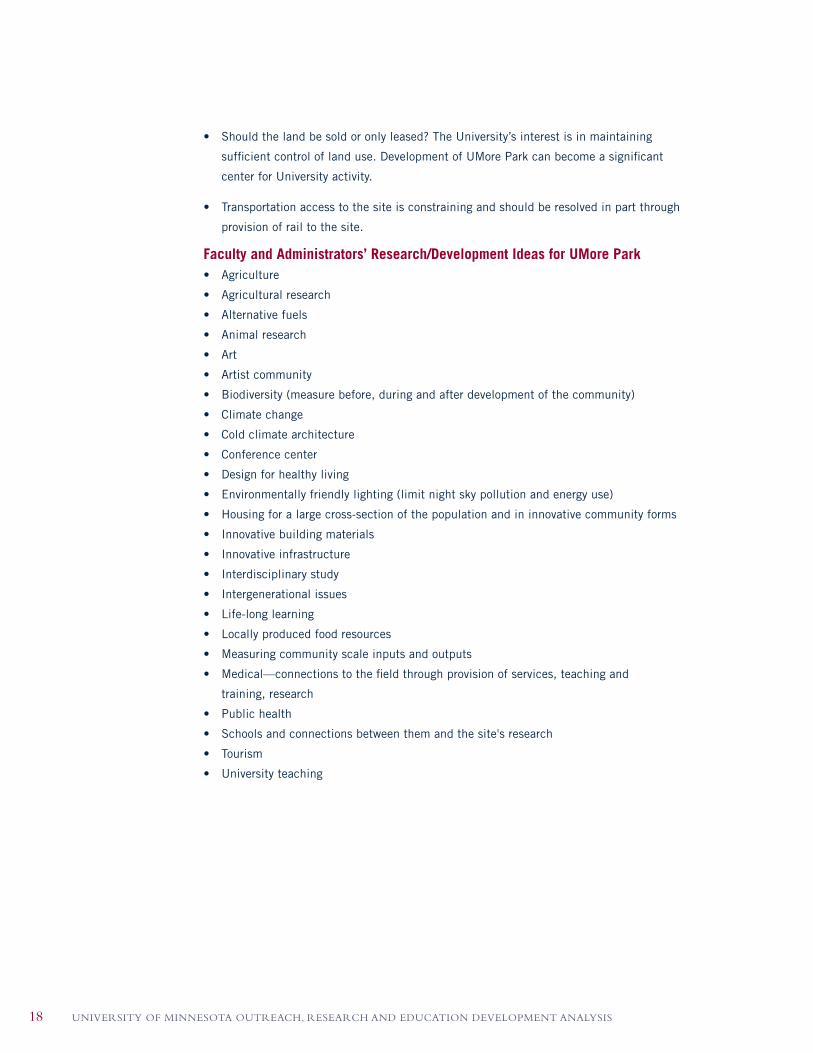
Faculty and Administrators’ Research/Development Ideas for UMore Park• Agriculture
• Agricultural research
• Alternative fuels
• Animal research
• Art
• Artist community
• Biodiversity (measure before, during and after development of the community)
• Climate change
• Cold climate architecture
• Conference center
• Design for healthy living
• Environmentally friendly lighting (limit night sky pollution and energy use)
• Housing for a large cross-section of the population and in innovative community forms
• Innovative building materials
• Innovative infrastructure
• Interdisciplinary study
• Intergenerational issues
• Life-long learning
• Locally produced food resources
• Measuring community scale inputs and outputs
• Medical—connections to the field through provision of services, teaching and
training, research
• Public health
• Schools and connections between them and the site's research
• Tourism
• University teaching

CHAPTER 1 THE PLANNING PROCESS
mem
oran
dum
19
DATE 17 March 2006TO UMore Park Steering CommitteeFROM Fred Merrill, Willa Kuh, Steve Wilson, Philip Phillip ParsonsPROJECT NAME UMore Park Strategic PlanPROJECT # SA #54621.00SUBJECT Meeting Notes from Feb 22 to 24, 2006 Stakeholder Interviews
In Sasaki’s compilation and review of our notes from the stakeholder interviews we noticed
widespread consideration of certain issues. These are outlined below:
Common Interests• University association with this site—many people expressed interest in ensuring that
development of the site benefits the University in terms of continued or expanded
research and as an opportunity for financial gain.
• Image of the site—there was broad agreement of sentiment across stakeholders that
this should be developed for a mix of uses (including residential development) and as a
community whose planning ideas and design are distinct within the market place. Many
advocates of a mixed-use community expressed interest that it has sustainable design
elements and (to a lesser extent) host community (social) research.
• Stakeholders value UMore Park and relate to its agricultural research, recognizing that
it contributes to the economy and is increasingly becoming a landmark of the heritage
of the region (given the rate of conversion occurring in the area from agricultural to
residential and commercial uses).
• Timing of this plan—there was broad description of the timing being ripe for this plan
to catalyze change at UMore Park. This appears largely to be a function of the growth
in value of the land for development, the strength of the University's ongoing strategic
planning process, ongoing planning efforts by Dakota County, Rosemount, and Empire
Township and, according to few stakeholders, the background consideration of the land
established over the last five years.
• Broaden the variety of research undertaken at UMore Park.
• This is formative time in sustainable design, a viable opportunity for this site (bio-fuels,
innovative stormwater management, solar and wind energy production, composting).

UNIVERSITY OF MINNESOTA OUTREACH, RESEARCH AND EDUCATION DEVELOPMENT ANALYSIS20
• The key natural resource at UMore Park is land that abuts the Vermillion River
(designated trout stream) for water quality and as a recreational resource. The State
and County are aligned to preserve the Vermillion River Corridor for recreation, water
management, and natural resource protection.
• This master plan process is an opportunity to look at urban/rural transition issues. This
is an opportunity to be a model example of development at the edge between urban and
rural areas.
• This site can showcase self-sustaining systems and make connections between
agriculture and health.
• The University plans should ensure financial benefit to the University.
• Maintain natural beauty of the site.
Associated Concerns• The University has limited funds to invest up front in this site.
• The plan should strive to be self-financing.
• Objectives of the planning process are to generate an analysis of predictable
development and options of greater value to the University system.
• Integrate planning for UMore Park’s future with that of the University.
• UMore Park should not be "parceled out" for fragmented suburban development.
• Don't let the potential need for site remediation limit the vision for the GOW site.
CHAPTER 1 THE PLANNING PROCESS 21
Following are stakeholder groups involved in the UMore Park master planning process:
Aggregate Industries
College of Agriculture, Food and Environmental Science
College of Architecture and Landscape Architecture, now known as the College of Design
Center for Rural Design
Dakota County Technical College
Department of Natural Resources
Faculty with research projects at UMore Park
Flint Hills Refinery
Local School Superintendents
Master Gardeners
Met Council
Representatives of Dakota County
Representatives of Empire Township
Representatives of Minnesota Agricultural Experiment Station
Representatives of Minnesota Extension Services
Representatives of the City of Rosemount
Representatives of the Metropolitan Counci
Representatives of the Soil and Water Conservation District l
UMore Park Citizens Advisory Council
UMore Park Management Team and New Co-Deans, Director of Extension
UMore Park Staff
UMore Park Steering Committee
University environmental, government relations, community relations, communications staff
UNIVERSITY OF MINNESOTA OUTREACH, RESEARCH AND EDUCATION DEVELOPMENT ANALYSIS22
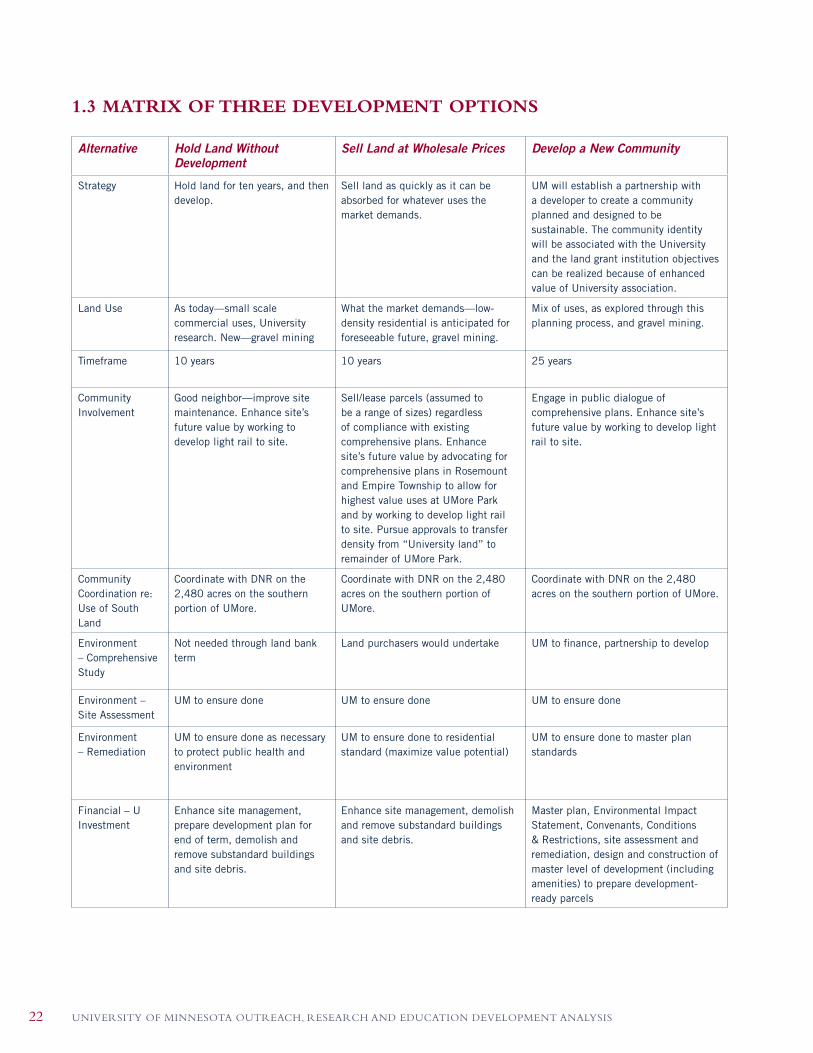
Alternative Hold Land Without Development
Sell Land at Wholesale Prices Develop a New Community
Strategy Hold land for ten years, and then develop.
Sell land as quickly as it can be absorbed for whatever uses the market demands.
UM will establish a partnership with a developer to create a community planned and designed to be sustainable. The community identity will be associated with the University and the land grant institution objectives can be realized because of enhanced value of University association.
Land Use As today—small scale commercial uses, University research. New—gravel mining
What the market demands—low-density residential is anticipated for foreseeable future, gravel mining.
Mix of uses, as explored through this planning process, and gravel mining.
Timeframe 10 years 10 years 25 years
Community Involvement
Good neighbor—improve site maintenance. Enhance site’s future value by working to develop light rail to site.
Sell/lease parcels (assumed to be a range of sizes) regardless of compliance with existing comprehensive plans. Enhance site’s future value by advocating for comprehensive plans in Rosemount and Empire Township to allow for highest value uses at UMore Park and by working to develop light rail to site. Pursue approvals to transfer density from “University land” to remainder of UMore Park.
Engage in public dialogue of comprehensive plans. Enhance site’s future value by working to develop light rail to site.
Community Coordination re: Use of South Land
Coordinate with DNR on the 2,480 acres on the southern portion of UMore.
Coordinate with DNR on the 2,480 acres on the southern portion of UMore.
Coordinate with DNR on the 2,480 acres on the southern portion of UMore.
Environment – Comprehensive Study
Not needed through land bank term
Land purchasers would undertake UM to finance, partnership to develop
Environment – Site Assessment
UM to ensure done UM to ensure done UM to ensure done
Environment – Remediation
UM to ensure done as necessary to protect public health and environment
UM to ensure done to residential standard (maximize value potential)
UM to ensure done to master plan standards
Financial – U Investment
Enhance site management, prepare development plan for end of term, demolish and remove substandard buildings and site debris.
Enhance site management, demolish and remove substandard buildings and site debris.
Master plan, Environmental Impact Statement, Convenants, Conditions & Restrictions, site assessment and remediation, design and construction of master level of development (including amenities) to prepare development-ready parcels
1.3 MATRIX OF THREE DEVELOPMENT OPTIONS

CHAPTER 1 THE PLANNING PROCESS 23
UMORE PARK CONCEPT PLAN
UNIVERSITY OF MINNESOTA OUTREACH, RESEARCH AND EDUCATION DEVELOPMENT ANALYSIS24
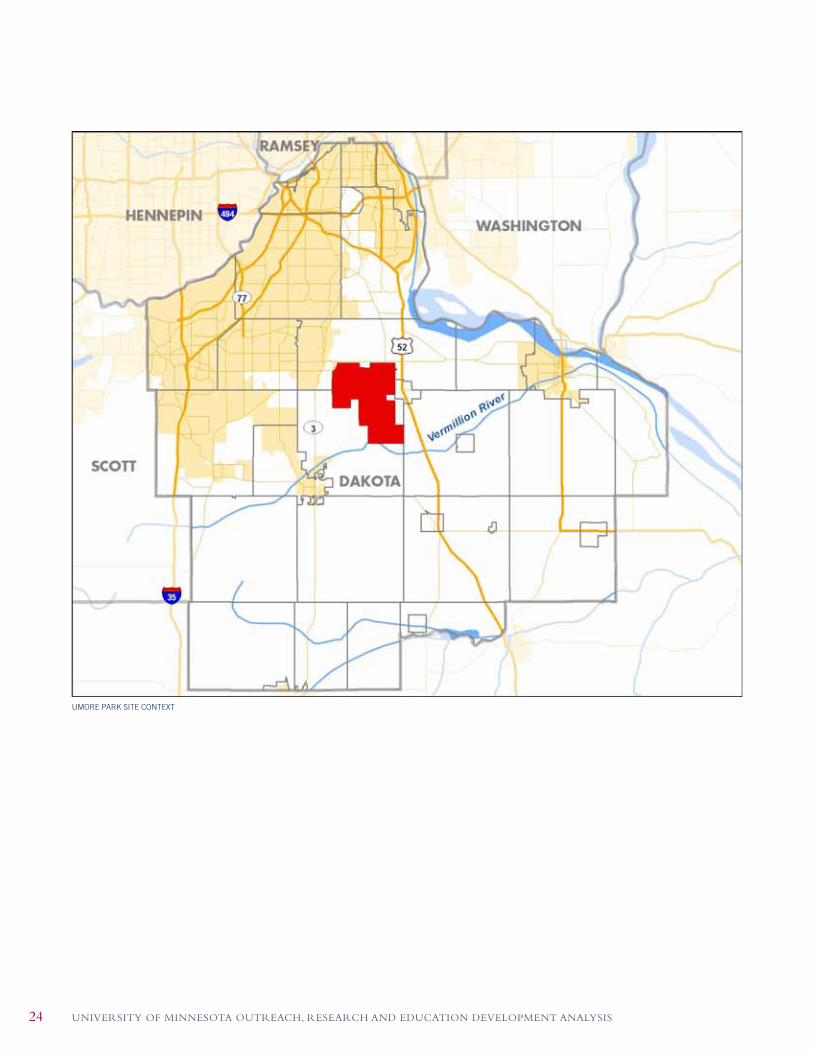
UMORE PARK SITE CONTEXT

CHAPTER 2 SITE ANALYSIS 25
SITE ANALYSIS
2.1 INTRODUCTION
UMore Park land value as host to sensitive and significant
natural resources and to the mission of the institution is
the subject of a number of studies in the last decade. It
also has industrial value associated with gravel extraction,
waste concrete recycling and, wind energy development.
The continuing trend of suburbanization of Dakota County is
reaching UMore Park, providing that land with a commercial
development value that might not have been imaginable
twenty years ago.
Today, while 82% of the UMore Park land is suitable for
development in its current state (i.e. is not a sensitive
natural resource), relatively little of the acreage is
development ready. Most of the acreage is constrained
from development by limited road access, lack of utilities
to support development, the existence of abandoned
structures, construction debris throughout the area
previously used for the Gopher Ordnance Works, and/or
potential or actual site contamination.
Studies prepared for the University in 2003 document the
location and potential value of aggregate resources at UMore
Park.1 The study found that four areas of UMore Park have
a collective value to the University of between $14 and $21
1 Studies are entitled “Inventory and Valuation of Aggregate Resources, UMore Park, Dakota County, Minnesota: (July 2003) and “Exploration for Additional Sand and Gravel Resources: an Addendum to Inventory and Evaluation of Aggregate Resources, UMore Park, Dakota County, Minnesota: (December 2003), both produced by R. K. Hoagberg Associates, Consulting Geologists, Edina, Minnesota
million.2 The actual financial value that the University will
realize will be influenced by the terms of the agreement
for extraction3, the timing of extracting the material and
the actual outcome— e.g. quality and quantity—of the
operation.4 This report follows an ad hoc committee effort
by government and industry in 1998 that documented the
Minneapolis demand and supply for aggregate. This study
concluded that while per capital demand is increasing, so
too are the constraints on extraction due to competing land
uses, restrictive zoning, increasing quality standards, and
complex permitting processes and standards.
Studies are currently underway to determine the value of
waste concrete at the former Gopher Ordnance Works5,
one of seventy-seven United States munitions facilities
constructed and operated during World War II. Presently, the
site still contains a number of WWII-era buildings, as well
as hundreds of assorted foundations, footings, remnants and
rubble associated with the former GOW facilities.
2 This is a 2003 dollar value.
3 In addition to contract terms that dictate roles and responsibilities for permit approvals, terms of payment and schedule, the value to the University of aggregate extraction will be impacted by conditions of operation—site maintenance, hours of operation, and site preparation for redevelopment once extraction is complete. These issues of site control will likely be very important to the phasing details of the master plan for UMore Park.
4 The environmental review and permit process for aggregate extraction at UMore Park can be expected to take up to two years. In addition, existing long-term contracts for extraction in Empire Township and other immediately proximate sites may impact the timing and extent of the resource extraction industry’s interest in UMore Park.
5 Constructed between 1942 and 1945 to produce nitrocellulose (smokeless gunpow-der), the facility operated for only a few months before closing. In 1947 and 1948, the federal government gave 8,000 acres and 162 buildings to the University of Minnesota. Following the end of WWII in 1945, and continuing through 1947, a majority of the GOW buildings were dismantled, burned, salvaged and/or were otherwise disposed.
CHAPTER TWO
UNIVERSITY OF MINNESOTA OUTREACH, RESEARCH AND EDUCATION DEVELOPMENT ANALYSIS26
A number of commercial and University research leases
exist at UMore Park and the University regularly receives
requests for additional leases, permits and easements.
University and commercial agricultural activity occupies
the site’s prime agricultural soil, while non-agricultural
commercial activity is largely located within the former
Gopher Ordnance Works complex. The University offers
short-term commercial leases to allow the University to
quickly change uses if it identifies another preferred use.
In 2006, the Minnesota Legislature established a process
for state support to the University of Minnesota football
stadium and planned transfer in 2032 of 2,840 acres of
UMore Park land (referred to in the legislation as “University
Land”) from the University of Minnesota to the Department
of Natural Resources (DNR).6 Management and oversight
of the University Land will be coordinated between the
University of Minnesota and the DNR for 25 years. After
this term, assuming full payment for the stadium, the land
will be transferred to the state, but with continued rights
provided in perpetuity to the University for fulfillment of its
academic mission of research, education and engagement.
6 Minnesota Laws 2006, Chapter 247, Sections 137.50, 137.52, and 137.54

CHAPTER 2 SITE ANALYSIS 27
2.2 SITE CHARACTERISTICSAND CONTEXT
UMore Park is a 7,686-acre site located in central Dakota
County, Minnesota. It is approximately twenty miles from
Minneapolis-St. Paul and is within the seven-county Twin
Cities metropolitan region. The northern portion of the site
is located in the City of Rosemount; the southern is within
Empire Township. The site borders Coates Township to
the east. United States Highway 52 runs north-south and
parallels UMore Park’s eastern border. State Highway 3
runs north-south, parallel to UMore Park’s western border.
County Road 46 bisects the property into its northern and
southern halves. County Road 42 and 190th Street form
UMore Park’s northern and southern borders, respectively.
Suburban development characterizes the area to the north
and west of UMore Park, while low-density agricultural use
and conservation land comprise the land to the south
and east.
UMore Park’s real estate value is obvious, and growing.
Located in the center of Dakota County, one of the fastest
growing counties in the region, the UMore Park property
extends into the City of Rosemount, which is projected to
grow its population by 30,000 inhabitants by 2020 – an
increase of 60%. According to the Minneapolis Star-Tribune,
“Once just another plot of land in a sea of farm fields,
UMore Park is now at ‘the eye of the needle’ as development
expands to the southeast.”7 Vehicular travel on the recently
upgraded County Road 46 exemplifies the area’s growth
pressures: it has evolved from a gravel road to a two-lane
highway carrying thousands of vehicles per day.
7 Smetanka, Mary Jane. “U Goes Slowly in Deciding Use of Valuable Land,” Minneapolis Star-Tribune. November 10, 2005.
Summary of Market Trends and Initiatives that Impact UMore Park’s Development Potential
Residential and Commercial Growth
Population projections for Dakota County indicate that the
County population will exceed 500,000 residents by 2030.
Regional Wastewater Investments
The Metropolitan Council Environmental Services has
recently developed a wastewater plan that will close the
Rosemount plant and expand the Empire Township plant
and requires construction of an effluent pipe that will
circumvent UMore Park. Planned capacity at this plant
accommodates the projected needs of UMore Park should it
be developed as a community.
Dakota County Technical College
Dakota County Technical College seeks to expand its
holdings into UMore Park land. Its immediate desire is to
build an athletic complex.
Flint Hill Resources
The oil refinery to the northeast of UMore Park has a crude
oil processing capacity of about 280,000 barrels per day
and has operated for 50 years. It also manufactures asphalt,
heating fuels, and sulfur for fertilizers. The facility has
plans to expand production within its existing acreage.
Its existence likely inhibits growth and property values at
UMore Park and other surrounding lands.
City of Rosemount
The City of Rosemount’s Mayor views UMore Park as a
“tremendous growth opportunity.”8 It is the City’s policy,
as established through its comprehensive plan, to “support
agricultural experimentation, education, and research within
the University of Minnesota property; coordinate efforts
with the University of Minnesota with the objective of
establishing greenway corridors and other recreational and
natural amenities on the University’s property; strengthen
8 Interview with Rosemount Mayor Bill Droste on March 21, 2006. “Rosemount mayor delivers fourth State of the City address” by Erica Christoffer – Sun Newspapers. March 29, 2006.
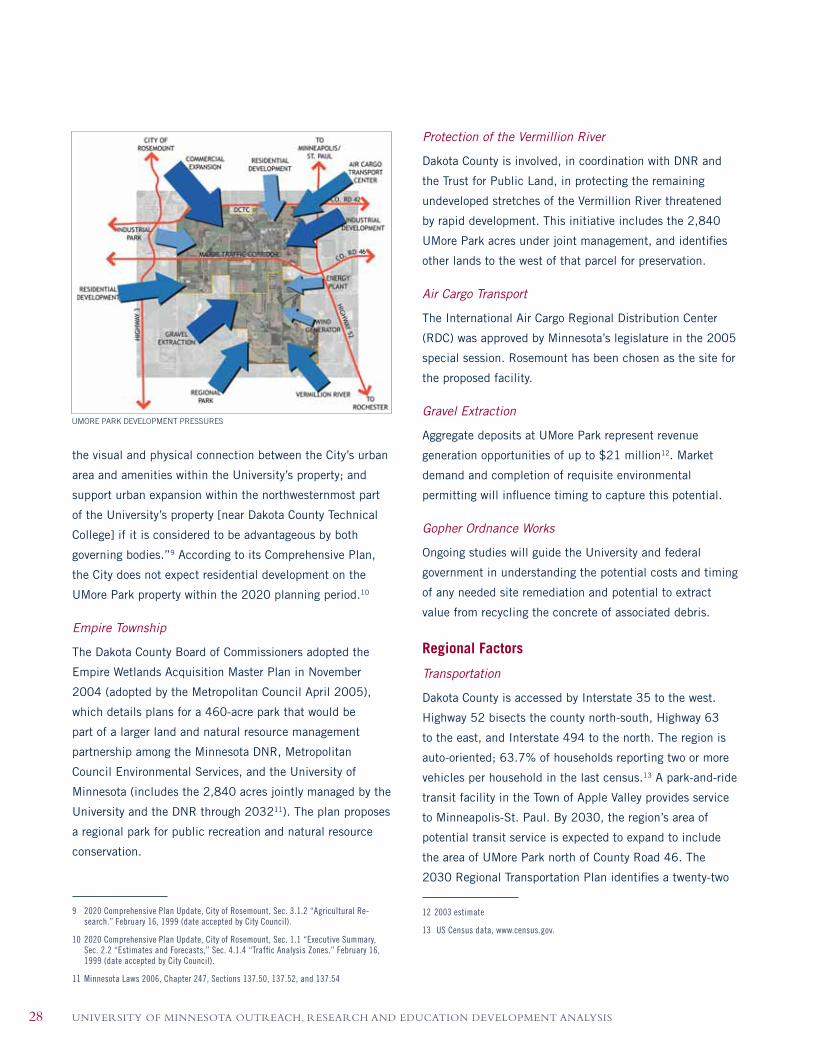
UNIVERSITY OF MINNESOTA OUTREACH, RESEARCH AND EDUCATION DEVELOPMENT ANALYSIS28
the visual and physical connection between the City’s urban
area and amenities within the University’s property; and
support urban expansion within the northwesternmost part
of the University’s property [near Dakota County Technical
College] if it is considered to be advantageous by both
governing bodies.”9 According to its Comprehensive Plan,
the City does not expect residential development on the
UMore Park property within the 2020 planning period.10
Empire Township
The Dakota County Board of Commissioners adopted the
Empire Wetlands Acquisition Master Plan in November
2004 (adopted by the Metropolitan Council April 2005),
which details plans for a 460-acre park that would be
part of a larger land and natural resource management
partnership among the Minnesota DNR, Metropolitan
Council Environmental Services, and the University of
Minnesota (includes the 2,840 acres jointly managed by the
University and the DNR through 203211). The plan proposes
a regional park for public recreation and natural resource
conservation.
9 2020 Comprehensive Plan Update, City of Rosemount, Sec. 3.1.2 “Agricultural Re-search.” February 16, 1999 (date accepted by City Council).
10 2020 Comprehensive Plan Update, City of Rosemount, Sec. 1.1 “Executive Summary, Sec. 2.2 “Estimates and Forecasts,” Sec. 4.1.4 “Traffic Analysis Zones.” February 16,1999 (date accepted by City Council).
11 Minnesota Laws 2006, Chapter 247, Sections 137.50, 137.52, and 137.54
Protection of the Vermillion River
Dakota County is involved, in coordination with DNR and
the Trust for Public Land, in protecting the remaining
undeveloped stretches of the Vermillion River threatened
by rapid development. This initiative includes the 2,840
UMore Park acres under joint management, and identifies
other lands to the west of that parcel for preservation.
Air Cargo Transport
The International Air Cargo Regional Distribution Center
(RDC) was approved by Minnesota’s legislature in the 2005
special session. Rosemount has been chosen as the site for
the proposed facility.
Gravel Extraction
Aggregate deposits at UMore Park represent revenue
generation opportunities of up to $21 million12. Market
demand and completion of requisite environmental
permitting will influence timing to capture this potential.
Gopher Ordnance Works
Ongoing studies will guide the University and federal
government in understanding the potential costs and timing
of any needed site remediation and potential to extract
value from recycling the concrete of associated debris.
Regional Factors
Transportation
Dakota County is accessed by Interstate 35 to the west.
Highway 52 bisects the county north-south, Highway 63
to the east, and Interstate 494 to the north. The region is
auto-oriented; 63.7% of households reporting two or more
vehicles per household in the last census.13 A park-and-ride
transit facility in the Town of Apple Valley provides service
to Minneapolis-St. Paul. By 2030, the region’s area of
potential transit service is expected to expand to include
the area of UMore Park north of County Road 46. The
2030 Regional Transportation Plan identifies a twenty-two
12 2003 estimate
13 US Census data, www.census.gov.
UMORE PARK DEVELOPMENT PRESSURES

CHAPTER 2 SITE ANALYSIS 29
mile bus-way and bus rapid transit service along the Cedar
Avenue Corridor from the Mall of America in Bloomington
to CSAH 70 in Lakeville. Federal and state funding is being
sought for this new transit service that would link with
improved transit service along Cedar Avenue to Eagan, Apple
Valley, and Lakeville. In March 2004 a “Locally Preferred
Alternative” was selected by the Dakota County Regional
Railroad Authority. It recommends bus rapid transit running
on highway shoulders throughout the bus-way corridor.
DAKOTA COUNTY ZONING

UNIVERSITY OF MINNESOTA OUTREACH, RESEARCH AND EDUCATION DEVELOPMENT ANALYSIS30
Education
Dakota County has a highly educated population in
comparison to the State of Minnesota: 35% of Dakota
County residents age twenty-five and older have a college
degree. Dakota County has 101,596 enrolled students,
or approximately 285 students for every 1,000 people. In
the Farmington School District (District 192), there is an
average of 780 students per school.14 In the Rosemount-
Apple Valley-Eagan School District (District 196), there
are on average 640 students per elementary school, 1,080
students per middle school, and 1,520 students per high
school.15 In 2004, Dakota County elementary schools
ranked third in the state for reading and math; middle
schools ranked fourth; and high schools ranked third.
Housing
The County represents 11% of the total number of housing
units in the metropolitan area. There are 131,151 dwelling
units, of which 22.3% are in multi-unit structures. Multi-
family home construction has exceeded single-family
home construction in comparison to the Twin Cities MSA.
Dakota County has a home ownership rate of 78%, which
is considered high for the region. Average household size is
2.7 people per unit, less than the 3.08 people per unit and
3.17 people per unit in Rosemount and Empire Township,
respectively.16
Waste Generation
In 2003, Dakota County generated, on average, about seven
pounds of garbage per day for every resident.17 The 2005-
2024 Dakota County Solid Waste Master Plan estimated
1.0677 tons of waste per resident, 42% of which was
recycled.18 The County estimated that area landfills have five
to seven years’ capacity left.19
14 http://www.farmington.k12.mn.us/
15 Figures revised annually, http://www.isd196.k12.mn.us/196profile.cfm
16 US Census data, www.census.gov.
17 Dakota County Green Guide 2005-07
18 2005-2024 Regional/Dakota County Solid Waste Master Plan
19 Dakota County Green Guide 2005-07
Recreation
Park service area analyses demonstrate that the rapidly
growing southwestern area of urban Dakota County is not
well-served by the existing regional park system and the
need for additional park acreage will grow over the coming
decades.20
Industry
Retail trade and service industries account for 44% of
all employment in Dakota County (1996). Manufacturing
continues to be a dominant sector, accounting for 17%
of employment in the County. The top three employment
centers for UMore Park area residents today are Eagan,
Minneapolis and Bloomington. By county, Dakota County is
the second-largest employment center in the area.21
Retail
The nearest retail center to UMore Park is in the City of
Rosemount. The Mall of America in Bloomington can be
accessed via public transportation (from the park and ride
facility in Apple Valley) or by car via I-35 and Route 77.
Government Policies and Objectives
A key planning issue identified in Dakota County 2020,
the County’s comprehensive plan, is population and
development growth. The plan focuses on policies and
implementation strategies that aim to manage growth
through land use regulation, protection of natural areas and
establishing recreation areas, by meeting transportation
needs associated with assumed growth, and maintenance of
the agricultural industry and heritage.
Two conservation initiatives may also influence UMore Park
land management decisions. The DNR’s Metro Conservation
Corridors program is establishing a network of conservation
land in the seven-county metro region. This initiative
encompasses lands within the Vermillion River watershed,
20 Empire Wetlands Acquisition Master Plan, November 2004
21 Based on commute-shed data from US Census Bureau, LED Origin-Destination Data Base (2nd Quarter 2002 and 2003)

CHAPTER 2 SITE ANALYSIS 31
DAKOTA COUNTY POPULATION IN 2004DAKOTA COUNTY POPULATION IN 1990
including the UMore Park land south of 170th Street. The
second initiative is Metro Greenways, a DNR program that
provides technical and monetary support to counties to
inventory, restore, and protect their natural resources.
Demographics
Over the last forty years, Dakota County has grown from a
rural farming community to an area of substantial suburban
growth. The strongest period of growth occurred in the
1960s with 4% Compound Annual Growth Rate (CAGR).
Today, Dakota County is the third most populous county in
Minnesota, hosting 355,904 residents – 14% of the Twin
Cities metropolitan region population. As the seven-county
Twin Cities region is expected to grow in the next 25 years,
it is projected that Dakota County will host a significant
portion of this new population for a net gain of 157,000
people by 2030.
Site Description and AnalysisAt 7,686 acres (approximately twelve square miles), UMore
Park is the largest undeveloped University-owned acreage
contiguous to any major U.S. city. It is approximately
a thirty-minute drive from Minneapolis-St. Paul. It is
located at the urban-rural interface and in the pathway of
development from three sides. An agricultural landscape
typifies UMore Park’s identity with remnants of past military
use and fragments of a prairie heritage. Development and
financial pressures are mounting; UMore Park is rapidly
gaining in value, political visibility, and interest from many
quarters.
Access and Circulation
UMore Park is serviced by U.S. Highway 52 to the east,
State Highway 3 to the west, County Road 42 to the north,
and 190th Street to the south. County Road 46 and 170th
Street cut the property in half, while Biscayne Avenue forms
the western border and Clayton Avenue forms the site’s
eastern edge. A network of public and private roads access
UMore Park facilities. The northern edges of the site are
served by existing railroad lines, in particular a railyard in
Rosemount to the northwest and freight access into the
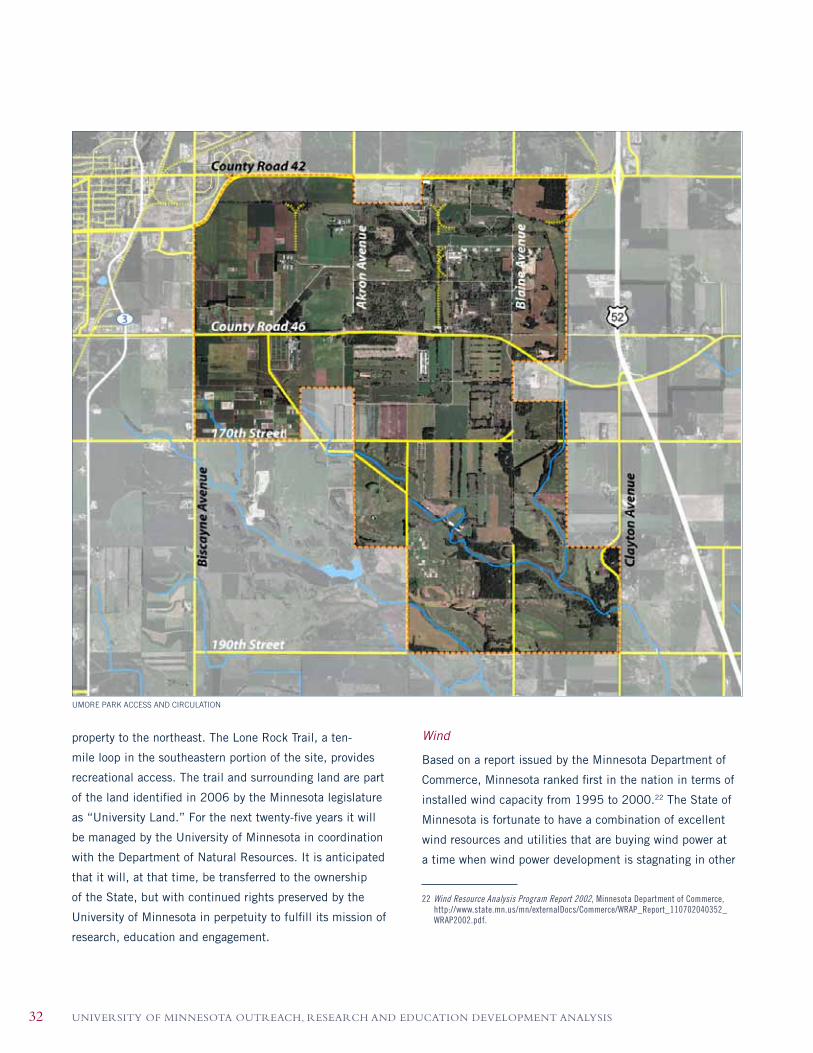
UNIVERSITY OF MINNESOTA OUTREACH, RESEARCH AND EDUCATION DEVELOPMENT ANALYSIS32
property to the northeast. The Lone Rock Trail, a ten-
mile loop in the southeastern portion of the site, provides
recreational access. The trail and surrounding land are part
of the land identified in 2006 by the Minnesota legislature
as “University Land.” For the next twenty-five years it will
be managed by the University of Minnesota in coordination
with the Department of Natural Resources. It is anticipated
that it will, at that time, be transferred to the ownership
of the State, but with continued rights preserved by the
University of Minnesota in perpetuity to fulfill its mission of
research, education and engagement.
UMORE PARK ACCESS AND CIRCULATION
Wind
Based on a report issued by the Minnesota Department of
Commerce, Minnesota ranked first in the nation in terms of
installed wind capacity from 1995 to 2000.22 The State of
Minnesota is fortunate to have a combination of excellent
wind resources and utilities that are buying wind power at
a time when wind power development is stagnating in other
22 Wind Resource Analysis Program Report 2002, Minnesota Department of Commerce, http://www.state.mn.us/mn/externalDocs/Commerce/WRAP_Report_110702040352_WRAP2002.pdf.
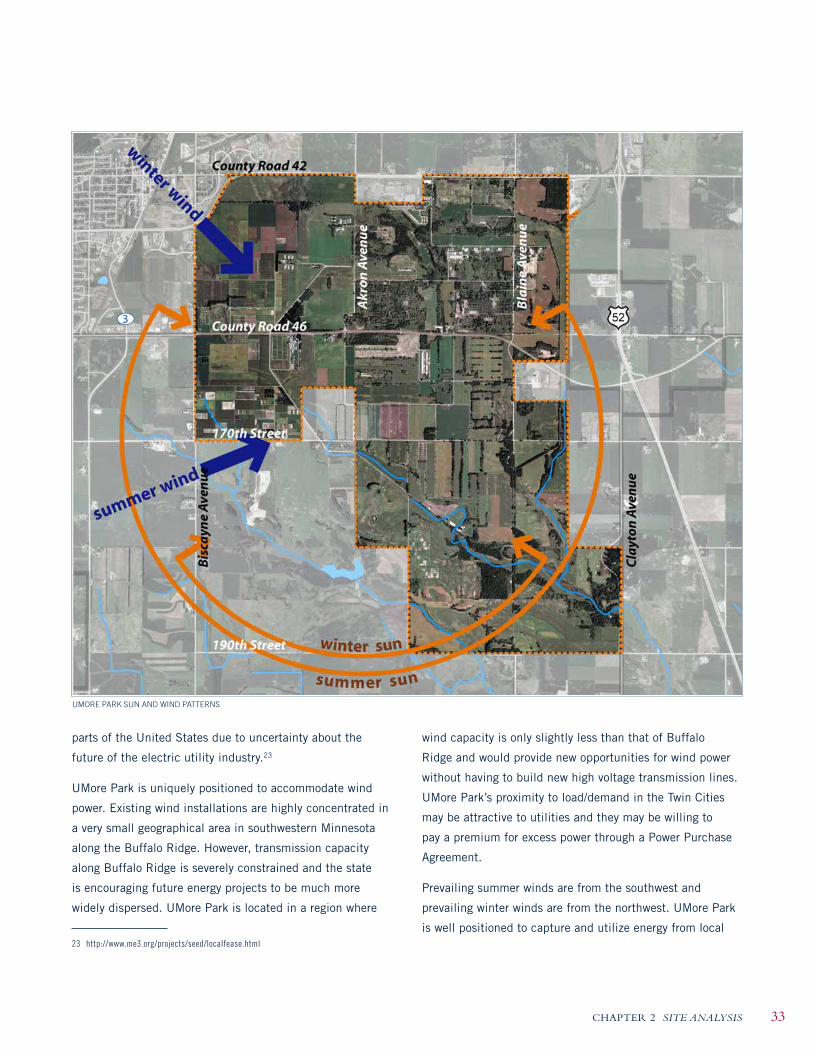
CHAPTER 2 SITE ANALYSIS 33
wind capacity is only slightly less than that of Buffalo
Ridge and would provide new opportunities for wind power
without having to build new high voltage transmission lines.
UMore Park’s proximity to load/demand in the Twin Cities
may be attractive to utilities and they may be willing to
pay a premium for excess power through a Power Purchase
Agreement.
Prevailing summer winds are from the southwest and
prevailing winter winds are from the northwest. UMore Park
is well positioned to capture and utilize energy from local
parts of the United States due to uncertainty about the
future of the electric utility industry.23
UMore Park is uniquely positioned to accommodate wind
power. Existing wind installations are highly concentrated in
a very small geographical area in southwestern Minnesota
along the Buffalo Ridge. However, transmission capacity
along Buffalo Ridge is severely constrained and the state
is encouraging future energy projects to be much more
widely dispersed. UMore Park is located in a region where
23 http://www.me3.org/projects/seed/localfease.html
UMORE PARK SUN AND WIND PATTERNS

UNIVERSITY OF MINNESOTA OUTREACH, RESEARCH AND EDUCATION DEVELOPMENT ANALYSIS34
wind patterns with average wind speeds ranging from 16.3
to 17.2 mph.24
Recently, the University of Minnesota campus in Morris
commissioned the University’s first large-scale utility
turbine. The turbine was completed in April 2005 and is
being used for energy generation on the Morris campus and
as a research instrument at the West Central Research and
24 14th Wind Resource Analysis Program Report. Minnesota Department of Commerce. June 2002.
Outreach Center. When examining wind conditions for both
Stevens County (Morris) and Dakota County (UMore Park), it
is likely that a turbine at UMore Park would be only slightly
less efficient than at Morris, yet highly feasible. The reason
for this is that the Morris turbine is located on a ridge, and
the UMore Park site is not. Other wind turbines have been
erected nearer to the UMore Park area demonstrating the
feasibility of harnessing wind power in Dakota County.
UMORE PARK SOILS AND AGGREGATE
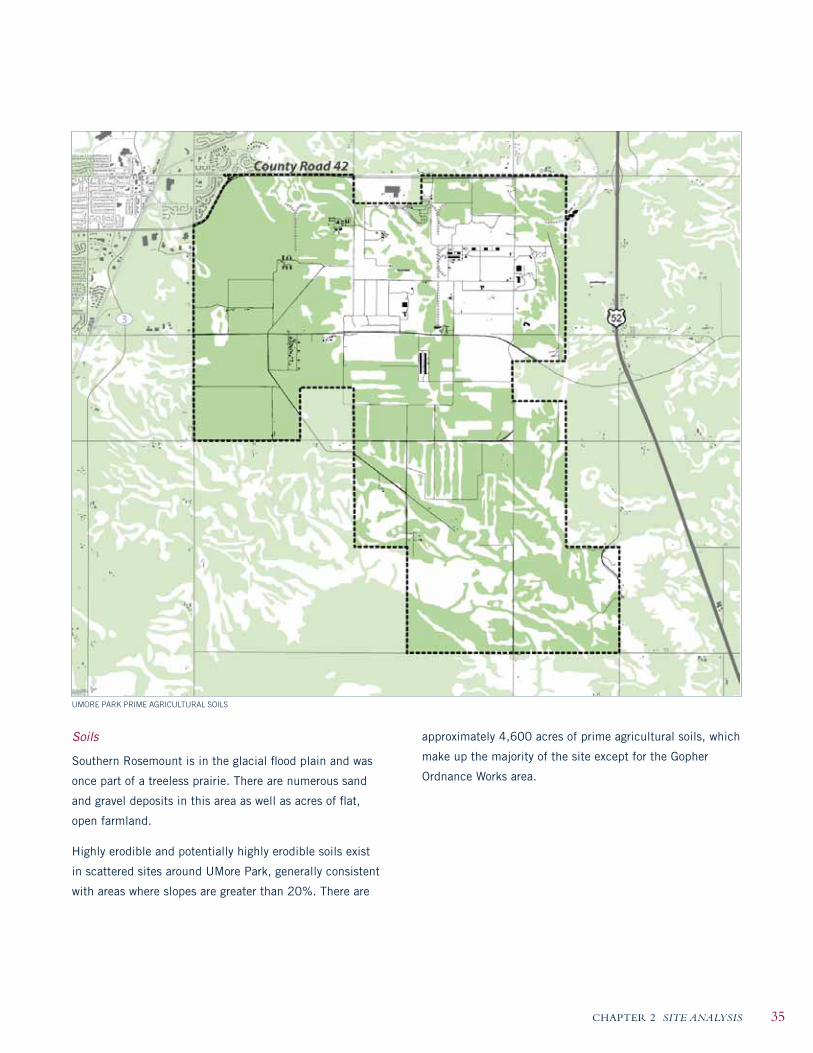
CHAPTER 2 SITE ANALYSIS 35
Soils
Southern Rosemount is in the glacial flood plain and was
once part of a treeless prairie. There are numerous sand
and gravel deposits in this area as well as acres of flat,
open farmland.
Highly erodible and potentially highly erodible soils exist
in scattered sites around UMore Park, generally consistent
with areas where slopes are greater than 20%. There are
approximately 4,600 acres of prime agricultural soils, which
make up the majority of the site except for the Gopher
Ordnance Works area.
UMORE PARK PRIME AGRICULTURAL SOILS

UNIVERSITY OF MINNESOTA OUTREACH, RESEARCH AND EDUCATION DEVELOPMENT ANALYSIS36
UMORE PARK WATER RESOURCES
Water
UMore Park is part of the Vermillion River watershed. While
some scattered wetland spots exist in the northern part of
the site, most of the 135 acres of wetlands are contained
south of 170th Street near the Vermillion River tributaries.

CHAPTER 2 SITE ANALYSIS 37
Topography
Though the topography is generally flat across the site, there
are locations where slopes exceed 30%. Of the 7,646 total
site acreage, 1,050 acres have slopes of 20% or greater.
These areas are concentrated on the southern portion of the
site south of 170th Street, as well as scattered patches to
the north of the site, primarily north of the Gopher Ordnance
Works facility.
UMORE PARK TOPOGRAPHY

UNIVERSITY OF MINNESOTA OUTREACH, RESEARCH AND EDUCATION DEVELOPMENT ANALYSIS38
migration zone for Blanding’s turtles extends 1.5 miles into
UMore Park from Inferior Pond.25
Dakota County is primarily Eastern Broadleaf forest, which
bridges the transition zone between prairie to the west and
true forest to the east. Typically, the area is characterized
by a mosaic landscape of prairie, forest and wetland
communities. UMore Park’s agricultural fields occupy what
25 Congdon and Dunham, “Delayed sexual maturity and demographics of Blanding’s Turtles.” Minnesota DNR Natural Heritage and Non-Game Research Program Environ-mental Review Fact Sheet Series. Blanding’s Turtle. September 2001.
Priority Habitat
Most of the ecologically significant landscape at UMore
Park is south of 170th Street. Habitat that is important to
the loggerhead shrike (Lanius ludovicianus), a Minnesota
threatened species, is primarily contained in this area with
a secondary area straddling County Road 46 near UMore
Park’s western edge. Another Minnesota threatened species
is Blanding’s turtle (Emydoidea blandingii), which may
be present on lands around Inferior Pond to the south.
According to the Natural Heritage Program, the potential
PRIORITY WILDLIFE HABITAT AT UMORE PARK

CHAPTER 2 SITE ANALYSIS 39
were once prairie grasslands, remnants of which exist in
some places around the slopes of the Vermillion River
tributaries. Fire disturbance moving northward from the
prairies maintained the specialized oak woodland-brushland
flora.26 UMore Park’s ecologically fragmented landscape
contains patches of prairie habitat critical for sustaining
native flora and fauna.
26 DNR, Scientific and Natural Areas. 2006.
Human Impact
The Rosemount area was inhabited by the Lower Band
Mdewakanton of the Santee Sioux tribe until 1851,
when Chief Little Crow, the leader of the New Ulm Indian
uprising, signed a treaty at Pilot Knob, Mendota, turning
the land over to the government. Settlers of European
descent then inhabited the area and developed it as farm
communities.
The Gopher Ordnance Works (GOW), an industrial military
plant erected during World War II, transformed the
GOPHER ORDNANCE WORKS

UNIVERSITY OF MINNESOTA OUTREACH, RESEARCH AND EDUCATION DEVELOPMENT ANALYSIS40
farmland. To produce “smokeless powder,” the government
stripped the land of farm buildings, roads, utility lines,
cropland and pasture, and replaced them with a complex
of approximately 800 wood and concrete manufacturing
buildings, many of which still stand. Acids, neutralizers
and other solvents were used in the manufacturing process.
These chemicals were present in some areas and buildings.
To date, contamination has been identified and remediated,
and the need for further remediation is under study.
Other human impacts, subsequent to the operation of the
Gopher Ordnance Works, include applications of chemical
pesticides and herbicides. The University also conducted
studies on the reuse of sewage sludge as crop fertilizer.
Additionally, the University used UMore Park to store
hazardous waste from its hospitals and science units. The
residual environmental effects of these activities have not
been fully explored.
On average, 600 to 900 acres are maintained in agricultural
production. Rotation of research plots over the past five
years has involved a total footprint of about 2,000 acres.
This University use has a practical value to researchers and
represents the agricultural tradition of the University’s land
grant mission to many of its neighbors.
Infrastructure
While Dakota County and the Minneapolis-St. Paul
metropolitan area have adequate infrastructure (water,
sewer, power, internet) to serve UMore Park, the timing to
make these systems accessible to development at UMore
Park is unplanned. The Rosemount plant is the region’s
smallest facility, treating 800,000 gallons of wastewater per
day. The plant will close in 2007. It will be replaced by a
lift station and interceptor to convey the wastewater to the
Empire plant for treatment.
UMORE PARK OVERLAID ON THE TWIN CITIES

CHAPTER 2 SITE ANALYSIS 41
The Metropolitan Council Environmental Services has
recently developed a wastewater plan that will close the
Rosemount plant and expand the Empire plant, which
requires the construction of an effluent pipe that will
circumvent UMore Park.
Planned capacity of the Empire plant accommodates the
projected needs of UMore Park should it be developed as a
community. The Empire plant, located near the Vermillion
River, serves approximately 99,000 people in several
communities in Dakota County. The plant treats an average
of 9 million gallons of wastewater per day (mgd); its current
capacity is 12 mgd. To meet the growth of the service area,
construction is underway to double the size of the plant
by the end of 2006. To avoid harm to the Vermillion River,
the treated wastewater will be conveyed 13 miles through
a new outfall pipe for discharge into the Mississippi River.
The regional road system is adequate for current needs
but not for a redeveloped UMore Park. Advancement of
this planning process will necessitate studies and plans to
develop roads within the site and enhance the capacity of
UMORE PARK WASTEWATER TREATMENT INFRASTRUCTURE

UNIVERSITY OF MINNESOTA OUTREACH, RESEARCH AND EDUCATION DEVELOPMENT ANALYSIS42
the supporting road system. Planning for a rail connection
between UMore Park and Minneapolis is plausible as a
function of potential demand but will take a considerable
lead time to develop.
2.3 SITE RESOURCES
Minnesota’s sand and gravel industry ranks eighth in the
United States and offers significant economic benefits,
particularly when operations are located close to where the
resource will be used (as would be the case with UMore
Park). Aggregate mining operations occur in nearly every
county in Minnesota. Aggregate materials are the essential
elements of a variety of construction products, such as
concrete. Silica sand, fine sand composed of quartz, is
mined in the southeastern part of Minnesota. Its uses
include glass-making, as a source of silicon, and improving
flow in oil wells.
In Minnesota, gravel mining operations are generally
under the jurisdiction of the host locality. This entity may
have specific regulations for development, operation, or
reclamation of a pit. Additionally, a number of state and
federal permits may apply that pertain to water quality,
water discharge, wetlands, air emissions and mine safety.
Environmental review in the form of an Environmental
Assessment Worksheet (EAW) is required for operations
that will exceed 40 acres to a mean depth of 10 feet. Local
governments are typically responsible for the preparation of
an EAW.
There are no statewide requirements or funds for the
reclamation of gravel pits in Minnesota. Sand and gravel
operations, including reclamation, are most directly handled
at the local government level (township, city, and/or
county). Plans for the reclamation of currently active gravel
operations may be included as part of the mining plan
developed by the pit operator and may be required by a
local government.

CHAPTER 2 SITE ANALYSIS 43
While there are no state funds for gravel pit reclamation,
twenty-eight counties, including Dakota County, administer
the Aggregate Material Tax.27 In these counties, 10% of the
tax raised from current gravel operations is set aside for the
reclamation of abandoned gravel pits on public land. Several
gravel pit reclamation projects on public land have been
partially funded by the proceeds from this tax.28 Counties,
townships or municipalities typically have the primary
authority for regulating extractive uses like aggregate
mining. In many counties, aggregate mining requires a
Conditional Land Use Permit (CLUP) from the county
planning and zoning office. A township or municipality
may also require a permit in addition to (or instead of) a
county permit. Local permits are generally required for new
operations that exceed a certain threshold of activity, or
for expansion of an existing operation. Local permits may
address issues such as hours of operation, noise, traffic,
dust, and reclamation.29
An end-use plan for redevelopment of a sand and gravel
site will ensure its return to an attractive appearance,
avoid erosion and sediment-related problems and, most
importantly, provide the opportunity for reuse value. Some
sand and gravel pits require more extensive reclamation or
progressive reclamation, depending on the intended end
use of the site. The objective of progressive reclamation
is to reclaim as soon as the gravel is removed and an area
is permanently abandoned.30 The main components of
reclamation are:
27 Minn. Stat. 298.75
28 Minnesota Department of Natural Resources, Division of Lands and Minerals. http://www.dnr.state.mn.us/lands_minerals/mining.html, accessed March 14, 2006.
29 Minnesota Department of Natural Resources, Division of Lands and Minerals, Environ-mental Regulations for Aggregate Mining, Fact Sheet 1, January 2001. http://files.dnr.state.mn.us/lands_minerals/aggregate1_mar01.pdf, accessed March 14, 2006.
30 Minnesota Department of Natural Resources, Division of Lands and Minerals, A Hand-book for Reclaiming Sand and Gravel Pits in Minnesota, July 1992, page 18.
• Site Stabilization and Grading: Slopes in the range
of 3:1 to 10:1 are generally satisfactory for forestry,
recreation, and some agricultural uses.
• Reapplication of Soils: Topsoil should be spread at a
depth of 6-18 inches. Prime farmland must have a
minimum of 48 inches of topsoil and subsoil.
• Establishing Vegetation: Vegetation should be
established by the first full growing season following
mine closure. Replanting trees, shrubs, and native
vegetation is crucial to the reclamation process. These
plantings should be monitored for several years to
observe signs of erosion or other failures.31
Once reclamation is achieved and maintained, a variety of
land uses may occur on the site. Examples provided by the
National Mining Association and the Minnesota Department
of Natural Resources are schools, recreation centers, parks,
malls, government facilities, airports, housing, golf and
agriculture. Land reclamation, when properly designed, can
introduce interesting topography and manmade water bodies
to complement new building construction or parks.
31 Minnesota Department of Natural Resources, http://files.dnr.state.mn.us/lands_miner-als/aggregate2_mar01.pdf.
UNIVERSITY OF MINNESOTA OUTREACH, RESEARCH AND EDUCATION DEVELOPMENT ANALYSIS44
2.4 TENANTS, CONTRACTS AND COMMITMENTS
Listed below are the parties who currently use UMore Park
vocationally: units of the University of Minnesota, the
federal government, and private parties.
University Units at UMore Park
Rosemount Research and Outreach Center is used by the faculty of:
The College of Food, Agricultural and Natural
Resource Sciences
Agronomy and Plant Genetics
Soil, Water and Climate
Plant Pathology
Animal Science
Entomology
Horticultural Science
University of Minnesota Extension Service
External Units:
USDA Cereal Disease Lab (adjunct faculty with Plant Pa-
thology)
US Forest Service (adjunct faculty with Plant Pathology)
Rosemount Research Center
College of Veterinary Medicine’s Research Farm, includes
use by Research Animal Resources
University of Minnesota Police Department Range Facility, Includes Uses by:
FBI and other federal agencies (ATF, etc.)
Police departments of local municipalities
Sheriff’s offices of local counties
Other police jurisdictions (State of Minnesota
Departments, etc.)
College of Design’s underground storage facility (use through
6/30/2016 only)
Environmental Health and Safety’s hazardous waste
storage buildings (4 buildings, 2 are licensed for temporary
radioactive materials storage-continuing until permanent
storage sites are located)
98 University units have storage at UMore Park
Third-Party Tenants at UMore Park
Forty-Four Leases:
31 commercial leases
7 farming (agricultural crop production) leases
6 residential leases
All on month-to-month leases, except these year-to-year leases:
Dakota County Sheriff’s Office Communications Tower
Dakota County Gun Club
Dole Explosives (land lease only; building space leased
month-to-month)
Jensen Field
Minneapolis Bomb Squad
Reese Enterprises
Specialized Environmental Technologies
Tri-Valley RC Flyers
All 7 farming leases (agricultural crop production)
Minnesota 49ers Training Program (terminated effective
November 30, 2006)
And except these leases (termination date noted):
Dakota County Technical College (105 Acres), through June
30, 2008

CHAPTER 2 SITE ANALYSIS 45
Pahls’ Market, through November 30, 2010
Minnesota Public Radio, through March 31, 2031, plus One
40-Year Option
Permits and easements on site have been granted to:
Dakota County (Dakota Trails Association) for snowmobile
trail
Frontier Communications for telephone lines
Northern Natural Gas for gas lines
Xcel Energy/Northern States Power for electrical lines
Cooperative Power Association for electrical lines
Dakota County Electrical Coop for electrical lines
Mid-America Pipeline Company for LPG products pipelines
Dakota County for County Roads 42 and 46, slopes
and bridges
Rosemount Township for slopes
Metropolitan Council for Empire outflow pipe and sewer
lines
City of Rosemount for water main
Peoples Natural Gas for gas lines
Dakota County Technical College for water well

CHAPTER 3 UMORE PARK MARKET ANALYSIS AND DEVELOPMENT STRATEGY 47
UMORE PARK MARKETANALYSIS AND
DEVELOPMENT STRATEGY
3.1 INTRODUCTION
Employing the findings of an in-depth market analysis of
Dakota County’s demographic profile and market rates
and trends, the Sasaki Team created and tested three
development models for UMore Park.
In the spring of 2006, as the viability of developing a
master-planned community came into focus, the UMore Park
Steering Committee met with two national-scale developers –
Forest City Enterprises and Hines – to test interest in forming
a partnership between the University and a large-scale
community developer. Each presented their qualifications to
the Steering Committee and described how prior experiences
might relate to opportunities at UMore Park. As part of these
initial discussions, the Steering Committee was invited by
each developer to visit their precedent projects.
The structure for University administration of a potential
development partnership was considered through study of
colleges and universities that manage significant levels of
non-academic real estate. For some, the mission that allows
for this activity is explicit: to augment the University’s
economic base and quality of life in the host community.
Some of these offices develop large-scale mixed-use projects
and play prominent roles as land developers in their local
and regional markets.
Members of the UMore Park Steering Committee visited four
sites to further analyze the potential direction for UMore
Park’s development. These included UniverCity at Simon
Frasier University (Burnaby, British Columbia); University
Town at the University of British Columbia (Vancouver,
British Columbia); Stapleton (Denver, Colorado); and
Palencia (St. John’s County, Florida). Visits to these locations
allowed UMore Park Steering Committee members to meet
with representatives of the respective institutions involved
in the planning and development of these sites and collect
more information on the projects and their evolution than is
publicly available.
The Steering Committee visited UniverCity and University
Town because they are university-sponsored, large-scale
community developments that mix uses. Both are expected
to generate significant revenue for their host institution and
enhance the institution’s legacy. They visited Stapleton and
Palencia at the invitation of Forest City Enterprises and
Hines, their respective developers and the two entities that
have, to date, met with the UMore Park Steering Committee
to indicate the nature and extent of their potential interest
in UMore Park. Through the latter two visits, members of the
UMore Park Steering Committee were able to further develop
a relationship with each of the entities, observe first-hand
the quality of their design and construction, and, as with the
institutional sites, gain information and insight not otherwise
accessible through literature searches.
The in-depth market analysis of UMore Park land concludes
that the University of Minnesota has an enormous land asset
that has been untapped for decades. The property, sitting in
Dakota County, is in the path of suburban growth, with new
CHAPTER THREE
UNIVERSITY OF MINNESOTA OUTREACH, RESEARCH AND EDUCATION DEVELOPMENT ANALYSIS48
development occurring at the western edge. The land has the
capacity to generate revenue to underwrite the University’s
education and research missions as well as promote the
cutting-edge thinking of the school and its forward thinking
policies.
There are many approaches to capitalizing on this asset,
ranging from passive to proactive. The potential financial
returns and positive impacts of the use of the land grow as
the University takes on a more aggressive role to positively
shape the site’s development patterns. However, as the
University takes a more active role the costs of development
and associated risks also increase. The decision makers
must consider development options from many perspectives
and decide how to best utilize this financial asset. This
full market report describes the options, their implications,
and the economics of the land planning and development
process.
The UMore Park property contains about 5,000 acres of
contiguous land in the southeast section of Metropolitan
Minneapolis – St. Paul in Dakota County. From an
investment perspective, this land’s value has not been
maximized, nor has its value to University missions been
enhanced. As with any type of financial asset, the prospects
for its return are shaped by a number of factors. For real
estate those include:
• The demographics of the marketplace – the basic
underlying economic base trends that are shaping future
demand for development of land
• Current and expected character of real estate markets;
• Competitive position of the site’s location
• Allowable uses for the land and its capacity for
development
• Financing scenarios and cost of capital
Through its market analysis the Sasaki Team found the
following:
1. The seven-county Minneapolis region has had steady
population growth since the 1990’s, which is expected
to continue and approximately double by the year 2030.
New growth is forecast to be spread throughout the
region. However, these forecasts are based on existing
and defined community comprehensive plans that are not
necessarily market based. Forecasts for Dakota County
are strong but subject to change, with the potential to
increase with a well-conceived development strategy at
UMore Park. The current population is well educated with
median household incomes well above US averages.
2. The regional economy is diverse and growing, with
representation from some Fortune 500 firms, leading to
job and business development.
3. Household growth has been at a faster rate than
population growth in the metro area as the average
household size has fallen. Dakota County comprises
10% of the housing units in the metro area, and has
seen active housing development, largely in Empire
Township and Apple Alley, but also in the Rosemount
area. Future housing development is expected to keep
pace with population growth in the county – and likely to
be consistent with the current stock that is largely single-
family, with some shifts toward housing that is oriented to
smaller, older households.
4. The region’s office market is considered to be overbuilt
with the average vacancy rate at about 15% and a vacant
supply of 10 million square feet – at current absorption
rates it would take about seven years to absorb this
excess space. The industrial market adds about 16
million square feet a year, and development is largely
build-to-suit buildings that have been constructed along
major transportation routes. These markets offer limited
potential for the UMore Park property as there are site
with better major highway access.
5. The region has about 60 million square feet of retail
space, of which 6 million has been added since 2002
during the recent hot real estate market. Vacancy rates
are low and the region’s supply of retail space is 15
square feet per capita, well below the nation’s average of
20 square feet per capita. However, the UMore Park site

CHAPTER 3 UMORE PARK MARKET ANALYSIS AND DEVELOPMENT STRATEGY 49
does not have the highly desirable highway interchanges
to offer to major retail projects like regional or super-
regional shopping centers, implying that neighborhood-
linked (e.g. town center) development is optimal.
In summary, the UMore Park property has locational and
market-based strengths and weaknesses. It is in the path
of the residential growth to the southeast and west of
the site. This bodes well for strong future residential and
opportunities on the property. Its distance from a major
highway will limit demand for most types of larger retail,
office and transportation-linked industrial uses. As a result,
the most likely development scenario is one that serves
residential demand, residential-driven office and commercial
uses and some industrial uses.
Market values for this study were estimated with the
understanding that this large site has degrees of access to a
wastewater line run by the Metropolitan Council on the west
edge of the property. For this reason, land values on the west
side of the property are higher because of their direct access
to this line. Land towards the southeast corner of the site
has less accessibility so land value is limited. The estimated
current value of land under these scenarios (assuming the
baseline concept plan for the site is accepted by the Met
Council) is $31,000 per acre, which is a weighted average
of land values. Potential contamination issues associated
with the site are not considered in this value - a detailed
environmental assessment will help assess potential impact
on value from contamination.
Hold Land without Development (Scenario A). This is a passive
approach to asset management. There is financial risk that
opportunities for the property will be diminished as other
development and municipal planning factors shape the
character of the Marketplace and even capture a substantial
share of real estate development demand. The site is likely
to remain competitively positioned after ten years but could
miss out on such things as light rail as it remains unused.
Recent rates of land appreciation are not likely to continue
given evidence the economy is slowing and interest rates are
rising. An appreciation rate of 4% was applied to grow the
current large-parcel land values during the ten year period.
Land values in 2016 at this rate of appreciation would be at
about $45,000 per acre, with a 2006 value of $31,000 per
acre. In addition to the land value there are aggregate mining
(estimated at between $14 and $21 million) and concrete
recycling opportunities, but these income-generating activities
could be conducted over all three scenarios if planned
accordingly.
Sell Land at Wholesale Prices (Scenario B). Demand for land
reflects either developer’s perceptions of market-driven demand;
or speculator’s expectation of appreciation. In this scenario,
there is no University involvement in the process and demand
for land would be based on continued household growth and
construction of housing products similar to what is now being
built (and commercial / industrial sales that reflect the character
of the site). The value that bulk purchasers would be willing to
pay is expected to be comparable to actual sales activity in the
area and would discount larger parcels. Current land values are
estimated at $31,000 per acre (see “Land Value” section for
details).
Develop a New Community (Scenario C). Case study and
literature research indicates that master planned communities
have higher market values and typically stronger sales and
leasing activity compared to subdivisions and other forms
of unplanned growth. This scenario creates sales forecasts
for incremental value to the University in several ways. The
University’s involvement in a sustainable environment that
offers health, education and recreational amenities will “grow”
market demand and thus increase the rate of sales. It also
will enhance the potential to create a more dense, planned
development that optimizes land use and land value. This
essentially gives UMore Park a market share that is larger than
the previous scenario, given the quality of the product, leading
to faster land absorption. Moreover, the University can become
an equity partner and share in the developer’s profits. There is
the chance to leverage other revenue streams such as transfer
fees as has been done in the redevelopment of Stapleton
Airport in Denver.

UNIVERSITY OF MINNESOTA OUTREACH, RESEARCH AND EDUCATION DEVELOPMENT ANALYSIS50
In considering developing a new community at UMore Park,
it is assumed that the land value incorporates trunk-level
infrastructure and basic land improvements as well as
entitlement changes that allow the land to be developed
according to a master plan. Because there are so many
undetermined variables (i.e. the nature of the relationship
between the University and a potential national developer,
the details of the level of university involvement at the site,
and the level of detail of a master plan for the community,
to name a few), it is difficult to estimate a value for this
scenario. However, it is possible to discuss potential
increments to existing values, based on the Sasaki Team’s
experience as well as published research on enhanced values
from master planned communities. Bringing the site up to
an improved level alone can increase the value up to three to
five times the current estimated values.
There is added value in developing master planned
communities. This enhanced value generated by master
planning can add up to 30% in market land value. This
can come from a 20% to 45% reduction in the amount of
land used, 15% to 25% reduction in infrastructure costs
and 7% to 15% less outlays for water and sewer lines from
increased density. This scenario offers substantial potential
for enhanced financial returns, but there are also associated
risks. The degree to which a master plan impacts the value
of a site is based on financial, social, and environmental
factors. A clear vision and well-designed master plan
are critical in securing maximal value from the land
– establishing development rights and selling raw land at a
higher value than the sum of the purchase price and/or other
investments.
These scenarios take the land from a “do nothing” approach
to the sale of raw land to infrastructure–served, development
ready property as part of the planned community. These
create a continuum of value dependent on the level of
planning that is ultimately reflected in the three scenarios.
Raw Land (Agricultural Value) Development Ready Land
Development Ready Master Plan
Lowest Value to University Highest Value to University
Consequently, there is also a continuum of risk dependent on
the level of planning. However, the risk can be mitigated by
having a well-thought, well-executed plan. This is possible if
the University partners with a national developer that is an
expert in executing large-scale, planned communities.
There is a question of timing for the University in terms of
value for the University by acting now (Scenario B and C)
versus acting later (Scenario A). The reality is that the area
around Rosemount is developing and the University has
the greatest opportunity in Scenario C to steer the course
of development. Under Scenario B the site opens a large
tract of land that would otherwise be an island in a sea of
development activity, which leads to leap-frog development
(and potentially leads to higher development costs later).
In Scenario C, initiating development of a master planned
community in the near future creates an opportunity for the
site to drive the character of other development activity in
the area. Ultimately, it could encourage different types of
adjacent development and lead to even higher site values.
Scenario A and B bring in some value from potential
aggregate mining, concrete recycling, etc., but these
activities also could take place in the master plan scenario.
Furthermore, appreciation rates in the long-term would be
higher by establishing a strong development direction now.

CHAPTER 3 UMORE PARK MARKET ANALYSIS AND DEVELOPMENT STRATEGY 51
Demographic Overview of the RegionThe seven counties that surround the UMore Park region—
Dakota, Hennepin, Anoka, Carver, Scott, Washington and
Ramsey Counties—represent a population of nearly 5 million
and 53% of Minnesota’s population. UMore Park is in Dakota
County, anticipated to be one of the fastest growing counties
of the surrounding region.
TABLE 1. DEMOGRAPHIC COMPARISON BY STATE, COUNTY AND CITY
Category United States Minnesota Dakota County Hennepin County
Population, 2000 281,421,906 4,919,479 355,904 1,116,206
CAGR* 1.2% 1.2% 2.6% 0.8%
Population % Ch., 1990-2000 13.1% 12.1% 29.3% 8.1%
%Population 18 Years & Under, 2000 25.7% 26.2% 29.2% 24.0%
%Population 65 Years & Over, 2000 12.4% 12.1% 7.4% 11.0%
Home Ownership Rate, 2000 66.2% 79.5% 78.2% 66.2%
High School Grads (25 & Over), 2000 80.4% 87.9% 93.2% 90.6%
College Grads (25 & Over), 2000 24.4% 27.4% 34.9% 39.1%
Category Anoka County Carver County Scott County Washington CountyPopulation, 2000 298,084 82,122 89,498 201,130
CAGR* 2.0% 5.5% 4.5% 3.3%
Population % Ch., 1990-2000 22.3% 46.5% 54.7% 37.9%
%Population 18 Years & Under, 2000 28.9% 31.5% 31.2% 29.4%
%Population 65 Years & Over, 2000 7.1% 7.5% 6.2% 7.6%
Home Ownership Rate, 2000 83.4% 83.5% 86.5% 85.7%
High School Grads (25 & Over), 2000 91.0% 91.4% 91.0% 94.0%
College Grads (25 & Over), 2000 21.3% 34.3% 29.4% 33.9%
Category Ramsey County Minneapolis St. PaulPopulation, 2000 511,035 382,618 287,151
CAGR* 0.5% 0.4% 0.5%
Population % Ch., 1990-2000 5.20% 3.9% 5.5%
%Population 18 Years & Under, 2000 25.60% 22.0% 27.1%
%Population 65 Years & Over, 2000 11.60% 9.1% 10.3%
Home Ownership Rate, 2000 63.50% 51.4% 54.8%
High School Grads (25 & Over), 2000 87.60% 85.0% 83.8%
College Grads (25 & Over), 2000 34.30% 37.4% 32.0%
* CAGR = Compounded Annual Growth RateSource: U.S. Census
3.2 UMORE PARK MARKET ANALYSIS AND DEVELOPMENT STRATEGY
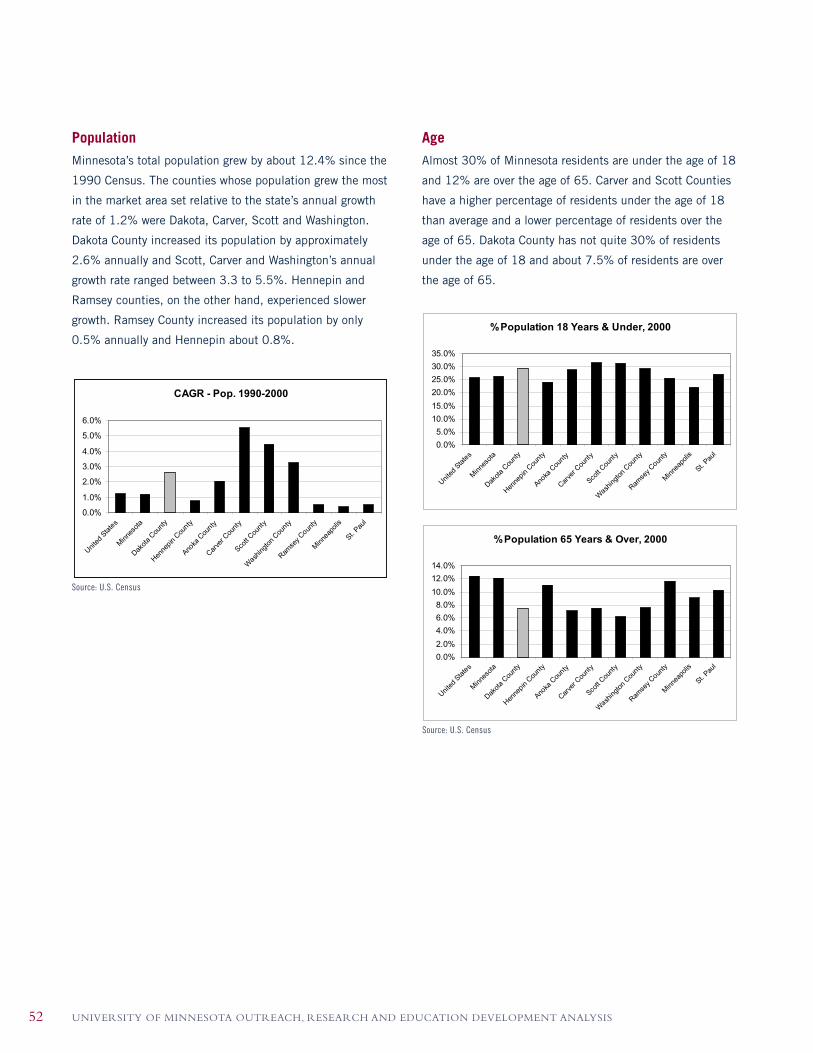
UNIVERSITY OF MINNESOTA OUTREACH, RESEARCH AND EDUCATION DEVELOPMENT ANALYSIS52
PopulationMinnesota’s total population grew by about 12.4% since the
1990 Census. The counties whose population grew the most
in the market area set relative to the state’s annual growth
rate of 1.2% were Dakota, Carver, Scott and Washington.
Dakota County increased its population by approximately
2.6% annually and Scott, Carver and Washington’s annual
growth rate ranged between 3.3 to 5.5%. Hennepin and
Ramsey counties, on the other hand, experienced slower
growth. Ramsey County increased its population by only
0.5% annually and Hennepin about 0.8%.
AgeAlmost 30% of Minnesota residents are under the age of 18
and 12% are over the age of 65. Carver and Scott Counties
have a higher percentage of residents under the age of 18
than average and a lower percentage of residents over the
age of 65. Dakota County has not quite 30% of residents
under the age of 18 and about 7.5% of residents are over
the age of 65.
CAGR - Pop. 1990-2000
0.0%
1.0%
2.0%
3.0%
4.0%
5.0%
6.0%
United
State
s
Minn
esot
a
Dakot
aCou
nty
Henne
pinCou
nty
Anoka
County
Carve
r Count
y
Scott
Count
y
Wash
ingto
nCou
nty
Ramse
y County
Minn
eapo
lis
St.Pau
l
Source: U.S. Census
%Population 18 Years & Under, 2000
0.0%
5.0%
10.0%
15.0%
20.0%
25.0%
30.0%
35.0%
United
State
s
Minn
esot
a
Dakot
aCou
nty
Henne
pinCou
nty
Anoka
County
Carve
r Count
y
Scott
Count
y
Wash
ingto
nCou
nty
Ramse
y County
Minn
eapo
lis
St.Pau
l
%Population 65 Years & Over, 2000
0.0%
2.0%
4.0%
6.0%
8.0%
10.0%
12.0%
14.0%
United
State
s
Minn
esot
a
Dakot
aCou
nty
Henne
pinCou
nty
Anoka
County
Carve
r Count
y
Scott
Count
y
Wash
ingto
nCou
nty
Ramse
y County
Minn
eapo
lis
St.Pau
l
Source: U.S. Census

CHAPTER 3 UMORE PARK MARKET ANALYSIS AND DEVELOPMENT STRATEGY 53
The distribution of population by age is anticipated to
change. The following chart indicates that the older age
segments are increasing as a percentage of total population
for Dakota County, while the youngest population stays about
the same.
Source: MN Planning - Dakota County: An Economic and Demographic Assessment
Educational Attainment27.4% of the state’s residents have a college degree. In
the Twin Cities metro area, Hennepin County (39.1%) has
the highest percentage of college graduates. Dakota County
ranks second (34.9%) and all of the counties, besides
Anoka, have rates above the state average.
IncomeThe median household income in the Twin Cities, according
to the 1999 Census, was $54,304. After adjustment for
inflation, median household income increased by 14.4%
between 1989 and 1999. Dakota County’s inflation adjusted
income was 12.9% for the same period - Dakota County falls
in the middle of the seven-county’s 1999 median income
breakout as shown in the following chart.
Source: U.S. Census
Median Home Value by CountyCarver County has the highest median home value, followed
by Scott County, Washington County, and Dakota County.
$61,863$57,754
$51,711 $45,722
$66,612 $66,305 $65,540
$0
$10,000
$20,000
$30,000
$40,000
$50,000
$60,000
$70,000
Scott Washington Carver Dakota Anoka Hennepin Ramsey
Median HH Income
Source: U.S. Census
$0$20,000$40,000$60,000$80,000
$100,000$120,000$140,000$160,000$180,000
Minn
esot
a
Dakot
a
Henne
pin
Ramse
y
Carve
r
Was
hingt
on
Anoka
Scott
County
Med
ian
Valu
e
College Grads (25 & Over), 2000
0.0%5.0%
10.0%15.0%20.0%25.0%30.0%35.0%40.0%45.0%
United
State
s
Minn
esot
a
Dakot
aCou
nty
Henne
pinCou
nty
Anoka
County
Carve
r Count
y
Scott
Count
y
Wash
ingto
nCou
nty
Ramse
y County
Minn
eapo
lis
St.Pau
l
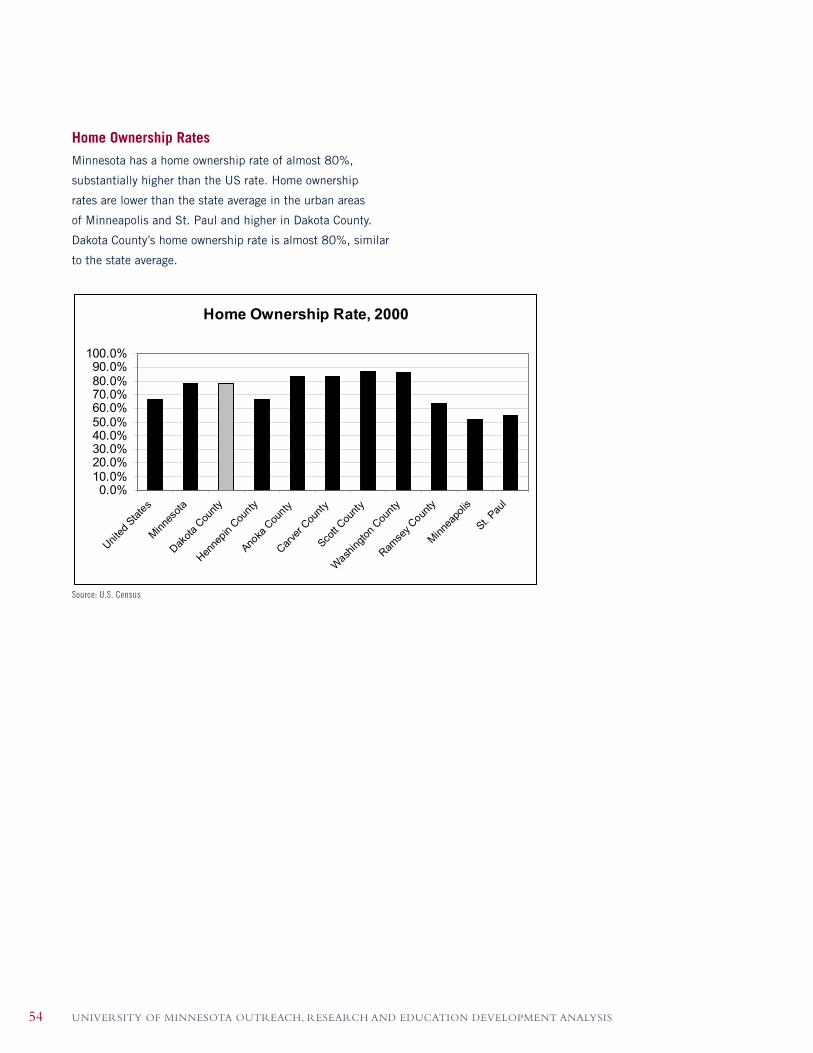
UNIVERSITY OF MINNESOTA OUTREACH, RESEARCH AND EDUCATION DEVELOPMENT ANALYSIS54
Home Ownership RatesMinnesota has a home ownership rate of almost 80%,
substantially higher than the US rate. Home ownership
rates are lower than the state average in the urban areas
of Minneapolis and St. Paul and higher in Dakota County.
Dakota County’s home ownership rate is almost 80%, similar
to the state average.
Home Ownership Rate, 2000
0.0%10.0%20.0%30.0%40.0%50.0%60.0%70.0%80.0%90.0%
100.0%
United
State
s
Minn
esot
a
Dakot
aCou
nty
Henne
pinCou
nty
Anoka
County
Carve
r Count
y
Scott
Count
y
Wash
ingto
nCou
nty
Ramse
y County
Minn
eapo
lis
St.Pau
l
Source: U.S. Census
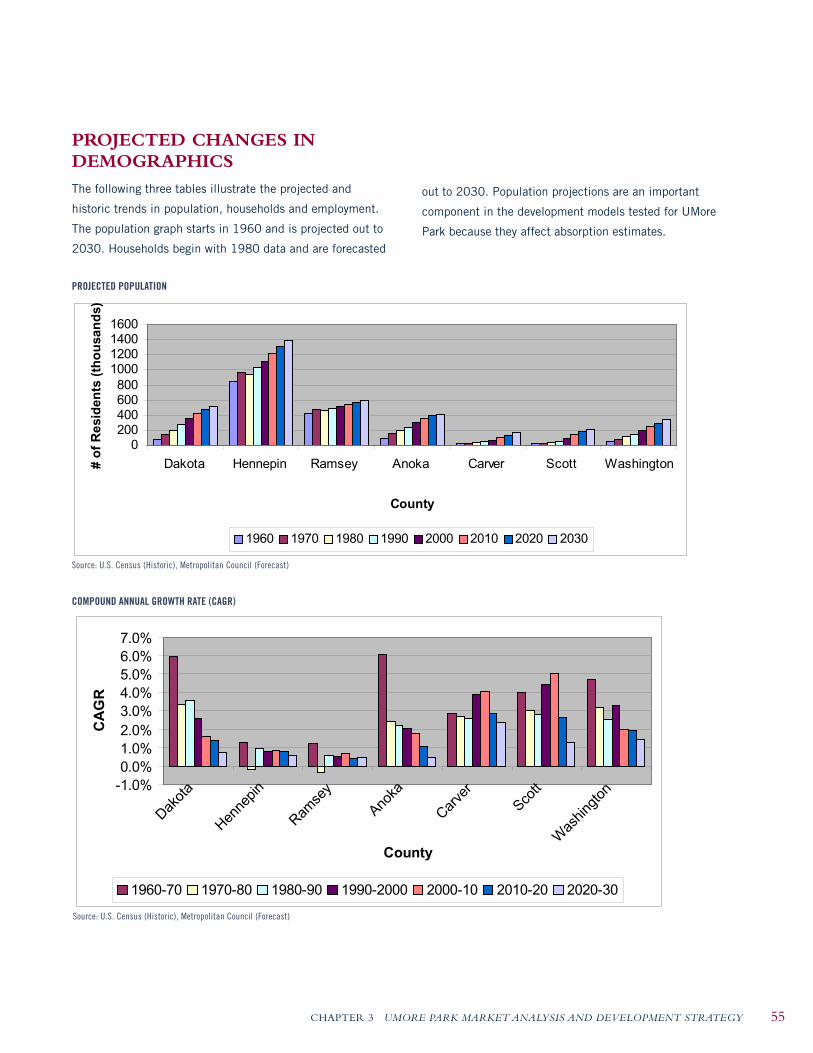
CHAPTER 3 UMORE PARK MARKET ANALYSIS AND DEVELOPMENT STRATEGY 55
PROJECTED CHANGES IN DEMOGRAPHICS
The following three tables illustrate the projected and
historic trends in population, households and employment.
The population graph starts in 1960 and is projected out to
2030. Households begin with 1980 data and are forecasted
0200400600800
1000120014001600
Dakota Hennepin Ramsey Anoka Carver Scott Washington
County
# o
f R
esid
en
ts (
tho
us
an
ds)
1960 1970 1980 1990 2000 2010 2020 2030
Source: U.S. Census (Historic), Metropolitan Council (Forecast)
-1.0%0.0%1.0%2.0%3.0%4.0%5.0%6.0%7.0%
Dakot
a
Henne
pin
Ramse
y
Anoka
Carve
rSco
tt
Was
hingt
on
County
CA
GR
1960-70 1970-80 1980-90 1990-2000 2000-10 2010-20 2020-30
COMPOUND ANNUAL GROWTH RATE (CAGR)
out to 2030. Population projections are an important
component in the development models tested for UMore
Park because they affect absorption estimates.
PROJECTED POPULATION
Source: U.S. Census (Historic), Metropolitan Council (Forecast)

UNIVERSITY OF MINNESOTA OUTREACH, RESEARCH AND EDUCATION DEVELOPMENT ANALYSIS56
0100,000200,000300,000400,000500,000600,000700,000
Dakot
a
Henne
pin
Ramse
y
Anoka
Carve
rSco
tt
Was
hingt
on
County
# o
f H
ou
se
ho
lds
1980 1990 2000 2010 2020 2030
Source: U.S. Census (Historic), Metropolitan Council (Projections)
TOTAL HOUSEHOLDS
Since 1960 the population of all seven counties has grown
steadily, with the exception of Hennepin and Ramsey
Counties which had a slight dip in 1980. Projecting from
2000 to 2010, Dakota County is expected to grow by an
annual rate of 1.6%.
Projected HouseholdsHouseholds in all seven counties are anticipated to grow
from 2000 to 2010 with the strongest growth occurring in
Scott County. Dakota County experienced a stronger annual
growth rate than the rest of the region from 1980 to 1990,
as highlighted by the CAGR chart. However, after 1990
Dakota County levels dropped to the middle range of its
surrounding counties. By 2010, Dakota County is projected
to see an annual growth rate of 2.0%, with the number of
households in Dakota County estimated to break 200,000 by
2030. Carver, Scott and Washington are seeing even stronger
growth. Scott is predicted to have the strongest growth
rate of all seven counties in region, with an average annual
growth rate to 2030 of about 3.5%.1
1. Source: U.S. Census (Historic), Metropolitan Council (Projections)
The average household size in Dakota County is estimated
to decline from about 3 persons per household to 2.5
persons per household. In fact, all seven counties are
anticipated to see a reduction in household size. This will
have implications for the type of housing made available
to the market in the future.

CHAPTER 3 UMORE PARK MARKET ANALYSIS AND DEVELOPMENT STRATEGY 57
EMPLOYMENT ANALYSIS
Prospects for employment growth in Dakota County and the
Rosemount area will be influenced by factors such as the
aging work force and location of UMore Park relative to other
municipal employment centers, including Eagan, Apple
Valley, Burnsville and Inver Grove Heights, that are more
proximate to major transportation systems.
The following table shows changes in employment for select
jurisdictions. Notice that Dakota County shows a percentage
growth from 2000 to 2004 second only to Scott County,
which is considerably smaller.
Dakota County shows a substantially higher compound
annual growth rate (CAGR) than either the MSA or the
state. Between 2000 and 2030, Minnesota employment
is projected to grow by 26%, the Twin Cities employment
base by 36% and Dakota County employment by 44%. In
2000, Dakota County had a larger percentage of residents
TABLE 2. TOTAL EMPLOYMENT CHANGE
Jurisdiction 2000 2004 Change(‘00-’04) % Change
USA 137,614,000 140,133,000 2,519,000 2%
Minneapolis 308,127 286,235 -21,892 -7%
Dakota County 154,242 169,525 15,283 10%
Hennepin County 877,693 825,858 -51,835 -6%
Ramsey County 334,207 327,837 -6,370 -2%
Anoka County 110,091 113,449 3,358 3%
Carver County 29,055 31,476 2,421 8%
Scott County 34,980 40,858 5,878 17%
Washington County 67,649 72,442 4,793 7%
Rosemount 6,356 6,866 510 8%
Source: US Census, Metropolitan Council, Bureau of Labor Statistics
TABLE 3. EMPLOYMENT PROJECTION
Jurisdiction 2000 2030 CAGR Total Percent Change
Minnesota 2,684,900 3,382,974 0.77% 26%
Twin Cities MSA 1,748,000 2,377,280 1.03% 36%
Dakota County 154,242 222,108 1.22% 44%
Source: Minneapolis Dept. of Employment and Economic Development
under 18 years of age than over 65 compared to the MSA
and state. This should help to meet the demand for qualified
employees resulting from projected rapid employment
growth. Dakota County has about 9% of the Twin Cities MSA
employment and is anticipated to see about 11% of Twin
Cities employment growth over the next thirty years. It is
estimated that Dakota County’s net employment will increase
to 68,000 employees over the next thirty years, while the
Twin Cities MSA’s2 employment growth is projected to grow
to 629,000 employees.
The table below illustrates employment trends for the ten
largest cities in Dakota County from 2000 to 2004. Only
Farmington employs less people than Rosemount, but
Rosemount shows modest growth in employment relative to
other highlighted jurisdictions. The cities with the largest
employee base are Eagan, Burnsville and Apple Valley due to
their proximity to major interstates including I-35 and I-494.
Rosemount is located farther from these interstates, closer to
Highway 52.
2. The Twin Cities MSA refers to the Minneapolis-St. Paul-Bloomington MSA.

UNIVERSITY OF MINNESOTA OUTREACH, RESEARCH AND EDUCATION DEVELOPMENT ANALYSIS58
TABLE 4. DAKOTA COUNTY EMPLOYMENT BY CITY
Jurisdiction 2000 2004 Change(‘00-’04) % Change
Eagan 42,750 48,804 6,054 14%
Burnsville 31,765 32,387 622 2%
Apple Valley 12,106 13,931 1,825 15%
Lakeville 10,966 12,941 1,975 18%
Inver Grove Heights 7,468 9,665 2,197 29%
South St. Paul 7,697 7,764 67 1%
West St. Paul 8,905 8,417 -488 -5%
Hastings 8,872 9,167 295 3%
Rosemount 6,356 6,866 510 8%
Farmington 3,986 4,535 549 14%
Source: Minneapolis Dept. of Employment and Economic Development
In 2003, nearly 40% of Dakota County employees
worked in retail, manufacturing or transportation and
warehousing. The number of employees in transportation
and warehousing nearly doubled from 2000 to 2003. Other
notable employment gains were accrued in management of
companies and enterprises (+ 26%) and utilities (+ 16%).
TABLE 5. DAKOTA COUNTY EMPLOYMENT BY INDUSTRY
Industry 2000 2000 % of Workers 2003 2003 % of
WorkersChange(‘00-’03) % Change
Mining 103 0.1% 106 0.0% 3 3%
Utilities 311 0.2% 360 0.1% 49 16%
Construction 10,980 7.2% 9,413 2.6% -1,567 -14%
Manufacturing 18,061 11.8% 17,861 4.9% -200 -1%
Wholesale Trade 11,129 7.3% 11,404 3.2% 275 2%
Retail Trade 21,874 14.3% 23,109 64.0% 1,235 6%
Transportation & Warehousing 9,341 6.1% 18,081 5.0% 8,740 94%
Information 9,707 6.4% 7,904 2.2% -1,803 -19%
Finance & Insurance 9,429 6.2% 7,233 2.0% -2,196 -23%
Real Estate, Rental & Leasing 2,236 1.5% 1,744 0.5% -492 -22%
Professional, Scientific & Technical services 6,798 4.4% 6,188 1.7% -610 -9%
Management of Companies & Enterprises 3,762 2.5% 4,726 1.3% 964 26%
Admin, Support & Waste Mgt Services 7,240 4.7% 6,919 1.9% -321 -4%
Educational Services 1,890 1.2% 1,443 0.4% -447 -24%
Health Care & Social Assistance 16,155 10.6% 12,252 3.4% -3,903 -24%
Arts, Entertainment & Recreation 2,782 1.8% 2,948 0.8% 166 6%
Accommodation & Food Services 13,243 8.7% 12,947 3.6% -296 -2%
Other Services 7,807 5.1% 8,352 2.3% 545 7%
Source: US Census

CHAPTER 3 UMORE PARK MARKET ANALYSIS AND DEVELOPMENT STRATEGY 59
The following table lists the largest employers in Dakota
County in 2005. These companies have a significant number
of workers and are potential target markets for a residential
community at UMore Park.
In 2000, Hennepin and Ramsey counties were net importers
of labor, containing more jobs than residents. Approximately
59% of people working in Dakota County reside in the
County, while roughly 41% come from outside of the county
(largely from within the seven-county metropolitan area).
The majority of employees who reside in Dakota County
commute between 15 and 29 minutes to reach their place
of work. The average commute for Dakota County is 22.8
minutes and for the MSA it is 23.6 minutes. These are
important statistics to reference when identifying the extent
to which UMore Park may be able to attract residents in
relation to their places of work.3
3 Dakota Future
TABLE 6. LARGEST EMPLOYERS IN DAKOTA COUNTY, 2005
Corporation Employees City
Thompson West 7,000 Eagan
Blue Cross / Blue Shield 3,000 Eagan
Lockheed Martin 1,750 Eagan
United Parcel Service 1,435 Eagan
Goodrich Sensor Systems 1,150 Burnsville
Northwest Airlines 1,100 Eagan
CHS Inc. 1,000 Inver Grove Heights
Cray Inc. 900 Eagan
Fairview Ridges Hospital 880 Burnsville
Flint Hills Resources 850 Rosemount
Smead Manufacturing Co. 625 Hastings
Source: Krumrie, Matt. “Who’s doing business in diverse combo of cities”,Upsize Mag.,Nov. 2005
TABLE 7. PLACE OF RESIDENCE FOR DAKOTA COUNTY EMPLOYEES
Place of Residence
# of Dakota County’s 2030 Employees
Dakota County 58.7% 130,378
Hennepin 11.3% 25,098
Ramsey 9.2% 20,434
Washington 5.4% 11,994
MN (not Metro) 5.3% 11,772
Scott 5.2% 11,550
Outside MN 2.8% 6,219
Anoka 1.7% 3,776
Carver 0.5% 1,111
Source: US Census, Metro Council
TABLE 8. PLACE OF WORK FOR DAKOTA COUNTY RESIDENTS
Place of Work
Dakota County 45.8%
Hennepin 31.8%
Ramsey 14.2%
Washington 1.9%
MN (not Metro) 2.0%
Scott 2.3%
Outside MN 0.9%
Anoka 0.6%
Carver 0.5%
Source: US Census
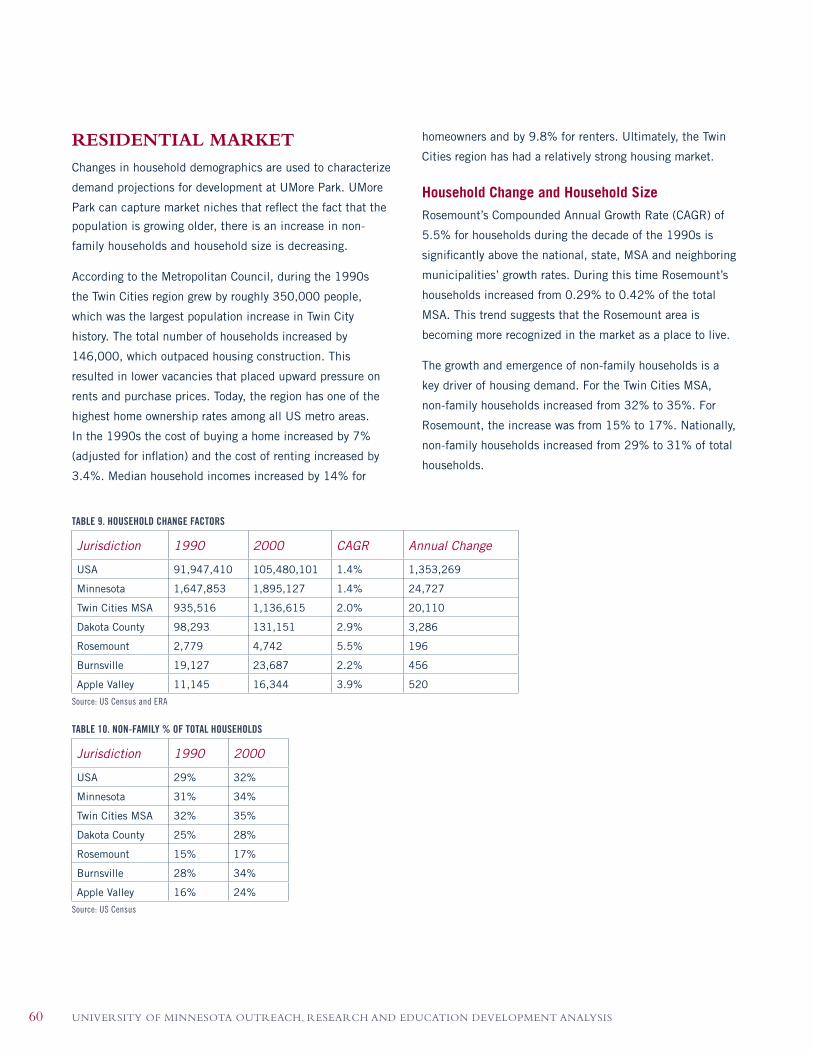
UNIVERSITY OF MINNESOTA OUTREACH, RESEARCH AND EDUCATION DEVELOPMENT ANALYSIS60
RESIDENTIAL MARKET
Changes in household demographics are used to characterize
demand projections for development at UMore Park. UMore
Park can capture market niches that reflect the fact that the
population is growing older, there is an increase in non-
family households and household size is decreasing.
According to the Metropolitan Council, during the 1990s
the Twin Cities region grew by roughly 350,000 people,
which was the largest population increase in Twin City
history. The total number of households increased by
146,000, which outpaced housing construction. This
resulted in lower vacancies that placed upward pressure on
rents and purchase prices. Today, the region has one of the
highest home ownership rates among all US metro areas.
In the 1990s the cost of buying a home increased by 7%
(adjusted for inflation) and the cost of renting increased by
3.4%. Median household incomes increased by 14% for
homeowners and by 9.8% for renters. Ultimately, the Twin
Cities region has had a relatively strong housing market.
Household Change and Household SizeRosemount’s Compounded Annual Growth Rate (CAGR) of
5.5% for households during the decade of the 1990s is
significantly above the national, state, MSA and neighboring
municipalities’ growth rates. During this time Rosemount’s
households increased from 0.29% to 0.42% of the total
MSA. This trend suggests that the Rosemount area is
becoming more recognized in the market as a place to live.
The growth and emergence of non-family households is a
key driver of housing demand. For the Twin Cities MSA,
non-family households increased from 32% to 35%. For
Rosemount, the increase was from 15% to 17%. Nationally,
non-family households increased from 29% to 31% of total
households.
TABLE 9. HOUSEHOLD CHANGE FACTORS
Jurisdiction 1990 2000 CAGR Annual Change
USA 91,947,410 105,480,101 1.4% 1,353,269
Minnesota 1,647,853 1,895,127 1.4% 24,727
Twin Cities MSA 935,516 1,136,615 2.0% 20,110
Dakota County 98,293 131,151 2.9% 3,286
Rosemount 2,779 4,742 5.5% 196
Burnsville 19,127 23,687 2.2% 456
Apple Valley 11,145 16,344 3.9% 520
Source: US Census and ERA
TABLE 10. NON-FAMILY % OF TOTAL HOUSEHOLDS
Jurisdiction 1990 2000
USA 29% 32%
Minnesota 31% 34%
Twin Cities MSA 32% 35%
Dakota County 25% 28%
Rosemount 15% 17%
Burnsville 28% 34%
Apple Valley 16% 24%
Source: US Census

CHAPTER 3 UMORE PARK MARKET ANALYSIS AND DEVELOPMENT STRATEGY 61
Non-family households are increasing in all Twin Cities
metro-area counties – non-family households are anticipated
to be almost 35% of all households in Dakota County by
2030. This is an opportunity market for UMore Park.
Growth in non-family housing is also decreasing the
average household size. This is noteworthy because smaller
households will have different housing needs.
Rosemount experienced a notable increase in some of
the older age cohorts from 1990 to 2000. For example,
from 1990 to 2000, the number of households with a
householder aged 45 to 54 years or older increased from
13% to 20%.
TABLE 12. HOUSEHOLDS BY AGE OF HOUSEHOLDER, 1990 VS. 2000
Age Cohort UnitedStates Minnesota Dakota
County Apple Valley Burnsville Rosemount Twin Cities MSA
1990
15 to 24 years 5% 6% 5% 3% 7% 5% 6%
25 to 34 years 22% 24% 30% 29% 32% 33% 27%
35 to 44 years 22% 23% 27% 36% 26% 30% 25%
45 to 54 years 16% 15% 16% 22% 19% 13% 15%
55 to 64 years 13% 12% 10% 7% 10% 11% 11%
65 to 74 years 13% 11% 7% 2% 5% 5% 9%
75 years + 9% 10% 4% 1% 1% 3% 7%
2000
15 to 24 years 5% 6 % 5% 3% 8% 2% 5%
25 to 34 years 17% 18% 20% 19% 22% 22% 20%
35 to 44 years 23% 24% 29% 29% 25% 35% 26%
45 to 54 years 20% 20% 22% 26% 21% 20% 21%
55 to 64 years 14% 13% 12% 14% 13% 10% 12%
65 to 74 years 11% 10% 7% 6% 7% 7% 8%
75 years + 10% 10% 6% 4% 4% 4% 8%
Source: US Census
Retirements of the Baby Boomer generation and growth
in non-family households will contribute to decreases
in average household size in the next decade. Growth of
demand in these submarkets could considerably alter area-
housing markets, and generate demand for housing options
such as higher density townhomes, bungalows, row houses,
and other similar products (either owned or for rent).
TABLE 11. AVERAGE HOUSEHOLD SIZE
Jurisdiction 1990 2000 CAGR
USA 2.63 2.59 -0.2%
Minnesota 2.58 2.52 -0.2%
Twin Cities MSA 2.58 2.56 -0.1%
Dakota County 2.78 2.7 -0.3%
Rosemount 3.1 3.08 -0.1%
Burnsville 2.67 2.53 -0.5%
Apple Valley 3.09 2.77 -1.1%
Source: US Census and ERA
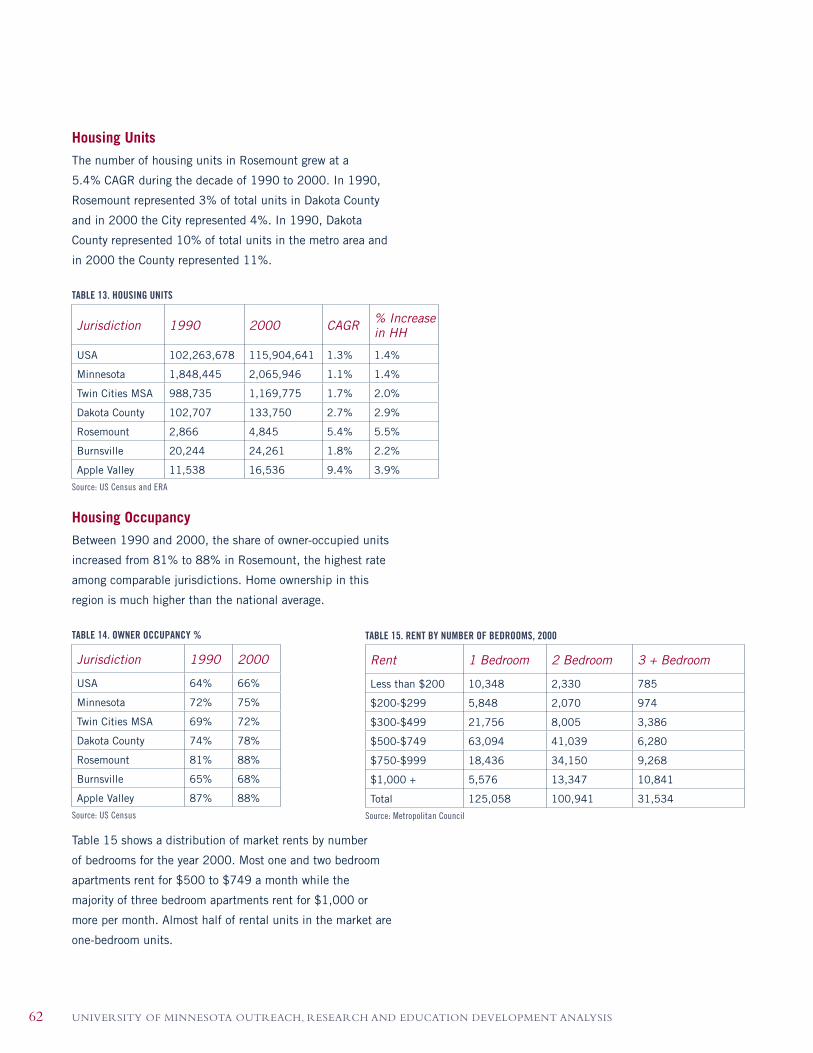
UNIVERSITY OF MINNESOTA OUTREACH, RESEARCH AND EDUCATION DEVELOPMENT ANALYSIS62
Housing UnitsThe number of housing units in Rosemount grew at a
5.4% CAGR during the decade of 1990 to 2000. In 1990,
Rosemount represented 3% of total units in Dakota County
and in 2000 the City represented 4%. In 1990, Dakota
County represented 10% of total units in the metro area and
in 2000 the County represented 11%.
TABLE 13. HOUSING UNITS
Jurisdiction 1990 2000 CAGR % Increase in HH
USA 102,263,678 115,904,641 1.3% 1.4%
Minnesota 1,848,445 2,065,946 1.1% 1.4%
Twin Cities MSA 988,735 1,169,775 1.7% 2.0%
Dakota County 102,707 133,750 2.7% 2.9%
Rosemount 2,866 4,845 5.4% 5.5%
Burnsville 20,244 24,261 1.8% 2.2%
Apple Valley 11,538 16,536 9.4% 3.9%
Source: US Census and ERA
Housing OccupancyBetween 1990 and 2000, the share of owner-occupied units
increased from 81% to 88% in Rosemount, the highest rate
among comparable jurisdictions. Home ownership in this
region is much higher than the national average.
TABLE 14. OWNER OCCUPANCY %
Jurisdiction 1990 2000
USA 64% 66%
Minnesota 72% 75%
Twin Cities MSA 69% 72%
Dakota County 74% 78%
Rosemount 81% 88%
Burnsville 65% 68%
Apple Valley 87% 88%
Source: US Census
Table 15 shows a distribution of market rents by number
of bedrooms for the year 2000. Most one and two bedroom
apartments rent for $500 to $749 a month while the
majority of three bedroom apartments rent for $1,000 or
more per month. Almost half of rental units in the market are
one-bedroom units.
TABLE 15. RENT BY NUMBER OF BEDROOMS, 2000
Rent 1 Bedroom 2 Bedroom 3 + Bedroom
Less than $200 10,348 2,330 785
$200-$299 5,848 2,070 974
$300-$499 21,756 8,005 3,386
$500-$749 63,094 41,039 6,280
$750-$999 18,436 34,150 9,268
$1,000 + 5,576 13,347 10,841
Total 125,058 100,941 31,534
Source: Metropolitan Council
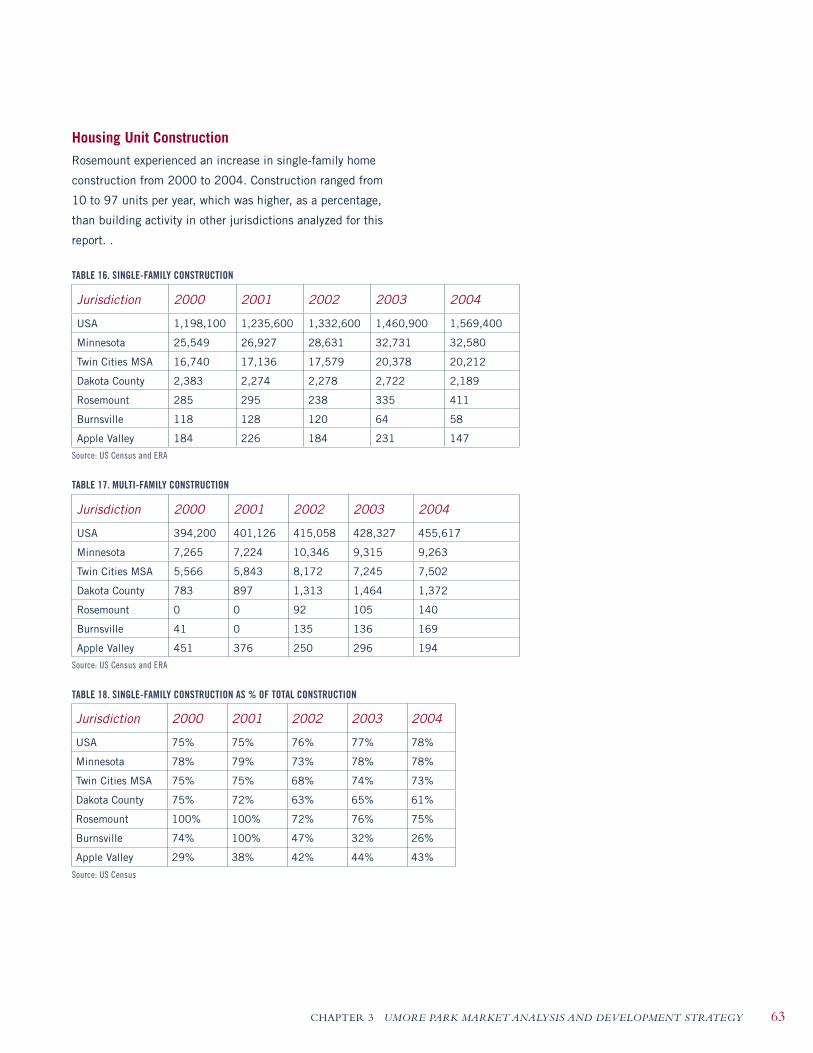
CHAPTER 3 UMORE PARK MARKET ANALYSIS AND DEVELOPMENT STRATEGY 63
Housing Unit ConstructionRosemount experienced an increase in single-family home
construction from 2000 to 2004. Construction ranged from
10 to 97 units per year, which was higher, as a percentage,
than building activity in other jurisdictions analyzed for this
report. .
TABLE 16. SINGLE-FAMILY CONSTRUCTION
Jurisdiction 2000 2001 2002 2003 2004
USA 1,198,100 1,235,600 1,332,600 1,460,900 1,569,400
Minnesota 25,549 26,927 28,631 32,731 32,580
Twin Cities MSA 16,740 17,136 17,579 20,378 20,212
Dakota County 2,383 2,274 2,278 2,722 2,189
Rosemount 285 295 238 335 411
Burnsville 118 128 120 64 58
Apple Valley 184 226 184 231 147
Source: US Census and ERA
TABLE 17. MULTI-FAMILY CONSTRUCTION
Jurisdiction 2000 2001 2002 2003 2004
USA 394,200 401,126 415,058 428,327 455,617
Minnesota 7,265 7,224 10,346 9,315 9,263
Twin Cities MSA 5,566 5,843 8,172 7,245 7,502
Dakota County 783 897 1,313 1,464 1,372
Rosemount 0 0 92 105 140
Burnsville 41 0 135 136 169
Apple Valley 451 376 250 296 194
Source: US Census and ERA
TABLE 18. SINGLE-FAMILY CONSTRUCTION AS % OF TOTAL CONSTRUCTION
Jurisdiction 2000 2001 2002 2003 2004
USA 75% 75% 76% 77% 78%
Minnesota 78% 79% 73% 78% 78%
Twin Cities MSA 75% 75% 68% 74% 73%
Dakota County 75% 72% 63% 65% 61%
Rosemount 100% 100% 72% 76% 75%
Burnsville 74% 100% 47% 32% 26%
Apple Valley 29% 38% 42% 44% 43%
Source: US Census

UNIVERSITY OF MINNESOTA OUTREACH, RESEARCH AND EDUCATION DEVELOPMENT ANALYSIS64
Dakota County was one of only two counties that built
fewer single-family units in 2004 than in 2000. Most
counties show a steadily increasing supply of single-family
units during the four-year period. In 2004, single-family
construction in Dakota County represented about 11% of
total MSA single-family building activity. Trends in multi-
family construction are not as clear. Select counties,
including Dakota, experienced relatively steady increases in
new units where as other counties experienced significant
year-to-year fluctuations in construction activity. In 2004,
Dakota County accounted for about 18% of total MSA multi-
family construction.4
4. Source: US Census and ERA
Rosemount shows relatively steady growth in construction
across the four year period in contrast with other cities. In
2004, Rosemount accommodated roughly 20% of County-
wide single-family construction. From 2000 to 2004, select
cities, including Rosemount, had a drastic increase in
multi-family housing construction. Inver Grove Heights went
from four units in 2000 to 429 in 2004. Eagan, Burnsville,
Hastings and Rosemount all show impressive growth during
the same period. Rosemount is one of three cities that show
a higher level of single-family construction in 2004 when
compared to 2000. Metro-wide, Rosemount was ranked
6th of cities for single-family housing permits in 2004.
Rosemount ranked 10th for total permits issued among metro
cities in the same year, and ranked 9th for new affordable
housing owner-occupied units.5
5. Report to the Minnesota Legislature on Affordable and Life-Cycle Housing In the Twin Cities Metropolitan Area, 2004. December 2005
TABLE 21. DAKOTA COUNTY MULTI-FAMILY CONSTRUCTION BY CITY
Jurisdiction 2000 2001 2002 2003 2004
Eagan 73 19 114 207 0
Burnsville 41 0 135 136 169
Apple Valley 451 376 250 296 194
Lakeville 21 20 214 93 378
Inver Grove Heights
4 159 273 429 307
South St. Paul 2 0 20 0 35
West St. Paul 97 0 0 0 0
Hastings 20 197 195 129 133
Rosemount 0 0 92 105 140
Farmington 50 122 0 0 0
Source: US Census
TABLE 22. ROSEMOUNT CONSTRUCTION AS % OF DAKOTA COUNTY
Unit Type 2000 2001 2002 2003 2004
Single-family 13% 14% 11% 13% 20%
Multi-family 0% 0% 7% 8% 10%
Source: US Census
TABLE 19. DAKOTA COUNTY CONSTRUCTION AS % OF TWIN CITIES MSA
Unit Type 2000 2001 2002 2003 2004
Single-family 14% 13% 13% 13% 11%
Multi-family 14% 15% 16% 20% 18%
Source: US Census
TABLE 20. DAKOTA COUNTY SINGLE-FAMILY CONSTRUCTION BY CITY
Jurisdiction 2000 2001 2002 2003 2004
Eagan 259 216 243 184 147
Burnsville 118 128 120 64 58
Apple Valley 184 226 184 231 147
Lakeville 592 513 472 687 541Inver Grove Heights
204 159 115 198 217
South St. Paul 25 29 25 42 35
West St. Paul 163 12 10 11 14
Hastings 115 111 151 257 213
Rosemount 285 295 238 335 411
Farmington 302 362 566 542 228
Source: US Census
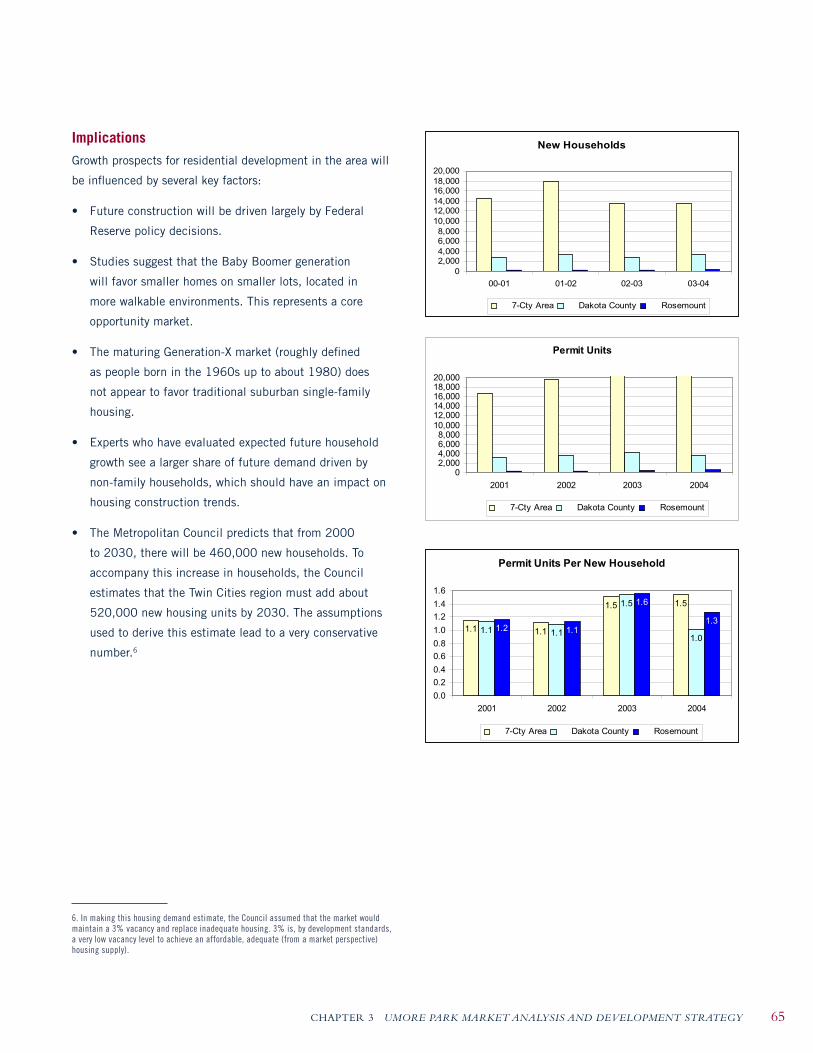
CHAPTER 3 UMORE PARK MARKET ANALYSIS AND DEVELOPMENT STRATEGY 65
ImplicationsGrowth prospects for residential development in the area will
be influenced by several key factors:
• Future construction will be driven largely by Federal
Reserve policy decisions.
• Studies suggest that the Baby Boomer generation
will favor smaller homes on smaller lots, located in
more walkable environments. This represents a core
opportunity market.
• The maturing Generation-X market (roughly defined
as people born in the 1960s up to about 1980) does
not appear to favor traditional suburban single-family
housing.
• Experts who have evaluated expected future household
growth see a larger share of future demand driven by
non-family households, which should have an impact on
housing construction trends.
• The Metropolitan Council predicts that from 2000
to 2030, there will be 460,000 new households. To
accompany this increase in households, the Council
estimates that the Twin Cities region must add about
520,000 new housing units by 2030. The assumptions
used to derive this estimate lead to a very conservative
number.6
6. In making this housing demand estimate, the Council assumed that the market would maintain a 3% vacancy and replace inadequate housing. 3% is, by development standards, a very low vacancy level to achieve an affordable, adequate (from a market perspective) housing supply).
New Households
02,0004,0006,0008,000
10,00012,00014,00016,00018,00020,000
00-01 01-02 02-03 03-04
7-Cty Area Dakota County Rosemount
Permit Units
02,0004,0006,0008,000
10,00012,00014,00016,00018,00020,000
2001 2002 2003 2004
7-Cty Area Dakota County Rosemount
Permit Units Per New Household
1.1 1.1
1.5 1.5
1.1 1.1
1.5
1.01.2 1.1
1.6
1.3
0.0
0.20.4
0.60.8
1.0
1.21.4
1.6
2001 2002 2003 2004
7-Cty Area Dakota County Rosemount
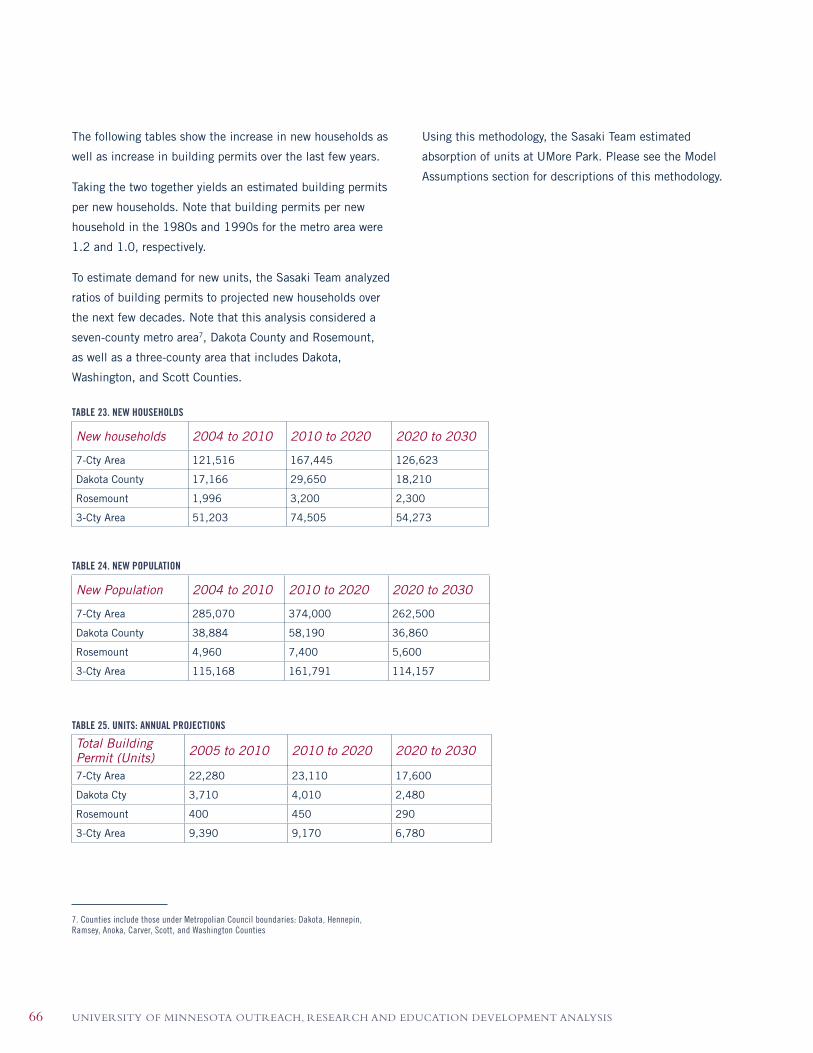
UNIVERSITY OF MINNESOTA OUTREACH, RESEARCH AND EDUCATION DEVELOPMENT ANALYSIS66
The following tables show the increase in new households as
well as increase in building permits over the last few years.
Taking the two together yields an estimated building permits
per new households. Note that building permits per new
household in the 1980s and 1990s for the metro area were
1.2 and 1.0, respectively.
To estimate demand for new units, the Sasaki Team analyzed
ratios of building permits to projected new households over
the next few decades. Note that this analysis considered a
seven-county metro area7, Dakota County and Rosemount,
as well as a three-county area that includes Dakota,
Washington, and Scott Counties.
TABLE 23. NEW HOUSEHOLDS
New households 2004 to 2010 2010 to 2020 2020 to 2030
7-Cty Area 121,516 167,445 126,623
Dakota County 17,166 29,650 18,210
Rosemount 1,996 3,200 2,300
3-Cty Area 51,203 74,505 54,273
TABLE 24. NEW POPULATION
New Population 2004 to 2010 2010 to 2020 2020 to 2030
7-Cty Area 285,070 374,000 262,500
Dakota County 38,884 58,190 36,860
Rosemount 4,960 7,400 5,600
3-Cty Area 115,168 161,791 114,157
TABLE 25. UNITS: ANNUAL PROJECTIONS
Total Building Permit (Units) 2005 to 2010 2010 to 2020 2020 to 2030
7-Cty Area 22,280 23,110 17,600
Dakota Cty 3,710 4,010 2,480
Rosemount 400 450 290
3-Cty Area 9,390 9,170 6,780
7. Counties include those under Metropolian Council boundaries: Dakota, Hennepin, Ramsey, Anoka, Carver, Scott, and Washington Counties
Using this methodology, the Sasaki Team estimated
absorption of units at UMore Park. Please see the Model
Assumptions section for descriptions of this methodology.

CHAPTER 3 UMORE PARK MARKET ANALYSIS AND DEVELOPMENT STRATEGY 67
OFFICE MARKET
The Minneapolis-St. Paul metropolitan office market has
almost 66 million square feet of rentable area. Class A
offices dominate the Minneapolis central business district
while suburban markets have Class A and B space.
The office market in the Twin Cities metro region continues
to be soft. 2005 was the first year with positive office
absorption rates since 2000. The 10 million square feet
of leasable space on the market represent seven years of
supply at 2005 absorption levels. This is not good news
for landlords or developers, who can expect to wait years
before rents start going up or before there is any substantial
increase in demand for new multi-tenant commercial office
space.
Despite a stagnant market, the slightly positive absorption
rates in 2005 could signal returning demand. However,
there has been no major new construction in years. Recent
declines in supply could be due to conversion from office
to residential or conversion to single tenant space (owner-
occupied), especially in the St. Paul central business
district, as well as redevelopment and demolition of older
buildings and sites for other uses.
Overall, the UMore Park location is not competitive with
other speculative office sites. Opportunities for the site are
probably limited to community-based offices (i.e. medical,
accounting, insurance). Build-to-suit lots will require heavy
recruitment to the site. Greater opportunities may exist for
office research space, which fits well with existing activities
at the site, or offices which offer services for residents or
the University. A master planned development has greater
potential to attract businesses and employees as residents.
Office ClassesTypically, office space within markets is broken down into
three separate classes, Class A, Class B, and Class C office
space:
Class A – A classification used to describe buildings that
generally qualify as extremely desirable, investment-grade
properties and command the highest rents or sale prices
compared to other buildings in the same market. Such
buildings are well-located and provide efficient tenant
layouts as well as high quality and/or one-of-a-kind floor
plans. They can be architectural or historical landmarks
designed by prominent architects. These buildings contain
modern mechanical systems and have above-average
maintenance and management as well as the best quality
materials and workmanship in their trim and interior fittings.
They are generally the most attractive and eagerly sought by
investors willing to pay a premium for quality.
Class B – A classification used to describe buildings that
generally qualify as a more speculative investment, and
as such, command lower rents or sale prices compared to
Class A properties. Such buildings offer utilitarian space
without special attractions. The new or fairly new buildings
have ordinary design while older non-landmark buildings
have good to excellent design. These buildings typical-
ly have average to good maintenance, management and
tenants. They are less appealing to tenants than Class A
properties and their floor plans, condition and facilities may
be deficient. They lack prestige and must depend on a lower
price to attract tenants and investors.
Class C – A classification used to describe buildings that
generally qualify as no-frills, older buildings that offer basic
space and command lower rents or sale prices compared to
other buildings in the same market. Such buildings typically
have below-average maintenance and management, and
could have mixed or low tenant prestige, inferior elevators,
and/or mechanical and electrical systems. These buildings
lack prestige and must depend on a lower price to attract
tenants and investors.

UNIVERSITY OF MINNESOTA OUTREACH, RESEARCH AND EDUCATION DEVELOPMENT ANALYSIS68
Office Submarkets
The market for commercial office space in the greater
Minneapolis-St. Paul Metropolitan Area can be broken down
into eight separate submarket areas:
• 494 Corridor
• 394 Corridor
• Northwest
• Suburban St. Paul
• BEA – Burnsville / Eagan / Apple Valley
• Midway
• St. Paul Central Business District (CBD)
• Minneapolis Central Business District (CBD)
There were positive signs in all individual market regions for
2005, however, the large amount of vacant space already on
the market will continue to hinder new construction for some
time regardless of location or improvements in vacancy rates.
Suburban Office Market
The suburban office market in the Minneapolis-St. Paul area
is made up of six of the eight submarket areas: the 494 and
394 Corridor, Northwest, Midway and Burnsville/Eagan/Apple
Valley (BEA) Markets. Traditionally split between Class A
and B office space, the suburban market did not fare any
better than the market as a whole from 2000 to 2005.
Rising vacancy rates, stagnated demand and falling supply
have been endemic since 2000. The suburban office market
accounts for over 35 million square feet, or 54%, of the net
66 million rentable square feet in
the market.
Office SupplyThere has been no significant construction in the
Minneapolis-St. Paul office market since 2000 and the
market has actually decreased in net rentable space
since. Lacking demand, low interest rates and a strong
condominium market have made conversion of office space
into condominiums an attractive alternative. The conversion
of some multi-tenant sublease space to single-tenant,
owner-occupied space also has contributed to the declining
supply in the office market. With rising interest rates and a
softening market, the rate of condominium conversions has
slowed since 2004.
NET RENTABLE OFFICE SPACE
Source: CB Richard Ellis - Minneapolis
0
2
4
6
8
10
12
14
16
494 394 Corridor Northwest SuburbanSt. Paul
BEA Market MidwayMarket
St. PaulCBD
MinneapolisCBD
Mill
ions
Squ
are
Fee
t
Class A Class B Class C
MINNEAPOLIS/ST. PAUL OFFICE SUBMARKETS
Source: CB Richard Ellis - Minneapolis

CHAPTER 3 UMORE PARK MARKET ANALYSIS AND DEVELOPMENT STRATEGY 69
Office Submarkets
At over 14-million square feet, Class A office space
dominates the 22-million square feet of leasable office
space in the Minneapolis CBD and makes up almost half
of the A-class space in the entire market. The 494 Corridor
has the largest percentage of Class B office space with a
similar amount of Class A space, a similarity that holds true
for most of the suburban submarket. The suburban St. Paul
Market is the only submarket where C-class office space
makes up a larger percentage then either the A or B classes
and interestingly enough, the St. Paul CBD has a far greater
percentage of Class B space than it does Class A. It is also
the only submarket to demonstrate an overall net loss in
rentable office space since 2000.
Suburban Office Growth
The suburban office market, consisting of the 494 Corridor,
394 Corridor, Suburban St. Paul, and Northwest, BEA and
Midway Markets comprises just over half of the office space
for the entire metro market, with the 494 and 394 Corridors
making up the bulk of the suburban market. Growth in
net leaseable area for suburban markets, like the rest of
the Minneapolis-St. Paul Metro Area, has stagnated since
2000 and even declined in some areas. In the suburban
markets, Class B has traditionally made up a slightly higher
percentage than Class A, except for the Suburban St. Paul
and BEA, where Class C and Class A have the most square
feet of rentable space respectively. While the actual decline
in total space has been marginal, Class C has declined the
most. Reasons for the decline include the conversion of
office space from multi-tenant to single tenant space and the
demolition of C-class buildings. The decline in net rentable
area in the suburban areas has not been as significant as
in the Minneapolis and St. Paul business districts where
there has been a strong trend to turn office space into
condominiums.
Office Vacancy and AbsorptionVacancy rates have soared in recent years, from just over 6%
in the Minneapolis CBD in 2000 to over 17% by 2005. The
aggregate market has seen a net increase of only 44,000
square feet in leased office space since 2000. 2005 did
show positive absorption across every submarket, with
over 800,000 square feet absorbed in the Minneapolis
CBD market. However, this was a minor gain after years of
negative absorption numbers. While the total amount of
leasable space in the market has actually declined since
2000, the amount of vacant space has risen over 5 million
square feet to over 10 million square feet, over 3.5 million of
which is in suburban markets.
NET RENTABLE OFFICE SPACE
Source: CB Richard Ellis - Minneapolis
0
5
10
15
20
25
494 394Corridor
Northwest SuburbanSt. Paul
BEA Market MidwayMarket
St. PaulCBD
MinneapolisCBD
Mill
ions
Squ
are
Fee
t
Rentable Area Leased Space

UNIVERSITY OF MINNESOTA OUTREACH, RESEARCH AND EDUCATION DEVELOPMENT ANALYSIS70
Office Submarkets
Vacancy rates have risen in every market from near 6% in
2000 for the Minneapolis CBD, to nearly 20% for the St.
Paul CBD in 2005. In most markets this rising vacancy has
not resulted from significant changes in rented space but
from a general stagnation in absorption. Both the central
business districts of St. Paul and Minneapolis have a
combined negative absorption of over 1.5 million square
feet. The only two markets, in fact, that have had net gains
in absorption since 2000 are the BEA (Burnsville / Eagan /
Apple Valley) and Midway Markets. However, like the other
markets they have experienced climbing vacancy rates.
OFFICE MARKET – SUPPLY VS. DEMAND
Source: CB Richard Ellis - Minneapolis
CLASS A SPACE – SUPPLY VS. DEMAND
Source: CB Richard Ellis - Minneapolis
Class A office space has followed the same general trend.
However, while the overall vacant office space in the market
has declined at a cumulative annual rate of just under 1%,
the exact opposite is true for Class A office space. Available
A-Class office space is two times that demanded.
Office Market Rents
Available data shows that as vacancy rates have steadily
increased over the past five years and that net asking rental
rates have slipped. Average net rents have fallen almost two
dollars per square foot since 2000 to just under $10.40.
While average rents have dropped significantly, they have
done nothing to alleviate the stark increase in vacancies
from 2000 to 2003. Vacancy rates reached a peak near the
beginning of 2004 and have since declined slightly.
OFFICE MARKET – VACANCY VS. RENTAL RATE
Source: CB Richard Ellis - Minneapolis
20
25
30
35
40
45
50
55
60
65
70
2000
- Q
1
2000
- Q
3
2001
- Q
1
2001
- Q
3
2002
- Q
1
2002
- Q
3
2003
- Q
1
2003
- Q
3
2004
- Q
1
2004
- Q
3
2005
- Q
1
2005
- Q
3
Mill
ions
Squ
are
Fee
t
Rentable Area Leased Space
20
25
30
35
40
45
50
55
60
65
70
2000
- Q
1
2000
- Q
3
2001
- Q
1
2001
- Q
3
2002
- Q
1
2002
- Q
3
2003
- Q
1
2003
- Q
3
2004
- Q
1
2004
- Q
3
2005
- Q
1
2005
- Q
3
Mill
ions
Squ
are
Fee
t
Rentable Area Leased Space
0.00%
2.00%
4.00%
6.00%
8.00%
10.00%
12.00%
14.00%
16.00%
18.00%
20.00%20
00 -
Q1
2000
- Q
3
2001
- Q
1
2001
- Q
3
2002
- Q
1
2002
- Q
3
2003
- Q
1
2003
- Q
3
2004
- Q
1
2004
- Q
3
2005
- Q
1
2005
- Q
3
Vac
ancy
$8.00
$9.00
$10.00
$11.00
$12.00
$13.00
$14.00
$15.00
$16.00
Net
Ren
tal R
ate
Vacancy Rate Rental Rate

CHAPTER 3 UMORE PARK MARKET ANALYSIS AND DEVELOPMENT STRATEGY 71
Premium Offi ce Rents
Comparing aggregate average rents with the average net
asking rate for A-class offi ce space shows that Class A, while
it remains almost two dollars higher than the market average,
has fallen almost three dollars from its 2000 level. Currently
hovering around $12, this more drastic drop in net rental
rates may account for the fact that vacancy rates did not rise
as sharply as compared to the average, having risen only six
points versus the nearly eight on average.
CLASS A SPACE – VACANCY VS. RENTAL RATE
Source: CB Richard Ellis - Minneapolis
Major Offi ce Nodes in Metro Area
The Sasaki Team identifi ed industry segments whose
operations are typically housed in offi ce space and are
potential offi ce tenants. These segments include services
like fi nance, insurance, and real estate (FIRE). The following
maps show business establishments that fall into these
segments and are color-coded by estimated number of
employees per establishment. The fi rst map shows all
identifi ed establishments and the second identifi es business
establishments with 50 or more employees. Places like
Burnsville and Eagan, with good access to interstates and
connecting highways, appear to draw signifi cant economic
activity.
0.00%
2.00%
4.00%
6.00%
8.00%
10.00%
12.00%
14.00%
16.00%
18.00%
20.00%
2000
- Q
1
2000
- Q
3
2001
- Q
1
2001
- Q
3
2002
- Q
1
2002
- Q
3
2003
- Q
1
2003
- Q
3
2004
- Q
1
2004
- Q
3
2005
- Q
1
2005
- Q
3
Vac
ancy
$8.00
$9.00
$10.00
$11.00
$12.00
$13.00
$14.00
$15.00
$16.00
Net
Ren
tal R
ate
Vacancy Rate Rental Rate
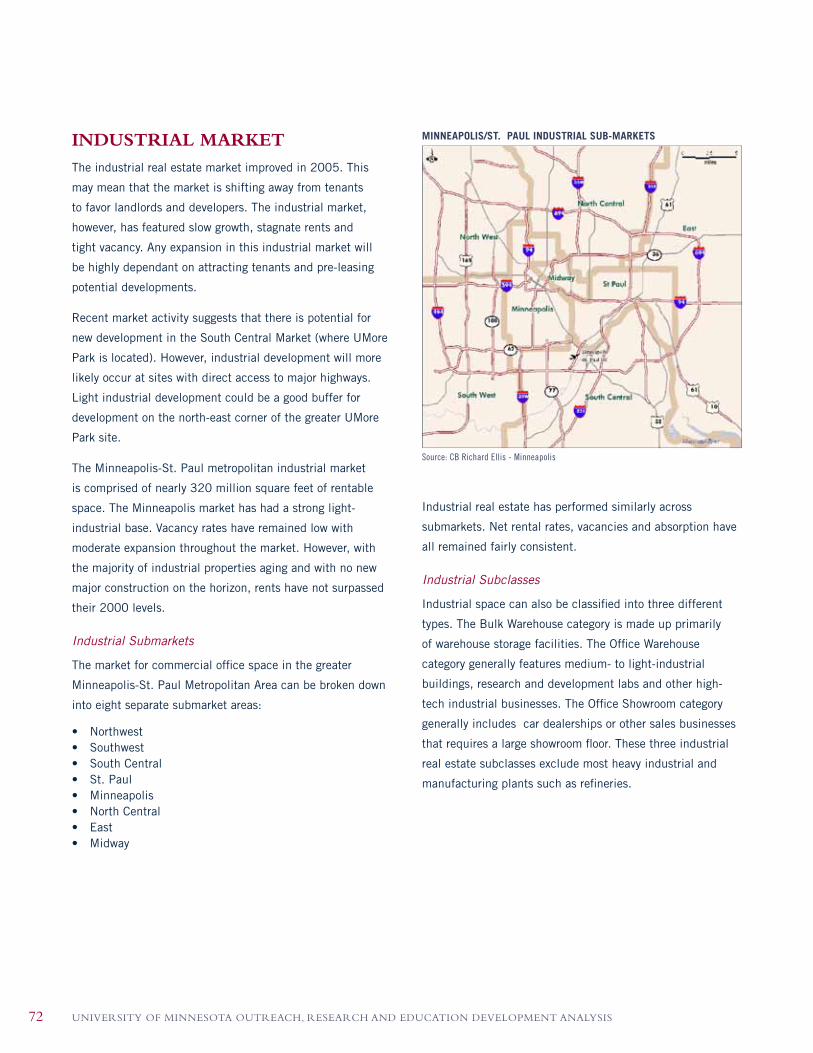
UNIVERSITY OF MINNESOTA OUTREACH, RESEARCH AND EDUCATION DEVELOPMENT ANALYSIS72
INDUSTRIAL MARKET
The industrial real estate market improved in 2005. This
may mean that the market is shifting away from tenants
to favor landlords and developers. The industrial market,
however, has featured slow growth, stagnate rents and
tight vacancy. Any expansion in this industrial market will
be highly dependant on attracting tenants and pre-leasing
potential developments.
Recent market activity suggests that there is potential for
new development in the South Central Market (where UMore
Park is located). However, industrial development will more
likely occur at sites with direct access to major highways.
Light industrial development could be a good buffer for
development on the north-east corner of the greater UMore
Park site.
The Minneapolis-St. Paul metropolitan industrial market
is comprised of nearly 320 million square feet of rentable
space. The Minneapolis market has had a strong light-
industrial base. Vacancy rates have remained low with
moderate expansion throughout the market. However, with
the majority of industrial properties aging and with no new
major construction on the horizon, rents have not surpassed
their 2000 levels.
Industrial Submarkets
The market for commercial office space in the greater
Minneapolis-St. Paul Metropolitan Area can be broken down
into eight separate submarket areas:
• Northwest• Southwest• South Central• St. Paul • Minneapolis• North Central • East• Midway
Source: CB Richard Ellis - Minneapolis
Industrial real estate has performed similarly across
submarkets. Net rental rates, vacancies and absorption have
all remained fairly consistent.
Industrial Subclasses
Industrial space can also be classified into three different
types. The Bulk Warehouse category is made up primarily
of warehouse storage facilities. The Office Warehouse
category generally features medium- to light-industrial
buildings, research and development labs and other high-
tech industrial businesses. The Office Showroom category
generally includes car dealerships or other sales businesses
that requires a large showroom floor. These three industrial
real estate subclasses exclude most heavy industrial and
manufacturing plants such as refineries.
MINNEAPOLIS/ST. PAUL INDUSTRIAL SUB-MARKETS

CHAPTER 3 UMORE PARK MARKET ANALYSIS AND DEVELOPMENT STRATEGY 73
South Central Industrial and Office Warehouse
The South Central industrial submarket covers the entire
are to the south of Minneapolis and St. Paul, including the
UMore Park site. Much of this area has been zoned industrial
and most land is held by developers. This makes entry into
the market for developers and companies without land
difficult. The South Central area is also a rapidly expanding
suburban region. As residential communities stretch further
out, rising land prices and the innate conflict between
residents and business owners are making new industrial
expansion in the area increasingly difficult.
The Office Warehouse market, which is typically associated
with R&D and other types of high-tech businesses, has
been an emerging niche as traditional manufacturing and
heavy industrial sites have moved to areas where labor is
less expensive. It offers the opportunity for the University of
Minnesota to develop joint ventures and partnerships with
potential tenants to further University research goals.
Industrial SupplyThe overall supply of net rentable industrial space has grown
since 2000. With an annual growth rate of around 2%, the
Minneapolis-St. Paul market has added over 16 million
square feet of net rentable industrial capacity in the last five
years.
Industrial Subclasses
Office Warehouse makes up the largest portion of the
Minneapolis-St. Paul industrial market. Office Warehouse
space represents 41% of the market, with 130 million
square feet of net rentable space. It has been growing at an
annual rate of just under 1% per year. Bulk Warehouse is
the second largest submarket with 63 million square feet of
space. It represents nearly 20% of the whole market. The
third largest submarket, Office Showroom, makes up 10.5%
of the market. The Bulk Warehouse and Office Showroom
markets have been growing at an annual rate of 2.1% and
0.5% respectively. This makes the Bulk Warehouse the
fastest growing area of the market and according to reports
most of this growth has been in the South Central market.
INDUSTRIAL SUBCLASSES – SUPPLY VS. DEMAND
Source: CB Richard Ellis - Minneapolis
SUPPLY VS. DEMAND 2000 TO 2005
Source: CB Richard Ellis - Minneapolis
Industrial Submarkets
The largest submarket in the Minneapolis-St. Paul Metro
area is the Southwest, with over 67 million square feet of
net leasable industrial space. However, it has grown only
3% since 2000 or about 0.5% per year. The second largest
submarket, the Northwest, has added over 6 million square
feet of net rentable space in the past five years. The fastest
growing market has been the smallest of the submarkets, the
East, with a compounded annual growth rate of almost 3%.
Midway and St. Paul were the only submarkets to actually
see a decrease in the amount of leasable space over the five-
year span from 2000 to 2005. Both declines occurred from
20
40
60
80
100
120
140
Bulk Warehouse Office Warehouse Office Showroom
Mill
ions
Squ
are
Fee
t
Rentable Area Leased Space
0
10
20
30
40
50
60
70
80
Northwest Southwest SouthCentral
St. Paul Minneapolis NorthCentral
East Midway
Mill
ion
sS
qu
are
Fe
et
Rentable Area Leased Space
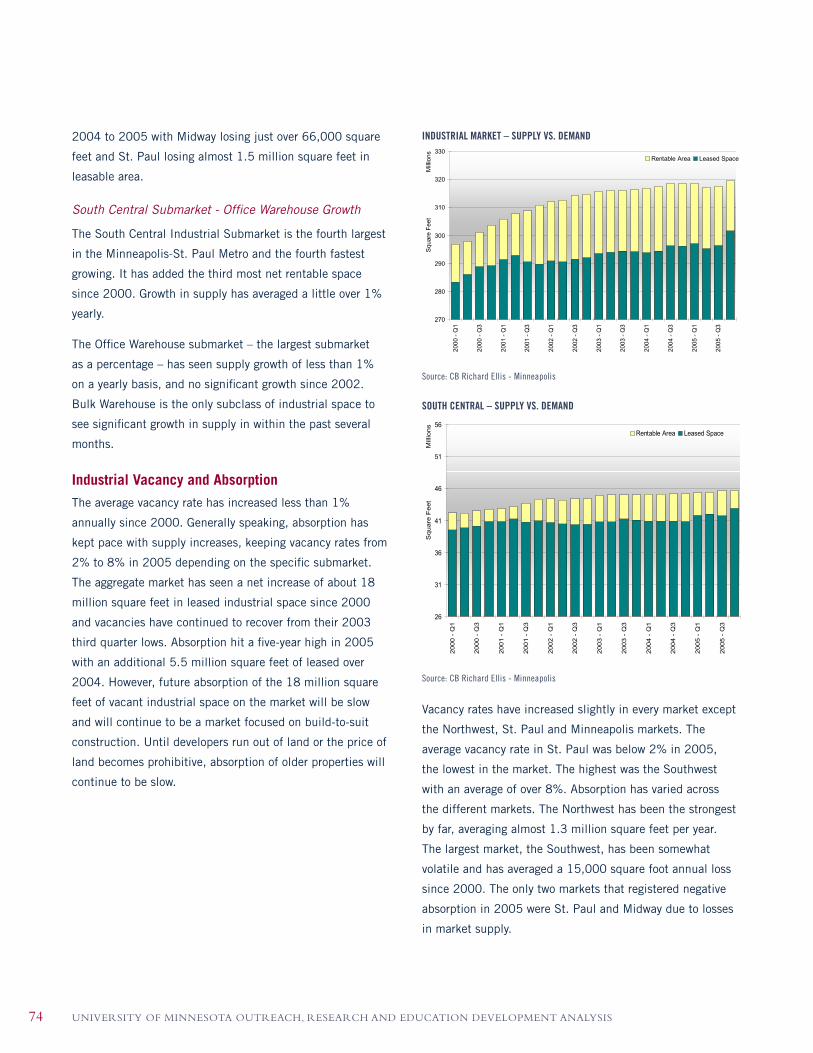
UNIVERSITY OF MINNESOTA OUTREACH, RESEARCH AND EDUCATION DEVELOPMENT ANALYSIS74
2004 to 2005 with Midway losing just over 66,000 square
feet and St. Paul losing almost 1.5 million square feet in
leasable area.
South Central Submarket - Office Warehouse Growth
The South Central Industrial Submarket is the fourth largest
in the Minneapolis-St. Paul Metro and the fourth fastest
growing. It has added the third most net rentable space
since 2000. Growth in supply has averaged a little over 1%
yearly.
The Office Warehouse submarket – the largest submarket
as a percentage – has seen supply growth of less than 1%
on a yearly basis, and no significant growth since 2002.
Bulk Warehouse is the only subclass of industrial space to
see significant growth in supply in within the past several
months.
Industrial Vacancy and AbsorptionThe average vacancy rate has increased less than 1%
annually since 2000. Generally speaking, absorption has
kept pace with supply increases, keeping vacancy rates from
2% to 8% in 2005 depending on the specific submarket.
The aggregate market has seen a net increase of about 18
million square feet in leased industrial space since 2000
and vacancies have continued to recover from their 2003
third quarter lows. Absorption hit a five-year high in 2005
with an additional 5.5 million square feet of leased over
2004. However, future absorption of the 18 million square
feet of vacant industrial space on the market will be slow
and will continue to be a market focused on build-to-suit
construction. Until developers run out of land or the price of
land becomes prohibitive, absorption of older properties will
continue to be slow.
INDUSTRIAL MARKET – SUPPLY VS. DEMAND
Source: CB Richard Ellis - Minneapolis
SOUTH CENTRAL – SUPPLY VS. DEMAND
Source: CB Richard Ellis - Minneapolis
Vacancy rates have increased slightly in every market except
the Northwest, St. Paul and Minneapolis markets. The
average vacancy rate in St. Paul was below 2% in 2005,
the lowest in the market. The highest was the Southwest
with an average of over 8%. Absorption has varied across
the different markets. The Northwest has been the strongest
by far, averaging almost 1.3 million square feet per year.
The largest market, the Southwest, has been somewhat
volatile and has averaged a 15,000 square foot annual loss
since 2000. The only two markets that registered negative
absorption in 2005 were St. Paul and Midway due to losses
in market supply.
270
280
290
300
310
320
330
2000
- Q
1
2000
- Q
3
2001
- Q
1
2001
- Q
3
2002
- Q
1
2002
- Q
3
2003
- Q
1
2003
- Q
3
2004
- Q
1
2004
- Q
3
2005
- Q
1
2005
- Q
3
Mill
ions
Squ
are
Fee
t
Rentable Area Leased Space
26
31
36
41
46
51
56
2000 -
Q1
2000 -
Q3
2001 -
Q1
2001 -
Q3
2002 -
Q1
2002 -
Q3
2003 -
Q1
2003 -
Q3
2004 -
Q1
2004 -
Q3
2005 -
Q1
2005 -
Q3
Mill
ions
Square
Feet
Rentable Area Leased Space
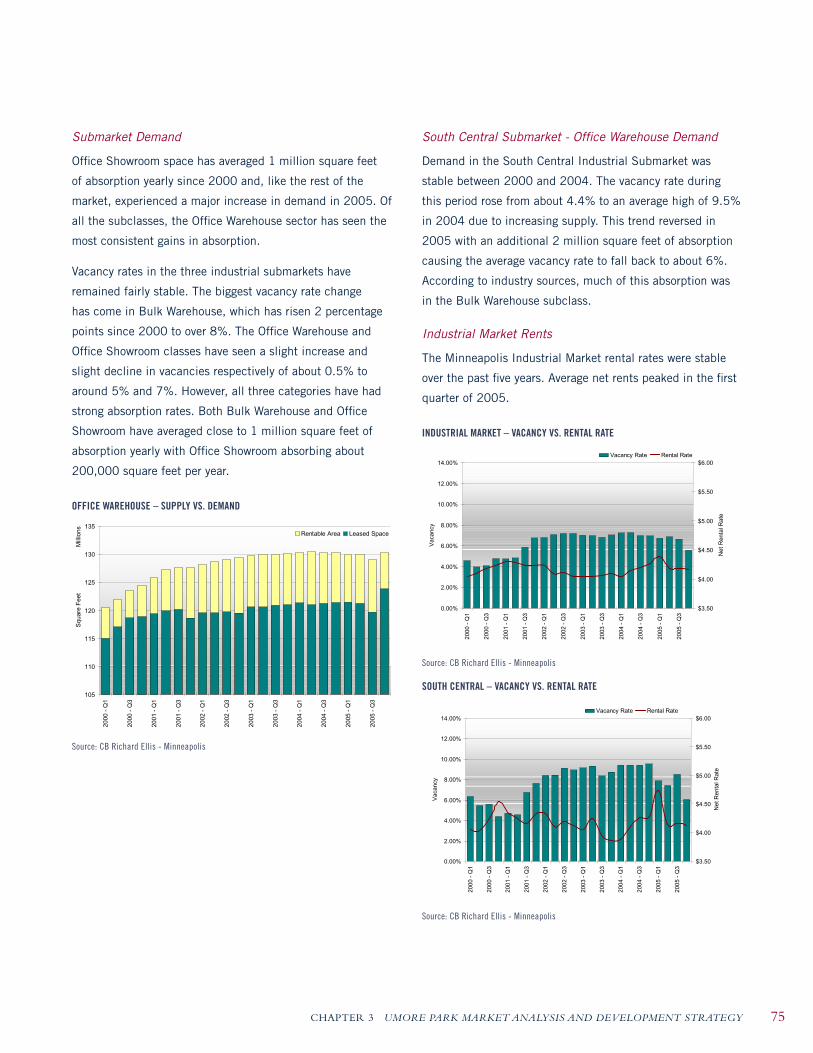
CHAPTER 3 UMORE PARK MARKET ANALYSIS AND DEVELOPMENT STRATEGY 75
Submarket Demand
Office Showroom space has averaged 1 million square feet
of absorption yearly since 2000 and, like the rest of the
market, experienced a major increase in demand in 2005. Of
all the subclasses, the Office Warehouse sector has seen the
most consistent gains in absorption.
Vacancy rates in the three industrial submarkets have
remained fairly stable. The biggest vacancy rate change
has come in Bulk Warehouse, which has risen 2 percentage
points since 2000 to over 8%. The Office Warehouse and
Office Showroom classes have seen a slight increase and
slight decline in vacancies respectively of about 0.5% to
around 5% and 7%. However, all three categories have had
strong absorption rates. Both Bulk Warehouse and Office
Showroom have averaged close to 1 million square feet of
absorption yearly with Office Showroom absorbing about
200,000 square feet per year.
OFFICE WAREHOUSE – SUPPLY VS. DEMAND
Source: CB Richard Ellis - Minneapolis
South Central Submarket - Office Warehouse Demand
Demand in the South Central Industrial Submarket was
stable between 2000 and 2004. The vacancy rate during
this period rose from about 4.4% to an average high of 9.5%
in 2004 due to increasing supply. This trend reversed in
2005 with an additional 2 million square feet of absorption
causing the average vacancy rate to fall back to about 6%.
According to industry sources, much of this absorption was
in the Bulk Warehouse subclass.
Industrial Market Rents
The Minneapolis Industrial Market rental rates were stable
over the past five years. Average net rents peaked in the first
quarter of 2005.
INDUSTRIAL MARKET – VACANCY VS. RENTAL RATE
Source: CB Richard Ellis - Minneapolis
SOUTH CENTRAL – VACANCY VS. RENTAL RATE
Source: CB Richard Ellis - Minneapolis
105
110
115
120
125
130
135
2000
- Q
1
2000
- Q
3
2001
- Q
1
2001
- Q
3
2002
- Q
1
2002
- Q
3
2003
- Q
1
2003
- Q
3
2004
- Q
1
2004
- Q
3
2005
- Q
1
2005
- Q
3
Mill
ions
Squ
are
Fee
t
Rentable Area Leased Space
0.00%
2.00%
4.00%
6.00%
8.00%
10.00%
12.00%
14.00%20
00 -
Q1
2000
- Q
3
2001
- Q
1
2001
- Q
3
2002
- Q
1
2002
- Q
3
2003
- Q
1
2003
- Q
3
2004
- Q
1
2004
- Q
3
2005
- Q
1
2005
- Q
3
Vac
ancy
$3.50
$4.00
$4.50
$5.00
$5.50
$6.00
Net
Ren
tal R
ate
Vacancy Rate Rental Rate
0.00%
2.00%
4.00%
6.00%
8.00%
10.00%
12.00%
14.00%
2000
- Q
1
2000
- Q
3
2001
- Q
1
2001
- Q
3
2002
- Q
1
2002
- Q
3
2003
- Q
1
2003
- Q
3
2004
- Q
1
2004
- Q
3
2005
- Q
1
2005
- Q
3
Vac
ancy
$3.50
$4.00
$4.50
$5.00
$5.50
$6.00N
et R
enta
l Rat
eVacancy Rate Rental Rate

UNIVERSITY OF MINNESOTA OUTREACH, RESEARCH AND EDUCATION DEVELOPMENT ANALYSIS76
Pertinent Industrial Rents
The South Central submarket has been significantly more
volatile than the Minneapolis market with respect to both
averages asking rent and vacancy rate. The average rent
has increased only $0.08 since 2000 but has fluctuated
between about $3.80 and $4.70. Vacancies in this market
also have reached much higher levels, close to 10% versus
the 8% market average, and still remained about 0.5%
higher at the end of 2005.
Office Warehouse has performed fairly close to the market as
a whole with an average vacancy of 6.3% over the past five
years. At the same time rents have been $0.09 higher than
the greater market on average and increased $0.08 since
2000.
OFFICE WAREHOUSE – VACANCY VS. RENTAL RATE
Source: CB Richard Ellis - Minneapolis
RETAIL MARKET
In general, the retail market has been consistently strong
and stable in the Minneapolis-St. Paul area. As is typical
with retail markets, demand is simply a factor of population
and retail developments follow population growth. The Apple
Valley/Lakeville submarket appears to be one of the rising
stars of the regional retail market. However, the UMore Park
site is not ideal for large-scale retail development because
it is not directly on a major highway or road. It is likely that
land in Coates just to the east of the site along State Route
52 may be more attractive to major big box retailers, though
opportunity does exist for the UMore Park site. Town center
retail is more likely for UMore Park under a master planned
scenario. This type of development will fit in well with the
recommended residential component.
With close to 60 million square feet of gross leasable area
and an inventory of shopping centers that includes the
Mall of America, the Minneapolis-St. Paul retail market is
one of the larger and more prestigious shopping regions in
the United States. Growth has been steady in this market,
which is dominated by traditional malls and indoor shopping
centers due to the Minnesota winter.
0.00%
2.00%
4.00%
6.00%
8.00%
10.00%
12.00%
14.00%
2000
- Q
1
2000
- Q
3
2001
- Q
1
2001
- Q
3
2002
- Q
1
2002
- Q
3
2003
- Q
1
2003
- Q
3
2004
- Q
1
2004
- Q
3
2005
- Q
1
2005
- Q
3
Vac
ancy
$3.50
$4.00
$4.50
$5.00
$5.50
$6.00
Net
Ren
tal R
ate
Vacancy Rate Rental Rate

CHAPTER 3 UMORE PARK MARKET ANALYSIS AND DEVELOPMENT STRATEGY 77
Retail Submarkets
The Minneapolis-St. Paul Metropolitan Area can be
subdivided into sixteen separate markets:
• Apple Valley/Lakeville
• Brookdale
• Burnsville
• Calhoun
• Coon Rapids
• Eagan
• Eden Prairie
• Maple Grove
Retail Market CompositionAs defi ned by the Urban Land Institute (ULI), shopping centers
fall mainly into fi ve categories:
Convenience Center:
Convenience Centers typically contain a minimum of three stores
and are anchored by a personal/convenience store. They sell the
same types of goods found in a Neighborhood Center and have a
gross leasable area (GLA) of up to 30,000 square feet.
Neighborhood Center:
Neighborhood Centers sell convenience goods, such as food,
drugs, and sundries and personal services like laundry and
dry cleaning, shoe repair and haircuts. Usually anchored by
a supermarket, these centers provide for the day-to-day living
needs of the immediate neighborhood with a total GLA of about
60,000 square feet. Size of this classifi cation may range from
30,000 to 100,000 square feet.
Community Center:
Community Centers are built around a junior department store,
variety store, super-drugstore or discount drugstore in addition
to a supermarket with a total GLA around 150,000. Total GLA of
this center class is from 100,000 to 500,000+ square feet.
Regional Center:
Regional Centers provide general merchandise such as clothes
and furniture along with services typical of a business district.
Some also include recreational facilities. Anchors here are one
or two full-line department stores of 50,000 square feet or more
with a total GLA typically in the 500,000 square foot range. Size
of Regional Centers goes from 250,000 to 900,000 square feet.
Super Regional Center:
Super Regional Centers have an extensive variety of offerings
along the lines of those in a Regional Center. Centered on three
or more full-line department stores greater than 75,000 square
feet in area, the typical GLA of a Super Regional Center is about
1,000,000 square feet. Centers in this category range from
500,000 to 1,500,000+ square feet in gross leasable area.
• Minneapolis CBD
• Northtown
• Ridgedale
• Rosedale
• Southdale
• St. Paul
• West St. Paul
• Woodbury
MINNEAPOLIS-ST. PAUL RETAIL SUBMARKETS
Source: CB Richard Ellis - Minneapolis
The size and performance of these individual markets varies
to a great degree but in general none of the submarkets has
suffered over the past three years.

UNIVERSITY OF MINNESOTA OUTREACH, RESEARCH AND EDUCATION DEVELOPMENT ANALYSIS78
The Sasaki Team anticipates that Convenience Center and
Neighborhood Center development will likely take place in
Scenarios A and B, with greater potential for Community
Center development in Scenario C. Scenario C development
will likely have a greater awareness in the marketplace, and
thus greater capture of retail demand to support a larger
retail component.
Retail SupplyIn the three years since 2002, there has been an additional
6.6 million square feet of gross leasable area added to the
Minneapolis-St. Paul Metropolitan retail market. With an
average growth in supply of around 2 million square feet per
year, new construction in the retail sector has been steady.
Retail Submarkets
Southdale leads the retail market in gross leasable area
with over 9 million square feet, 4 million square feet more
than the second largest submarket. Ridgedale. Woodbury,
Maple Grove and Coon Rapids have grown the most over the
last three years, all having added around 780,000 square
feet of shopping space since 2002 and with compound
annual growth rates of 6.8%, 9.5% and 7% respectively.
Apple Valley/Lakeville has been growing the fastest at a
compounded rate of 11% per year with over 700,000
square feet constructed since 2002. Brookdale is the only
submarket that has actually decreased in gross leasable area
since 2002, falling by 156,000 square feet in 2004. While
downtown Minneapolis has not lost any retail area, there
has been no notable expansion in this market, Calhoun or
Rosedale.
RENTABLE AND LEASED SPACE BY SUBMARKETS – 2002 TO 2005Source: CB Richard
Ellis - Minneapolis
Apple Valley/Lakeville Growth
The Apple Valley/Lakeville submarket has experienced the
highest annual growth rate over the past three years and
added the fourth most gross leasable area of any market
region. However, the Apple Valley/Lakeville market is still
relatively small with a total of only 2.6 million square feet.
Retail Vacancy and AbsorptionVacancy rates have increased marginally since the beginning
of 2002, going up a little over one percentage point over
three years. During this same time, the Minneapolis market
has absorbed an additional 5.5 million square feet in retail
space. By the end of 2005, 1 million square feet, or 6.8% of
total space, remained vacant.
0
1
2
3
4
5
6
7
8
9
10
App
le V
alle
y -
Lake
ville
Bro
okda
le
Bur
nsvi
lle
Cal
houn
Coo
n R
apid
s
Eag
an
Ede
n P
rairi
e
Map
le G
rove
Map
lew
ood
Min
neap
lois
CB
D
Nor
thto
wn
Rid
geda
le
Ros
edal
e
Sou
thda
le
St.
Pau
l
Wes
t St.
Pau
l
Woo
dbur
y
Mill
ions
Squ
are
Fee
t
Rentable Area Leased Space

CHAPTER 3 UMORE PARK MARKET ANALYSIS AND DEVELOPMENT STRATEGY 79
Retail Submarkets
Vacancy rates at the end of 2005 varied by as much as
10 percentage points between individual retail markets,
with market specific rates moving both up and down since
2002. Ridgedale had the lowest vacancy rate, remaining
almost unchanged from its 2002 level at 2.5%. The vacancy
rate in the West St. Paul submarket decreased the most,
falling from 8.1% to 3.1% by 2005. The biggest increase
in vacancy came in Calhoun, the smallest submarket, rising
over 7.6 percentage points. Every market besides Apple
Valley/Lakeville, Eagan, and West St. Paul has experienced
increases in vacancy rates since 2002. But even with
rising vacancies in all of these submarkets, only Brookdale,
Calhoun, Northtown and Rosedale had cumulative negative
absorption. Seven of the sixteen submarkets have absorbed
100,000 square feet or more over the past three years.
MSA RETAIL MARKET – SUPPLY VS. DEMAND
Source: CB Richard Ellis - Minneapolis
Apple Valley/Lakeville Demand
The retail market in the Apple Valley/Lakeville region has
been one of the best performing submarkets over the
past three years. With the fourth lowest vacancy rate,
third highest decline in vacancy and second most overall
absorption, this market has exhibited particular strength and
year-over-year gains in both supply and demand.
APPLE VALLEY/LAKEVILLE – SUPPLY VS. DEMAND
Source: CB Richard Ellis - Minneapolis
Retail Market Rents
Retail rents have gone up almost $2.00 from their first
quarter 2002 average – about 3% per quarter. However,
at the same time the average aggregate vacancy rate has
increased 1.3 percentage points or almost 6% per quarter.
Gains in rental rates have been offset by the loss of tenants.
It is also important to note that the fourth quarter 2004
average rents do not include Regional or Super-Regional
shopping centers. Without including these shopping centers
the average asking rent drops by approximately $5.00 per
square foot.
RETAIL MARKET – VACANCY VS. RENTAL RATE
Source: CB Richard Ellis - Minneapolis
44
46
48
50
52
54
56
58
60
2002
- Q
1
2002
- Q
2
2002
- Q
3
2002
- Q
4
2003
- Q
1
2003
- Q
2
2003
- Q
3
2003
- Q
4
2004
- Q
1
2004
- Q
2
2004
- Q
3
2004
- Q
4
2005
- Q
1
2005
- Q
2
2005
- Q
3
2005
- Q
4
Mill
ions
Squ
are
Fee
t
Rentable Area Leased Space
1
2
3
2002
- Q
1
2002
- Q
2
2002
- Q
3
2002
- Q
4
2003
- Q
1
2003
- Q
2
2003
- Q
3
2003
- Q
4
2004
- Q
1
2004
- Q
2
2004
- Q
3
2004
- Q
4
2005
- Q
1
2005
- Q
2
2005
- Q
3
2005
- Q
4
Mill
ions
Squ
are
Fee
t
Rentable Area Leased Space
0.00%
1.00%
2.00%
3.00%
4.00%
5.00%
6.00%
7.00%
8.00%
2002
- Q
1
2002
- Q
2
2002
- Q
3
2002
- Q
4
2003
- Q
1
2003
- Q
2
2003
- Q
3
2003
- Q
4
2004
- Q
1
2004
- Q
2
2004
- Q
3
2004
- Q
4
2005
- Q
1
2005
- Q
2
2005
- Q
3
2005
- Q
4
Vac
ancy
$0.00
$5.00
$10.00
$15.00
$20.00
$25.00
Net
Ren
tal R
ate
Vacancy Rate Rental Rate
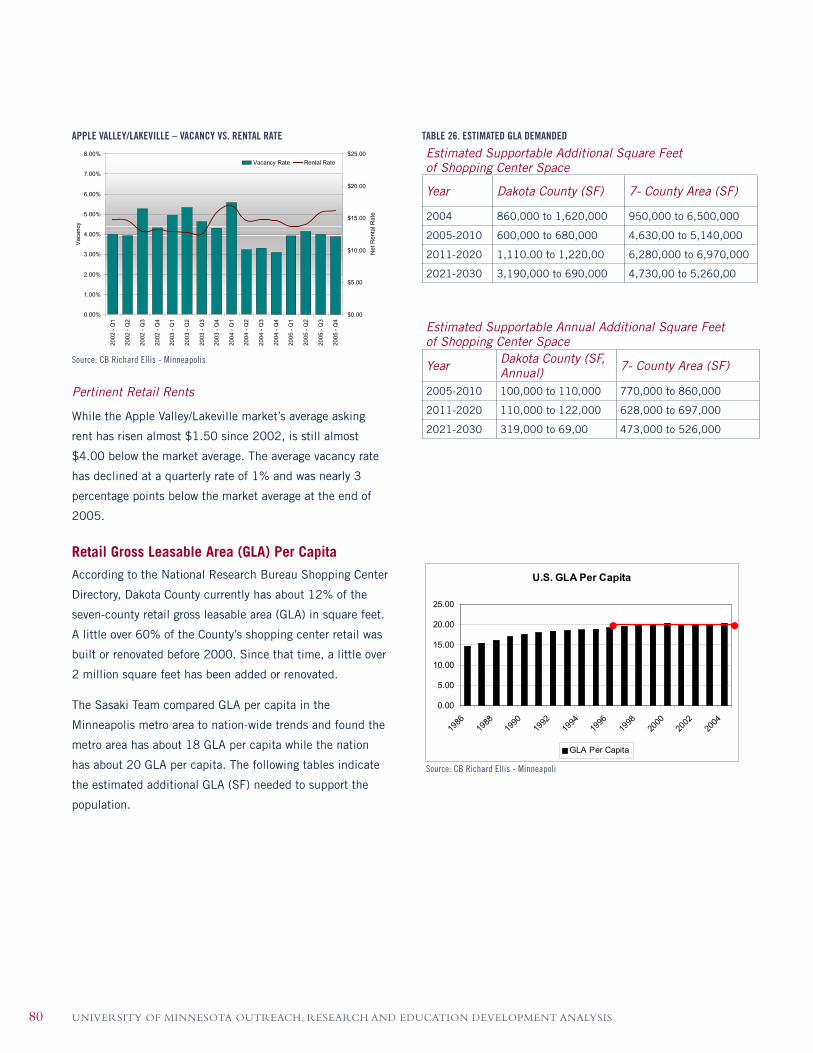
UNIVERSITY OF MINNESOTA OUTREACH, RESEARCH AND EDUCATION DEVELOPMENT ANALYSIS80
APPLE VALLEY/LAKEVILLE – VACANCY VS. RENTAL RATE
Source: CB Richard Ellis - Minneapolis
Pertinent Retail Rents
While the Apple Valley/Lakeville market’s average asking
rent has risen almost $1.50 since 2002, is still almost
$4.00 below the market average. The average vacancy rate
has declined at a quarterly rate of 1% and was nearly 3
percentage points below the market average at the end of
2005.
Retail Gross Leasable Area (GLA) Per CapitaAccording to the National Research Bureau Shopping Center
Directory, Dakota County currently has about 12% of the
seven-county retail gross leasable area (GLA) in square feet.
A little over 60% of the County’s shopping center retail was
built or renovated before 2000. Since that time, a little over
2 million square feet has been added or renovated.
The Sasaki Team compared GLA per capita in the
Minneapolis metro area to nation-wide trends and found the
metro area has about 18 GLA per capita while the nation
has about 20 GLA per capita. The following tables indicate
the estimated additional GLA (SF) needed to support the
population.
TABLE 26. ESTIMATED GLA DEMANDED
Estimated Supportable Additional Square Feet of Shopping Center Space
Year Dakota County (SF) 7- County Area (SF)
2004 860,000 to 1,620,000 950,000 to 6,500,000
2005-2010 600,000 to 680,000 4,630,00 to 5,140,000
2011-2020 1,110.00 to 1,220,00 6,280,000 to 6,970,000
2021-2030 3,190,000 to 690,000 4,730,00 to 5,260,00
Estimated Supportable Annual Additional Square Feet of Shopping Center Space
Year Dakota County (SF, Annual) 7- County Area (SF)
2005-2010 100,000 to 110,000 770,000 to 860,000
2011-2020 110,000 to 122,000 628,000 to 697,000
2021-2030 319,000 to 69,00 473,000 to 526,000
0.00%
1.00%
2.00%
3.00%
4.00%
5.00%
6.00%
7.00%
8.00%
2002
- Q
1
2002
- Q
2
2002
- Q
3
2002
- Q
4
2003
- Q
1
2003
- Q
2
2003
- Q
3
2003
- Q
4
2004
- Q
1
2004
- Q
2
2004
- Q
3
2004
- Q
4
2005
- Q
1
2005
- Q
2
2005
- Q
3
2005
- Q
4
Vac
ancy
$0.00
$5.00
$10.00
$15.00
$20.00
$25.00
Net
Ren
tal R
ate
Vacancy Rate Rental Rate
U.S. GLA Per Capita
0.00
5.00
10.00
15.00
20.00
25.00
1986
1988
1990
1992
1994
1996
1998
2000
2002
2004
GLA Per Capita
Source: CB Richard Ellis - Minneapoli

CHAPTER 3 UMORE PARK MARKET ANALYSIS AND DEVELOPMENT STRATEGY 81
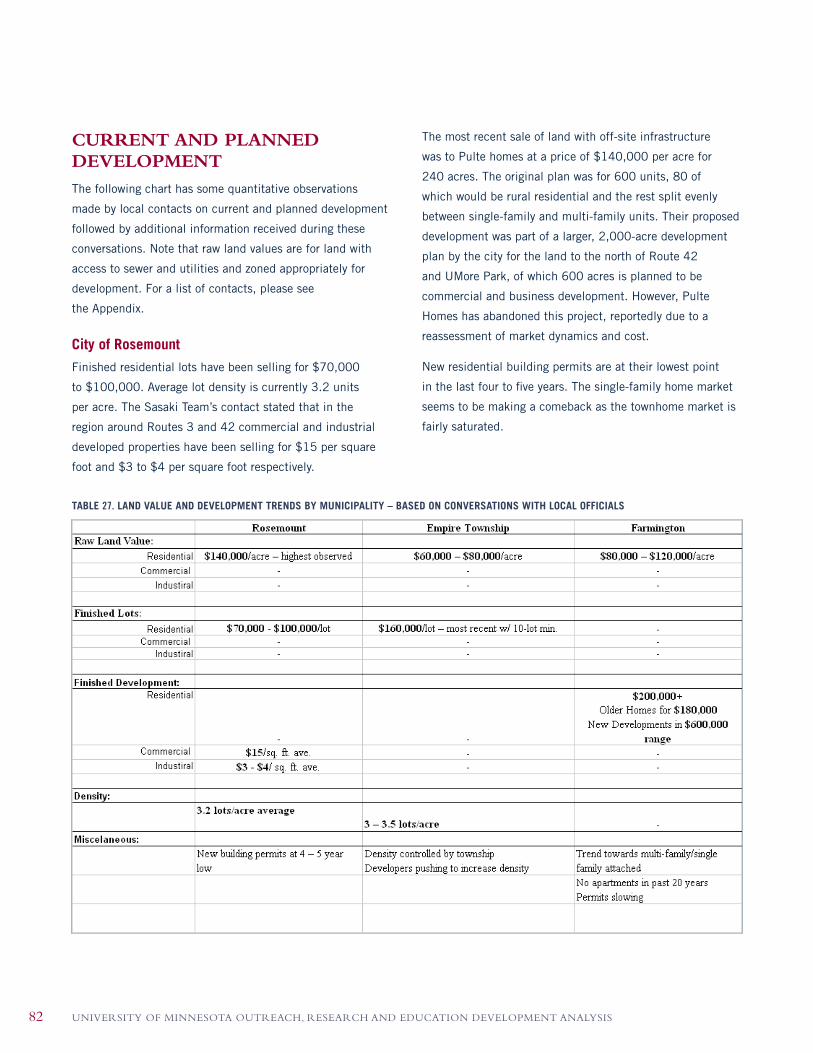
UNIVERSITY OF MINNESOTA OUTREACH, RESEARCH AND EDUCATION DEVELOPMENT ANALYSIS82
CURRENT AND PLANNEDDEVELOPMENT
The following chart has some quantitative observations
made by local contacts on current and planned development
followed by additional information received during these
conversations. Note that raw land values are for land with
access to sewer and utilities and zoned appropriately for
development. For a list of contacts, please see
the Appendix.
City of RosemountFinished residential lots have been selling for $70,000
to $100,000. Average lot density is currently 3.2 units
per acre. The Sasaki Team’s contact stated that in the
region around Routes 3 and 42 commercial and industrial
developed properties have been selling for $15 per square
foot and $3 to $4 per square foot respectively.
The most recent sale of land with off-site infrastructure
was to Pulte homes at a price of $140,000 per acre for
240 acres. The original plan was for 600 units, 80 of
which would be rural residential and the rest split evenly
between single-family and multi-family units. Their proposed
development was part of a larger, 2,000-acre development
plan by the city for the land to the north of Route 42
and UMore Park, of which 600 acres is planned to be
commercial and business development. However, Pulte
Homes has abandoned this project, reportedly due to a
reassessment of market dynamics and cost.
New residential building permits are at their lowest point
in the last four to five years. The single-family home market
seems to be making a comeback as the townhome market is
fairly saturated.
TABLE 27. LAND VALUE AND DEVELOPMENT TRENDS BY MUNICIPALITY – BASED ON CONVERSATIONS WITH LOCAL OFFICIALS
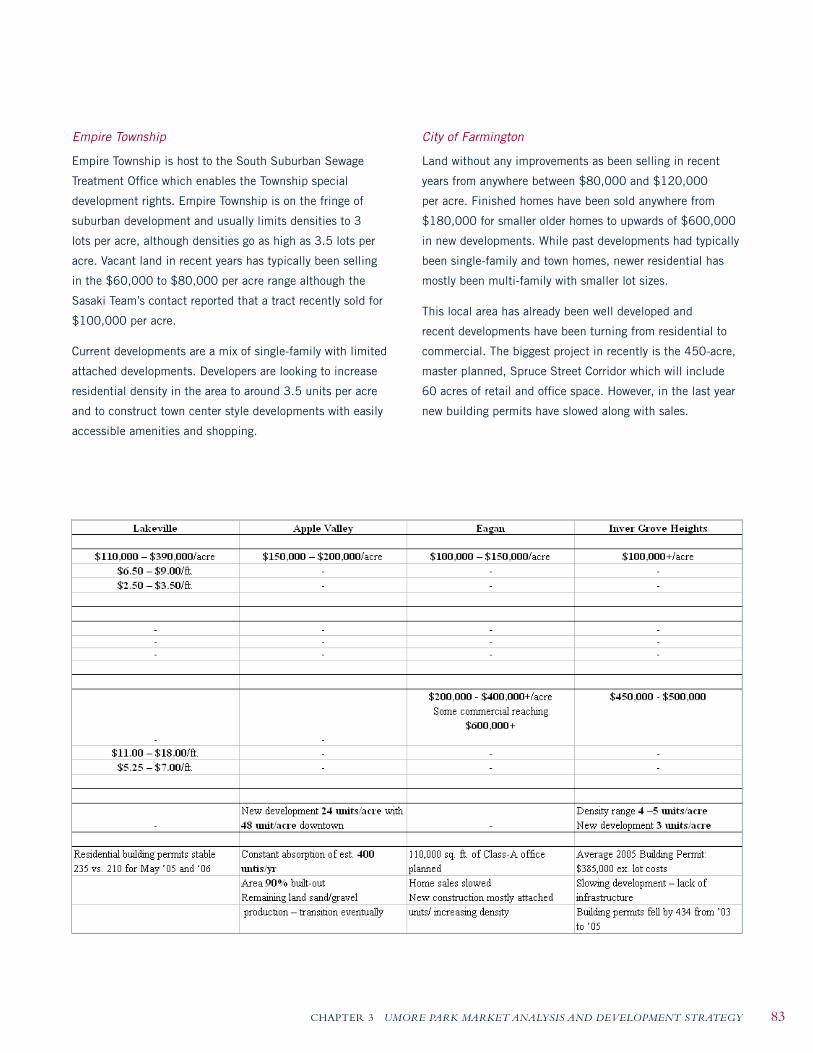
CHAPTER 3 UMORE PARK MARKET ANALYSIS AND DEVELOPMENT STRATEGY 83
Empire Township
Empire Township is host to the South Suburban Sewage
Treatment Office which enables the Township special
development rights. Empire Township is on the fringe of
suburban development and usually limits densities to 3
lots per acre, although densities go as high as 3.5 lots per
acre. Vacant land in recent years has typically been selling
in the $60,000 to $80,000 per acre range although the
Sasaki Team’s contact reported that a tract recently sold for
$100,000 per acre.
Current developments are a mix of single-family with limited
attached developments. Developers are looking to increase
residential density in the area to around 3.5 units per acre
and to construct town center style developments with easily
accessible amenities and shopping.
City of Farmington
Land without any improvements as been selling in recent
years from anywhere between $80,000 and $120,000
per acre. Finished homes have been sold anywhere from
$180,000 for smaller older homes to upwards of $600,000
in new developments. While past developments had typically
been single-family and town homes, newer residential has
mostly been multi-family with smaller lot sizes.
This local area has already been well developed and
recent developments have been turning from residential to
commercial. The biggest project in recently is the 450-acre,
master planned, Spruce Street Corridor which will include
60 acres of retail and office space. However, in the last year
new building permits have slowed along with sales.

UNIVERSITY OF MINNESOTA OUTREACH, RESEARCH AND EDUCATION DEVELOPMENT ANALYSIS84
City of Lakeville
Lakeville has experienced steady and prosperous growth in
recent years. The city has projected 500 to 650 new units
on a yearly basis for at least the next several years.
The biggest hindrance to development is access to
utilities. The southern portion of Lakeville is not part of the
Metropolitan Industrial Service Area and therefore has no
access to sewer and water. However, this southern portion
will have access to utilities starting in 2010 and will be
phased in through 2050.
Commercial land is currently selling in the range of 479,000
to $784,000 per acre for finished platted land. Raw
commercial land is estimated at $300,000 to $392,000
per acre. Industrial platted land is selling for $228,000
to $305,000 per acre and raw industrial is selling for
$109,000 to $141,000 per acre.
City of Apple Valley
Unlike most communities in the area, land available for
development in Apple Valley is limited. Available land is
90% built out and the land that will come on-line eventually
will be from converting sand and gravel mining operations as
they reached the end of their life cycle.
Raw land is selling from $150,000 to $200,000 per acre
without improvements. Recently, a village-like development
has been approved with a density 48 units per acre,
double the typical density. The City’s latest development,
Cobblestone Lake, a 300+ acre master planned community,
has a 12 unit per acre density.
Apple Valley has enjoyed fairly steady absorption rates, even
in recent years when many other communities have seen
declining permits. Sales have been constant at 400 units per
year over the last several years.
City of Eagan
Unimproved land is selling for $100,000 to $150,000
per acre. However, depending on the location, finished
development, houses, townhomes, commercial, and
industrial units are selling for $200,000 to $400,000 per
acre. Commercial property in close proximity to the highway
is selling for as high as $600,000 per acre of developed
land, although much of this is speculative construction.
Recent residential sales have slowed significantly. Attached
units and multi-family as well as retail and office space are
the primary forms of new construction. The City recently
approved three new Class-A office projects with a total
of 155,000 square feet and there are another 110,000
square feet in the planning stages. All of these projects will
incorporate first floor retail space.
City of Inver Grove Heights
The City of Inver Grove Heights has experienced moderate
and steady growth, though this has slowed in the past two
years. Declining demand and the rising cost of raw land have
contributed to this decline with unimproved land currently
selling for $100,000+ per acre.
The average residential building permit in 2005 was
$385,000, which excludes the cost of land. Finished,
single-family homes are currently selling around $450,000
to $500,000 and densities currently range in the 4 to 5 unit
per acre range.
Another problem for new development has been a lack of
available water and sewer infrastructure. Residential building
permits have dropped steadily from 635 in 2003 to 201 in
2005. Estimates indicate that there will be only 150 new
residential permits – most of them for townhomes – in 2006.
The City has recently allocated five square miles for
development in the northwest corner and will begin installing
sewer and water in the spring. This infrastructure will
be added in two phases over the next twenty years at an
estimated cost of $16.5 million for Phase I and $13.7
million for Phase II. At build out this mixed development will
have 6,000 residential units of all types, 3 million square
feet of commercial and retail space, and light industrial
facilities. Average density in this area will be approximately 3
units per acre.
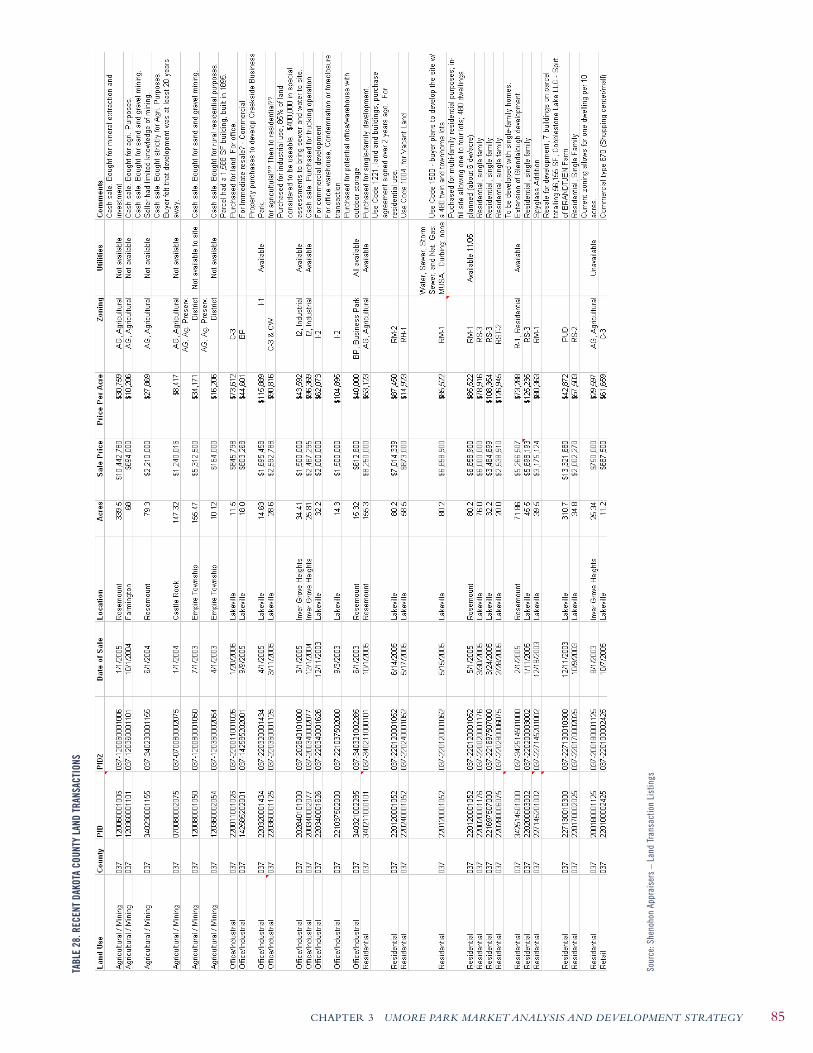
CHAPTER 3 UMORE PARK MARKET ANALYSIS AND DEVELOPMENT STRATEGY 85
Sour
ce: S
heno
hon
Appr
aise
rs –
Lan
d Tr
ansa
ctio
n Li
stin
gs
TABL
E 28
. REC
ENT
DAKO
TA C
OUNT
Y LA
NDTR
ANSA
CTIO
NS
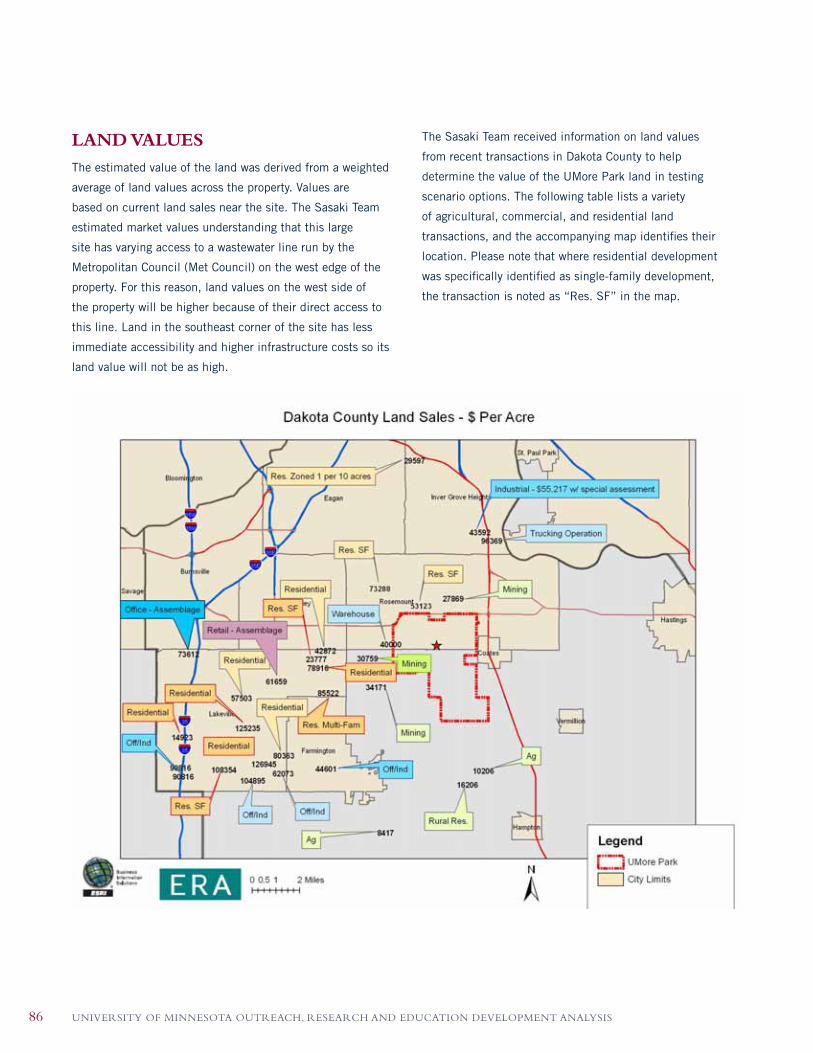
UNIVERSITY OF MINNESOTA OUTREACH, RESEARCH AND EDUCATION DEVELOPMENT ANALYSIS86
LAND VALUES
The estimated value of the land was derived from a weighted
average of land values across the property. Values are
based on current land sales near the site. The Sasaki Team
estimated market values understanding that this large
site has varying access to a wastewater line run by the
Metropolitan Council (Met Council) on the west edge of the
property. For this reason, land values on the west side of
the property will be higher because of their direct access to
this line. Land in the southeast corner of the site has less
immediate accessibility and higher infrastructure costs so its
land value will not be as high.
The Sasaki Team received information on land values
from recent transactions in Dakota County to help
determine the value of the UMore Park land in testing
scenario options. The following table lists a variety
of agricultural, commercial, and residential land
transactions, and the accompanying map identifies their
location. Please note that where residential development
was specifically identified as single-family development,
the transaction is noted as “Res. SF” in the map.
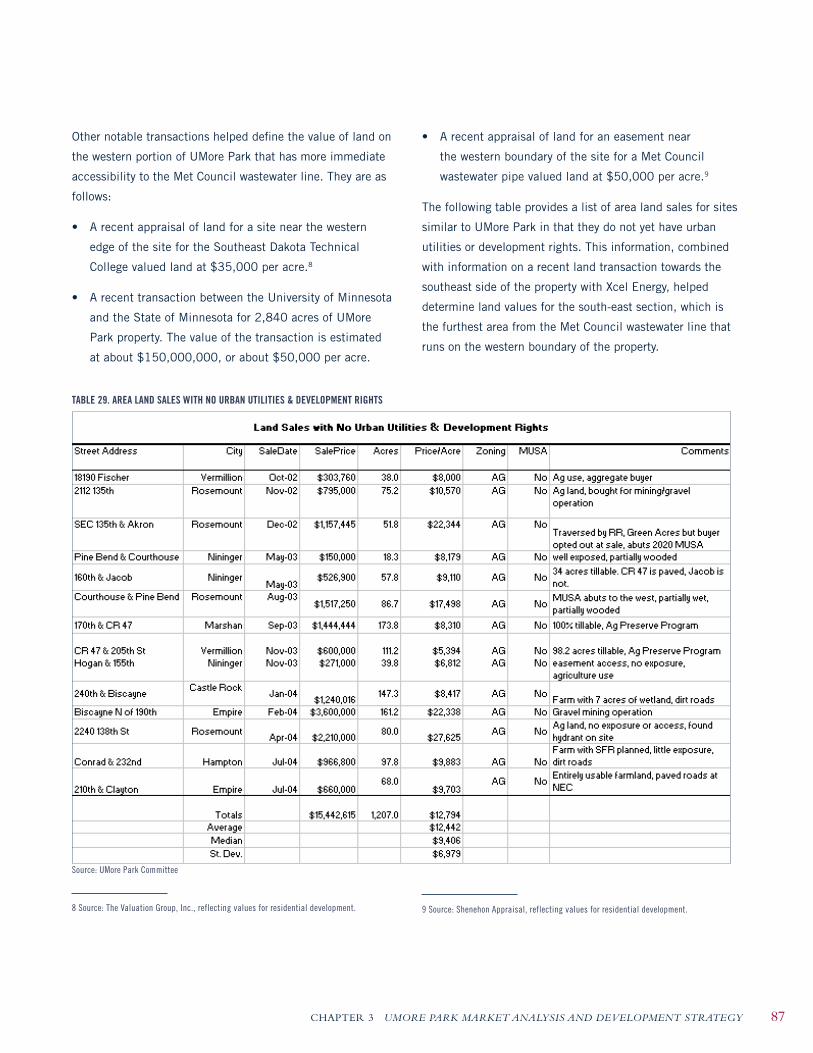
CHAPTER 3 UMORE PARK MARKET ANALYSIS AND DEVELOPMENT STRATEGY 87
Other notable transactions helped define the value of land on
the western portion of UMore Park that has more immediate
accessibility to the Met Council wastewater line. They are as
follows:
• A recent appraisal of land for a site near the western
edge of the site for the Southeast Dakota Technical
College valued land at $35,000 per acre.8
• A recent transaction between the University of Minnesota
and the State of Minnesota for 2,840 acres of UMore
Park property. The value of the transaction is estimated
at about $150,000,000, or about $50,000 per acre.
8 Source: The Valuation Group, Inc., reflecting values for residential development.
• A recent appraisal of land for an easement near
the western boundary of the site for a Met Council
wastewater pipe valued land at $50,000 per acre.9
The following table provides a list of area land sales for sites
similar to UMore Park in that they do not yet have urban
utilities or development rights. This information, combined
with information on a recent land transaction towards the
southeast side of the property with Xcel Energy, helped
determine land values for the south-east section, which is
the furthest area from the Met Council wastewater line that
runs on the western boundary of the property.
9 Source: Shenehon Appraisal, reflecting values for residential development.
TABLE 29. AREA LAND SALES WITH NO URBAN UTILITIES & DEVELOPMENT RIGHTS
Source: UMore Park Committee
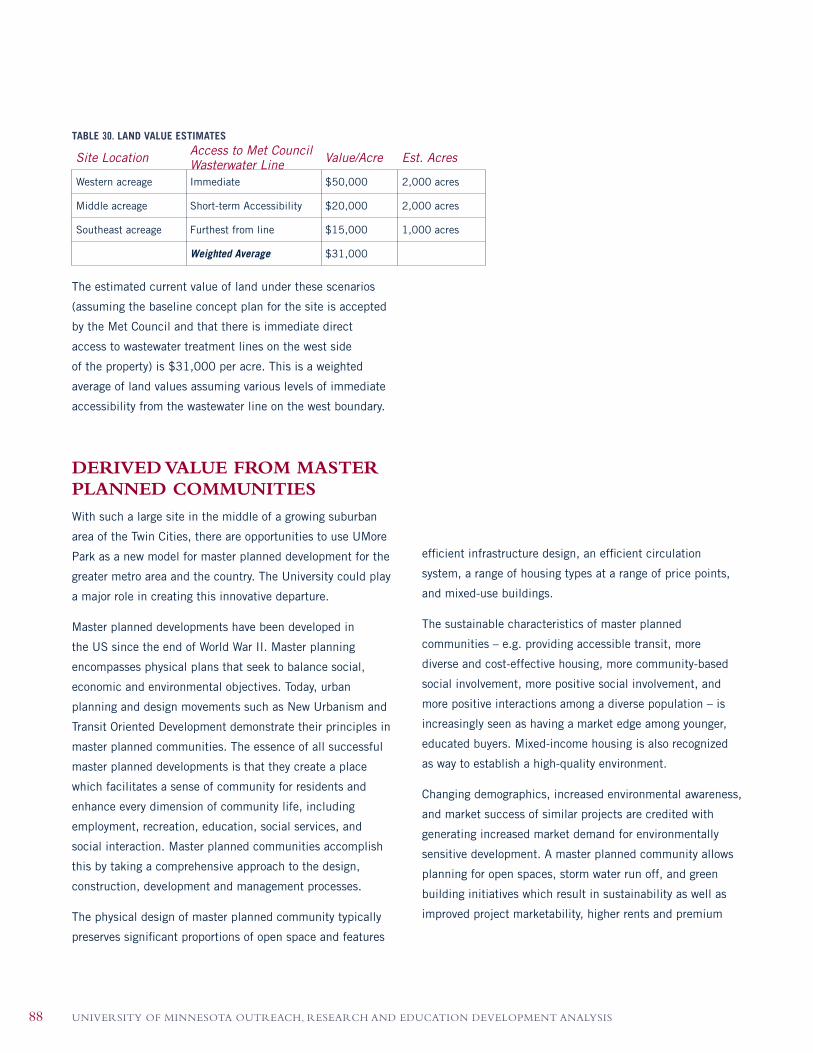
UNIVERSITY OF MINNESOTA OUTREACH, RESEARCH AND EDUCATION DEVELOPMENT ANALYSIS88
efficient infrastructure design, an efficient circulation
system, a range of housing types at a range of price points,
and mixed-use buildings.
The sustainable characteristics of master planned
communities – e.g. providing accessible transit, more
diverse and cost-effective housing, more community-based
social involvement, more positive social involvement, and
more positive interactions among a diverse population – is
increasingly seen as having a market edge among younger,
educated buyers. Mixed-income housing is also recognized
as way to establish a high-quality environment.
Changing demographics, increased environmental awareness,
and market success of similar projects are credited with
generating increased market demand for environmentally
sensitive development. A master planned community allows
planning for open spaces, storm water run off, and green
building initiatives which result in sustainability as well as
improved project marketability, higher rents and premium
TABLE 30. LAND VALUE ESTIMATES
Site Location Access to Met Council Wasterwater Line Value/Acre Est. Acres
Western acreage Immediate $50,000 2,000 acres
Middle acreage Short-term Accessibility $20,000 2,000 acres
Southeast acreage Furthest from line $15,000 1,000 acres
Weighted Average $31,000
The estimated current value of land under these scenarios
(assuming the baseline concept plan for the site is accepted
by the Met Council and that there is immediate direct
access to wastewater treatment lines on the west side
of the property) is $31,000 per acre. This is a weighted
average of land values assuming various levels of immediate
accessibility from the wastewater line on the west boundary.
DERIVED VALUE FROM MASTERPLANNED COMMUNITIES
With such a large site in the middle of a growing suburban
area of the Twin Cities, there are opportunities to use UMore
Park as a new model for master planned development for the
greater metro area and the country. The University could play
a major role in creating this innovative departure.
Master planned developments have been developed in
the US since the end of World War II. Master planning
encompasses physical plans that seek to balance social,
economic and environmental objectives. Today, urban
planning and design movements such as New Urbanism and
Transit Oriented Development demonstrate their principles in
master planned communities. The essence of all successful
master planned developments is that they create a place
which facilitates a sense of community for residents and
enhance every dimension of community life, including
employment, recreation, education, social services, and
social interaction. Master planned communities accomplish
this by taking a comprehensive approach to the design,
construction, development and management processes.
The physical design of master planned community typically
preserves significant proportions of open space and features

CHAPTER 3 UMORE PARK MARKET ANALYSIS AND DEVELOPMENT STRATEGY 89
prices.
Successful planning and development maximizes and
preserves long-term value and has a positive impact on
the cost of providing public services, including public
schools. Generally, as one moves through the spectrum from
a subdivision to a master planned community, the value
increases.
Planning Form Defining Characteristic(s) Image Examples
New Communities/TownsLarge scale, long term,balanced/mixed land uses
A new town• Reston, Virginia• The Woodlands, Texas• Summerlin, Nevada
Traditional PlannedCommunities
Moderate scale, moderateterm, mixed uses, and highopen space/recreationcomponent
A new village,contemporaryin form
• Ladera, California• Gainey Ranch, Arizona
Recreation CommunitiesRecreation and lifestyleorganizing element(s),predominantly second home
A resort lifestylecommunity
• Desert Mountain, Arizona• Hualalai, Hawaii
Active Adult Communities
Age-restricted with centralfacilities for fosteringresident interaction andlifestyle
A retirementlifestylecommunity
• Sun City, Arizona• Sun City, Nevada
New UrbanistDevelopments
Garages loaded fromrear, street-separatedsidewalks, fine-grainmixed use
A traditional village• Seaside, Florida• Kentlands, Maryland
ConservationDevelopments
Conserved open spacefocus, typically underconservation trust
A rural hamlet• Spring Island, South Carolina• Prairie Crossing, Illinois
TABLE 31. PLANNED COMMUNITIES COMPARED
Planned Subdivision: Master Planned Community:
Physical design and layout often supporting a particular theme; restrictive covenants to promote a standard of development
Value Adding Infrastructure and AmenitiesDesign, layout, physical and social infrastructure, community development programs and ‘community compact
TABLE 32. SPECTRUM OF RESIDENTIAL PLANNING

UNIVERSITY OF MINNESOTA OUTREACH, RESEARCH AND EDUCATION DEVELOPMENT ANALYSIS90
Master Planned Communities and DemandOver the next twenty-five years the United States will grow
by almost 58 million people and 70% to 90% of near-term
growth is predicted to be on previously undeveloped land.11
According to research done by the Sasaki Team, national
trends point to an increasing demand for master planned
communities with 15% to 30% of homebuyers looking
for walkable, compact neighborhoods — especially empty
nesters and retirees.12 About 50% of new home buyers would
prefer communities with housing, retail and services all
within walking distance.
Master planned communities will comprise 20% to 30% of
all new residential construction by the year 2015. Oriented
to affluent community and professionals, its strongest market
segment consists of single, young professionals and older
couples without children at home. This segment is growing
throughout the United States and in the Minneapolis-St.
Paul metro area.
11 Heid, Jim. Greenfield Development Without Sprawl: The Role of Planned Communities. Washington, D.C.: ULI – Urban Land Institute, 2004.
12 Economics Research Associates. Amalthea Mews: Westerville, Ohio. 16625. Chicago. 2006
The table below shows the average savings in infrastructure
costs, road construction, utility installation, housing cost
and economic impact over typical unplanned subdivisions
in a study of developments in New Jersey, Kentucky, and
Delaware. The master planned community’s design of open
space and compact community design equates to a 20%
to 45% reduction in the amount of land used as compared
to other forms of development. This translates to a 15%
to 25% reduction in infrastructure costs and 7% to 15%
reduction in outlays for water and sewer lines.
TABLE 33. EXAMPLES IN SAVINGS FOR VARIOUS DEVELOPMENTS
Project Site in… New Jersey Kentucky DelawareDevelopable Land 43.50% 24.20% 20.50%
Infrastructure Costs
Roads (Local) 25% 14.80% 19.70%
Utilities (Water/Sewer) 15% 8.20% 6.70%
Housing Costs 5% 2%–3% 8.40%
Fiscal Impacts 2% N/A 6.90%
Source: Lincoln Institute of Land Policy
The following tables compare residential housing sale prices
for planned community projects to their greater MSA area.
Homebuyers typically pay a 15% to 25% premium for homes
in master planned communities. Research found that buyers
prefer neighborhoods with more connective street networks;
more streets; shorter, dead-end streets, more and smaller
blocks; better pedestrian accessibility to commercial uses;
more evenly distributed land uses in the neighborhood; and
proximity to operating light rail stations.10
Master planned communities succeed by adding value to
the land financially, socially, and environmentally. A clear
vision and well-designed master plan are critical in securing
maximal value from the land. However, it is important to
note that master planned communities have significant up-
front costs and greater difficulty accessing capital. Master
planned communities also typically require a longer timeline
for development, making them a greater risk than any single-
use project.
10 Clarion Associates, Economics Research Associates. Growing Smarter at the Edge. City of Tucson, Lincoln Institute of Land Policy, Sonoran Institute. 2005.
PlannedCommunity
Project:Average
MSA:Average Average
Project Price Per SF Price Per SF Of MSA
Hidden Springs $126.23 $80.63 157%
Summerlin $154.53 $125.00 124%
Verrado $107.93 $94.00 115%
Vistancia $90.07 $94.00 96%
DC Ranch $280.68 $94.00 299%
Otay Ranch $202.00 $200.00 101%
Ranch Sahuarita $88.21 $93.33 95%
San Elijo Ranch $256.15 $200.00 128%North City Future Urbanizing Area
$283.79 $200.00 142%
Source: Economics Research Associates
TABLE 34. MARKET TO PROJECT COMPARISON: RESIDENTIAL FOR-SALE HOUSING

CHAPTER 3 UMORE PARK MARKET ANALYSIS AND DEVELOPMENT STRATEGY 91
Hid
den
Spr
ings
Sum
mer
linVe
rrad
oVi
stan
cia
DC
Ran
chO
tay
Ran
chN
orth
Cit
y Fu
ture
U
rban
izin
g A
rea
San
Elij
o R
anch
Ran
ch S
a-hu
arit
a
Tota
l # o
f U
nits
1,0
35
64
,00
09
,50
01
7,0
00
5,0
00
18
,00
01
3,0
00
3,3
98
10
,60
0
Ran
ge (
pric
e pe
r sf
)$
10
8.6
9 -
$1
01
.54
-$
91
.26
-$
83
.91
-$
20
0.3
0 -
$1
74
.99
-$
23
5.0
0 -
$1
78
.21
-$
76
.48
-
$2
21
.58
$
21
6.4
6
$1
35
.88
$
14
3.7
6$
60
2.1
6
$2
78
.55
$
42
8.0
0
$3
29
.78
$1
03
.59
Ave
rage
Pri
ce p
er s
f$
12
6.2
3
$1
54
.53
$
10
7.9
3$
90
.07
$2
80
.68
$
20
2.0
0
$2
83
.79
$2
56
.15
$
88
.21
Pre
miu
m f
or U
nits
Fr
onti
ngO
pen
Spa
ce$
5,0
00
.00
-$
4,0
00
.00
-$
1,0
00
.00
-$
6,0
00
.00
-$
10
,00
0.0
0 -
$2
0,0
00
.00
-$
10
,00
0.0
0 -
$7
5,0
00
+
or G
olf
Cou
rse
$1
50
,00
0.0
0
$2
5,0
00
.00
$
20
,00
0.0
0
$1
00
,00
0.0
0
$5
0,0
00
.00
$
80
,00
0.0
0
$9
0,0
00
.00
Ann
ual A
bsor
ptio
n R
ate
Sin
ce O
peni
ng6
56
15
0N
A1
52
88
06
91
92
1,2
35
Sour
ce:E
cono
mic
sR
esea
rch
Ass
ocia
tes
TABL
E 35
. PRO
JECT
PER
FORM
ANCE
—RE
SIDE
NTIA
LFO
R-SA
LEHO
USIN
G

UNIVERSITY OF MINNESOTA OUTREACH, RESEARCH AND EDUCATION DEVELOPMENT ANALYSIS92
MODEL AND MODELASSUMPTIONS
Based on discussions with the steering committee regarding
University goals and potential outcomes, the Sasaki Team
tested three development options.
Scenario A - “Hold Land without Development” – the University
would increase investment in UMore Park over the next ten
years by removing dilapidated structures, remediating site
contamination and extracting value from the gravel pits. It
would continue its research and commercial leasing of the
site and engage in a long-range planning process for the site.
Scenario B – “Sell Land at Wholesale Prices” – the University
would subdivide the property into large parcels of land
and sell it as quickly as possible. The purchasers of the
large land tracts (assumed to be at least 300 acres) would
determine future use and pursue approvals. It is likely that
they would develop low-density residential neighborhoods.
All existing University research and commercial leases would
be terminated.
Scenario C — “Develop a New Community” –the University
will develop a master plan, establishing the design
details to inspire decision making, capital investment
and guide development to construct the vision for UMore
Park described in this plan Scenario three, “Master Plan
Community” calls on the University to create a master plan
of sufficient detail and advance site preparation to attract a
master developer(s) to aid in its execution. In this scenario
the University offers its land, its name and intellect as
integral to the identity of the site, and may provide financial
mechanism to access capital in a preferential way. The
master developer provides the wisdom of their experience in
developing a master plan, securing approvals, developing the
land, and through their independent access to capital.
Scenario AssumptionsPractical timeframes were used to test the scenarios. Ten
years was selected for Scenario A—an ample time for the
University to ready the land for development and plan
for entering the real estate market at a higher price point
for sale of land. Twenty-five years for Scenario B—after a
significant level of absorption has taken place. And, twenty-
five years for Scenario C, to the time in which most of the
land is fully developed as a master planned community.
TABLE 36. INITIAL ASSUMPTIONS
Residential AssumptionsThe following information, in addition to other demographic
analyses in this document, helped generate assumptions
which led to estimates for residential unit capture
and absorption. Several market areas were analyzed to
understand the nuances of the overall market, including
the seven-county metro area, Dakota County, the City of
Rosemount, and the site’s three-county primary market area
of Dakota, Scott, and Washington Counties.
Using projections provided by the Metropolitan Council, the
Sasaki Team estimated the number of new households added
to the market over the last few years as well as forecasted
growth for future decades.
Base Assumptions
Current Year 2006Beginning Year 2010Years in Analysis 25End Year 2034
Scenario A Scenario B Scenario C
Net Developable Acres 3,729 3,729 3,729
Inflation 3%

CHAPTER 3 UMORE PARK MARKET ANALYSIS AND DEVELOPMENT STRATEGY 93
Permit and household data were used to predict total
permits per new household. The higher permits per new
household (indicating more robust residential construction)
in recent years is not likely to keep pace due to probable
decline in housing construction (due to recent strong
additions to housing stock compared to household growth
and other factors like rising interest rates). The Sasaki Team
anticipates that long run estimates will be more in line with
longer-run historic patterns.
Similarly, the ratio of single-family units to total units
was assessed to determine the unit mix for the proposed
development. Estimates during the period of analysis
are highlighted in gray. Because of changing household
characteristics (particularly with an aging population), the
Sasaki Team believes that a greater variety of housing types
will be demanded in the long run.13 For this reason, a slightly
smaller percentage of new units are estimated to be single-
family in future decades, with estimates in the first five years
of the analysis following trends from recent years.
13 The Appendix contains information on the aging population, and retirees in particular.
Using this information, the Sasaki Team estimated long-
term (by decade) annual projections for single-family and
multi-family housing units for several markets. The analysis
multiplied the number of new households by building
permits and multiplied the result by the percentage of
single-family units to arrive at a breakdown, by decade, of
single-family and multi-family units.
New Households 2000-2001 2001-2002 2002-2003 2003-2004 2004-2010 2010-2020 2020-2030
7-Cty Area 14,620 17,779 13,600 13,570 132,777 172,400 126,900 Dakota County 2,815 3,287 2,713 3,518 18,506 28,800 18,310 Rosemount 255 292 282 433 1,996 3,200 2,300 3-Cty Area 7,167 7,993 6,446 7,915 51,203 74,505 54,273
Total Permit (Units) Per New
Household 2001 2002 2003 2004 2004-2010 2010-2020 2020-2030
7-Cty Area 1.1 1.1 1.5 1.5 1.1 1.0 1.0 Dakota County 1.1 1.1 1.5 1.0 1.3 1.0 1.0 Rosemount 1.2 1.1 1.6 1.3 1.2 1.1 1.0 3-Cty Area 1.0 0.9 1.4 1.1 1.1 1.0 1.0
% Single Family of Total Units 2001 2002 2003 2004 2005-2010 2010-2020 2020-2030
7-Cty Area 70% 61% 68% 66% 63% 62% 61% Dakota County 72% 63% 65% 61% 66% 65% 64% Rosemount 100% 72% 76% 75% 75% 73% 71% 3-Cty Area 77% 72% 77% 79% 78% 76% 74%
TABLE 39. % SINGLE FAMILY OF TOTAL UNITS
TABLE 38. TOTAL PERMIT (UNITS) PER NEW HOUSEHOLDS – HISTORIC AND PROJECTED
TABLE 37. NET NEW HOUSEHOLDS – HISTORIC AND PROJECTED

UNIVERSITY OF MINNESOTA OUTREACH, RESEARCH AND EDUCATION DEVELOPMENT ANALYSIS94
The following residential assumptions were used to
determine the absorption and capture rates for the UMore
Park site, focusing on the three-county primary market area:
• Gross densities at build out will be slightly higher in
Scenario C due to higher absorption rate for higher-
density owner and renter-occupied multi-family
development. Densities for three types of residential
development were used to estimate land absorption.
They are:
Single-family – 3.3 units per acre
Owner-Occupied Multi-Family – 10.9 units per acre
Renter-Occuped Multi-Family – 28.8 units per acre
• Capture rates for Dakota County and the remaining three-
county area are estimated by assuming that a certain
level of development will be taking place in these market
areas over the years. As the development matures, the
site’s capture rates are anticipated to increase because
there will be fewer developments of this scale and
UMore Park’s market appeal will increase.
Based on the location of the property, recent demand
indicators and the Sasaki Team’s experience with
comparable mixed-use developments, the study
forecasts that UMore Park will attract 5% to 10% of
the Dakota County market in the short-term, and a
smaller percentage of the remaining three-county area
(2% to 3%).
»
»
»
»
• In Scenario C, it is assumed that University involvement
with the site will increase absorption and capture rates.
Also, the development will likely become attractive not
only to the three-county market area but households
outside this area.
Based on the location of the property, recent demand
indicators and the Sasaki Team’s experience with
comparable mixed-use developments,the study
forecasts that UMore Park will attract up to 6.5% to
13% of the Dakota County market in the short-term,
and a smaller percentage of the remaining three-
county area (2.6% to 3.9%). It is also likely that a
higher percentage of the site’s residents will come
from outside the three-county area because this site
will be more unique and marketable due to University
involvement.
• One likely market niche in Scenario C would be U of
M alumni. 10% of U of M living alumni live within the
three-county market area and over half of alumni are
in the seven-county metro area (see table). The Sasaki
Team believes this will augment the UMore Park market
in Scenario C.
»
Single Family Units 1990 2000 2001 2002 2003 2004 2005 to 2010 2010 to 2020 2020 to 2030
7-Cty Area 9,279 12,260 11,786 11,989 14,069 13,876 15,340 10,690 7,740 Dakota Cty 2,383 2,274 2,278 2,722 2,189 2,650 1,870 1,170 Rosemount 285 295 238 335 411 300 260 160 3-Cty Area 6,154 5,560 5,304 7,094 6,618 7,320 5,660 4,020Multi Family Units 2000 2001 2002 2003 2004 2005 to 2010 2010 to 2020 2020 to 2030
7-Cty Area 4,790 5,002 7,793 6,505 7,053 9,010 13,100 9,900 Dakota Cty 783 897 1,313 1,464 1,372 1,360 2,020 1,320 Rosemount 0 0 92 105 140 100 190 130 3-Cty Area 1,445 1,634 2,057 2,085 1,738 2,070 3,580 2,820Total Building Permits (Units) 2000 2001 2002 2003 2004 2005 to 2010 2010 to 2020 2020 to 2030
7-Cty Area 13,599 17,050 16,788 19,782 20,574 20,929 24,350 23,790 17,640 Dakota Cty 3,166 3,171 3,591 4,186 3,561 4,010 3,890 2,490 Rosemount 285 295 330 440 551 400 450 290 3-Cty Area 7,599 7,194 7,361 9,179 8,356 9,390 9,240 6,840
Units: Annual Projections
TABLE 40. RESIDENTIAL ANNUAL PROJECTIONS
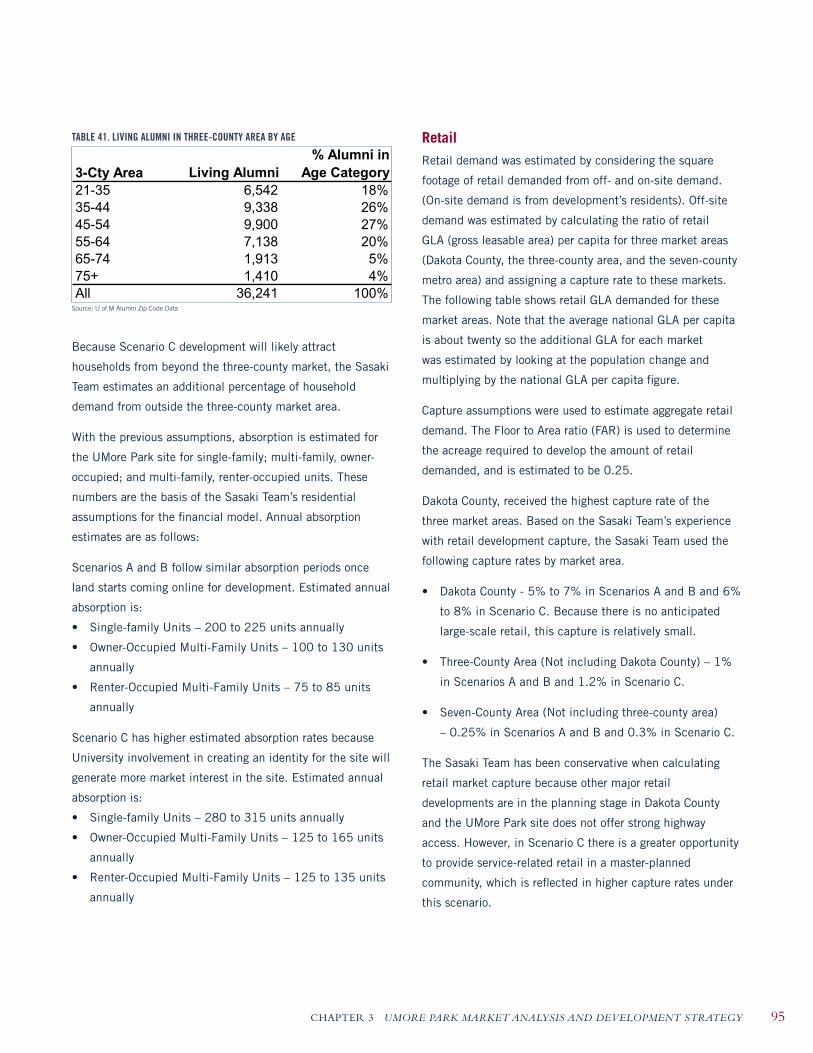
CHAPTER 3 UMORE PARK MARKET ANALYSIS AND DEVELOPMENT STRATEGY 95
TABLE 41. LIVING ALUMNI IN THREE-COUNTY AREA BY AGE
Because Scenario C development will likely attract
households from beyond the three-county market, the Sasaki
Team estimates an additional percentage of household
demand from outside the three-county market area.
With the previous assumptions, absorption is estimated for
the UMore Park site for single-family; multi-family, owner-
occupied; and multi-family, renter-occupied units. These
numbers are the basis of the Sasaki Team’s residential
assumptions for the financial model. Annual absorption
estimates are as follows:
Scenarios A and B follow similar absorption periods once
land starts coming online for development. Estimated annual
absorption is:
• Single-family Units – 200 to 225 units annually
• Owner-Occupied Multi-Family Units – 100 to 130 units
annually
• Renter-Occupied Multi-Family Units – 75 to 85 units
annually
Scenario C has higher estimated absorption rates because
University involvement in creating an identity for the site will
generate more market interest in the site. Estimated annual
absorption is:
• Single-family Units – 280 to 315 units annually
• Owner-Occupied Multi-Family Units – 125 to 165 units
annually
• Renter-Occupied Multi-Family Units – 125 to 135 units
annually
RetailRetail demand was estimated by considering the square
footage of retail demanded from off- and on-site demand.
(On-site demand is from development’s residents). Off-site
demand was estimated by calculating the ratio of retail
GLA (gross leasable area) per capita for three market areas
(Dakota County, the three-county area, and the seven-county
metro area) and assigning a capture rate to these markets.
The following table shows retail GLA demanded for these
market areas. Note that the average national GLA per capita
is about twenty so the additional GLA for each market
was estimated by looking at the population change and
multiplying by the national GLA per capita figure.
Capture assumptions were used to estimate aggregate retail
demand. The Floor to Area ratio (FAR) is used to determine
the acreage required to develop the amount of retail
demanded, and is estimated to be 0.25.
Dakota County, received the highest capture rate of the
three market areas. Based on the Sasaki Team’s experience
with retail development capture, the Sasaki Team used the
following capture rates by market area.
• Dakota County - 5% to 7% in Scenarios A and B and 6%
to 8% in Scenario C. Because there is no anticipated
large-scale retail, this capture is relatively small.
• Three-County Area (Not including Dakota County) – 1%
in Scenarios A and B and 1.2% in Scenario C.
• Seven-County Area (Not including three-county area)
– 0.25% in Scenarios A and B and 0.3% in Scenario C.
The Sasaki Team has been conservative when calculating
retail market capture because other major retail
developments are in the planning stage in Dakota County
and the UMore Park site does not offer strong highway
access. However, in Scenario C there is a greater opportunity
to provide service-related retail in a master-planned
community, which is reflected in higher capture rates under
this scenario.
Source: U of M Alumni Zip Code Data
3-Cty Area Living Alumni
% Alumni in
Age Category
21-35 6,542 18%35-44 9,338 26%45-54 9,900 27%55-64 7,138 20%65-74 1,913 5%75+ 1,410 4%All 36,241 100%
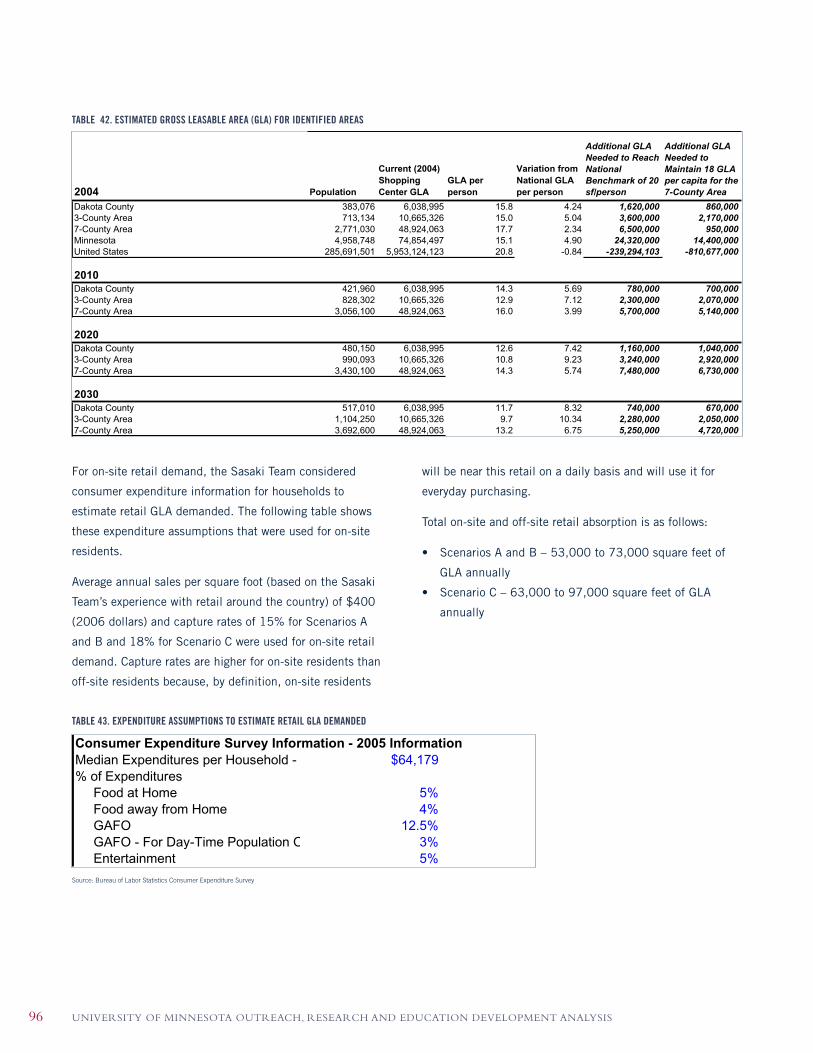
UNIVERSITY OF MINNESOTA OUTREACH, RESEARCH AND EDUCATION DEVELOPMENT ANALYSIS96
For on-site retail demand, the Sasaki Team considered
consumer expenditure information for households to
estimate retail GLA demanded. The following table shows
these expenditure assumptions that were used for on-site
residents.
Average annual sales per square foot (based on the Sasaki
Team’s experience with retail around the country) of $400
(2006 dollars) and capture rates of 15% for Scenarios A
and B and 18% for Scenario C were used for on-site retail
demand. Capture rates are higher for on-site residents than
off-site residents because, by definition, on-site residents
will be near this retail on a daily basis and will use it for
everyday purchasing.
Total on-site and off-site retail absorption is as follows:
• Scenarios A and B – 53,000 to 73,000 square feet of
GLA annually
• Scenario C – 63,000 to 97,000 square feet of GLA
annually
TABLE 42. ESTIMATED GROSS LEASABLE AREA (GLA) FOR IDENTIFIED AREAS
2004 Population
Current (2004)
Shopping
Center GLA
GLA per
person
Variation from
National GLA
per person
Additional GLA Needed to Reach National Benchmark of 20 sf/person
Additional GLA Needed to Maintain 18 GLA per capita for the 7-County Area
Dakota County 383,076 6,038,995 15.8 4.24 1,620,000 860,0003-County Area 713,134 10,665,326 15.0 5.04 3,600,000 2,170,0007-County Area 2,771,030 48,924,063 17.7 2.34 6,500,000 950,000Minnesota 4,958,748 74,854,497 15.1 4.90 24,320,000 14,400,000United States 285,691,501 5,953,124,123 20.8 -0.84 -239,294,103 -810,677,000
2010
Dakota County 421,960 6,038,995 14.3 5.69 780,000 700,0003-County Area 828,302 10,665,326 12.9 7.12 2,300,000 2,070,0007-County Area 3,056,100 48,924,063 16.0 3.99 5,700,000 5,140,000
2020
Dakota County 480,150 6,038,995 12.6 7.42 1,160,000 1,040,0003-County Area 990,093 10,665,326 10.8 9.23 3,240,000 2,920,0007-County Area 3,430,100 48,924,063 14.3 5.74 7,480,000 6,730,000
2030
Dakota County 517,010 6,038,995 11.7 8.32 740,000 670,0003-County Area 1,104,250 10,665,326 9.7 10.34 2,280,000 2,050,0007-County Area 3,692,600 48,924,063 13.2 6.75 5,250,000 4,720,000
Source: Bureau of Labor Statistics Consumer Expenditure Survey
Consumer Expenditure Survey Information - 2005 Information
Median Expenditures per Household - $64,179% of Expenditures Food at Home 5% Food away from Home 4% GAFO 12.5% GAFO - For Day-Time Population O 3% Entertainment 5%
TABLE 43. EXPENDITURE ASSUMPTIONS TO ESTIMATE RETAIL GLA DEMANDED

CHAPTER 3 UMORE PARK MARKET ANALYSIS AND DEVELOPMENT STRATEGY 97
Office, Industrial, and InstitutionalThe following assumptions are used to estimate square
footage and land usage for office development. Please note
that this applies to speculative development.
• Floor to Area Ratio (FAR) is 0.25 for office development.
• Absorption rates are 25,000 square feet annually for
Scenarios A and B. This number was selected after
analyzing the dynamics of the office market and UMore
Park’s likely participation. The site is not ideal for large-
scale office development and the office market overall
has been relatively weak in the Minneapolis-St. Paul
metro market.
• Absorption rates are 30,000 square feet annually for
Scenario C. The University’s involvement in Scenario C
is anticipated to increase annual absorption for office
space.
There may be additional opportunities for “lightning to
strike” office development at the site, which would result
in a greater share of the site being used as office. This
opportunity is greatest in a master-planned community
because a unique living environment could attract employers
who want to be near such a community and employees who
like the concept of being close to work. If this occurs, it
will impact the extent of development of other development
components (residential, retail, etc.) Given competitive sites
and the competition to secure planned office development,
this opportunity potential appears to be limited.
The following assumptions are used to estimate square
footage and land usage for industrial development. Please
note that this applies to speculative development.
• Floor to Area Ratio (FAR) is 0.25 for office development.
• Absorpotion rates are 25,000 square feet annually for
industrial space in Scenarios A and B and about 28,000
squre feet annually in Scenario C. The Sasaki Team
believes that light industrial particularly could be a good
buffer for development on the north-east corner of the
greater UMore Park site.
• Land assigned for institutional uses will use eleven
institutional acres per residential acre developed
according to regional trends.
Absorption rates for industrial development were selected
after analyzing the dynamics of the industrial market and
UMore Park’s likely participation. The site is not ideal for
industrial development particularly regarding the envisioned
large residential component as well as understanding that
most industrial development will want to take place at easy
access points along major transportation routes.
Again, there could be opportunities for additional industrial
development beyond the speculative development estimated
here – for example, an air cargo facility would impact
the speed at which industrial land gets developed at
UMore Park. The Sasaki Team’s financial model uses the
conservative, market-driven demand estimates.

UNIVERSITY OF MINNESOTA OUTREACH, RESEARCH AND EDUCATION DEVELOPMENT ANALYSIS98
Overall Conclusions
Land Absorption By Scenario
The following table uses these assumptions to estimate
acres that will be absorbed in five year increments under
each development scenario. This shows that Scenarios A
and B follow similar absorption trends under current market
conditions, though absorption in Scenario A does not begin
until Year 2016 in the analysis (which is also about 10 years
from now under the Land Bank scenario), while absorption
in Scenarios B and C begins in 2010. Scenario C shows
faster absorption for reasons discussed previously: a master
planned community with university involvement has greater
opportunities to create its own market niche in the market
place compared to that of a standard development. A master
planned community with university connections not only has
an opportunity to attain a higher market share (i.e. faster
absorption), but also an opportunity to create a higher-den-
sity community in an area that otherwise may not buy into
that concept.
The following table shows the number of acres absorbed in a
twenty-five year period as well as at full development. Note
that the rate of absorption in Scenario C leads to a build
out in a considerably faster time period for the site. The
total acres used in Scenario A is lower because absorption
does not start until 2016 while the University holds the
land, compared to absorption starting in 2010 for the other
scenarios.
Scenario AResidential 0 416 377 367 367 1,527 % of Residential
Single Family 0 342 314 307 307 1,269 83%Mid-Density 0 60 49 47 47 202 13%High-Density 0 15 14 13 13 55 4%
Commercial 0 30 28 28 29 115 % of Commercial
Retail 0 7 5 5 6 23 20%Office 0 11 11 11 11 46 40%Industrial 0 11 11 11 11 46 40%
Institutional 0 38 34 33 33 139
Total Acres 0 484 439 428 429 1,781
Scenario BResidential 410 416 377 367 367 1,937 % of Residential
Single Family 342 342 314 307 307 1,611 83.2%Mid-Density 54 60 49 47 47 256 13.2%High-Density 14 15 14 13 13 69 3.6%
Commercial 28 30 28 28 29 143 % of Commercial
Retail 5 7 5 5 6 28 20%Office 11 11 11 11 11 57 40%Industrial 11 11 11 11 11 57 40%
Institutional 37 38 34 33 33 176
Total Acres 475 484 439 428 429 2,255
Scenario CResidential 569 578 522 508 508 2,685 % of Residential
Single Family 478 478 439 429 429 2,252 83.9%Mid-Density 70 76 61 57 57 322 12.0%High-Density 21 24 22 22 22 110 4.1%
Commercial 32 35 34 34 34 169 % of Commercial
Retail 6 9 7 7 8 37 22%Office 14 14 14 14 14 69 41%Industrial 13 13 13 13 13 63 37%
Institutional 52 53 47 46 46 244
Total Acres 653 666 603 588 588 3,098
TABLE 44. ESTIMATED LAND ABSORPTION BY SCENARIO
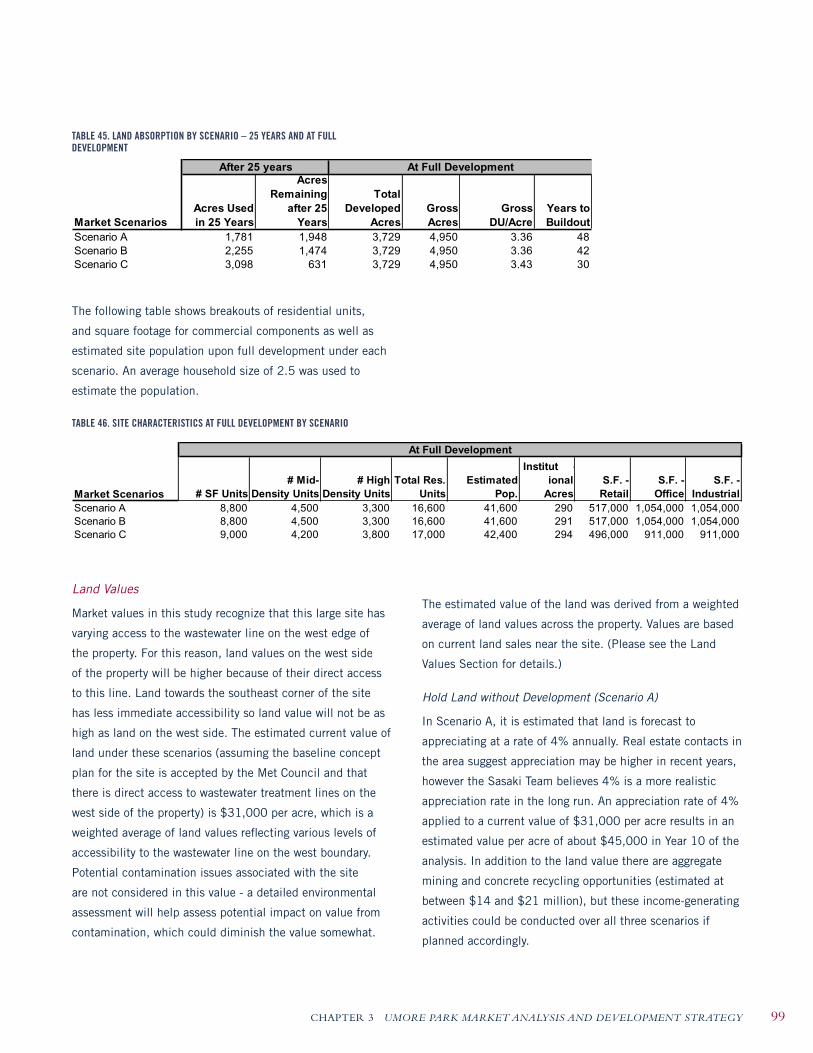
CHAPTER 3 UMORE PARK MARKET ANALYSIS AND DEVELOPMENT STRATEGY 99
TABLE 45. LAND ABSORPTION BY SCENARIO – 25 YEARS AND AT FULL DEVELOPMENT
The following table shows breakouts of residential units,
and square footage for commercial components as well as
estimated site population upon full development under each
scenario. An average household size of 2.5 was used to
estimate the population.
TABLE 46. SITE CHARACTERISTICS AT FULL DEVELOPMENT BY SCENARIO
Land Values
Market values in this study recognize that this large site has
varying access to the wastewater line on the west edge of
the property. For this reason, land values on the west side
of the property will be higher because of their direct access
to this line. Land towards the southeast corner of the site
has less immediate accessibility so land value will not be as
high as land on the west side. The estimated current value of
land under these scenarios (assuming the baseline concept
plan for the site is accepted by the Met Council and that
there is direct access to wastewater treatment lines on the
west side of the property) is $31,000 per acre, which is a
weighted average of land values reflecting various levels of
accessibility to the wastewater line on the west boundary.
Potential contamination issues associated with the site
are not considered in this value - a detailed environmental
assessment will help assess potential impact on value from
contamination, which could diminish the value somewhat.
The estimated value of the land was derived from a weighted
average of land values across the property. Values are based
on current land sales near the site. (Please see the Land
Values Section for details.)
Hold Land without Development (Scenario A)
In Scenario A, it is estimated that land is forecast to
appreciating at a rate of 4% annually. Real estate contacts in
the area suggest appreciation may be higher in recent years,
however the Sasaki Team believes 4% is a more realistic
appreciation rate in the long run. An appreciation rate of 4%
applied to a current value of $31,000 per acre results in an
estimated value per acre of about $45,000 in Year 10 of the
analysis. In addition to the land value there are aggregate
mining and concrete recycling opportunities (estimated at
between $14 and $21 million), but these income-generating
activities could be conducted over all three scenarios if
planned accordingly.
Market Scenarios
Acres Used
in 25 Years
Acres
Remaining
after 25
Years
Total
Developed
Acres
Gross
Acres
Gross
DU/Acre
Years to
Buildout
Scenario A 1,781 1,948 3,729 4,950 3.36 48Scenario B 2,255 1,474 3,729 4,950 3.36 42Scenario C 3,098 631 3,729 4,950 3.43 30
After 25 years At Full Development
Market Scenarios # SF Units
# Mid-
Density Units
# High
Density Units
Total Res.
Units
Estimated
Pop.
Institut -
ional
Acres
S.F. -
Retail
S.F. -
Office
S.F. -
Industrial
Scenario A 8,800 4,500 3,300 16,600 41,600 290 517,000 1,054,000 1,054,000Scenario B 8,800 4,500 3,300 16,600 41,600 291 517,000 1,054,000 1,054,000Scenario C 9,000 4,200 3,800 17,000 42,400 294 496,000 911,000 911,000
At Full Development

UNIVERSITY OF MINNESOTA OUTREACH, RESEARCH AND EDUCATION DEVELOPMENT ANALYSIS100
Sell Land at Wholesale Prices (Scenario B)
Demand for land reflects either developer’s perceptions
of market-driven demand; or speculator’s expectation
of appreciation. In this scenario, there is no University
involvement in the process, and demand for land would be
based on continued household growth and construction of
housing products similar to what is now being built (and
commercial / industrial sales that reflect the locational
character for the site). The value that bulk purchasers would
be willing to pay is expected to be comparable to actual
sales activity in the area – and reflecting a discount for larger
parcels. Current land values are estimated at $31,000 per
acre.
Develop a New Community (Scenario C)
Case study / literature research indicates that master
planned communities have higher market values and
typically stronger sales / leasing activity compared to
unplanned subdivisions and other growth. This scenario
creates sales forecasts for incremental value to the University
in several ways. The University’s involvement in a sustainable
environment that offers health, education and recreational
amenities will “grow” market demand and thus increase
sales velocity and will enhance the potential to create a more
dense, planned development that optimizes land use and
land value. This essentially gives UMore Park a market share
that is larger than the previous scenario, given the quality of
the product. Second, the University can become an equity
partner and share in the “upside” of development, or the
developer’s profits. Finally, there is the chance to leverage
other revenue streams such as transfer fees as has been
done in the redevelopment of Stapleton Airport in Denver.
In Scenario C, it is assumed that the land value incorporates
trunk-level infrastructure and basic land improvements
as well as entitlement changes that allow the land to be
developed according to a master plan. Because there are
so many undetermined variables in Scenario C (the nature
of the relationship between the University and a potential
nationwide developer, the details of the level of university
involvement at the site, and the level of detail of a master
plan for the community, to name a few), it is difficult to
estimate a value for this scenario at this time.
For UMore Park the retail value (the value of land prepared
for development) is calculated at 3 to 5 times the current
value of $31,000 an acre. Based on the Sasaki Team’s
experience as well as published research on enhanced
values from master planned communities, the added value
in developing master planned communities can add 30%
above the assumed retail value of land. This results from
a combination of 20% to 45% reduction in the amount of
land used, 15% to 25% reduction in infrastructure costs
and 7% to 15% less outlays for water and sewer lines from
increased density typical of master plans. These estimates of
value are distinct from any assessment of cost of providing
infrastructure and amenities.
The degree to which a master plan impacts the value of a
site is based on financial, social, and environmental factors.
A clear vision and well-designed master plan are critical
in securing maximal value from the land – establishing
development rights and selling raw land at a higher value
than the sum of the purchase price and/or other investments.
There is a continuum of value dependent on the level of
planning that is ultimately reflected in the three scenarios.
Raw Land (Agricultural Value Development Ready Land
Development Ready Master Plan
Lowest Value to University Highest Value to University
Consequently, there is also a continuum of risk dependent on
the level of planning. However, the risk can be mitigated by
having a well-thought, well-executed plan. This is possible if
the University partners with a nationwide developer that is an
expert in executing large-scale, planned communities.
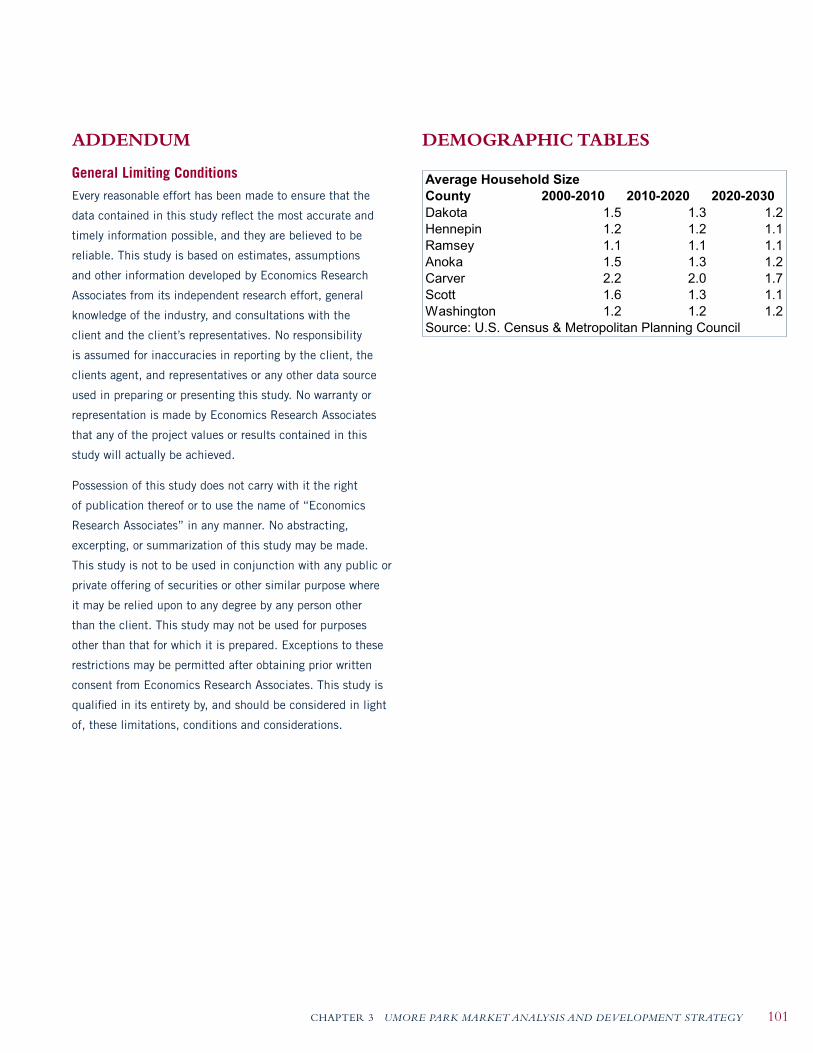
CHAPTER 3 UMORE PARK MARKET ANALYSIS AND DEVELOPMENT STRATEGY 101
ADDENDUM
General Limiting ConditionsEvery reasonable effort has been made to ensure that the
data contained in this study reflect the most accurate and
timely information possible, and they are believed to be
reliable. This study is based on estimates, assumptions
and other information developed by Economics Research
Associates from its independent research effort, general
knowledge of the industry, and consultations with the
client and the client’s representatives. No responsibility
is assumed for inaccuracies in reporting by the client, the
clients agent, and representatives or any other data source
used in preparing or presenting this study. No warranty or
representation is made by Economics Research Associates
that any of the project values or results contained in this
study will actually be achieved.
Possession of this study does not carry with it the right
of publication thereof or to use the name of “Economics
Research Associates” in any manner. No abstracting,
excerpting, or summarization of this study may be made.
This study is not to be used in conjunction with any public or
private offering of securities or other similar purpose where
it may be relied upon to any degree by any person other
than the client. This study may not be used for purposes
other than that for which it is prepared. Exceptions to these
restrictions may be permitted after obtaining prior written
consent from Economics Research Associates. This study is
qualified in its entirety by, and should be considered in light
of, these limitations, conditions and considerations.
Average Household Size
County 2000-2010 2010-2020 2020-2030
Dakota 1.5 1.3 1.2Hennepin 1.2 1.2 1.1Ramsey 1.1 1.1 1.1Anoka 1.5 1.3 1.2Carver 2.2 2.0 1.7Scott 1.6 1.3 1.1Washington 1.2 1.2 1.2Source: U.S. Census & Metropolitan Planning Council
DEMOGRAPHIC TABLES

UNIVERSITY OF MINNESOTA OUTREACH, RESEARCH AND EDUCATION DEVELOPMENT ANALYSIS102
Projected Household Forecast by County
Source: U.S. Census & Metropolitan Planning Council
1980 1990 2000 2010 2020 2030Dakota 64,087 98,293 131,151 160,650 190,300 208,510 CAGR* N/A 4.4% 2.9% 2.0% 1.7% 0.9%Hennepin 365,536 419,060 456,131 504,920 550,610 585,680 CAGR N/A 1.4% 0.9% 1.0% 0.9% 0.6%Ramsey 170,505 190,500 201,236 219,170 231,670 246,290 CAGR N/A 1.1% 0.5% 0.9% 0.6% 0.6%Anoka 60,716 82,437 106,428 130,980 153,980 163,610 CAGR N/A 3.1% 2.6% 2.1% 1.6% 0.6%Carver 12,011 16,601 24,356 39,410 53,090 68,510 CAGR N/A 3.3% 3.9% 4.9% 3.0% 2.6%Scott 13,501 19,367 30,692 53,460 73,500 85,890 CAGR N/A 3.7% 4.7% 5.7% 3.2% 1.6%Washington 35,088 49,246 71,462 93,949 116,834 138,117 CAGR N/A 3.4% 3.8% 2.8% 2.2% 1.7%
CAGR 1980-90 1990-2000 2000-10 2010-20 2020-30
Dakota 4.4% 2.9% 2.0% 1.7% 0.9%Hennepin 1.4% 0.9% 1.0% 0.9% 0.6%Ramsey 1.1% 0.5% 0.9% 0.6% 0.6%Anoka 3.1% 2.6% 2.1% 1.6% 0.6%Carver 3.3% 3.9% 4.9% 3.0% 2.6%Scott 3.7% 4.7% 5.7% 3.2% 1.6%Washington 3.4% 3.8% 2.8% 2.2% 1.7%
Projected Population Forecast by County
Source: U.S. Census & Metropolitan Planning Council
1960 1970 1980 1990 2000 2010 2020 2030
Dakota 78,303 139,808 194,279 275,227 355,904 416,790 478,110 512670 CAGR* 6.0% 3.3% 3.5% 2.6% 1.6% 1.4% 0.7%Hennepin 842,854 960,080 941,411 1,032,431 1,116,206 1,213,600 1,309,630 1,384,800 CAGR 1.3% -0.2% 0.9% 0.8% 0.8% 0.8% 0.6%Ramsey 422,525 476,255 459,784 485,765 511,035 547,700 570,860 598,900 CAGR 1.2% -0.4% 0.6% 0.5% 0.7% 0.4% 0.5%Anoka 85,916 154,712 195,998 243,641 298,084 355,170 393,010 410,760 CAGR 6.1% 2.4% 2.2% 2.0% 1.8% 1.0% 0.4%Carver 21,358 28,331 37,046 47,915 70,205 104,470 138,720 174,630 CAGR 2.9% 2.7% 2.6% 3.9% 4.1% 2.9% 2.3%Scott 21,909 32,423 43,784 57,846 89,498 145,640 189,700 215,370 CAGR 4.0% 3.0% 2.8% 4.5% 5.0% 2.7% 1.3%Washington 52,432 83,003 113,571 145,896 201,130 244,732 296,693 342,620 CAGR 4.7% 3.2% 2.5% 3.3% 2.0% 1.9% 1.4%
CAGR 1960-70 1970-80 1980-90 1990-2000 2000-10 2010-20 2020-30
Dakota 6.0% 3.3% 3.5% 2.6% 1.6% 1.4% 0.7%Hennepin 1.3% -0.2% 0.9% 0.8% 0.8% 0.8% 0.6%Ramsey 1.2% -0.4% 0.6% 0.5% 0.7% 0.4% 0.5%Anoka 6.1% 2.4% 2.2% 2.0% 1.8% 1.0% 0.4%Carver 2.9% 2.7% 2.6% 3.9% 4.1% 2.9% 2.3%Scott 4.0% 3.0% 2.8% 4.5% 5.0% 2.7% 1.3%Washington 4.7% 3.2% 2.5% 3.3% 2.0% 1.9% 1.4%

CHAPTER 3 UMORE PARK MARKET ANALYSIS AND DEVELOPMENT STRATEGY 103
CURRENT AND PLANNEDDEVELOPMENT CONTACTS LOCAL AREA
City of Rosemount
Name: Kim Lindquist
Title: Director of Community Development
Phone: 651.322.2020
E-mail: [email protected]
Empire Township
Name: Bill Wustenberg
Title: N/A – Empire Township Planning
Commission
Phone: 651.460.3330
City of Farmington
Name: Tina Schwanz
Title: Economic Development Specialist
Phone: 651.463.1861
E-mail: [email protected]
City of Lakeville
Name: Adam Kienberger
Title: Economic Development Specialist
Phone: 952.985.4420
E-mail: [email protected]
City of Apple Valley
Name: Tom Lovelace
Title: Director of Community Development
Phone: 952.953.2575
E-mail: [email protected]
City of Eagan
Name: Eric Slettedahl
Title: N/A – Community Development Office
Phone: 651.675.5685
City of Inver Grove Heights
Name: Thomas Link
Title: Director of Community Development
Phone: 651.450.2546
E-mail: [email protected]

UNIVERSITY OF MINNESOTA OUTREACH, RESEARCH AND EDUCATION DEVELOPMENT ANALYSIS104
RETIREMENT TRENDS
To understand the trends associated with retirement at
the national, state and county levels, it helps to begin by
defining what retirement actually means. For the United
States, retirement usually consists of two observable factors:
nonparticipation in the paid labor force and receipt of
monetary funds through pensions, Social Security, or other
retirement plans. For example, a person who does not work
for compensation and who receives benefits from some form
of a retirement account would meet this definition.
As the generation born between 1946-1964 approaches
retirement age, the proportion of the U.S. population age
65+ will rise from 12.4% to from 2005 to 20.3% in 2035
(U.S. Census 2003). The profiles of the economically active,
however, are currently shifting towards older workers.
The following table highlights the Census Bureau’s estimates
for 2005 through 2035. These estimates provide a pretty
good gauge as to how much the baby boom population will
increase.
The Census Bureau estimates that the number of people
ages 65+ will increase from about 37 million in 2005 to
around 77 million in 2035. There is an anticipated annual
growth rate of residents 65+ of 2.49% per year. This growth
rate is considerable when comparing the growth rates of
other age groups. No other age group, as the below table
illustrates, comes close to matching this kind of growth.
Age Projections in the U.S. Population (in thousands)Year 25 to 34 35 to 44 45 to 54 55 to 64 65 + Total
2005 39,600 43,603 42,436 30,376 36,696 192,711
2035 47,548 46,296 45,584 39,397 76,641 255,466
CAGR 0.61% 0.20% 0.24% 0.87% 2.49%Source: U.S. Census 2003
The following table exhibits Minnesota’s projected population
increase by age group.
The Minnesota State Demographic Center estimated that
residents ages 65+ will increase from 620,000 residents in
2005 to about 1.4 million in 2035. The anticipated growth
rate for the 65+age bracket is 2.68%, just slightly higher
than the national average.
Age Projections for MinnesotaYear 25 to 34 35 to 44 45 to 54 55 to 64 65 + Total
2005 693,000 783,000 770,000 512,000 620,000 3,378,000
2035 788,000 839,000 814,000 675,000 1,370,000 4,486,000
CAGR 0.43% 0.23% 0.19% 0.93% 2.68%Source: Minnesota State Demographic Center
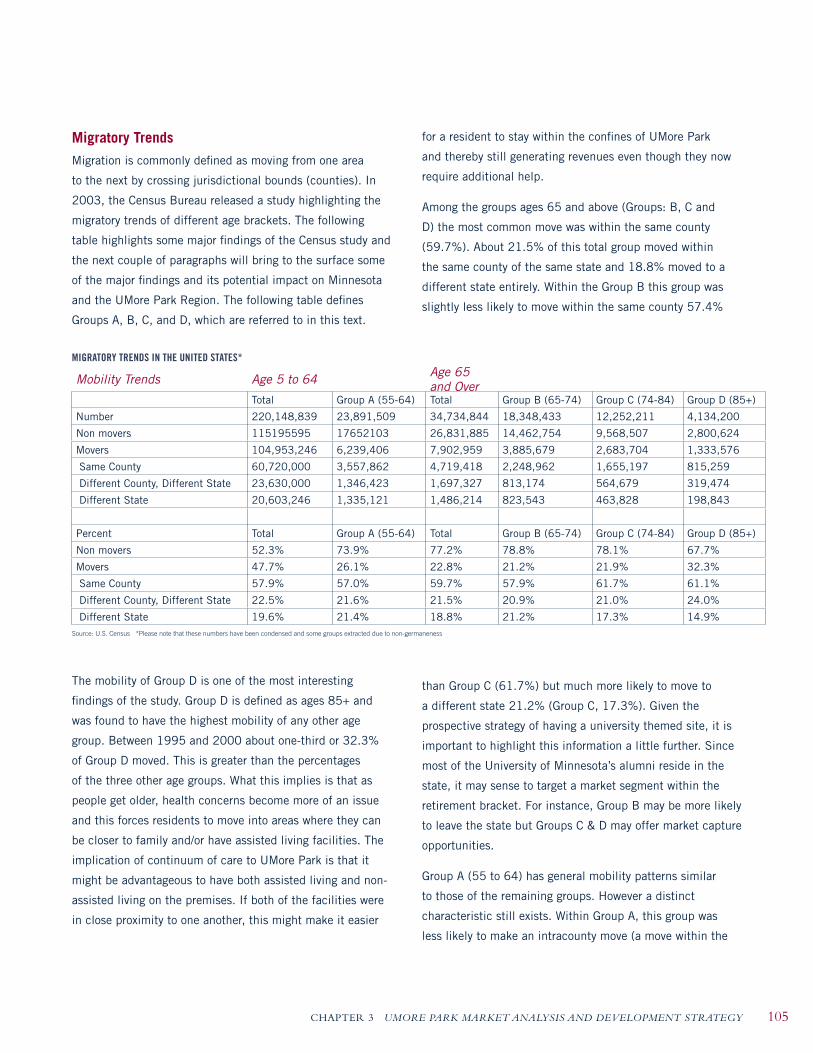
CHAPTER 3 UMORE PARK MARKET ANALYSIS AND DEVELOPMENT STRATEGY 105
for a resident to stay within the confines of UMore Park
and thereby still generating revenues even though they now
require additional help.
Among the groups ages 65 and above (Groups: B, C and
D) the most common move was within the same county
(59.7%). About 21.5% of this total group moved within
the same county of the same state and 18.8% moved to a
different state entirely. Within the Group B this group was
slightly less likely to move within the same county 57.4%
than Group C (61.7%) but much more likely to move to
a different state 21.2% (Group C, 17.3%). Given the
prospective strategy of having a university themed site, it is
important to highlight this information a little further. Since
most of the University of Minnesota’s alumni reside in the
state, it may sense to target a market segment within the
retirement bracket. For instance, Group B may be more likely
to leave the state but Groups C & D may offer market capture
opportunities.
Group A (55 to 64) has general mobility patterns similar
to those of the remaining groups. However a distinct
characteristic still exists. Within Group A, this group was
less likely to make an intracounty move (a move within the
Migratory TrendsMigration is commonly defined as moving from one area
to the next by crossing jurisdictional bounds (counties). In
2003, the Census Bureau released a study highlighting the
migratory trends of different age brackets. The following
table highlights some major findings of the Census study and
the next couple of paragraphs will bring to the surface some
of the major findings and its potential impact on Minnesota
and the UMore Park Region. The following table defines
Groups A, B, C, and D, which are referred to in this text.
The mobility of Group D is one of the most interesting
findings of the study. Group D is defined as ages 85+ and
was found to have the highest mobility of any other age
group. Between 1995 and 2000 about one-third or 32.3%
of Group D moved. This is greater than the percentages
of the three other age groups. What this implies is that as
people get older, health concerns become more of an issue
and this forces residents to move into areas where they can
be closer to family and/or have assisted living facilities. The
implication of continuum of care to UMore Park is that it
might be advantageous to have both assisted living and non-
assisted living on the premises. If both of the facilities were
in close proximity to one another, this might make it easier
MIGRATORY TRENDS IN THE UNITED STATES*
Mobility Trends Age 5 to 64 Age 65and Over
Total Group A (55-64) Total Group B (65-74) Group C (74-84) Group D (85+)
Number 220,148,839 23,891,509 34,734,844 18,348,433 12,252,211 4,134,200
Non movers 115195595 17652103 26,831,885 14,462,754 9,568,507 2,800,624
Movers 104,953,246 6,239,406 7,902,959 3,885,679 2,683,704 1,333,576
Same County 60,720,000 3,557,862 4,719,418 2,248,962 1,655,197 815,259
Different County, Different State 23,630,000 1,346,423 1,697,327 813,174 564,679 319,474
Different State 20,603,246 1,335,121 1,486,214 823,543 463,828 198,843
Percent Total Group A (55-64) Total Group B (65-74) Group C (74-84) Group D (85+)
Non movers 52.3% 73.9% 77.2% 78.8% 78.1% 67.7%
Movers 47.7% 26.1% 22.8% 21.2% 21.9% 32.3%
Same County 57.9% 57.0% 59.7% 57.9% 61.7% 61.1%
Different County, Different State 22.5% 21.6% 21.5% 20.9% 21.0% 24.0%
Different State 19.6% 21.4% 18.8% 21.2% 17.3% 14.9%Source: U.S. Census *Please note that these numbers have been condensed and some groups extracted due to non-germaneness

UNIVERSITY OF MINNESOTA OUTREACH, RESEARCH AND EDUCATION DEVELOPMENT ANALYSIS106
same county) and more likely to move to a different state
entirely. This is important to bring up in terms of targeting
age groups before they decide on where to move. Presumably
within Group A there are some who have already retired or on
the cusp of retirement and looking for a prospective place to
live. By catching them early on in the retirement cycle and
there is a good possibility that this group would be willing to
consider UMore Park. Further, out-of-state U of M graduates
could be targeted.
Non-movers are defined as those individuals who stayed
within their same household. For ages 65 and over, non-
movers comprised 77.2% of the surveyed people. In other
words, 77% of the population 65 and older did not change
household addresses. This is of interest to UMore Park in the
following ways. UMore Park might want to begin a gradual
process to test retirement housing. (Second homes are not
believed to be a strong target market).
IMMIGRATION, OUTMIGRATION AND NET MIGRATION
Minnesota Wisconsin Iowa North Dakota South Dakota65 & OverInmigrants 14,923 19,046 10,843 2,402 4,084
Outmigrants 21,060 23,008 15,770 3,948 4,330
Net Migration -6,137 -3,962 -4,927 -1,546 -246
65 to 74Inmigrants 6,567 9,164 5,073 1,271 2,159
Outmigrants 12,674 13,208 8,533 1,895 2,389
Net Migration -6,107 -4,044 -3,460 -624 -230
75 to 84Inmigrants 5,210 6,347 3,457 711 1,284
Outmigrants 6,036 6,763 4,965 1,297 1,300
Net Migration -826 -416 -1,508 -586 -16
85+Inmigrants 3146 3535 2313 420 641
Outmigrants 2350 3037 2272 756 641
Net Migration 796 498 298 -336 0Source: U.S. Census
The Census study also compiled data for each state detailing
the migratory trends associated with their respective age
brackets. The following table points out Minnesota’s and
its bordering state’s migratory patterns. According to the
Census, Inmigration refers to the number of migrants who
moved into an area (in this case, the state). Outmigration
is the opposite: number of people who moved out and
Net Migration in the difference between inmigration and
outmigration. With net migration, a negative value for net
migration is indicative of net outmigration, more emigrants
left an area than entered it. Positive numbers reflect the
opposite.

CHAPTER 3 UMORE PARK MARKET ANALYSIS AND DEVELOPMENT STRATEGY 107
Minnesota, along with its bordering states, saw net migration
decline from just about all age categories. In Minnesota,
ages 64 to 74 saw about an average decline of about 6,100
residents. A high-quality retirement, living environment with
health and education programming at UMore Park could
have a limiting effect on this trend.
State Immigration to Dakota, Scott and Washington CountiesUsing the targeted counties of Dakota, Scott and Washington
Counties, the Sasaki Team has compiled data on the states
which Dakota, Scott and Washington Counties receive most
of their domestic immigration from.
72% of Dakota, Scott and Washington County inflows come
from within Minnesota. The next biggest contributor is
Michigan with 18%. West Virginia, Wisconsin and California
send only a marginal number of people to the area with 3%
and 4%, respectively.
MSA immigration to Dakota, Scott and Washington CountiesDakota, Scott and Washington Counties receive most of its
domestic immigrants from Hennepin County (56%). Dakota
County is the next largest group with 18%. Washington,
Anoka and Ramsey all send each send about 7% of its
residents to our targeted areas. It might be interesting to
highlight that Dakota, Scott and Washington all send a good
share of residents to each other, which is, in part, why the
Sasaki Team used the three-county area as the primary
residential market in its analysis.
Chart 2
MSA Immigration to Dakota, Scott and Washington
Counites Washington
7%Anoka
7%
Dakota18%
Scott5%
Ramsey7%
Hennepin56%
Hennepin Ramsey Scott Dakota Anoka Washington
Source: U.S. Census


CHAPTER 3 UMORE PARK MARKET ANALYSIS AND DEVELOPMENT STRATEGY 109
3.3 CONSIDERATION OFNATIONAL DEVELOPERS AND SUCCESSFUL DEVELOPMENTMODELS
The UMore Park Steering Committee met with two national
developers who are interested in the UMore Park project
and the opportunity to collaborate with the University of
Minnesota to see this land developed as a community. The
profile of each is detailed below:
Forest City Enterprises Hines
Office Headquarters Cleveland, OH Houston, TX
Other Offices Boston, Chicago, Denver, Los Angeles, New York, San Francisco, Washington DC
85 offices in 15 countries, including Atlanta, Chicago, London, New York and San Francisco
Mission Statement Forest City Enterprises is a national owner and developer of real estate, committed to building superior, long-term value for its shareholders and customers. We accomplish this through the operation, acquisition and development of commercial, rental housing and land development projects. We operate by developing meaningful relationships and leveraging our entrepreneurial capabilities with creative talent in a fully integrated real estate organization.
Hines is a privately owned, international real estate firm that has provided the highest level of quality, service and value to its clients and investors for nearly 50 years. With a presence in more than 85 cities around the globe and investor relationships with many of the world’s largest financial institutions, Hines has the breadth of experience, the network of expertise and the financial strength to assume complex and challenging investment, development and management projects.
Specialties Commercial, Residential, Mixed-Use and Land Development
Skyscrapers, corporate headquarters, mixed-use centers, industrial parks, medical facilities, and master-planned resort and residential communities
Company Assets $7.8 billion $11.7 billion
Annual Revenues $1 billion unknown
Public or Private? Public Private
Current Project Loca-tions
Focus on core metro areas of New York/Philadelphia, Boston, Washington DC, Baltimore, Denver and California; also growing market share in Chicago and Florida; working in 19 states in all
Working on projects across the US and the world
Project Highlights Stapleton Airport redevelopment, Denver, CO; University Park at MIT, Cambridge, MA; Waterfront project, Washington, DC
The Galleria, Houston, TX; Embassy House, Beijing, China; Wortham Theater Center, Houston, TX
Projects in Minnesota? No Yes -- University of Minnesota TCF Bank Stadium, Wells Fargo Center, Twinsville, US Bank Center, 50 and 225 South Sixth St
Website Address http://www.forestcity.net http://www.hines.com/development

UNIVERSITY OF MINNESOTA OUTREACH, RESEARCH AND EDUCATION DEVELOPMENT ANALYSIS110
Steiner and Associates McCaffery Interests
Office Headquarters Columbus, OH Chicago, IL
Other Offices Arlington, VA; Alexandria, VA; Minneapolis, MN
Mission Statement Steiner + Associates specialize in the design, construction, leasing and marketing of new town centers with a master planning focus. Steiner brings its principled development approach to suburban locations, actively incorporates the ideals of New Urbanism and shares with both private and public sectors the responsibility for planned public spaces that are beautiful, commercially vital, universally accessible and always unforgettable.
McCaffery Interests, Inc., formed in 1991, targets investment in and the development or redevelopment of under performing, specialty urban real estate. The company is led by Daniel T. McCaffery within a structure that features economic participation and meaningful delegation of responsibility and accountability among the management team. To date, McCaffery Interests has successfully followed through on its mission and has acquired, developed and/or redeveloped nearly $800,000,000 of outstanding real estate assets.
Specialties “Town center” retail developments Urban devel opment and redevelopment; retail, office and residential projects
Company Assets $550 million unknown
Annual Revenues unknown unknown
Public or Private? Private Private
Current Project Loca-tions
Kansas City, MO; Milwaukee, WI; Hampton, VA; Dayton, OH
Myrtle Beach, SC; Pittsburgh, PA; Chicago, IL
Project Highlights Easton Town Center, Columbus, OH; CocoWalk, Coconut Grove, FL; Centro Ybor, Ybor City, FL;
Georgetown Centre, Washington, DC; Hotel Burnham, Chicago, IL
Projects in Minnesota? No Yes -- Block E Minneapolis
Website Address http://www.steiner.com http://www.mccafferyinterests.com
CHAPTER 3 UMORE PARK MARKET ANALYSIS AND DEVELOPMENT STRATEGY 111
The responsibilities, authority and reporting relationships
real estate offices of other large University’s were surveyed to
identify potential precedents for the University of Minnesota
as it considers master planning of UMore Park. A summary
of three interesting models follows:
• Among other goals, Cornell University Real Estate
Department (CU-RED) promotes activities that support
commercialization of University technology and real
estate activities to enhance the economic base and
exemplify high standards of planning and development
in Ithaca. The office has authority to acquire, sale,
lease, develop, encumber, and plan all of Cornell’s
non-academic real property assets. CU-RED directs two
brokerage offices. In Cornell office projects include office
buildings, a mixed-use project, apartment buildings and
a 300-acre business and technology. Typically, their
real estate is provided through a land/ground lease with
reversion rights on the land and improvements. Revenue
from their ventures is assigned to the University’s
general use budget. The Board of Trustees votes on its
use in consideration of an annual proposal submitted to
it by the Cornell Division of Planning and Budget.
• The Massachusetts Institute of Technology Real
Estate Office invests in and manages property for
the endowment, investment in the general fund of
the University, and for the benefit of the Institute’s
retirement and benefits plan. Through the Real Estate
Office, MIT owns and manages considerable residential
and commercial properties. It recently sold an office
complex immediately adjacent to the University for over
$600 million and owns University Park, planned to be
a 2.3 million square foot mixed-use development in
Cambridge, Massachusetts. This office relies on land/
ground leases for most of its commercial holdings. In
the case of University Park, the Real Estate Office has
contracted with a single master developer, developed the
master level permits in partnership with the developer,
and provides the land to the developer through a long-
term lease. Terms of the master agreement stipulate
milestone activities and regular dates for the master
developer to confer with the Real Estate Office.
• Simon Frasier University in Burnaby, British Columbia
has established the SFU Community Trust, a wholly
owned subsidiary of Simon Fraser University, to plan and
manage UniverCity, a 200-acre mixed-use development
adjacent to the University. The project’s mission is
to establish a community that complements existing
and future University development and that creates
an endowment fund and other sources of revenue
to support University purposes. This project will be
developed entirely through long-term leases and a
multitude of developers. The project’s board of directors
includes representatives from the university’s Board of
Governors, officers of the university, and external experts
knowledgeable about planning and urban development.
The corporation receives advice from a Community
Advisory Committee which represents the campus
community and other interest groups.
In considering national developers and precedent University
real estate accomplishments, the UMore Park Steering
Committee visited four communities that presented

UNIVERSITY OF MINNESOTA OUTREACH, RESEARCH AND EDUCATION DEVELOPMENT ANALYSIS112
themselves of greatest interest to the group:
UniverCityUniverCity is a mixed-use new community by Simon Fraser
University with a creative approach to sustainable planning
and new urban development. It is located in Burnaby,
British Columbia in a unique mountaintop setting. In 1995,
the City of Burnaby and Simon Fraser University entered into
an agreement where the University transferred to the City
approximately 820 acres of conservation land in exchange
for approvals to build a new community surrounding the
university campus. This campus came to be known as
UniverCity.
Simon Fraser University currently has a daily on campus
population of approximately 12,000 persons including the
Resident Student population of 1,400. The goal of the
Simon Fraser UniverCity concept is to create a vibrant,
self-sustaining community known for its well planned
neighborhoods, its strong links to the university and its deep
respect for the natural heritage of Burnaby Mountain. It
is connected by a network of bus routes and highways to
downtown Vancouver and is about half way between the east
and west extremes of Greater Vancouver’s urbanized area.
Simon Fraser has outlined four cornerstones which define the
development of this new community: Environment, Equity,
Economy, and Education.
• Environment: The community will be served by public
transportation, is surrounded by over 1200 acres of
park or conservation lands, and will employ innovative
approaches to stormwater management and energy
conservation.
• Equity: The community will include secondary suites to
accommodate student needs, and will offer a diverse mix
of apartments and homes for sale or rent.
• Economy: The community is zoned for mixed use and
will provide job opportunities through the university, the
expanded research park known as Discovery Park, as well
as develop the UniverCity High Street which offers a mix
of service-based industries and businesses.
• Education: The community can utilize Simon Fraser
childcare, classes, continuing education, and summer

CHAPTER 3 UMORE PARK MARKET ANALYSIS AND DEVELOPMENT STRATEGY 113
camp programs which are offered on campus.
For the purpose of the UniverCity Development Plan
Concept, Simon Fraser University is planning for a total
housing population of 10,000 persons. Simon Fraser
University has also committed to provide a site, or sites
for an elementary school that would be capable of being
developed to accommodate 400 to 600 students. As of
July, 2006, the community contains 1,000 townhouses
and apartments and is one-tenth of its projected size. All
buildings thus far have been built in accordance with the
UniverCity community trust’s green building guidelines.
Research Links:
http://www.univercity.ca
University TownUniversity Town is designed to bring market and non-market
housing onto to the campus of the University of British
Columbia (UBC). The reasons for this are multi-fold:
• To encourage a more active campus community
(historically the campus was more commuter-oriented
due to a lack of on-campus housing or affordable
housing near the UBC campus);
• To offer a greater range of housing options for students,
faculty and staff;
• To sponsor a live-work community where 50% of new
market and non-market housing is targeted for people
who work or study on campus, thereby significantly
reducing the need for commuting; and
• To help build the University endowment, ensuring that
the University maintains its position as a world leader in
education and research.
University Town involves the construction of new residential
and new academic buildings, and includes the planning of
eight new neighborhoods in addition to nearly 2.5-million SF
of academic and research facilities
within the 1,000-acre campus.
99-year leases for residential and
commercial uses enable the University
to still hold the title to the land and
grow its endowment. The development
is expected to generate US $400-
million for the UBC endowment.
Land leases are predicated upon commercial standards,
with each leaseholder paying property taxes equivalent
to those paid by residents in surrounding municipalities.
50% of new market and non-market housing is targeted for
people who work or study on campus, reducing commuting
to and from campus. UBC is the largest employer in the
Greater Vancouver area. A real estate trust, UBC Properties
Trust, oversees development and management of U-Town
in a project management role.1 Community amenities are
intricately linked to University services and campus life such
as resident memberships to UBC facilities and advanced
ticketing for events. The neighborhoods will provide a mix
of housing, university related shops and services, parks,
community centers and amenities in a pedestrian-friendly
setting close to the university’s academic, cultural and
recreational facilities. A wide range of housing options with
transportation infrastructure, and cultural, academic, and
recreational facilities will complete the community vision.
Most “non-institutional” development is expected to occur
within eight local areas identified in the Official Community
Plan (OCP), surrounding the academic core. The purpose of
the Campus Community Plan and the Neighbourhood Plans
is to interpret and apply the OCP’s policies and development
requirements as a framework for future development
approval. Each Neighbourhood Plan contains a detailed
land use plan, development controls, design guidelines, and
servicing and transportation strategies.
Though the campus is generally considered part of the
City of Vancouver, it is technically part of “Electoral Area
1 UBC Properties Trust is a “market oriented private company wholly owned by the Univer-sity of British Columbia. It was established in 1988 with a mission to acquire, develop and manage real estate assets for the benefit of the University.”
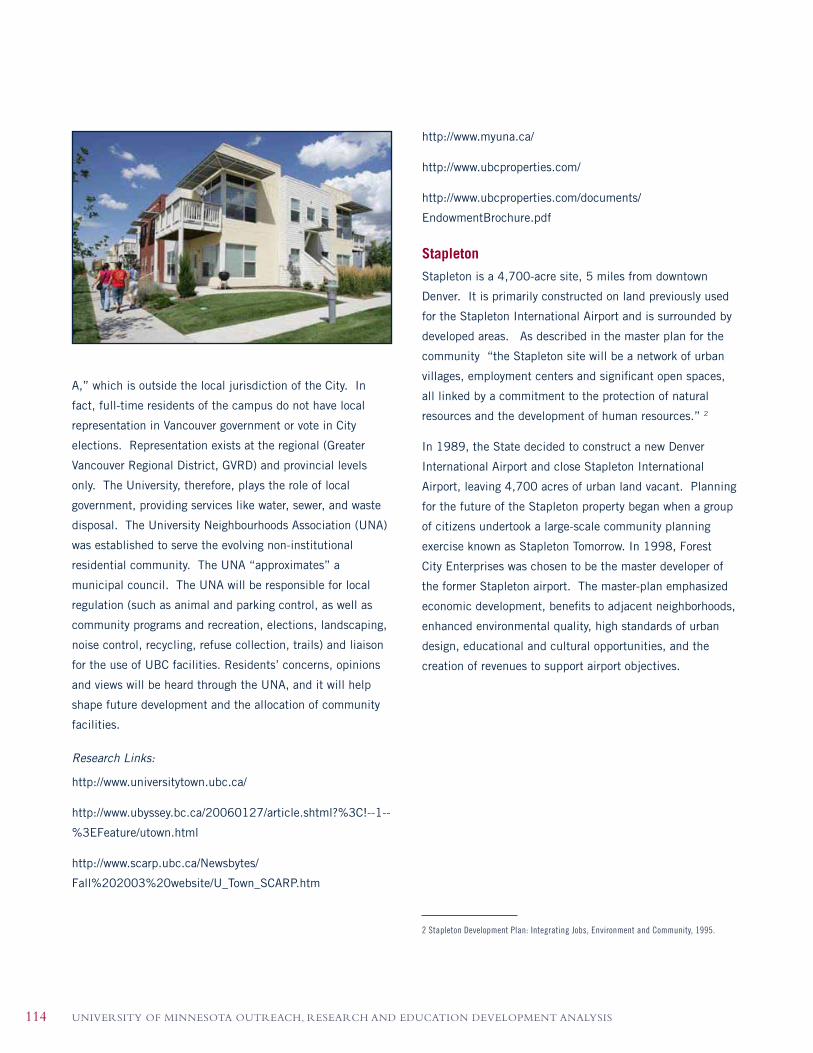
UNIVERSITY OF MINNESOTA OUTREACH, RESEARCH AND EDUCATION DEVELOPMENT ANALYSIS114
A,” which is outside the local jurisdiction of the City. In
fact, full-time residents of the campus do not have local
representation in Vancouver government or vote in City
elections. Representation exists at the regional (Greater
Vancouver Regional District, GVRD) and provincial levels
only. The University, therefore, plays the role of local
government, providing services like water, sewer, and waste
disposal. The University Neighbourhoods Association (UNA)
was established to serve the evolving non-institutional
residential community. The UNA “approximates” a
municipal council. The UNA will be responsible for local
regulation (such as animal and parking control, as well as
community programs and recreation, elections, landscaping,
noise control, recycling, refuse collection, trails) and liaison
for the use of UBC facilities. Residents’ concerns, opinions
and views will be heard through the UNA, and it will help
shape future development and the allocation of community
facilities.
Research Links:
http://www.universitytown.ubc.ca/
http://www.ubyssey.bc.ca/20060127/article.shtml?%3C!--1--
%3EFeature/utown.html
http://www.scarp.ubc.ca/Newsbytes/
Fall%202003%20website/U_Town_SCARP.htm
http://www.myuna.ca/
http://www.ubcproperties.com/
http://www.ubcproperties.com/documents/
EndowmentBrochure.pdf
StapletonStapleton is a 4,700-acre site, 5 miles from downtown
Denver. It is primarily constructed on land previously used
for the Stapleton International Airport and is surrounded by
developed areas. As described in the master plan for the
community “the Stapleton site will be a network of urban
villages, employment centers and significant open spaces,
all linked by a commitment to the protection of natural
resources and the development of human resources.” 2
In 1989, the State decided to construct a new Denver
International Airport and close Stapleton International
Airport, leaving 4,700 acres of urban land vacant. Planning
for the future of the Stapleton property began when a group
of citizens undertook a large-scale community planning
exercise known as Stapleton Tomorrow. In 1998, Forest
City Enterprises was chosen to be the master developer of
the former Stapleton airport. The master-plan emphasized
economic development, benefits to adjacent neighborhoods,
enhanced environmental quality, high standards of urban
design, educational and cultural opportunities, and the
creation of revenues to support airport objectives.
2 Stapleton Development Plan: Integrating Jobs, Environment and Community, 1995.

CHAPTER 3 UMORE PARK MARKET ANALYSIS AND DEVELOPMENT STRATEGY 115
In April 2001, Forest City Stapleton acquired the first parcel
of land and began the first phase of the 25-year, $5 billion
development envisioned by the Denver community more than
12 years before. When complete, Stapleton is expected to
house 30,000 residents and host 35,000 workers. 1,116
acres at Stapleton will be devoted to regional parks and open
space.
A september 2006 report entitled “The Stapleton
Redevelopment Area” details the $5.7 billion economic and
fiscal impact of Stapleton to date. This includes $185.5
million on site preparation, $330 million in infrastructure
improvements and employee retail expenditures of $695
million.
The redevelopment of Stapleton has challenged developers
to coordinate and implement a range of development
activities that are nearly unprecedented in their scope, and
one of the largest urban redevelopments in the nation. Forest
City has coordinated the work of ten single family builders
selected to create housing that meets high standards
for urban design and energy efficiency, while also being
affordable to a wide range of incomes, including housing
for “workforce” households that make 80% or less of the
Area Median Income. Regional and neighborhood retail
centers that are pedestrian-friendly and provide a diversity
of opportunities for a variety of retailers, including small,
minority and woman-owned businesses are also being
provided for at Stapleton.
Forest City Enterprises, Inc. is principally engaged in the
ownership, development, acquisition and management of
premier commercial and residential real estate throughout
the United States.
Research Links:
http://www.stapletondenver.com
http://www.forestcity.net/


CHAPTER 4 PROGRAM AND PHYSICAL PLAN OPTIONS 117
PROGRAMAND PHYSICALPLAN OPTIONS
4.1 INTRODUCTION
Members of the UMore Park Steering Committee and many
stakeholders of this strategic planning process believe that
a new community that bears the University of Minnesota
imprimatur is the best future use for UMore Park. As a
general concept, a master planned community is envisioned
to support for UMore Park. Master planned communities
are equated with high quality design and commensurate
financial return.
Through this planning process, the UMore Park Steering
Committee examined a number of appealing program
elements. The urban character of well-loved communities
in the area were studied to identify attributes that might be
included in the design of the new UMore Park community.
The UMore Park Steering Committee explored ways that
the University could perpetuate its legacy as a land grant
institution and its prominence in the region by making
this a community that represents the land grant mission
of research, education and engagement for the next
generation, specifically through the themes of education,
health and energy.
During the planning process, the Sasaki Team proposed
potential program elements for UMore Park to support
the vision of the site as a community of remarkable
quality of life and innovation in design at all levels, with
community, landscape and buildings supporting a model
of sustainability. Three questions guided the Sasaki Team’s
proposed program elements:
• What are non-conventional program elements that can
distinguish UMore Park?
• How can UMore Park exceed baseline market values and
induce demand through innovative planning and design?
• What is the right balance of land uses to meet the
University’s mission and satisfy community expectations?
These questions elicited responses that helped the Sasaki
Team to understand the desires for the site at a more
detailed level. It also prompted the UMore Park Steering
Committee to establish subcommittees to advance
consideration of the role of education, health and energy at
UMore Park.
This phase of the development of the UMore Park strategic
plan set the stage for the Sasaki Team to begin its design
process. The Sasaki Team’s planning process was created
to realize six objectives that are evident in sustainable
communities:
CHAPTER FOUR

UNIVERSITY OF MINNESOTA OUTREACH, RESEARCH AND EDUCATION DEVELOPMENT ANALYSIS118
1. Celebrate Community – Create a design that speaks
to the context of Minnesota, borrowing from the most
celebrated town planning, urban design elements and
architectural style and from the universal elements of
our best cities. Introduce elements of our best cities.
Introduce elements of a vibrant community, such
as connected neighborhoods, mixed uses, housing,
municipal and civic services, shopping and employment,
culture, and a range of open spaces. Provide a variety
of housing types to accommodate the needs and
interests of all the community’s household types, from
families to the elderly. Illustrate the planner/designer’s
understanding of public policies and plans that influence
UMore Park’s development. Tailor the physical design
to the needs and interests of the anticipated resident
community at UMore Park.
2. Design for the Pedestrian – Design a pedestrian-
oriented environment. Create a walkable community
with appealing streets and destination points within
reasonable distance of residential settings. This will
reduce transportation-related energy consumption and
promote public health. Create streets in a grid pattern
with attractive streetscapes. Create a downtown of
dramatic vistas and active parks. Design a trail system
within the community to link developed areas with
rural and undeveloped areas, and, ultimately, to the
Vermillion River and the anticipated system of trails to
be developed on the southern part of UMore Park.
3. Enhance the Natural Environment – Design will enhance
the site’s ecology. Concentrate development and preserve
large parcels of open space to conserve ecological
communities. Create corridors so that animals can
traverse developed areas and continue to benefit from
the region’s many, significantly-sized undeveloped areas.
Adequately protect sensitive ecosystems and threatened
and endangered plants and animals. Address site
contamination to correct any associated environmental
problem and allow for development throughout the site.
4. Provide Transportation Options – Pursue the opportunity
for a rail connection to UMore Park from Minneapolis/St.
Paul and anticipate access point(s) within the UMore
Park site plan. Plan for bus service to and throughout
UMore Park.
5. Enhance Water Resources – Build on the strength and
logic of predecessor plans. A watershed protection
approach at UMore Park identifies means of conserving
water resources, reusing water, managing stormwater,
and innovative treatment of wastewater, all with the
objective of maximizing water quantity and quality in
the sub-basin. Use parks and open space to support
innovative stormwater management strategies.
6. Achieve Energy Efficiency – Develop alternative energy
and climate-responsive energy efficient design in
combination with compact development, reducing
automobile reliance and greenhouse gas emissions.
Design energy efficient structures.

CHAPTER 4 PROGRAM AND PHYSICAL PLAN OPTIONS 119
4.2 COMMUNITY DESIGN PRECEDENTS
The vision for UMore Park is of a sustainable community—
one that works to provide for the social, economic, and
environmental well-being of its host population. It is
imagined to be a model for other land grant institutions,
an example of how a University’s imprimatur can attract
uses and investments much more significant than would
otherwise occur. While part of the wonder of the community
will be these uses and the attention they may attract for
residents, visitors and University researchers, the actual city
form and architectural dimensions will borrow from the best
loved of Minnesota’s cities and towns.
These communities have attributes that urban designers
and developers study as their models for master planned
communities. The centers of these communities are
dominated by architecture — both commercial and
residential — that is varied, interesting and appropriate
to the region in its design vernacular and materials.
Historic structures, parks and other forms of landmarks are
prominent and well-maintained. The centers are populated
by pedestrian traffic and not overwhelmed by automobile
circulation. People who use these streets represent a range
of ages and types of people from the greater community.
Crossing the street is safe, both from the perspective of
rate of travel for automobiles and trucks, and because of
clearly marked and handicap accessible crossings. Natural
assets of the town are evident — streets and views are open
to river crossings, distant mountains or dramatic views
to farmland; topography has been honored rather than
manipulated through the community’s development. Outside
of the town center, residential neighborhoods offer an
inviting experience to pedestrians through scale, provision
of sidewalks and shade trees and a street and signage
system that provides easy direction to destinations (such as
a library, schools or recreation fields) that are in or abut the
neighborhood.
A specific concern for water management has the twin
objectives of managing water consumption to avoid waste
and returning as much water as is practical to the water
basin. Low Impact Development (LID) is the term that
characterizes the family of design strategies that work to
enhance the ability of a site to manage rainfall with the
objective of matching the pre-development condition.
These are innovative techniques that will provide research
opportunities for University faculty and programs.
The Sasaki Team recommends the following LID techniques
for UMore Park. Their placement and mix will be tested
during development of site design. At that time, modeling
of the site can provide the University with data to measure
their location-specific effectiveness.
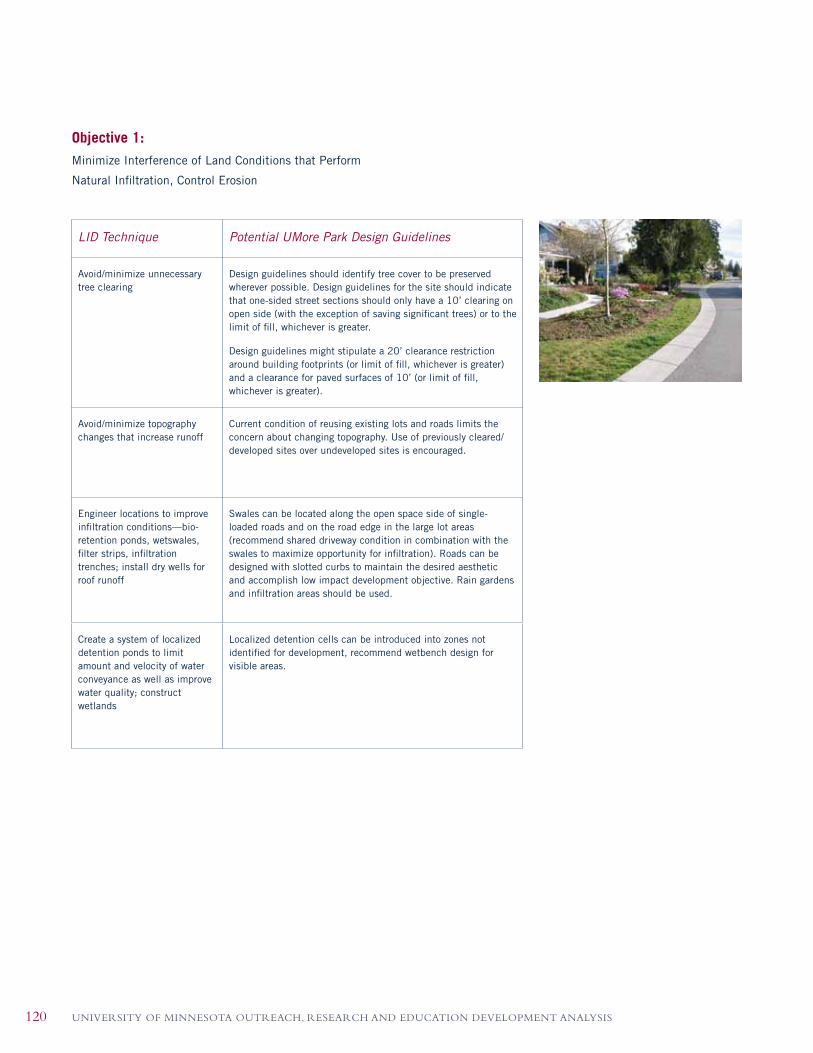
UNIVERSITY OF MINNESOTA OUTREACH, RESEARCH AND EDUCATION DEVELOPMENT ANALYSIS120
LID Technique Potential UMore Park Design Guidelines
Avoid/minimize unnecessary tree clearing
Design guidelines should identify tree cover to be preserved wherever possible. Design guidelines for the site should indicate that one-sided street sections should only have a 10’ clearing on open side (with the exception of saving significant trees) or to the limit of fill, whichever is greater.
Design guidelines might stipulate a 20’ clearance restriction around building footprints (or limit of fill, whichever is greater) and a clearance for paved surfaces of 10’ (or limit of fill, whichever is greater).
Avoid/minimize topography changes that increase runoff
Current condition of reusing existing lots and roads limits the concern about changing topography. Use of previously cleared/developed sites over undeveloped sites is encouraged.
Engineer locations to improve infiltration conditions—bio-retention ponds, wetswales, filter strips, infiltration trenches; install dry wells for roof runoff
Swales can be located along the open space side of single-loaded roads and on the road edge in the large lot areas (recommend shared driveway condition in combination with the swales to maximize opportunity for infiltration). Roads can be designed with slotted curbs to maintain the desired aesthetic and accomplish low impact development objective. Rain gardens and infiltration areas should be used.
Create a system of localized detention ponds to limit amount and velocity of water conveyance as well as improve water quality; construct wetlands
Localized detention cells can be introduced into zones not identified for development, recommend wetbench design for visible areas.
Objective 1: Minimize Interference of Land Conditions that Perform
Natural Infiltration, Control Erosion

CHAPTER 4 PROGRAM AND PHYSICAL PLAN OPTIONS 121
LID Technique Potential UMore Park Design Guidelines
Construct parking lots with vegetated swales in medians
Vegetated swales can be installed in any parking lots throughout the site.
Install infiltration or wet swale trenches along road surfaces. Design sidewalk, driveway and parking lot flows to drain away from street gutter and pipe systems into vegetated swales or bioretention areas.
Swales can be located along the open space side of single-loaded roads and on the road edge in large lot areas. Roads can be designed with slotted curbs to maintain the desired aesthetic of a curb and accomplish low impact development objective. Relatively low use roads, particularly in remote locations can be curbless.
Plan shared parking to limit number of parking spaces, decrease impervious surface of lot
Relevant to mixed-use areas.
Use pervious pavement for event and overflow parking areas, driveways and pedestrian paths)
Pervious pavement can be used for event and overflow parking. Pavers (Turfstone and EcoStone) and porous concrete (Ecocreto) can be used in parking lanes, alleys and driveways. Porous concrete or porous asphalt is recommended for sidewalks and can be used on multi-use paths. Footpaths need no paving.
Install best performing catch basins (deep sump, hooded catch basins)
Universally applicable.
Minimize pavement for roads by minimizing the number of traffic lanes and through narrowed traffic lanes
Universal. Road lanes can be as narrow as 10’.
Avoid installing curbs on streets
Install slotted curbs with curb inlets when curbed street are otherwise desired. With this, design grass strips between the road and sidewalk.
Objective 2: Integrate LID into Design of Paved Surfaces (roads, parking
lots, alleys, driveways, pedestrian paths)

UNIVERSITY OF MINNESOTA OUTREACH, RESEARCH AND EDUCATION DEVELOPMENT ANALYSIS122
LID Technique Potential UMore Park Design Guidelines
Minimize use of fertilizers, de-icing salt, and pesticides
Universally applicable.
Install cisterns to reduce stormwater runoff quantity and velocity, and to provide storage for irrigation water.
Most cost efficient in commercial and multi-family dwellings and can be used in garden or small-scale agricultural situations.
Vegetate roofs to limit amount and velocity of water conveyance associated with buildings
Universally applicable
Establish buffers around water bodies to protect and maintain water quality from effluent, agricultural runoff, pesticides, and other pollutants.
Establish 50-100’ buffers where pollutant loading may affect water quality, particularly between streams and intensive agricultural uses.
Objective 3: Prevent Pollution

CHAPTER 4 PROGRAM AND PHYSICAL PLAN OPTIONS 123
LID Technique Potential UMore Park Design Guidelines
Regularly sweep streets and parking lots
Universally applicable
Regularly clean out stormwater detentions structures
Universally applicable
Add soil amendments This is relevant for paved surfaces or reclaimed areas being converted to open space and in any non-grass infiltration areas.
Regularly replace catch basin filters for street and parking lot runoffs
Universally applicable
Objective 4: Improve Maintenance Practices

UNIVERSITY OF MINNESOTA OUTREACH, RESEARCH AND EDUCATION DEVELOPMENT ANALYSIS124
Ethiopia, whom they met during their travels and provide
the Ethiopian farmers with necessities such as powdered
milk. The ranch provides a variety of educational hands-on
programs for local school children.
Vacanza Italia (various locations in Italy) is an organization
that works with a network of farmers to provide farming
holidays throughout Italy. The network of farms offers
accommodations that range from small apartments on
farm grounds to luxury villas on rural estates. Some farms
offer cooking and painting classes. All farms are historic
buildings, many family-owned, and they highlight the local
flavors and cultural practices of their specific areas.1
Biomass EnergyRenewable energy sources in the United States account for
approximately 9% of total electricity generated.2 Biomass
power is the second largest source of renewable energy after
hydroelectric power, and makes up approximately 19% of
total renewable energy. Biomass is a substance that can
be used to produce fuel and consists of wood, grasses, and
agricultural residue, as well as animal excreta, municipal
solid waste, and food processing residue. Studies indicate
that Minnesota has excellent biomass resource potential.
The agricultural and forestry sectors of Minnesota make
available significant quantities of residual biomass.
Biodiesel is a clean-burning alternative fuel produced from
domestic, renewable resources. In Minnesota, it is made
primarily from soybeans, but it can also be made from other
materials such as vegetable oils, animal fats and spent
cooking oil.3 Biofuels can be blended with gasoline or
1 Research Links http://www.sfc.ucdavis.edu/agritourism/agritour.html
http://www.nrcs.usda.gov/Technical/RESS/altenterprise/Alternatvbroch.pdfhttp://www.nrcs.usda.gov/Technical/RESS/altenterprise/success.htmlhttp://www.agritourismworld.com/http://www.agriturismoitaly.it/panel/qualita_eng.phphttp://www.wwoof.org/howworks.asphttp://www.slowfood.com/eng/sf_ita_mondo/sf_ita_mondo.lassohttp://www.cfap.org/afs_temp3.cfm?topicID=372http://www.vacanzaitalia.com/montalcino.htm
2 National Renewable Energy Laboratory, Minnesota Biomass – Hydrogen and Electricity Generation Potential. Golden, Colorado, February 2005.
3 The most common method of producing biodiesel is to react animal fat or vegetable oil with methanol in the presence of sodium hydroxide (a base, known as lye or caustic soda). This reaction is a base-catalyzed transesterification that produces methyl esters and glycerine. If ethanol is substituted for methanol, ethyl esters and glycerine are produced. Methanol is preferred, because it is less expensive than ethanol.
4.3 POTENTIAL PROGRAMELEMENTS
The Sasaki Team explored several program elements,
including arts and culture, recreation and open space,
non-University education, agriculture, alternative energy
production, and other University uses. Because Minneapolis-
St. Paul has a strong arts and culture economy, effectively
serving as the arts and culture center of the northern
Midwest, an in-depth study was undertaken to articulate
options and test the viability of establishing a cultural
destination center at UMore Park.
AgritourismAgritourism is a type of tourism that allows visitors to live
temporarily on a farm’s premises, enjoy the natural beauty
of the farm, and participate in farm-work. In Italy, where
Agritourism originated, called Agroturismo, the industry is
highly organized and known world-wide. Agritourism provide
authentic cultural experiences, highlighting the scenery,
culture, and natural flavors that can not be duplicated in
resorts and hotels.
Precedents
Melstead Place (Mountain, ND) is an agritourism bed and
breakfast in Mountain, North Dakota, that markets its rural,
peaceful location to lure urbanites and suburbanites, along
with locals who visit the farm regularly. The owners originally
saw the rural, “middle of nowhere” location as a pitfall, but
have found that this is what visitors love most about it. The
bed and breakfast has allowed the owners to maintain the
agricultural roots of their land by providing a steady income
and stream of visitors to patronize and support their farm.
Melstead Place specializes in holiday events, which always
draw a large local crowd.
Double T A-Cres Ranch (Stevinson, CA) was one of the
first organic dairy farms in California’s Central Valley. It
is a family-owned farm with a museum. They specialize
in hosting weddings. The farm owners also have social
missions. It has a relationship with a group of farmers in

CHAPTER 4 PROGRAM AND PHYSICAL PLAN OPTIONS 125
directly substituted for diesel. Use of biofuels reduces toxic
air emissions, greenhouse gas buildup, and dependence
on imported oil, while supporting agricultural and rural
economies. Unlike gasoline and diesel, biofuels contain
oxygen. Adding biofuels to petroleum products allows the
fuel to combust more completely and this reduces air
pollution.
As of 2002 Minnesota legislation, Minnesota requires nearly
all diesel fuel sold in the state to contain at least a 2%
biodiesel blend. Since 2005, with three new production
facilities, Minnesota is the largest producer of biodiesel in
the U.S. The production capacities of the three Minnesota
plants are as follows:
• FUMPA (Farmers Union Marketing and Processing
Association) in Redwood Falls - 3 million gallons;
• Soy Mor in Albert Lea - 30 million gallons; and
• Minnesota Soybean Processors in Brewster - 30 million
gallons.
In an effort to accelerate development of the statewide
biodiesel industry in 2003, the Governor formed a Biodiesel
Task Force to increase the production and use of biodiesel
in Minnesota.
The National Renewable Energy Laboratory estimates
values for the biomass inventory in the State of Minnesota.
Additionally, based on these supplies, NREL also estimates
the electricity potential from this and the percentage of
electricity that could be met using biomass power.4
Source of Biomass in Minnesota
Average of all biomass resource data, tons/year
Forest Residue 874,900
Mill Residue 903,549
Agricultural Residue 24,895,287
Energy Crops 5,783,002
Urban Wood Waste 1,532,529
4 National Renewable Energy Laboratory, Minnesota Biomass – Hydrogen and Electricity Generation Potential. Golden, Colorado, February 2005.
• NREL estimates that 1 ton/year of biomass resource base
has an electricity potential of 1 MWh/year when used in
direct-fired biomass power plants.
• Test plots of switchgrass at Auburn University have
produced up to 15 tons of dry biomass per acre, and
five-year yields average 11.5 tons—enough to make
1,150 gallons of ethanol per acre each year.5
Power Potential from the Use of Direct-Fired Biomass Power Plants in MN
ElectricityPotential(MWh/year)
% of MN electricity that could be met with biomass power
Forest Residue 1,233,609 2%
Mill Residue 1,274,005 2%
Agricultural Residue 35,102,355 58%
Energy Crops 8,154,033 14%
Urban Wood Waste 2,160,866 4%
TOTAL 47,924,867 80%
The University of Minnesota’s Center for Biorefining, affili-
ated with the University of Minnesota Initiative for Renew-
able Energy and the Environment, coordinates University
efforts and resources to conduct exploratory fundamental
and applied research. It provides education on bioenergy,
biochemicals and biomaterials. It stimulates collaboration
among University researchers, other public sector inves-
tigators, and private investigators involved in bio-based
production technology development. It initiates technology
transfer to industries, fostering economic development in
rural areas.6
5 Oak Ridge National Laboratory, Bioenergy Feedstock Information Network, Biofuels from Switchgrass: Greener Energy Pastures, http://bioenergy.ornl.gov/papers/misc/switgrs.html
6 http://biorefining.coafes.umn.edu/home.php
UNIVERSITY OF MINNESOTA OUTREACH, RESEARCH AND EDUCATION DEVELOPMENT ANALYSIS126
Breadbasket for the Twin CitiesThis concept considers UMore Park the breadbasket
(geographic region serving as a principal source of food supply)
for the Twin Cities campuses, providing fresh fruit, produce,
grains and perhaps meats to University Dining Services and
the greater campus community. It might work similarly to
a community-supported agriculture program wherein the
University would purchase shares in local farms in exchange
for produce. “Local food” is any food that is grown by farmers
who live in the same area as the people who buy the food.
Local food sales include all forms of direct marketing. Local
food also includes the sale of food by a farmer or a group of
farmers to a restaurant, grocery store, caterer, etc., who will
then sell the food to customers.
Buying locally grown food is an investment in the economic,
social, and environmental wellbeing of your community.
Specifically, buying local foods:
• Reduces the number of miles, refrigerating, processing,
and packaging that is typical of most American meals;
• Supports local farmers and communities;
• Helps to sustain the environment;
• Promotes tourism within the area;
• Promotes healthy food choices;
• Maximizes freshness and taste; and
• Retains food dollars in the community.
In support of local agriculture, the University’s Dining Services
(UDS) has developed an ongoing partnership with Food
Alliance Midwest, an organization that provides certification
of products grown using environmentally friendly and socially
responsible agricultural practices in the Midwest. UDS uses
Minnesota grown produce, including apples, strawberries,
eggplant, green peppers, cabbage, radishes, cucumbers,
green beans, potatoes, and sweet corn when in season.
UDS purchased five tons of produce locally from May
through October 2005. The residential restaurants featured
Pepin Heights Honey Crisp apples during October. Honey
Crisp apples were invented at the University of Minnesota.
Sustainable agriculture items are used in recipes at all UDS
residential restaurants, catering, and retail locations.7
Cluster DevelopmentCluster development is a type of development that places
all housing in a concentrated space, leaving as much
public open space available as possible. The purpose of
cluster development is to preserve an area’s natural beauty
and allow all inhabitants access to open spaces. This, in
turn, can create more desirable living communities and
higher property values, while preserving natural spaces for
everyone’s enjoyment. In many cases, further development
is prohibited on the protected open space.
Precedents
SouthWood (Tallahassee, FL) has combined the principles
of traditional American town-building with respect for the
natural environment. SouthWood’s community framework
focuses on the town center at the 123-acre Central Park.
The land uses are spatially arranged to draw together the
activities of a traditional “Main Street” and its mix of
uses, with workplace and school in an urban pedestrian
environment linked by 12 miles of walking trails. An existing
state office park adjoining the site is being expanded and
integrated into the town center.
A distinctive architectural vernacular has been developed
for SouthWood based on small-town historic precedents;
while townhouses border the streets close to Central Park,
homes with broad verandas stretch along tree-lined roads
and overlook SouthWood’s golf course. The soft forms of
7 Research LinksCommunity Farm Alliance. L.I.F.E.: Locally integrated food economies. www.community-farmalliance.org/life.htmForbord, Mary Jo. The Eye of the Storm. Sustainable Farming Association of Minnesota. www.sfa-mn.org/pages/cpost/ cp-0141.html#1.Pirog, Rich et al. Food, Fuel, and Freeways: An Iowa perspective on how far food travels, fuel usage, and greenhouse gas emissions. Leopold Center for Sustainable Agriculture, June, 2001. http://www.misa.umn.edu/forum/ foodmiles.pdf.Minnesota Institute for Sustainable Agriculture. University of Minnesota. http://www.misa.umn.edu/Local_Food_Consumer.htmlSalatin, Joel. Holy Cows and Hog Heaven: The Food Buyer’s Guide to Farm Friendly Food. 2004. Polyface, Inc.University Dining Services. University of Minnesota. http://www1.umn.edu/dining/aware-ness.html

CHAPTER 4 PROGRAM AND PHYSICAL PLAN OPTIONS 127
the site’s natural systems, with its Live Oaks, meadows and
necklace of ponds and lakes, frame the built environment,
heightening the contrast between natural and manmade
features.
Jackson Meadow (St. Croix, MN) is a neighborhood built to
foster social interaction. There is plenty of public open
space, and most of the inhabitants’ basic, everyday needs
are within walking distance. Everyone’s front yard converges
with walking paths, and garages are not attached to the
homes. The biking and hiking trails connect Jackson
Meadow with neighboring towns in order to foster interaction
with the larger community.8
Co-HousingCo-housing is housing in which residents actively participate
in the design and operation of their own neighborhoods
and are committed to living together as a community.
The physical design encourages both social contact and
individual space. Private homes contain all the features
of conventional homes, but residents also have access
to common facilities such as open space, courtyards, a
playground and a common house. Co-housing communities
are usually designed as attached or single-family homes
along one or more pedestrian streets or clustered around a
courtyard. The majority of these communities house twenty
to forty households.
8 Research Linkshttp://www.kingwood.com/about.phphttp://www.jacksonmeadow.com/https://entp.hud.gov/idapp/html/subdivlook.cfmwww.ci.oak-ridge.tn.us/ComDev-html/PUD.htmwww.joe.com/web/www.joe.com/web/TownsAndHomes/SouthWood/ News/04.01.03ArvidasNewestGolfCourse.htmwww.golfcoursehome.net/doc/ communities/Community-Southwood.htmwww.myflorida.com/fdi/fscc/news/local/9902/rt-sw1.htmwww.sustainabledesignguide.umn.edu/MSDG/case/jm/jm.htmlmocoloco.com/archives/000200.phpnews.minnesota.publicradio.org/ features/2003/01/13_helmsm_jacksonmeadow/www.woodmags.com/wdb/magazine_rack/ 2004_fall_29/jackson/index.php3www.mnproject.org/pdf/ccschapters/jackmead.pdfwww.kingwoodonline.com/
Precedents
Cambridge, Massachusetts Co-housing
• Urban residential community located on a 1.5-acre site,
a ten-minute walk from vibrant Porter Square
• The site is close to schools, parks, shopping and public
transportation
• The co-housing is organized as a condominium
association
Muir Commons Davis, CA
• Davis is located in Northern California 15 miles west
of Sacramento and seventy-five miles northeast of
San Francisco. Muir Commons is part of the Aspen
development in West Davis
• Neighborhood features include a greenbelt, parks, a
wildlife pond, and an elementary school
• Muir Commons is made up of twenty-six homes on just
under three acres and is home to approximately forty-five
adults and twenty-eight children
• Muir Commons is legally structured similar to a
condominium
Robert’s Creek, British Columbia
• Located in the heart of ‘downtown’ Roberts Creek, on the
Sunshine Coast of British Columbia
• A semi-rural community of thirty-one detached (single-
family) and attached (duplex) homes on twenty acres of
land, a short walk to the Pacific Ocean, and steps away
from the thriving village center of Roberts Creek.
Heartwood, Durango, CO
• Located near Durango in southwest Colorado, close
to the state’s largest wilderness area and the red rock
canyons of the Colorado Plateau.
• Nestled gently in 250 acres of meadow, pine forest and
pastureland9
9 Research Linkshttp://www.cohousing.org/default.aspx http://www.cohousing.ca/http://www.cohousingco.com/http://www.cambridgecohousing.org/http://www.muircommons.org/http://www.robertscreekcohousing.ca/http://www.heartwoodcohousing.com/LANDPHOTOS.html

UNIVERSITY OF MINNESOTA OUTREACH, RESEARCH AND EDUCATION DEVELOPMENT ANALYSIS128
Cold Climate ArchitectureCold climate architecture emphasizes topography, climate,
light, and tectonic form. Research has demonstrated that very
high levels of energy and resource efficiency can be achieved
with design and building principles that are available to all
and adaptable to other climates, sites, and uses.
Precedents
Rocky Mountain Institute (Snowmass, CO) was completed
in 1984 and is a showcase of efficiency techniques which
increase comfort and enjoyment while saving money and
resources. The 4,000-square-foot building is super-insulated
and semi-underground for microclimatic reasons. The
windows have special glazing designed to maximize solar
heating in cold climates. The building construction cost was
still below the local median for custom buildings.10
Community Supported Agriculture (CSA)A CSA is an agreement between a farmer and consumers in
which the consumer pays an annual fee for a share of the
harvest during the growing season. This provides consistent
revenue for farmers, helping many small family farms stay
in business. CSAs support the consumer in giving them
fresh, healthy, local produce at prices that are often much
lower than those at the grocery store. “CSAs support a
sustainable agriculture system which . . .
• provides farmers with direct outlets for farm products
and ensures fair compensation
• encourages proper land stewardship by supporting
farmers in transition toward low or no chemical inputs
• strengthens local economies by keeping food dollars in
local communities
• directly links producers with consumers allowing people
to have a personal connection with their food and the
land on which it was produced
• makes nutritious, affordable, wholesome foods
accessible and widely available to community
members.”11
10 Research Linkshttp://www.rmi.org/sitepages/pid379.php
11 http://www.csacenter.org/movement.html
The Land Stewardship Project (Minnesota) provides a
CSA Farm Directory to Minnesota consumers, promotes
connections between urban consumers and rural producers,
and supports local and sustainable farming through a variety
of programs.
Continuing Care Retirement CommunitiesContinuing Care Retirement Communities (CCRCs) are
facilities that have flexible living accommodations ranging
from independent apartment living to nursing and hospice
care. CCRCs allow the aging to stay in one community for
the remainder of their lives, no matter what their health
and living needs become. Typically, CCRC residents enter a
facility while they are healthy and active in order to have a
more stable living environment as they age and anticipate
needing more medical and living assistance.
CCRCs Without Walls are organizations that follow the
same philosophy of CCRC facilities, but provide in-home
service. Care receivers often pay a one-time fee as large as
$40,000, depending on a person’s age and care required, in
combination with a monthly fee.
Precedents
Presbyterian Senior Care’s Longwood at Home (Pittsburgh
Area) offers “without walls” care in one’s own home,
in addition to traditional CCRC care on their Longwood
at Oakmont campus outside of Pittsburgh. The care at
Longwood at Oakmont is marketed towards wealthier
clientele, with a campus situated on a country club. The
at-home care is more affordable than the care at Longwood
at Oakmont, opening up the possibility of CCRC care for the
middle class.
Friends Life Care at Home (Philadelphia area) provides at-home
care throughout Philadelphia and its suburbs. The services
provided include home healthcare, homemaking assistance,
skilled nursing, meal delivery, an emergency response system,
adult daycare, and referral to home maintenance service
vendors.12
12 Research LinksCCRCshttp://www.riocog.org/AAA/TCOA2006/sessions.htmhttp://www.heronpoint.com/griffin.htmlhttp://www.climatemaster.com/download/Commercial%20Case%20Studies/LC305.pdfhttp://www.kendal.org/documents/meetgroundCurrent.pdfhttp://www.helpguide.org/elder/continuing_care_retirement_communities.htm#ccrc

CHAPTER 4 PROGRAM AND PHYSICAL PLAN OPTIONS 129
Equestrian FacilitiesEquestrian facilities are very popular year-round enterprises
that attract a wide range of ages. The physical design of
an equestrian facility can range from simple indoor and
outdoor paddocks with stables to large show facilities. Many
equestrian facilities also include their own trails for trail-
rides, either on the premises or nearby.
Precedents
Alfred University Equestrian Center
• 50 horses, an indoor arena, classrooms, event viewing
areas, outdoor riding rings, fenced pastures and trails.
• The University recently built the new equestrian center
much closer to campus than an older center had been.
Bronx Equestrian Center, NY
• Offers boarding, sales, lessons, and special events.
• The location is close to the city and available to
urban riders.
Giant Steps Equestrian Center
• Located just North of San Francisco.
• Giant Steps is a center that uses riding and caring for
horses as therapy for people with a range of physical
disabilities.13
Flexible Interdisciplinary Research SpaceThe “hotelling” concept is one where office workers are not
permanently assigned to desks, which reduces the needed
square footage the company purchases because not every
employee will be under the same roof at the same time. The
12 cont. CCRCs without Wallshttp://www.findarticles.com/p/articles/mi_m3830/is_n2_v47/ai_20465581#continuehttp://www.srcare.org/pages/livingcare/pdfs/CollateralInsertsClean.pdfhttp://www.aging.org/files/public/Aging_in_Place_Issue_Brief.pdfhttp://aging.state.ny.us/explore/housing/housalt2.htm
13 Research Linkshttp://www.northequest.com/http://www.essexequestrian.com/http://www.glenwoodequestriancenter.com/news012803.htmlhttp://www.primebldg.com/Prime_equestrian.htmhttp://www.iowaequestrian.com/testimonials.htmlhttp://www.dreampowertherapy.org/http://www.giantstepsriding.org/http://www.thejudgeschoice.com/schools_camps.htmhttp://uplandfarm.com/harbor.htmhttp://www.bronxequestriancenter.com/http://www.bizjournals.com/buffalo/stories/2004/05/10/daily33.htmlhttp://www.alfred.edu/athletics/facilities.html#equestrian
flexible interdisciplinary research space concept relies on
shared facilities and common gathering places for academic
and corporate users, thereby encouraging collaboration,
networking, and professional and academic development.
Precedents
The Collaborative Innovation Center (Carnegie Mellon
University) is a 120,000 square foot, state-of-the-art dry-lab
research facility to be built on the Carnegie Mellon campus.
The Collaborative Innovation Center is an opportunity to
create better, smarter and stronger relationships between
university researchers and leading corporations, and to
produce the kinds of dramatic breakthroughs in science,
engineering and technology that have put Carnegie Mellon
on the map for more than a century. The facilities include a
two-story amphitheater, locker rooms, parking for 220 cars,
an electric recharge station for electric vehicles, and raised-
floor and modular data wiring for flexible “plug-and-play”
office and lab set-up.
The James H. Clark Center (Stanford University) is dedicated
to interdisciplinary research related to bioscience. It
serves as a focal point for the Bio-X program supporting
interdisciplinary research for its 270 Stanford faculty
affiliates and their coworkers. The Clark Center will be the
research home for about 600 people, affiliated with 25
departments. Shared facilities within the building include
an auditorium and seminar rooms, a teaching laboratory, a
Biofilm Center, the Stanford Center for Innovation in In-vivo
Imaging, low vibration laser labs, special projects space,
and two super computers. Clark is also home to the new
Department of Bioengineering, a joint effort by the Schools
of Medicine and Engineering. Two restaurants, Peets
Coffee & Tea (open 8-6 weekdays) and LinX, a full-service
restaurant (open 10-5 weekdays) provide gathering places.
“Hotel Space”: Within the Clark Center are 65 bright yellow
three-foot benches that are available to researchers for
temporary occupancy. The benches provide an opportunity
for researchers to work in close proximity during the early
stages of projects. Hotel space is designed to encourage
cross-disciplinary collaboration.

UNIVERSITY OF MINNESOTA OUTREACH, RESEARCH AND EDUCATION DEVELOPMENT ANALYSIS130
Discovery Park (Purdue University) supports multi-
principal investigator (PI) multi-departmental research
initiatives. By 2006, Discovery Park will have: 5 new
interdisciplinary research buildings, 3000 students
involved in entrepreneurial activities, 500 faculty
involved in interdisciplinary research, $25 million/year in
sponsored research funding, $10 million/year in recurring
infrastructure support, 8 new start-up companies created,
20 new ventures supported within existing companies, and
20 corporate partners.14
Large-Scale Sustainable communitiesMany new communities address sustainability as an
environmental, economic, and social concern — and
marketing tool — and strive for a diverse population for
which to provide services and amenities that will last for
generations.
Each project recognizes that transportation, employment
and educational infrastructure is necessary to support a
growing population. In addition, each community is near an
urban center and is making it a priority to connect to that
urban center through public transportation and walking and
biking paths. The projects aim to preserve the history of
their sites.
Some, such as Viikki in Helsinki, are closely related to a
university, while others are tied more closely to the social
and geographical history of a place, such as Callaway
Gardens outside Atlanta. Communities such as these, when
associated with a university, can put the university at the
forefront of sustainable development and attract significant
investment.
Precedents
Viikki; Helsinki, Finland
• Seven to ten kilometers from Helsinki city center.
• Currently, 5,000 housing units, 7,000 inhabitants.
• 2015 Projection: 15,000 Inhabitants, 6,000 students,
7,000-8,000 jobs.
14 Research Linkshttp://www.cmu.edu/co-lab/http://biox.stanford.edu/clark/index.htmlhttp://biox.stanford.edu/clark/images/Hotel_policies.pdfhttp://web.e-enterprise.purdue.edu/wps/portal/!ut/http://www.purdue.edu/DiscoveryPark/pdf/dp.pdf
• Mix of rented and owned housing.
• Buses and train line connect Viikki to Helsinki.
• In 1946, land was converted from prison services to a
research farm for the University of Helsinki.
• Major transformation to present its state began in 1993
with the initiation of the Vikki Science Park.
• Houses the University of Helsinki’s Campus of
agriculture, forestry, biosciences, pharmacy, veterinarian
medicine.
• Multiple public primary and secondary schools.
• Viikki Science Park: At center of Viikki, place for
advanced biotechnology research and entrepreneurship,
plus a Neuroscience Center and the Vikki Science
Library.
• Local Commercial Center currently being built.
• Ecological criteria for new building monitors pollution,
use of natural resources, diverse nature and food
production, passive and active solar energy, and general
health of living environments.
• Benchmark sustainability data:
– 20% reduction in carbon dioxide emissions*
– 20% reduction in consumption of pure water*
– 10% reduction in building site waste during
construction*
– 20% less mixed refuse*
– 40% less conventional heating energy**COMPARED TO CONVENTIONAL BUILDING AND CONSUMPTION
Dongtan Eco-City; Shanghai, China
• Situated very close to Shanghai on China’s third-largest
island.
• Expected population of 50,000.
• 630 Hectares = 1,557 Acres (3/4 size of Manhattan).
• Aims to be “World’s First Sustainable City.”
• Will attract commercial and leisure investment.
• Aimed to be open for Shanghai’s International Expo in
2010.
• One-hour ferry ride from downtown Shanghai.
• Sustainability Initiatives:
– Capture and purify water
– Reduce environmentally degrading landfills
– Combined heat and power systems using
renewable energy

CHAPTER 4 PROGRAM AND PHYSICAL PLAN OPTIONS 131
• Zero-emission transit
• Human sewage processed for compost and irrigation
• Make all public transportation within a 7 minute walk of
all parts of the city.
Thames Gateway; London, England
• Land stretching forty miles east of East London, on both
sides of Thames River and Estuary.
• Anticipated 30,000-40,000 new homes and 50,000
new jobs.
• Area is currently mostly brownfields, designated a
national priority for urban regeneration.
• Area is polluted and segregated by waterways, roadways
and railways.
• Extensive infrastructure projects in the works for
transportation and social services to support the increase
in people and jobs and integrate with surrounding
communities.
• Aims for 50% affordable housing.
• First phase of planning for 2012 Olympic and
Paralympic Games.
• Envisioned as a “Water City” with canals, waterways and
green spaces.
• Thames Estuary is a significant travel route to mainland
Europe and has been historically valuable to Britain.
• Plan intends to establish 9 distinct areas with
commercial, industrial, residential, and other uses.
• Area currently has 1.6 million people, some of the most
underserved in the country.
• Sensitive wetlands exist on the site and may be in
danger with increased visitors and building intervention.
• Concern in being expressed for the risk of flooding and
the need for flood management.
• Residents are becoming worried of being priced out of
their homes and house prices inflating over time.
• Sustainability Initiatives:
– Maintaining high, stable levels of economic growth
– Social progression meeting the needs of a diverse
population
– Natural resource conservation
– Minimizing need for automobile travel
– Using land efficiently
– Enhance value and accessibility of marshlands
– Increase green open space linking urban and
rural areas
– Create a website to expose public to
sustainability initiatives
– Minimize water usage
Callaway Gardens; Atlanta, GA
• 20,000 Acres
• Resort community (golf course, tennis courts, inn) with
nature preserve.
• Preserve has been named an “Important Bird Area”
(IBA) by the Audubon Society.
• 10 miles of bike paths.
• 40-acre garden.
• 60-minute drive from Atlanta.
• Contains enclosed Butterfly Center.
• 7.5-acre vegetable garden.
• Attracts 1 million visitors annually.
• LEED certified conference center.
• Sustainability Initiatives:
– Plans exist for future sustainable community
development
– Support biodiversity on the nature preserve
– Act as a model for others to preserve natural places
– Expose the public to preservation and open
space initiatives
North Charleston Sustainable Community Redevelopment; Charleston, SC
• Redevelopment of 3,000 acres.
• Includes 350 acres the City of North Charleston
acquired from Charleston Naval Complex Redevelopment
Authority.
• 200-acre park surrounding Noisette Creek.
• Up to 10,000 new and rehabilitated housing units
projected.
• 6-8 million sq. ft. of commercial space.
• Revitalization intended for North Charleston’s Old
Village.
• Improvements to area public schools.
• Museums, recreation, tourist destinations to be built.

UNIVERSITY OF MINNESOTA OUTREACH, RESEARCH AND EDUCATION DEVELOPMENT ANALYSIS132
• 20-year timeline for the project, 2-year timeline for
master planning.
• $30 million budget.
• Public/private partnership.
• Residential architecture is preserving character to of the
Navy Yards.
• Sustainability Initiatives:
– Reestablish Noisette Creek as a healthy,
functioning ecosystem
– Set a benchmark for smart growth and combat
urban sprawl
– Reclaim waterfront for public use
– Integrate former Navy base into city
– Preserve and promote area’s historical significance
– Provide natural landscape that is accessible to
urban populations
– Pedestrian paths and bikeways to connect with
neighboring areas15
15 Research Links
VIIKKIhttp://viikki.helsinki.fi/english/index.htmhttp://helix.helsinki.fi/infokeskus/english/http://www.cardiff.ac.uk/archi/programmes/cost8/case/holistic/finland-viikki.pdf
DONGTANhttp://www.arup.com/eastasia/project.cfm?pageid=7047http://www.dongtan.biz/english/gywm/default.phphttp://www.guardian.co.uk/china/story/0,,1681385,00.html#article_continuehttp://www.wbcsd.ch/plugins/DocSearch/details.asp?type=DocDet&ObjectId=MTk4MTkhttp://www.carbonfree.co.uk/cf/news/wk09-0002.htm
THAMES GATEWAYhttp://www.thames-gateway.org.uk/http://www.london.gov.uk/mayor/planning/lower-lea-valley.jsphttp://www.london.gov.uk/mayor/planning/docs/lowerleavalley-summary.rtfwww.hm-treasury.gov.uk/newsroom_and_speeches/press/2004/press_barker_04.cfmhttp://www.seeda.co.uk/http://www.tgessex.co.uk/pages.php?id=6http://www.tgessex.co.uk/index.php
CALLAWAY GARDENShttp://www.callawaygardens.com/info/main.welcome.aspwww.callawaygardens.com/info/aboutUs.thePreserve.generalInfoOnThePreserve.asphttp://www.georgia.org/Travel/Discover/Major+Attractions/Callaway+Gardens.htm
NORTH CHARLESTON SUSTAINABLE COMMUNITY REDEVELOPMENThttp://www.bnim.com/fmi/xsl/portfolio/index.xsl?-token.pnum=03105&-token.pid=pr8-
10&-token.cat=cat-8http://www.architectureweek.com/2006/0419/news_1-2.htmlhttp://www.noisettesc.com/pdf/news/3013822510641721.pdfhttp://www.noisettesc.com/press_news_article.html?id=59http://www.navyyardsc.com/
Lifelong LearningLifelong learning programs are premised on the belief
that participants who share new ideas, challenges, and
experiences find rewards in every season of life. Lifelong
learning programs offer unique educational experiences,
infused with the spirit of camaraderie and adventure that
enrich and enhance the lives of its participants. Programs
are commonly taught by expert instructors who share
stimulating information through in-depth lectures, field
trips, and cultural excursions. Lively discussions with faculty
and fellow participants illuminate issues and broaden
horizons. Often, programs are hosted at universities during
semester and summer breaks.
Elderhostel is a not-for-profit organization dedicated to
providing extraordinary learning adventures for people 55
and over. From New Hampshire to New Zealand, South
Africa to South Dakota, Elderhostel offers nearly 8,000
programs a year in more than 90 countries to more than
170,000 older adults annually. Workshops, travel tours,
intergenerational programs, research projects, and courses
are typical offerings.16
Lifestyle CentersLifestyle centers are high-end, urban commercial centers
that are typically mixed-use and located near affluent
residential neighborhoods. The central organizing element
for this type of development is a main street or major
promenade with generous tree-lined sidewalks, decorative
pavement, benches, and pedestrian-scale lighting. A central
plaza is also featured, usually with fountains, sculpture,
and groves of mature shade trees, to create an activity
zone for events. Lifestyle centers are popular destinations
for local residents as well as the region for shopping and
entertainment.
16 Research Linkshttp://www.elderhostel.orghttp://www.smith.edu/ada/http://www.uclaextension.edu/
CHAPTER 4 PROGRAM AND PHYSICAL PLAN OPTIONS 133
Precedents
Santana Row (San Jose, CA) is a mixed-use lifestyle center:
residential units (apartments, condos and townhouses),
sixty-six shops, eighteen restaurants, five spas and a hotel.
It is organized along the Third Street Promenade. Shops are
typically high-end retailers including Gucci, Wolford, and
Burberry. Restaurants cover a wide range from Chili’s to the
Straits Cafe. Pedestrian-oriented streets, farmers’ market,
open air concerts and events.
CityPlace (West Palm Beach, FL) is a seventy-two acre,
$600 million development in Downtown West Palm Beach
featuring a mix of national and regional specialty retailers,
residential units, a theater within a renovated 1926 church,
and a twenty-screen Muvico cinema complex. These
amenities are offered within an architecturally distinct
complex reminiscent of an Italian town center. The retail
center is located on fifty-five acres on the north side of
Okeechobee Boulevard. It is a $600 million development in
Downtown West Palm Beach with 600,000 sq.ft. of retail,
fourteen destination restaurants, 586 private residences,
including town homes, rental apartments and live/work
lofts, and a 375-room hotel. The residences at CityPlace
are key to the long-term success of the project and will add
twenty-four hour life to its streets and plazas. To date, all
townhomes and garden condominium units have been sold.
Demographics of the buyers include young singles, young
couples, and retired couples who are attracted to the energy
and activity that CityPlace will offer.
Stanford Shopping Center (Palo Alto, CA) offers a premier
shopping and dining experience in the San Francisco Bay
Area and is one of a few open-air malls across the country.
Stanford Shopping Center was originally developed by
Stanford University in 1956 and can be considered an
early example of a lifestyle center, even though it is strictly
a retail center and not mixed-use. Today, it is one of the
most successful regional malls in the United States and
offers over 140 stores and restaurants. Stanford Shopping
Center is a part of the Simon Property Group, a real estate
investment trust engaged in the ownership, development
and management of retail real estate, primarily regional
malls, premium outlet centers, and community shopping
centers.17
Organic Farming Organic farming produces crops and livestock without the
use of synthetic fertilizers, pesticides, growth regulators
and feed additives. Some methods organic farmers employ
are crop rotation, crop residues, animal manure, and
mechanical cultivation for increased productivity, nutrients,
and weed/pest control18. Organic farming has been one of
the fastest growing segments of U.S. agriculture for over
a decade. Certified organic cropland for grains, fruits,
vegetables and other crops more than doubled from 1992
to 1997, and doubled again for many crops between 1997
and 2003.
Minnesota Organic Farmers’ Information Exchange is one
of the United States’ top producers of organic cropland.
Minnesotan organic farmers have a group of twenty-two
“mentors,” fellow organic farmers that can answer other
farmers’ questions.
Remote Departments, Off-Campus Storage Many universities choose to use land outside of their
campus to house certain departments, research ventures,
and storage. This is one way for urban campuses to save
money and space without compromising their mission and
educational goals.
Precedents
Petersham Forest (Harvard University) is a 2000-acre parcel
that is 35 miles from Harvard’s Cambridge, MA dedicated to
woodlands research. Researchers from Harvard study forest
preservation and often work with state and local government
to influence legislation.
17 Research Linkshttp://www.santanarow.com/about/http://www.cityplace.com/AboutCityplace.htmlhttp://www.stanfordshop.com/about.aspx
18 http://www.heartlandfields.com/soy_health/soy_glossary.html

UNIVERSITY OF MINNESOTA OUTREACH, RESEARCH AND EDUCATION DEVELOPMENT ANALYSIS134
TOP PRODUCING ORGANIC CROPLAND STATES, 2001
Harvard Veterinary School and Primate Research Facility
(Southborough, MA) hosts the Veterinary School and Primate
Research Center outside of the Cambridge campus and
allows Harvard more space for its non-human primate
research labs. Even while off-campus, the lab still conducts
interdisciplinary research with departments on Harvard’s
Cambridge campus.
Harvard Depository Library (Southborough, MA) enables
Harvard to purchase and have on-hand, multiple copies
and volumes of certain books. The building uses innovative
methods to allow for high-density and climate-controlled
storage. Harvard has even rented out some of its storage
space to the Brown University Library.19
ResortsDestination resorts for vacations, conferences, weddings and
other events can generate income for the University.
Precedents
Desert Springs Resort (Palm Desert, CA) hosts a major hotel
and conference center with 210,000 sq.ft. of indoor and
outdoor of flexible meeting, exhibit and banquet space, 833
resort rooms and 51 suites, two 18-hole championship golf
courses, and a full-service spa and fitness center.
19 Research Linkshttp://harvardforest.fas.harvard.edu/wandw/exec_summ_wandw.pdfhttp://www.hms.harvard.edu/nerprc/http://www.arl.org/preserv/harvard.html
Deerhurst Resort (Ontario, Canada) is located on an 800-
acre setting on Peninsula Lake in Ontario, and has 40,000
square feet of meeting, exhibit and conference space, 32
meeting rooms, 400 guestrooms, 2 ballrooms, a business
center, and a full-service spa. It also offers two golf courses
and year-round activities.
Canyon Ranch (Tuscon, AZ and Lenox, MA) is a destination
health spa and retreat center for inspiring healthy living.
They offer fitness classes, nutrition consultation, stress
assessments, medical wellness, spa services, cooking
classes, guided hiking and biking, golf, tennis, and other
sports.
Kripalu Center for Yoga & Health (Lenox, MA) is a “retreat and
renewal” destination for fitness, yoga and spiritual healing
and expression. The grounds host the Kripalu Center for
Professional Training which includes the School of Yoga,
School of Massage and School of Ayurveda. It is operated
by the Kripalu Yoga Fellowship, a non-profit and charitable
organization and is located on the grounds of a former Jesuit
seminary in Lenox, Massachusetts.20
Sand and Gravel MiningIndustrial minerals include aggregate (sand, gravel and
crushed stone), peat, kaolin clay, dimension stone, and
silica sand. Aggregate mining operations occur in nearly
every county in Minnesota. Aggregate materials are the
essential elements of a variety of construction products,
such as concrete. Silica sand, a fine sand composed of
quartz, is mined in the southeastern part of Minnesota.
Its uses include glass-making, a source of silicon, and
improving flow in oil wells.
Precedents
In Minnesota, gravel mining operations are generally under
the jurisdiction of the host local government. This entity
may have specific regulations for development, operation,
or reclamation of a pit. Additionally, a number of state and
20 Research Linkshttp://www.desertspringsresort.comhttp:// www.deerhurstresort.comhttp:// www.canyonranch.comhttp:// www.kripalu.org
SOURCE: ECONOMIC RESEARCH SERVICE, USDA

CHAPTER 4 PROGRAM AND PHYSICAL PLAN OPTIONS 135
federal permits may apply that pertain to water quality,
water discharge, wetlands, air emissions and mine safety.
Environmental review in the form of an Environmental
Assessment Worksheet (EAW) is required for operations
that will exceed 40 acres to a mean depth of 10 feet. Local
government is responsible for the preparation of an EAW.
There are no statewide requirements or funds for the
reclamation of gravel pits in Minnesota. Sand and gravel
operations, including reclamation, are most directly handled
at the local government (township, city, and/or county)
level. Plans for the reclamation of currently active gravel
operations may be included as part of the mining plan
developed by the pit operator, and may be required by a
local government.
While there are no state funds for gravel pit reclamation, 28
counties, including Dakota County, administer the Aggregate
Material Tax (Minn. Stat. 298.75). In these counties, 10%
of the tax raised from current gravel operations is set aside
for the reclamation of abandoned gravel pits on public land.
Several gravel pit reclamation projects on public land have
been partially funded by the proceeds from this tax.21
Counties, townships or municipalities have the primary
authority for regulating extractive uses like aggregate
mining. In many counties, aggregate mining requires a
Conditional Land Use Permit (CLUP) from the county
planning and zoning office. A township or municipality
may also require a permit in addition to (or instead of) a
county permit. Local permits are generally required for new
operations that exceed a certain threshold of activity, or
for expansion of an existing operation. Local permits may
address issues such as hours of operation, noise, traffic,
dust, and reclamation.22
There are over 4,000 gravel pits in the State of Minnesota
Currently, there is no state or federal mining permit in
Minnesota that requires aggregate operators to submit
a mining plan or to reclaim the site after mining. In
21 Minnesota Department of Natural Resources, Division of Lands and Minerals. http://www.dnr.state.mn.us/lands_minerals/mining.html, accessed March 14, 2006.
22 Minnesota Department of Natural Resources, Division of Lands and Minerals, Environ-mental Regulations for Aggregate Mining, Fact Sheet 1, January 2001. http://files.dnr.state.mn.us/lands_minerals/aggregate1_mar01.pdf, accessed March 14, 2006.
Minnesota, sand and gravel mining is increasingly viewed as
a temporary use to be followed by another land use that is
compatible with the surrounding landscape.
Once reclamation is achieved and maintained, a variety of
land uses may occur on the site. Examples provided by the
National Mining Association and the Minnesota Department
of Natural Resources are schools, recreation centers, parks,
malls, government facilities, airports, housing, golf, and
agriculture.23
Environmental Secondary SchoolsUniversities build connections with high schools providing
preparatory programs focused on environmental education.
The partnerships are designed to provide the schools with
college-awareness programs geared towards environmental
subjects such as environmental science, environmental
law, wildlife conservation and environmental justice. The
programs include an academic program as well as applied
learning experiences.
Precedents
New York High School for Environmental Studies:
• 1,200 students
• The high school has a significant recruitment
relationship with the University of Vermont, which
recruits students of color and supports growing college
prep initiatives, and is also partnered with the University
of Rochester, CUNY College NOW, John Jay College.
• Features regular coursework with hands-on learning
throughout the city such as recycling initiatives,
environmental justice, roof gardening, and ecology.
• Awards: Borough of Manhattan Golden Apple Award/
Department of Sanitation Recycling Award for 2002,
2003, and 2004. Citywide Winners for Envirothon
2002, 2003, and 2004. Manhattan’s Top High School
Internship Program for 2000.
23 Research Link Minnesota Department of Natural Resources, Division of Lands and Minerals, A Hand-book for Reclaiming Sand and Gravel Pits in Minnesota, July 1992.
UNIVERSITY OF MINNESOTA OUTREACH, RESEARCH AND EDUCATION DEVELOPMENT ANALYSIS136
• Model for a growing number of high school
environmental programs around the country.
West Seattle High School Environmental Science Academy
• Students have higher attendance and GPA than peers,
and have greater interest in college.
• Restored West Seattle’s Hamilton Viewpoint to natural
state with Parks and Recreation Department and Mithun
Architectural Firm - Students won John H. Stanford
Education Achievement Award by the Cascade Land
Conservancy.24
Slow Food“A food community is a physically identifiable entity,
that shares values, interests and a common purpose, and
is engaged—through seed saving, harvesting, breeding,
farming, fishing, food processing, food distribution,
marketing, education and other eco-gastronomic activities—
in bringing small scale food products to consumers.” -Carlo
Petrini, Slow Food Founder and President.25
Slow Food is an international movement initiated to promote
a slower, less frantic lifestyle, and quality food, culture and
biodiversity. Slow Food promotes consumer information and
protects cultural identities tied to foods. There are a number
of international chapters that hold frequent events and give
awards that celebrate quality of food and lifestyle.
Slow Food USA is a non-profit organization that supports
local farmers, promotes biodiversity, and helps join food
producers and consumers interested in promoting quality,
healthy foods and lifestyles. Slow Food USA hosts events
around the country that celebrate local flavors, provide
aid to the hungry and those in need, and educate urban
consumers about rural producers.
Terra Madre (Turnin Italy) is an international food festival
hosted by the Slow Food organization. Terra Madre hosts
24 Research Linkshttp://www.uvm.edu/theview/article.php?id=1403http://www.seattleschools.org/area/news/x30515ws.xmlhttp://www.nycenet.edu/Templates/Schools/Regions/School.aspx?NRMODE=Published&NRORIGINALURL=%2fOurSchools%2fRegion9%2fM400%2fdefault%2ehtm&NRNODEGUID=%7bE100F252-B174-435C-BE1A-62DAC1073567%7d&NRCACHEHINT=Guest
25 http://www.slowfoodusa.org/events/terra_madre_2006.htmlhttp://www.slowfoodusa.org/events/terra_madre_2006.html
5,000 sustainable food producers, chefs, and university
representatives from 150 countries. “In October 2004,
Slow Food held the first edition of Terra Madre, a forum for
those who seek to grow, raise, catch, create, distribute and
promote food in ways that respect the environment, defend
human dignity and protect the health of consumers.”26
Solar EnergyAccording to the U.S. Department of Energy, Minnesota
has as much usable sunlight as some parts of Texas and
Florida. This means the sun can provide a residence with
a significant amount of heating and electrical needs on a
year-round basis. In Minnesota, per capita consumption
of electricity in homes 2001 was 3,902 kWh. Per capita
electricity used in homes increased by 1,019 kWh between
1980 and 2001, an annual average increase of 1.5%.27
Solar electricity is expensive in Minnesota and has long
payback periods. Cost efficiency of building-integrated
Photovoltaics has yet to be realized as compared to fossil-
fuel alternatives. It is more cost-effective to provide
electricity to a large number of homes using a large-scale
centralized utility (solar, wind or other) rather than building-
integrated.
Several manufacturers of photovoltaics offer systems
that can be integrated into the design of a building. As a
construction material, such as a BIPV glass façade, it is an
integral component of the building envelope and generates
electricity. Hence, it is defined as a multifunctional
building material. Building integrated photovoltaics
can save money by substituting building components,
providing multifunctional potential for insulation, acoustical
control, daylighting, shading, reducing roof replacement,
waterproofing, fire protection, and wind protection. The
National Renewable Energy Laboratory (NREL) reports that
building integrated photovoltaics can offer significant cost
savings when compared to standalone photovoltaic systems.
26 Research Linkshttp://www.slowfood.com/eng/sf_ita_mondo/sf_ita_mondo.lassohttp://www.slowfoodusa.org/
27 U.S. Department of Energy, Energy Efficiency and Renewable Energy, Minnesota Energy Statistics, http://www.eere.energy.gov/states/state_specific_statistics.cfm/state=MN, accessed February 15, 2006.

CHAPTER 4 PROGRAM AND PHYSICAL PLAN OPTIONS 137
A very large-scale photovoltaic system is a photovoltaic
system ranging from 10 megawatts up to several gigawatts
consisting of one plant or an aggregation of multiple units
operating in harmony and distributed in the same district.28
For institutions which have a large amount of undeveloped
open space, there are several options of ground mounted
solar electric systems. These can often withstand high wind
speeds and are often mounted on solar trackers so that the
photovoltaic (photovoltaic) modules automatically follow
the path of the sun throughout the day. Standalone systems
produce power independently of the utility grid. In some
off-grid locations one-quarter mile or more from the power
lines, standalone photovoltaic systems can be more cost-
effective than extending power lines. The U.S. Department
of Energy finds they are particularly appropriate for remote,
environmentally sensitive areas, such as agricultural
applications, large parks, or other rural uses.
Solargenix Energy (Boulder City, NV) is a subsidiary of Acciona
Energy SA, said it formally began construction on the 64-
megawatt plant in the Eldorado Valley of Boulder City. The
$106 million solar project on 300 acres is scheduled for
completion by March 2007, when the Solargenix will begin
selling energy to the Nevada Power Company and Sierra
Pacific Power Company. The plant is expected to provide
enough power for about 40,000 households.29
Sacramento Municipal Utility District (Sacramento, CA)
operates a 2-megawatt photovoltaic power plant at Rancho
Seco, California. The utility also works with residential and
commercial customers on several robust PV programs.
University-Sponsored Conference CentersFacilities for meetings, conferences, weddings and other
events affiliated with universities generate interest in
progress in academics and research, and income for the
university.
28 Kurokawa, Kosuke, Energy from the Desert: Feasibility of Very Large Scale Photovoltaic Power Generation Systems, Photovoltaic Power Systems Executive Committee of the International Energy Agency, James and James Limited, London: 2001. http://www.oja-services.nl/iea-pvps/products/download/rep8_01s.pdf, accessed February 15, 2006.
29 “Company breaks ground on $106 million solar plant in Nevada,” SignOnSanDiego, http://www.signonsandiego.com/news/science/20060212-1801-nv-solarplant.html, accessed February 15, 2006.
Precedents
The Fawcett Center (Ohio State University) was established
as a national prototype for conference centers on major
college campuses. The Fawcett Center boasts 40,000
sq.ft. of state-of-the-art conference facilities, including a
500-seat auditorium and 19 multi-function meeting rooms
accommodating groups of 10 to 1,000. It is also associated
with a 150-room hotel. The center demonstrates the
university’s commitment to lifelong learning and making the
university a resource for the people of Ohio.
The Penn Stater (Penn State University) has 58,000 square
feet of meeting space with banquet and meeting amenities,
41 professional conference rooms, a 10,000 sq.ft.
ballroom, and a 300-room hotel. Audiovisual equipment and
event planning services are included. Associated with the
Nittany Lion Inn, a 223-room inn and conference facility
run by Penn State, the facility is also part of Penn State’s
prestigious Hospitality Services Department.
University Place (Indiana University-Purdue University)
is located on the campus of Indiana University-Purdue
University-Indianapolis in downtown Indianapolis. Twenty
eight dedicated self-contained meeting rooms ranging from
a 340-seat auditorium to breakout rooms, includes two
tiered meeting rooms, two boardrooms, and a ballroom.
An upscale hotel with 278 rooms is integrated with the
conference center.
The Eric P. Newman Education Center (Washington University
Medical Center) has a 450-seat auditorium, a 100-seat
auditorium, a 42-seat auditorium, and 12 conference and
breakout rooms. There are 220 rooms in an adjacent hotel
and 400 additional rooms at nearby hotels with a wide
range of amenities and prices. Forest Park is adjacent to
the center, with golf, running, hiking and boating, a world-
renowned zoo, and museums. Professional football, baseball
and hockey are accessible by light rail.30
30 Research Linkshttp://www.fawcettcenter.comhttp://www.pshs.psu.edu/http://www.universityplace.iupui.eduhttp://www.epnec.wustl.edu/

UNIVERSITY OF MINNESOTA OUTREACH, RESEARCH AND EDUCATION DEVELOPMENT ANALYSIS138
Utopian CommunitiesUtopian communities aim to put ideology into practice.
They have been in existence for several centuries and have
followed different philosophies. In recent history, utopian
ideals have included minimizing environmental impact,
avoiding suburban sprawl, maintaining natural beauty,
maintaining self-sufficiency of inhabitants and community,
creating visually appealing architecture and landscape, and
fostering community and individuality, while still allowing
for privacy.
Landmarks of utopian communities
• 1663 - Twenty communities were founded by religious
groups in the U.S., mostly German.
• 1774 - Mother Ann Lee founded the Shakers, which
grew to 6,000 members by 1840s.
• 1824 - Robert Owen arrived from Britain - secular
ideology, promised to transform property and labor
relationships.
• 1840s - Charles Fourier foresaw a harmonious world in
which men and women would realize their true natures
in communities of approximately 2,500 people.
• 1841 - Brook Farm, West Roxbury, Massachusetts:
- Members tried to create alternative to the inequality
of modern society
- Each member owned a share of the property
- Housing, jobs, food were all shared
- Intellectual and social activities were of utmost
importance
- Land is currently a state park
• 1840s - North American Phalanx, Red Bank, New
Jersey:
- Philosophy similar to Brook Farm
- Consisted of “a stream mill, stables, cow and wagon
sheds, forges, carpenter shops, a packing house,
a school, a day nursery for working mothers, guest
cottages, landscaped gardens and paths, and an
artificial pond for bathing, boating and ice harvesting
in the winter”
- Most occupants were of the lower and middle classes
• 1960s - Emphasized notion of collective living as a form
of self-fulfillment and personal growth.
• 1961 - Camphill Village, Copake, New York, is part of
the international Camphill movement consisting of more
than one hundred communities in twenty-two countries.
In this model, coworkers and their children live together
in extended family households and work together in a
variety of craft shops and work areas.
• 1970 - Arcosanti, Arizona is an experimental town
located in the Arizona desert demonstrating ways to
improve urban conditions and reducing negative impacts
on the environment. Here, residents work on planning,
construction, teaching, computer aided drafting,
maintenance, cooking, carpentry, metal work, ceramics,
gardening and communications31
Wind EnergyBased on the Wind Resource Analysis Program Report
issued by the Minnesota Department of Commerce,
Minnesota ranked first in the nation in terms of installed
wind capacity from 1995-2000. The State of Minnesota is
fortunate to have a combination of excellent wind resources,
utilities that are buying wind power, an active environmental
advocacy community, and an environmentally-aware public.
At a time when development is stagnating in other parts
of the United States due to uncertainty about the future
shape of the electric utility industry, wind projects are being
developed here.32
UMore Park is uniquely positioned to accommodate wind
power. Existing wind installations are highly concentrated in
a very small geographical area in southwestern Minnesota
31 Research Linkshttp://www.answers.com/topic/utopian-communitieshttp://www.artnews.info/gallery.php?i=100&exi=719http://www.luhringaugustine.com/index.php?mode=past&object_id=106#http://www.arcosanti.org/project/background/history/main.htmlhttp://www.arcosanti.org/project/main.htmlhttp://www.questia.com/search/utopian-communities-http://oregonstate.edu/Dept/philosophy/club/utopia/utopian-visions/robinson-lec.htmlhttp://www.massmoments.org/moment.cfm?mid=294http://www.camphill.org/http://www.camphillvillage.org/
32 http://www.me3.org/projects/seed/localfease.html
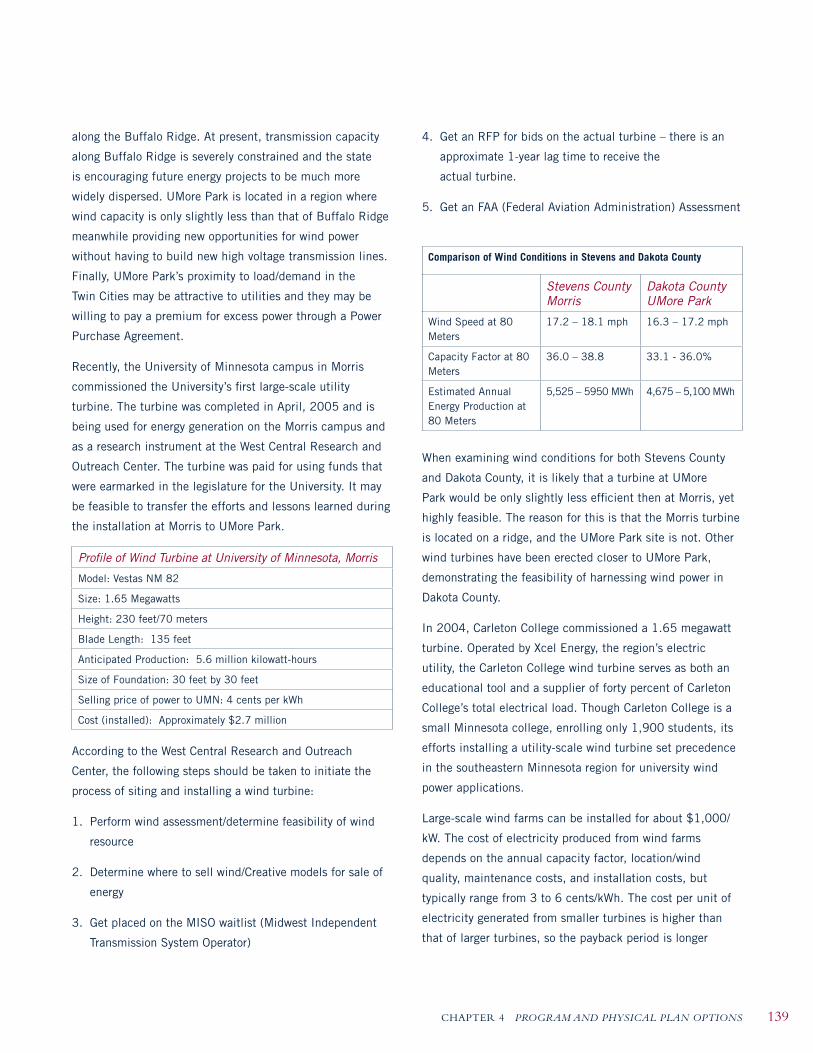
CHAPTER 4 PROGRAM AND PHYSICAL PLAN OPTIONS 139
along the Buffalo Ridge. At present, transmission capacity
along Buffalo Ridge is severely constrained and the state
is encouraging future energy projects to be much more
widely dispersed. UMore Park is located in a region where
wind capacity is only slightly less than that of Buffalo Ridge
meanwhile providing new opportunities for wind power
without having to build new high voltage transmission lines.
Finally, UMore Park’s proximity to load/demand in the
Twin Cities may be attractive to utilities and they may be
willing to pay a premium for excess power through a Power
Purchase Agreement.
Recently, the University of Minnesota campus in Morris
commissioned the University’s first large-scale utility
turbine. The turbine was completed in April, 2005 and is
being used for energy generation on the Morris campus and
as a research instrument at the West Central Research and
Outreach Center. The turbine was paid for using funds that
were earmarked in the legislature for the University. It may
be feasible to transfer the efforts and lessons learned during
the installation at Morris to UMore Park.
Profile of Wind Turbine at University of Minnesota, Morris
Model: Vestas NM 82
Size: 1.65 Megawatts
Height: 230 feet/70 meters
Blade Length: 135 feet
Anticipated Production: 5.6 million kilowatt-hours
Size of Foundation: 30 feet by 30 feet
Selling price of power to UMN: 4 cents per kWh
Cost (installed): Approximately $2.7 million
According to the West Central Research and Outreach
Center, the following steps should be taken to initiate the
process of siting and installing a wind turbine:
1. Perform wind assessment/determine feasibility of wind
resource
2. Determine where to sell wind/Creative models for sale of
energy
3. Get placed on the MISO waitlist (Midwest Independent
Transmission System Operator)
4. Get an RFP for bids on the actual turbine – there is an
approximate 1-year lag time to receive the
actual turbine.
5. Get an FAA (Federal Aviation Administration) Assessment
Comparison of Wind Conditions in Stevens and Dakota County
Stevens County Morris
Dakota CountyUMore Park
Wind Speed at 80 Meters
17.2 – 18.1 mph 16.3 – 17.2 mph
Capacity Factor at 80 Meters
36.0 – 38.8 33.1 - 36.0%
Estimated Annual Energy Production at 80 Meters
5,525 – 5950 MWh 4,675 – 5,100 MWh
When examining wind conditions for both Stevens County
and Dakota County, it is likely that a turbine at UMore
Park would be only slightly less efficient then at Morris, yet
highly feasible. The reason for this is that the Morris turbine
is located on a ridge, and the UMore Park site is not. Other
wind turbines have been erected closer to UMore Park,
demonstrating the feasibility of harnessing wind power in
Dakota County.
In 2004, Carleton College commissioned a 1.65 megawatt
turbine. Operated by Xcel Energy, the region’s electric
utility, the Carleton College wind turbine serves as both an
educational tool and a supplier of forty percent of Carleton
College’s total electrical load. Though Carleton College is a
small Minnesota college, enrolling only 1,900 students, its
efforts installing a utility-scale wind turbine set precedence
in the southeastern Minnesota region for university wind
power applications.
Large-scale wind farms can be installed for about $1,000/
kW. The cost of electricity produced from wind farms
depends on the annual capacity factor, location/wind
quality, maintenance costs, and installation costs, but
typically range from 3 to 6 cents/kWh. The cost per unit of
electricity generated from smaller turbines is higher than
that of larger turbines, so the payback period is longer
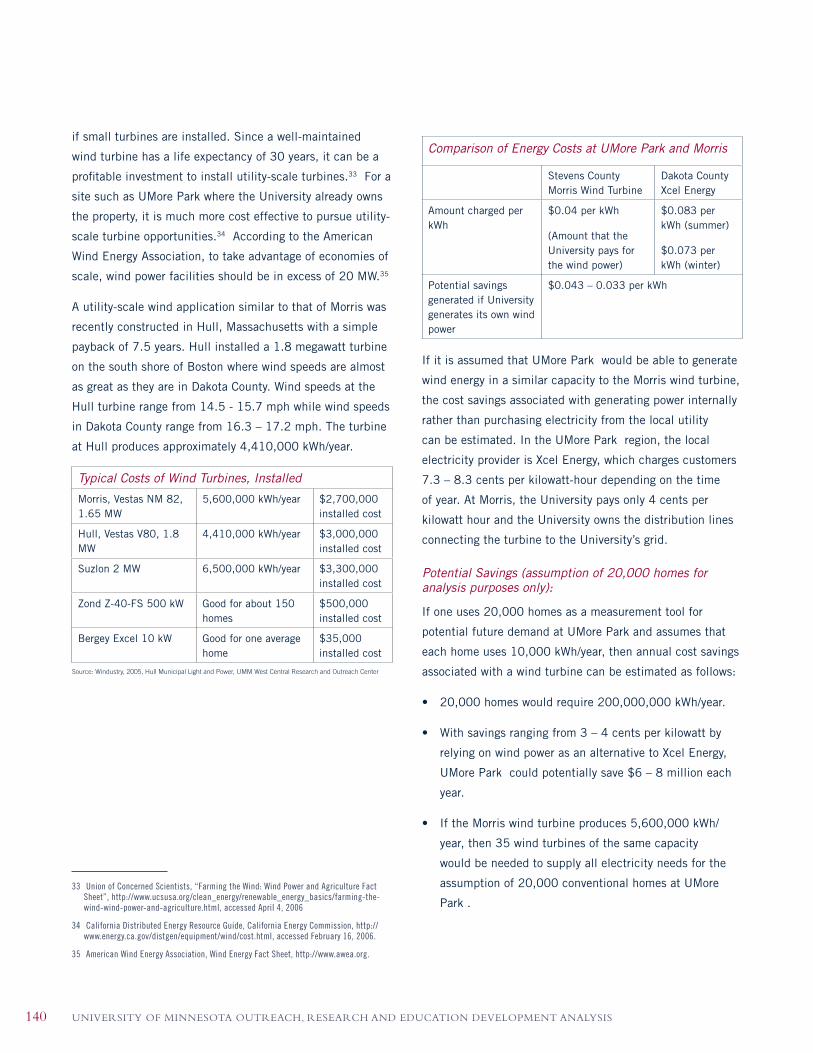
UNIVERSITY OF MINNESOTA OUTREACH, RESEARCH AND EDUCATION DEVELOPMENT ANALYSIS140
if small turbines are installed. Since a well-maintained
wind turbine has a life expectancy of 30 years, it can be a
profitable investment to install utility-scale turbines.33 For a
site such as UMore Park where the University already owns
the property, it is much more cost effective to pursue utility-
scale turbine opportunities.34 According to the American
Wind Energy Association, to take advantage of economies of
scale, wind power facilities should be in excess of 20 MW.35
A utility-scale wind application similar to that of Morris was
recently constructed in Hull, Massachusetts with a simple
payback of 7.5 years. Hull installed a 1.8 megawatt turbine
on the south shore of Boston where wind speeds are almost
as great as they are in Dakota County. Wind speeds at the
Hull turbine range from 14.5 - 15.7 mph while wind speeds
in Dakota County range from 16.3 – 17.2 mph. The turbine
at Hull produces approximately 4,410,000 kWh/year.
Typical Costs of Wind Turbines, Installed
Morris, Vestas NM 82, 1.65 MW
5,600,000 kWh/year $2,700,000 installed cost
Hull, Vestas V80, 1.8 MW
4,410,000 kWh/year $3,000,000 installed cost
Suzlon 2 MW 6,500,000 kWh/year $3,300,000 installed cost
Zond Z-40-FS 500 kW Good for about 150 homes
$500,000 installed cost
Bergey Excel 10 kW Good for one average home
$35,000 installed cost
Source: Windustry, 2005, Hull Municipal Light and Power, UMM West Central Research and Outreach Center
33 Union of Concerned Scientists, “Farming the Wind: Wind Power and Agriculture Fact Sheet”, http://www.ucsusa.org/clean_energy/renewable_energy_basics/farming-the-wind-wind-power-and-agriculture.html, accessed April 4, 2006
34 California Distributed Energy Resource Guide, California Energy Commission, http://www.energy.ca.gov/distgen/equipment/wind/cost.html, accessed February 16, 2006.
35 American Wind Energy Association, Wind Energy Fact Sheet, http://www.awea.org.
Comparison of Energy Costs at UMore Park and Morris
Stevens CountyMorris Wind Turbine
Dakota CountyXcel Energy
Amount charged per kWh
$0.04 per kWh
(Amount that the University pays for the wind power)
$0.083 per kWh (summer)
$0.073 per kWh (winter)
Potential savings generated if University generates its own wind power
$0.043 – 0.033 per kWh
If it is assumed that UMore Park would be able to generate
wind energy in a similar capacity to the Morris wind turbine,
the cost savings associated with generating power internally
rather than purchasing electricity from the local utility
can be estimated. In the UMore Park region, the local
electricity provider is Xcel Energy, which charges customers
7.3 – 8.3 cents per kilowatt-hour depending on the time
of year. At Morris, the University pays only 4 cents per
kilowatt hour and the University owns the distribution lines
connecting the turbine to the University’s grid.
Potential Savings (assumption of 20,000 homes for analysis purposes only):
If one uses 20,000 homes as a measurement tool for
potential future demand at UMore Park and assumes that
each home uses 10,000 kWh/year, then annual cost savings
associated with a wind turbine can be estimated as follows:
• 20,000 homes would require 200,000,000 kWh/year.
• With savings ranging from 3 – 4 cents per kilowatt by
relying on wind power as an alternative to Xcel Energy,
UMore Park could potentially save $6 – 8 million each
year.
• If the Morris wind turbine produces 5,600,000 kWh/
year, then 35 wind turbines of the same capacity
would be needed to supply all electricity needs for the
assumption of 20,000 conventional homes at UMore
Park .
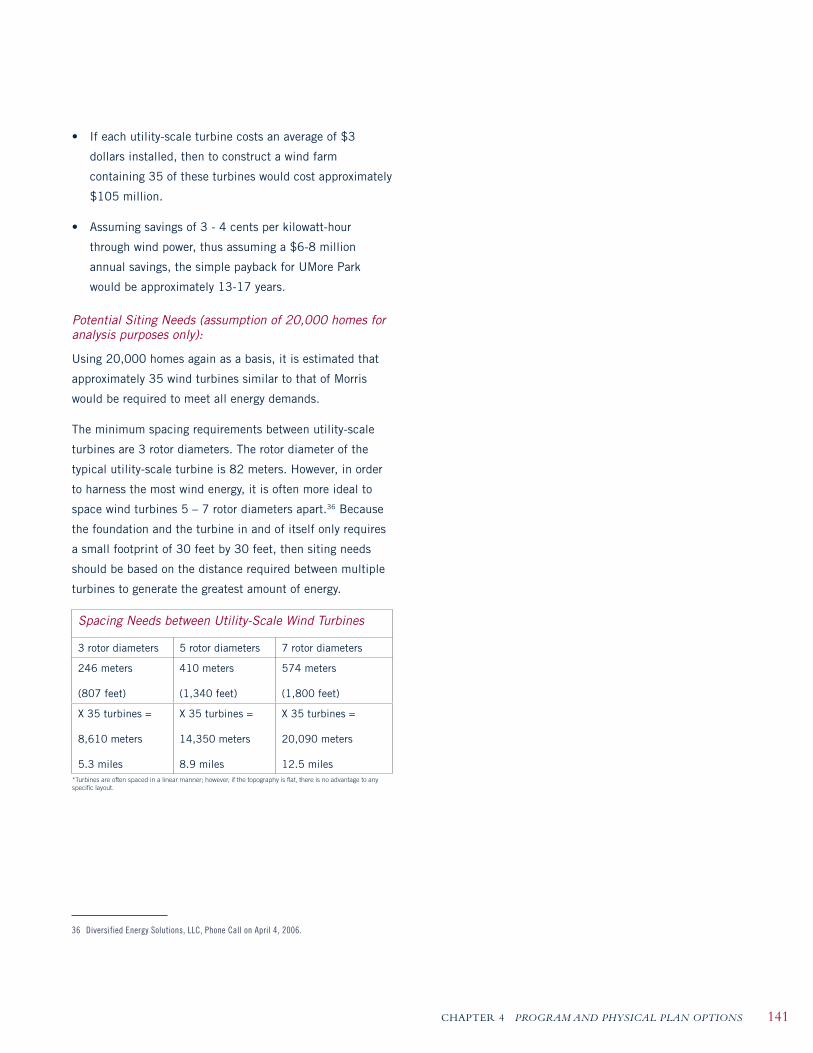
CHAPTER 4 PROGRAM AND PHYSICAL PLAN OPTIONS 141
• If each utility-scale turbine costs an average of $3
dollars installed, then to construct a wind farm
containing 35 of these turbines would cost approximately
$105 million.
• Assuming savings of 3 - 4 cents per kilowatt-hour
through wind power, thus assuming a $6-8 million
annual savings, the simple payback for UMore Park
would be approximately 13-17 years.
Potential Siting Needs (assumption of 20,000 homes for analysis purposes only):
Using 20,000 homes again as a basis, it is estimated that
approximately 35 wind turbines similar to that of Morris
would be required to meet all energy demands.
The minimum spacing requirements between utility-scale
turbines are 3 rotor diameters. The rotor diameter of the
typical utility-scale turbine is 82 meters. However, in order
to harness the most wind energy, it is often more ideal to
space wind turbines 5 – 7 rotor diameters apart.36 Because
the foundation and the turbine in and of itself only requires
a small footprint of 30 feet by 30 feet, then siting needs
should be based on the distance required between multiple
turbines to generate the greatest amount of energy.
Spacing Needs between Utility-Scale Wind Turbines
3 rotor diameters 5 rotor diameters 7 rotor diameters
246 meters
(807 feet)
410 meters
(1,340 feet)
574 meters
(1,800 feet)
X 35 turbines =
8,610 meters
5.3 miles
X 35 turbines =
14,350 meters
8.9 miles
X 35 turbines =
20,090 meters
12.5 miles*Turbines are often spaced in a linear manner; however, if the topography is flat, there is no advantage to any specific layout.
36 Diversified Energy Solutions, LLC, Phone Call on April 4, 2006.

UNIVERSITY OF MINNESOTA OUTREACH, RESEARCH AND EDUCATION DEVELOPMENT ANALYSIS142
Stormwater + LID | On-site Management
• Develop landscape strategies to treat stormwater on-site using swales, biofiltration, detention basins, and pervious paving
Stormwater + LID| On-site Management
• Use biofiltration where possible to ensure groundwater recharge and to reduce out-of-basin transfer through stormwater drains.
• Engineer locations to improve infiltration conditions—bio-retention ponds, wet swales, filter strips, infiltration trenches, install dry wells for roof run-off.
Following are excerpts from presentations made to the UMore Park Steering Committee during the course of the planning process. This presentation identifies program elements that might be constructed at UMore Park.

CHAPTER 4 PROGRAM AND PHYSICAL PLAN OPTIONS 143
Stormwater + LID | Biofiltration
• Minimize hardscapes and utilize pervious paving.
• Research shows approximately 10 percent impervious area in a watershed yields demonstrable degradation.
• Pavers and porous concrete can be used in parking lanes, alleys and driveways.
• Porous concrete or porous asphalt is recommended for sidewalks and can be used on multi-use paths.
• Footpaths, bike paths, and remote or overflow parking areas need no paving.
Stormwater + LID | LID Design
• Use pervious pavement where pavement is necessary

UNIVERSITY OF MINNESOTA OUTREACH, RESEARCH AND EDUCATION DEVELOPMENT ANALYSIS144
• Consider curbless roads or slotted curbs where necessary.
• Utilize shared parking or gravel parking to improve drainage and reduce impervious area.
Stormwater + LID | LID Design
• Design sidewalk, driveway and parking lot flows to drain away from street gutter and pipe systems into vegetated swales or bioretention areas.
Stormwater + LID | Living Machine
• Treat wastewater through biological processes
Living Machine
Reducesneed for
infrastructureexpansion

CHAPTER 4 PROGRAM AND PHYSICAL PLAN OPTIONS 145
Stormwater + LID | Greenroofs
• Introduce green roofs where possible. Greenroofs reduce energy costs, runoff, and enhance habitat.
1 | Residential Development
Traditional Neighborhood DevelopmentDense, walkable, neighborhood development designed to preserve wilderness and farmland between towns.Designed around a clear public center.Employment, recreation, and stores are all within walking distance from one's home. Include a wide range of architectural styles.

UNIVERSITY OF MINNESOTA OUTREACH, RESEARCH AND EDUCATION DEVELOPMENT ANALYSIS146
1| Residential Development
Utopian CommunitiesBrook Farm, West Roxbury, MA, 1841
A utopian society where people could share together to have a better lifestyle.Based on the concept of self-relianceAlternative to the inequality of modern societyEach member owned a share of the propertyHousing, jobs, food were all sharedIntellectual and social activities were of utmost importanceCurrently a state park
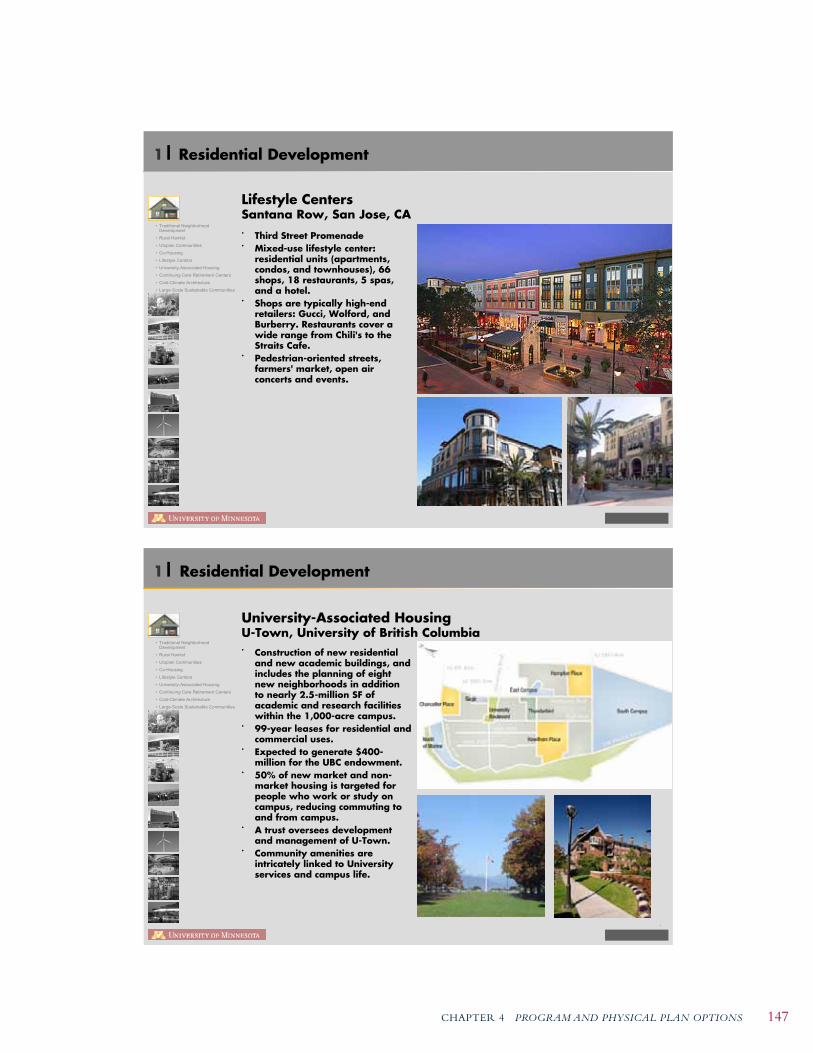
CHAPTER 4 PROGRAM AND PHYSICAL PLAN OPTIONS 147
1| Residential Development
Lifestyle CentersSantana Row, San Jose, CA
Third Street PromenadeMixed-use lifestyle center: residential units (apartments, condos, and townhouses), 66 shops, 18 restaurants, 5 spas, and a hotel.Shops are typically high-end retailers: Gucci, Wolford, and Burberry. Restaurants cover a wide range from Chili's to the Straits Cafe. Pedestrian-oriented streets, farmers' market, open air concerts and events.
1| Residential Development
University-Associated HousingU-Town, University of British Columbia
Construction of new residential and new academic buildings, and includes the planning of eight new neighborhoods in addition to nearly 2.5-million SF of academic and research facilities within the 1,000-acre campus.99-year leases for residential and commercial uses.Expected to generate $400-million for the UBC endowment.50% of new market and non-market housing is targeted for people who work or study on campus, reducing commuting to and from campus.A trust oversees development and management of U-Town.Community amenities are intricately linked to University services and campus life.

UNIVERSITY OF MINNESOTA OUTREACH, RESEARCH AND EDUCATION DEVELOPMENT ANALYSIS148
1| Residential Development
University-Associated Housing: Retirement CommunitiesUniversity of Michigan "University Commons"
"University Commons" condos for residents 55 and older92 condominiums on 18 acre wooded site, 7 acres of permanent woodlandsMarkets "elegant, thoughtful design and quality"Evokes Nostalgia for the University
1| Residential Development
Continuing Care Retirement Centers (CCRC)Longwood at Home, Pittsburgh Area
Provides "Without Walls" CCRC care in one's own home, in addition to on a residential campusThree separate plans to chose from, depending on needsOffers homemaker, home health services, companion services, emergency response, adult day care, assisted living and skilled nursing care, home maintenance, social and wellness programs

CHAPTER 4 PROGRAM AND PHYSICAL PLAN OPTIONS 149
1| Residential Development
Cold-Climate ArchitectureRocky Mountain Institute, Snowmass, CO
Completed in 1984,, the Rocky Mountain Institute building is a state-of-the-art showcase of efficiency techniques which increase comfort and enjoyment while saving money and resources.4,000-square-foot building is passive solar, superinsulated, and semiunderground for microclimatic reasons.Windows have a special glazing designed to maximize solar heating in cold climates.Building cost was still below local median for custom buildings.
1| Residential Development
Large-Scale Sustainable CommunitiesViikki, Helsinki, Finland
Community founded in 1993Currently 7,000 residents; projected to increase to 15,000 by 2015Includes extension campus of University of Helsinki and a biotechnology park Building standards require reductions in pollution and energy consumptionBuses and train lines connect to downtown Helsinki

UNIVERSITY OF MINNESOTA OUTREACH, RESEARCH AND EDUCATION DEVELOPMENT ANALYSIS150
2| University-Affiliated High School Education
Secondary SchoolsWest Seattle High School Environmental Science AcademyUniversity of Hartford High School of Science and Engineering
2| Non-University Education
Adventures in lifelong learning for older adults through educational travel programsWorkshops, travel tours, intergenerational programs
Life-Long LearningElderhostel
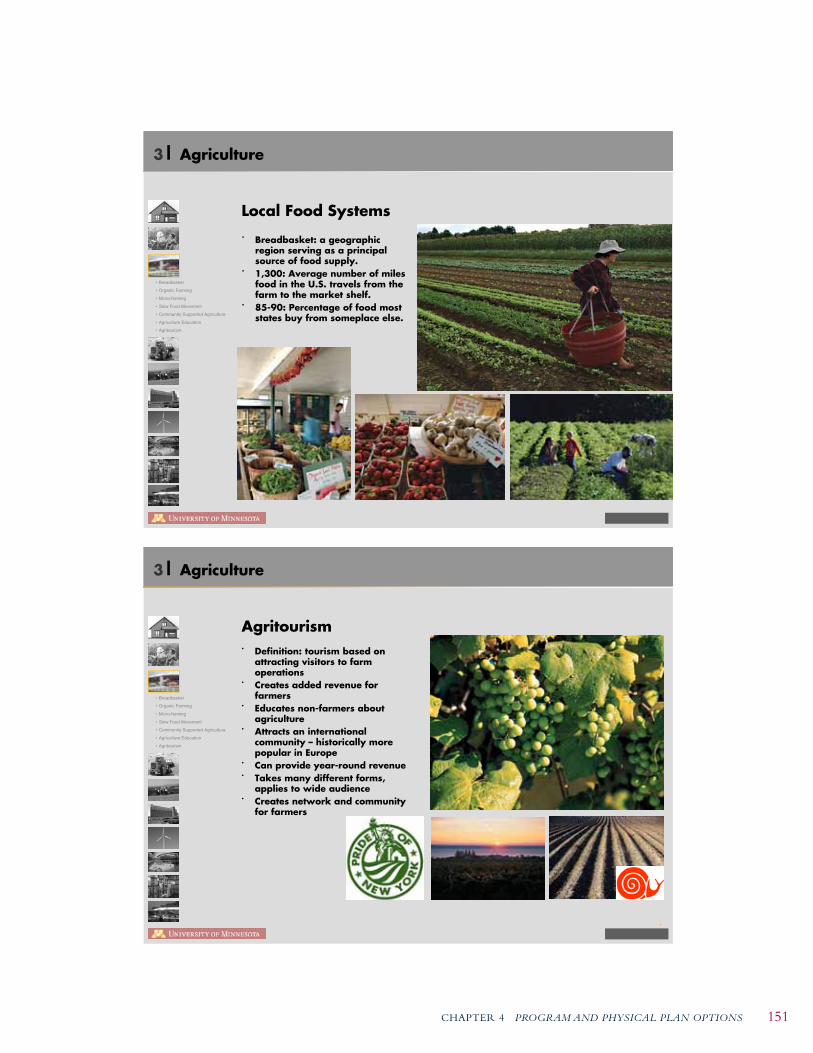
CHAPTER 4 PROGRAM AND PHYSICAL PLAN OPTIONS 151
3| Agriculture
Local Food Systems
Breadbasket: a geographic region serving as a principal source of food supply.1,300: Average number of miles food in the U.S. travels from the farm to the market shelf.85-90: Percentage of food most states buy from someplace else.
3| Agriculture
Definition: tourism based on attracting visitors to farm operationsCreates added revenue for farmersEducates non-farmers about agricultureAttracts an international community – historically more popular in EuropeCan provide year-round revenueTakes many different forms, applies to wide audienceCreates network and community for farmers
Agritourism
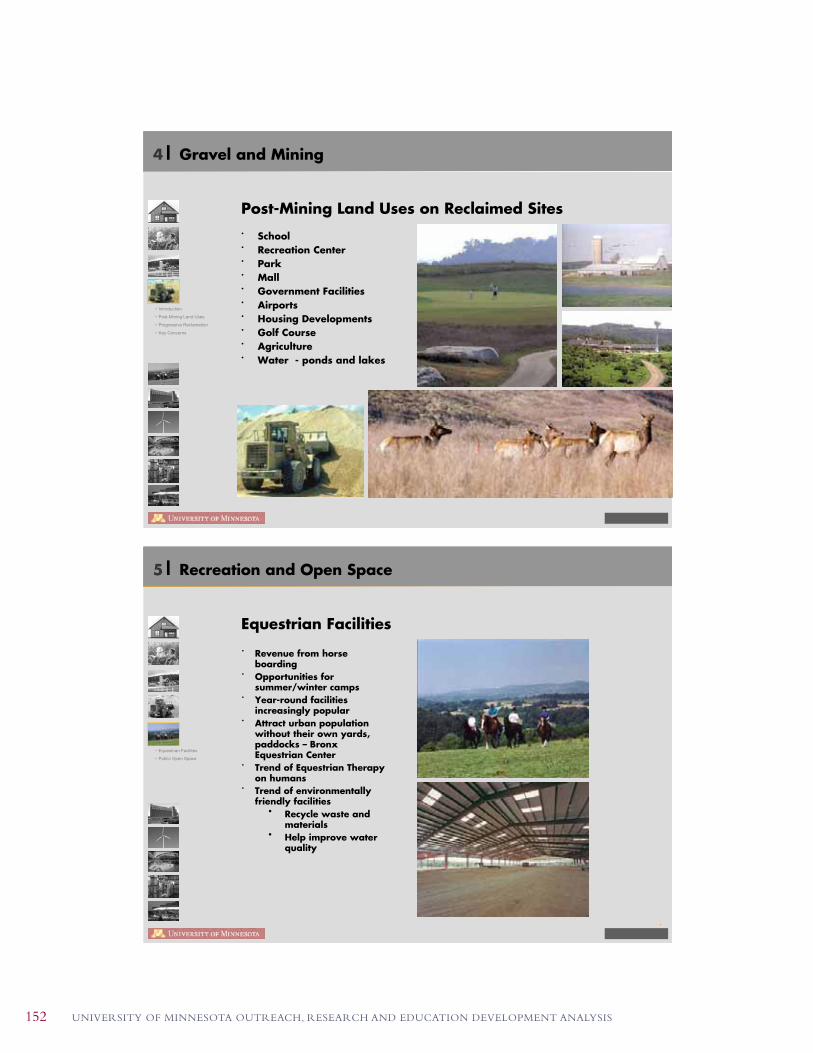
UNIVERSITY OF MINNESOTA OUTREACH, RESEARCH AND EDUCATION DEVELOPMENT ANALYSIS152
4| Gravel and Mining
SchoolRecreation CenterParkMallGovernment FacilitiesAirportsHousing DevelopmentsGolf CourseAgricultureWater - ponds and lakes
Post-Mining Land Uses on Reclaimed Sites
5| Recreation and Open Space
Revenue from horse boardingOpportunities for summer/winter campsYear-round facilities increasingly popularAttract urban population without their own yards, paddocks – Bronx Equestrian CenterTrend of Equestrian Therapy on humansTrend of environmentally friendly facilities
• Recycle waste and materials
• Help improve water quality
Equestrian Facilities

CHAPTER 4 PROGRAM AND PHYSICAL PLAN OPTIONS 153
6| Tourism
University-Associated Conference Center The Penn Stater, Penn State University
58,000 square feet of meeting space with banquet and meeting amenitiesAudiovisual equipment and event planning services.41 professional conference rooms, 10,000-square-foot ballroom and 300-room hotelAssociated with the NittanyLion Inn, a 223-room inn and conference facility run by Penn State.
6| Tourism
Specialty Resorts and SpasDeerhurst Resort, Ontario Canyon Ranch, Lenox, MA
Lovely natural settingsMeeting, exhibit & conference spaceYear-round and seasonal activities Destination health spa and retreat center for inspiring healthy living.

UNIVERSITY OF MINNESOTA OUTREACH, RESEARCH AND EDUCATION DEVELOPMENT ANALYSIS154
7| Alternative Energy Sources
Solar EnergyMinnesota's Annual Average Solar Isolation, 1998-2000
Photovoltaic (PV) technology uses the energy carried by sunlight to produce electricity.A typical Minnesota home consumes around 700 kilowatt-hours (kwh) of electricity each month or 25 kWh per day.A very large-scale PV system is defined as a PV system ranging from 10 megawatts up to several gigawatts consisting of one plant or an aggregation of multiple units operating in harmony and distributed in the same district.This could be a feasible application for UMore's energy needs.
7| Alternative Energy Sources
Conversion of biomass (plant-derived material) to valuable fuels; crops like corn and soy beans, and waste from consumer, municipal, industrial, and agricultural processes.A "greenhouse neutral" option for generating electricity because biofuels are derived from organic materialsCost competitiveness of bioenergy increases when energy generated is used on site rather than distributedUMore is rich in agriculture and forestry resources.The National Renewable Energy Laboratory states that there is enough residual biomass in Minnesota to produce 99% of total electricity used in the state.
Biomass Potential at UMore

CHAPTER 4 PROGRAM AND PHYSICAL PLAN OPTIONS 155
7| Alternative Energy Sources
Buffalo RidgeUMore
Turbines provide significant amounts of energy using only the natural power of the wind.Minnesota currently has 710 MW of wind power, including a turbine at Carleton College.UMore is well positioned to capture and utilize energy from local wind patterns.
Wind Energy
8| University-Associated Research Parks
University of Wisconsin Research Park
Established in 1984Originally 351 acres255 acres developed34 buildings1.5 million of square feet under roof$160 million value$3.5 million per year paid in property taxes110 tenantsMore than 5,300 employeesMore than $318 million in annual payroll

UNIVERSITY OF MINNESOTA OUTREACH, RESEARCH AND EDUCATION DEVELOPMENT ANALYSIS156
9| Other University Uses
2000 Acres dedication to conservation and agricultural research Primate researchClimate controlled books and record storage
Remote DepartmentsPetersham Forest, Harvard University
10| Arts and Culture
Regional Centers for Art and CultureChautauqua Institution, Chautauqua, NYTanglewood, Lenox, MA
Lovely natural settingsDay and overnight destination for enjoying arts and culture, schools for the arts, and recreation.

CHAPTER 4 PROGRAM AND PHYSICAL PLAN OPTIONS 157
UMore Park | A Community of the 21st Century
A community that draws its inspiration from the best minds at a great university, and that responds to the major challenges of our time: healthy living, education, and energy
UMore Park will contribute to a better future for the residents of Minnesota as they face the emerging economic, social, environmental and globalization challenges of the 21st century.
UMore Park is envisioned as a place in which the University collaboratively engages its expertise in teaching, research and outreach across all disciplines in the creation of a new “city” dedicated to educational excellence, renewable energy, and healthy lives.
UMore Park will be a place to discover, invent, design, build and evaluate the physical, socio-economic and institutional “infrastructure” of the 21st century.

UNIVERSITY OF MINNESOTA OUTREACH, RESEARCH AND EDUCATION DEVELOPMENT ANALYSIS158
4.4 POTENTIAL FOR ARTSAND CULTURE PARKS
The Twin Cities region is host to a diverse and thriving
cultural life. Seven of its arts institutions including the
Minneapolis Institute of Arts, Walker Art Center, Minnesota
Orchestra, Saint Paul Chamber Orchestra, Minnesota Opera,
Guthrie Theater and Children’s Theatre Company – are
internationally recognized in their fields. Just as importantly,
there are hundreds of smaller organizations and individuals
that write, paint, sculpt, sing, dance and perform
throughout the area. All of these groups greatly enhance the
region’s quality of life, while bringing nearly $1 billion into
the Minnesota economy every year.37
Minnesotans have played a significant role in encouraging
the diversity of cultural offerings. The University of
Minnesota’s Minnesota Center for Survey Research
conducted a survey in 1998 which found that 92%
of Minnesotans believe that the arts are important to
their quality of life. The survey also found that 60% of
Minnesotans are involved in the arts by engaging in some
creative activity in their everyday lives. This exceeds the
national average of 50% for arts participation.
As the University of Minnesota contemplates the direction
of its Rosemount site, it is important to assess the existing
cultural venues, their regional support networks, and the
characteristics that make the Twin Cities artistically unique.
Existing Venues
According to the Minnesota State Arts Board, the Twin
Cities region has approximately 25 performance spaces for
music, dance, opera, theater, media arts and literature.
On the whole, these venues are either large (1,500 seats
or greater) or small (300 seats or less), with little in
between. The largest venues include the University of
Minnesota’s Northrop Auditorium, Orchestra Hall (home of
the Minnesota Orchestra), and the Main Hall at the Ordway
Center and O’Shaughnessy Auditorium at the College of
37 Minnesota State Arts Board, http://www.arts.state.mn.us/about/facts.htm.
Saint Catherine, with 4,769, 2,450, 1,900, and 1,750
seats, respectively.38 (See Appendix, Tables 1 and 2) The
area also features a variety of art museums and galleries,
including the Walker Art Center, the Minneapolis Institute
of Arts, and at least 25 commercial galleries. These venues
may compete with the proposed venue at UMore Park,
but their tenants represent prospective performers for the
subject site.
The past five years have seen tremendous expansion in
the Twin Cities’ arts facilities. In April 2004, the Walker
Art Center completed an expansion and renovation of its
galleries by Herzog and de Meuron. The facilities now
include eleven galleries and a performance space for
contemporary visual and performance artists. Likewise,
the Minneapolis Institute of Arts currently is constructing
a new wing that will add 34 new galleries and expand its
exhibition space by 40%. In October 2005 the Children’s
Theater Company also completed a $24 million expansion.
On the performing arts side, the acclaimed Guthrie Theater
will relocate from its current site near Loring Park to a new
$125 million theater overlooking the Mississippi River in
June 2006.
In addition to expansions of existing cultural institutions,
the new artistic ventures have developed in the Twin Cities.
In 2002, an area businessman founded the Museum of
Russian Art to showcase his personal collection of Soviet-
era art. It recently moved to a renovated church structure
in south Minneapolis.39 In addition, the newly-founded
Minnesota Shubert Performing Arts and Education Center
currently is undertaking the relocation and redesign of the
historic Shubert Theatre in downtown Minneapolis. The new
Shubert Performance Center will host dance performances
and support the region’s burgeoning dance community,
in addition to providing performance, rehearsal and
administrative offices for Minnesota arts organizations.40
38 Minnesota State Arts Board, http://www.mnarts.us/space_action.cfm.
39 “New Museum Showcases Russian Art,” ExploreMinnesota.com, August 9, 2005. http://www.exploreminnesota.com/9Aug200510.html
40 The Minnesota Shubert Performing Arts and Education Center, http://www.minesotashu-bert.org/Vision/Vision.htm

CHAPTER 4 PROGRAM AND PHYSICAL PLAN OPTIONS 159
Finally, there are a variety of large-scale, indoor and
outdoor venues for music and other performances. In
the cities of Minneapolis and St. Paul alone, there is an
amphitheater, two arenas and two stadiums. Each of these
hosts performances by renowned musicians and artists as
well as athletic contests. These sites may compete with a
Rosemount venue because they capture a significant part
of the arts-going population – especially among the younger
generations – but a facility at UMore Park could fill market
gaps that these venues are missing, or provide better
facilities for similar events. Further analysis is required to
determine the extent of opportunities in this area.
Regional Support for the Arts: Foundations
Foundations and arts organizations throughout the Twin
Cities region support and utilize the area’s creative
facilities. In 2004, the National Endowment for the Arts
gave $3.5 million and the Minnesota state government
gave approximately $17.2 million to the arts. In addition,
more than 135 private foundations give money to arts
organizations in the state, the most prominent of which
include the McKnight Foundation, Bush Foundation, Jerome
Foundation, Target Foundation and Corporation, General
Mills Community Action, and Minneapolis Foundation. 250
corporations also support the arts by participating in the
Minnesota Keystone Program, through which they donate
2-5% of their pretax profits to the community.41
Compositely, Minnesota grant makers gave $112 million to
arts, culture and humanities organizations in 2003. 39% of
this money went to performing arts organizations, and 23%
went to museums. Another 10% went to arts and cultural
organizations.42 Arts grants represented 13% of all grant
funding in the state, the same percentage as was given
nationwide.
41 Minnesota Citizens for the Arts, http://www.mtn.org/mca/factspgs/mnsluvarts.html#Summary
42 “Minnesota Arts Grantmaking,” Minnesota Council on Foundations, 2006. http://www.mcf.org/mcf/giving/reports/arts03.pdf
Regional Support for the Arts: Artists Networks and Organizations
While public and private funding provide a foundation
for artistic efforts, it is the arts organizations themselves
that make the Twin Cities arts scene vibrant. The region is
home to 66 theaters and theater companies, 28 musical
performing groups and more than 12 dance companies.43
Thousands of writers also call the region home.
A number of unique, non-profit organizations support
and augment these arts groups and individuals. Artspace
Projects, Inc. strives to create, foster and preserve
affordable space for artists and arts organizations by
redeveloping warehouse buildings into artists live/work space
in Minneapolis. It is now the nation’s leading non-profit real
estate developer for the arts.44 Another unique non-profit
supporting Twin Cities artists is Open Book. Members of the
Loft Literary Center, Milkweed Editions and the Minnesota
Center for Book Arts founded Open Book in 2000 to
support the region’s writing community. Located in a former
factory near downtown Minneapolis, Open Book contains a
performance hall and exhibition gallery, a resource library,
classrooms and individual studios for writers, as well as
book printing facilities. It is the first facility in the nation
dedicated to literary arts.45
St. Paul has a thriving art community as well, which can be
attributed to the dedication and involvement of individual
artists, supporting foundations, private owners, as well as
growing interest from the City. The St. Paul Art Collective
organizes the Art Crawl – a self-guided tour of almost 200
artists’ studios in 22 buildings in downtown St. Paul and
Lowertown. The Art Crawl has been an annual event since
1991 and draws about 14,000 people during the event’s
3-day period. The growth of the art community in St. Paul
Springboard for the Arts’ – a non-profit whose mission is to
cultivate a vibrant arts community by connecting artists with
the skills, contacts, information and services they need to
make a living and a life, is also based in St. Paul.
43 Explore Minnesota, http://www.exploreminnesota.com/Attractions and “A Home for the Performing Arts,” The Minnesota Shubert Performing Arts and Education Center, http://www.minnesotashubert.org/minnesotashubert/archives/mns_article_2.pdf
44 Artspace Projects, Inc., http://www.artspaceusa.org/about/
45 Open Book, http://www.openbookmn.org/.
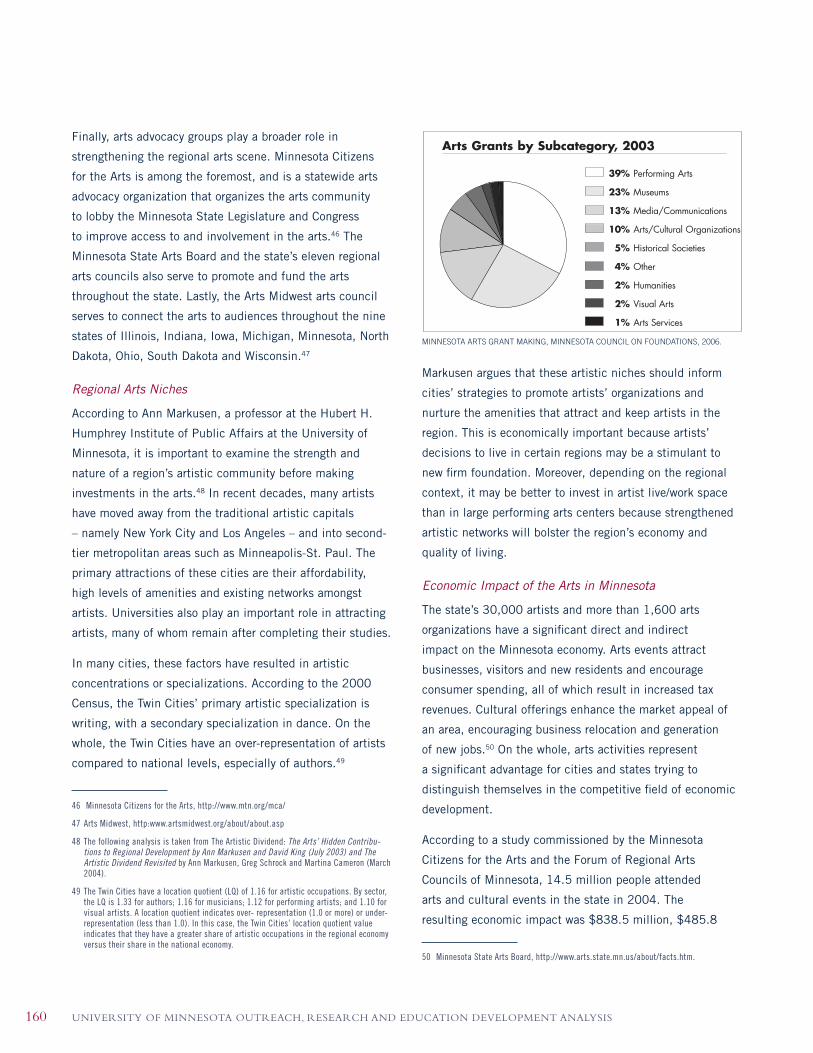
UNIVERSITY OF MINNESOTA OUTREACH, RESEARCH AND EDUCATION DEVELOPMENT ANALYSIS160
MINNESOTA ARTS GRANT MAKING, MINNESOTA COUNCIL ON FOUNDATIONS, 2006.
Finally, arts advocacy groups play a broader role in
strengthening the regional arts scene. Minnesota Citizens
for the Arts is among the foremost, and is a statewide arts
advocacy organization that organizes the arts community
to lobby the Minnesota State Legislature and Congress
to improve access to and involvement in the arts.46 The
Minnesota State Arts Board and the state’s eleven regional
arts councils also serve to promote and fund the arts
throughout the state. Lastly, the Arts Midwest arts council
serves to connect the arts to audiences throughout the nine
states of Illinois, Indiana, Iowa, Michigan, Minnesota, North
Dakota, Ohio, South Dakota and Wisconsin.47
Regional Arts Niches
According to Ann Markusen, a professor at the Hubert H.
Humphrey Institute of Public Affairs at the University of
Minnesota, it is important to examine the strength and
nature of a region’s artistic community before making
investments in the arts.48 In recent decades, many artists
have moved away from the traditional artistic capitals
– namely New York City and Los Angeles – and into second-
tier metropolitan areas such as Minneapolis-St. Paul. The
primary attractions of these cities are their affordability,
high levels of amenities and existing networks amongst
artists. Universities also play an important role in attracting
artists, many of whom remain after completing their studies.
In many cities, these factors have resulted in artistic
concentrations or specializations. According to the 2000
Census, the Twin Cities’ primary artistic specialization is
writing, with a secondary specialization in dance. On the
whole, the Twin Cities have an over-representation of artists
compared to national levels, especially of authors.49
46 Minnesota Citizens for the Arts, http://www.mtn.org/mca/
47 Arts Midwest, http:www.artsmidwest.org/about/about.asp
48 The following analysis is taken from The Artistic Dividend: The Arts’ Hidden Contribu-tions to Regional Development by Ann Markusen and David King (July 2003) and The Artistic Dividend Revisited by Ann Markusen, Greg Schrock and Martina Cameron (March 2004).
49 The Twin Cities have a location quotient (LQ) of 1.16 for artistic occupations. By sector, the LQ is 1.33 for authors; 1.16 for musicians; 1.12 for performing artists; and 1.10 for visual artists. A location quotient indicates over- representation (1.0 or more) or under-representation (less than 1.0). In this case, the Twin Cities’ location quotient value indicates that they have a greater share of artistic occupations in the regional economy versus their share in the national economy.
Markusen argues that these artistic niches should inform
cities’ strategies to promote artists’ organizations and
nurture the amenities that attract and keep artists in the
region. This is economically important because artists’
decisions to live in certain regions may be a stimulant to
new firm foundation. Moreover, depending on the regional
context, it may be better to invest in artist live/work space
than in large performing arts centers because strengthened
artistic networks will bolster the region’s economy and
quality of living.
Economic Impact of the Arts in Minnesota
The state’s 30,000 artists and more than 1,600 arts
organizations have a significant direct and indirect
impact on the Minnesota economy. Arts events attract
businesses, visitors and new residents and encourage
consumer spending, all of which result in increased tax
revenues. Cultural offerings enhance the market appeal of
an area, encouraging business relocation and generation
of new jobs.50 On the whole, arts activities represent
a significant advantage for cities and states trying to
distinguish themselves in the competitive field of economic
development.
According to a study commissioned by the Minnesota
Citizens for the Arts and the Forum of Regional Arts
Councils of Minnesota, 14.5 million people attended
arts and cultural events in the state in 2004. The
resulting economic impact was $838.5 million, $485.8
50 Minnesota State Arts Board, http://www.arts.state.mn.us/about/facts.htm.
Arts Grants by Subcategory, 2003
39% Performing Arts
23% Museums
13% Media/Communications
10% Arts/Cultural Organizations
5% Historical Societies
4% Other
2% Humanities
2% Visual Arts
1% Arts Services

CHAPTER 4 PROGRAM AND PHYSICAL PLAN OPTIONS 161
million of which was direct income generated by cultural
organizations, and $352.7 million of which was indirect
income generated by audiences’ event-related spending.
This cultural income supported 22,095 jobs, generated
$631.1 million in household income to local residents, and
delivered $94.1 million to state and local government.51
While the arts have a significant impact throughout
Minnesota, the Twin Cities metro area has an especially
robust culture economy. In 2004, arts organizations and
their audiences generated $719.5 million and created
19,000 jobs. This provided $568.7 million in income to
the area’s residents and generated over $79 million in tax
revenue for state and local governments. Beyond ticket
prices, audience members spent $22.58 per person on
average at each event they attended. One-fifth of all event
attendees lived outside of the Twin Cities’ seven county
metro area.52
As these statistics would indicate, the majority of cultural
economic support comes from within the Twin Cities
metropolitan region. However, the arts play a critical
role in attracting tourists and fueling the local tourist
industry. Indeed, five of Minnesota’s top tourist attractions
– the Walker Art Center, Guthrie Theater, Ordway Center,
Orchestra Hall, and the Children’s Theatre – are arts
organizations. These cultural tourists spend more than 30%
more per trip than the average traveler.53
Performing Arts TrendsIn addition to regional statistics on the arts, it is important
to use national trends to evaluate the potential success
of an arts and culture center at Rosemount. The following
section outlines a number of key findings.
Shrinking Size of Arts Organizations
According to a comprehensive overview of the performing
arts commissioned by the Pew Charitable Trusts in 1999
51 “The Arts: A Driving Force in Minnesota’s Economy,” Minnesota Citizens for the Arts and the Forum of Regional Arts Councils of Minnesota (2006), i-iii.
52 Ibid., xx, xxii.
53 On average, cultural tourists spend $614 per trip versus $425 for other tourists. Min-nesota State Arts Board, http://www.arts.state.mn.us/about/facts.htm
titled, “The Performing Arts in a New Era”, there has been
a recent flood of small organizations with low operating
budgets. Data from the National Center on Charitable
Statistics indicate that the number of non-profit arts
organizations in Minnesota grew at an average of about
7% each year from 812 organizations in 1996 to 1,466
organizations in 2005, just under nationwide growth of 8%
over the same time period.
Decreasing Number of Artists
Over the last two decades, the percentage of arts
professionals in the labor force grew from 0.9% in 1980
to 1.4% in 2000. According to the Americans for the Arts
Creative Industries report, over 58,000 Minnesota residents
are working in the arts in 2006, an estimated decrease
of 7% over the previous year. Nationwide, the number of
people working in the arts decreased by 3%.54 This contrasts
with the growth that occurred in the United States between
1970 and 1990, when the number of self-proclaimed
professional artists doubled to 1.6 million, 261,000 of
which were performing artists.
Generally speaking, performing artists earn considerably
less and experience higher unemployment than other
professionals with comparable education levels. A select
number of “superstars” tend to capture a significant portion
of the arts market income.
Disparate Audiences
Large and small arts organizations tend to target very
different constituencies. Large performing arts organizations
will often use marketing strategies that prioritize
blockbuster productions, popular artists and sellout
audiences. Small organizations increasingly rely on niche
programming that targets small, local audiences.
Steady Audience Participation
According to “The Performing Arts: Trends and Their
Implications”, a report by the non-profit research
54 Creative Industries is composed of arts-centric businesses that range from non-profit museums, symphonies, and theaters to for-profit film, architecture, and advertis-ing companies. It excludes industries such as computer programming and scientific research—both creative, but not focused on the arts.

UNIVERSITY OF MINNESOTA OUTREACH, RESEARCH AND EDUCATION DEVELOPMENT ANALYSIS162
organization RAND, there has been an increase in
attendance levels at live performances throughout the past
few decades. Unfortunately, much of the increase correlates
to population growth and the share of the population
attending live performances has not actually increased.
Increasing education levels should create more demand for
the arts, since higher educational attainment is correlated
to higher performing arts attendance rates. However,
Americans increasingly are turning to entertainment options
such as museums and at-home entertainment which give
them greater flexibility and convenience. This is especially
true for the younger generations, and may mean that
the performing arts will come under increasing financial
pressure in the future. Ethnic diversity also may impact the
future of the performing arts. Since 40% of the population
growth in the United States comes from immigration, this
will certainly have an affect on artistic tastes.
The results of the most recent National Endowment for the
Arts (NEA) 2002 Survey of Public Participation in the Arts
(SPPA) found that 39% of Americans 18 years or older
– roughly 81 million people – attended a jazz or classical
music concert; went to an opera, musical, play, or ballet;
or visited an art museum at least once in 2002.55 Echoing
the RAND study, the NEA found that, as the population has
increased, the total percentage of the population attending
performances has remained fairly constant. On the positive
side, the NEA SPPA survey indicates that participation in
the arts increased from 4% to 16% between 1982 to 1997.
Uncertain Future for Middle Tier Organizations
Moving forward, the biggest change in the performing arts
industry, according to The Performing Arts in a New Era,
will be in the middle tier of non-profit arts organizations,
particularly opera companies, symphony orchestras, ballet
companies, and theater groups located outside major metro
areas. Reductions in demand, rising costs, and static or
decreasing funding will force these institutions either to
become larger and more prestigious, or to become smaller
55 These data are based on a nationwide sample of 17,135 people 18 years old and above.
and more community-oriented, using local talent to keep
costs down and adapting programming to local audiences.
Cost-Benefit Analysis of the Performing Arts Over the past decade, there have been many studies
conducted about the real value of the performing arts,
especially of non-profit theaters, ballet, opera, and classical
music organizations. The studies recognize that these
organizations have positive social, cultural and economic
impacts on communities. To quantify the economic impacts,
the following section conducts a cost-benefit analysis of the
performing arts. To do so, it looks beyond the bottom line of
individual organizations or venues and analyzes the overall
viability and real economic impact of arts and cultural
organizations as a whole.
Driven by Demand
The amount of demand for the performing arts defines their
role in the community. However, demand encompasses
more than audience attendance. Those who participate in
the arts do so in a variety of ways that include attendance,
participation, and support through either donations of
time and or money. Of course, these different types
of involvement can, and often do, overlap. Analysis of
participation in the arts also depends on the definition of
what performing arts are. Putting all these factors together
sheds light on who participates in the performing arts and
what drives demand.
Influences on Participation
The performing arts, as defined by the NEA, traditionally
include jazz; classical music; opera; musical theater;
professional, amateur and community theater; ballet; and
other dance. Using this definition, a study commissioned
by the Pew Charitable Trusts entitled “The Performing Arts
in a New Era” determined demand for the performing arts
industry. The study found that the key factors influencing
patterns of audience participation in the arts are:
• Changes in the size and composition of the population

CHAPTER 4 PROGRAM AND PHYSICAL PLAN OPTIONS 163
• Preferences for the arts and art forms
• Practical considerations such as supply, cost, time,
income and knowledge
• Individual experience, including education and/or prior
arts experience
Traditional theories have held that education is the largest
influence in predicting participation in the arts – the
higher the levels of education, the higher the levels of
participation, especially within the performing arts. This
correlation has begun to break down in recent years. Other
factors impacting arts attendance include age and gender.
Beyond Traditional Definitions of the Arts
Moving away from the traditional definition of the arts gives
insight into current participation in the arts and America’s
changing tastes. The Urban Land Institute released a series
of reports in 2002 entitled Building Arts Participation:
New Findings in the Field based on the 1998 Community
Partnerships for Cultural Participation (CPCP) Survey. In
their comparative study, the traditional definition of the arts
was expanded to include ‘popular’ styles such as reggae
music, puppet theater and ethnic dance, as well as the
visual arts.
Using the broader, expanded definition of the arts, the CPCP
study found that 61% of people who attended arts and
cultural events attended a wide array of programs, while
only 39% attended programs that fell into the traditional,
narrow definition of the arts. This broader definition has a
large impact on participation. Whether through personal
engagement, involvement with their children, volunteering
or financial contribution, 80% of respondents that attended
the broader array of live performances participated in some
other way in cultural activities. Contrary to the popular
belief that larger venues are more popular, respondents
identified community facilities as the top place they
attended arts and cultural programs. Open-air venues and
locations at college and university campuses captured 69%
and 56% of respondents, respectively.
The Urban Institute study demonstrates that the taste
for the arts is changing across the country and that the
traditional definition of the arts does not sufficiently
indicate demand for performing arts venues. The array
of cultural programs has expanded to cover all walks of
life from all backgrounds. Whereas traditional art forms
depend on a wealthy, well-educated constituency, a broader
definition that includes ethnic and popular cultural themes
encompasses a much larger demographic.
Financial Feasibility of the Performing Arts
RAND’s report “The Performing Arts in a New Era”, suggests
that traditional performing arts will never be able to support
themselves entirely on revenue and that the system of
governmental support for the arts has begun to collapse in
recent years. While the validity of these statements may
be questionable, it seems certain that live performing arts
venues are typically not profit-making enterprises.
Non-Profit Versus For-Profit Performing Arts Groups
It is important to note that not all live performing arts
organizations are non-profit and that there is some
difference in the revenue streams between for-profit and
non-profit groups. Most notably, for-profit organizations are
commercial institutions that must rely solely on revenue and
earnings for operation. This earned income comes from the
same sources as non-profit groups: ticket sales, rental fees,
investments, and concessions.
The big difference in the non-profit organizations is the
receipt of unearned income – income from grants and other
contributions. The largest form of contribution comes from
indirect government subsidies, including foregone taxes and
property gifts. Federal, state and local governments also
make direct contributions to non-profit organizations through
grants and foundations like the National Endowment for the
Arts. The tax status of non-profit organizations also enables
them to receive tax-deductible donations from private
parties. Finally, individuals contribute unearned income
by volunteering.

UNIVERSITY OF MINNESOTA OUTREACH, RESEARCH AND EDUCATION DEVELOPMENT ANALYSIS164
The Income Gap: Earned Versus Unearned Income
While unearned income may seem like a great benefit to
non-profit arts establishments, it creates an income gap
within organizations. Since all companies, profit or non-
profit, must operate within their budget constraints, the
difference between earned income and unearned income
creates not only an instability but a dependence on outside
sources of funding. Often the success of a non-profit
organization depends on their ability to mitigate dependence
on unearned income streams though grant writing and
fundraising, tight budgeting, and cost control.
The disparity between income sources is not constant
across arts, however. Census data shows that, on average,
opera companies had an earnings gap of $1.6 million. This
is substantially different than other music groups, which
had an average gap of only $78,000. As a percentage, the
importance of earned income is fairly constant, ranging from
about 50 to 65% of organizational budget totals. Money
to fill this budgetary gap comes from the government,
foundations, individuals and private business. Interestingly,
direct government support on average amounts to only 5%.
Performance Anxiety
While earned income is an important part of the performing
arts, its percentage of total income has remained stable
despite increases in ticket prices. For instance, even
though ticket prices have gone up as much as 70% for
symphonies over ten years, earned revenue has not gone up
as a percentage of total revenue. This is mostly due to the
increase in large donations by private individuals. However,
the stable earned income numbers mean that non-profit
organizations are still just as dependent as ever on
unearned income.
The for-profit sector has not fared much better. Two-thirds of
commercial movies lose money, 70% of theater productions
end up in the red, and nine out of ten commercial record
deals fail to break even. So, while the financial situation
of the non-profit sector has gone unchanged for the most
part, the for-profit sector has experienced consolidation,
contraction, increasing competition and technological
advances that pose an even greater question of
future viability.
Theater TrendsEvery year, the Theatre Communications Group (TCG)
publishes an annual survey that reports on the performance,
practice and state of non-profit theaters in the United
States. This survey includes a five-year projection for 92
theaters across the country as well as an in-depth survey of
the overall state of 198 theaters. Covering earned income,
contributions, change in unrestricted net assets (CUNA),
attendance, performances and pricing, the TCG survey gives
an accurate, up-to-date picture of financial performance of
the non-profit theater industry.
Income and Expenses
The latest edition of this survey, Theatre Facts 2004, shows
that increases in earned income for the non-profit theater
sector did not keep pace with rising expenses from 2000
to 2004. As a whole, earned income outpaced inflation
by 3.1%, while expenses grew at a rate of 8.9% above
inflation.
Contributed income was a huge factor during this same five-
year period, growing at an annual rate of 20.1% after being
adjusted for inflation. The growth in gifts from individuals
was the largest and totaled 84%. State and federal funding
grew at 1% and 45% respectively, while average local
funding fell 39%. Overall, total growth in income outpaced
expenses by 1.4% from 2000 to 2004.
Attendance/Performances/Pricing
Attendance for the theater sector was not promising,
with a 4% decline from 2000 to 2005. The main area of
growth was children’s shows. While the aggregate number
of performances increased 1.6%, the average single ticket
price grew 14% after inflation.
The Big Picture
Despite rising ticket prices, falling attendance, skyrocketing
expenses and lackluster earned income growth, non-profit
theater in the United States holds some promise. CUNA

CHAPTER 4 PROGRAM AND PHYSICAL PLAN OPTIONS 165
reached a five-year high in 2004 and, thanks to contributed
income, the average theater finished in the black. Large
theaters have been successful in filling capacities, while
mid-sized theaters have struggled. Small theaters remain
absolutely dependent on contributions and have problems
attracting audiences. Overall, government agencies,
corporations, foundations and individuals contributed $1.46
billion to the non-profit theater industry to keep it vibrant
and viable.
Arts and CommunityIn light of the performance of the non-profit and for-profit
arts sectors, it would seem irrational to support the industry
if it did not provide additional benefits. To justify such hefty
outlays of capital to non-profit arts organizations, Americans
for the Arts, along with 91 communities across America,
conducted a study called “Arts & Economic Prosperity”
to identify the impact that these organizations have on
the community and the country. The Urban Institute’s
1998 CPCP report also highlights the economic and social
relationship between arts participation and community
building.
Economic Impact on Communities
The Urban Institute’s study quantified the economic impact
of arts on their communities by examining employment,
household income, and government tax revenue. In fiscal
year 2000, the non-profit arts sector spent an estimated
$53.2 billion dollars in the U.S. economy. This spending
resulted in 2.1 million jobs, $47.4 billion in household
income, and $11 billion in federal, state and local taxes.
These numbers, however, do not include expenditures by
audiences in the region surrounding these arts venues.
Considering that the average non-profit arts attendee spends
about $22.87 above the cost of admission (non-local
attendees spend an average of $38.05) on lodging, meals,
retail, concessions and other items in the community, the
impact of the non-profit performing arts extends beyond
what they themselves spend in the economy.
Putting these two pieces of the puzzle together, the non-
profit arts sector contributes a total of over $134 billion to
the United States economy – an additional $80.8 billion
over what the organizations themselves spend. This added
spending also produces another 2.76 million jobs and
accounts for $42 billion in household income.
To put this into perspective, direct and indirect arts
employment represents well over 1% of the total U.S.
workforce. In 2000 alone, direct expenditures by non-
profit arts organizations accounted for 0.78% of the
total workforce, or 1.14 million jobs. As a whole, all
of this spending also generated another $13.4 billion
in tax revenues for a total of $24.4 billion. Taking into
consideration that federal, state and local government
together contribute $3 billion to support the arts yearly,
this equates to a financial return of more than 8:1. Despite
its lack of financial self-sufficiency, it appears that the
economic benefits of the non-profit arts sector justify their
significant support.
Beyond Economics
In addition to the economic benefits, cultural, educational
and entertainment benefits come along with all types
of arts. Non-profit arts enrich communities culturally as
well as economically. In the Urban Institute Building Arts
Participation report, almost 60% of respondents identified
“Socializing with Family and Friends” as their primary
motivation to attend arts and cultural programs. Frequent
participants in arts and culture are more likely to engage in
civic activities than less frequent participants. People who
attend performances or events also tend to participate in the
arts in other ways, such as engaging in amateur art-making,
involving their children in the arts, and supporting the arts
through volunteering or financial contributions. In fact, about
80% of respondents that attended live events and programs
participated in arts and culture in other ways. Social benefits
from arts participation include personal development, social
cohesion, community empowerment, local image, identity
definition, and health and well-being. 56
56 As suggested by François Matarasso’s report entitled: “Use or Ornament: The Social Impact of Participation in the Arts”, 1997.

UNIVERSITY OF MINNESOTA OUTREACH, RESEARCH AND EDUCATION DEVELOPMENT ANALYSIS166
Concert Trends
Ticketing
According to Billboard Box Scores, ticket sales grew by only
0.2% in 2004 and the concert market continues to compete
with other venues and forms of entertainment, including
at-home entertainment. Many events and entertainment
venues have recently taken a closer look at purchasing
behavior, pricing systems, and seating in an attempt to
improve revenues. For example, Amusement Business
learned that, after buying one high-priced ($200-$300)
ticket, consumers are much less likely to purchase tickets
to future shows and may even skip less expensive shows in
order to save up for the big show. This information has fed
the concert market’s growing confidence in smaller, local/
regional promoters who “know” their audiences and tour at
smaller capacity performing arts facilities.
Furthermore, according to Amusement Business Spotlight
2001, ticket prices have been gradually climbing as a result
of promoters paying more as artist guarantees increase.
A proliferation of venue space and a consolidation of the
companies controlling acts have also driven ticket prices
upward, as more venues are working with fewer promoters to
secure profitable acts.
Marketing
Performing arts organizations are using a multitude of
strategies to alleviate financial pressures in an increasingly
competitive leisure market. On the cost side, this has meant
hiring fewer expensive guest artists and avoiding newer
works. On the income side, it has meant hiring celebrity
artists to attract larger audiences and producing traditional
“warhorse” programs such as the Nutcracker Ballet. As
mentioned above, this has created programmatic variations
among the various-sized organizations. Small commercial,
non-profit, and volunteer organizations are using niche
programming; mid-size organizations are using traditional
programming; and large non-profits are using blockbuster
programming.
Arts organizations have also restructured their marketing
strategies to try to revive ticket sales. According to the
2005 Performing Arts Faculty Administrators Seminar
sessions, most venues are returning to subscription-based
pricing strategies, offering one “mega ticket” that is good
at multiple venues and events; buy-one, get-one-free deals;
or create-your-own subscription series. Common add-ons
include free parking and snack vouchers.
Many venues are also using themes to enhance or re-brand
their image. For example, Clear Channel Entertainment, the
largest outdoor event promoter, adopted a “Music Sounds
Better on Grass” campaign to promote a more casual, social
image for lawn seating, while House of Blues Concerts,
owner/operator of at least 20 arenas and outdoor performing
arts facilities, is keeping ticket prices below $20 and
encouraging customers to bring their own food, blankets,
and chairs. Ravinia Festival will sell two-for-one companion
tickets for selected Chicago Symphony Orchestra concerts
this summer. Other venues have designated “Theater
Thursdays” and singles’ nights to appeal to younger
audiences.
The concert and performing industry is also taking
advantage of the fact that, as noted in Amusement Business
Spotlight 2000, fan development is a cycle that begins
with parents taking their children to shows and continues
as those children grow up and pay their own way to concerts
and sporting events, and then eventually bring their own
children to shows. This cycle of fan loyalty has prompted
some venues to introduce strategies to acquire marketing
data from fans in exchange for concessions and prize
coupons.
Capacity
At the same time that promoters are working on creative
marketing packages, the growing number of small- and mid-
sized venues reflects the increasing number of performers
who can easily sell 2,000 to 5,000 seats. According to
Amusement Business Spotlight 1999, the 5,000-seat and
under venue is increasingly popular for baby boomers. As

CHAPTER 4 PROGRAM AND PHYSICAL PLAN OPTIONS 167
this trend continues to increase, some artists with the ability
to sell out a large venue such as Neil Young and Tina Turner
have instead chosen to play two shows in a smaller venue.
Audiences have responded well to this, and may even prefer
to spend money on a more intimate concert experience.
Despite the challenges of predicting and managing ticket
pricing and venue preferences, artists continue to tour to
increase exposure to fans and media, build revenue, gain
performance experience, do market research, and sell
merchandise. While it is not yet possible to download a live
show, a variety of venues are taking advantage of improving
technology to create podcasts and offer music samples on
their websites.
Case Studies There are a variety of venues to consider programmatically
at UMore Park – the program could include an
amphitheater or similar venue, a multi-purpose theater,
rehearsal and event space for community programs,
educational and/or conference facilities, gallery space, artist
live/work space, or a combination of these. Please see the
following case studies for examples of how some of these
have been incorporated in other places.
Regional Performance Centers
Among other uses, the University of Minnesota could
consider the creation of a regional performing arts center
on the Rosemount site. This development would give arts
groups of all types a venue in which to perform, and would
include open-air and indoor facilities. The following section
outlines precedents for this type of development, including
The Banff Centre in Alberta, Canada; the Chautauqua
Institution in the Southern Tier of New York; Tanglewood
in the Berkshire Mountains of Massachusetts; the Ravinia
Festival in Highland Park, Illinois; and the DTE Energy
Music Theater in Clarkston, Michigan to guide future
discussion of this issue. Please note that these examples are
all longstanding institutions. However, they all started from
smaller programs and expanded to what they are today
over time.

UNIVERSITY OF MINNESOTA OUTREACH, RESEARCH AND EDUCATION DEVELOPMENT ANALYSIS168
BANFF CENTRE
Banff Centre (Banff National Park, Alberta, Canada)Founded in 1933 by the University of Alberta, Department
of Extension, with a grant from the U.S. based Carnegie
Foundation, The Banff Centre began with a single course
in drama. Its success generated additional arts programs
and the Centre became known as the Banff School of Fine
Arts in 1935. While arts programming continued to grow
and flourish, conferences were introduced in 1953 and
management programs in 1954.
Today its four areas of programming include:
• Arts
• Leadership Development
• Mountain Culture
• Conference Services
In 1970, to acknowledge the broader educational role of the
School as well as its move toward a centre of experiment
and innovation, it was renamed The Banff Centre for
Continuing Education (The Banff Centre for short). In 1978,
Alberta government legislation granted The Banff Centre full
autonomy as a non-degree granting educational institution
under the governance of an appointed Board. “The Banff
Centre operates under the authority of the Post Secondary
Learning Act, revised statutes of Alberta 2003, with the
object of providing to the public the opportunity of access
to a broad range of learning experiences.” (Legislative
mandate) All development on the site is subject to approval
by the Town of Banff and is governed by previous studies
undertaken as a course of compliance with the Alberta
Municipal Government Act.
In the mid-1990s, The Banff Centre, along with most
public institutions in Alberta, sustained cuts to its operating
grant. The Centre responded in an entrepreneurial way
and launched a successful capital campaign (The Creative
Edge) to raise funds for state-of-the-art revenue generating
conference facilities, as well as a new Music & Sound
complex. The new facilities opened in 1996–conference
revenues reportedly increased by 30% as a result of these
capital improvements. In the same year, the Centre’s fourth
division, Mountain Culture programming, was created. A few
years later, in 1999, The Banff Centre was recognized as a
National Training Institute by the federal government and
was awarded $3 million over three years for artistic training
programs.
The Banff Centre is located on a 17.6 ha (43+ acre) site
overlooking the Town of Banff and the Bow Valley. Today,
the Centre continues its role as a catalyst for creativity. A
globally respected arts, cultural, and educational institution
and conference facility, The Banff Centre is a leader in
the development and promotion of creative work in the
arts, sciences, business, and the environment.57 It is
also a leader in sustainable design. The Banff Centre is
currently redeveloping the campus in a $100 million master
plan over a 10-year period (approved in January 2005)
to add “greener” stormwater management systems and
landscaping. All new buildings on the campus – including
additions to Donald Cameron Hall and the Sally Borden
Building – will be LEED certified.
Facilities:
Eric Harvie Theatre is the main auditorium for the Banff
complex, and accommodates opera, dance, drama and wide-
ranging music performances, as well as film screenings and
conferences. It has 959 seats.
57 Text taken from Banff Centre website: http://www.banffcentre.ca/about/history/

CHAPTER 4 PROGRAM AND PHYSICAL PLAN OPTIONS 169
Margaret Greenham Theatre is the second theatre space in
the complex. It is a studio space used exclusively for dance,
drama, intimate music events and meetings. It has 246
seats.
Max Bell Auditorium features a modern, 330-seat auditorium
engineered for acoustic excellence and equipped with a 4.5-
meter (15-foot) screen, dimmer lighting, a sound system
and projection booth. This building houses 17 meeting
rooms of varying capacities, as well as a large central foyer
that is ideal for conference registration, receptions or
displays. The entire building is 14,220 sq.ft.
Other Facilities
• The CLUB, a nightclub style venue with 180 seats
• Rolston Recital Hall (200 seats)
• Donald Cameron Hall, which includes a dining hall,
classrooms and administration offices
• Sally Borden Building, which contains athletic and
recreational facilities (swimming pool, gymnasium,
fitness center) and a café
• Glyde Hall, which hosts Walter Phillips Gallery and
studios for Visual Arts programs
• Lougheed Building, which hosts Media and Creative
Electronic Environment programs
• 28 Music Huts, or small practice studios for musicians
• Leighton Colony artist studios
Amenities
• 800 beds for students, staff and faculty
• 500 parking spots
• Bus service from Calgary (2 hours away)
• Shuttle bus service to Banff hotel properties
The Banff Centre is 75% self-reliant, generating revenue
from conference sales, donations, sponsorship, program
grants, and tuition. The Banff Centre is supported
by funding from governmental agencies including
Alberta Advanced Education, Alberta Infrastructure and
Transportation, Alberta Innovation and Science, and the
Alberta Foundation for the Arts. Arts training programs
are supported by funding from the Government of Canada
through the Canadian Department of Heritage and the
Department of Human Resources Development through the
National Arts Training Contribution Program.58
58 Text taken from Banff Centre website: http://www.banffcentre.ca/about/history/
DIMENSIONS AREA CEILING HEIGHT CAPACITIES
Room feet meters sq. ft. m3 feet meters theater banquet reception
Eric Harvie Theater
Stage Dimensions
West Foyer
East Foyer
Lobby
60 x 40
88 x 28
58 x 28
93 x 24
18.3 x 12.2
26.8 x 8.5
17.7 x 8.5
28.3 x 7.1
2400
2464
1624
2195
223
229
151
204
60'
10'7''
10'7''
10'9''
18.0
3.2
3.2
3.3
959
60
50
150
—
50
—
—
—
115
90
100
Eric Harvie Theater
Stage Dimensions
West Foyer
60 x 40
83 x 10
18.3 x 12.2
25.3 x 3.0
2400
830
223
77
7'9''
7'9''
18.0
2.7
246
—
—
—
—
65
The Club 40 x 51 12 x 15.5 2040 187 7'9'' 2.4 — — 125
BANFF CENTRE FACILITIES

UNIVERSITY OF MINNESOTA OUTREACH, RESEARCH AND EDUCATION DEVELOPMENT ANALYSIS170
Chautauqua Institution (Chautauqua, New York)The Chautauqua Institution is a not-for-profit, 750-acre
educational center beside Chautauqua Lake in southwestern
New York State, where approximately 7,500 persons are
in residence on any day during the nine-week summer
season. The Institution welcomes over 170,000 people at
its scheduled events. Over 8,000 students enroll annually
in the Chautauqua Summer Schools which offer courses in
art, music, dance, theater, writing skills and a wide variety
of special interests.
Today its four areas of programming include:
• Arts
• Education
• Religion
• Recreation
The Institution, originally the Chautauqua Lake Sunday
School Assembly, was founded in 1874 as an educational
experiment in out-of-school, vacation learning. It was
successful and broadened almost immediately beyond
courses for Sunday school teachers to include academic
subjects, music, art and physical education. The
Chautauqua Institution is governed by a 24-member board
of trustees, four of whom are elected by property owners.
The board establishes the policies and direction of the
Institution, electing the officers who are responsible for the
operation of the Institution.59 As per the Institution’s 2005
annual report, the Institution accounts for about 80% of its
revenues from earned revenue.
59 Text modified from Chautauqua Institution website, http://www.ciweb.org/history.html
Facilities:
• The Amphitheater was built in 1893 and is a multi-use
facility that presents over 180 programs each season,
including lectures, symphonic and popular music
concerts, dance performances, and religious services.
The Chautauqua Symphony Orchestra performs three
concerts a week in the Amphitheater in summer months.
It has pew-style seating for 4,500, bleacher seating for
500, and choir-loft seating for 300.
• Bellinger Hall includes a dormitory with 250 beds, a
conference center and cafeteria, and 5 meeting rooms
• Hall of Christ is a worship hall with 225 seats, which
also hosts chamber music concerts, recitals and film
screenings
• Hall of Philosophy is a lecture hall with 600 seats
• The Elizabeth S. Lenna Hall opened in 1993 and
hosts recitals, chamber music concerts and other
performances. The hall is approximately 8,000 square
feet and its interior height measures 50 ft. from floor to
peak. It has 500 seats.
• McKnight Hall hosts recitals and rehearsals and has
100 seats.
• 140-seat Normal Hall is for performances by the
Chautauqua Conservatory Theater.
• Norton Memorial Hall has 1,365 seats and hosts
concerts by the Chautauqua Opera.
• Smith-Wilkes Hall is a 425-seat venue for chamber
music, recitals, lectures and film screenings.

CHAPTER 4 PROGRAM AND PHYSICAL PLAN OPTIONS 171
CHAUTAUQUA INSTITUTION
Other Amenities
• Smith Memorial Library
• School of Art
• School of Dance
• School of Music
• Theater Conservatory
• Special Studies
• Children’s School (early childhood education center)
• Boys’ and Girls’ Club (summer day camp)
• Youth Activities Center
• College Club
• Chautauqua Literary and Scientific Circle Book Club
• Sailing center
• Chautauqua Golf Course (36 holes)
• Tennis center (12 courts)
• Two fitness centers
• Four public beaches

UNIVERSITY OF MINNESOTA OUTREACH, RESEARCH AND EDUCATION DEVELOPMENT ANALYSIS172
TANGLEWOOD
Tanglewood (Lenox, Massachusetts)Site Acreage: Total-750 acres. Main property-225 acres
In August 1934, a group of summer residents of the
Berkshires organized a series of three outdoor concerts by
members of the New York Philharmonic. The venture was
so successful that the promoters incorporated the Berkshire
Symphonic Festival and repeated the experiment during the
next summer. The Festival Committee then invited Serge
Koussevitzky and the Boston Symphony Orchestra to take
part in the 1936 concerts. Following the BSO’s success, the
Tappan family offered their 210-acre estate, Tanglewood,
as a gift to Koussevitzky and the orchestra. The offer was
accepted, and the first Tanglewood concert took place
on August 5, 1937. The first permanent structure on the
site – the Music Shed, designed by Eliel Saarinen – was
inaugurated in August 1938, and the Boston Symphony
Orchestra has played there nearly every summer since.
In 1986, the Boston Symphony Orchestra acquired the
Highwood estate adjacent to Tanglewood and expanded the
public grounds by 40%. To unite the properties and update
the concert facilities, they opened Seiji Ozawa Hall in 1994.
This venue accommodates student concerts, recitals and
chamber music concerts offered by the Boston Symphony
Orchestra throughout the summer.
Today Tanglewood annually draws over 350,000 visitors.
In addition to the Boston Symphony Orchestra, there are
weekly chamber music concerts, Prelude concerts and Open
Rehearsals, the annual Festival of Contemporary Music,
and almost daily concerts by the gifted young musicians of
the Tanglewood Music Center. The Boston Pops Orchestra
appears annually, and in recent years the Tanglewood
Jazz Festival has been added to close the summer. The
season offers not only a vast quantity of music, but also
a vast range of musical forms and styles, all presented
with a regard for artistic excellence that makes the festival
unique.60
The Tanglewood Music Center (TMC) provides a unique,
in-depth musical experience for emerging professional
musicians of exceptional ability. Participants in the program,
who all attend as Fellows of the Music Center (with costs of
tuition, room and board covered by their Fellowships), work
with internationally renowned artists, including members
of the Boston Symphony, resident faculty, and guests. The
Fellowship Program is designed for experienced musicians
who have completed much or all of their formal instruction,
and who will benefit from and contribute most to the very
intense and demanding projects undertaken at the Center.
The sole criterion for admission is musical excellence. While
there is no strict upper age limit, preference is normally
shown to those between the ages of 18 and 30. The TMC
presents over 40 additional concerts throughout the season,
presenting orchestra, opera, chamber music and vocal
programs, and including a new music festival in its multiple
onsite venues. Today, 20% of the members of American
symphony orchestras and 30% of first-chair players are
alumni of the Tanglewood Music Center. Also offered at
Tanglewood for younger artists ages 15-18 are the programs
of the Boston University Tanglewood Institute (BUTI), two-to
eight-week programs June 18-August 12.61
60 Text from Tanglewood website, http://www.tanglewood.org/itemB/detail.jhtml?id=600029&area=tgl
61 text from http://www.bso.org/genC/genCone.jhtml?id=cat50084&area=edu

CHAPTER 4 PROGRAM AND PHYSICAL PLAN OPTIONS 173
Facilities (fixed seats):
Koussevitzky Music Shed 5,100 seats
Seiji Ozawa Hall 1,200 seats
Chamber Music Hall 300 seats
Theatre-Concert Hall N/A
Other Facilities and Amenities
• Tanglewood Music Center (BSO’s Academy for Advanced
Musical Study for 150 emerging professional artists)
• Highwood Manor House
• Hawthorne Cottage
• Visitor Center
• Two cafés and Two gift shops
• Formal gardens
• Onsite caterer
• Tents for special events
• Round-trip bus service from Boston on Friday and
Saturday nights
The Boston Symphony Orchestra is reportedly the world’s
largest orchestral operation, and the fourth-largest
performing arts institution in the country. The Boston
Symphony Orchestra presents 21 concerts and the Boston
Pops Orchestra presents another 60 events at Tanglewood
during the summer season. It is estimated that the BSO
generates $70 million for Berkshire County during the ten
weeks it is in residence at Tanglewood. Approximately two-
thirds of the BSO’s total revenues, including those from
Tanglewood, are from earned revenue.
According to the BSO’s 2003 tax statement, about 70% of
Tanglewood’s visitors are from outside Massachusetts. In
recent years Tanglewood ticket sales have declined due to
a softening in the tourism industry as well as poor weather
conditions. Nonetheless, Tanglewood remains an important
part of the regional arts economy and anchors the growing
number of cultural institutions in western Massachusetts,
including the Massachusetts Museum of Contemporary Art,
Hancock Shaker Village, the Clark Art Institute and the
Berkshire Museum.

UNIVERSITY OF MINNESOTA OUTREACH, RESEARCH AND EDUCATION DEVELOPMENT ANALYSIS174
RAVINIA FESTIVAL
Ravinia Festival (Highland Park, Illinois)Located in Highland Park, the non-profit Ravinia Festival
Association offers an inexpensive way to hear top performers
in the summer season. Since 1936, Ravinia has hosted
the Chicago Symphony Orchestra in summer residence and
offers a variety of other performances. It also operates The
Steans Institute for Young Artists (SIYA). Five programs
comprise the Institute’s summer season: the program for
jazz; the classical programs for piano and strings, and for
vocal chamber music; and for singers; and the Sandra K.
Crown Program for American Classic Music Theater. In each
of the programs, young artists study with an internationally
renowned faculty of artist-teachers, participate in concerts
given as part of Ravinia’s summer programming and
attend Ravinia concerts.62 Outside the summer season,
the organization presents its Rising Stars concert series
October through May in Bennett-Gordon Hall, featuring the
best young artists in classical music. Ravinia has identified
community outreach and education initiatives as its key
missions. The Festival runs programs in 24 inner-city
schools throughout Chicago and will soon move into other
under-served areas. In 2003, Kauffman launched One
Score, One Chicago, based on One Book, One Chicago as a
means of generating community-wide interest in classical
music.
Facilities
• The Pavilion has 3,200 covered fixed seats and
an extensive lawn area that can accommodate an
estimated 10,000 to 15,000 attendees who can hear
62 Text from Ravinia website: http://www.ravinia.org/Steans/Steans.aspx
the performance through a high-quality speaker system
throughout the park’s lawn area.
• Martin Theatre, an indoor venue, seats 850 and is used
for chamber music performances and recitals
• Bennett-Gordon Hall, another indoor venue, seats 450
and is used for Steans Institute concerts and a few
select dance recitals and workshops.
The Ravinia Festival season typically runs from June
to September (about 105 days) with 120 total event
performances (on all three stages). Between 40% and
50% of events at Ravinia take place at the main pavilion.
According to ERA interviews and the Festival’s annual
report, attendance in 2005 was a record 600,000+ people,
with 6 sell-out shows. Gross ticket revenues in 2005 were
close to $11.3 million, an increase of nearly $1 million
from $10.3 million the previous year. An additional $9.4
million was raised from the Illinois Arts Council and
private contributors. As the summer home for the Chicago
Symphony Orchestra, Ravinia Festival also hosts a variety
of entertainers that range in style and audience following.
The 2005 season included performances by Aretha
Franklin, Hootie and the Blowfish, and Garrison Keillor.
Tickets range from $5 to $15 for lawn seats, and up to
$80 for top performers such as Tony Bennett. For the 2006
season, Ravinia will use a new promotion to further boost
attendance at CSO events – a new multi-visit discount
card has reportedly generated an increase in sales. Earned
revenue accounts for about 60% of Ravinia’s total revenue.
DTE Energy Music Theater (Clarkston, Michigan)Located in Clarkston, Michigan, in the wealthiest area of
metro Detroit, this amphitheater has a reputation among
customers for being scenic and well planned. The logistics
of ingress, egress, and its 6,000 parking spaces have
eliminated many of the hassles and anxiety that fans
complain about at other venues like the World Theater
and Deer Creek. The rural location and the slightly smaller
capacity contribute to the venue’s success on this score.

CHAPTER 4 PROGRAM AND PHYSICAL PLAN OPTIONS 175
The DTE Energy Music Theater’s total seating capacity is
15,275. There are roughly 7,000 fixed seats. The rest of the
seating capacity is on the lawn.
Previously know as Pine Knob, this venue sold its naming
rights to DTE Energy Company. It is owned and managed
by Palace Sports and Entertainment (PS&E). Open May
to September, on average DTE Energy Music Theater
has approximately 60 to 80 events each summer. This
year’s program includes performances by the Dave
Matthews Band, Ringo Starr, Gin Blossoms, John Michael
Montgomery, The New Cars, Blondie, and Randy Travis. The
performance season lasts roughly 120 days and is heavily
booked. In 2004, 834,000 guests attended DTE Energy
Music Theatre’s 68 shows. In 2005, over 705,000 guests
attended 57 shows (with gross ticket sales of over $13
million). DTE Energy Music Theatre remained the most
attended amphitheatre in the world for the 15th consecutive
year and was listed as the fourth highest drawing concert
venue in the world of any type in 2005, according to the
year-end lists of Pollstar Magazine, a leading entertainment
trade publication.
ConclusionGiven the Twin Cities’ vibrant arts community and the
significant impact it has on the local and regional economy,
as well as the relatively high participation in the arts of the
metro area population, it is worthwhile for the University
to explore development of a cultural development on the
UMore Park site. It is important to note that most arts and
cultural facilities do not sustain their operations solely on
earned revenue. However, arts and culture have potential
links to increased community involvement and quality of
life, and thus may enhance investment in a residential
community at UMore Park as well as the adjacent
communities.
There may be seasonal opportunities for an outdoor venue
at Rosemount given its close proximity to the Twin Cities
metropolitan area. If the University considers a large-scale
performing arts center on the site, it may want to explore
other ways to capitalize on and cultivate the region’s artistic
“clusters” in areas like writing and dance, perhaps by
incorporating artist education or live/work space into its site
plan.
Finally, it is recommended that the University conduct a
more in-depth analysis of regional demand for new cultural
facilities, and financial feasibility for each option, before
moving forward with a development scheme. Based on ERA’s
experience with these projects, it is important to assess the
following to determine the viability of an arts development
at UMore Park :
1. The local and regional demand for new arts venues
(considering the region’s population and economic base,
target demographics, market trends and the performance
of other venues in the Twin Cities metropolitan market).
2. Programmatic options for the new venue (considering
regional arts specialization, compatible uses, site
characteristics and operational plans).
3. The economic viability and impact of the proposed
performance centers given demand and identified
programming (considering the financial impact of
venue-related tourism, funding options and possible
partnerships, and case studies).
By taking these steps, the University will ensure that it
makes an informed decision about whether investing in an
arts and culture center at Rosemount will have long-term
benefits to the University, the city of Rosemount, and the
Twin Cities region as whole.

UNIVERSITY OF MINNESOTA OUTREACH, RESEARCH AND EDUCATION DEVELOPMENT ANALYSIS176
Addendum
TABLE 1. SELECTED PERFORMING ARTS VENUES IN THE TWIN CITIES
Name Disciplines Capacity
The Acadia Café Music, Literature 50
Bryant Lake Bowl TheaterMusic, Dance, Opera, Theater, Media Arts, Literature
85
Pillsbury House Theatre Theater 96
Cedar Riverside People’s Center Theater 100
The Playwrights’ Center Music, Theater, Literature 100
Intermedia Arts Music, Dance, Theater, Media Arts, Literature 115
JDC Studio Theatre/Jawaahir Dance Co. Music, Dance, Theater, Literature 120
Minneapolis Theatre GarageMusic, Dance, Opera, Theater, Media Arts, Literature
146
The Jungle Theater Music, Media Arts, Literature 148
Ballet Arts Minnesota Music, Dance, Opera, Theater 220
Hennepin Center for the Arts Music, Opera, Theater 230
Walker Community Church Music, Dance, Theater 250
Hamline University Music, Dance, Opera, Theater 300
Minnesota History Center Music, Dance, Opera, Theater, Media Arts 314
Hamline University Music, Media Arts, Literature 315
Ordway Center for the Performing ArtsMusic, Dance, Opera, Theater, Media Arts, Literature
315
Fine Arts Center Music, Dance, Opera, Theater 340
Fine Line Music Café Music, Dance, Opera, Theater 400
Fine Arts Center Music, Media Arts, Literature 480
History Theatre Music, Opera, Theater, Media Arts 590
Hollywood/Birdland Theatre Corp.Music, Dance, Opera, Theater, Media Arts, Literature
650
Benson Great Hall Music 1,500
O’Shaughnessy AuditoriumMusic, Dance, Opera, Theater, Media Arts, Literature
1,742
Ordway Center for the Performing ArtsMusic, Dance, Opera, Theater, Media Arts, Literature
1,912
Minnesota Orchestral Association Music 2,450
Northrop Memorial Auditorium Music, Dance 4,769
Source: Minnesota State Arts Board
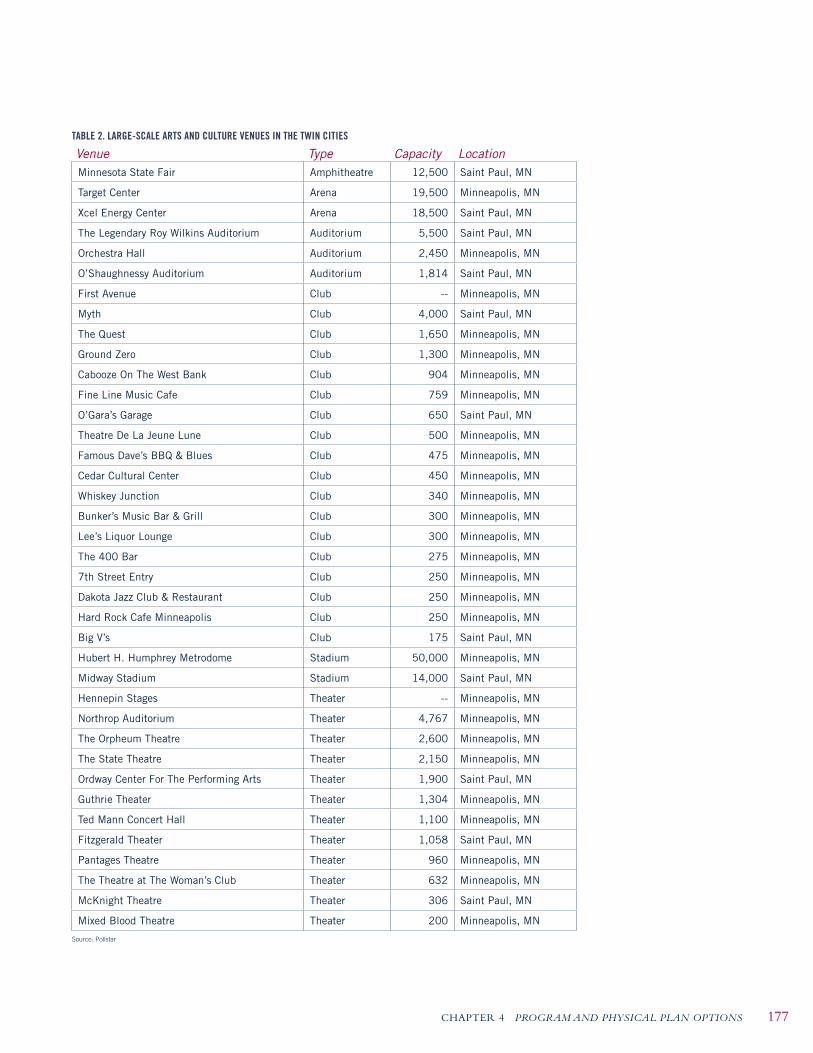
CHAPTER 4 PROGRAM AND PHYSICAL PLAN OPTIONS 177
TABLE 2. LARGE-SCALE ARTS AND CULTURE VENUES IN THE TWIN CITIES
Venue Type Capacity LocationMinnesota State Fair Amphitheatre 12,500 Saint Paul, MN
Target Center Arena 19,500 Minneapolis, MN
Xcel Energy Center Arena 18,500 Saint Paul, MN
The Legendary Roy Wilkins Auditorium Auditorium 5,500 Saint Paul, MN
Orchestra Hall Auditorium 2,450 Minneapolis, MN
O’Shaughnessy Auditorium Auditorium 1,814 Saint Paul, MN
First Avenue Club -- Minneapolis, MN
Myth Club 4,000 Saint Paul, MN
The Quest Club 1,650 Minneapolis, MN
Ground Zero Club 1,300 Minneapolis, MN
Cabooze On The West Bank Club 904 Minneapolis, MN
Fine Line Music Cafe Club 759 Minneapolis, MN
O’Gara’s Garage Club 650 Saint Paul, MN
Theatre De La Jeune Lune Club 500 Minneapolis, MN
Famous Dave’s BBQ & Blues Club 475 Minneapolis, MN
Cedar Cultural Center Club 450 Minneapolis, MN
Whiskey Junction Club 340 Minneapolis, MN
Bunker’s Music Bar & Grill Club 300 Minneapolis, MN
Lee’s Liquor Lounge Club 300 Minneapolis, MN
The 400 Bar Club 275 Minneapolis, MN
7th Street Entry Club 250 Minneapolis, MN
Dakota Jazz Club & Restaurant Club 250 Minneapolis, MN
Hard Rock Cafe Minneapolis Club 250 Minneapolis, MN
Big V’s Club 175 Saint Paul, MN
Hubert H. Humphrey Metrodome Stadium 50,000 Minneapolis, MN
Midway Stadium Stadium 14,000 Saint Paul, MN
Hennepin Stages Theater -- Minneapolis, MN
Northrop Auditorium Theater 4,767 Minneapolis, MN
The Orpheum Theatre Theater 2,600 Minneapolis, MN
The State Theatre Theater 2,150 Minneapolis, MN
Ordway Center For The Performing Arts Theater 1,900 Saint Paul, MN
Guthrie Theater Theater 1,304 Minneapolis, MN
Ted Mann Concert Hall Theater 1,100 Minneapolis, MN
Fitzgerald Theater Theater 1,058 Saint Paul, MN
Pantages Theatre Theater 960 Minneapolis, MN
The Theatre at The Woman’s Club Theater 632 Minneapolis, MN
McKnight Theatre Theater 306 Saint Paul, MN
Mixed Blood Theatre Theater 200 Minneapolis, MN
Source: Pollstar

UNIVERSITY OF MINNESOTA OUTREACH, RESEARCH AND EDUCATION DEVELOPMENT ANALYSIS178
Residential Density | Housing Types
Single Family
Multifamily
Single Family- Low Density
Town House
Residential Density | Area Survey
(Dwelling Units/ Acre)
Following are excerpts from presentations made to the UMore Park Steering Committee during the course of the planning process. This presentation explores the density and program mix that might be constructed at UMore Park.

CHAPTER 4 PROGRAM AND PHYSICAL PLAN OPTIONS 179
Density | .25-1 du/ac Eagan, MN
.9
1 ac
re
Density | 1-3 du/ac West St. Paul
3
3
3
3
1 acre

UNIVERSITY OF MINNESOTA OUTREACH, RESEARCH AND EDUCATION DEVELOPMENT ANALYSIS180
Density | 3-5 du/ac West St. Paul
1ac
re
54
5
Density | 5-8 du/ac South St. Paul1
acre7
8
8
5
66
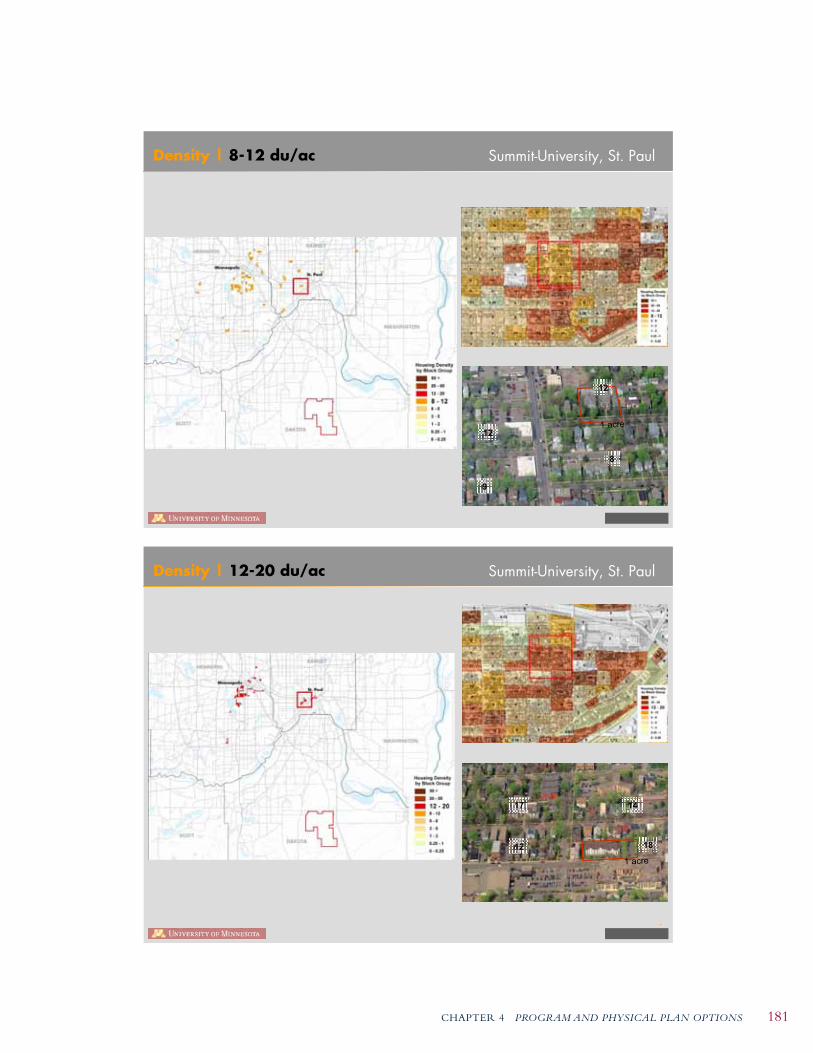
CHAPTER 4 PROGRAM AND PHYSICAL PLAN OPTIONS 181
Density | 8-12 du/ac Summit-University, St. Paul
1 acre
9
12
12
8
Density | 12-20 du/ac Summit-University, St. Paul
17 14
12 18
1 acre

UNIVERSITY OF MINNESOTA OUTREACH, RESEARCH AND EDUCATION DEVELOPMENT ANALYSIS182
Density | 20-50 du/ac Summit-University, St. Paul
37 29
22 4
1 acre
Density | 50+ du/ac Downtown St. Paul
1 acre
62
66
51
69

CHAPTER 4 PROGRAM AND PHYSICAL PLAN OPTIONS 183
Development Capacity | Density Comparison
External Employment
External Retail
Cultural Center
Schools
Internal Retail & Services
Multi-family
Townhouse
Medium Density SF
Low Density SF
45,638100%Multi-family
-0%Townhouse
-0%Medium Density Single Family
-0%Low Density Single Family
UnitsShareUnit Mix
3,860 25%Multi-family
15,440TOTAL
3,860 25%Townhouse
3,860 25%Medium Density Single Family
3,860 25%Low Density Single Family
UnitsShareUnit Mix
Land Use | Concept Plan

UNIVERSITY OF MINNESOTA OUTREACH, RESEARCH AND EDUCATION DEVELOPMENT ANALYSIS184
Land Use | Block Scale
Block Detail
1,200'
1,200
'
Plan Elements | Health and Recreation

CHAPTER 4 PROGRAM AND PHYSICAL PLAN OPTIONS 185
Plan Elements | Greenways
Plan Elements | Nature Preserve
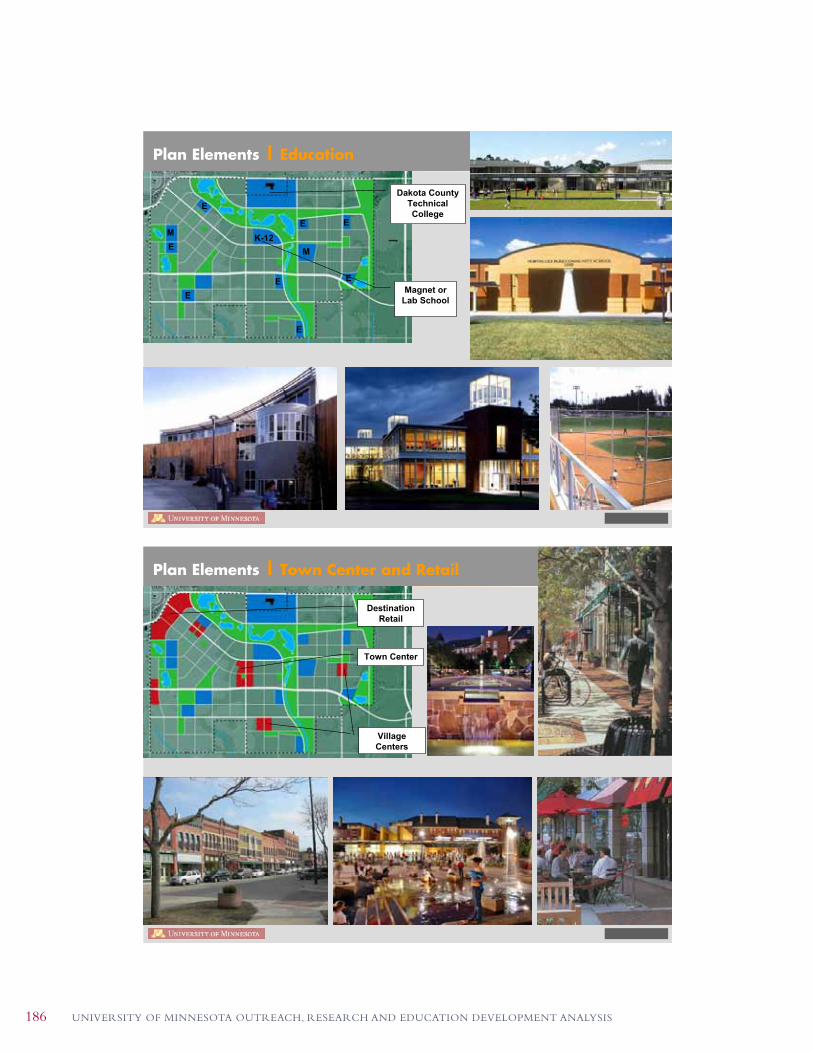
UNIVERSITY OF MINNESOTA OUTREACH, RESEARCH AND EDUCATION DEVELOPMENT ANALYSIS186
Plan Elements | Education
EM
M
E
E
E
E
E
E E
K-12
Dakota County Technical College
Magnet or Lab School
Plan Elements | Town Center and Retail
Destination Retail
Town Center
VillageCenters

CHAPTER 4 PROGRAM AND PHYSICAL PLAN OPTIONS 187
Plan Elements | Cultural Facilities
Cultural Center
ADD PERSON-PAINTING CHAUTAUQUA ONE
Plan Elements | Cultural Facilities
Tanglewood- Lenox, MA
Outdoor Venues

UNIVERSITY OF MINNESOTA OUTREACH, RESEARCH AND EDUCATION DEVELOPMENT ANALYSIS188
Plan Elements | Cultural Facilities
Conference Center
Plan Elements | Cultural Facilities
Interpretive Center

CHAPTER 4 PROGRAM AND PHYSICAL PLAN OPTIONS 189
Plan Elements | Cultural Amenities
Community-Supported Agriculture
Plan Elements | Employment Centers
Research and Development
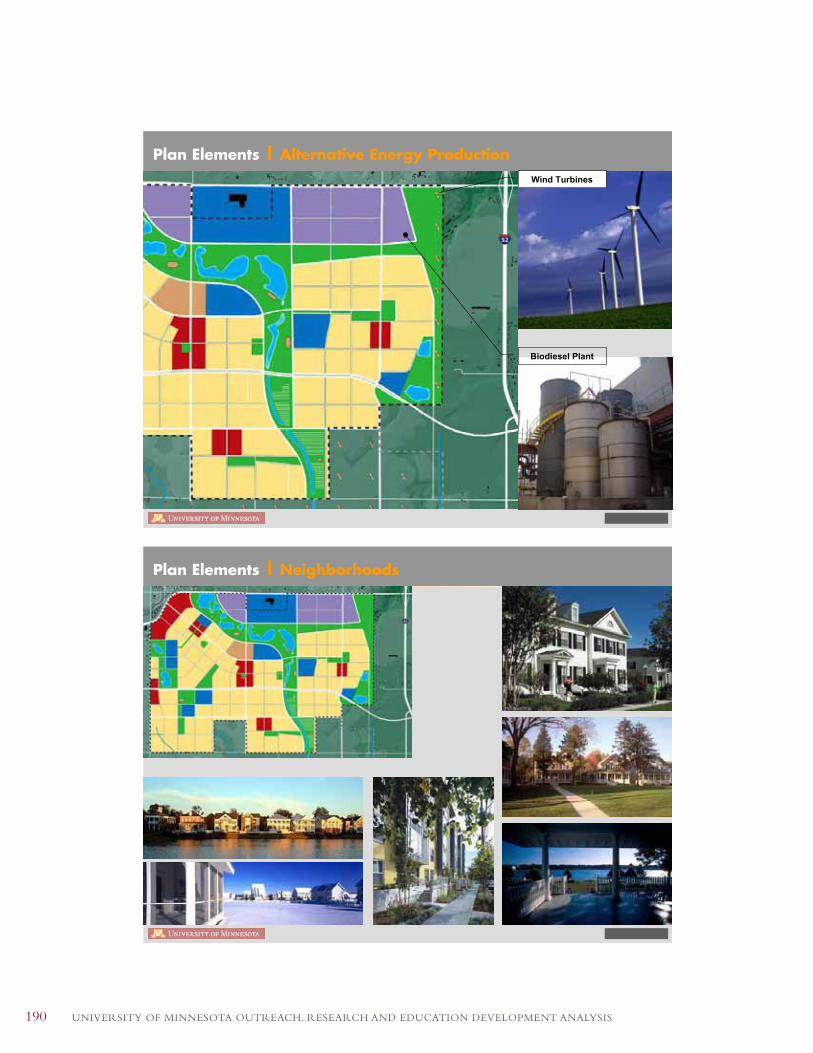
UNIVERSITY OF MINNESOTA OUTREACH, RESEARCH AND EDUCATION DEVELOPMENT ANALYSIS190
Plan Elements | Alternative Energy ProductionWind Turbines
Biodiesel Plant
Plan Elements | Neighborhoods

CHAPTER 4 PROGRAM AND PHYSICAL PLAN OPTIONS 191
Plan Elements | Neighborhoods
UNIVERSITY OF MINNESOTA OUTREACH, RESEARCH AND EDUCATION DEVELOPMENT ANALYSIS192
4.5 UMORE PARK LAND USECAPACITY
A capacity study for UMore Park tested density alternatives
for the site and compared them to existing developments in
the Twin Cities region. The UMore Park Steering Committee
used these comparisons to develop a framework plan to
guide development of UMore Park, and which organizes
development around a central cultural and retail node.
Under this framework, approximately 1,100 acres would be
developed with a large commercial area along County Road
42, a heavy reliance on multi-family housing (thirty dwelling
units per acre), and 270 acres of recreational open space.
The plan showcases a system of connections that link
the site to the newly preserved Empire Wetlands and the
Metro Conservation Corridor. The greenway framework will
determine the layout of its roads and parkway routes, and
the presence of ecological features will help identify ideal
sites for schools, retail nodes and cultural facilities. Finally,
the plan will locate research and development sites on land
not suited for residential development.
Distinct from its examination of market conditions, the
Sasaki Team tested the capacity of the site to understand
potential impacts of the design plan. By manipulating
fixed assumptions derived from national, state, and local
information in a development model, they illustrated
impacts such as traffic generation, parking demand and
infrastructure demand from a range of program mixes.
The first step of the model established the assumptions
for infrastructure, retail and open space needs. After
determining the amount of land needed for these program
elements, the model assigned the remaining land to a mix
of housing types, schools, community services, and local
retail. The modeling process then manipulated the number
and types of housing units (based on varying density levels),
adjusted land use requirements for dependent factors, and
tested site capacity.
The model used four housing typologies: Single-Family
Low Density (three dwelling units per acre), Single-Family
Medium Density (six dwelling units per acre), Townhouse
(twelve dwelling units per acre), and Multi-Family (thirty
dwelling units per acre). It presented two development
options to test the UMore Park Steering Committee’s
interest in developing a model that would be new to the
Minneapolis-St. Paul area. These options – similar to current
development in the region – that yielded 15,000 dwelling
units. The same exercise was repeated to gain a preliminary
understanding of the impacts of an increasing population,
up to 45,000 dwelling units. At this density, thirty dwelling
units per acre, the site is considered to be maximized.
After determining the minimum and maximum number
of housing units the site could support, the UMore Park
Steering Committee turned to the consultant’s economic
analysis and determined that 20,000 to 30,000 residents
is an appropriate target level given the region’s projected
economic growth. This would equate to 7,000 to 8,000
housing units.

193
APPENDIX
INTRODUCTION
1. UMORE PARK STEERINGCOMMITTEE SUBCOMMITTEEREPORTS
As the UMore Park Steering Committee brought focus to its
vision of the UMore Park community, three sub-committees
were organized to develop the University’s interests in
education, health and the environment at UMore Park. The
following three summary reports were completed in July,
2006, and are provided here to document the development
of concepts and the definition of value that the University
brings to the vision of a new community. The ideas
captured here will be further enhanced and revised by the
Steering Committee over time.
STEERING COMMITTEE STUDY OF EDUCATION
UMore Park Strategic Planning: Opportunities through Education
Vision and Context
Thomas Jefferson said, “Educating the common people
[is the only] sure foundation … for the preservation of
freedom and happiness.” Education in its many forms is
the springboard in this new community for better living that
launches children and adults into new experiences based on
quality schools, community-based experiential learning, easy
access to information and innovation in teaching, learning
and technology. The University of Minnesota provides the
foundation for education and learning activities that are
interwoven into the fabric of the community. These, in
turn, will create lifelong opportunities for individuals and
their families.
Education translates as economic success for individuals
and the economy. For example, twenty years ago the
‘education premium,’ the average value of a four-year or
advanced college degree compared with a high school
diploma, was worth forty percent more in terms of lifetime
earnings. Today that premium has grown to over seventy
percent (Economic Policy Institute, 2004).
Further, the imprimatur of the University of Minnesota
ensures distinction for this new community. The
educational goal for the community – and for all
Minnesota communities – is:
• Every Minnesota child needs to complete some form of
post-secondary education.
• The educational pipeline should be strengthened to
ensure that youth who plan to pursue post-secondary
education are better prepared.
• The educational pipeline should be broadened to
ensure that opportunities are available to a broader
range of youth.
• The educational pipeline begins with early childhood
development, prenatal through three years of age.
• The educational pipeline extends across the

UNIVERSITY OF MINNESOTA OUTREACH, RESEARCH AND EDUCATION DEVELOPMENT ANALYSIS194
lifetime, supporting adults through multiple career
changes and family leadership, retirees through
learning-based activities and volunteerism, and elders
through intergenerational interactions and extended
independence.
FindingsA new community founded on University expertise
– particularly in areas of education, health and energy
– brings cascading benefits to all. University research,
education and public engagement benefit the community
and its residents. The opportunity for the University to plan
and design a unique community helps to fulfill its strategic
positioning goal of becoming among the top three public
research institutions in the world. Residents and their
families, and others in the surrounding area, benefit from
education, learning and enrichment that lead to healthy
lives, classroom accomplishments, career opportunities and
successes, personal satisfaction, active citizenship, and
volunteerism.
University Value
Linkages to the University of Minnesota will bring
the following strengths and contributions to this new
community:
Education:
• Prenatal through age 3: Programming and research
related to early childhood development, brain
development, family social sciences, public health,
nutrition; facilitation of parental involvement pre-birth
through post secondary experience.
• Pre-kindergarten through 12th grade: Programming
and research through departments, centers and entities
including Consortium for Post-secondary Academic
Success; Center for School Change; Children, Youth and
Families Consortium
• Post-secondary education: Research-based education;
career counseling; technology-based learning
opportunities; internships and experiential learning.
• Professional development for teachers. Might include
on-site center and lodging facility that would provide
research-based professional development that is
integrated with business, industry and governmental
innovation.
• Lifelong learning. Linkages to University of Minnesota
Extension Service programming; College of Continuing
Education programming; Vital Aging Network; non-credit
classes, public lectures and seminars, performances;
volunteer opportunities.
Research:
• Community-linked research could offer public
information and education on range of issues and
interests in the community and region – transportation,
water quality, energy efficiency, ecology, health and
wellness, weather and climate, yards and gardens,
recreation, and public affairs, for example.
Engagement and Services:
• Library. Serves as a community hub that provides
information services, books and publications for learning
and enjoyment, access and applications of state-of-the-
art technology, programming that emphasizes segments
of the community (early childhood development, family
interactions, children and youth, seniors) highlighted
by special interests and needs. Linkage to University of
Minnesota library system and faculty expertise creates a
unique resource for the community and region.
Partnerships
Higher education:
• The location of Dakota County Technical College at
the northern boundary of UMore Park offers a unique
opportunity to leverage University of Minnesota strengths
with those of MnSCU to create educational opportunities
for regional residents and others.
Public-private sector:
• Intergenerational. Senior residences adjacent; shared
facilities for school, community center, senior center,
arts and other public community education offerings.

APPENDIX 195
• Health and wellness. Integrate a clinic and wellness
center into the community that emphasize and provide
educational programs on diet and nutrition, physical
activity, family health and other aspects of wellness and
disease prevention.
• Workforce preparation. Coordinate with state, industry,
other educational institutions and local foundations
to address customized training and new models
for workforce preparation that enhance economic
development.
• Global economy. Prepare students for global approaches
and international interactions in daily work and life.
Diversity and the range of cultural values and practices
need to be regarded as assets to the community.
• Volunteerism. Community connections are a hallmark
of student success. Community programming that
encourages volunteer contributions to the school by
parents and community residents – especially including
older adults – benefits the students, families, teachers
and the community overall.
• Leadership. Local governments, business leaders and
others can support active citizenship programs that offer
students of all ages opportunities for civic engagement
and contributions to the public good.
Unique Human Resources
The “silver surge” is pushing across the nation as the first
wave of 77 million baby boomers turns 60. Today, one in
eight Americans is 65 years or older. By 2020, the number
increases to one in six. Based on statistics comparing U.S.
census data from 1990 to 2000, Minnesota’s population
age 60-64 increased 6 percent; 65-69 decreased 3.4
percent; 70-74 increased 13 percent and 75 and older
increased 25 percent. In comparison, the Minnesota
population under age 60 increased 16 percent.
In Dakota County older adults were 10.3 percent of the
population in 2000. Between 1990 and 2000 the older
population in Dakota County increased by 48.1 percent.
Research shows that people 65 and older remain active and
choose to engage in career activities and avocations. This
segment of the population will be an integral part of a new
community in various ways, including:
• Strengthening neighborhoods. Intergenerational
interactions and diversity strengthens civic engagement
and enriches families and the community.
• Educating and enriching children. Older adults play an
expanding role in the education of children, including
mentoring and tutoring. Further, the power of the older
adult vote on education and community issues should
not be underestimated.
• Civic engagement. Service to community benefits
older adults as well as the community. Mechanisms to
engage older adults as volunteers, advocates, trainers
and community leaders are a key component of the new
community.
Conclusions• UMore Park and its future community can be a model
for innovation that supports educational opportunities for
children, youth and adults (including senior adults).
• The imprimatur of the University of Minnesota brings
a powerful and unique character to this community for
better living. The ability to integrate education, health
and energy into the fabric of the community – through
discovery – creates a vibrant destination for residents,
neighbors in the surrounding regions and visitors.
• Powerful and successful schools are contextual. They
are integrated with the community and its residents.
Planning for the future – and a future community – must
emphasize flexibility to grow a school system and lifelong
learning programs in tandem with its community.
• A new school and/or school system should be innovative,
unique and offer models for new approaches to
education – a prenatal to post-secondary continuum,
teacher development and renewal, community
engagement, lifelong learning.

UNIVERSITY OF MINNESOTA OUTREACH, RESEARCH AND EDUCATION DEVELOPMENT ANALYSIS196
Further, this library will more fully serve the community,
based on age-level interests. For example, an emphasis on
early childhood learning and development serve interests at
the prenatal through three-year-old levels. Specialists from
the University’s Children, Youth and Families Consortium
and other programs will be available on site to respond to
requests and direct parents and other interested individuals
to on-line resources. The library will also segment
programming within the pre-kindergarten through 12th grade
age group. Strong relationships with local and surrounding
school districts will engage children and youth through
summer programs as well as through school curriculum.
Teenagers can explore career options, post-secondary
opportunities and job preparation with the assistance of
specialists attuned to the needs and interests of this age
group. Professional development opportunities linked to the
University and teacher-training sessions will benefit educators
and their students. Active retirees will find assistance in
connecting to volunteer opportunities as well as educational
programming, classes, and travel. Older senior adults will
have the immediate access to assistance and a network
that can provide social and intergenerational interaction
and connections to transportation and health information.
Importantly, health and wellness expertise will be fully
integrated into programming at all age levels.
Select Sources and Resources
• Center for School Change, http://www.hhh.umn.edu/
centers/school-change/index.html
• National Clearinghouse for Educational Facilities, National
Institute of Building Sciences, http://www.edfacilities.org
• The Federal Reserve Bank of Minneapolis, http://www.
mpls.frb.org/research/studies/earlychild/
• Harlem Children’s Zone, http://www.hcz.org
• Middle Country Public Library, http://www.mcpl.lib.ny.us
• Metropolitan Area Agency on Aging, http://www.tcaging.org
• Grantmakers In Aging, www.giaging.org
• Older adults – the increasingly large cohort of retiring
baby boomers and elders – should be drawn into this
new community to increase community expertise,
richness of experience and strengthen community
networks, learning and volunteerism.
• Engagement in the vision for a new community should
start as soon as possible:
– Involve an intergenerational cross section of
community members to create the vision for
educational opportunities in a new community.
– Involve youth and older adults in discussions and
planning.
– Involve school districts, other public and private
entities and the local business community – the range
of potential partners – in the region surrounding
UMore Park in visioning, even before master planning
is initiated.
RecommendationsA focal point of the community’s center will be a University-
founded library. This library will serve as the community hub
that provides information services, books and publications
for learning and enjoyment, access and applications of
state-of-the-art technology and linkages to the University of
Minnesota library system, the top-ranked research library in
North America.
But this library will stretch further into the community by
offering information sessions, classes, seminars and Q&A
forums that feature University researchers and educators to
address issues of the day that impact citizens, such as diet
and nutrition; obesity in children and adults; management
of diet-related chronic diseases such as diabetes, cancer
and heart disease. Gardening and yard care; relationships of
communities to water quality (in the local Vermillion River
watershed, the Mississippi River and Minnesota’s lakes;
alternative energy and Minnesota’s future in biofuels, wind
and other renewable energy options; energy-efficient homes,
vehicles and buildings; and a range of topics of interest to
the community.

APPENDIX 197
comfortable place to live, work and play.
This concept is the promise of what the University can
provide to citizens in addressing health challenges
that face society, both today and into the future. It is a
comprehensive and systematic approach to evaluating and
improving the quality of life for the people we serve.
Goals for a UMore Park/University of Minnesota Health
Initiative include:
• Obesity and diabetes rates for people living in this
community are 20% below the average of their peers.
• Adults are able to be self-sufficient to an older age.
• Young people exercise more and eat healthier food.
• People participate more in wellness activities and have
10% lower health care costs than their peer groups.
• Suicide, domestic violence, alcoholism, drug use, teen
pregnancy, and children in need of foster care are 20%
lower than the regional average.
• Smoking and the associated diseases are 20% below the
regional average.
• People in all age groups participate in extracurricular
learning activities at 25% greater rates than the regional
average.
• People exercise more than 20 minutes per day, at least 3
times per week 20% more than the regional average.
• The community uses 30% less fossil fuels, 20% less
water, and reduces air and water impurities associated
with the community 25% compared to the regional
average.
We feel the University of Minnesota can lead an initiative to
achieve these goals.
STEERING COMMITTEE STUDY OF HEALTHUMore Park Strategic Planning: Opportunities through
Health
Lifestyle-related diseases impact people and health care
costs. More than half of health care costs, those related to
obesity, diabetes, and heart disease, are largely preventable
through lifestyle choices.
Can the University of Minnesota provide leadership in
developing communities that encourage people to lead
healthier lives? Can the University imbed research within
these communities for the betterment of society? Can theses
communities be designed to attract people to live in them?
This committee thinks the University can.
This vision involves a systems approach that encompasses
food; diet and nutrition; exercise; community, business,
and home design; health care; education; mental health;
youth; social work; and progressive care for aging as part
of a vibrant community. This vision also recognizes that
maintaining water, air and environmental quality, and life-
long learning are part of a healthy society.
Health is not something that exists independently or as a
discrete part of our lives. How we eat, raise and educate
our citizens, design cities, use energy, incorporate the arts
and the natural environment, provide energy, and move
from place to place all affect our health. As a University
we have the intellectual capacity to team with the private
sector to envision communities that will be sustainable for a
millennium, not just for a few generations. We can envision
and design communities that integrate the complex systems
that impact our life and our health. We can do it in such a
way that allows this entire city to be a non-intrusive research
platform that will both help propel the University to its goal
of being a top three research institute and demonstrate
leadership as societies envision designing healthy
communities that give hope to prudent use of resources
and sustainable living for generations to come. A Health
Care Initiative at UMore Park is a research, demonstration,
and delivery platform imbedded into a welcoming and
UNIVERSITY OF MINNESOTA OUTREACH, RESEARCH AND EDUCATION DEVELOPMENT ANALYSIS198
• Health care and healthy living as an early amenity to
attract people to live in the community.
In themselves, these concepts are not new or novel. There
are models existing (and being developed) that encourage
people to lead healthier lives. There are really two key
differences and strengths in the proposed concept. The first
is the integrated, systems approach to health and health
care. The second is the research and education power of the
University of Minnesota.
By incorporating the best that the world has to offer in terms
of health care and the vision of research leaders we propose
to:
• Incorporate into the design of a health care system, the
ability to do research and evaluate the impact of this
initiative through the University of Minnesota School of
Public Health, private health care partners and others.
• Integrate the environment and our use of resources into
our evaluation of human and community health.
• Incorporate lifelong education and ties with the
University of Minnesota to encourage people to lead
healthier lives.
Recommendations:• Develop a UMore Park Health Initiative that integrates
wellness, health care, exercise and amenities to attract
people.
• A UMore Park Health Initiatives should focus on
compelling societal issues. Specific issues, such as
obesity, diabetes, heart disease resonate more with
society than broad concepts.
• Tie these health initiatives into existing university
health and wellness structure: Fairview, health services,
education, family and social services, etc.
• Approach health as a continuum that encourages people
to be physically and mentally active from prenatal needs
to nursing care.
Key Findings:Health is an encompassing concept that includes healthier
living as well as health care. Already the University of
Minnesota is emphasizing the relationships between
diet and health through the President’s interdisciplinary
initiative on Healthy Foods, Healthy Lives, which focus
on the collaborative research that can generate healthful
outcomes for citizens, their families and communities. The
University also engages with partners to provide increased
opportunities for health and wellness. Neighborhood clinics,
new research partnerships with the Mayo Clinic and a range
of ongoing initiatives with Fairview are a few examples. The
University’s emphasis on food, health and lifestyle through
research, education and engagement help position the
institution among the top three public research universities
in the world.
The proposed concept is an approach to Health that
promotes:
• Healthier eating by providing access to healthier foods
for all socioeconomic groups.
• Health education that targets specific needs of citizens.
• Exercise, activity and positive mental health through
trails, parks, sidewalks, health centers, access
to the arts, theaters, libraries, elder hostels, safe
neighborhoods and communities, design that encourages
social interaction, and educational ties to the University
of Minnesota.
• Coordination and delivery of information and access to
the amenities available in the community.
• Vital aging by consciously integrating the concepts
described above into people’s lives.
• An education system that focuses on lifelong learning
and begins with prenatal care.
• A healthy, sustained environment and a safe and place
for people to live.

APPENDIX 199
• This health system must be designed to provide
leadership and vision that extend beyond the region and
the State.
Places to investigate to expand the vision for progressive
care in a living community include:
• Academy Village in Tucson, AZ
• Rossmoor – Walnut, Creek CA
• Boutwells Landing – Oak Parks Heights, MN
STEERING COMMITTEE STUDY OF ENERGY AND ENVI-RONMENT
Umore Park Strategic Planning: Opportunities through Energy
Vision and ContextUMore Park is uniquely positioned at the rural edge of
the Twin Cities metropolitan area, one of the 25 largest
in the country and predicted to grow by a million people
by 2030. Its proposed development as a new community
by the University of Minnesota places our flagship land
grant institution in an enviable, but also highly responsible
position. The University’s ownership of this land presents
a singular and unique opportunity to express paradigm-
altering approaches to multi- and interdisciplinary
knowledge development that will serve as a global
benchmark and, in so doing, provide an academic and
financial legacy for the University.
The 5,000-acre parcel is an educational institutional land-
holding unique in the world. The University, in this moment
of transformation, has the chance to integrate its investment
in intellectual and real estate capital and its innovative
approaches to research and development in a community
that will epitomize the new hallmarks of a land grant
university of world renown.
As development at UMore Park constitutes the making of
a community, it also will be a living laboratory of human
settlement at the urban/rural edge. This laboratory can
be the setting of research, technological and ecological
development that would inform the nature of sustainable
development in all human communities. Embedded in this
proposition is the concept of a knowledge economy that
would be the foundation of the tangible economy of the
development.
The broad vision is to develop the land to integrate energy
and environmental sustainability with the other core
objectives of the project - education and health. This
requires the development of a successful master plan that
integrates quantitative design models for energy, water, land
use/transportation, the carbon cycle, law and policy, and
economic development.
Tangible benefits of this integrated approach to the
University are both financial and academic:
• Create a new knowledge economy resulting in patents,
publishing, public and private research relationships and
opportunities as well as profits from investment shares in
the development.
• Provide increased income for the University from land
leases/sales made more valuable by the real estate
development and its integration with the mission of the
University.
• Illustrate a new paradigm for integrated and holistic
research in a land grant research institution that already
focuses on critical areas of synergistic research including
the pharmaceutical/agricultural connection, carbon
sequestration, energy development and conservation,
alternative transportation systems.
• Create a critical mass of sustainable land resource-
based industries with long-term economic gain for the
University and State.
• Create new productive and more diverse yet integrated
jobs, including training people for new technologies.
A unique mixed-use development at UMore Park will provide
the following benefits to its residents and by extension to
the surrounding communities:
UNIVERSITY OF MINNESOTA OUTREACH, RESEARCH AND EDUCATION DEVELOPMENT ANALYSIS200
• A reliable and non-polluting energy supply delivered at a
lower cost that will remain stable over the long term
• The availability of renewable transportation fuel
• The application of deep energy conservation technologies
to cold climate buildings that are flexibly designed
to continuously accommodate new technologies, so
providing an ongoing basis for minimizing energy costs.
• The University’s involvement with education, health and
research into sustainable development
• Demonstration of a lifestyle of the future that celebrates
the increasingly multi-generational mix of society.
Sustainable economic real estate development at UMore
Park depends upon the creation of an innovative integrated
infrastructure that will provide added value for the
residents, business and surrounding community. Efficient
utilization and preservation of the earth’s resources will
provide practical and cultural enrichment of the UMore Park
community. But here, innovative infrastructure is more than
just extending existing metropolitan services into the site.
Critically significant multidisciplinary research opportunities
are embedded in the design and implementation of these
practical infrastructure systems, attuned to the scale of
the community development. These research opportunities
will also provide the basis for leveraging resources through
partnerships with both the private (developers, utilities,
businesses) and public (DOE, EPA, DOT) sectors. In
addition to the knowledge values created, these systems
could provide the following direct revenue streams:
• Sale of electrical power and thermal energy to the
development
• Sale of excess electrical power and dispatchable energy
storage to a utility
• Sale of solid and liquid waste removal service to the
development
• Sale of potable and process water to the development
• Sale of knowledge useful for academic research and
marketing
• Sale of licenses for intellectual property
commercialization
• Sale of carbon sequestration credits on the international
market
Key FindingsIn the design and planning for community and regional
resources, deep conservation, efficient energy use and
integration of renewable energy resources and other
infrastructure using current and near-term practical and
cost-effective technologies will be used to achieve an overall
Gross Zero Energy development. Therefore, energy will be a
significant factor in setting the scale for other infrastructure
that can integrate water conservation, efficient and
ecological storm water management, as well as waste and
wastewater treatment. It is crucial that the development
be guided by realistic, quantitative assessments of the
available renewable energy resources.
The scale and costs of energy systems in relation to more
holistic development objectives will be guided by the
appropriate mix of on- and off-the-grid energy technologies.
These systems would embrace new and existing design
approaches and technologies in the fields (amongst
others) of renewable energy (solar, wind, cellulosic and
non-cellulosic biomass), energy conversion (for example,
multiple junction, stretched lens array photovoltaics;
simultaneous fermentation and saccharination cellulosic
biomass conversion; oxygen and hydrogen enriched bio-
fueled regenerative gas and steam turbine cascades;
fuel cells, etc); energy storage (below-grade interstitial
hydrogen and thermal reservoirs); integrated carbon cycles;
agricultural energy production; energy conservation; data
networking; and artificially intelligent control.
The sub-committee assumes that the University/Regents
will select development Scenario D – Master Developer
Partnership - and enter into a joint venture with an

APPENDIX 201
experienced large-scale development company as well as
other partners to prepare a Master Development Plan. This
plan for a 21st century city, providing a community culture
that reflects sustainable living, will integrate design for life-
long-learning, health, and energy self-sufficiency.
In the creation of the Master Development Plan it is crucial
that faculty, researchers and key design professionals within
the University be engaged in a meaningful way as partners
in this process. If a standard planning process is followed
that does not effectively engage University knowledge and
expertise, this opportunity could easily be squandered.
Therefore, we think it important that the University establish
and fund a faculty team to develop and integrate the
quantitative design models necessary to describe an energy
and environmental resource based development approach
so that the long-term financial and academic yields can
be maximized using practical and feasible development
strategies. This faculty team, working under the direction
of and in consultation with the UMore Park Steering
Committee will be charged to:
a. Prepare a comprehensive quantitative inventory of the
renewable energy solar and wind capacity of UMore Park
and the surrounding communities
b. Complete a detailed due diligence review of the core
enabling energy conservation and renewable energy
generation technologies in terms of their current
practicality and commercial availability
c. Explore ways of generating transportation fuel both in
the short and long term from the available renewable
resources using currently available commercial
technology
d. Integrate sustainability with education and health into
the design of the master plan
This holistic approach to the development of UMore Park
affords a unique and unprecedented opportunity for the
University of Minnesota to transform its land grant mission
with assets that could generate a wealth of academic,
intellectual, economic and social benefits not only for the
University and the State of Minnesota but for the world.
Examples of large-scale sustainable developments that
embody some of the aspects proposed include:
• Viikki section of Helsinki, Finland
• Dongtan Eco-City – Shanghai, China
• Thames Gateway – London, England
• Calloway Gardens – Atlanta, GA
• North Charleston Sustainable Community Development
– Charleston, SC

UNIVERSITY OF MINNESOTA OUTREACH, RESEARCH AND EDUCATION DEVELOPMENT ANALYSIS202
2. SUMMARY OF RECENT UNIVERSITY PLANNINGANALYSES
SummaryThe University has issued previous analyses and reports for
all or parts of UMore Park:
• 1997: The Rosemount Advisory Council drafts a mission
statement that expresses a commitment to establishing a
partnership between the community, businesses and the
University to provide a world-class agricultural research
and education center relating to environmentally-safe
technologies at UMore Park.1
• 1999: The University creates a plan to build on the
Rosemount Advisory Council's mission statement
by preserving University ownership of UMore Park;
acknowledging the interests of surrounding communities;
and balancing financial return on investment with social
benefits and environmental health.2
• 2000: The University creates a plan that articulates a
physical framework to realize the programmatic goals of
the previous plans.3
• 2003: The Board of Regents approve the following
mission and vision for UMore Park:
A living laboratory at an active urban/rural edge used
for teaching research and community education
about contemporary issues such as land use history
and planning, agriculture, natural resources, health,
environment, energy and water;
A large, University-owned property with a rich and varied
history that demonstrates the impact of different kinds
1 University of Minnesota College of Agricultural, Food and Environmental Sciences. Agricultural Research and Education at Rosemount. Minneapolis, Minnesota, 1997
2 University of Minnesota Center for Rural Design. Integrated Land Planning Framework for the University of Minnesota Rosemount/Empire Property. Minneapolis, Minnesota, 1999 (Adopted by the University of Minnesota Board of Regents, 1999)
3 Urban Strategies Inc / Colliers Towle Real Estate / The Rise Group. UMore Park: Cultivat-ing a Landscape for Knowledge: Management Plan for the University of Minnesota Outreach, Research, and Education Park. Toronto, Ontario, 2000
of land uses, the significance of research in addressing
both rural and urban issues, and that increasingly
serves a wider variety of programs and societal needs
appropriate to the site;
A diverse landscape for the pursuit and demonstration of
design excellence and environmental restoration at the
urban/rural edge of the Twin Cities; and
A regional treasure for the public interpretation,
exploration and enjoyment of Minnesota's natural and
cultural heritage.4
• 2004: The University-sponsored UMore Park
Management Team develops a plan to ensure orderly
development of UMore Park in support of the 2003
Board of Regents vision and mission for the land;5
• 2005: A University-appointed Executive Committee
recommended initiation of a planning process to create
a lasting legacy at UMore Park in support of University
research objectives. The Committee recommended
stewardship of the land and reinvestment of financial
gain into a perpetual endowment to fund academic
priorities.6
4 University of Minnesota UMore Park Strategic Plan, March 18, 2003.
5 UMore Park Management Team. Master Plan for UMore Park, July 2004. Minneapolis, Minnesota, 2004
6 University of Minnesota College of Architecture and Landscape and College of Agricul-tural, Food and Environmental Sciences. The University of Minnesota and UMore Park: Research-Based Legacy Through Sustainable Development. Minneapolis, Minnesota, 2005

APPENDIX 203
3. GOPHER ORDNANCE WORKS
Portions of UMore Park were once part of the “Gopher
Ordnance Works” (GOW). The GOW consisted of nearly 900
buildings, with related roads, railroad tracks, utilities and
infrastructure, distributed across 12,000 acres acquired by
the United States Government in 1941 and 1942. GOW was
one of five facilities designed, constructed and operated by
E.I. DuPont de Nemours Company during WWII to produce
smokeless cannon and rifle powder, oleum (concentrated
sulphuric acid), and related products.
Two almost identical munitions production facilities were
intended for GOW. The first, primarily on the northeastern
part of the property, reconditioned used and manufactured
new gunpowder (nitrocellulose) and related bi-products
for approximately 11 months during late 1944 and
1945. The second production facility, located primarily
in the north central part of the property, reportedly never
became operational. Numerous facilities supporting the
manufacturing operation were also built and operated by
the United States Government and its contractor at the site,
including two large steam plants, a water treatment plant,
several sewage pump stations, sandblasting shops, a paint
shop and storage, carpenter shops, millwright and machine
shops, garage and repair shops, a car wash, a locomotive
house, laundries, sheet metal shops, and a gas station.
Following the end of WWII in 1945, and continuing through
1947, a majority of the GOW buildings were dismantled,
burned, salvaged and/or were otherwise disposed. Presently,
the site still contains a number of WWII-era buildings,
as well as hundreds of assorted foundations, footings,
remnants and rubble associated with the former GOW
facilities. In 1946 the GOW was designated as “surplus”
property by the War Department and the University
submitted a proposal to acquire approximately 8,000 acres
for research and educational purposes. The University’s
proposal was approved and in 1947 and 1948 the property
was acquired by quit claim deeds under the Surplus
Property Act of 1944. The University was required, as a
condition of the Federal Government, to use the property for
educational and research purposes for at least 30 years.
Prior to its acquisition by the Federal Government, the land
was in private hands and used primarily for agriculture.
Since being acquired by the University, the land has been
put to productive use and been devoted mainly to crop
production and agricultural and other research.
The portion of UMore Park transferred to the University
in 1947 includes, generally, the western one-third of the
5,000 acre site studied by the Steering Committee. The
remaining two-thirds of this site, which includes the land
that saw the most intensive industrial development and
use in WWII, was transferred to the University in 1948.
The USACE has acknowledged responsibility for the
environmental investigation and any necessary clean-up of
any environmental issues present on the 1947 parcel as a
result of GOW activities. As discussed below, the USACE
has completed a Preliminary Assessment Report under the
Formerly Used Defense Sites (FUDS) Program regarding
the 1947 parcel, and has scheduled and funded a site
investigation. However, the USACE has thus far taken the
position that there are no FUDS-eligible projects on the vast
majority of the land transferred to the University in 1948.
As a result, less is known about the environmental condition
of the 1948 parcel.
The USACE conducted several environmental inspections
and investigations of GOW between 1985 and 1999 as
part of the FUDS program. In 2006, the USACE completed
a Preliminary Assessment Report for the 1947 parcel
consisting of a review of available documents and a site
reconnaissance. If GOW activities in an area could pose a
potential environmental concern, that area was designated
as an Area of Concern (AOC). Three AOCs were identified in
the area north of 170th Street and west of Akron Avenue:

UNIVERSITY OF MINNESOTA OUTREACH, RESEARCH AND EDUCATION DEVELOPMENT ANALYSIS204
• AOC3 consists of depressions that held water from
various shipping and storage areas.
• AOC 5 consists of land improved with explosives storage
bunkers, seven of which are still present.
• AOC6 consists of an area near 154th Street where
construction and perhaps demolition debris such as
concrete and rebar appears to have been deposited in
two former borrow areas.
Presently, there is no analytical testing data available
regarding these three AOCs.
In 2003, the University and the Minnesota Pollution Control
Agency jointly funded a limited environmental investigation
of six production areas of GOW, five of which were located
within the 1948 parcel: the Oleum Plant, the Nitric Acid
Plant, the Burning Grounds, the Waste Water Treatment
Plant/Power Plant “A”, and the Main Shops Area. The
results of this investigation are summarized in the Phase I
Environmental Assessment prepared by Peer Engineering,
Inc. (July 2006) (Phase I), which is described below.
In anticipation of its report to the Board of Regents, the
Steering Committee directed that the Phase I be prepared.
Peer Engineering, Inc. was selected through a competitive
process to do this work and delivered its report on July
26, 2006. Because large numbers of concrete remnants
from the GOW’s activities consisting of approximately
200,000 cubic yards of concrete are present on the site
and the cost of removing them (or, conversely, the benefit
of recycling them) could be a material factor in determining
the future of the site, the Steering Committee also directed
that a concrete remnant assessment be prepared. After a
competitive bidding process, the University recently retained
Peer to perform an assessment of the concrete remnants,
which was based in part upon a scope of work prepared by
DPRA, Inc. dated June 30, 2006. This concrete study to be
undertaken by Peer, which is to be completed by September
30, 2006, will include: (1) a refined volume estimate of the
concrete remnants and ruins present on the 1948 parcel;
(2) the environmental condition of selected, representative
concrete remnants and soils located adjacent to those
remnants; and (3) analyses and recommendations regarding
mitigation measures, disposal options and reuse scenarios
for any environmentally-impacted concrete remnants
or ruins.
With respect to the AOCs on the 1947 parcel, the USACE
has advised the University that it will conduct a site
inspection (field work including intrusive testing) this fall
and complete its assessment of data and the need for
potential remedial actions within the next 1 ½ years. In
addition, the USACE will prepare a preliminary assessment
and site investigation with respect to a 26.7 acre area in
the 1948 parcel that was the site of the power plant serving
the operational production facility. This 26.7 acre area is
generally located to the east of Blaine Avenue and just north
of 160th Street.

APPENDIX 205
4. LAND OWNERSHIP
On May 24, 2006 the Governor signed into law legislation7
providing for partial funding by the State of Minnesota of a
new, on-campus Gopher football Stadium. The University
agreed, in order to reduce the amount students will pay
toward the stadium costs to transfer 2,840 acres of UMore
Park to the Minnesota Department of Natural Resources
(DNR) after the State has fulfilled its obligation to pay its
cost of the stadium.8 The legislation requires the State to
make payments over a 25-year term ending in 2032. If the
State fails to make the required payments, the University
will not be required to offer the land to the State.
The land that is eligible for transfer lies generally south of
170th Street. Legislation provides that, even after the land
is transferred to the state in 2032, the University would
7 Minnesota Laws 2006, Chapter 247, Sections 137.50, 137.52, and 137.54
8 Minnesota Laws 2006, Chapter 247, Sections 137.50, 137.52, and 137.54
retain rights in perpetuit for its academic mission: research,
education, and engagement.
The legislation requires the University to impose negative
covenants on the land precluding residential, commercial
or industrial development and to enter into negotiations
with the DNR for a joint powers agreement or conservation
easement that will allow the University to continue its
research on the land while at the same time allowing for
the development of outdoor recreational uses and land
preservation. The University and DNR are to cooperatively
manage the property and any proceeds from its use by
University tenants will be dedicated to the operation and
maintenance of the property.
The law allows the DNR to designate which land is to be
conveyed to it and to designate other public agencies as
grantees of land DNR chooses not to acquire. Dakota County
has been assembling land near UMore Park for recreational
UMORE PARK AND DNR LANDS LAND OWNERS AT UMORE PARK

UNIVERSITY OF MINNESOTA OUTREACH, RESEARCH AND EDUCATION DEVELOPMENT ANALYSIS206
uses, and the legislation allows DNR to designate it as
a transferee. The law contemplates that DNR and other
agencies may seek title to less than all of the land, in which
case the negative covenants would still remain in place.
Following signing of the bill in May 2006, The University,
the DNR, and Dakota County initiated discussions intended
to lead to an agreement before the start of the 2007
legislative session. Among the things being discussed are
the kinds and placement of recreational activities that
will be allowed on the land, potential natural vegetation
restoration and the extent to which the land will be used for
agricultural production.

UNIVERSITY OF MINNESOTA OUTREACH, RESEARCH AND EDUCATION DEVELOPMENT ANALYSIS