

Uma iniciativa Apoio Reference Scenario - Government Plan World – GDP growth 2013-2020: 3.8% per...
30
Clique no ícone para adicionar uma imagem Clique no ícone para adicionar uma imagem
-
Upload
caroline-veronica-howard -
Category
Documents
-
view
216 -
download
0
Transcript of Uma iniciativa Apoio Reference Scenario - Government Plan World – GDP growth 2013-2020: 3.8% per...

Clique no ícone para adicionar uma imagem
Clique no ícone para adicionar uma imagem

Uma iniciativa
Apoio
Mitigation Scenarios for Brazil - 2030
William Wills, D.Sc.
Reference Scenario - Government Plan
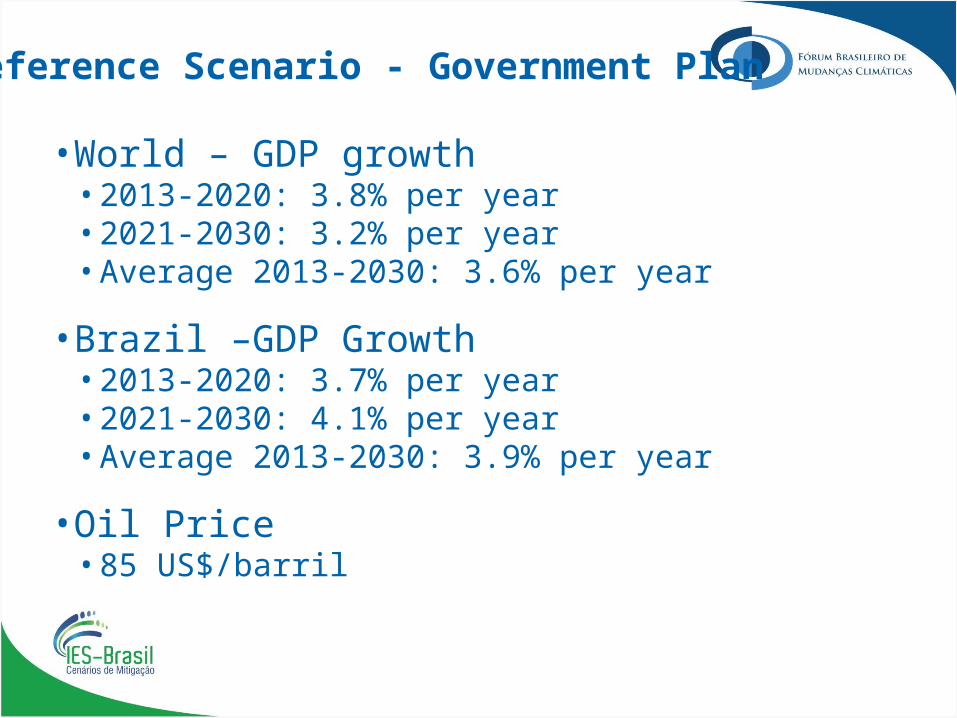
•World – GDP growth• 2013-2020: 3.8% per year• 2021-2030: 3.2% per year• Average 2013-2030: 3.6% per year
•Brazil –GDP Growth• 2013-2020: 3.7% per year• 2021-2030: 4.1% per year• Average 2013-2030: 3.9% per year
•Oil Price• 85 US$/barril

Reference Scenario - Government Plan
•Exchange rate• 2.20 R$/US$
•Population• Total:223 Million • Active population
from 45.8% in 2005 to 49.7% in 2030
•GDP Composition:% VA 2010 2030
Agriculture 5.3% 5.6%
Industry 28.1% 26.4%
Services 66.6% 68.0%
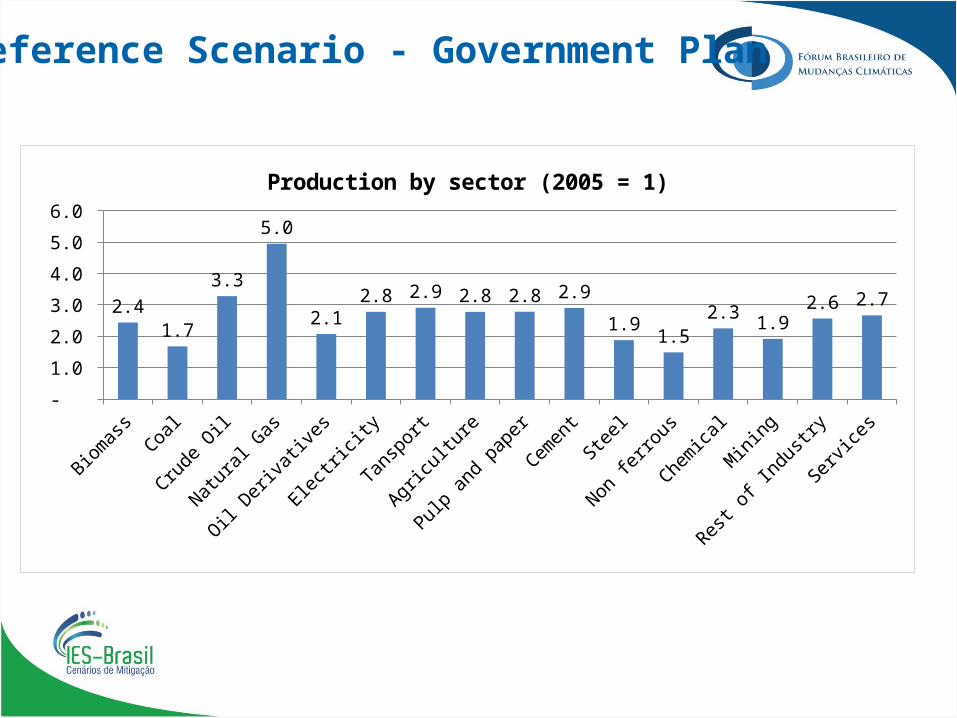
Reference Scenario - Government Plan
BiomassCoal
Crude O
il
Natural Gas
Oil Deriv
atives
Electricit
y
Tansport
Agricultu
re
Pulp and paper
CementSteel
Non ferro
us
Chemical
Mining
Rest of In
dustry
Services
-
1.0
2.0
3.0
4.0
5.0
6.0
2.4
1.7
3.3
5.0
2.1
2.8 2.9 2.8 2.8 2.9
1.9 1.5
2.3 1.9
2.6 2.7
Production by sector (2005 = 1)

Reference Scenario - Government Plan B
iom
ass (
Ktep
)
Oil (
Ktep
)
Natu
ral G
as (K
tep)
Oil D
eriv
ative
s (Kt
ep)
Pulp
&Pa
per.
(M t)
Cem
ent (
M t)
Stee
l (M
t)
Non
ferr
ous (
M t)
-60,000
-40,000
-20,000
0
20,000
40,000
60,000
Net Exports
2005 CPG-2030
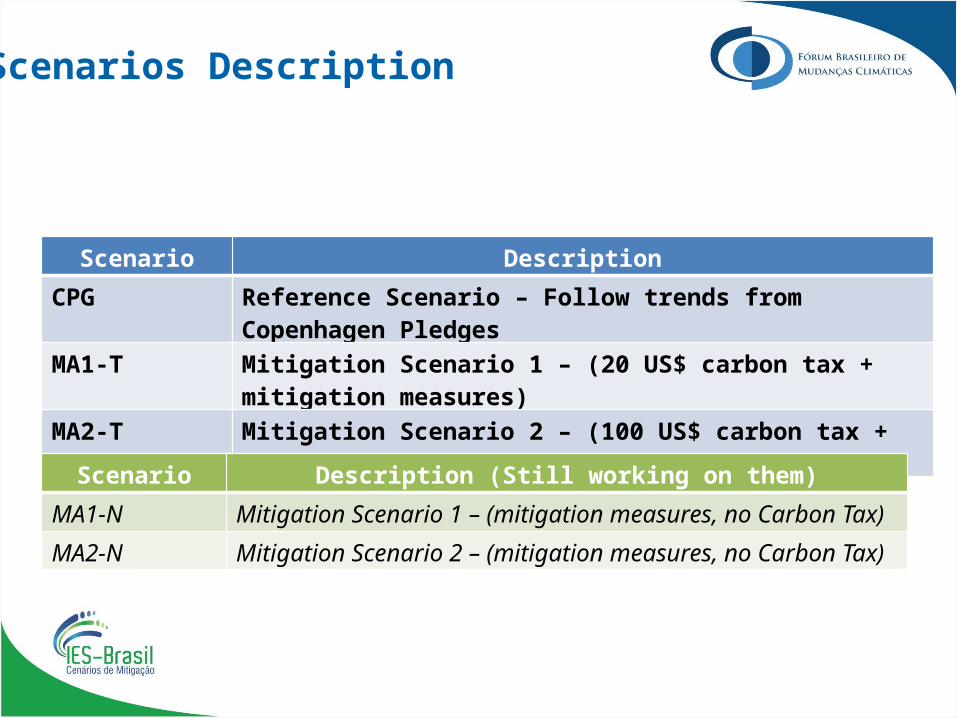
Scenarios Description
Scenario Description
CPG Reference Scenario – Follow trends from Copenhagen Pledges
MA1-T Mitigation Scenario 1 – (20 US$ carbon tax + mitigation measures)
MA2-T Mitigation Scenario 2 – (100 US$ carbon tax + mitigation measures)
Scenario Description (Still working on them)
MA1-N Mitigation Scenario 1 – (mitigation measures, no Carbon Tax)
MA2-N Mitigation Scenario 2 – (mitigation measures, no Carbon Tax)
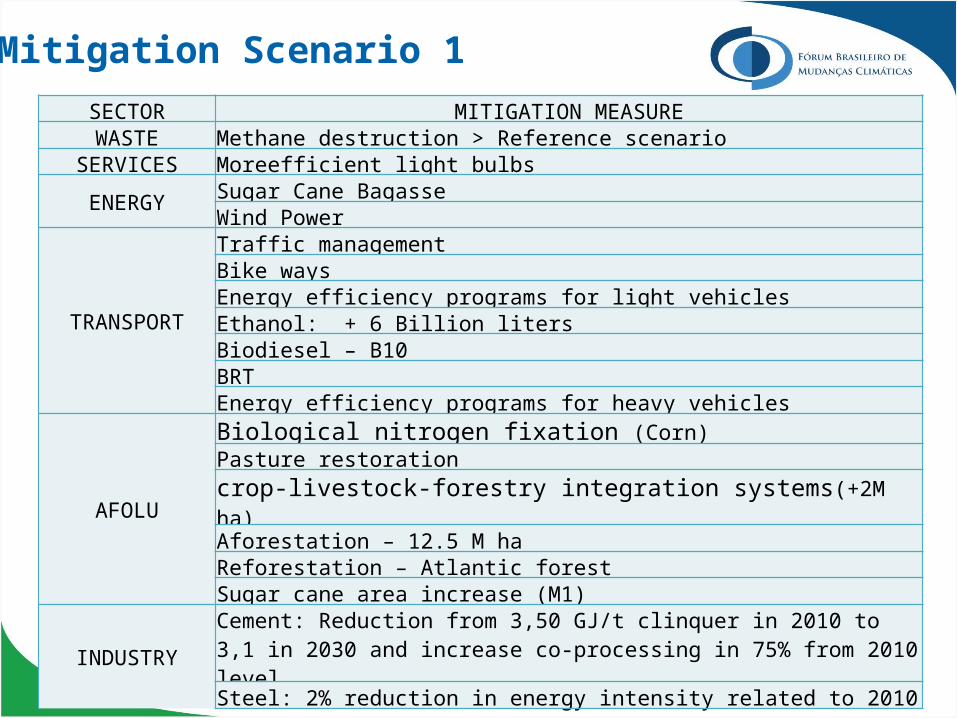
Mitigation Scenario 1SECTOR MITIGATION MEASUREWASTE Methane destruction > Reference scenario
SERVICES Moreefficient light bulbs
ENERGY Sugar Cane BagasseWind Power
TRANSPORT
Traffic managementBike waysEnergy efficiency programs for light vehiclesEthanol: + 6 Billion liters Biodiesel – B10BRTEnergy efficiency programs for heavy vehicles
AFOLU
Biological nitrogen fixation (Corn)Pasture restorationcrop-livestock-forestry integration systems(+2M ha)Aforestation – 12.5 M haReforestation – Atlantic forestSugar cane area increase (M1)
INDUSTRYCement: Reduction from 3,50 GJ/t clinquer in 2010 to 3,1 in 2030 and increase co-processing in 75% from 2010 levelSteel: 2% reduction in energy intensity related to 2010
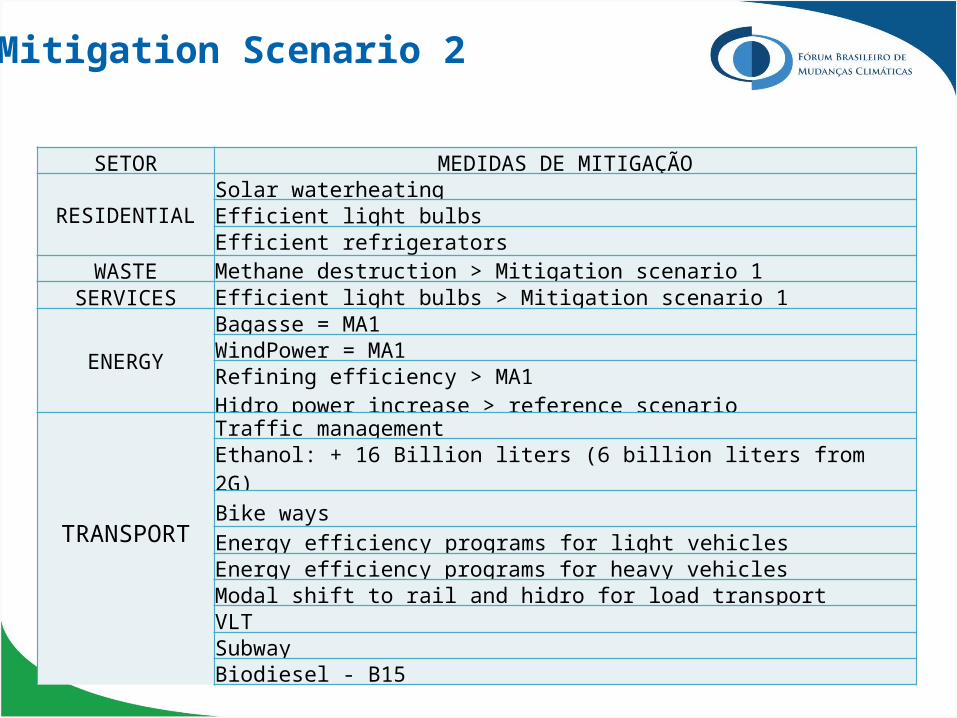
Mitigation Scenario 2
SETOR MEDIDAS DE MITIGAÇÃO
RESIDENTIALSolar waterheatingEfficient light bulbsEfficient refrigerators
WASTE Methane destruction > Mitigation scenario 1SERVICES Efficient light bulbs > Mitigation scenario 1
ENERGY
Bagasse = MA1WindPower = MA1Refining efficiency > MA1Hidro power increase > reference scenario
TRANSPORT
Traffic managementEthanol: + 16 Billion liters (6 billion liters from 2G)
Bike waysEnergy efficiency programs for light vehiclesEnergy efficiency programs for heavy vehiclesModal shift to rail and hidro for load transportVLTSubwayBiodiesel - B15
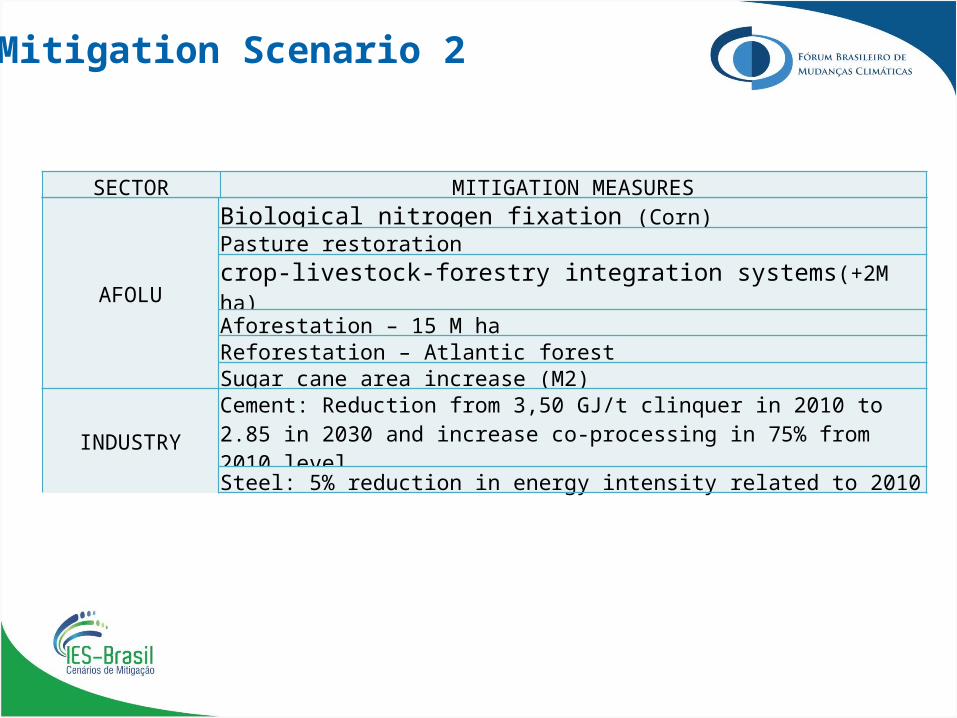
Mitigation Scenario 2
AFOLU
Biological nitrogen fixation (Corn)Pasture restorationcrop-livestock-forestry integration systems(+2M ha)Aforestation – 15 M haReforestation – Atlantic forestSugar cane area increase (M2)
INDUSTRYCement: Reduction from 3,50 GJ/t clinquer in 2010 to 2.85 in 2030 and increase co-processing in 75% from 2010 levelSteel: 5% reduction in energy intensity related to 2010
SECTOR MITIGATION MEASURES

Modelling mitigation measures in IMACLIM-BR
• IMACLIM-BR is a hybrid general equilibrium model• Monetary (M R$2005) e phisical (Ktep) flows are represented
• Mitigation measures modelling:• Technical coefficients changes according to Bottom-up
information:• Fuel changes or reduction: technical coefficients are
changed according to sectoral specific information for each measure• Investments – Capital intensity of the sector changes
according to sectoral specific information for each measure
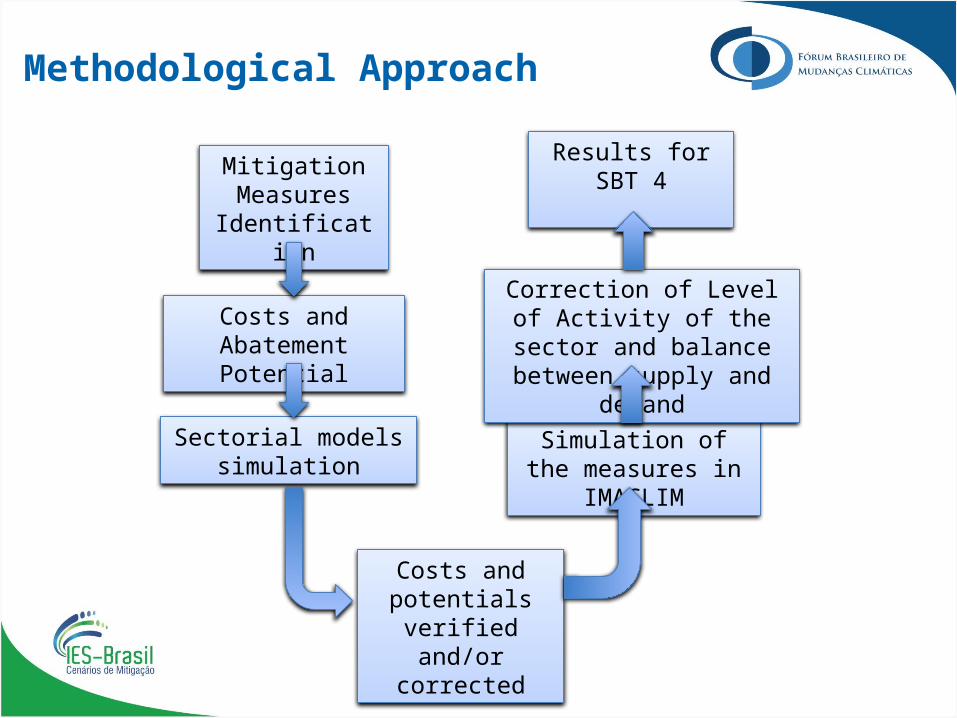
Methodological Approach
Mitigation Measures
Identification
Costs and Abatement Potential
Sectorial models simulation
Costs and potentials verified and/or corrected
Simulation of the measures in IMACLIM
Correction of Level of Activity of the sector and balance
between supply and demand
Results for SBT 4
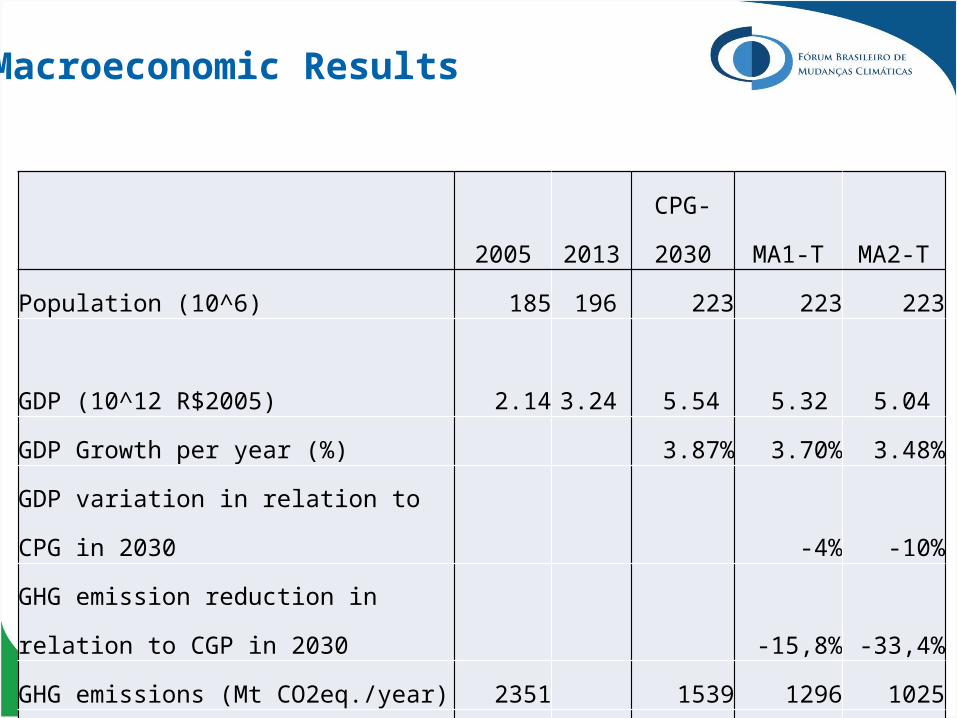
2005 2013 CPG-2030 MA1-T MA2-TPopulation (10^6) 185 196 223 223 223GDP (10^12 R$2005) 2.14 3.24 5.54 5.32 5.04 GDP Growth per year (%) 3.87% 3.70% 3.48%GDP variation in relation to CPG in 2030 -4% -10%GHG emission reduction in relation to CGP in 2030 -15,8% -33,4%GHG emissions (Mt CO2eq./year) 2351 1539 1296 1025GDP per capita (10^3 R$2005) 11.57 16.52 24.83 23.84 22.60
Macroeconomic Results
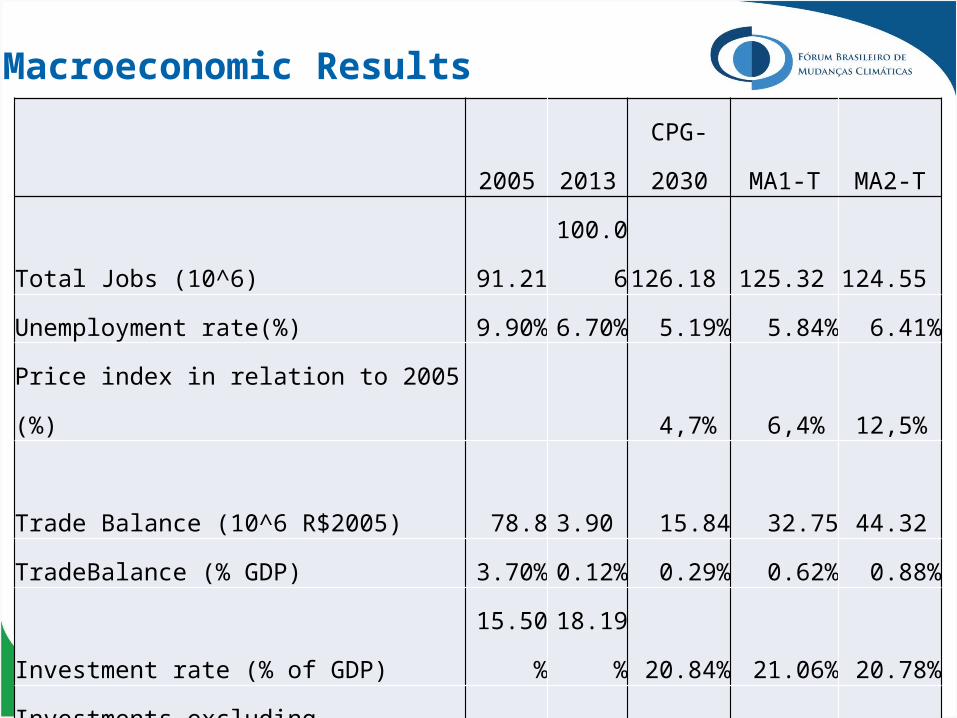
2005 2013 CPG-2030 MA1-T MA2-TTotal Jobs (10^6) 91.21 100.06 126.18 125.32 124.55 Unemployment rate(%) 9.90% 6.70% 5.19% 5.84% 6.41%Price index in relation to 2005 (%) 4,7% 6,4% 12,5% Trade Balance (10^6 R$2005) 78.8 3.90 15.84 32.75 44.32 TradeBalance (% GDP) 3.70% 0.12% 0.29% 0.62% 0.88%Investment rate (% of GDP) 15.50% 18.19% 20.84% 21.06% 20.78%Investments excluding mitigation (10^12R$2005) 0.33 0.59 1.15 1.12 1.05 Total Mitigation Investments 2015-2030 (10^9 R$2005) 230.06 563.82 Mitigation investments in 2030 (Bi de R$2005) 11.71 29.26 Mit. Invest./GDP in 2030 0.22% 0.58%
Macroeconomic Results
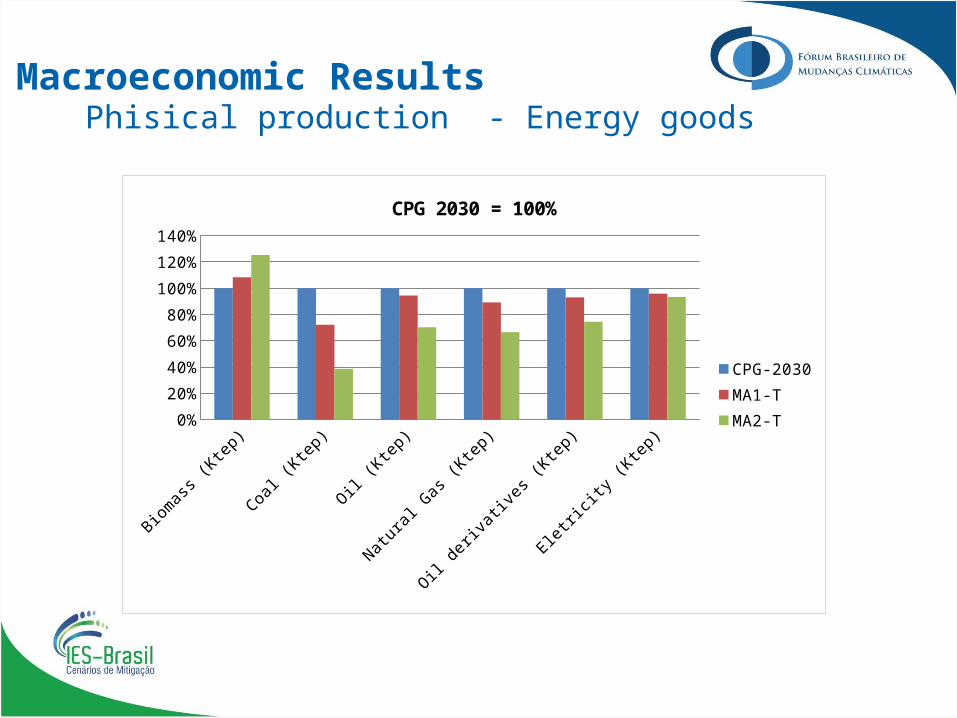
Macroeconomic ResultsPhisical production - Energy goods
Biomass (Ktep)
Coal (Ktep)
Oil (Ktep)
Natural G
as (Ktep)
Oil deriv
atives (
Ktep)
Eletricit
y (Ktep)
0%
20%
40%
60%
80%
100%
120%
140%
CPG 2030 = 100%
CPG-2030MA1-TMA2-T

Macroeconomic ResultsPhisical production – Industrial goods
Pulp&Paper (M
t)
Cement (M
t)
Steel (M
t)
Non Ferro
us (M
t)
Chemical
Mining
Rest of In
dustry
75%
80%
85%
90%
95%
100%
105%
CPG 2030 = 100%
CPG-2030MA1-TMA2-T

Macroeconomic ResultsPhisical Production – Other sectors
Transport Agriculture Services86%
88%
90%
92%
94%
96%
98%
100%
102%
CPG 2030 = 1
CPG-2030MA1-TMA2-T

Macroeconomic Results
Biomass (Ktep)
Oil (Ktep)
Natural Gas (
Ktep)
Oil deriv
atives (Ktep)
Pulp&Paper (M t)
Cement (M t)
Steel (M t)
Non Ferrous (
M t)
-60,000
-40,000
-20,000
-
20,000
40,000
60,000
Net Exports (ktep or M tons)
CPG-2030MA1-TMA2-T
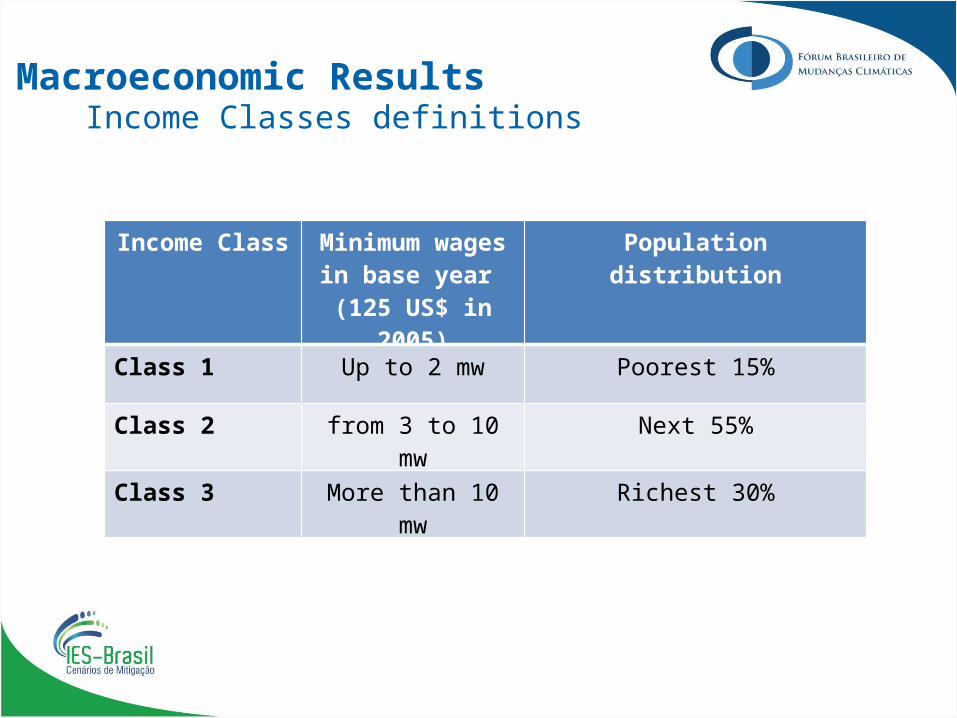
Macroeconomic ResultsIncome Classes definitions
Income Class Minimum wages in base year
(125 US$ in 2005)
Population distribution
Class 1 Up to 2 mw Poorest 15%
Class 2 from 3 to 10 mw Next 55%
Class 3 More than 10 mw Richest 30%
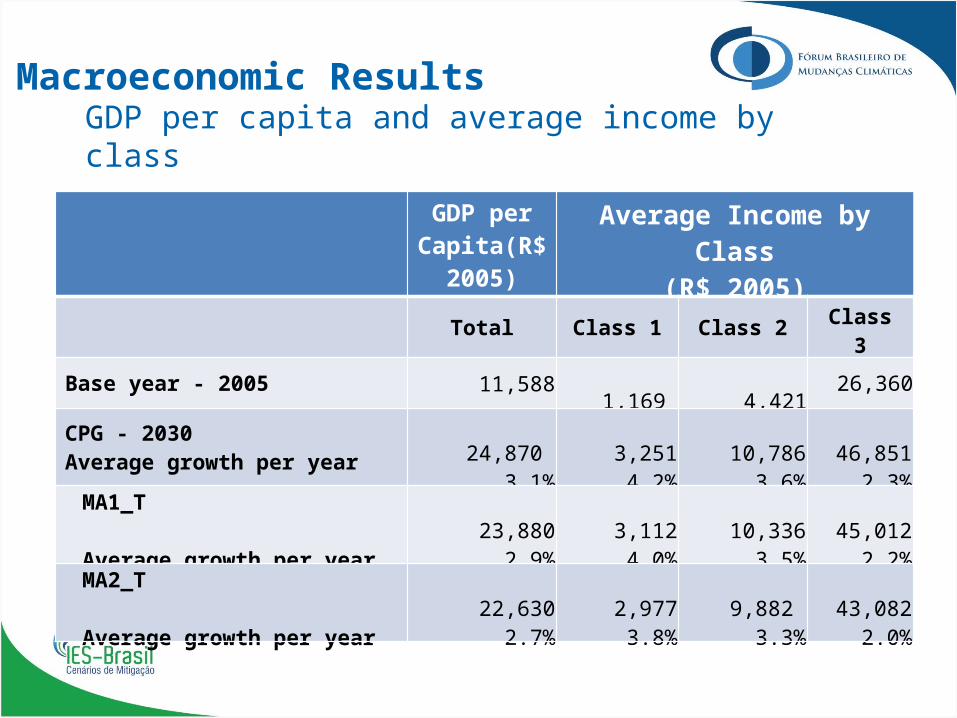
Macroeconomic Results
GDP per Capita(R$
2005)
Average Income by Class(R$ 2005)
Total Class 1 Class 2 Class 3
Base year - 2005 11,588 1,169 4,421 26,360
CPG - 2030Average growth per year
24,870 3.1%
3,2514.2%
10,7863.6%
46,8512.3%
MA1_T
Average growth per year 23,880
2.9% 3,112
4.0% 10,336
3.5% 45,012
2.2%
MA2_T
Average growth per year 22,630
2.7% 2,977
3.8% 9,882
3.3% 43,082
2.0%
GDP per capita and average income by class
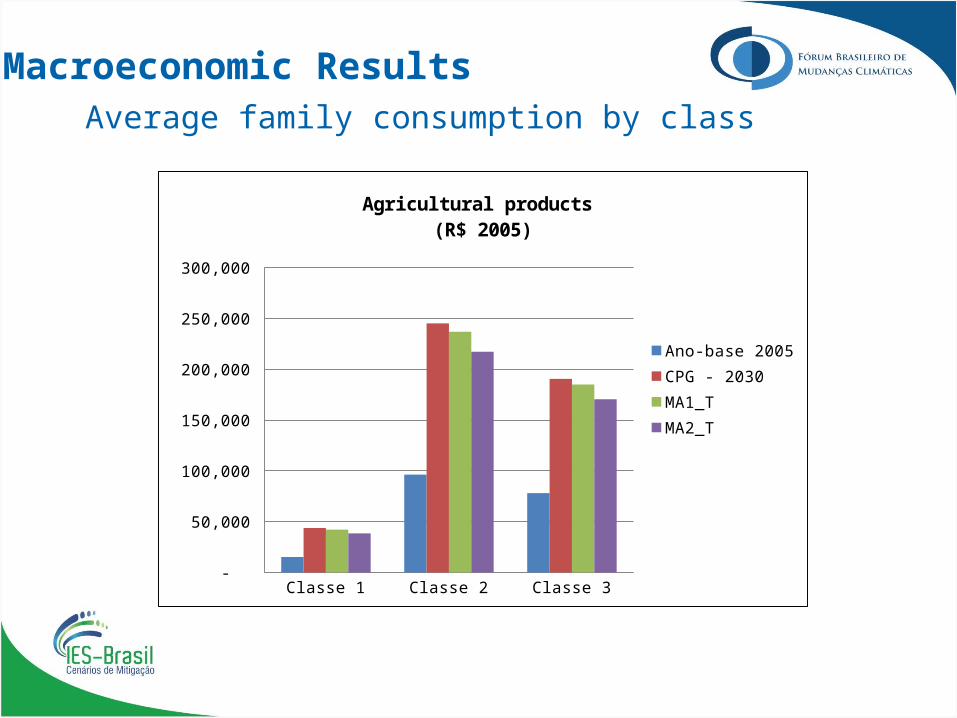
Macroeconomic ResultsAverage family consumption by class
Classe 1 Classe 2 Classe 3 -
50,000
100,000
150,000
200,000
250,000
300,000
Agricultural products (R$ 2005)
Ano-base 2005CPG - 2030MA1_TMA2_T
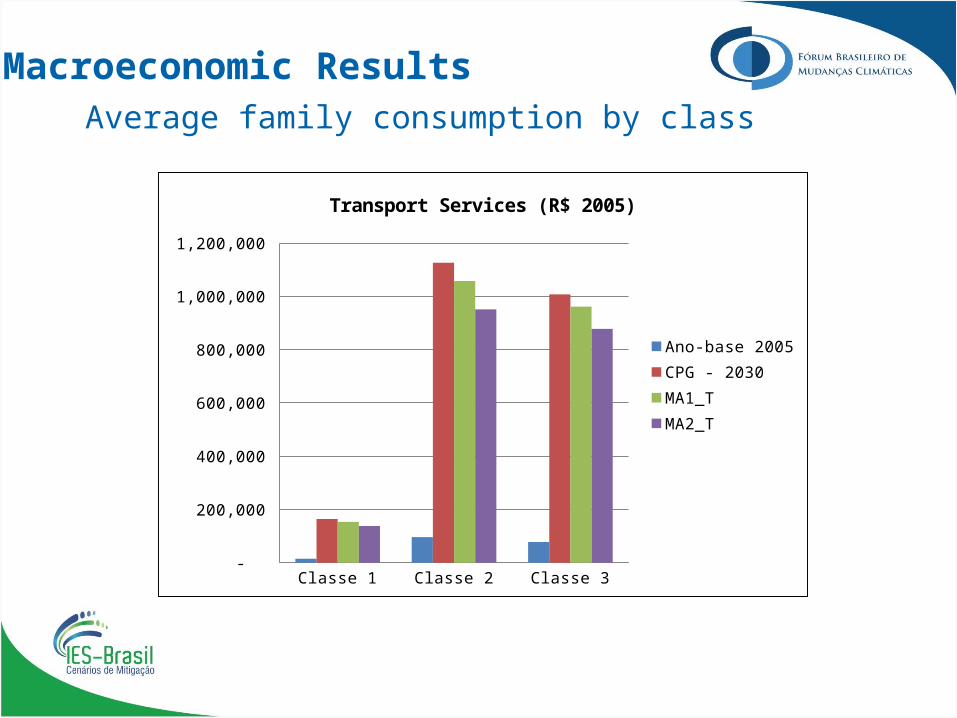
Macroeconomic Results
Classe 1 Classe 2 Classe 3 -
200,000
400,000
600,000
800,000
1,000,000
1,200,000
Transport Services (R$ 2005)
Ano-base 2005CPG - 2030MA1_TMA2_T
Average family consumption by class
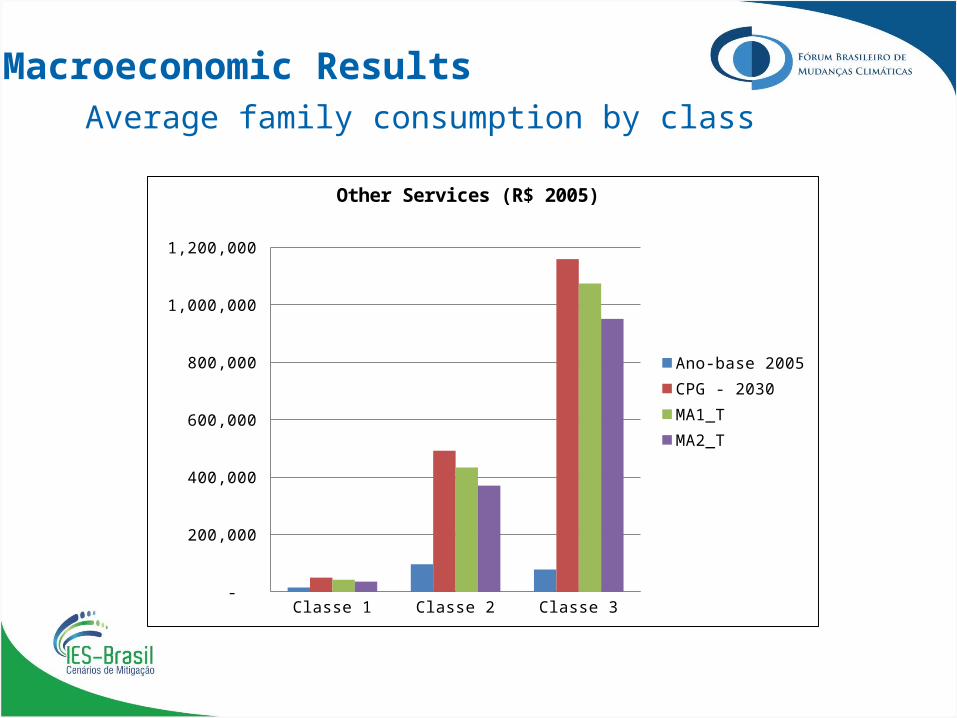
Macroeconomic Results
Classe 1 Classe 2 Classe 3 -
200,000
400,000
600,000
800,000
1,000,000
1,200,000
Other Services (R$ 2005)
Ano-base 2005CPG - 2030MA1_TMA2_T
Average family consumption by class
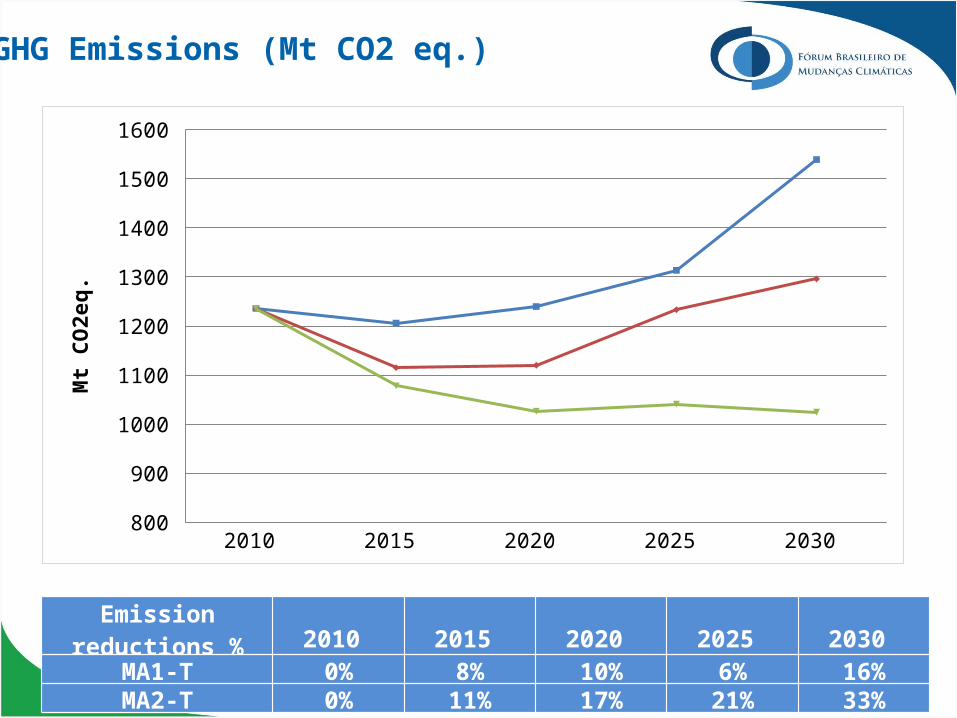
GHG Emissions (Mt CO2 eq.)
Emission reductions % 2010 2015 2020 2025 2030 MA1-T 0% 8% 10% 6% 16%MA2-T 0% 11% 17% 21% 33%
2010 2015 2020 2025 2030
CPG 1236.03351536254
1205.68750029621
1239.72028062907
1313.49333005794
1539.19631060002
MA1-T 1236.03351536254
1115.24574393682
1120.03892811857
1233.2297402394
1296
MA2-T 1236.03351536254
1078.09218891695
1026.42570814401
1040.98756948858
1024.50627796302
850 950
1050 1150 1250 1350 1450 1550
Mt C
O2e
q.
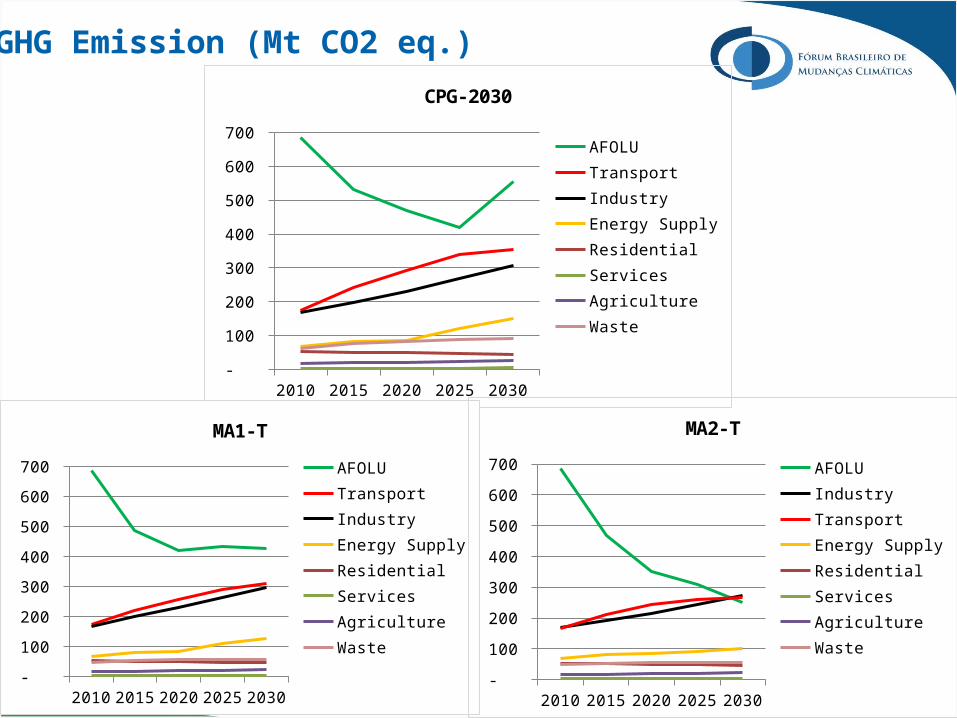
GHG Emission (Mt CO2 eq.)
2010 2015 2020 2025 2030 -
100
200
300
400
500
600
700
CPG-2030
AFOLUTransportIndustryEnergy SupplyResidentialServicesAgricultureWaste
2010 2015 2020 2025 2030 -
100
200
300
400
500
600
700
MA1-T
AFOLUTransportIndustryEnergy SupplyResidentialServicesAgricultureWaste
2010 2015 2020 2025 2030 -
100
200
300
400
500
600
700
MA2-T
AFOLUIndustryTransportEnergy SupplyResidentialServicesAgricultureWaste
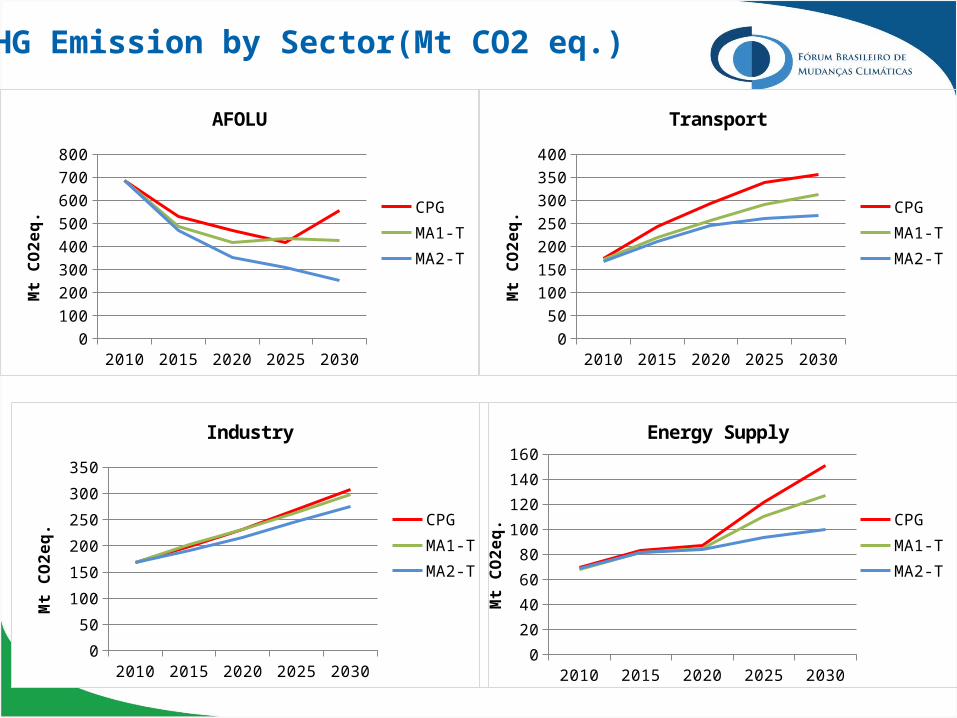
GHG Emission by Sector(Mt CO2 eq.)
2010 2015 2020 2025 20300
100
200
300
400
500
600
700
800
AFOLU
CPGMA1-TMA2-T
Mt
CO2e
q.
2010 2015 2020 2025 20300
50
100
150
200
250
300
350
400
Transport
CPGMA1-TMA2-T
Mt
CO2e
q.
2010 2015 2020 2025 20300
50
100
150
200
250
300
350
Industry
CPGMA1-TMA2-T
Mt
CO2e
q.
2010 2015 2020 2025 20300
20
40
60
80
100
120
140
160
Energy Supply
CPGMA1-TMA2-T
Mt
CO2e
q.
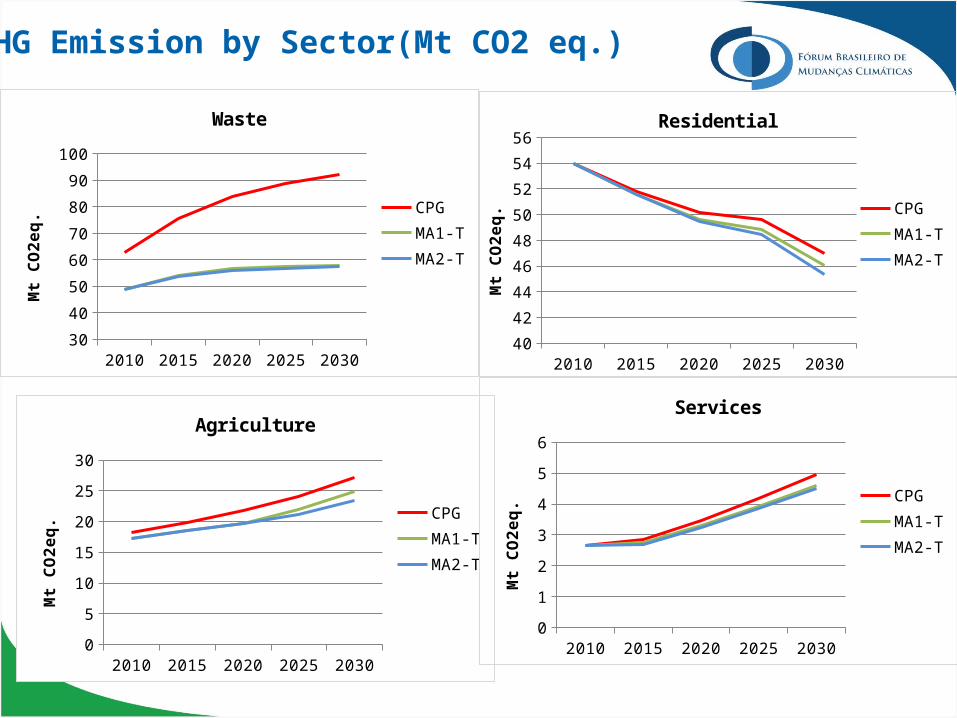
GHG Emission by Sector(Mt CO2 eq.)
2010 2015 2020 2025 20300
5
10
15
20
25
30
Agriculture
CPGMA1-TMA2-T
Mt
CO2e
q.
2010 2015 2020 2025 20300
1
2
3
4
5
6
Services
CPGMA1-TMA2-T
Mt
CO2e
q.
2010 2015 2020 2025 203030
40
50
60
70
80
90
100
Waste
CPGMA1-TMA2-T
Mt
CO2e
q.
2010 2015 2020 2025 203040
42
44
46
48
50
52
54
56Residential
CPGMA1-TMA2-T
Mt
CO2e
q.
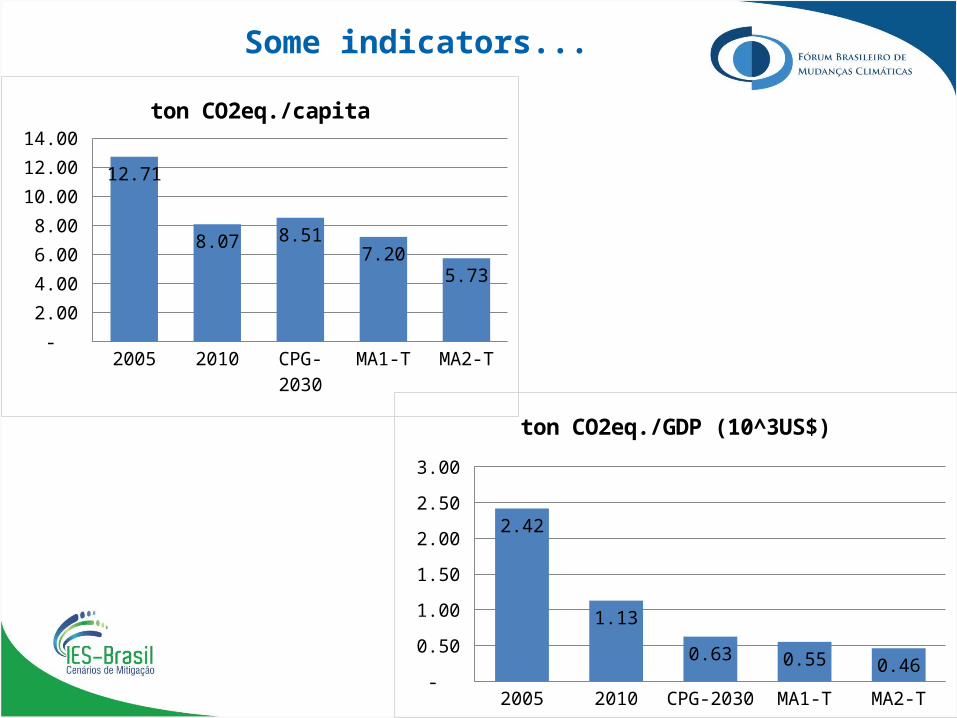
Some indicators...
2005 2010 CPG-2030 MA1-T MA2-T -
2.00
4.00
6.00
8.00
10.00
12.00
14.00
12.71
8.07 8.51 7.20
5.73
ton CO2eq./capita
2005 2010 CPG-2030 MA1-T MA2-T -
0.50
1.00
1.50
2.00
2.50
3.00
2.42
1.13
0.63 0.55 0.46
ton CO2eq./GDP (10^3US$)
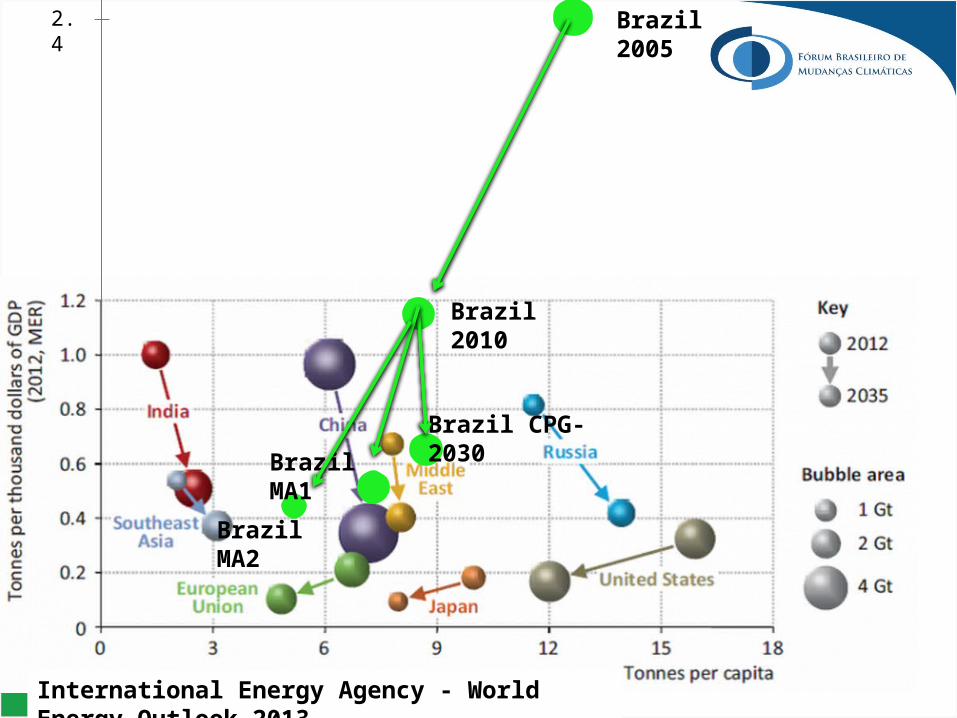
2.4 Brazil 2005
Brazil MA2
Brazil MA1
Brazil CPG-2030
Brazil 2010
International Energy Agency - World Energy Outlook 2013