Ultraviolet* Spectroscopy* - Los Angeles Mission College · Use*WoodwardMFeiser*rules*to*predict...
24
Ultraviolet Spectroscopy
Transcript of Ultraviolet* Spectroscopy* - Los Angeles Mission College · Use*WoodwardMFeiser*rules*to*predict...

Ultraviolet Spectroscopy

Ultraviolet and Visible (UV) Spectroscopy
• Spectroscopy is the study of the interac9on between ma<er and electromagne9c radia9on.
• UV/Vis spectroscopy provides informa9on about compounds with conjugated double bonds.
• The Ultraviolet region of the electromagne9c spectrum extends from 200 – 400 nm.

Ultraviolet and Visible (UV) Spectroscopy
• Conjugated compounds can absorb light in the ultraviolet region of the spectrum
• The electrons in the highest occupied molecular orbital (HOMO) undergo a transi9on to the lowest unoccupied molecular orbital (LUMO)
• The region from 2 x 10-‐7m to 4 x 10-‐7m (200 to 400 nm) is most useful in organic chemistry
• A plot of absorbance (log of the ra9o of the intensity of light in over light transmi<ed) against wavelength in this region is an ultraviolet spectrum

Ultraviolet and Visible (UV) Spectroscopy
• When an organic molecule is irradiated with electromagne9c energy, the radia9on either is absorbed by the compound or passes through, depending on the radia9on’s exact energy.
• When (UV) radia9on is used, the energy absorbed by a molecule correspond to the amount necessary to exact energy from one molecular orbital to another.

Ultraviolet and Visible (UV) Spectroscopy
• The UV spectrum is recorded by irradia9ng the sample with UV light of con9nuously changing wavelength (200 – 400 nm).
• When the wavelength of light corresponds to the energy level required to excite an electron to a higher level, energy is absorbed.
• Absorp9on is detected and displayed on a chart that plots λ vs % radia9on absorbed.

A UV Spectrum

• Example: 1,3-‐butadiene has four π molecular orbitals with the lowest two occupied
• Electronic transi9on is from HOMO to LUMO at 217 nm (peak is broad because of combina9on with stretching, bending)
Ultraviolet Spectrum of 1,3-‐Butadiene
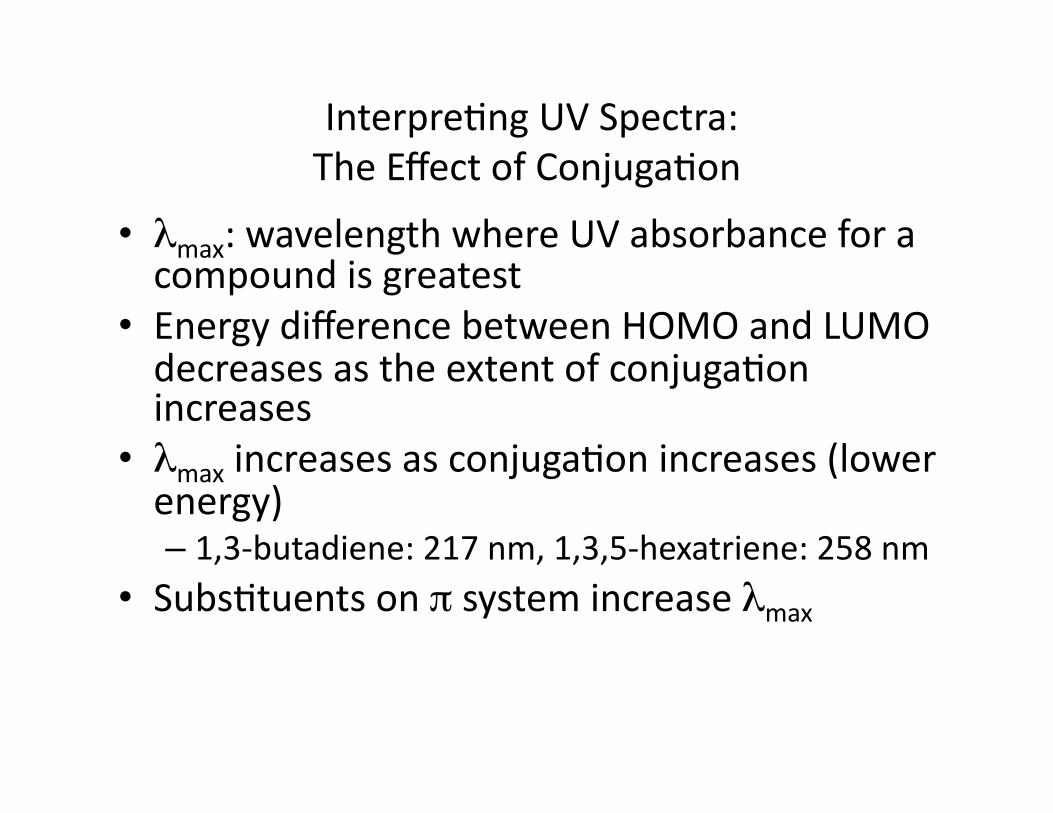
• λmax: wavelength where UV absorbance for a compound is greatest
• Energy difference between HOMO and LUMO decreases as the extent of conjuga9on increases
• λmax increases as conjuga9on increases (lower energy) – 1,3-‐butadiene: 217 nm, 1,3,5-‐hexatriene: 258 nm
• Subs9tuents on π system increase λmax
Interpre9ng UV Spectra: The Effect of Conjuga9on

An Electronic Transi9on
Only organic compounds with π electrons can produce UV/Vis spectra.
A UV spectrum is obtained if UV light is absorbed.
A visible spectrum is obtained if visible light is absorbed.

The More Conjugated Double Bonds, the Longer the Wavelength

A UV Spectrum

Conjuga9on Makes the Electronic Transi9on Easier

Conjuga9on Makes the Electronic Transi9on Easier

Colored Compounds Absorb Visible Light (> 400 nm)

• Visible region is about 400 to 800 nm • Extended systems of conjuga9on absorb in visible region • β-‐Carotene, 11 double bonds in conjuga9on, λmax = 455 nm • Visual pigments are responsible for absorbing light in eye and triggering
nerves to send signal to brain
Conjuga9on, Color, and the Chemistry of Vision

• Absorbance for a par9cular compound in a specific solvent at a specified wavelength is directly propor9onal to its concentra9on
• You can follow changes in concentra9on with 9me by recording absorbance at the wavelength
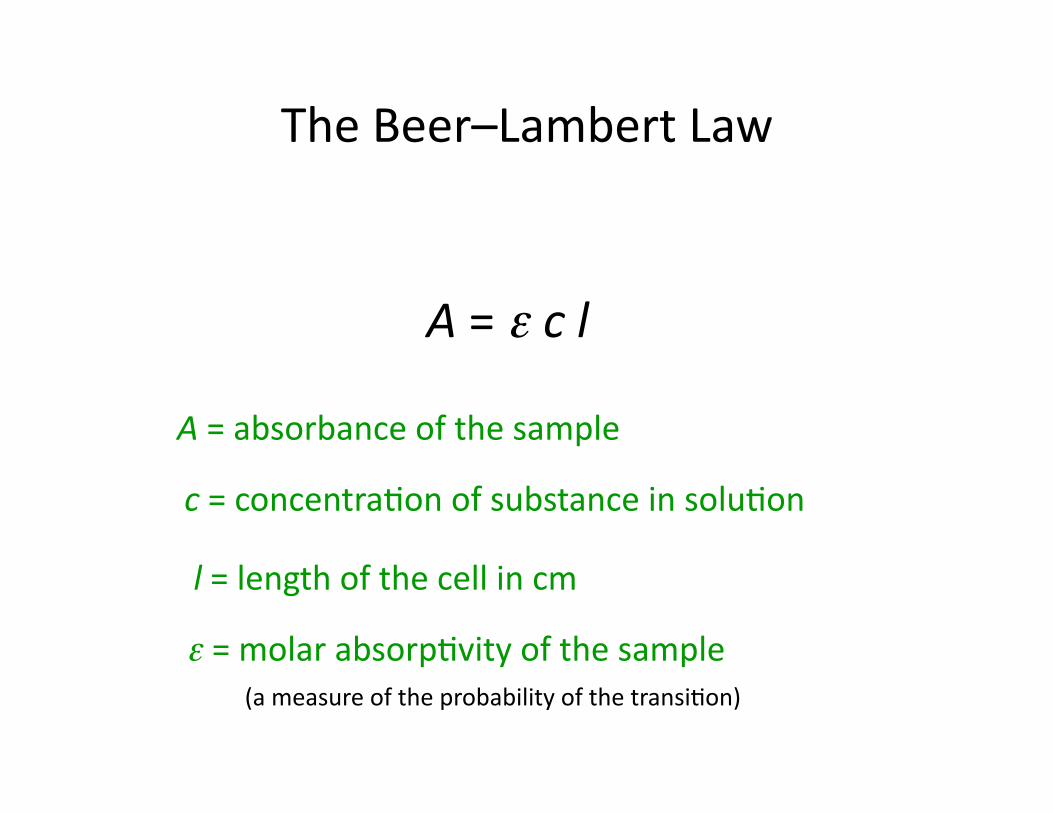
• Beers’ law: absorbance = εcl – “ε” is molar absorp9vity (ex9nc9on coefficient) – “c” is concentra9on in mol/L – “l” is path of light through sample in cm
Quan9ta9ve Use of UV Spectra
The Beer–Lambert Law
A = ε c l
A = absorbance of the sample
c = concentra9on of substance in solu9on
l = length of the cell in cm
ε = molar absorp9vity of the sample (a measure of the probability of the transi9on)

UV/Vis Absorp9on Bands are Broad
UV/Vis absorp9on bands are broad because an electronic state has vibra9onal sublevels.

Chromophore
A chromophore is that part of a molecule that is responsible for a UV/Vis spectrum.

Auxochrome
An auxochrome is a subs9tuent that alters the posi9on and the intensity of the absorp9on.

The Color Observed Depends on the Color Absorbed

Common Dyes

Terms describing UV absorp9ons
1. Chromophores: functional group(s) of a molecule responsible for the absorption of light.
2. Auxochromes: functional group that does not itself absorb in the UV region above 200 nm, but does not effect of shifting chromophore peaks to longer λ. Substituents with unshared pair e's like OH, NH, SH ..., when attached to π chromophore they generally move the absorption maximum to longer λ.
3. Bathochromic shift: shift to longer λ or lower frequency, also called red shift.
4. Hysochromic shift: shift to shorter λ or higher frequency, also called blue shift.
5. Hyperchromism: increase in ε of a band. 6. Hypochromism: decrease in ε of a band.

Calcula9ng λmax
Use Woodward-‐Feiser rules to predict λmax for: Benzoyl Deriva9ves
Unsaturated Acids and Esters
Unsaturated Aldehydes
Enones
Homoannular (cisoid) dienes
Heteroannular (transoid) dienes