
Ultrasound real-time elastography can predict - BioMed Central
11
RESEARCH ARTICLE Open Access Ultrasound real-time elastography can predict malignancy in BI-RADS W -US 3 lesions Sebastian Wojcinski 1* , Esther Boehme 2 , André Farrokh 2 , Philipp Soergel 1 , Friedrich Degenhardt 2 and Peter Hillemanns 1 Abstract Background: Lesions of the breast that are classified BI-RADS W -US 3 by ultrasound are probably benign and observation is recommended, although malignancy may occasionally occur. In our study, we focus exclusively on BI-RADS W -US 3 lesions and hypothesize that sonoelastography as an adjunct to conventional ultrasound can identify a high-risk-group and a low-risk-group within these patients. Methods: A group of 177 breast lesions that were classified BI-RADS W -US 3 were additionally examined with real-time sonoelastography. Elastograms were evaluated according to the Tsukuba Elasticity Score. Pretest and posttest probability of disease (POD), sensitivity (SE), specificity (SP), positive (PPV) and negative predictive values (NPV) and likelihood-ratios (LR) were calculated. Furthermore, we analyzed the false-negative and false-positive cases and performed a model calculation to determine how elastography could affect the proceedings in population screening. Results: In our collection of BI-RADS W -US 3 cases there were 169 benign and eight malignant lesions. The pretest POD was 4.5% (95% confidence interval (CI): 2.1–9.0). In patients with a suspicious elastogram (high-risk group), the posttest POD was significantly higher (13.2%, p = 0.041) and the positive LR was 3.2 (95% CI: 1.7–5.9). With a benign elastogram (low-risk group), the posttest POD decreased to 2.2%. SE, SP, PPV and NPV for sonoelastography in BI-RADS W -US 3 lesions were 62.5% (95% CI: 25.9–89.8), 80.5% (95% CI: 73.5–86.0), 13.2% (95% CI: 5.0–28.9) and 97.8% (95% CI: 93.3–99.4), respectively. Conclusions: Sonoelastography yields additional diagnostic information in the evaluation of BI-RADS W -US 3 lesions of the breast. The examiner can identify a low-risk group that can be vigilantly observed and a high-risk group that should receive immediate biopsy due to an elevated breast cancer risk. Keywords: Sonoelastography, Breast lesions, BI-RADS-US 3, Diagnostic accuracy, Breast cancer, Breast imaging Background More than one million women are newly diagnosed with breast cancer each year [1]. Industrial nations with the highest cancer rates include the U.S.A, Italy, Australia, Germany, the Netherlands, Canada and France [2]. In 2000, the last year for which global data exists, approxi- mately 400,000 women died from breast cancer, rep- resenting 1.6 per cent of all female deaths [3]. The early detection of breast cancer has moved into the very focus of primary health care. There is sound evidence that the recent decline in cancer mortality observed in several countries is due to early detection to a significant extent [4]. The responsibility for this success includes improve- ments in imaging technologies, but is also due to a higher degree of health awareness and educational pro- grams. Nevertheless, a significant number of false- positive and false-negative findings still occur [5]. The consequence of a false-positive result in diagnostic im- aging is the performance of an unnecessary biopsy. A false-negative result has an even more serious implica- tion as the diagnosis of malignancy is delayed, with a po- tentially worse clinical outcome for the patient. In order to prevent excessive biopsies on the one hand and, in particular, to guarantee the highest level of patient safety * Correspondence: [email protected] 1 Hannover Medical School, Department of OB/GYN, OE 6410, Carl-Neuberg-Straße 1, 30625 Hannover, Germany Full list of author information is available at the end of the article © 2013 Wojcinski et al.; licensee BioMed Central Ltd. This is an Open Access article distributed under the terms of the Creative Commons Attribution License (http://creativecommons.org/licenses/by/2.0), which permits unrestricted use, distribution, and reproduction in any medium, provided the original work is properly cited. Wojcinski et al. BMC Cancer 2013, 13:159 http://www.biomedcentral.com/1471-2407/13/159
Transcript of Ultrasound real-time elastography can predict - BioMed Central

Wojcinski et al. BMC Cancer 2013, 13:159http://www.biomedcentral.com/1471-2407/13/159
RESEARCH ARTICLE Open Access
Ultrasound real-time elastography can predictmalignancy in BI-RADSW-US 3 lesionsSebastian Wojcinski1*, Esther Boehme2, André Farrokh2, Philipp Soergel1, Friedrich Degenhardt2
and Peter Hillemanns1
Abstract
Background: Lesions of the breast that are classified BI-RADSW-US 3 by ultrasound are probably benign andobservation is recommended, although malignancy may occasionally occur.In our study, we focus exclusively on BI-RADSW-US 3 lesions and hypothesize that sonoelastography as an adjunctto conventional ultrasound can identify a high-risk-group and a low-risk-group within these patients.
Methods: A group of 177 breast lesions that were classified BI-RADSW-US 3 were additionally examined withreal-time sonoelastography. Elastograms were evaluated according to the Tsukuba Elasticity Score. Pretest andposttest probability of disease (POD), sensitivity (SE), specificity (SP), positive (PPV) and negative predictive values(NPV) and likelihood-ratios (LR) were calculated. Furthermore, we analyzed the false-negative and false-positivecases and performed a model calculation to determine how elastography could affect the proceedings inpopulation screening.
Results: In our collection of BI-RADSW-US 3 cases there were 169 benign and eight malignant lesions. The pretestPOD was 4.5% (95% confidence interval (CI): 2.1–9.0). In patients with a suspicious elastogram (high-risk group), theposttest POD was significantly higher (13.2%, p = 0.041) and the positive LR was 3.2 (95% CI: 1.7–5.9). With a benignelastogram (low-risk group), the posttest POD decreased to 2.2%. SE, SP, PPV and NPV for sonoelastography inBI-RADSW-US 3 lesions were 62.5% (95% CI: 25.9–89.8), 80.5% (95% CI: 73.5–86.0), 13.2% (95% CI: 5.0–28.9) and 97.8%(95% CI: 93.3–99.4), respectively.
Conclusions: Sonoelastography yields additional diagnostic information in the evaluation of BI-RADSW-US 3 lesionsof the breast. The examiner can identify a low-risk group that can be vigilantly observed and a high-risk group thatshould receive immediate biopsy due to an elevated breast cancer risk.
Keywords: Sonoelastography, Breast lesions, BI-RADS-US 3, Diagnostic accuracy, Breast cancer, Breast imaging
BackgroundMore than one million women are newly diagnosed withbreast cancer each year [1]. Industrial nations with thehighest cancer rates include the U.S.A, Italy, Australia,Germany, the Netherlands, Canada and France [2]. In2000, the last year for which global data exists, approxi-mately 400,000 women died from breast cancer, rep-resenting 1.6 per cent of all female deaths [3]. The earlydetection of breast cancer has moved into the very focusof primary health care. There is sound evidence that the
* Correspondence: [email protected] Medical School, Department of OB/GYN, OE 6410,Carl-Neuberg-Straße 1, 30625 Hannover, GermanyFull list of author information is available at the end of the article
© 2013 Wojcinski et al.; licensee BioMed CentrCommons Attribution License (http://creativecreproduction in any medium, provided the or
recent decline in cancer mortality observed in severalcountries is due to early detection to a significant extent[4]. The responsibility for this success includes improve-ments in imaging technologies, but is also due to ahigher degree of health awareness and educational pro-grams. Nevertheless, a significant number of false-positive and false-negative findings still occur [5]. Theconsequence of a false-positive result in diagnostic im-aging is the performance of an unnecessary biopsy. Afalse-negative result has an even more serious implica-tion as the diagnosis of malignancy is delayed, with a po-tentially worse clinical outcome for the patient. In orderto prevent excessive biopsies on the one hand and, inparticular, to guarantee the highest level of patient safety
al Ltd. This is an Open Access article distributed under the terms of the Creativeommons.org/licenses/by/2.0), which permits unrestricted use, distribution, andiginal work is properly cited.

Wojcinski et al. BMC Cancer 2013, 13:159 Page 2 of 11http://www.biomedcentral.com/1471-2407/13/159
on the other hand, diagnostic methods should be con-tinuously refined.Today, ultrasound (US) plays a decisive role in the diag-
nostic pathways, with high sensitivity and specificity [6].Despite technical advances, the most important step inbringing breast US to its current position was the intro-duction of the standardized BI-RADSW-US-classificationsystem by the American College of Radiology (ACR) [7].The ACR BI-RADSW–US lexicon provides various cat-egories with predefined terminology to describe the dom-inant features of breast lesions accurately. According tothe ACR, each lesion should be assigned a BI-RADSW-UScategory ranging from BI-RADSW-US 0 to BI-RADSW-US6 at the end of the diagnostic procedure [7]. The distinctBI-RADSW-US classification also implies what furtherclinical action should be taken: BI-RADSW-US 4 lesionsare possibly malignant and BI-RADSW-US 5 lesions areprobably malignant. Therefore, the appropriate conse-quence is a biopsy, usually under US guidance. Malig-nancy practically never occurs in BI-RADSW-US 2 lesions,which are defined as benign findings.To our understanding, the group of BI-RADSW-US 3
lesions remains a critical category. These findings areprobably benign and short-term follow-ups are recom-mended. Nevertheless, malignancy is eventually diag-nosed in about 3% of these lesions, resulting in a delayeddiagnosis of cancer in a considerable number of patients[8]. Therefore, a suitable predictor for malignancy inBI-RADS-W-US 3 lesions would be beneficial and ofclinical relevance.
Figure 1 Tsukuba Elasticity Score (TES). Schematic view, sonoelastograpor BGR-sign.
Nowadays, newly developed US technologies may allowa better differentiation of benign and malignant masses[9]. The idea behind real-time tissue elastography(sonoelastography) is that a region of interest is subjectedto a compression force (stress) and the resulting strain(displacement) within the tissue is assessed [Figure 1]. Themost common way to apply stress is to compress thetissue with the ultrasound probe (hand-held sonoelas-tography). Another recently developed method is shearwave elastography, which uses an acoustic push pulse toinduce an elastic shear wave that propagates through thetissue. The velocity of the shear wave is measured by de-tection pulses and provides a quantitative measurement oftissue stiffness [10].Our study was based on hand-held sonoelastography.
In a recent meta-analysis regarding all BI-RADSW-UScategories, this non-invasive ultrasound-based methoddemonstrated a good sensitivity of 79% and an excellentspecificity of 88% compared to conventional B-mode US(96% and 70%, respectively) [11]. Furthermore, whensonoelastography is applied to a predefined group oflesions, a diagnostic advantage may be achieved. Thishas been demonstrated in a subgroup analysis ofBI-RADSW-US 3 lesions, where the probability of dis-ease (POD) significantly increased from 8.3% to 45.5%with a suspicious elastogram [6].Therefore, we designed our prospective study to con-
centrate exclusively on BI-RADSW-US 3 lesions, andscrutinize whether sonoelastography can truly filter outmalignancy in this group.
hy and B-mode ultrasound of lesions categorized as TES 1–5

Wojcinski et al. BMC Cancer 2013, 13:159 Page 3 of 11http://www.biomedcentral.com/1471-2407/13/159
Our hypothesis is that elastography can identify ahigh-risk group (prevalence of malignancy significantlyincreased) and a low-risk group (prevalence of malig-nancy significantly decreased) within the cohort of pa-tients with a BI-RADSW-US 3 lesion (overall prevalenceof malignancy about 3%).
MethodsGeneral designOur study was carried out at the Breast Cancer Centerof Franziskus Hospital in Bielefeld, Germany. The studycohort was selected from patients who were referred toour clinic due to specific diagnostic queries. Patientswith a sonographically visible lesion categorized asBI-RADSW-US 3 were regarded as being suitable for ourstudy. Patients with a current treatment of breast cancer,skin disorders, inflammatory conditions of the breast,current pregnancy or lactation or psychiatric problemswere excluded. Ultrasound examinations and sonoelas-tography were not performed under study conditions butfor diagnostic purposes within the routine practice of ourbreast cancer center. As we were using a standard of careclinical protocol, the responsible ethics committee did notrequire additional approval for the non-interventional de-sign of our prospective case study (Hannover MedicalSchool, Ethics committee, Study-ID 1414–2012).
Ultrasound examinationsUltrasound examinations were performed by the authorSW, a DEGUM (Deutsche Gesellschaft für Ultraschall inder Medizin, German society for ultrasound in medi-cine) level II certified senior consultant in gynecologywith 7 years’ experience in breast US [12]. For sonog-raphy, two high-end ultrasound scanners were used:
1. The Siemens ACUSON S2000™ ultrasound system(Siemens Medical Solutions, Inc., Mountain View,CA, USA) equipped with the 18 L6 HD lineartransducer (5.5–18 MHz, 5.7 cm)
2. The Hitachi HI VISION AviusW ultrasound system(Hitachi Medical Corporation, Inc., Tokyo, Japan)equipped with the EUP L74M linear transducer(5–13 MHz, 5.0 cm) or the EUP-L65 linear probe(6–14 MHz, 3.8 cm)
One-hundred and fifty-three lesions were scannedwith the ACUSON S2000™ and 24 lesions were scannedwith the Hitachi HI VISION AviusW.All patients received bilateral whole breast ultrasound.
B-mode pictures of the lesion were obtained and docu-mented in two planes. As previously reported, the orien-tation of the probe does not influence the elastographicscore [13]. Therefore, the elastograms were taken eitherin the sagittal or horizontal orientation. In the most
common mode for sonoelastography, hard tissue appearsblue to turquoise and soft tissue appears red to green ona continuous scale ranging from red through yellow,green and turquoise to blue [Figures 1, 2, 3, 4 and 5].According to the national regulating authority statutes,
breast US systems have to fulfill basic technical require-ments and undergo regular quality control measures[14]. These standards applied to the equipment used inour study.Following the ultrasound examination, further diag-
nostic steps (i.e. magnetic resonance imaging, mammog-raphy, core needle biopsy, open biopsy or follow-upexaminations) were conducted whenever necessary. Fi-nally, we used the following means to define the benignor malignant nature of the lesions:57 lesions (32.2%) were followed up after 6 months
and/or additionally examined by other imaging methodsand finally staged down to BI-RADSW 2 and conse-quently categorized as certainly benign. In 120 cases(67.8%) it was considered necessary to perform a fineneedle aspiration, an open biopsy or a core needle bi-opsy at the time of the first consultation or during oneof the follow-up visits.
Image interpretation and data managementThe elastograms were evaluated using the Tsukuba Elas-ticity Score (TES), also known as the Itoh-Score orElasto-Score, which is a 5-point strain partly corre-sponding to the BI-RADS classification [Figure 1]. Thecut-off point for malignancy is between TES 3 and TES4 [15]. Therefore, lesions that are categorized as TES 1,2 or 3 are considered probably benign, and lesions cate-gorized as TES 4 and 5 are suspicious for cancer.Due to technical reasons, liquid cysts are regularly as-
sociated with the BGR-sign (blue-green-red-sign, a colorpattern with blue in the top area of the lesion, green inthe middle and red at the bottom that particularly ap-plies to the Hitachi system) or with a color distributionresembling a “bull’s-eye” (which particularly applies tothe Siemens system). Lesions displaying these colordistributions are defined as probably benign, as thisphenomenon is regularly and exclusively observed incysts [16,17].
StatisticsMicrosoftW Office ExcelW 2003 (Microsoft Corporation)was used for data collection.Statistical analysis was performed using MedCalcW
11.6 statistical software (MedCalc Software bvba,Belgium). In the primary analysis, we calculated the pre-test probability of disease (POD) as well as the posttestPOD in the high-risk group (suspicious elastogram) andin the low-risk group (benign elastogram). Pairwise com-parisons were performed using the Z-test. Furthermore,

Figure 2 BI-RADSW-US 3 lesion with a suspicious elastogram, TES 4. The lesion was revealed to be malignant (true positive case).
Wojcinski et al. BMC Cancer 2013, 13:159 Page 4 of 11http://www.biomedcentral.com/1471-2407/13/159
we calculated the positive likelihood ratio (high-riskgroup) and the negative likelihood ratio (low-risk group).If the lower boundary was greater than one for the high-risk group and if the upper boundary was less than onefor the low-risk group the null hypotheses could berejected. Secondarily, we calculated sensitivity, specificityand predictive values based on the Bayesian theorem.For the calculation of 95% confidence levels we usedNewcombe intervals with continuity correction [18].Normality was tested with the Agostino-Pearson-test.The Student’s t-test was used for numerical data andcomparison of means when normality holds. For dis-
Figure 3 BI-RADSW-US 3 lesion with a benign elastogram, TES 2. The
tributions far from normal, the Mann–Whitney U testwas used. Statistical significance was assumed at p < 0.05for all tests.Furthermore, we performed a model calculation to de-
termine how elastography could affect the proceedingsin population screening with a given prevalence ofBI-RADSW-US 3 lesions. For this purpose, we compareddata from the literature concerning the biopsy rate inBI-RADSW-US 3 lesions with the estimated proportionof BI-RADSW-US 3 lesions that would be biopsiedafter an additional elastogram by simple percentagecalculation.
lesion was revealed to be malignant (false negative case).
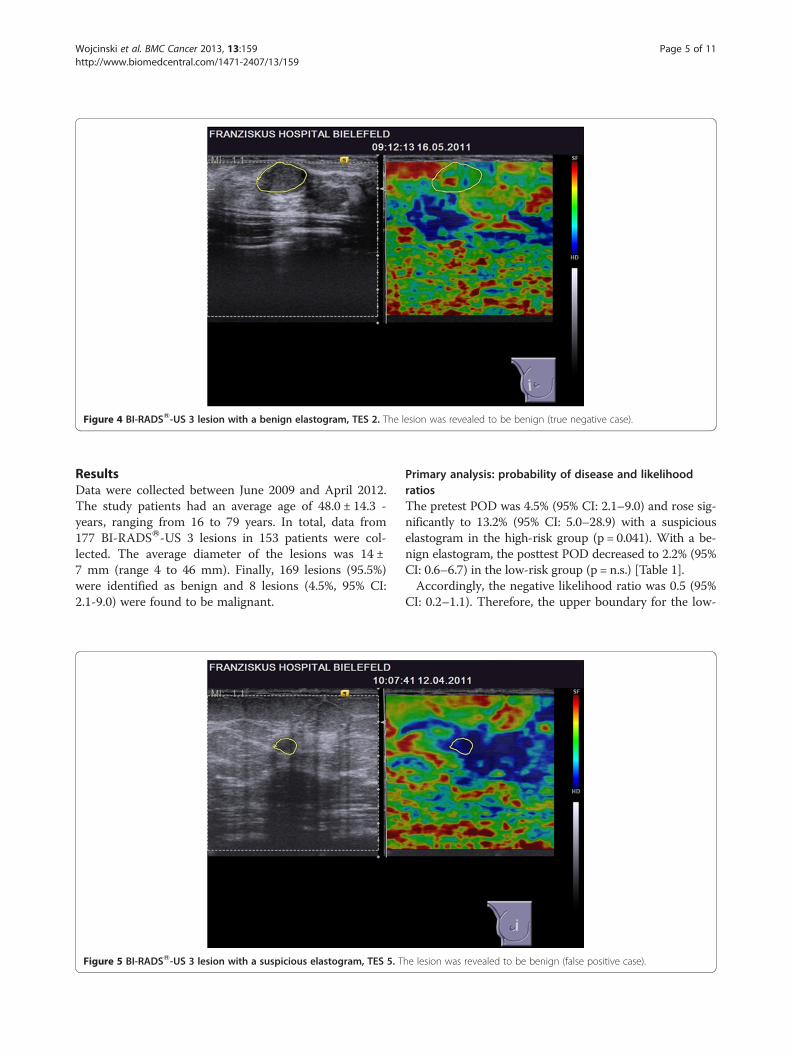
Figure 4 BI-RADSW-US 3 lesion with a benign elastogram, TES 2. The lesion was revealed to be benign (true negative case).
Wojcinski et al. BMC Cancer 2013, 13:159 Page 5 of 11http://www.biomedcentral.com/1471-2407/13/159
ResultsData were collected between June 2009 and April 2012.The study patients had an average age of 48.0 ± 14.3 -years, ranging from 16 to 79 years. In total, data from177 BI-RADSW-US 3 lesions in 153 patients were col-lected. The average diameter of the lesions was 14 ±7 mm (range 4 to 46 mm). Finally, 169 lesions (95.5%)were identified as benign and 8 lesions (4.5%, 95% CI:2.1-9.0) were found to be malignant.
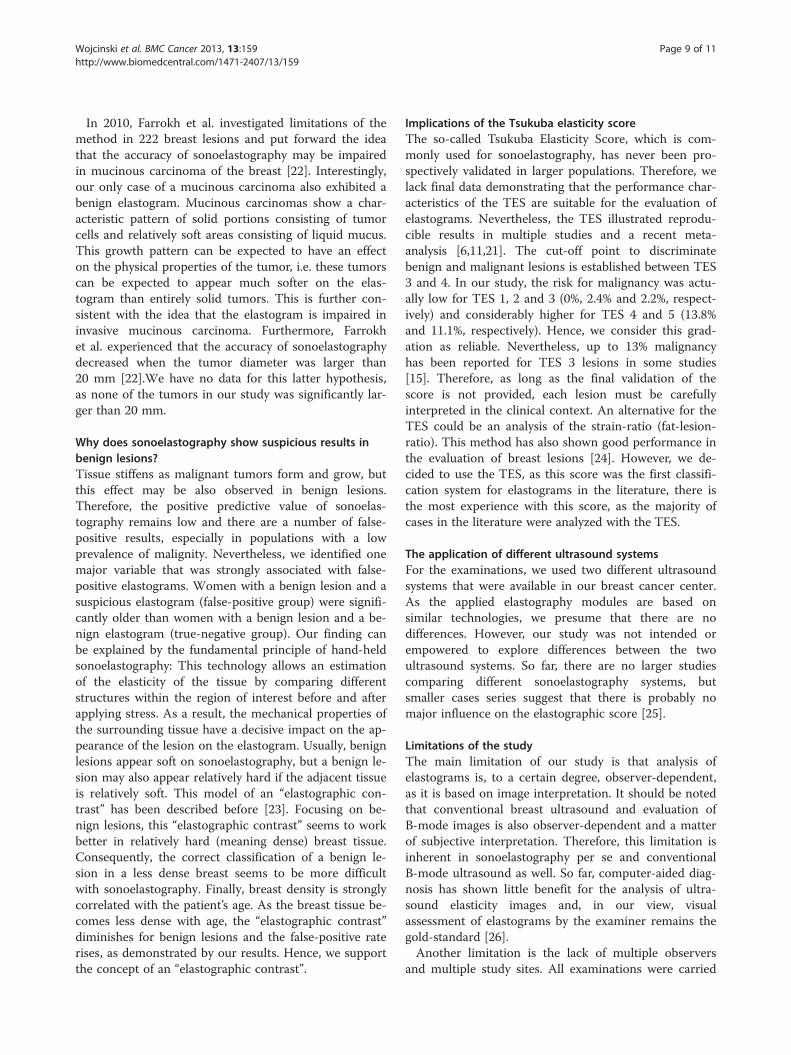
Figure 5 BI-RADSW-US 3 lesion with a suspicious elastogram, TES 5. T
Primary analysis: probability of disease and likelihoodratiosThe pretest POD was 4.5% (95% CI: 2.1–9.0) and rose sig-nificantly to 13.2% (95% CI: 5.0–28.9) with a suspiciouselastogram in the high-risk group (p = 0.041). With a be-nign elastogram, the posttest POD decreased to 2.2% (95%CI: 0.6–6.7) in the low-risk group (p = n.s.) [Table 1].Accordingly, the negative likelihood ratio was 0.5 (95%
CI: 0.2–1.1). Therefore, the upper boundary for the low-
he lesion was revealed to be benign (false positive case).

Table 1 Primary outcome analysis
Effect of sonoelastography on the probability of disease
TES 1–3 or BGR-sign (test negative,benign elastogram, low-risk group)
TES 4–5 (test positive, suspiciouselastogram, high-risk group)
pretest POD 4.5% a, b (2.1-9.0)
posttest POD 2.2% b, c (0.6-6.7) 13.2% a, c (5.0-28.9)
Likelihood ratio 0.5 (0.2-1.1) 3.2 (1.7-5.9)
Comparison of pretest- and posttest-POD and likelihood ratios.95% confidence interval in brackets.POD = probability of disease; TES = Tsukuba elasticity score; BGR = blue-green-red.a p = 0.041 (comparison of POD before test and POD after positive test).b p = 0.268 (comparison of POD before test and POD after negative test).c p = 0.004 (comparison of POD after negative test and POD after positive test).
Wojcinski et al. BMC Cancer 2013, 13:159 Page 6 of 11http://www.biomedcentral.com/1471-2407/13/159
risk group marginally failed to be smaller than one, andfor this group the null hypothesis could not be rejected.Moreover, for the high-risk group, the positive likeli-
hood ratio was 3.2 (95% CI: 1.7–5.9). In this group thelower boundary was greater than one and, consequently,we could reject the null hypothesis.
Sensitivity, specificity, predictive values and prevalence ofmalignancyThe sensitivity of the sonoelastography was 62.5% (95%CI: 25.9–89.8), which means that sonoelastographycould recognize approximately two out of three malig-nancies in the group of BI-RADSW-US 3 lesions. Thespecificity was 80.5% (95% CI: 73.5–86.0), and the posi-tive and negative predictive values were found to be13.2% (95% CI: 5.0–28.9) and 97.8% (95% CI: 93.3–99.4),respectively [Table 2].
Table 3 Prevalence of malignant lesions within thedifferent elastography scores
Descriptive analysis of the malignant lesionsThe prevalence of malignancy was 4.5% (95% CI: 2.1–9.0) for the BI-RADSW-US 3 lesions in our study, as weeventually detected eight breast cancer cases. Out ofthese eight lesions, none was categorized TES 1, two le-sions were categorized TES 2, one lesion was categorizedTES 3 and five lesions were correctly categorized TES 4(n = 4) or TES 5 (n = 1) [Table 3].The characteristics of the eight breast cancer cases are
shown in Table 4.
Table 2 Sensitivity, specificity and predictive values forsonoelastography in BI-RADSW-US 3 lesions
Sensitivity, specificity and predictive values for sonoelastography
Prevalence of malignancy in BI-RADSW-US 3 4.5% (2.1-9.0)
Sensitivity 62.5% (25.9-89.8)
Specificity 80.5% (73.5-86.0)
Positive predictive value 13.2% (5.0-28.9)
Negative predictive value 97.8% (93.3-99.4)
95% confidence intervals in brackets.
Seven patients presented with a mammogram, but therewas only one patient with a suspicious mammogram(BI-RADS 4) and one patient with a mammogram thatrecommended additional imaging evaluation (BI-RADS 0).The other breast cancer patients (n = 5) had benign orprobably benign mammograms (BI-RADS 2 or 3).With eight patients, the breast cancer group is too
small to permit statistical comparison of true-positive(suspicious elastogram) and false-negative (benignelastogram) cases, but there was a tendency for smallerlesions located deeper in the breast in the subgroup offalse-negative elastograms [Table 4]. Examples of a true-positive and a false-negative breast cancer case are givenin Figures 2 and 3.
Analysis of the benign lesionsFocusing on the 169 benign lesions, 136 elastograms werebenign and 33 elastograms were suspicious. Therefore,elastography showed a false-positive result in approxi-mately one out of five benign BI-RADSW-US 3 lesions.Comparing these true-negative and false-positive cases,
there was no difference regarding the size of the lesions ortheir distance from the skin. Regarding age, womenwith a suspicious elastogram (false-positive cases) weresignificantly older than women with a benign elastogram
Prevalence of malignancy according to theTsukuba Elasticity Score
TES n Prevalence of malignant lesions
1 7 0% (0.0-43.9)
2 82 2.4% (0.4-9.4)
3 46 2.2% (0.1-13.0)
4 29 13.8% (4.5-32.6)
5 9 11.1% (0.6-49.3)
BGR-sign 4 0% (0.0-60.4)
95% confidence interval in brackets. TES = Tsukuba elasticity score; BGR = blue-green-red.

Table 4 Characteristics of the breast cancer patients in our study sorted by the results from the elastogram(comparison of true positives and false negatives)
Characteristics of the breast cancer patients
Age Tumor type Longest axison histology (mm)
Longest axison US (mm)
Distance from skinon US (mm)
TES BI-RADSon MG
Time since lastMG (months)
True positive cases (suspicious elastogram in breast cancer patients)
77 IDC 21 17 5 4 3 0
73 IDC 15 22 5 4 3 14
77 DCIS 10 14 2 4 0 0
39 DCIS 5 12 6 4 n.a.1 n.a.1
58 IDC 12 12 6 5 2 12
False negative cases (benign elastogram in breast cancer patients)
71 IDC 8 8 12 2 4 0
48 IMC 8 9 4 2 2 0
71 IDC 11 12 18 3 3 0
US = ultrasound; TES = Tsukuba elasticity score; IDC = invasive ductal carcinoma; DCIS = ductal carcinoma in situ; IMC = invasive mucinous carcinoma;MG =mammography; n.a. = not available.1not available: The patient presented with a palpable lesion that was exclusively diagnosed with ultrasound as the patient was less than 40 years old.
Wojcinski et al. BMC Cancer 2013, 13:159 Page 7 of 11http://www.biomedcentral.com/1471-2407/13/159
(true-negative cases) (53.1 versus 45.9 years, p = 0.008)[Table 5]. Examples of a true-negative and a false-positiveresult are given in Figures 4 and 5.
Model calculationBased on our findings, we performed a model calculationto estimate how elastography could affect the proceedingsin screening populations. As demonstrated in the ACRIN6666 trial, BI-RADSW-US 3 lesions occur in about 19.5%of high-risk women and at least 16.6% of BI-RADSW-US 3patients can be expected to be ultimately biopsied as thelesions are upgraded in the follow-up examinations [19].This means that about 3.2% of all screened women usuallyneed a biopsy due to a BI-RADSW-US 3 lesion. In ourstudy, 21.5% of BI-RADSW-US 3 lesions had a suspiciouselastogram and immediate biopsy was recommended.Consequently, focusing on patients with BI-RADSW-US 3
Table 5 Characteristics of women with benign lesions sortedpositives and false negatives)
Characteristics of women
True negative case(benign elastogram in beni
N 136
Age (years; mean ± SD) 45.9 ± 14.0
Distance from skin in US (mm; mean ± SD) 6.6 ± 3.8
Longest axis in US (mm; mean ± SD) 13.7 ± 6.1
US-platform S: 84.6%
H: 15.4%
US = ultrasound; SD = standard deviation.1 Student’s t-test.2 Mann–Whitney U test.3 Z-Test.
lesions, the biopsy rate would increase from 16.6%(management without elastography) to 21.5% (indica-tion to biopsy based on the elastogram). Focusing onthe screening population, in which BI-RADSW-US 3 le-sions only occur in about 20% of the women, the overallbiopsy rate of 3.2% (without elastography) would in-crease to 4.2% (with elastography). However, this wouldallow the detection of 62.5% of cancers directly duringthe first consultation, instead of performing the biopsymany months or even years later after the tumor pro-gresses in the follow-up examinations.
DiscussionDiagnostic performance of sonoelastography inBI-RADSW-US 3 lesionsCompared to mammography and conventional ultra-sound, sonoelastography has previously demonstrated an
by the results from the elastogram (comparison of true
with benign lesions
sgn lesions)
False positive cases(suspicious elastogram in benign lesions)
p
33
53.1 ± 10.7 0.0081
7.3 ± 3.3 n.s.
(0.158)2
14.2 ± 9.5 n.s.
(0.361)2
S: 97.0% n.s.
H: 3.0% (0.057)3

Wojcinski et al. BMC Cancer 2013, 13:159 Page 8 of 11http://www.biomedcentral.com/1471-2407/13/159
excellent diagnostic performance in the evaluation ofbreast lesions [6]. Nevertheless, there are plenty of clin-ical situations where such additional information is notimperative. Patients almost never receive a single im-aging technique alone (i.e. conventional ultrasound,mammography or magnetic resonance imaging), butusually undergo several different examinations before re-ceiving a final diagnosis. Therefore, in a realistic setting,sonoelastography is not applied as a single method butis used in addition to other examinations in “heavily-pre-diagnosed patients”.An elastogram, for example, might be capable of iden-
tifying a breast lesion as highly suggestive of malignancy,but if this lesion was already suspicious on the mammo-gram (i.e. BI-RADSW 5) and/or in the conventionalultrasound (i.e. BI-RADSW-US 5), this additional infor-mation would not have an effect on the management ofthe patient.Therefore, we need to concentrate on patients and
breast lesions where the appropriate action is as yetunclear and a more advanced assessment is needed. Thisis the rationale for our focus on patients with BI-RADSW-US 3 lesions. The risk for malignancy is rela-tively low in this category, but can reach 3% or evenmore in distinct patient populations [7,8,20]. In ourstudy, the prevalence of breast cancer was moderatelyhigher (4.5%), but the 95% CI (2.1-9.0) suggests that ourpopulation shows an acceptable distribution of benignand malignant cases and can be regarded as representativefor other populations. Sonoelastography demonstrated ahelpful discrimination of patients into a low-risk group(posttest POD 2.2%) or a high-risk group with a signifi-cantly increased posttest POD of 13.2%. In addition, mostof the breast cancer patients in our study had a benign orprobably benign mammogram (i.e. BI-RADSW 2 or 3).Accordingly, further diagnostic steps were initially not in-dicated and the elastogram alone led to the diagnosis ofcancer.This is why we recommend the application of
sonoelastography to BI-RADSW-US 3 lesions. The deci-sion of whether to take a histological specimen ormerely perform follow-up examinations in a patient canthen be based on the results from the elastogram.
Can we detect more cancers even as we reduce thenumber of biopsies?A missed cancer or a delayed diagnosis of cancer mayhave a decisive impact on the survival of a patient.Therefore, a perfectly arranged diagnostic setting is cru-cial for our patients.Although BI-RADSW-US 3 lesions are probably be-
nign, there is still a substantial risk of malignancy for theindividual patient. As demonstrated by our results,sonoelastography has the power to identify a high-risk
group with a three-fold increased risk of malignancy aswell as a low-risk group with a decreased risk of malig-nancy. Nevertheless it has to be discussed whether thisprocedure can be transferred into our daily clinical rou-tine. When performing breast diagnostics, there are twomajor aims: On the one hand, we intend to increase thenumber of correctly and early identified breast cancers(and consequently avoid missed malignancies and de-layed diagnoses of cancer); on the other hand we try toreduce the number of unnecessary biopsies. In fact, bothaims often behave reciprocally with each other. Never-theless, our investigations should be aimed at developingmethods that have a significant effect on diagnosticaccuracy, but which only cause a slight increase in thebiopsy rate.Concerning BI-RADSW-US 3 lesions, performing
short-term follow-up examinations has been suggested[7]. However, at least 16.6% of these patients usuallyneed a biopsy during one of these follow-ups, as thetumor progresses or changes its morphology [19]. Fur-thermore, we experience an increase of biopsies inBI-RADSW-US 3 lesions, as patients often demand ahistological confirmation rather than repeated examina-tions. As a consequence, many patients with a BI-RADSW-US 3 lesion are still biopsied today despite all ofthe recommendations.Based upon this experience, sonoelastography would
only slightly increase the number of biopsies if thistechnology were to be used as an adjunct to conven-tional ultrasound. We estimate that, in the group of BI-RADSW-US 3 lesions, the biopsy rate would increase by4.9% (from 16.6% to 21.5%), but as BI-RADSW-US 3 le-sions only occur in every fifth woman, the overall biopsyrate in the entire population would only rise by 1%.What is more, two thirds of all cancers in this groupcould be diagnosed immediately at the time of the firstexamination. To our way of thinking, the relationshipbetween the only slightly increased biopsy rate and thepositive predictive value of sonoelastography is defin-itely favorable. So far, elastography has not shown anability to decrease the biopsy rate, but patient safetycould be much higher with this technology.
Why does sonoelastography fail in some cancers?In our study, five out of eight breast cancers were cor-rectly classified as suspicious on the elastogram, butthere were also three false-negative results.In 2006, Thomas et al. published data on 108 breast
tumor patients [21]. The authors concluded that there maybe limitations to sonoelastography for lesions that areextensive, inhomogeneous, located deep in the breast or re-lated to rare histological types [21]. In our study, false-negative cases showed a tendency to be located deeper inthe breast, which matches the experiences of Thomas et al.
Wojcinski et al. BMC Cancer 2013, 13:159 Page 9 of 11http://www.biomedcentral.com/1471-2407/13/159
In 2010, Farrokh et al. investigated limitations of themethod in 222 breast lesions and put forward the ideathat the accuracy of sonoelastography may be impairedin mucinous carcinoma of the breast [22]. Interestingly,our only case of a mucinous carcinoma also exhibited abenign elastogram. Mucinous carcinomas show a char-acteristic pattern of solid portions consisting of tumorcells and relatively soft areas consisting of liquid mucus.This growth pattern can be expected to have an effecton the physical properties of the tumor, i.e. these tumorscan be expected to appear much softer on the elas-togram than entirely solid tumors. This is further con-sistent with the idea that the elastogram is impaired ininvasive mucinous carcinoma. Furthermore, Farrokhet al. experienced that the accuracy of sonoelastographydecreased when the tumor diameter was larger than20 mm [22].We have no data for this latter hypothesis,as none of the tumors in our study was significantly lar-ger than 20 mm.
Why does sonoelastography show suspicious results inbenign lesions?Tissue stiffens as malignant tumors form and grow, butthis effect may be also observed in benign lesions.Therefore, the positive predictive value of sonoelas-tography remains low and there are a number of false-positive results, especially in populations with a lowprevalence of malignity. Nevertheless, we identified onemajor variable that was strongly associated with false-positive elastograms. Women with a benign lesion and asuspicious elastogram (false-positive group) were signifi-cantly older than women with a benign lesion and a be-nign elastogram (true-negative group). Our finding canbe explained by the fundamental principle of hand-heldsonoelastography: This technology allows an estimationof the elasticity of the tissue by comparing differentstructures within the region of interest before and afterapplying stress. As a result, the mechanical properties ofthe surrounding tissue have a decisive impact on the ap-pearance of the lesion on the elastogram. Usually, benignlesions appear soft on sonoelastography, but a benign le-sion may also appear relatively hard if the adjacent tissueis relatively soft. This model of an “elastographic con-trast” has been described before [23]. Focusing on be-nign lesions, this “elastographic contrast” seems to workbetter in relatively hard (meaning dense) breast tissue.Consequently, the correct classification of a benign le-sion in a less dense breast seems to be more difficultwith sonoelastography. Finally, breast density is stronglycorrelated with the patient’s age. As the breast tissue be-comes less dense with age, the “elastographic contrast”diminishes for benign lesions and the false-positive raterises, as demonstrated by our results. Hence, we supportthe concept of an “elastographic contrast”.
Implications of the Tsukuba elasticity scoreThe so-called Tsukuba Elasticity Score, which is com-monly used for sonoelastography, has never been pro-spectively validated in larger populations. Therefore, welack final data demonstrating that the performance char-acteristics of the TES are suitable for the evaluation ofelastograms. Nevertheless, the TES illustrated reprodu-cible results in multiple studies and a recent meta-analysis [6,11,21]. The cut-off point to discriminatebenign and malignant lesions is established between TES3 and 4. In our study, the risk for malignancy was actu-ally low for TES 1, 2 and 3 (0%, 2.4% and 2.2%, respect-ively) and considerably higher for TES 4 and 5 (13.8%and 11.1%, respectively). Hence, we consider this grad-ation as reliable. Nevertheless, up to 13% malignancyhas been reported for TES 3 lesions in some studies[15]. Therefore, as long as the final validation of thescore is not provided, each lesion must be carefullyinterpreted in the clinical context. An alternative for theTES could be an analysis of the strain-ratio (fat-lesion-ratio). This method has also shown good performance inthe evaluation of breast lesions [24]. However, we de-cided to use the TES, as this score was the first classifi-cation system for elastograms in the literature, there isthe most experience with this score, as the majority ofcases in the literature were analyzed with the TES.
The application of different ultrasound systemsFor the examinations, we used two different ultrasoundsystems that were available in our breast cancer center.As the applied elastography modules are based onsimilar technologies, we presume that there are nodifferences. However, our study was not intended orempowered to explore differences between the twoultrasound systems. So far, there are no larger studiescomparing different sonoelastography systems, butsmaller cases series suggest that there is probably nomajor influence on the elastographic score [25].
Limitations of the studyThe main limitation of our study is that analysis ofelastograms is, to a certain degree, observer-dependent,as it is based on image interpretation. It should be notedthat conventional breast ultrasound and evaluation ofB-mode images is also observer-dependent and a matterof subjective interpretation. Therefore, this limitation isinherent in sonoelastography per se and conventionalB-mode ultrasound as well. So far, computer-aided diag-nosis has shown little benefit for the analysis of ultra-sound elasticity images and, in our view, visualassessment of elastograms by the examiner remains thegold-standard [26].Another limitation is the lack of multiple observers
and multiple study sites. All examinations were carried

Wojcinski et al. BMC Cancer 2013, 13:159 Page 10 of 11http://www.biomedcentral.com/1471-2407/13/159
out by the same examiner, who had intensive trainingand many years’ experience with sonoelastography. Toevaluate the performance under realistic conditions, thestudy concept should be repeated with multiple ob-servers with different levels of experience. The outcomebias was minimized in our study setting, as the examinerdid not know the final nature of the lesion at the time ofthe elastographic assessment. Furthermore, the B-modeimages yielded no additional information, as all lesionswere categorized BI-RADSW-US 3 and appeared prob-ably benign.Finally, to prove our concept, we see an imperative
need for a prospective, multicenter trial to fully evaluatebreast sonoelastography in a standard clinical setting.Furthermore, studies focusing on other risk groups(i.e. BI-RADSW 4a, 4b and 4c) would be beneficial.
ConclusionsSonoelastography yields additional diagnostic informa-tion in the evaluation of BI-RADSW-US 3 lesions of thebreast and enables the examiner to identify a low-riskgroup that can be watchfully observed as well as a high-risk group that should receive immediate biopsy due toan elevated breast cancer risk.
Competing interestsThe authors declare that they have no competing interests.
Authors’ contributionsSW and AF contributed to the conception and design of the study and SWperformed the ultrasound examinations. EB performed data collection. SWand EB contributed to the statistical analysis and the writing of themanuscript. PH and PS conducted final reviews of the database and themanuscript and FD provided additional methodological advice. All authorsread and approved the final manuscript.
AcknowledgementPublication costs were covered by a grant of the DFG (German ResearchFoundation) within the project “Open Access Publications” at MHH(Hannover Medical School, Germany).
Author details1Hannover Medical School, Department of OB/GYN, OE 6410,Carl-Neuberg-Straße 1, 30625 Hannover, Germany. 2Franziskus Hospital,Department of OB/GYN, Bielefeld, Germany.
Received: 12 August 2012 Accepted: 19 March 2013Published: 27 March 2013
References1. Parkin DM, Bray F, Ferlay J, Pisani P: Global cancer statistics, 2002. CA
Cancer J Clin 2005, 55(2):74–108.2. IARC: Globocan Database. Lyon: International Agency for Research on
Cancer; 2008.3. IARC: World Cancer Report 2008. Lyon: International Agency for Research on
Cancer, WHO Press; 2008.4. Parkin DM, Fernandez LM: Use of statistics to assess the global burden of
breast cancer. Breast J 2006, 12(Suppl 1):S70–S80.5. Urbschat I, Kieschke J, Schlanstedt-Jahn U, Gehlen S, Thiel A, Jensch P:
Beiträge bevölkerungsbezogener Krebsregister zur Evaluation desbundesweiten Mammographie-Screenings. Gesundheitswesen 2005,67(7):448–454.
6. Wojcinski S, Farrokh A, Weber S, Thomas A, Fischer T, Slowinski T, SchmidtW, Degenhardt F: Multicenter study of ultrasound real-time tissue
elastography in 779 cases for the assessment of breast lesions:improved diagnostic performance by combining the BI-RADS(R)-USclassification system with sonoelastography. Ultraschall in der Medizin2010, 31(5):484–491.
7. Mendelson EB, Baum JK, Berg WA, Merritt CR, Rubin E, BI-RADS: Ultrasound.In Breast Imaging Reporting and Data System: ACR BI-RADS - Breast ImagingAtlas. Edited by D’Orsi CJ, Mendelson EB, Ikeda DM. Reston, VA: AmericanCollege of Radiology; 2002.
8. Hille H, Vetter M, Hackeloer BJ: The accuracy of BI-RADS classification ofbreast ultrasound as a first-line imaging method. Ultraschall Med 2012,33(2):160–163.
9. Hahn M, Roessner L, Krainick-Strobel U, Gruber IV, Kramer B, Gall C,Siegmann KC, Wallwiener D: Kagan KO: [Sonographic criteria for thedifferentiation of benign and malignant breast lesions using real-timespatial compound imaging in combination with XRES adaptive imageprocessing]. Ultraschall in der Medizin 2012, 33(3):270–274.
10. Fierbinteanu-Braticevici C, Andronescu D, Usvat R, Cretoiu D, Baicus C,Marinoschi G: Acoustic radiation force imaging sonoelastography fornoninvasive staging of liver fibrosis. World J Gastroenterol 2009,15(44):5525–5532.
11. Sadigh G, Carlos RC, Neal CH, Dwamena BA: Ultrasonographicdifferentiation of malignant from benign breast lesions: a meta-analyticcomparison of elasticity and BIRADS scoring. Breast Cancer Res Treat 2012,133(1):23–35.
12. DEGUM (Deutsche Gesellschaft für Ultraschall in der Medizin) -Mehrstufenkonzept Mammasonographie. http://www.degum.de/Mehrstufenkonzept_Mammasonogra.634.0.html.
13. Ciurea AI, Bolboaca SD, Ciortea CA, Botar-Jid C, Dudea SM: The influence oftechnical factors on sonoelastographic assessment of solid breastnodules. Ultraschall Med 2011, 32(Suppl 1):S27–S34.
14. KBV (Kassenärztliche Bundesvereinigung, German Federal Association ofFund Doctors): Ultrasound regulations. http://www.kbv.de/rechtsquellen/2488.html.
15. Itoh A, Ueno E, Tohno E, Kamma H, Takahashi H, Shiina T, Yamakawa M,Matsumura T: Breast disease: clinical application of US elastography fordiagnosis. Radiology 2006, 239(2):341–350.
16. Ueno E: The utility of real-time tissue elastography for the breast, Hitachi Real-time Tissue Elastography: Publications; International Communications, ClinicalAbstracts. http://www.bestcontact.com.my/support/downloads/hi-rte-publications-and-communications-clinical-abstracts—applications-in-womens-health-11-06-10.pdf.
17. Barr RG, Lackey AE: The utility of the “bull’s-eye” artifact on breastelasticity imaging in reducing breast lesion biopsy rate. Ultrasound Q2011, 27(3):151–155.
18. Newcombe RG: Interval estimation for the difference betweenindependent proportions: comparison of eleven methods. Stat Med 1998,17(8):873–890.
19. Barr RG, Zhang Z, Cormack JB, Mendelson EB, Berg WA, Yeh N: ProbablyBenign Lesions on Screening Breast Sonography: Prevalence and Risk ofMalignancy in the ACRIN 6666 Trial. In Presented at:Radiological Society ofNorth America 2011 Scientific Assembly and Annual Meeting. Chicago,IL: 27 November - 2 December 2011.
20. Madjar H, Ohlinger R, Mundinger A, Watermann D, Frenz JP, Bader W,Schulz-Wendtland R, Degenhardt F: BI-RADS-analogue DEGUM criteria forfindings in breast ultrasound–consensus of the DEGUM Committee onBreast Ultrasound. Ultraschall Med 2006, 27(4):374–379.
21. Thomas A, Fischer T, Frey H, Ohlinger R, Grunwald S, Blohmer JU, Winzer KJ,Weber S, Kristiansen G, Ebert B, Kummel S: Real-time elastography–anadvanced method of ultrasound: First results in 108 patients with breastlesions. Ultrasound Obstet Gynecol 2006, 28(3):335–340.
22. Farrokh A, Wojcinski S, Heymer T, Dumke K, Weber EA, Degenhardt F: DieReal-Time Sonoelastographie in der Mammadiagnostik - Limitationender Methode. Ultraschall Med 2010, 31:13_01.
23. Wojcinski S, Cassel M, Farrokh A, Soliman AA, Hille U, Schmidt W,Degenhardt F, Hillemanns P: Variations in the Elasticity of Breast TissueDuring the Menstrual Cycle Determined by Real-time Sonoelastography.J Ultrasound Med: official journal of the American Institute of Ultrasound inMedicine 2012, 31(1):63–72.
24. Thomas A, Degenhardt F, Farrokh A, Wojcinski S, Slowinski T, Fischer T:Significant differentiation of focal breast lesions: calculation of strainratio in breast sonoelastography. Acad Radiol 2010, 17(5):558–563.

Wojcinski et al. BMC Cancer 2013, 13:159 Page 11 of 11http://www.biomedcentral.com/1471-2407/13/159
25. Wojcinski S, Farrokh A, Gyapong S, Degenhardt F: Sonoelastographie:Welche Verfahren gibt es? Wie sind Handhabung undReproduzierbarkeit im klinischen Alltag? Senologie - Zeitschrift fürMammadiagnostik und -therapie 2009, 6:P042.
26. Moon WK, Choi JW, Cho N, Park SH, Chang JM, Jang M, Kim KG: Computer-aided analysis of ultrasound elasticity images for classification of benignand malignant breast masses. AJR Am J Roentgenol 2010, 195(6):1460–1465.
doi:10.1186/1471-2407-13-159Cite this article as: Wojcinski et al.: Ultrasound real-time elastographycan predict malignancy in BI-RADSW-US 3 lesions. BMC Cancer 201313:159.
Submit your next manuscript to BioMed Centraland take full advantage of:
• Convenient online submission
• Thorough peer review
• No space constraints or color figure charges
• Immediate publication on acceptance
• Inclusion in PubMed, CAS, Scopus and Google Scholar
• Research which is freely available for redistribution
Submit your manuscript at www.biomedcentral.com/submit


![Ultrasound elastography in neuromuscular and movement ......acoustic radiation force imaging (ARFI), and transient elastography (TE) [33]. 2.1. Ultrasound strain elastography Ultrasound](https://static.fdocuments.net/doc/165x107/5f02150f7e708231d4027b6b/ultrasound-elastography-in-neuromuscular-and-movement-acoustic-radiation.jpg)