Ultrasonic testing of paper: how it relates to mechanical ... · Ultrasonic testing of paper:...
18
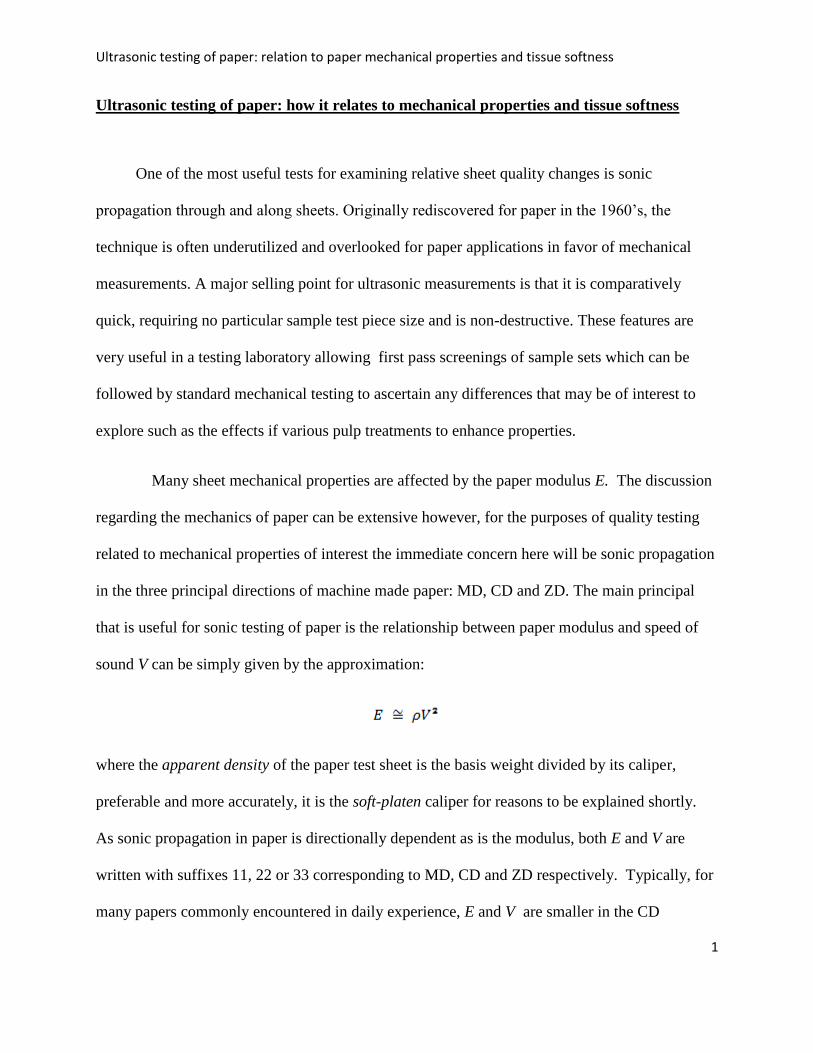
Ultrasonic testing of paper: relation to paper mechanical properties and tissue softness 1 Ultrasonic testing of paper: how it relates to mechanical properties and tissue softness One of the most useful tests for examining relative sheet quality changes is sonic propagation through and along sheets. Originally rediscovered for paper in the 1960’s, the technique is often underutilized and overlooked for paper applications in favor of mechanical measurements. A major selling point for ultrasonic measurements is that it is comparatively quick, requiring no particular sample test piece size and is non-destructive. These features are very useful in a testing laboratory allowing first pass screenings of sample sets which can be followed by standard mechanical testing to ascertain any differences that may be of interest to explore such as the effects if various pulp treatments to enhance properties. Many sheet mechanical properties are affected by the paper modulus E. The discussion regarding the mechanics of paper can be extensive however, for the purposes of quality testing related to mechanical properties of interest the immediate concern here will be sonic propagation in the three principal directions of machine made paper: MD, CD and ZD. The main principal that is useful for sonic testing of paper is the relationship between paper modulus and speed of sound V can be simply given by the approximation: where the apparent density of the paper test sheet is the basis weight divided by its caliper, preferable and more accurately, it is the soft-platen caliper for reasons to be explained shortly. As sonic propagation in paper is directionally dependent as is the modulus, both E and V are written with suffixes 11, 22 or 33 corresponding to MD, CD and ZD respectively. Typically, for many papers commonly encountered in daily experience, E and V are smaller in the CD
Transcript of Ultrasonic testing of paper: how it relates to mechanical ... · Ultrasonic testing of paper:...
Ultrasonic testing of paper: relation to paper mechanical properties and tissue softness
1
Ultrasonic testing of paper: how it relates to mechanical properties and tissue softness
One of the most useful tests for examining relative sheet quality changes is sonic
propagation through and along sheets. Originally rediscovered for paper in the 1960’s, the
technique is often underutilized and overlooked for paper applications in favor of mechanical
measurements. A major selling point for ultrasonic measurements is that it is comparatively
quick, requiring no particular sample test piece size and is non-destructive. These features are
very useful in a testing laboratory allowing first pass screenings of sample sets which can be
followed by standard mechanical testing to ascertain any differences that may be of interest to
explore such as the effects if various pulp treatments to enhance properties.
Many sheet mechanical properties are affected by the paper modulus E. The discussion
regarding the mechanics of paper can be extensive however, for the purposes of quality testing
related to mechanical properties of interest the immediate concern here will be sonic propagation
in the three principal directions of machine made paper: MD, CD and ZD. The main principal
that is useful for sonic testing of paper is the relationship between paper modulus and speed of
sound V can be simply given by the approximation:
where the apparent density of the paper test sheet is the basis weight divided by its caliper,
preferable and more accurately, it is the soft-platen caliper for reasons to be explained shortly.
As sonic propagation in paper is directionally dependent as is the modulus, both E and V are
written with suffixes 11, 22 or 33 corresponding to MD, CD and ZD respectively. Typically, for
many papers commonly encountered in daily experience, E and V are smaller in the CD

Ultrasonic testing of paper: relation to paper mechanical properties and tissue softness
2
compared to MD by about 1.5 times or greater and ZD values are about 30 times or more lower
than either MD or CD values. The ratio of MD to CD values is attributable to the combination of
fiber orientation and drying stresses acquired during paper manufacture. The much lower ZD
values reflect the compressibility and bonding level of the fiber layers in the paper structure.
The speed of sound in paper is most commonly measured using pairs of bimorph
transducers placed lightly onto the surface of the test sheet. These comprise of a metal paddle a
few millimeters wide which is made to vibrate when an alternating voltage of typical frequency
80 kHz is placed onto the piezoelectric crystals on either side of the paddle. The paddles vibrate
directionally perpendicular to their width producing a longitudinal sound wave that propagates
along the surface of the sheet. Another transducer is used to detect the transmitted sound wave.
Sound speed becomes the known distance of the spacing between transducers divided by the
time for travel of the sound wave determined electronically. Commercial instruments, the
Lorentzen-Wettre TSO, Nomura Shoji SST 250 or the Sonisys usually report the in-plane
velocity squared which is effectively E/ρ called the specific modulus or tensile stiffness index.
A popular application of sonic in-plane testing exploits the sensitivity of the method
to the MD/CD ratio. Paper machines are often several meters wide and the web in varying states
of consolidation is under tension and open draws in much of the machine leading to a cross-
machine reel profile in the MD/CD ratio in the resulting dry paper at the end of the reel. A
highly varying MD/CD ratio of edge rolls compared to rolls culled from nearer the center of the
machine cause runnability issues once the paper is run through a printing or converting process,
therefore it is desirable to minimize the MD/CD profile across a reel through a program of

Ultrasonic testing of paper: relation to paper mechanical properties and tissue softness
3
iterative adjustments of headbox stock flows, stock jet to wire speed ratios, adjustment of open
draw tensions, drying strategies, etc.
An example is provided below where cross reel strips from a linerboard producing
fourdrinier paper machine were submitted for profile analysis. Figure 1 shows the Lorentzen and
Wettre TSO along with close ups of the measuring head and a polar diagram screen shot.
a)
b) c)
d)

Ultrasonic testing of paper: relation to paper mechanical properties and tissue softness
4
Figure 1. Lorentzen and Wettre TSO intended for measuring cross reel strips a). Close-ups of
the circular array transducer head b) and c). A typical polar plot of V2 d), showing tensile
specific stiffness orientation, MD being up and CD being across for typical linerboard.
The cross reel strips were supplied as rolls that were 3 feet or longer in the MD cut with a knife
by walking along the length of the jumbo reel at the end of the paper machine. The strip as
supplied and roughly cut at the paper machine reel is laid out flat on a floor, the edge of the roll
is assumed to be the actual MD, perpendicular lines to the edges are drawn across the roll and
test strips are cut across the reel at regular intervals. It is important that to realize in profile
studies that there is an MD variation in measurements as well as a CD. The objective is to
observe whether a significant profile exists in the CD. In the Figure below, an L&W TSO tester
was used to make 4 measurements in the MD at the various successive positions across the reel.
This instrument consists of a circular array of transducers which upon being electronically
activated in alternating opposing pairs instantly provide measurements of in-plane specific
stiffness V2.

Ultrasonic testing of paper: relation to paper mechanical properties and tissue softness
5
Figure 2. MD/CD stiffness profile for the 42# samples. The “typical smile” MD/CD profile
is seen here largely due to edge shrinkage and some edge flow. Error bars are standard
deviations of 4+ measurements.
The quantity of interest in profile measurements is that ratio of VMD2/VCD
2 , the MD/CD specific
stiffness ratio. Figure 2 above shows the typical dip in the middle of the cross reel strip that is
seen in many fourdrinier style paper machines that are not optimized to have a flat profile. The
lower ratio in the middle is caused by the combination of stick edge flows and drying shrinkage
stresses. The paper web in most paper machines endures many open draws while under MD
tension and so inevitably shrinks in the CD in the manufacturing process. The contribution of
edge flows may be assessed from examining the stiffness orientation angle which is the
clockwise measured angle of the maximum V2 with respect to the assumed MD from the sample
strip edge.
Figure 3. Corresponding stiffness orientation angles for the reel strips shown in Figure 2.

Ultrasonic testing of paper: relation to paper mechanical properties and tissue softness
6
Orientation angle profiles in Figure 3 show a slight rise or dip in the middle of the machine
(positions 6 through 8) indicating an opportunity to flatten the profile through adjustment of
stock to wire speed ratio, the so-called rush/drag ratio. Orientation is measured clockwise with
respect to the assumed of true MD which is zero degrees. Negative values indicate or orientation
towards the operators’ side, positive values towards the drive side. An overall negative profile
suggests that there is too much recirculation flow causing a skewed overall flow towards the
operators’ or front side of the paper machine.
Speed of sound through the test sheet is used to determine the ZD modulus. In this
case the transducers are 1 MHz driven piezo crystals coupled to plastic contacting delay blocks
ending in neoprene sheets that contact either side of the sheet under a pressure of 50 kPa the case
of standard measurements or 20 kPa in the case of towel or tissue sheet measurements. A close-
up of the transducers of one commercial development the Sonisys instrument is shown on Figure
4. This shows the central top and bottom ZD transducers with black neoprene rubber contacting
tips with concentric pairs of in-plane transducers behind. These transducers are made to rotate
around the axis of the ZD transducer axis and dropped down by actuators to take in-plane
measurements at various angles on the test sheet. The action of the transducers is shown in
Figure 5. When the orientation of the paddles is so that they are edge to edge, then the
propagation of the waves that are detected are shear waves. This has the rather esoteric
application of determining the in-plane Poisson rations when the measurement is made at 45
degrees with respect to the MD of the sheet.
The distance that is used in calculating the speed of sound through the sheet is the sheet
thickness or caliper. Paper caliper is affected by the combination of the sheet compressibility and

Ultrasonic testing of paper: relation to paper mechanical properties and tissue softness
7
surface roughness. For towel and tissue, experimental evidence shows that caliper does not
decrease appreciable once the measuring platen caliper is 20 kPa or lower. For dense printing,
writing papers, the higher pressure of 50 kPa provides a measurement that coincides closely with
the thickness of a stack of sheets. Since paper is non-uniform on the scale of the longest fibers, a
circular platen diameter is chosen to cover several flocs or visible clumps of paper, 20 to 30 mm
is typical. Surface roughness is compensated by using soft rubber covers on the platens. The
rubber conforms to the surface undulations and provides a more accurate measurement of the
caliper. This soft platen measurement of caliper is known to provide what is termed the
mechanical equivalent or effective caliper.
Figure 4. Close-up shot of the transducer contacting ZD and in-plane probes of the Sonisys
instrument in their retracted vertical position. The test sheet is placed onto the back rubber
mat.
Ultrasonic testing of paper: relation to paper mechanical properties and tissue softness
8
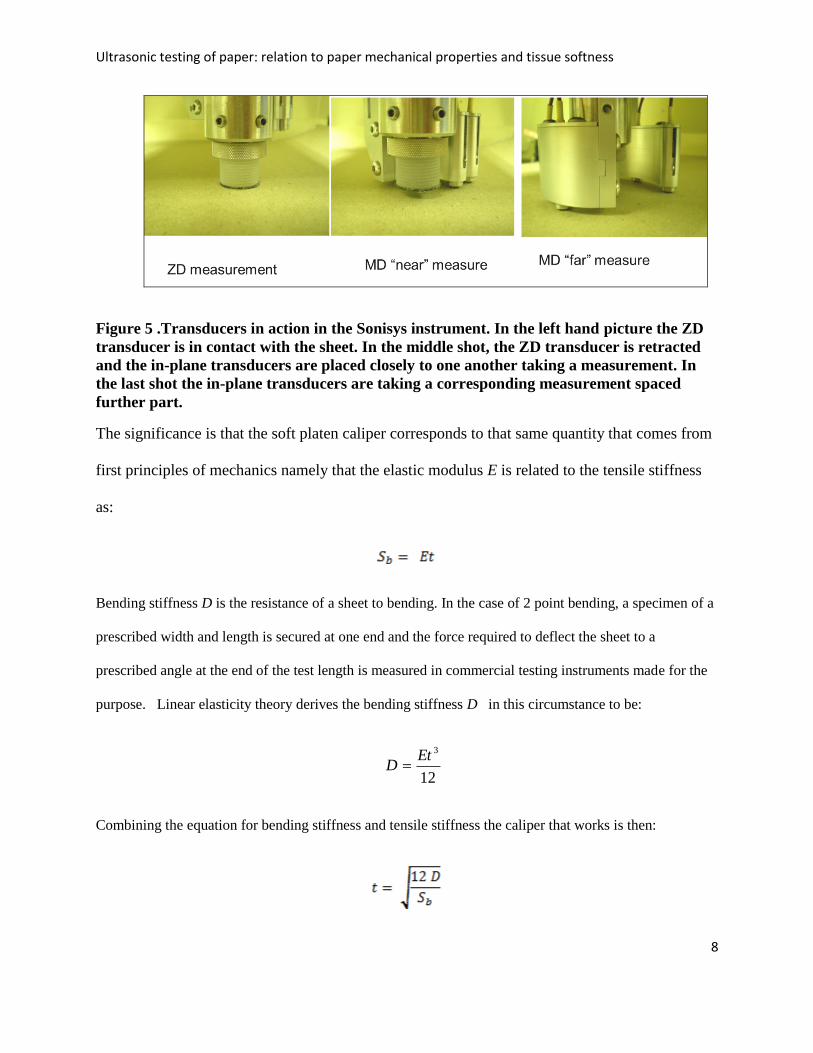
Figure 5 .Transducers in action in the Sonisys instrument. In the left hand picture the ZD
transducer is in contact with the sheet. In the middle shot, the ZD transducer is retracted
and the in-plane transducers are placed closely to one another taking a measurement. In
the last shot the in-plane transducers are taking a corresponding measurement spaced
further part.
The significance is that the soft platen caliper corresponds to that same quantity that comes from
first principles of mechanics namely that the elastic modulus E is related to the tensile stiffness
as:
Bending stiffness D is the resistance of a sheet to bending. In the case of 2 point bending, a specimen of a
prescribed width and length is secured at one end and the force required to deflect the sheet to a
prescribed angle at the end of the test length is measured in commercial testing instruments made for the
purpose. Linear elasticity theory derives the bending stiffness D in this circumstance to be:
12
3EtD
Combining the equation for bending stiffness and tensile stiffness the caliper that works is then:

Ultrasonic testing of paper: relation to paper mechanical properties and tissue softness
9
Since the objective in ultrasonic measurements is to have the measurements correlate with physical
properties, the caliper used in the calculations to convert sound speed to modulus is the soft platen caliper
which is usually less than the caliper measured by hard platens by a few percent.
Ultrasonic measurements conveniently correlate to many measured mechanical properties and in principle
can be used as a quality check. The fundamental relationship that is used in this regard is between the
tensile stiffness and the specific stiffness or sound speed squared and sheet basis weight β:
Many strength properties are related to the tensile stiffness. For example as shown by Seth and age 1983
for well consolidated papers the stress strain curve shape is largely dependent on the modulus as
determined by the fiber quality only the strength values are affected to about 25% as determined by the
degree of fiber bonding. Therefore, sonic propagation can be used to assess sheet quality for a given
sample set most easily by multiplying the basis weight of a sheet with the ultrasonically measured
specific stiffness. In Figure 3 below, a variety of paper and plastic film samples were tested for tensile
stiffness using a universal testing machine UTM and also for in plane ultrasonic specific stiffness using
an Lorentzen and Wettre TSO (tensile stiffness orientation) unit. There is a convincing correlation
between the sonic calculated stiffness βV2 and the mechanical tensile stiffness. Typically, ultrasonic
measured equivalents of physical constants are 30 – 50% higher than mechanically measured counterparts
because of the viscoelastic nature of paper.

Ultrasonic testing of paper: relation to paper mechanical properties and tissue softness
10
Figure 6. Results from a lab study using a Lorentzen and Wettre TSO instrument on a variety of
paper samples comparing the results to standard mechanical tensile stiffness.
Many strength properties are dependent of the elastic modulus and correspondingly the tensile stiffness so
that ultrasonics may be used instead of mechanical testing for a given sample set. In one example using
unbleached softwood kraft pulp handsheet that have undergone various dry strength additive treatments,
the objective was to evaluate their effect in terms of standard compression test (SCT) and also out-of-
plane crush (CMT) measured on strips sent through a laboratory corrugator and subsequently tested on a
compression tester. The results are shown in Figure 7 where it is observed that there is a good correlation
of the physical results with mechanical values.

Ultrasonic testing of paper: relation to paper mechanical properties and tissue softness
11
Figure 7. A comparison of out-of-plane corrugated strip crush with tensile stiffness
calculated as (basis weight x VCD2).
Another case using a range of linerboard and furnish medium from US Southeast mills were
analyzed for SCT and ring crush (RCT) compression tests. Again, when the results are plotted
against the CD tensile stiffness from the ultrasonics measurements shown in Figure 8, good
correlations result. The advantage in using ultrasonics to test sheet quality is that no sample
cutting or preparation is required as long as the sample can be placed into the testing instrument.
The variation in ultrasonics measurements is often smaller, about 3% compared to larger 7 to 10
% variation for many mechanical measurements. The disadvantage in relying on ultrasonic
measurements alone is that the correlation between elastic sonic measurements and inelastic
mechanical strength measurements varies if the composition of the sheets changes through
changes in furnish or additive. Therefore if used for routine quality screening, the correlation
between ultrasonic stiffness and the mechanical measurements should be checked whenever
changes are made to the product being evaluated.

Ultrasonic testing of paper: relation to paper mechanical properties and tissue softness
12
Figure 8. SCT and RCT for a selection of linerboard and corrugating medium of varying
basis weights versus ultrasonic tensile stiffness.
In the out-of-plane ZD, sonic propagation is affected by the degree of bonding between fibers.
Debonder additives are applied to towel or tissue products in attempt to improve bulk increase
absorbency and apparent softness. ZD sonic measurements are useful in assessing the potential
efficacy of debonder treatments. In Figure 9 below, a series of standard laboratory handsheets
were prepared using various levels of a conventional debonder “A” and 2 experimental
debonders “B” and “C” at 3 conventional application levels of 1.5, 3 and 5 lbs/ton dry weight of
fiber.

Ultrasonic testing of paper: relation to paper mechanical properties and tissue softness
13
Figure 9. Ultrasonic ZD measurements at 2 different platen pressures for a series of
handsheets prepared of different levels of different debonders.
There are two sets of ZD modulus data shown in Figure 9. One set is taken using a caliper
pressure of 50 kPa (high pressure platens) and the other at a pressure of 20 kPa (low pressure
platens). The lower pressure produces less compression of the sheet so that overall lower ZD
moduli are obtained compared to the corresponding values obtained at higher pressure. Both sets
of data indicate that relative to the case of the Base sheet having no additive, agent “B” applied
at the 3 lb/ton level can be expected to be the most effective treatment. Indeed, the decrease in
ZD modulus was accompanied by a significant increase in surface roughness and corresponding
increase in compressibility as measured by a difference in caliper at 50 k Pa to that at 20 k Pa.
For this sample set, no other significant differences were measured in strength and tear properties
indicating that the ultrasonic measurements were more sensitive in detecting the expected action
of the chemical additives.

Ultrasonic testing of paper: relation to paper mechanical properties and tissue softness
14
Since ZD sonic propagation is dependent on the coupling between fibers it can in principle
detect tissue softness defined as the perception of softness by tactile feel using the thumb and
fingertips of the hand. This is a contentious topic in itself, addressed by several researchers in the
past. The consensus is that softness comprises of a combination of or physical attributes such as
low bending stiffness, low surface friction high compressibility, and a microscale roughness
attributable to loose fiber ends on the surface. In sonic propagation, loose projecting fibers on the
surface along with loose interfiber contacts throughout the sheet in the absence of bonding
compromise impedance mismatch leading to attenuation of the sonic signal. The attenuation A
(dB) of the signal can be measured as one method to predict the softness using the multiple linear
regression of the form:
Softness = aZ + b A/β +cβ
where a, b, c are empirical coefficients 247.6, 19.1, and 0.82 respectively or others as may be
obtained from individual regression analysis of different sample sets, Z is the impedance defined
as the density times the sound velocity or equivalently, Z is also the basis weight β divided by the
time of flight of the signal, A is the attenuation of the transmitted signal determined from Fourier
analysis of the transmitted and received signals. An example of this application is shown in the
Figure 10 below where a selection of commercial paper towels were evaluated
Ultrasonic testing of paper: relation to paper mechanical properties and tissue softness
15
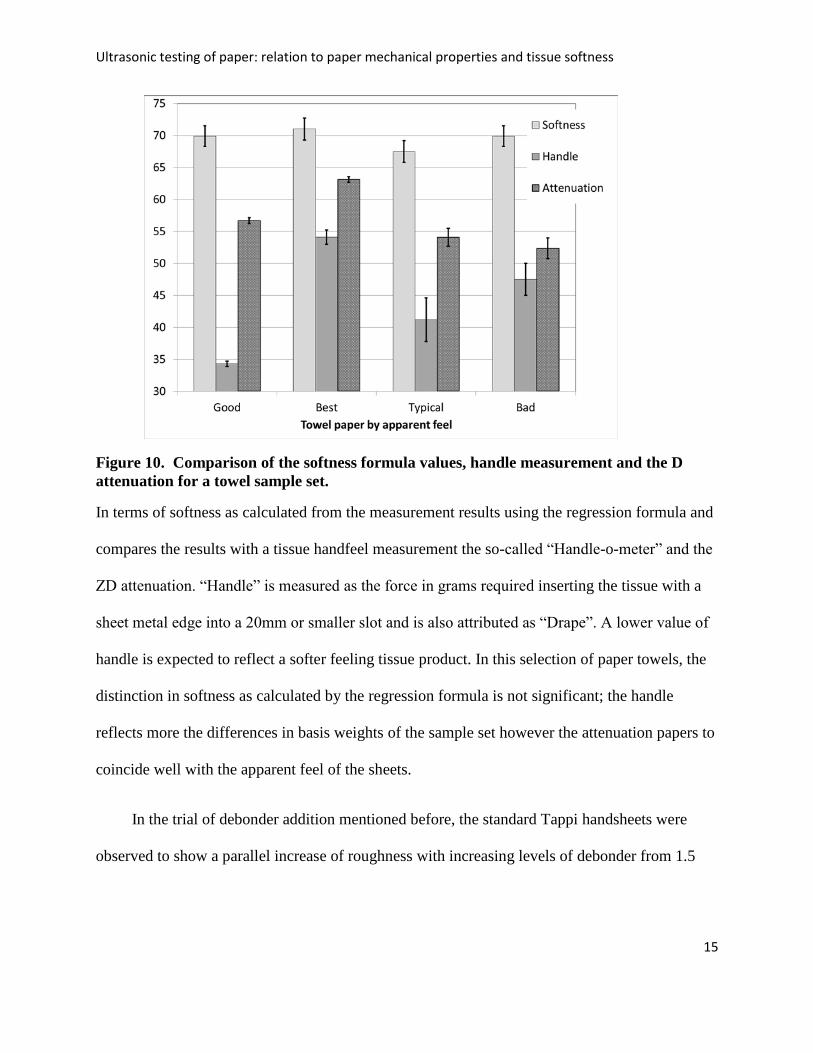
Figure 10. Comparison of the softness formula values, handle measurement and the D
attenuation for a towel sample set.
In terms of softness as calculated from the measurement results using the regression formula and
compares the results with a tissue handfeel measurement the so-called “Handle-o-meter” and the
ZD attenuation. “Handle” is measured as the force in grams required inserting the tissue with a
sheet metal edge into a 20mm or smaller slot and is also attributed as “Drape”. A lower value of
handle is expected to reflect a softer feeling tissue product. In this selection of paper towels, the
distinction in softness as calculated by the regression formula is not significant; the handle
reflects more the differences in basis weights of the sample set however the attenuation papers to
coincide well with the apparent feel of the sheets.
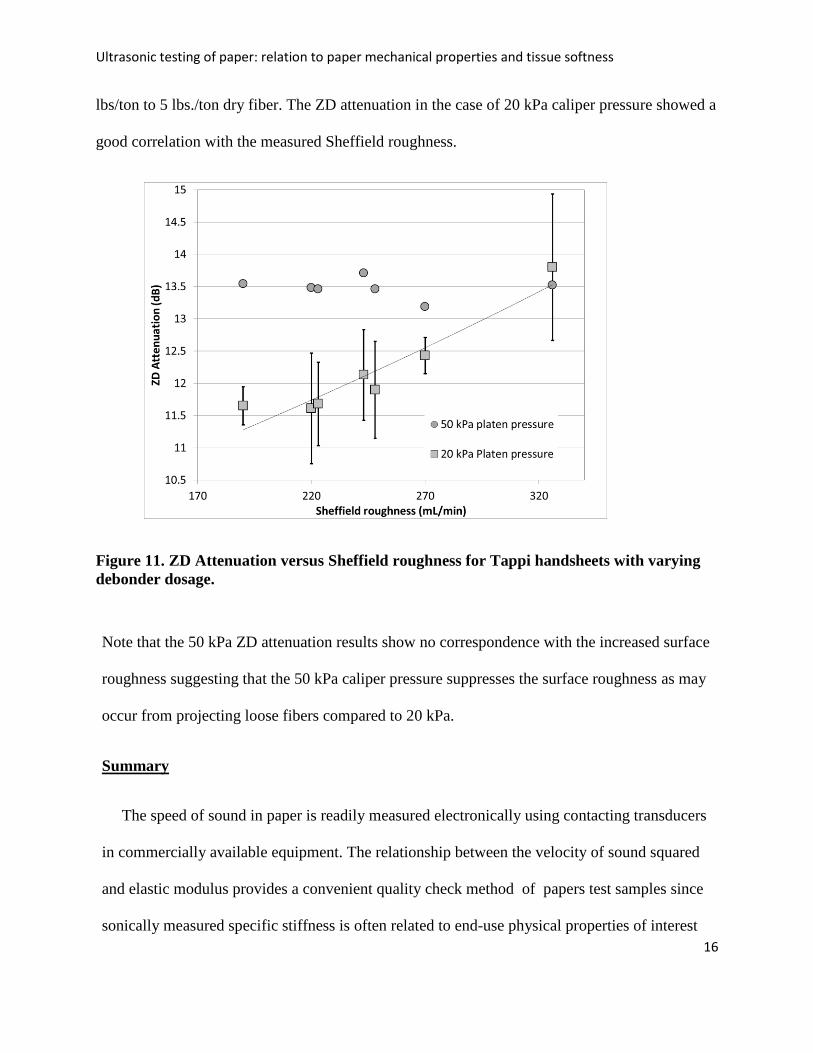
In the trial of debonder addition mentioned before, the standard Tappi handsheets were
observed to show a parallel increase of roughness with increasing levels of debonder from 1.5
Ultrasonic testing of paper: relation to paper mechanical properties and tissue softness
16
lbs/ton to 5 lbs./ton dry fiber. The ZD attenuation in the case of 20 kPa caliper pressure showed a
good correlation with the measured Sheffield roughness.
Figure 11. ZD Attenuation versus Sheffield roughness for Tappi handsheets with varying
debonder dosage.
Note that the 50 kPa ZD attenuation results show no correspondence with the increased surface
roughness suggesting that the 50 kPa caliper pressure suppresses the surface roughness as may
occur from projecting loose fibers compared to 20 kPa.
Summary
The speed of sound in paper is readily measured electronically using contacting transducers
in commercially available equipment. The relationship between the velocity of sound squared
and elastic modulus provides a convenient quality check method of papers test samples since
sonically measured specific stiffness is often related to end-use physical properties of interest

Ultrasonic testing of paper: relation to paper mechanical properties and tissue softness
17
such as tensile or compression strength. Measuring the directionality of the squared sound speed
squared across paper machine wise strips permits profile optimization through iterative
adjustments of the paper machine headbox stock flows and stock jet to forming wire speed
ratios. Speed of sound through the sheet is affected by the interfiber bonding and also by the
quality of the contact between the contacting transducers. This allows the potential to discern
the effects of pulp stock chemical additives on the level of bonding and also application of the
method to the relative measure of paper tissue or towel softness.
Bibliography:
1) C.C. Habeger and W.A. Wink, “Ultrasonic Velocity Measurements in the Thickness Direction of Paper,” J. Appl. Polymer Sc., vol. 32, pp. 4503-4540, 1986.
2) M. Titus, “Ultrasonic Technology – Measurements of Papers Orientation and Elastic Properties,” Tappi J., vol. 77(1), pp. 127-130, 1994.
3) T. Nomura, “Introduction of New SST-3000 and Development of SST Uses,” Japan Tappi J., vol. 48(1), pp. 215-219, 1994
4) G.A. Baum, “Elastic Properties, Paper Quality, and process Control,” Appita, vol. 40(4), pp. 288-294, 1987.
5) J.F. Waterhouse, “Ultrasonic Testing of Paper and Paperboard: Principles and Applications,” Tappi J., vol. 77(1), pp. 120-126, 1994.
6) R. W. Mann, G.A. Baum, and C.C. Habeger, “Determination of All Nine Orthotropic elastic Constants for Machine-made Paper,” Tappi J., vol. 63(2), pp. 163-166, 1980.
7) G. A Baum, D.C. Brennan, and C.C. Habeger, “Orthotropic elastic Constants of Paper,” Tappi J., vol. 64(8), pp. 97-101, 1981.
8) Y. Pan, J. Biasca, and C.C. Habeger, “Empirical Relationships Between Tissue Softness and Out of plane Ultrasonic Measurements,” Tappi J., vol. 73(11), pp. 95-100, 1989
9) Brodeur, P.H., Gergardstein J.P., “Overview of Applications of Ultrasonics in the Pulp and Paper Industry “ Proceedings of IEEE International Ultrasonic Symposium, Sendhai Japan, October 1998.

Ultrasonic testing of paper: relation to paper mechanical properties and tissue softness
18
Roman Popil, Ph.D.
Senior research scientist
February 2016