Ultrasonic Drug Delivery - NJ Center for Biomaterials Workshop/Bruce Redding, ESI... · Ultrasonic...
46
Ultrasonic Drug Delivery Ultrasonic Drug Delivery Encapsulation Systems Encapsulation Systems PO Box 759 PO Box 759 Broomall, PA 19008 USA Broomall, PA 19008 USA Ph: 484 Ph: 484 - - 343 343 - - 2506 / Fax 610 2506 / Fax 610 - - 356 356 - - 1866 1866 Bruce K. Redding Jr. Bruce K. Redding Jr.
-
Upload
nguyentram -
Category
Documents
-
view
215 -
download
0
Transcript of Ultrasonic Drug Delivery - NJ Center for Biomaterials Workshop/Bruce Redding, ESI... · Ultrasonic...

Ultrasonic Drug DeliveryUltrasonic Drug Delivery
Encapsulation SystemsEncapsulation SystemsPO Box 759PO Box 759
Broomall, PA 19008 USABroomall, PA 19008 USAPh: 484Ph: 484--343343--2506 / Fax 6102506 / Fax 610--356356--18661866
Bruce K. Redding Jr. Bruce K. Redding Jr.

Non-Invasive Insulin Delivery

UU--Wand Designed to Fit a WomenWand Designed to Fit a Women’’s s GripGrip

UU--Strip Insulin Patch Strip Insulin Patch & &
UU--WandWand
Skin Transport MechanismSkin Transport Mechanism

Transdermal drug deliveryThe three principal layers of the skin
Dermis
Stratum corneum
Epidermis
Hair
follicle
50 μm
15 μm

ICG Fluorescence Mode ImagingAnother feature that we looked for in the images was temporary increases in the diameter of pores or hair follicles. The images below are of the same sweat duct before and after treatment. They are not conclusive, but may indicate a slight increase.
Fluorescence 500 µm x 500 µm image at 10µm depth at time 0hr.
Fluorescence 500 µm x 500 µm image at 10µm depth after 1hr treatment.
~ 5 µm
~ 10 µm

keratinocyte
Lipid bilayers
.
Drug Delivery Pathway

UU--Strip Insulin PatchStrip Insulin PatchPhysicsPhysics
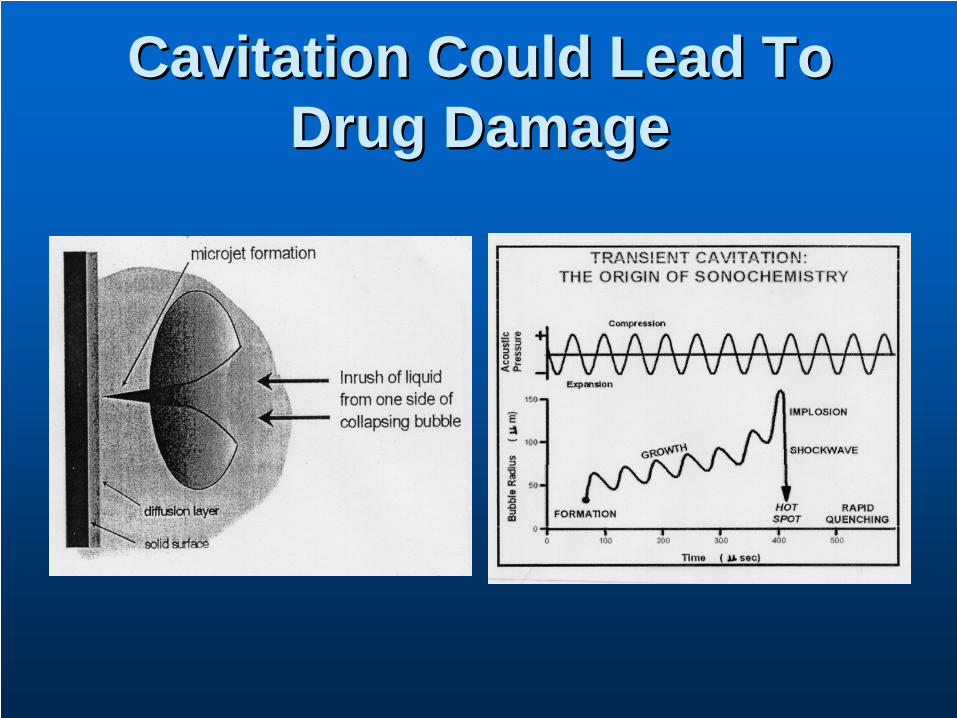
Cavitation Could Lead To Cavitation Could Lead To Drug DamageDrug Damage

Ultrasonic Massaging Action Effected By Alternating Waveform
Enlarges Pore Size
Homogenization Skin Transport
Sawtooth waveform Square waveform

Sonic Waveform Duty CyclesSonic Waveform Duty CyclesThe alternating waveform Duty Cycle means the time in The alternating waveform Duty Cycle means the time in milliseconds the signal is on a particular waveform.milliseconds the signal is on a particular waveform.Example, UExample, U--Strip insulin delivery is generally 50 Strip insulin delivery is generally 50 msecsmsecs on on sawtoothsawtooth followed by 50 followed by 50 msecsmsecs on square wave. There is a on square wave. There is a 2 2 msecmsec gap between the next sequence. At the start the gap between the next sequence. At the start the skin is primed on skin is primed on sawtoothsawtooth for 30 seconds.for 30 seconds.The UThe U--Wand, designed to deliver skin care compounds just Wand, designed to deliver skin care compounds just under the SC layer, Subunder the SC layer, Sub--Dermal delivery, operates with no Dermal delivery, operates with no Priming, and a 80 Priming, and a 80 msecmsec sawtoothsawtooth, 20 , 20 msecmsec squarewavesquarewave..The AThe A--Wand, designed to compounds transdermally, to the Wand, designed to compounds transdermally, to the dermis, operates with no Priming, and a 20 dermis, operates with no Priming, and a 20 msecmsecsawtoothsawtooth, 80 , 80 msecmsec squarewavesquarewave, but uses a higher sonic , but uses a higher sonic intensity than the Uintensity than the U--Wand.Wand.

Duty Cycle ComparisonsDuty Cycle ComparisonsProduct
ApplicationDelivery
Transdermal vs. Sub-Dermal
Device Freq.(kHz)
Intensity(mW/ sq.cm)
Skin Priming
Sawtooth Wave Duty
Cyclemsecs
Square Wave Duty Cyclemsecs
Gap Timing Between
Next Signal seriesmsecs
Insulin Delivery- Humulin
Transdermal U-Strip 23 125 30 seconds 50 50 2
Insulin Delivery- Humalog
Transdermal U-Strip 23 125 30 seconds 50 50 2
Insulin Delivery- Humulin
Transdermal A-Wand 30 225 0 50 50 2
Betadyne Transdermal A-Wand 30 225 0 20 80 2
Capoxone Transdermal A-Wand 30 225 0 20 80 2
Eucerin Sub-Dermal U-Wand 30 225 0 80 20 2

UU--Strip Treated InsulinStrip Treated Insulin

UU--Strip Insulin Patch Strip Insulin Patch &&
UU--WandWand
EngineeringEngineeringA New Form of TDDA New Form of TDDElectronicsElectronics

Peel-away filmSemi-permeable film
Sonic membraneBackbone material
Absorbent
Ultrasound
Insulin
Transdermal Delivery Device withP
Patch design
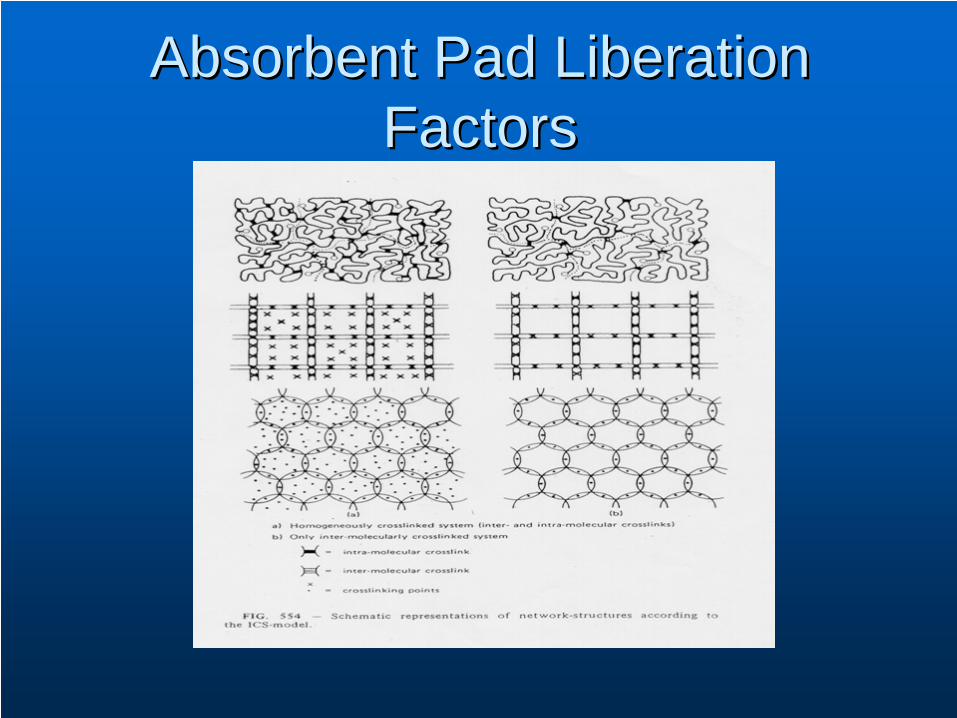
Absorbent Pad Liberation Absorbent Pad Liberation FactorsFactors

PatchPatch--CapCap

Low Profile Transdermal Patch
•Center absorbent pad holds drug.•No Risk of adhesive contamination.•Plastic components pass through ultrasound.•On/Off Function •Rate Control, Limitation•Designed for both Low and High molecular weight drugs. Bottom View

The U-Strip Transducer
Bondinglayers Cavity
End cap
PZT
End capTransducer Delivers alternating sonic waveform: 1/5 the power of a sonic toothbrush, 20-30 kHz at 125 mW/sq. cm intensity

UU--Strip Device MiniaturizationStrip Device Miniaturization
A-Wand
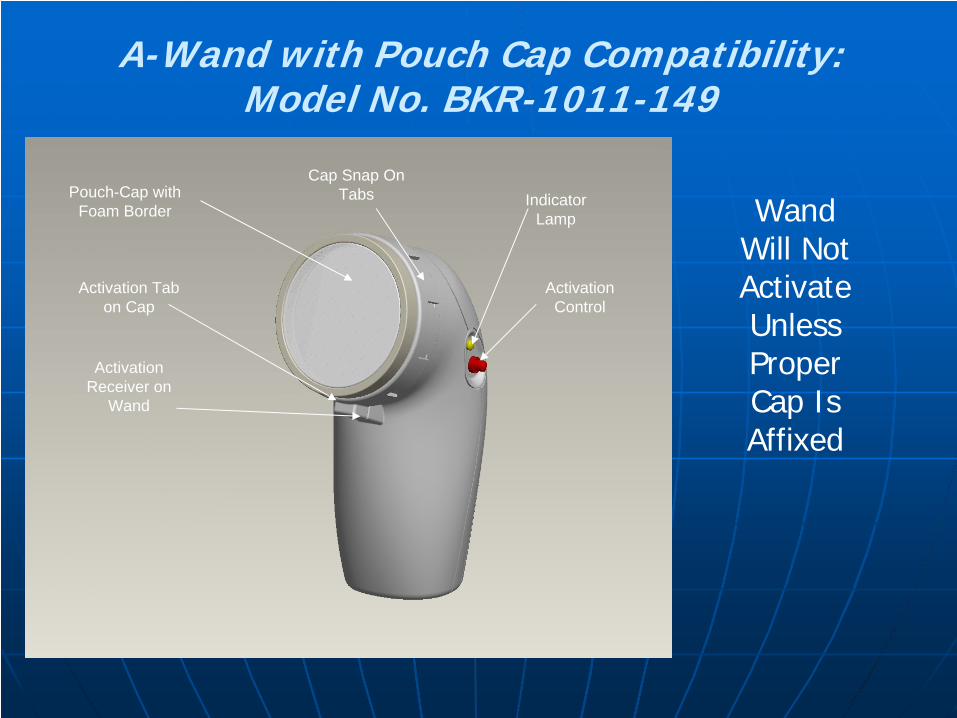
Pouch-Cap with Foam Border
Activation Tab on Cap
Activation Receiver on
Wand
Indicator Lamp
Activation Control
Cap Snap On Tabs
A-Wand with Pouch Cap Compatibility: Model No. BKR-1011-149
Wand Will Not Activate Unless Proper Cap Is Affixed

AA--Wand with Pouch Cap Compatibility: Model Wand with Pouch Cap Compatibility: Model No. BKRNo. BKR--10111011--149149
View of Wand Plastic Housing CrossView of Wand Plastic Housing Cross--SectionSection
Cap Attachment
Transducer Array Block
Wand Housing
Circuit Compartment
Battery Compartment
9 VDC Battery
Battery Cover
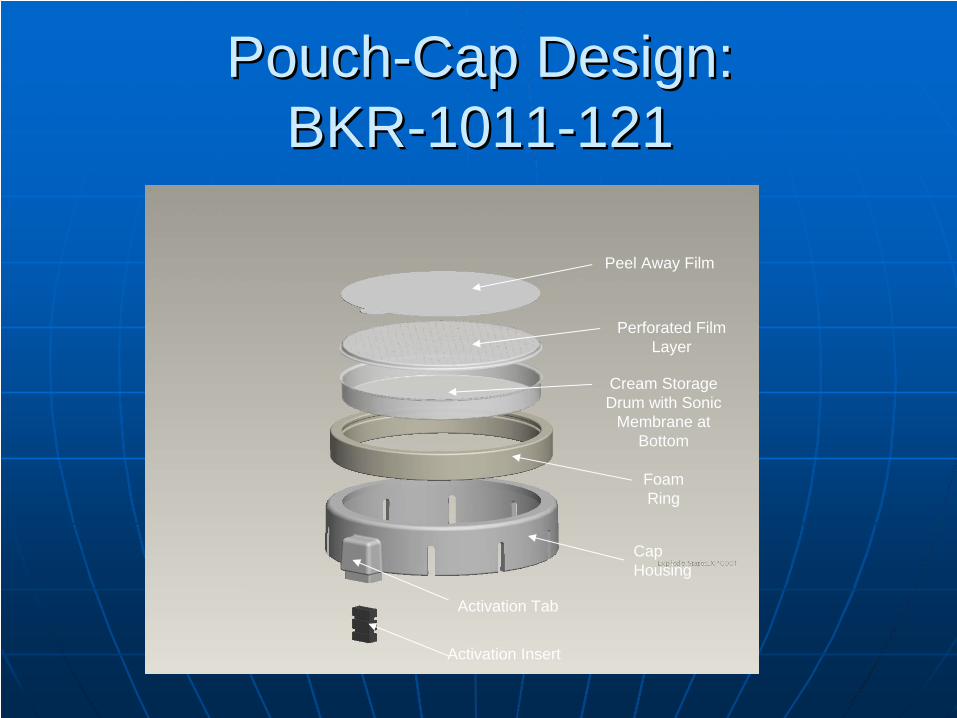
PouchPouch--Cap Design: Cap Design: BKRBKR--10111011--121121
Peel Away Film
Perforated Film Layer
Cream Storage Drum with Sonic
Membrane at Bottom
Foam Ring
Cap Housing
Activation Tab
Activation Insert

Delivery of Delivery of CopaxoneCopaxone via via AA--WandWand
Before After, Note deposition under SC Layer
Originally designed for Application of Cosmetics under the skin a new more powerful version, the A-Wand, has demonstrated a match for Sub-Q delivery via hypodermic needle, Non-invasively, for MS
UU--Strip Insulin PatchStrip Insulin Patch
Clinical SummaryClinical Summary
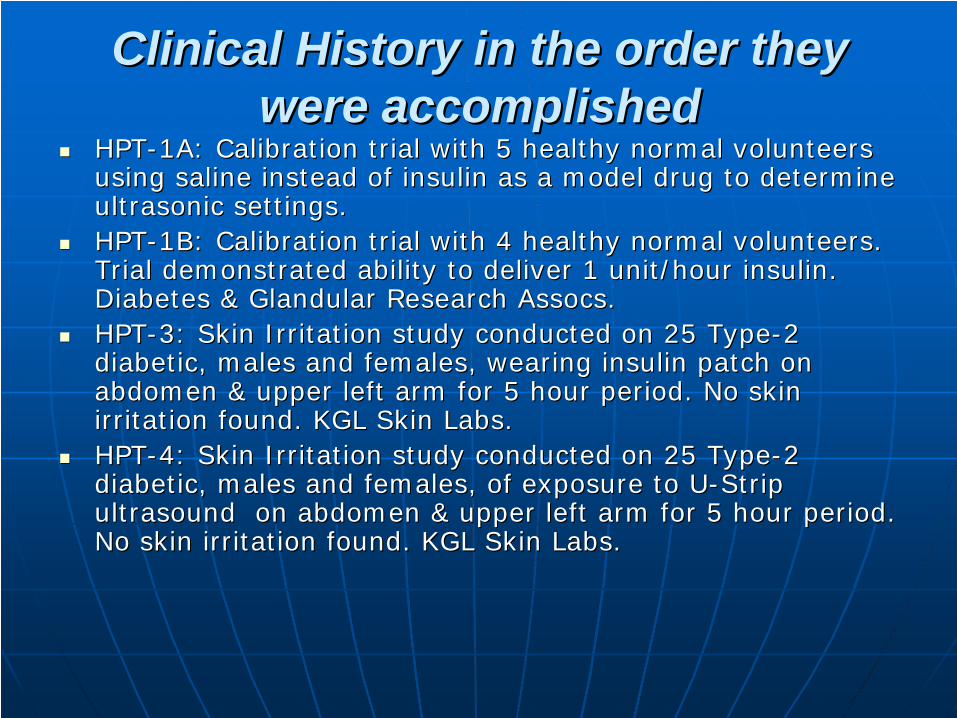
Clinical History in the order they Clinical History in the order they were accomplishedwere accomplished
HPTHPT--1A: Calibration trial with 5 healthy normal volunteers 1A: Calibration trial with 5 healthy normal volunteers using saline instead of insulin as a model drug to determine using saline instead of insulin as a model drug to determine ultrasonic settings.ultrasonic settings.HPTHPT--1B: Calibration trial with 4 healthy normal volunteers. 1B: Calibration trial with 4 healthy normal volunteers. Trial demonstrated ability to deliver 1 unit/hour insulin. Trial demonstrated ability to deliver 1 unit/hour insulin. Diabetes & Glandular Research Assocs.Diabetes & Glandular Research Assocs.HPTHPT--3: Skin Irritation study conducted on 25 Type3: Skin Irritation study conducted on 25 Type--2 2 diabetic, males and females, wearing insulin patch on diabetic, males and females, wearing insulin patch on abdomen & upper left arm for 5 hour period. No skin abdomen & upper left arm for 5 hour period. No skin irritation found. KGL Skin Labs.irritation found. KGL Skin Labs.HPTHPT--4: Skin Irritation study conducted on 25 Type4: Skin Irritation study conducted on 25 Type--2 2 diabetic, males and females, of exposure to Udiabetic, males and females, of exposure to U--Strip Strip ultrasound on abdomen & upper left arm for 5 hour period. ultrasound on abdomen & upper left arm for 5 hour period. No skin irritation found. KGL Skin Labs.No skin irritation found. KGL Skin Labs.

Clinical History in the order Clinical History in the order they were accomplishedthey were accomplished
HPTHPT--2A: Comparison study between insulin pump and 2A: Comparison study between insulin pump and insulin patch using 6 male typeinsulin patch using 6 male type--2 diabetics over a 5 hour 2 diabetics over a 5 hour study period.study period.HPTHPT--2B: Comparison of insulin patch vs. fasting level (no 2B: Comparison of insulin patch vs. fasting level (no typetype--2 medication) during daytime evaluation to determine 2 medication) during daytime evaluation to determine which system was more effective in glucose reduction and which system was more effective in glucose reduction and control.control.HPTHPT--2C: Comparison of insulin patch vs. type2C: Comparison of insulin patch vs. type--2 medication 2 medication during night time evaluation to determine which system during night time evaluation to determine which system was more effective in glucose reduction and control.was more effective in glucose reduction and control.HPTHPT--2D: Comparison of insulin patch vs. type2D: Comparison of insulin patch vs. type--2 medication 2 medication during daytime evaluation to determine which system was during daytime evaluation to determine which system was more effective in glucose reduction and control.more effective in glucose reduction and control.HPTHPT--5: Confocal imaging of insulin & Dye mixture to 5: Confocal imaging of insulin & Dye mixture to determine pathway through the skin using Udetermine pathway through the skin using U--Strip.Strip.

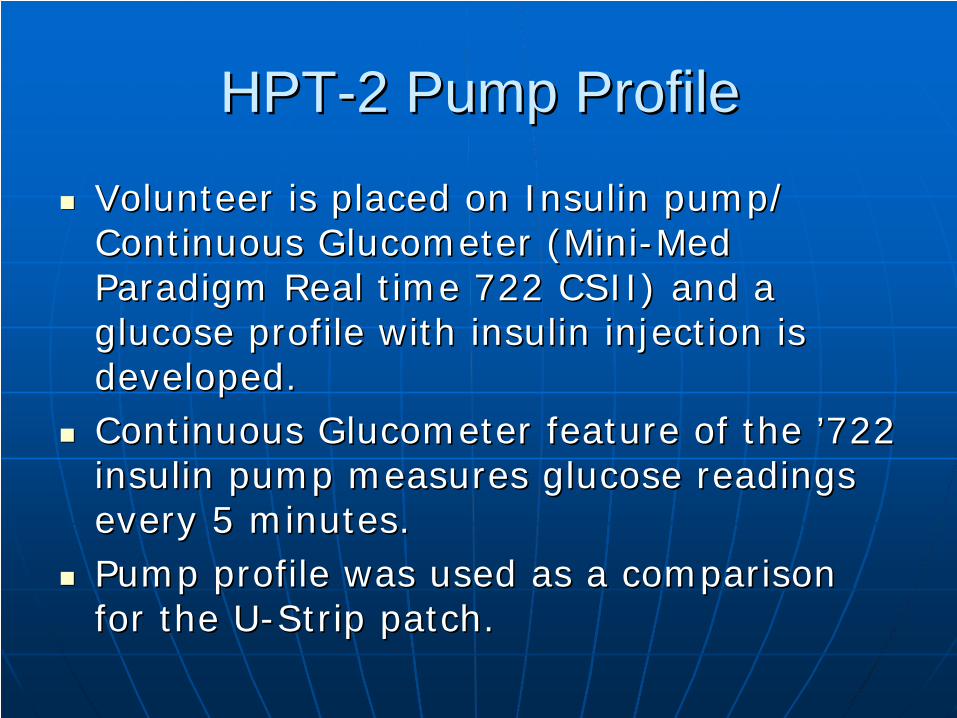
HPTHPT--2 Pump Profile2 Pump Profile
Volunteer is placed on Insulin pump/ Volunteer is placed on Insulin pump/ Continuous Glucometer Continuous Glucometer (Mini(Mini--Med Med Paradigm Real time 722 CSII) and a Paradigm Real time 722 CSII) and a glucose profile with insulin injection is glucose profile with insulin injection is developeddeveloped..Continuous Glucometer feature of the Continuous Glucometer feature of the ’’722 722 insulin pump measures glucose readings insulin pump measures glucose readings every 5 minutes. every 5 minutes. Pump profile was used as a comparison Pump profile was used as a comparison for the Ufor the U--Strip patch.Strip patch.

GoalGoal--1: Drop the Glucose Level of a 1: Drop the Glucose Level of a TypeType--2 Diabetic to Mild or Safe Range2 Diabetic to Mild or Safe Range
Physiologic Insulin Secretion: 24-Hour Profile
Insulin(µU/mL)
Glucose(mg/dL)
150
100
50
07 8 9 10 11 12 1 2 3 4 5 6 7 8 9
A.M. P.M.
Basal Glucose
Time of Day
50
25
0 Basal Insulin
Breakfast Lunch Dinner
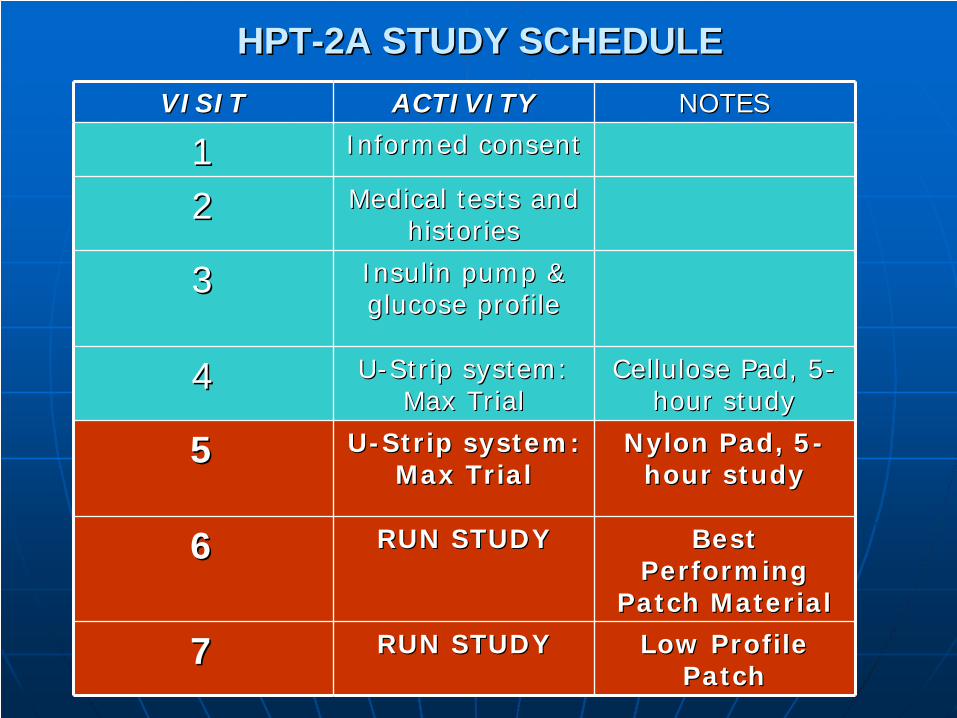
HPTHPT--2A STUDY SCHEDULE2A STUDY SCHEDULEVISITVISIT ACTIVITYACTIVITY NOTESNOTES
11 Informed consent Informed consent
22 Medical tests and Medical tests and histories histories
33 Insulin pump & Insulin pump & glucose profileglucose profile
44 UU--Strip system:Strip system: Max TrialMax Trial
Cellulose Pad, 5Cellulose Pad, 5-- hour studyhour study
55 UU--Strip system:Strip system: Max TrialMax Trial
Nylon Pad, 5Nylon Pad, 5-- hour studyhour study
66 RUN STUDYRUN STUDY Best Best Performing Performing
Patch MaterialPatch Material
77 RUN STUDYRUN STUDY Low Profile Low Profile PatchPatch

Six Check PointsSix Check Points1.1. Real Time Glucometer Readings of Real Time Glucometer Readings of
Patients Serum Glucose Levels: a Real Patients Serum Glucose Levels: a Real Time Indicator of UTime Indicator of U--strip Performancestrip Performance
2.2. Serum Blood Analysis: Humalog LevelsSerum Blood Analysis: Humalog Levels3.3. Serum Blood Analysis: CSerum Blood Analysis: C--peptide Levelspeptide Levels4.4. Serum Blood Analysis: Glucose LevelsSerum Blood Analysis: Glucose Levels5.5. Weight Reduction in Transdermal Weight Reduction in Transdermal
Delivery DeviceDelivery Device6.6. Skin Scans of Test Area.Skin Scans of Test Area.

HPTHPT--22 Patch vs. Insulin PumpPatch vs. Insulin Pump
Volunteer Pump Patch IDEnding EndingDrop % Drop %
1 -24% -20% SR2 -43% -21% DD3 -55% -36% FB4 -30% -23% TN5 -27% -14% CD6 -47% -25% PM
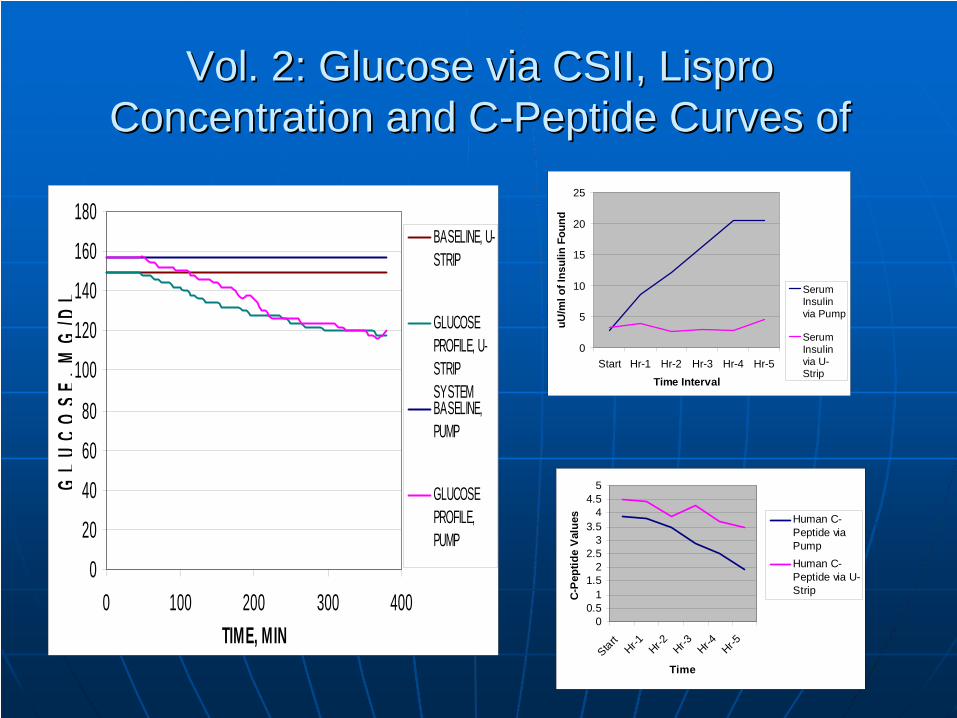
Vol. 2: Glucose via CSII, Lispro Vol. 2: Glucose via CSII, Lispro Concentration and CConcentration and C--Peptide Curves ofPeptide Curves of
0
20
40
60
80
100
120
140
160
180
0 100 200 300 400TIME, MIN
GLU
CO
SE,M
G/D
L
BASELINE, U-STRIP
GLUCOSEPROFILE, U-STRIPSYSTEMBASELINE,PUMP
GLUCOSEPROFILE,PUMP
0
5
10
15
20
25
Start Hr-1 Hr-2 Hr-3 Hr-4 Hr-5
Time Interval
uU/m
l of I
nsul
in F
ound
SerumInsulinvia Pump
SerumInsulinvia U-Strip
00.5
11.5
22.5
33.5
44.5
5
StartHr-1 Hr-2 Hr-3 Hr-4 Hr-5
Time
C-P
eptid
e V
alue
s Human C-Peptide viaPumpHuman C-Peptide via U-Strip

Serum Blood Analysis: VolSerum Blood Analysis: Vol--11
Time Serum C-Peptide Serum C-Peptidevia Pump via Patch
Start 3.9 4.5Hr-1 3.8 4.4Hr-2 3.5 3.9Hr-3 2.9 4.3Hr-4 2.5 3.7Hr-5 1.9 3.5
Time Serum Insulin Serum Insulinvia Pump via Patch
Start 2.7 3.2Hr-1 8.5 3.9Hr-2 12.1 2.6Hr-3 16.3 3Hr-4 20.4 2.8Hr-5 20.4 4.5
Time Serum Glucose Serum Glucosevia Pump via Patch
Start 137 143Hr-1 129 131Hr-2 120 119Hr-3 106 117Hr-4 103 111Hr-5 95 110

VolVol--1: Comparative 21: Comparative 2--hr % Drop hr % Drop in Glucose and Cin Glucose and C--Peptide LevelsPeptide Levels
Glucose Glucosevia Pump via Patch
Starting 137 143Hour 2 120 119Drop 17 24Drop % 12.4% 16.8%
C-Peptide C-Peptidevia Pump via Patch
Starting 3.9 4.5Hour 2 3.5 3.9Drop 0.4 0.6Drop % 10.3% 13.3%

Glucose Drops Pump vs. PatchGlucose Drops Pump vs. PatchHPT-2 Vol-1 Glucose Comparison
Pump Vs. Patch
020406080
100120140160180
1 2 3 4 5 6
Time in Hours
Glu
cose
(mg/
dl)
CGMS BaselineGlucoseCGMS on Pump
Patch Baseline
Glucose on Patch
HPT-2 U-Strip/Insulin Vol-2 Glucose Comparison Pump vs Patch
0
50
100
150
200
1 2 3 4 5 6
Time in Hours
Glu
cose
(mg/
dl)
CGMSBaselineGlucose
CGMS onPump
Patch DayBaseline
Glucose onPatch
HPT-2 Vol-3 Glucose Comparison Pump vs. Patch
0
50
100
150
200
250
300
1 2 3 4 5 6
Time in Hours
Glu
cose
(mg/
dl)
CGMSBaselineGlucose
CGMS onPump
PatchBaselin
Glucose onPatch
HPT-2 Vol-4 Glucose Comparison Pump Vs. Patch
0
50
100
150
200
250
300
1 2 3 4 5 6
Time in Hours
Glu
cose
(mg/
dl)
CGMS BaselineGlucose
CGMS on Pump
Patch Baseline
Glucose onPatch
HPT-2 Vol-5 Glucose Comparison Pump Vs. Patch
0
50
100
150
200
250
300
1 2 3 4 5 6
Time in Hours
Glu
cose
(mg/
dl)
CGMS BaselineGlucose
CGMS on Pump
Patch Baseline
Glucose onPatch
HPT-2 Vol-6 Glucose Comparison
0
50
100
150
200
250
1 2 3 4 5 6
Time in HoursG
luco
se (m
g/dl
)
CGMSBaselineGlucose
CGMS onPump
PatchBaseline
Glucoseon Patch

HPTHPT--2B U2B U--Strip vs. Fasting Strip vs. Fasting GlucoseGlucose
220
225
230
235
240
245
250
255
260
265
270
0 50 100 150 200 250 300 350
Time (min)
Glu
cose
(mg/
dL)
FastingU-Strip
100
120
140
160
180
200
220
0 50 100 150 200 250 300 350
Time (min)
Glu
cose
(mg/
dL)
FastingU-Strip
Vol.4 Vol.-5
Vol. 1 2 3 4 5 6
Metformin X X X X X
Avandia X X X X
Exubera X
Byetta X

HPTHPT--2C U2C U--Strip vs. Medication Strip vs. Medication Night Time ComparisonNight Time Comparison
200
220
240
260
280
300
320
0 50 100 150 200 250 300 350
Time (min)
Glu
cose
(mg/
dL)
MedicationU-Strip
100
120
140
160
180
200
220
0 50 100 150 200 250 300 350
Time (min)
Glu
cose
(mg/
dL)
MedicationU-Strip
Vol.-5 Vol.-6
Vol. 1 2 3 4 5 6
Metformin X X X X X
Avandia X X X X
Exubera X
Byetta X

HPTHPT--2D U2D U--Strip vs. Medication Strip vs. Medication Daytime ComparisonDaytime Comparison
100
120
140
160
180
200
220
240
260
280
0 50 100 150 200 250 300 350
Time (min)
Glu
cose
(mg/
dL)
Day MedicationU-Strip
100
120
140
160
180
200
220
0 50 100 150 200 250 300 350
Time (min)
Glu
cose
(mg/
dL)
Day MedicationU-Strip
Vol.-5 Vol.-6
Vol. 1 2 3 4 5 6
Metformin X X X X X
Avandia X X X X
Exubera X
Byetta X

Lispro Blood Concentration, uU/mLLispro Blood Concentration, uU/mL Pump Vs. PatchPump Vs. Patch
Time, Time, hrhr SRSR DDDD FBFB TNTN CDCD MeanMean
VolVol--11 VolVol--22 VolVol--33 VolVol--44 VolVol--55 VolVol--66
00 0.0/3.20.0/3.2 0.00.0 0.00.0 0.00.0 0.00.0 0.00.0
11 3.5/3.93.5/3.9 1.51.5 10.110.1 4.74.7 5.25.2 5.05.0
22 7.1/2.67.1/2.6 5.65.6 13.313.3 7.57.5 18.718.7 8.48.4
33 11.3/3.011.3/3.0 7.87.8 15.415.4 10.910.9 19.819.8 11.411.4
44 15.4/2.815.4/2.8 7.77.7 16.616.6 16.216.2 17.717.7 14.014.0
55 15.4/4.515.4/4.5 8.98.9 17.017.0 18.118.1 34.234.2 14.914.9
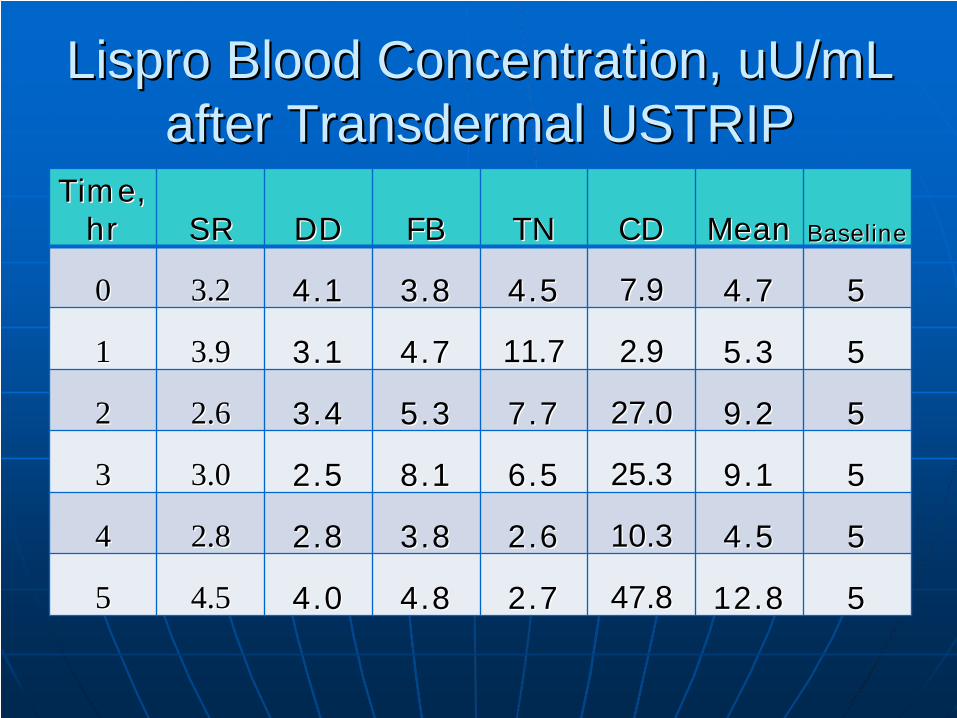
Lispro Blood Concentration, uU/mL Lispro Blood Concentration, uU/mL after Transdermal USTRIPafter Transdermal USTRIP
Time, Time, hrhr SRSR DDDD FBFB TNTN CDCD MeanMean BaselineBaseline
00 3.23.2 4.14.1 3.83.8 4.54.5 7.97.9 4.74.7 55
11 3.93.9 3.13.1 4.74.7 11.711.7 2.92.9 5.35.3 55
22 2.62.6 3.43.4 5.35.3 7.77.7 27.027.0 9.29.2 55
33 3.03.0 2.52.5 8.18.1 6.56.5 25.325.3 9.19.1 55
44 2.82.8 2.82.8 3.83.8 2.62.6 10.310.3 4.54.5 55
55 4.54.5 4.04.0 4.84.8 2.72.7 47.847.8 12.812.8 55

Conclusions:Conclusions:The UThe U--Strip effected a better reduction in Strip effected a better reduction in
glucose within the first two hours of the study glucose within the first two hours of the study -- at a rate faster (8.5mg/dl/hr) than for the at a rate faster (8.5mg/dl/hr) than for the insulin pump (6mg/dl/hr)insulin pump (6mg/dl/hr)The UThe U--Strip was superior to the pump in Strip was superior to the pump in suppressing endogenous insulin production suppressing endogenous insulin production within the first 2within the first 2--hour period (higher % Chour period (higher % C--peptide drop/hr). See Table 5.peptide drop/hr). See Table 5.An important advantage offered by UAn important advantage offered by U--Strip is Strip is that a better degree of the intracellular drug that a better degree of the intracellular drug uptake may be achieved at a substantially uptake may be achieved at a substantially lower drug concentration in the blood. lower drug concentration in the blood. In comparison to oral meds for TyIn comparison to oral meds for Ty--22’’s the Us the U--Strip was more reliable in both daytime and Strip was more reliable in both daytime and night time glucose control.night time glucose control.

Passive TDD
Insulin rPA tPA
RequiresAssistance
U-Strip CapableRange
Molecular Size
Unknown
Up to 500 Da Up to 1000 Da 6000 Da 36 kDa 75 kDa Greater than 125 kDa
Range of Molecular Size
U-strip Is Theorized to Be Capable of Delivering From 0 to 125,000 Mol Wt. Compounds

Non-Invasive Insulin Delivery