Fundamental Aspects in Quantitat Ultrasonic Determination ...

NASA Technical Memorandum 88855
. Ultrasonic Determination of Recrystallization [PASA-Tll-88855) U L T R A S O N I C DETERWINATION OP N87-3C399
R E C B Y S ? A L L I Z A I I C N ( N A S A ) 15 F CSCL 14D
Unclas 63/38 44241
Edward R. Generazio Lewis Research Center Cleveland, Ohio
Prepared for Review of Progress in Quantitive NDE cosponsored by Ames Laboratory and Iowa State University La Jolla, California, August 3-8, 1986
https://ntrs.nasa.gov/search.jsp?R=19870000966 2020-04-28T09:17:12+00:00Z

ULTRASONIC DETERMINATION OF RECRYSTALLIZATION
Edward R . Generazio
National Aeronautics and Space Administration Lewi s Research Center Cleveland, OH.
INTRODUCTION
Metals are currently used in a wide variety of applications ranging from simple structural to complex heat engine components. Each use has a different set of engineering characteristics that must be met by the mate- rial being considered for use. One method to tailor material properties to meet engineering requirements is thermomechanical processing (TMP) . I , *
e If TMP involves cold working, metals generally show a marked increase In m strength, but this increase does not continue without limit as the micro- w structure becomes distorted and exhibits high internal stress. These
residual stresses are generally detrimental to the end use applications.
the material at various intervals during the cold working process. Annealing serves two main purposes. (1) To relax residual stresses and (2) to recrystallize (soften) the material. Stress relieving results in partial softening due to the movement and annihilation of dislocations3,4 while recrystallization yields a total softening by the complete replace- ment of the worked microstructure with an essentially dislocation free new grain structure. Both of these processes are dependent on the amount of prior cold work, temperature, and time where the time to complete the process decreases as the amount of work or temperature increases.
CQ
rJ
I
Further modification of the material can be obtained by annealing
In the case of recrystallization there are several experimentally measurable material properties that exhibit marked variations. Four of the most cornon material characteristicsl-3 are hardness, strength, ductility, and microstructural changes. The experimental signatures of each of these after recrystallization are (1 ) the material hardness decreases, (2) the yield strength decreases, (3) the ductility increases, and (4) a free grain structure appears. While these changes can be observed by mechanically testing, and metallographic, diffractive x-ray and transmission electron microscopic examination, generally destructive testing methods are required.
It is shown here that the nondestructive measurement of ultrasonic attenuation can identify and characterize the state of the recrystalliza- tion. The interrelation between ultrasonic attenuation and recrystalll- zation thermal kinetics yields a technique for determining onset, degree, and completion of recrystallization.

THEORY
We are concerned here with the ultrasonic interaction with material microstructure and the thermal process of recrystallization. Two theories cover i ng acousti c -mi cros t ructur e5-7 1 nteract 1 on and the thermal ki net i c s of recrystalllzatlon8-lO need to be examined. It Is assumed that the acoustic interaction with the microstructure Is dominated by grain scat- tering6 and/or di slocation damping. interactions leading to magnetoelastic and thermoelastic effects5 are not expected to change substantially and/or concurrently with rec ry s tal 1 i zat i on.
Other acoustic-microstructural
The attenuation ag due to grain scattering is given by6
(1) 3 4 2 a, = CrD F (Rayleigh) and as = C,DF (Stochastic)
where the C I S are constants dependent on density, velocity, etc., D is the mean grain diameter, F is frequency. When the wavelength of sound is much greater than the mean grain diameter or scatterer size, we have Rayleigh scattering with a fourth power frequency dependence. When the scatterer size is on the order of the sound wavelength we have stochastic scattering with a second power frequency dependence. Equation (1) should not be expected to apply t o an arbitrary metal consisting o f a size dis- tribution of topologically complex grains. However, we may identify the frequency exponent as a key variable. That is, if grains are growing from small (Rayleigh) to large (stochastic) scatterers is is expected that the frequency exponent, over a fixed frequency rangel should decrease with increasing grain size.
The attenuation due to dislocation damping ad i s given by7 .
where g is the dislocation density, C Is a constant dependent on shear modulus, dislocation damping force, etc., and W is a complicated func- tion o f the resonant frequency containing a dilute noninteracting collection of dislocation lines ori- ented normal to the sound direction. Equation (2) does not apply to the intertwined network o f dislocations observed in mechanically worked mate- rials. Equation (2) does, however, imply that if dislocation damping i s dominant attenuation mechanism then a decrease in dislocation density should result In a correspondlng decrease in attenuation.
Fo. Equation (2) applies to materials
THERMAL KINETICS
Mechanically working a metal produces a dense collection of germ nuclei within the material. increase in temperature, transform (i.e., recrystallize) into small crys- tallites which subsequently row into fully developed grains. The trans- formed volume is given bye-18
These germ nuclei, when activated by an
$ = 5 1 1 - exp[-S6 3 3 Not exp (- $)] I i 31
(3)
where V R is the volume that has recrystallized and V i s the initial unrecrystallized volume, and
2

S shape factor G grain growth rate R gas constant No initial number of germ nuclei per unit volume U total energy required for a germ nuclei to become a growth nucleus
Ti absolute anneal temperature t anneal time
(crystallite)
Equation ( 3 ) is applicable to thermal annealing processes, where the time of each anneal Is held constant and the anneal temperature Ti is varied for a series of M anneals.
Althou h 6, U, S , and No are known to vary with tempera- ture,l93.4.!-10 the value of these parameters as a function of tempera- ture is unknown. It will be assumed that they are constants and this should be considered when using the thermal kinetic results.
Material Samples
The samples were produced from commercially available Nickel 200 rod that has been initially cold rolled 50 percent and annealed at 63125 K for 15 min, then cold rolled an additional 50 percent. Four samples for ultrasonic evaluation were cut from the rolled material with both sides ground and polished through 1.0 pm diamond to a mirror finish. Thirty- two specimens for metallographic, x-ray, and transmission electron micro- scopic analysis were also cut fromthe rolled stock.
Experiment
The 36 specimens (anneal batch) were initially simultaneously annealed as a group in air at 758 K for 1 hr and air cooled. Two metal-
for microstructural, x-ray, and transmission electron microscopic evalu- ation, and the four polished samples were remeasured for thickness and ultrasonic attenuation (30 to 6 5 MHz) -11 tion these four samples and the remaining 30 specimens were heat treated at a higher temperature. This process of specimen selection (permanent removal of two specimens) and ultrasonic evaluation of the four polished samples was repeated 16 times with the annealing temperature increased for each step and ranging from 758 to 1011 K (f5 K). The two specimens removed after each step were lnvestigated using: (1) metallography to determine microstructural changes, ( 2 ) transmlsslon electron microscopy to ldentlfy dislocation density variations, and (3) x-ray diffraction to determine crystalline disorder.
’ lography specimens were selected and permanently removed from the group
After ultrasonic investiga-
Microstructure
Three mutually perpendicular faces o f the annealed samples were polished, etched, and photographed using standard metallographic procedures.
Three millimeter diameter, 0.38 rnm thick disks were electro-discharge machined (EDM) from the annealed specimens. After the disks were hand ground to a thickness of about 0.002 cm and further electropolished to a thickness o f about 800 A , they were examined by transmission electron microscopy (TEM). At least three TEM disks were examined for each annealing temperature.
3

RESULTS
U l t r a s o n i c At tenuat ion
The u l t r a s o n i c a t tenua t ion as a func t i on o f frequency f o r each o f t h e annealing temperatures i s shown i n Fig. 1 and the a t t e n u a t i o n f o r f i x e d frequency i s i l l u s t r a t e d as a f u n c t i o n o f anneal temperature i n F ig . 2. While the a t tenua t ion f o r a l l temperatures Increases w i t h i nc reas ing frequency, the a t t e n u a t i o n f o r constant f requencies, i s observed t o be a nonmonotonic f u n c t i o n o f t h e anneal temperature (F ig . 2). Below 800 K the a t tenua t ion ( f o r f i x e d frequency) remains constant. a t t e n u a t i o n increases r a p i d l y w i t h temperature from 800 t o 900 K. Although the a t tenua t ion cont inues t o increase between 900 and 975 K i t i s a t a much slower r a t e . Above 975 K t he a t tenua t ion again r a p i d l y r i s e s w i t h temperature. F igure 2 a l s o demonstrates t h a t t h e magnitude o f t h e v a r i a t i o n i n a t tenua t ion over the e n t i r e anneal temperature range i s more pronounced a t h igher f requencies.
The
X-Ray Analvsi s
The f u l l w id th a t h a l f maximum (FWHM) o f t he (200) x-ray Bragg peak va r ies considerably over t h e anneal ing temperature range (F ig . 2). For temperatures below 850 K t h e FWHM remains r e l a t i v e l y constant. The FWHM r a p i d l y decreases over t h e range 850 t o 900 K. This i s an i n d i c a t i o n o f i nc reas ing c r y s t a l l i n e order w i t h i nc reas ing anneal temperature. Temper- a tures above 901 K r e s u l t e d i n a r e l a t i v e l y constant FWHM. The uncer- t a i n t y i n t h i s measurement i s r e l a t i v e l y l a r g e as evidenced by the f l u c t u a t i n g FWHM a t bo th low and h i g h anneal temperatures.
Metal loqraphic Resul ts
Typica l photomicrographs f o r t h e face and edge sides a r e shown i r i F igs. 3 t o 8 f o r anneal temperatures o f 758, 814, 871, 901, 940, and 1011 K ( l abe led Tl-Tg), respec t i ve l y . As t h e the two perpendicu lar edges exh ib i t ed s i m i l a r m ic ros t ruc tu re , on l y data f o r one edge i s shown.
Photomicrographs o f t h e face plane i l l u s t r a t e l i t t l e change w i t h anneal ing temperature u n t i l i t equaled approximately 901 K where t h e unclear, worked s t r u c t u r e remaining a f t e r lower temperature heat t r e a t - ments (F igs . 3 (c ) , 4 (c ) , and 5 ( c ) ) I s replaced by a normal g r a i n s t r u c - t u r e ( F i g . 6 ( c ) ) . Higher anneal ing temperatures (F igs . 7 ( c ) and 8 ( c ) ) r e s u l t i n l i t t l e a d d i t i o n a l change except f o r g r a i n growth. While exami- n a t i o n of the face sect ions reveals a sharp t r a n s i t i o n i n m i c r o s t r u c t u r e a t 901 K, the edge planes show a much more gradual e f f e c t . As t he anneal- i n g temperature I s increased above 871 K t he elongated g r a i n s t r u c t u r e v i s i b l e i n Figs. 3 (b ) and 4(b) i s s lowly replaced by a normal g r a i n con f igu ra t i on (F igs . 5(b) and 6 ( b ) ) u n t i l r e c r y s t a l l i z a t i o n i s nea r l y complete ( F i g . 7 ( b ) ) and g r a i n growth occurs (F ig . 8 ( b ) ) .
Transmission E lec t ron Microscopy
Transmission e l e c t r o n photomicrographs f o r s i x anneal temperatures a re a l s o shown i n Figs. 3 t o 8. Below 800 K TEM found on ly l o c a l i z e d areas w i t h high and low d i s l o c a t i o n d e n s i t i e s ( F i g . 3 (a ) ) . The h i g h and l o w dens i t y regions a re dark and l i g h t areas, respec t i ve l y , i n F ig . 3 . A t 814 K, nucleated C r y s t a l l i t e s have s t a r t e d t o form (F ig . 4 ( a ) ) w i t h t h e nucleated c r y s t a l l i t e s vary ing i n s i z e and e x h i b i t i n g boundaries const ructed o f an i n t e r t w i n e d c o l l e c t i o n of d i s l o c a t i o n s . F igure 4 a l s o contains reglons t h a t appear t o be j u s t forming i n t o C r y s t a l l i t e s ; these regions a re bel ieved t o be germ n u c l e i t h a t have j u s t transformed i n t o
4

nuc lea t i on s i t e s . A t 871 K f u l l y developed c r y s t a l l i t e s w i t h p lana r boundaries co -ex i s t w i t h l o c a l i z e d regions o f low and h i g h d i s l o c a t i o n d e n s i t i e s (F ig . 5 ( a ) ) . The 901 K anneal e x h i b i t s l a r g e r c r y s t a l l i t e s having both narrow s t e p - l i k e boundaries and boundaries con ta in ing a c o l l e c t i o n of o r i e n t e d d i s l o c a t i o n pi le-ups (F ig . 6 (a ) ) ; a d d i t i o n a l l y , i s o l a t e d and in terconnected d i s loca t i ons a re present w i t h i n t h e c r y s t a l - l i t e s . A f t e r a 940 K anneal (F ig . 7(a)) t h e boundaries tend t o have a c o l l e c t i o n of d i s l o c a t i o n s randomly at tached t o them, and both i s o l a t e d and in terconnected d i s l o c a t i o n s are present w i t h i n t h e c r y s t a l l i t e s . A t t h e h ighes t anneal temperature, 1011 K, (F ig . 8 (a ) ) , on l y random i s o l a t e d d i s l o c a t i o n s a re present w i t h i n the C r y s t a l l i t e s .
C o r r e l a t i o n Between U l t r a s o n i c Attenuat ion and Thermal K i n e t i c s
F igure 9 shows t h e value o f t h e key v a r i a b l e determined by f i t t i n g t h e data shown i n F ig . 1 t o
N (dashed-dotted curve)
N a = CF ( 4 )
The percent o f r e c r y s t a l l i z a t i o n VR/V determined by use o f Eq. ( 3 ) i s shown as a s o l i d curve. Here S = 4n/3, G = 3 pm/hr, U = 80 Kcal / mole3,8-10 and t h e f r e e parameter No nuclei/cm3. Also shown i s t h e percent o f r e c r y s t a l l i z a t i o n , obtained from t h e photomicrographs,9 f o r samples e x h i b i t i n g about 25 t o 75 per- cent r e c r y s t a l l i z a t t o n ; l a r g e r and smal ler percents could no t be pre- c i s e l y determined by o p t i c a l methods.
i s taken t o be 2x10¹⁸ germ
DISCUSSION
During t h e e n t t r e anneal ing process t h e a t tenua t ion a t a f i x e d f r e - quency e i t h e r remains constant o r increases w i t h i nc reas ing anneal tem- perature. The d i s l o c a t i o n dens i t y i s n o t known q u a n t i t a t i v e l y , i t does, however, decrease f rom an extremely l a r g e t o a low value as recovery and r e c r y s t a l l i z a t i o n takes p lace over the anneal temperature range. There- fo re , d i s l o c a t i o n damping cannot be t h e dominant a t t e n u a t i o n mechanism causing t h e l a r g e change i n at tenuat ion observed du r ing r e c r y s t a l l i z a t i o n From t h i s r e s u l t i t w i l l be assumed t h a t t h e g r a i n boundary s c a t t e r i n g i s t he dominant a t t e n u a t i o n mechanism du r ing the r e c r y s t a l l i z a t i o n process.
The onset o f r e c r y s t a l l i z a t i o n i s i d e n t i f i e d as t h e temperature a t which the f i r s t germ n u c l e i t ransform i n t o nucleated c r y s t a l l i t e s . A c o u s t i c a l l y t h e onset o f r e c r y s t a l l i z a t i o n begins i n the temperature range 796 t o 814 K where the at tenuat ion f i r s t s t a r t s t o increase ( l i g h t shaded reg ion i n Fig. 10). A t these anneal temperatures t h e small nucle- ated c r y s t a l l i t e s a re a c o u s t i c a l l y Rayleigh sca t te re rs y i e l d i n g t h e l a r g e value o f t h e exponent N ( F i g . 9) .
I nc reas ing t h e anneal temperature produces an i nc reas ing number o f nucleated c r y s t a l l i t e s and simultaneously enhances t h e growth r a t e o f p rev ious l y nucleated c r y s t a l l i t e s . Therefore, above 814 K the re I s a mixed system of Rayleigh (newly formed c r y s t a l l i t e s ) and near l y s tochas t i c (growing c r y s t a l l i t e s ) sca t te re rs . For temperatures between 814 and 975 K, t he magnitude of t h e at tenuat ion i s expected t o increase w h i l e t h e exponent N should decrease (see Eq. ( 1 ) ) . This i s i n agreement w i t h Figs. 2 and 9 and i s i d e n t i f i e d as the r e c r y s t a l l i z a t i o n temperature range i n F ig . 10 (dark shaded reg ion) .
The complet ion of r e c r y s t a l l i z a t i o n i s i d e n t i f i e d as the temperature a t which a l l t h e germ n u c l e i a re depleted. That i s , t h e germ n u c l e i have
5

e i t h e r transformed i n t o nucleated c r y s t a l l i t e s o r have been swallowed up by growing c r y s t a l l i t e s . The complet ion o f r e c r y s t a l l i z a t i o n occurs between 960 and 9 7 5 K and i s shown i n Fig. 10 as a l i g h t shaded region.
Above 975 K pure g r a i n growth i s observed (cross-hatched reg ion i n Fig. 10) . Since the g ra ins a re r e l a t i v e l y l a r g e (approximately 50 pm diameter) , f o r temperatures above 975 K, they (growing a t r a t e o f about 3 pm/hr) are s tochas t i c sca t te re rs ; thus t h e a t tenua t ion above 975 K should increase w h i l e t h e exponent N should remain a constant (Eq. (1)) i n agreement w i t h Figs. 2 and 9 . It should be noted here, t h a t t he a t tenua t ion i n the pure g r a i n growth reg ion has been i n v e s t i g a t e d p r e v i - o u s l y l 3 and found t o sca le w i t h t h e r a t i o o f mean g r a i n diameter t o sound wavelength i n d i c a t i n g t h a t dominant a t tenua t ion mechanism i s g r a i n boundary scat ter ing.
Both the r e c r y s t a l l i z e d f u n c t i o n V R / V and the exponent N possess s i m i l a r temperature dependence (F ig . 9 ) . The thermal k i n e t i c r e s u l t s supports t h e a t t e n u a t i o n data and i s understood as fo l l ows . The p r o b a b i l i t y o f a germ n u c l e i t ransforming i n t o a nucleated c r y s t a l l i t e increases wi th i nc reas ing anneal temperature. Therefore, an i n i t i a l l y slow r e c r y s t a l l i z a t i o n r a t e i s fo l lowed by a r a p i d increase i n t h e ra te . A l s o , t h e germ n u c l e i t ransform simultaneously w i t h the growth o f p r e v i - ous nucleated c r y s t a l l i t e s . These growing c r y s t a l l i t e s tend t o swallow up other germ n u c l e i so t h a t t he dens i t y o f germ n u c l e i decreases. Therefore, there a re two mechanisms t h a t lead t o a decrease i n germ . n u c l e i densi ty. The germ n u c l e i become a c t i v a t e d and t rans fo rm i n t o c r y s t a l l i t e s o r they get swallowed up by growing c r y s t a l l i t e s . As a r e s u l t t h e r e c r y s t a l l i z a t i o n r a t e ( o r t h e r a t e o f format ion o f Rayleigh s c a t t e r s ) a t h i g h temperatures decreases.
A d i r e c t analogy e x i s t s between the r e c r y s t a l l i z a t i o n r a t e and the r e a c t i o n r a t e observed i n many chemical processes. This f o l l o w s f rom, the shape o f the a t t e n u a t i o n versus anneal ing temperature data. Moving from t h e l e f t t o t h e r i g h t i n Fig. 10 we see an increase i n the a t t e n u a t i o n w i t h a simultaneous increase i n slope. This reg ion i s commensurate w i t h a r a p i d t ransformat ion o f germ n u c l e i t o nucleated c r y s t a l l i t e s (Rayle igh s c a t t e r e r s ) . Above 901 K, t h e s lope o f t he a t tenua t ion begins t o decrease. This agrees w i t h a l a r g e number o f germ n u c l e i being swallowed up by growlng c r y s t a l l l t e s ( i . e . , a decreased r a t e o f Rayleigh s c a t t e r e r f o rma t ion ) . The slope o f t he a t t e n u a t i o n begins t o increase r a p i d l y once more above 975 K. This i s a s igna tu re t h a t t he r e c r y s t a l l i z a t i o n process has completed ( i .e . , germ n u c l e i a re depleted) and on ly pure g r a i n i s growth present. Therefore, onset, percent, and completion o f r e c r y s t a l - l i z a t i o n ( o r onset o f pure g r a i n growth) are a l l i d e n t i f i a b l e f rom t h e u l t r a s o n i c a t tenua t ion as shown i n F ig . 10.
The ma n i t u d e o f t he FWHM of a Bragg peak i s dependent on several mechanisms.y.12 When res idua l s t r e s s e s a re present t h e atoms a re d isp laced f rom t h e i r l a t t i c e s i t e s and t h i s r e s u l t s i n a broadening o f t h e Bragg peak. I t i s a l s o poss ib le t o have c r y s t a l l i t e s w i t h s i m i l a r b u t n o t i d e n t i c a l o r i e n t a t i o n w i t h i n the area covered by t h e x-ray beam. This w i l l also lead t o a broadening of t h e Bragg peak. The presence o f d i s l o c a t i o n s r e s u l t s i n h i g h l o c a l i z e d stresses and l a r g e displacements o f atoms f r o m t h e i r otherwise ordered c r y s t a l l i n e s t r u c t u r e . atomic displacements w i l l lead t o a broadening of t he Bragg peak.
The FWHM of the d i f f r a c t i o n peak obta ins a mlnimum value a t 901 K. This i s an I n d i c a t i o n t h a t t he h ighest c r y s t a l l i n e order has been obtained. r e c r y s t a l l i z a t i o n I s incomplete ( F i g . 6 ( b ) ) .
These l a r g e
However, t h e edge photomicrographs c l e a r l y i n d i c a t e t h a t Bragg backscattered x-rays
6
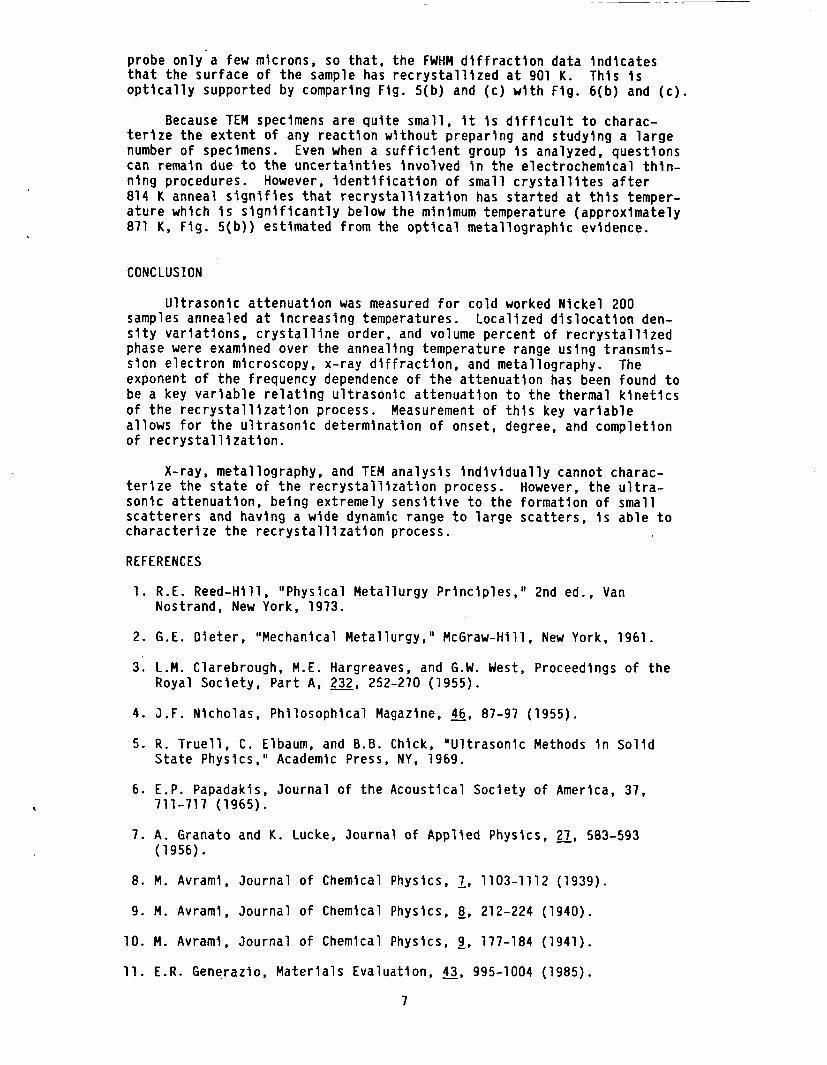
probe only a few microns, so that, the FWHM diffraction data indicates that the surface of the sample has recrystallized at 901 K. This is optically supported by comparing Fig. 5(b) and (c) with Fig. 6(b) and (c).
terlze the extent of any reaction without preparing and studying a large number of specimens. Even when a sufficient group is analyzed, questions can remaln due to the uncertainties involved in the electrochemical thin- ning procedures. However, identification of small crystallites after 814 K anneal signifies that recrystallizatlon has started at this temper- ature which is significantly below the minimum temperature (approximately 871 K , Fig. 5(b)) estimated from the optical metallographic evidence.
Because TEM specimens are quite small, it is difficult to charac-
CONCLUSION
Ultrasonic attenuation was measured for cold worked Nickel 200 samples annealed at increasing temperatures. Localized dislocation den- sity variations, crystalline order, and volume percent of recrystallized phase were examined over the annealing temperature range using transmis- sion electron microscopy, x-ray diffraction, and metallography. The exponent of the frequency dependence of the attenuation has been found to be a key variable relating ultrasonic attenuation to the thermal kinetics of the recrystallization process. allows for the ultrasonic determination of onset, degree, and completion of recrystallization.
Measurement of this key variable
X-ray, metallography, and TEM analysis individually cannot charac- terize the state of the recrystallization process. However, the ultra- sonic attenuation, being extremely sensitive to the formation of small scatterers and having a wlde dynamic range to large scatters, i s able to characterize the recrystal 1 1 zation process.
REFERENCES
1. R.E. Reed-Hill, "Physical Metallurgy Principles,8t 2nd ed., Van
2. G.E. Dieter, "Mechanical Metallurgy,' McGraw-Hill, New York, 196
3. L.M. Clarebrough, M.E. Hargreaves, and G.W. West, Proceedings o f
4. J.F. Nicholas, Philosophical Magazine, 46, 87-97 (1955).
5 . R. Truell, C. Elbaum, and B . B . Chick, "Ultrasonic Methods in Sol
Nostrand, New York, 1973.
Royal Society, Part A, 232, 252-270 (1955).
State Physics," Academic Press, NY, 1969.
6. E.P. Papadakis, Journal of the Acoustical Society of America, 37, 711-717 (1965).
the
d
7. A. Granato and K. Lucke, Journal of Applied Physics, 27, 583-593 (1956).
8. M. Avrami, Journal of Chemical Physics, 1, 1103-1112 (1939).
9. M. Avrami, Journal of Chemical Physics, 8, 212-224 (1940).
10. M. Avrami, Journal of Chemical Physics, 3, 177-184 (1941).
1 1 . E . R . Genqrazio, Materials Evaluation, 43, 995-1004 (1985).
7

12. P. Gay; P.E . Hirsch, and A. Kelly, Acta Metallurgica, 1, 315-319 (1953).
13. E.R. Generazlo, Materials Evaluation, 44, 198-202, 208 (1986).
8

8
4 m
L
c U 2 a r 2 E <
0 25 50 75 100 FREQUENCY. F. MHz
FIGURE 1 . - ULTRASONIC ATTENUATION AS A FUNCTION OF FREQUENCY.
MHz I 50
0 750 800 850 900 950 1000 1050
ANNEALING TEMPERATURE, K
FIGURE 2.- ULTRASONIC ATTENUATION AS A FUNCTION OF ANNEAL TEMPEATURE ( S O L I D CURVES). THE DASH CURVE I S THE FULL WIDTH AT HALF MAXIMUM OF THE (2 0 0) X-RAY DIFFRACTION PEAK.
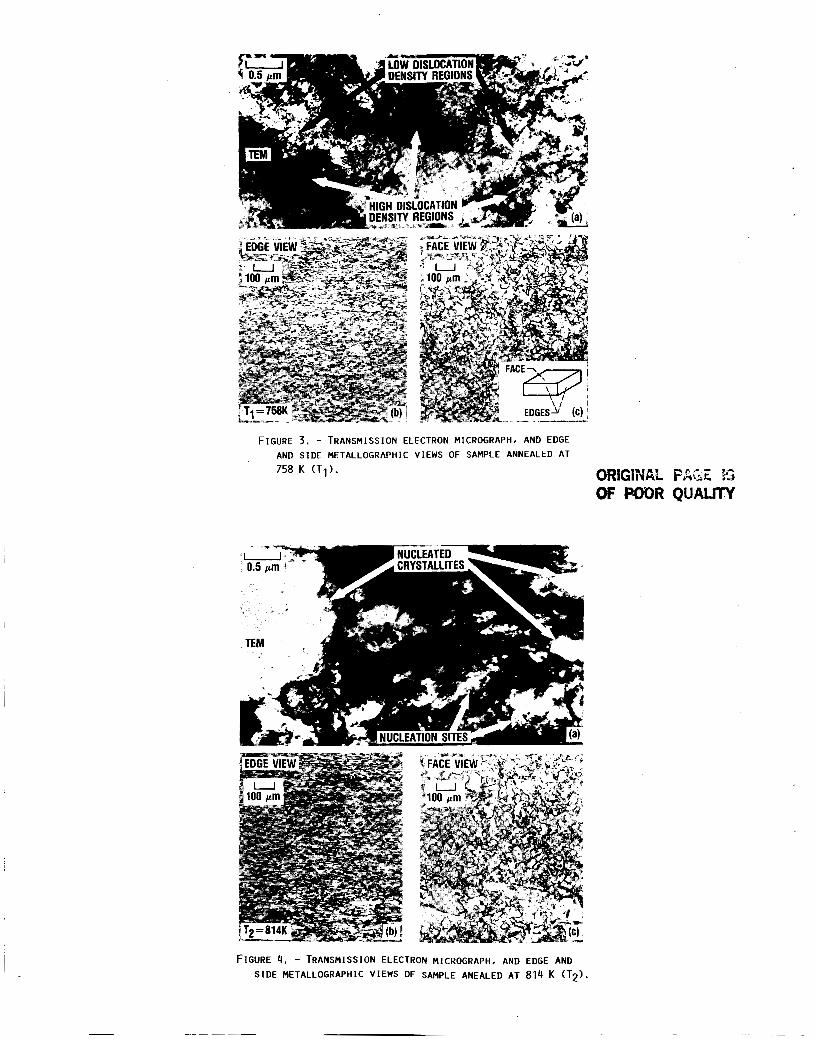
FIGURE 3. - TRANSMISSION ELECTRON MICROGRAPH. AND EDGE AND S I D E METALLOGRAPHIC VIEWS OF SAMPLE ANNEALED AT
758 K ( T i ) . ORiGlNAL FAG E OF W R QUALKY
FIGURE 4 . - TRANSMISSION ELECTRON MICROGRAPH, AND EDGE AND
S I D E METALLOGRAPHIC VIEWS OF SAMPLE ANEALED A T 814 K (T2).

FIGURE 5 . - TRANSMISSION ELECTRON MICROGRAPH. AND EDGE AND S I D E METALLOGRAPHIC VIEWS OF SAMPLE ANNEALED AT 871 K (T3).
FIGURE 6. - TRANSMISSION ELECTRON MICROGRAPH. AND EDGE
AND S IDE METALLOGRAPHIC VIEWS OF SAMPLE ANNEALED AT
901 K (T4 ) .

ORGINAL OF POOR
FIGURE 7. - TRANSMISSION ELECTRON MICROGRAPH, AND EDGE AND SIDE METALLOGRAPHIC VIEWS OF SAMPLE ANNEALED AT 940 K (T5).
FIGURE 8. - TRANSMISSION ELECTRON MICROGRAPH, AND EDGE AND SIDE METALLOGRAPHIC VIEWS OF SAMPLE ANNEALED AT 1011 K (Tg).

0 < >" L
25 s - J J U
> nz u W " !7J 50
% 75
Y c L
" W loo
1000 1050 750 800 850 900 950 ANNEAL TEMPERATURE. K
FIGURE 9. - RECRYSTALLIZATION PERCENT VRN DETERMINED B Y USE OF EQUATION (3) ( S O L I D CURVE), L I G H T OPTICAL METALLOGRAPHIC TECHNIQUES (DOTTED CURVE) AND CAL-
T I O N OF ANNEALING TEMPERATURE. CULATED EXPONENT N (DASH-DOTTED CURVE) AS A FUNC-
h I V
W
W L
IU
a n
v
L
c L W c c U
0, 2
750 800 850 900 950 1000 ANNEALING TEPlPERATURE, K
FIGURE 10.- ATTENUATION AS A FUNCTION OF ANNEALING TEMPERATURE AT 40 " 2 . THE L I G H T SHADING I N THE FIGURE INDICATES ACOUSTIC I D E N T I F I C A T I O N OF THE TEMPERATURE RANGES FOR ONSET AND COMPLE- T I O N OF RECRYSTALLIZATION. THE DARK SHADING-- INDICATES THE RECRYSTALLIZATION TEMPERATURE RANGE. THE CROSS-HATCHED REGION INDICATES THE ONSET OF PURE GRAIN GROWTH. THE TEMPERATURE
FIGURES 3 TO 8. RESPECTIVELY.
LABELS T i TO T6 REFER TO THE DATA SHOWN I N
2.6
2.4
L
I- L W L 0
W
2.2 . 2.0 3
1.8
1.6

1. Report No.
NASA TM-88855
7. Key Words (Suggested by Author@))
U l t r a s o n i c a t tenua t ion ; Nondes t ruc t i ve e v a l u a t i o n ; Nondest ruc t ive t e s t i n g ; Gra in s i z e d i s t r i b u t i o n ; R e c r y s t a l l i z a t i o n ; Nuc lea t i on ; D i s l o c a t i o n s
2. Government Accession No.
18. Distribution Statement
U n c l a s s i f i e d - u n l i m i t e d STAR Category 38
4. Title and Subtitle
9. Security Classif. (of this report)
U n c l a s s i f i e d
U l t r a s o n i c Determinat ion o f R e c r y s t a l l i z a t i o n
20. Security Classif. (of this page) 21. No. of pages 22. Price'
Unc 1 ass 1 f 1 ed
7. Author@)
Edward R. Generazlo
9. Performing Organization Name and Address
N a t i o n a l Aeronaut ics and Space A d m i n i s t r a t i o n Lewis Research Center Cleveland, Ohio 44135
2. Sponsoring Agency Name and Address
N a t i o n a l Aeronaut ics and Space A d m i n i s t r a t i o n Washington, D.C. 20546
5. Supplementary Notes
3. Recipient's Catalog No.
5. Report Date
6. Performing Organization Code
506-43-1 1 8. Performing Organization Report No.
E-3248
IO. Work Unit No.
11. Contract or Grant No.
13. Type of Report and Period Covered
Techn ica l Memorandum
14. Sponsoring Agency Code
Prepared f o r Review o f Progress i n Q u a n t i t a t i v e NDE, cosponsored by t h e Ames Labora tory and Iowa S t a t e U n i v e r s i t y , La J o l l a , C a l i f o r n i a , August 3-8, 1986.
6. Abstract
U l t r a s o n i c a t t e n u a t i o n was measured f o r c o l d worked N i c k e l 200 samples annealed a t i n c r e a s i n g temperatures. Loca l i zed d i s l o c a t i o n d e n s i t y v a r i a t i o n s , c r y s t a l - l i n e o rde r and volume pe rcen t o f r e c r y s t a l l i z e d phase were determined over t h e anneal temperature range u s i n g t ransmlss ion e l e c t r o n microscopy, x - r a y d i f f r a c - t i o n and meta l lography. The exponent o f t h e f requency dependence o f t h e a t t e n u - a t i o n has been found t o be a key v a r i a b l e r e l a t i n g U l t r a s o n i c a t t e n u a t i o n t o t h e thermal k i n e t i c s o f t h e r e c r y s t a l l i z a t i o n process. I d e n t i f i c a t i o n o f t h i s key v a r i a b l e a l l o w s f o r t h e u l t r a s o n i c d e t e r m i n a t i o n o f onset, degree, and comple- t i o n o f r e c r y s t a l l i z a t i o n .
t ' For sale by the National Technical Information Service, Springfield, Virginia 221 61