Ultra‐high performance fiber‐reinforced concrete in ...
184
Ultra‐high performance fiber‐reinforced concrete in incremental bridge launching A study on the application of UHPFRC in the superstructure of an incrementally launched box girder bridge in The Netherlands Master’s Thesis – Main Study A.J. Oostra 18‐08‐2015
Transcript of Ultra‐high performance fiber‐reinforced concrete in ...

Ultra‐high performance fiber‐reinforced concrete in incremental bridge launching
A study on the application of UHPFRC in the superstructure of an
incrementally launched box girder bridge in The Netherlands
Master’s Thesis – Main Study
A.J. Oostra
18‐08‐2015

Ultra‐high performance fiber‐reinforced concrete in incremental bridge launching
A study on the application of UHPFRC in the superstructure of an
incrementally launched box girder bridge in The Netherlands
By
A.J. Oostra
Bachelor of Built Environment, Hogeschool van Amsterdam (2011).
Student number: 4183770.
Submitted to the Department of Structural Engineering
in partial fulfillment of the requirements for the degree of
Master of Science in Civil Engineering
at the Delft University of Technology,
to be defended publicly on Thursday August 27, 2015 at 11:00 AM.
Supervisor: Dr. ir. C. van der Veen, TU Delft
Thesis committee: Prof. dr. ir. D.A. Hordijk (chairman), TU Delft
Prof. ir. A.Q.C. van der Horst, TU Delft
Ir. A.D. Reitsema, TU Delft
Ir. C.M.P. ‘t Hart, Royal HaskoningDHV
Ir. M. Kortenaar, Royal HaskoningDHV

Preface
The findings of this thesis are the result of the graduation project on ultra‐high performance fiber‐
reinforced concrete in incremental bridge launching. The study focuses on the application of UHPFRC
in the superstructure of an incrementally launched bridge in The Netherlands and explores the
competitiveness of the concept. The graduation project is the last step in completion of the Master’s
degree program at Delft University of Technology and has been conducted with the engineering
consultancy Royal HaskoningDHV.
Completing this thesis would not have been possible without a number of people I would like to
thank at this moment. First of all, I would like to thank my graduation committee: dr. ir. C. van der
Veen, prof. ir. A.Q.C. van der Horst, prof. dr. ir. D.A. Hordijk, ir. A.D. Reitsema, ir. M. Kortenaar and ir.
C.M.P. ‘t Hart for their assistance and inspiring ideas. Secondly, I would like to thank my parents for
their support. And lastly, I would like to thank Marc for reviewing the report and suggesting
improvements.
Arjen Oostra
Hoofddorp, August 2015

Abstract
Incremental bridge launching is one of the many ways in which a bridge can be constructed. In The
Netherlands this method is not often used. This may be explained by the fact, that there are not
many suitable locations for application of this method. Incremental bridge launching is profitable for
long bridges and can only be used for straight bridges or when the superstructure has a constant
horizontal and vertical radius throughout the length. However, when the preconditions for use of this
method are met, incremental bridge launching can be a great solution for bridge design.
Ultra‐high performance fibre‐reinforced concrete (UHPFRC) is a new concrete. In contrast to regular
reinforced concrete, UHPFRC contains fibers to provide for the capacity that is necessary when the
concrete is loaded in tension. However, as for incrementally launched bridges, its application is
limited as of yet. One explanation for the reluctance to use the material, is that compared to regular
concrete, the cost of production are many times higher. To make economical designs using UHPFRC,
the high cost of production need to be recovered by material savings, when a structure is executed
or during its lifetime.
The aim of this thesis is to identify whether a superstructure designed in UHPFRC can increase the
application range of incremental bridge launching in The Netherlands, and to explore whether the
concept can compete with other bridge designs. In order to make a statement, a case study approach
is used. It concerns the launch of the eastern approach bridge of the bridge over “Het Pannerdensch
Kanaal”, designed in UHPFRC. The location suits incremental bridge launching perfectly, as there is a
constant horizontal and vertical curvature in the alignment for over 550 meters.
The most favorable cross‐section for incrementally launched bridges is a box girder. A comprehensive
analysis on the cross‐sectional capacity of a prestressed box girder, designed with different concrete
strength classes, is performed to optimize the shape. The design of a box girder takes a special
procedure, where both the transverse and longitudinal directions are considered separately.
Transverse bending moments and shear forces, due to mobile loading, are obtained with influence
surfaces and the differential equation of the Euler‐Bernoulli bending beam. For the longitudinal
direction, a spreadsheet is developed to identify the bending moments and shear forces that occur
during launch and service life. The force method for analysis of indeterminate structures is used to
determine the governing bending moments for this multiple span bridge. Also, the sheet contains
parts to determine the required amount of central and continuity prestressing and to optimize the
length of the steel nose to reduce the peak moments during launch.

The use of UHPFRC in the design of a structure requires a special approach. Requirements regarding
quality control are strict and need to be prescribed to allow on‐site production. The typical
characteristics of UHPFRC have an important impact on the execution and production cycle of the
incrementally launched bridge, which is therefore investigated. The case study is used to investigate
the competitiveness of the design. Cost of production and execution are integrated into a price per
cubic meter of concrete and compared to the design of The Zeeburgerbrug, which was launched and
built with regular concrete.
Efficient use of UHPFRC allows a light box girder design, which can be launched without auxiliary
supports. Conventional and shear reinforcement are not necessary. Transverse and longitudinal
prestressing provide sufficient bending moment capacity, while the fibers contribute to a huge shear
capacity that is more than enough to withstand the shear forces. The required amount of central and
continuity prestressing does not fit in the concrete cross‐section. Therefore, all tendons are applied
externally. The anchors and deviators will not fit in the concrete cross‐section either.
The cost comparison shows, that a lot of the higher cost of production of UHPFRC can already be
compensated during the design and construction phases. The remaining part of the higher cost of
production of UHPFRC need to be compensated differently, for instance by savings in maintenance
cost due to better durability properties or by a lighter substructure, as we are able to generate
proper savings in the amount of concrete for the superstructure.
The case study proves that when the superstructure is considered only, it might be hard to design
and execute the UHPFRC box girder more economically than the design of The Zeeburgerbrug.
However, when we consider the total bridge over the entire service life, we might have a competitive
design. Alternative bridge designs, that use different construction techniques should be developed to
assess the competitiveness of the incrementally launched UHPFRC box girder for that location.

Table of Contents
1 Introduction ................................................................................................................................... 14
1.1 Problem indication ................................................................................................................ 14
1.2 Scope ..................................................................................................................................... 14
1.3 Research goal and method .................................................................................................... 14
1.4 Thesis outline......................................................................................................................... 15
2 Literature review ........................................................................................................................... 16
2.1 The construction method of a traditional incrementally launched bridge ........................... 16
2.2 Preconditions for use of incrementally launched bridge construction ................................. 17
2.3 The cross‐section of an incrementally launched box girder bridge ...................................... 17
2.4 Loading during launch ........................................................................................................... 18
2.5 Cost ........................................................................................................................................ 20
2.6 Benefits of incremental bridge launching ............................................................................. 21
2.7 Drawbacks on incremental bridge launching ........................................................................ 22
2.8 The competitiveness of incremental bridge launching in Croatia ......................................... 23
2.9 Internal or external prestressing of incrementally launched bridges ................................... 24
2.9.1 Development in prestressing ........................................................................................ 24
2.9.2 Benefits of external prestressing ................................................................................... 26
2.10 Ultra‐High Performance Concrete ......................................................................................... 26
2.10.1 Fibers ............................................................................................................................. 26
2.10.2 Compressive strength .................................................................................................... 26
2.10.3 Tensile strength ............................................................................................................. 27
2.10.4 Fiber orientation ............................................................................................................ 27
2.10.5 Durability ....................................................................................................................... 27
2.10.6 Optimal use of UHPC ..................................................................................................... 28
2.10.7 Reticence on a wide application for use of UHPC ......................................................... 28
2.11 Building incrementally launched bridges in UHPC ................................................................ 28
2.12 Why UHPC and incremental bridge launching might complete each other ......................... 29
2.13 Research goals for the main study ........................................................................................ 29
2.13.1 The Dutch market .......................................................................................................... 29
2.13.2 Design and execution of an UHPC incrementally launched bridge ............................... 30
2.13.3 Optimization of the cross‐section ................................................................................. 30
2.13.4 Prestressing in incremental bridge launching ............................................................... 30
2.13.5 An optimal span length ................................................................................................. 30
2.13.6 Alternative execution method ...................................................................................... 30
3 Designing with UHPFRC ................................................................................................................. 31
3.1 Rectangular reinforced NSC/HSC beam ................................................................................ 36
3.2 Rectangular doubly reinforced NSC/HSC beam .................................................................... 39
3.3 Rectangular doubly reinforced NSC/HSC beam + normal force ............................................ 39
3.4 Rectangular prestressed NSC/HSC beam .............................................................................. 41
3.5 Reinforced NSC/HSC box girder ............................................................................................ 41
3.6 Prestressed NSC/HSC box girder ........................................................................................... 42
3.7 Rectangular unreinforced UHPFRC beam ............................................................................. 44
3.8 Rectangular prestressed UHPFRC beam ................................................................................ 45
3.9 Unreinforced UHPFRC box girder .......................................................................................... 47
3.10 Prestressed UHPFRC box girder ............................................................................................. 48
3.10.1 Varying the deck depth ................................................................................................. 50
3.10.2 Varying the web width .................................................................................................. 50
3.10.3 Varying the floor depth ................................................................................................. 50
3.10.4 Varying the box girder height ........................................................................................ 50
3.10.5 Increasing the concrete compressive strength fck from 150 MPa to 200 MPa ............. 53
3.10.6 Increasing the design tensile strength σctmax from 5 MPa to 6 MPa .............................. 53
3.10.7 Increasing the modulus of elasticity Ec from 50000 MPa to 60000 MPa ...................... 53
3.10.8 UHPFRC without fibers .................................................................................................. 53
3.10.9 Using VHPFRC instead of UHPFRC ................................................................................. 53
4 The hardening process and quality of concrete ............................................................................ 54
4.1 Hardening of conventional concrete ..................................................................................... 54
4.2 Hardening of ultra‐high performance concrete .................................................................... 57
5 Building with ultra‐high performance fiber‐reinforced concrete ................................................. 59
5.1 Ultra‐high performance concrete manufacturers ................................................................. 59
5.2 Mixture composition ............................................................................................................. 60
5.3 Preconditions and equipment for on‐site production and application of UHPC .................. 61
6 Case study: bridge over “Het Pannerdensch Kanaal” ................................................................... 63
6.1 Functional requirements ....................................................................................................... 65
6.2 Geometrical requirements .................................................................................................... 65
6.3 Physical requirements ........................................................................................................... 66
6.4 Boundary conditions ............................................................................................................. 66
6.5 Design assumptions ............................................................................................................... 66
7 Box girder dimensions for preliminary design .............................................................................. 68
7.1 The shape of the box girder .................................................................................................. 68
7.1.1 Inclined webs versus straight webs ............................................................................... 68
7.2 The deck width ...................................................................................................................... 69
7.3 Remaining box girder dimensions ......................................................................................... 70
8 Design of the superstructure ......................................................................................................... 72
8.1 Design procedure .................................................................................................................. 72
8.2 The loads ............................................................................................................................... 72
8.2.1 Self weight ..................................................................................................................... 72
8.2.2 Super imposed dead load .............................................................................................. 73
8.2.3 Traffic loading ................................................................................................................ 74
8.2.4 Temperature loading ..................................................................................................... 75
8.3 Load combinations ................................................................................................................ 75
8.3.1 Ultimate limit state ........................................................................................................ 75
8.3.2 Serviceability limit state ................................................................................................ 76
8.4 Transverse direction and mobile loads ................................................................................. 77
8.4.1 Load case 1 .................................................................................................................... 79
8.4.2 Load case 2 .................................................................................................................... 81
8.4.3 Load case 3 .................................................................................................................... 83
8.4.4 Load case 4 .................................................................................................................... 86
8.5 Flange design ......................................................................................................................... 89
8.5.1 Self‐weight ..................................................................................................................... 89
8.5.2 Asphalt layer .................................................................................................................. 89
8.5.3 Footpath and edge element .......................................................................................... 90
8.5.4 Parapet .......................................................................................................................... 90
8.5.5 Safety barrier ................................................................................................................. 90
8.5.6 All permanent loads ...................................................................................................... 90
8.5.7 UDL ................................................................................................................................ 91
8.5.8 Tandem system ............................................................................................................. 92
8.5.9 ULS design ..................................................................................................................... 94
8.5.10 SLS design ...................................................................................................................... 95
8.6 Deck support ......................................................................................................................... 97
8.6.1 Self‐weight ..................................................................................................................... 97
8.6.2 Asphalt ........................................................................................................................... 98
8.6.3 Permanent loads ........................................................................................................... 98
8.6.4 UDL ................................................................................................................................ 99
8.6.5 Tandem system ........................................................................................................... 100
8.6.6 ULS design ................................................................................................................... 101
8.6.7 SLS design .................................................................................................................... 102
8.7 Deck end haunch ................................................................................................................. 105

8.7.1 Self‐weight ................................................................................................................... 105
8.7.2 Asphalt ......................................................................................................................... 105
8.7.3 Permanent loads ......................................................................................................... 105
8.7.4 UDL .............................................................................................................................. 107
8.7.5 Tandem system ........................................................................................................... 107
8.7.6 ULS design ................................................................................................................... 109
8.7.7 SLS design .................................................................................................................... 110
8.8 Deck mid span ..................................................................................................................... 112
8.8.1 Self‐weight ................................................................................................................... 112
8.8.2 Asphalt ......................................................................................................................... 112
8.8.3 Permanent loads ......................................................................................................... 112
8.8.4 UDL .............................................................................................................................. 112
8.8.5 Tandem system ........................................................................................................... 113
8.8.6 ULS design ................................................................................................................... 114
8.8.7 SLS design .................................................................................................................... 115
8.9 Force distribution in the webs ............................................................................................. 116
8.9.1 Mobile loading on cantilever (load case 1) ................................................................. 116
8.9.2 Mobile loading on deck between the webs (load case 4) ........................................... 116
8.10 Force distribution in the floor ............................................................................................. 119
8.10.1 Self‐weight ................................................................................................................... 119
8.10.2 Vehicle with hydraulic jack .......................................................................................... 119
8.10.3 Tensile force in the floor due to mobile loading on deck ............................................ 119
8.10.4 ULS design ................................................................................................................... 120
8.10.5 SLS design .................................................................................................................... 121
8.11 A different deflection at both webs .................................................................................... 122
8.11.1 Force distribution in the floor caused by box girder distortion .................................. 129
9 Longitudinal direction ................................................................................................................. 130

9.1 General properties .............................................................................................................. 130
9.2 Extreme bending moments at support and span during launch ......................................... 131
9.2.1 Self‐weight ................................................................................................................... 131
9.2.2 ULS design ................................................................................................................... 131
9.2.3 SLS design .................................................................................................................... 131
9.3 Central prestressing ............................................................................................................. 131
9.3.1 The initial prestressing force ....................................................................................... 132
9.3.2 The working prestressing force ................................................................................... 132
9.3.3 Shrinkage ..................................................................................................................... 132
9.3.4 Creep ........................................................................................................................... 133
9.3.5 Relaxation .................................................................................................................... 133
9.3.6 The required amount of central prestressing ............................................................. 134
9.3.7 The ultimate bending moment capacity ..................................................................... 134
9.3.8 The maximum compressive stress .............................................................................. 134
9.4 Nose optimization ............................................................................................................... 135
9.4.1 Central prestressing and nose length .......................................................................... 135
9.4.2 The required amount of central prestressing for the cantilever bending moment .... 139
9.4.3 The ultimate bending moment capacity ..................................................................... 139
9.5 Extreme shear forces at the support during launch ............................................................ 140
9.5.1 Self‐weight ................................................................................................................... 140
9.5.2 ULS design ................................................................................................................... 140
9.5.3 Ultimate shear capacity ............................................................................................... 140
9.6 The Use Phase ..................................................................................................................... 142
9.6.1 Self‐weight ................................................................................................................... 142
9.6.2 Super imposed dead load ............................................................................................ 142
9.6.3 Traffic loading .............................................................................................................. 142
9.7 Extreme bending moments for a bridge with multiple spans ............................................. 143

9.7.1 Calculation of the extreme bending moments at the supports .................................. 143
9.7.2 Extreme bending moment for an intermediate beam in the span ............................. 145
9.7.3 Extreme bending moment for an end beam in the span ............................................ 147
9.7.4 Calculation of the external bending moments for a bridge with multiple spans ........ 148
9.7.5 Rotational spring stiffness for a beam with multiple spans ........................................ 149
9.8 Calculation of the required amount of continuity prestressing .......................................... 150
9.8.1 Tendon arrangement ................................................................................................... 150
9.8.2 Creep ........................................................................................................................... 152
9.8.3 Relaxation .................................................................................................................... 152
9.8.4 The required amount of continuity prestressing ........................................................ 152
9.8.5 The ultimate bending moment capacity ..................................................................... 153
9.9 Extreme shear forces at the supports in the use phase ...................................................... 154
9.9.1 Ultimate shear capacity ............................................................................................... 154
9.10 The length of a segment ...................................................................................................... 155
9.11 The final box girder design .................................................................................................. 158
9.11.1 Reduction of web thickness ........................................................................................ 158
9.11.2 Maximum span length ................................................................................................. 158
10 Execution ................................................................................................................................. 159
10.1 The construction site and fabrication yard ......................................................................... 159
10.2 The steel nose ...................................................................................................................... 161
10.3 The formwork system .......................................................................................................... 161
10.4 Casting of concrete .............................................................................................................. 162
10.5 Curing of concrete and heat treatment .............................................................................. 163
10.6 Anchors and deviators ......................................................................................................... 164
10.7 Temporary launch bearings and launch procedure ............................................................ 166
10.8 Sequence of work ................................................................................................................ 166
11 Cost .......................................................................................................................................... 169

11.1 Cost of production of UHPC and NSC .................................................................................. 169
11.1.1 General properties of The Zeeburgerbrug .................................................................. 170
11.2 Cost components ................................................................................................................. 171
11.2.1 Formwork .................................................................................................................... 171
11.2.2 Reinforcement and prestressing ................................................................................. 171
11.2.3 Launching .................................................................................................................... 171
11.2.4 Nose ............................................................................................................................. 171
11.2.5 Auxiliary bridge piers ................................................................................................... 172
11.3 Price index ........................................................................................................................... 172
11.4 Comparing the designs in UHPC and NSC ........................................................................... 172
12 Conclusion ............................................................................................................................... 175
13 Discussion ................................................................................................................................ 177
13.1 General remarks .................................................................................................................. 177
13.2 Limitations ........................................................................................................................... 177
13.3 Recommendations for further research .............................................................................. 178
14 References ............................................................................................................................... 180

14
1 Introduction
1.1 Problem indication
In The Netherlands, incremental bridge launching is a construction technique that is not often used.
However, in a recent Croatian study by (Mandic Ivankovic, et al., 2014), incremental bridge launching
proved to be very competitive to other bridge execution methods. Also, (Rosignoli, 1997) showed
that incrementally launched bridges without auxiliary supports are located in the area of transition
between constant and variable height superstructures. Since variable height superstructures
generally have higher construction cost and longer construction times, increasing the application
range of full span incremental bridge launching is obviously beneficial. Besides that, research on the
application of new concretes, like ultra‐high performance fiber‐reinforced concrete, is an important
subject at Delft University of Technology. This study contributes to current research by providing
insights on whether UHPFRC can increase the application range of incremental bridge launching and
whether the combination results in an economical bridge design.
1.2 Scope
In incremental bridge launching, the superstructure of a bridge is manufactured by sections on one
of the abutments. Each new segment is poured directly against the preceding one and after it has
hardened, the whole structure is moved forward towards the span. Therefore, the study aims on the
design and execution of the superstructure of the bridge and does not consider the substructure. The
application of a new material in bridge construction requires vast expertise on material behavior.
Especially development of mechanical properties during early age and properties regarding execution
play a crucial role and need to be studied.
1.3 Research goal and method
The aim of the study is to explore whether the superstructure of an incrementally launched box
girder bridge can be designed and executed in UHPFRC and if the concept can compete with bridge
designs that use other construction techniques. A case study approach is used to make a statement
and to identify the associated boundary conditions and external factors and to prescribe the
requirements that apply to this situation.

15
1.4 Thesis outline
Chapter 2 summarizes the most important findings in reviewing the literature on UHPFRC and
incremental bridge launching and provides an overview of research goals for the main study. Chapter
3 presents the results obtained from the analysis of the cross‐sectional capacity of different types of
beams designed with different types of concrete. In chapter 4 the hardening properties of UHPFRC
and the quality of concrete are discussed, while Chapter 5 provides typical mixture compositions and
preconditions for on‐site production and application of the material.
Chapter 6 describes the case study with corresponding requirements, boundary conditions and
design assumptions. In chapter 7 the shape of the box girder and dimensions for preliminary design
are defined. Chapter 8 starts with the special procedure for box girder design and then analyzes the
transverse direction. Chapter 9 investigates the force distribution in longitudinal direction.
Finally, in chapter 10 and 11, the execution of the incrementally launched UHPFRC box girder is
described and the cost are compared to the design of The Zeeburgerbrug, which used normal
strength concrete. Chapter 12 and 13 contain the conclusions and recommendations for further
research.

16
2 Literature review
This chapter summarizes the most important findings obtained from the literature review on
incrementally launched bridges and UHPFRC. Paragraph 2.13 presents the research goals for the
main study.
2.1 The construction method of a traditional incrementally launched bridge
The superstructure of an incrementally launched bridge is made up of sections, manufactured in a
fabrication yard behind one of the abutments. Conditions similar to those in a factory can be
reached, making high quality production possible. Each new unit is poured directly against the
preceding one and after it has hardened is pushed towards the span by a hydraulic jacking device. In
all bridges that were explored during literature review (Oostra, 2014), construction of one unit took
about a week after which all operations were repeated. The exact interpretation of such a cycle
depends on whether the box girder will be cast in one or two phases. The weekends will be used for
the concrete to harden.
The bridge supports are equipped with temporary sliding bearings to reduce friction during launch.
The bearings usually consist of a high quality concrete block covered with a stressed chrome‐steel
plate. Steel reinforced neoprene sliding plates, with a Teflon coating on one face, should be able to
be inserted without difficulty.
The conditions during erection are of great influence upon the economy of the superstructure. A
lightweight nose is mounted to the cantilevering superstructure to reduce the cantilever moment
during launch. Alternatively the front end can be guyed from a mast. For bridges with very long spans
the use of auxiliary piers during erection may be beneficial.
During launch the superstructure is subjected to alternating bending moments. Each cross‐section
moves from regions of positive moments into regions of negative moments. To withstand these
moments central prestressing is used. Central prestressing means that prestressing is arranged such
that at all points the cross‐section is equally compressed. Usually the central prestressing is
positioned in the deck and floor.

17
When the superstructure has been completely launched, the continuity tendons are stressed. Their
arrangement is designed according to the bending moments occurring in the use phase. The
continuity prestressing is normally located in the webs and is anchored and stressed at buttresses on
their inner faces. The continuity prestressing has a draped profile and is ideally anchored at the
points of contra flexure in the bending moment diagram.
2.2 Preconditions for use of incrementally launched bridge construction
Incremental bridge launching has the following preconditions:
Incremental bridge launching can be used for straight bridges or when the superstructure
has a constant horizontal and vertical radius throughout the length.
All segments should exactly fit into the span to achieve high repetition in lay‐out of
reinforcing and prestressing steel.
2.3 The cross‐section of an incrementally launched box girder bridge
When a favorable cross‐section has been chosen one can make considerable savings in the required
amount of central prestressing. The following requirements should be met:
1. The superstructure should be designed as light as possible.
2. The ratio of moment of resistance above and beneath the neutral axis should be similar to
the ratio of support moments to span moments. This requires the moment of resistance of
the top part to be about twice the moment of resistance of the bottom part.
3. The core width, i.e. the ratio between moment of resistance and cross‐sectional area, should
be as large as possible.
These three conditions are best fulfilled by a box girder with cantilevers. The required amount of
central prestressing is about equal above the support and in the span.
The width of the web in the span is dominated by the shear forces which appear when the section
passes a support. The width of the web at the support is governed by the shear forces that occur in
the use phase.

18
During launch, every cross‐section of the deck is subjected to the same transitory stresses. A great
uniformity of cross‐section along the deck is necessary. Mid‐span sections cannot be designed
lighter, but would be beneficial as the span increases and is often done with other construction
techniques.
The cross‐section moves between the two limit configurations shown in Figure 2.1. Configuration (a)
represents the use phase. In configuration (b) the superstructure has advanced by half a span. In
both configurations, the cross‐sections at mid‐span are rarely overloaded, because the combination
of lower shear forces and a lower bending moment than under live loads often only require sufficient
prestressing to withstand tensile stresses in the bottom floor.
With respect to the cross‐section above the support, configuration (b) is governing. In configuration
(b) the cross‐section is subjected to maximum negative moment and maximum shear, while in final
position it will be at mid‐span and needs to withstand positive moments and slight shear. These
transient stresses tend to cause an oversized cross‐section with respect to the use phase.
Figure 2.1: Limit configurations during launching (Rosignoli, 1997).
2.4 Loading during launch
In (Iversen, et al., 1993), the launch of the 21 span Dornoch Firth Bridge was analyzed. To investigate
the effects of launch on the leading units, a six‐span structure was modeled with a steel launch nose
attached to the first unit and the rear support being a clamped support. Peak moments developed
during launch over approximately the first 60 meters of the superstructure, as shown in Figure 2.2.
(Bourne, et al., 2009) discussed the effects of launch of the Clackmannanshire Bridge on its bending
moment diagram. Figure 2.3 illustrates that even with a 35 meters long launching nose the bending
moments in the first two spans were around 25% higher than in the remaining spans. Instead of the
ultimate bending moment capacity, cracking appeared to be critical in the design. The engineers
decided to reduce the reinforcement bar spacing to obtain a more fine cracking pattern.

19
Figure 2.2: Self‐weight bending moment diagram during launch (Iversen, et al., 1993).
Figure 2.3: Bending moments due to launching effects (Bourne, et al., 2009).
20
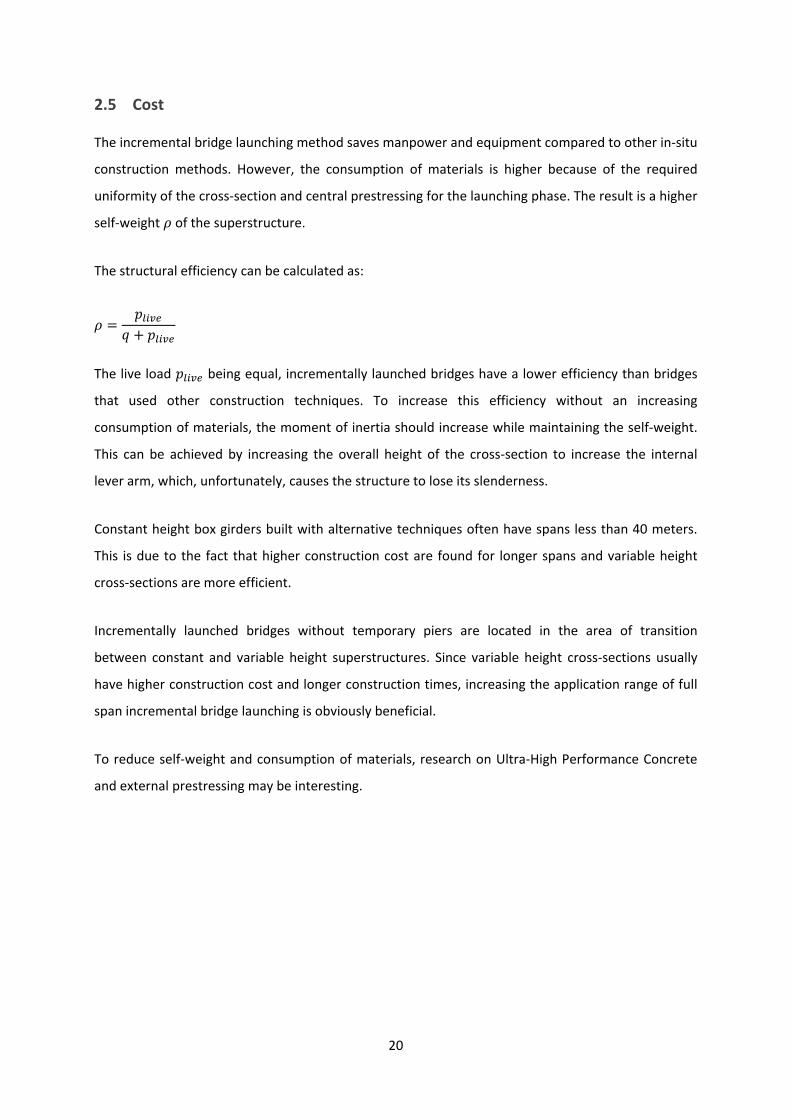
2.5 Cost
The incremental bridge launching method saves manpower and equipment compared to other in‐situ
construction methods. However, the consumption of materials is higher because of the required
uniformity of the cross‐section and central prestressing for the launching phase. The result is a higher
self‐weight of the superstructure.
The structural efficiency can be calculated as:
The live load being equal, incrementally launched bridges have a lower efficiency than bridges
that used other construction techniques. To increase this efficiency without an increasing
consumption of materials, the moment of inertia should increase while maintaining the self‐weight.
This can be achieved by increasing the overall height of the cross‐section to increase the internal
lever arm, which, unfortunately, causes the structure to lose its slenderness.
Constant height box girders built with alternative techniques often have spans less than 40 meters.
This is due to the fact that higher construction cost are found for longer spans and variable height
cross‐sections are more efficient.
Incrementally launched bridges without temporary piers are located in the area of transition
between constant and variable height superstructures. Since variable height cross‐sections usually
have higher construction cost and longer construction times, increasing the application range of full
span incremental bridge launching is obviously beneficial.
To reduce self‐weight and consumption of materials, research on Ultra‐High Performance Concrete
and external prestressing may be interesting.

21
The optimum length of the mould can be found when assembly cost and launching cost are at their
minimum.
: length of the mould (m).
: cost per meter of formwork.
: total length of launching part (m).
: cost per launching operation.
/ : number of launching operations.
: cost independent on .
is at its minimum when / 0.
0
2.6 Benefits of incremental bridge launching
Compared to other construction techniques, incremental bridge launching has the following
advantages:
The superstructure can be erected without stationary falsework that would disturb the
environment. The so‐called ‘traffic fine’ – a penalty for crossing a road and when it has to be
closed temporarily – can be confined.
The concentration of the building site and concrete batch plant behind one of the
abutments keeps the transportation distances extremely short.
Construction is safe, because the complete bridge can be erected from one of the
abutments and no construction on falsework or at a balanced cantilever is necessary.
A more sustainable superstructure can be designed compared to other construction
techniques due to longer elements and thus fewer joints. Furthermore, each new segment
will be poured directly onto its predecessor, which results in watertight joints. Cracking near
joints will be limited due to continuous longitudinal reinforcement. All these properties may
contribute to less maintenance.

22
2.7 Drawbacks on incremental bridge launching
There are not a lot of incrementally launched bridges built in The Netherlands. The reason may be
one of the following:
The location is not suitable for this construction method, because of: a short bridge, short
spans, low road alignment (construction with precast girders will be cheaper), complex road
geometry, no space for a temporary fabrication yard, environment can be disturbed (in‐situ
construction on scaffolding will be cheaper).
The consumption of materials is high, because a great uniformity of cross‐section and
central prestressing for the launching operation are required.
Incrementally launched bridges have a less slender superstructure than bridges built with
other construction techniques.
Web thickness at mid‐span may increase for longer spans as opposed to bridges built with
other construction techniques. This is due to the temporary shear forces which appear when
a section passes a support.
Due to the static scheme of a continuous beam on many supports, horizontal forces may
become very large. The substructure must be designed to withstand these forces and is
therefore likely to become heavy.
23
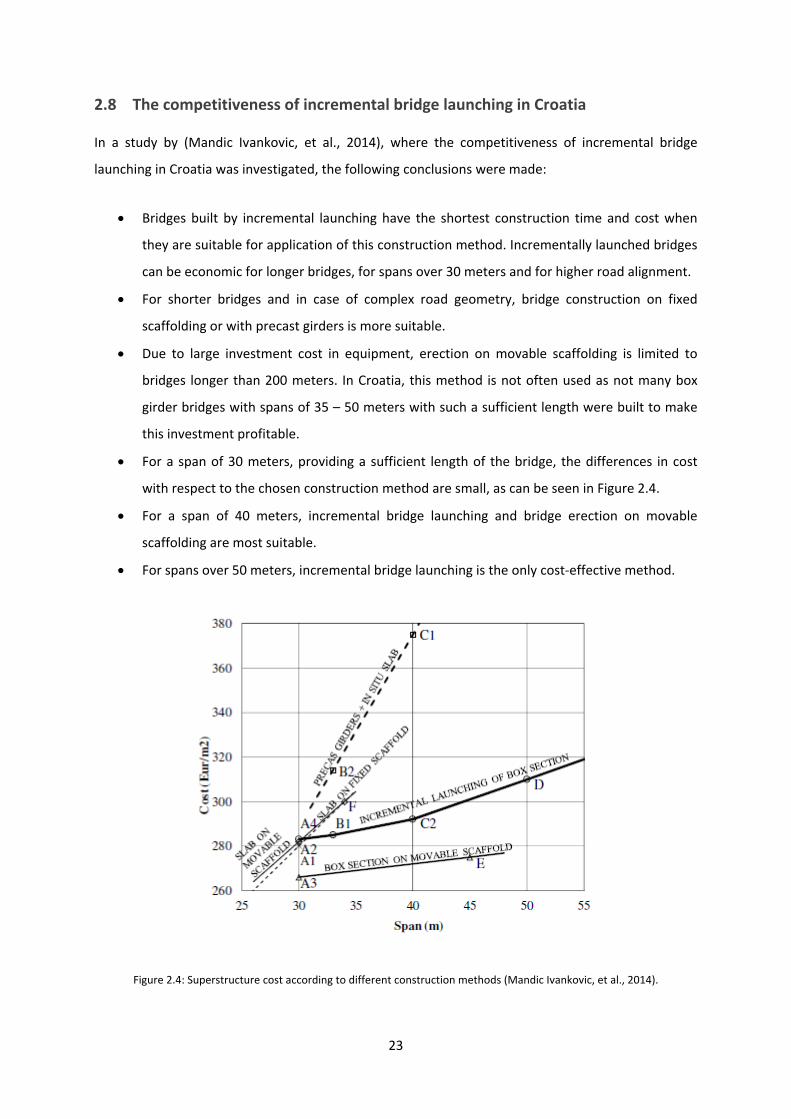
2.8 The competitiveness of incremental bridge launching in Croatia
In a study by (Mandic Ivankovic, et al., 2014), where the competitiveness of incremental bridge
launching in Croatia was investigated, the following conclusions were made:
Bridges built by incremental launching have the shortest construction time and cost when
they are suitable for application of this construction method. Incrementally launched bridges
can be economic for longer bridges, for spans over 30 meters and for higher road alignment.
For shorter bridges and in case of complex road geometry, bridge construction on fixed
scaffolding or with precast girders is more suitable.
Due to large investment cost in equipment, erection on movable scaffolding is limited to
bridges longer than 200 meters. In Croatia, this method is not often used as not many box
girder bridges with spans of 35 – 50 meters with such a sufficient length were built to make
this investment profitable.
For a span of 30 meters, providing a sufficient length of the bridge, the differences in cost
with respect to the chosen construction method are small, as can be seen in Figure 2.4.
For a span of 40 meters, incremental bridge launching and bridge erection on movable
scaffolding are most suitable.
For spans over 50 meters, incremental bridge launching is the only cost‐effective method.
Figure 2.4: Superstructure cost according to different construction methods (Mandic Ivankovic, et al., 2014).

24
In The Netherlands, we have different conditions. In Croatia, almost all bridges cross deep valleys so
construction on movable scaffolding will not be a good solution. It is interesting to know if, and under
what conditions, incremental bridge launching could compete with other construction techniques in
The Netherlands. Since the method is suitable for longer bridges and intermediate spans, it may only
be used for approach bridges and long viaducts.
2.9 Internal or external prestressing of incrementally launched bridges
2.9.1 Development in prestressing
(Oostra, 2014) studied prestressing of incrementally launched bridges, and noticed a clear
development in the type of prestressing used for incrementally launched bridges:
1. Traditionally, central and continuity prestressing are located inside the concrete cross‐
section. However, the arrangement of central prestressing is not beneficial for the use phase.
2. Central prestressing will be applied internally. Continuity prestressing will be applied
externally and arranged according to the use phase.
3. Horizontal external tendons act as central prestressing. After the launching operation is
completed, their arrangement is adapted in order to form an efficient lay‐out for the use
phase. Above the supports the cables are elevated. At mid‐span the cables are pulled
downwards. This operation requires the cables to elongate, which can be done by so‐called
shims. The cables should be detensioned before their rearrangement. Such a system was
used in the bridge over the Rio Caroni in Venezuela.
4. A part of the external continuity tendons is installed permanently and balanced by as many
temporary tendons, which have an opposite lay‐out. After launching, these temporary
tendons are detensioned and rearranged as final external tendons for the use phase. Such a
system was used in the Sathorn Bridge in Thailand.
5. The use of partial prestressing. During launching, the load is shared between external
prestressing and longitudinal reinforcement; passive reinforcement that would otherwise be
ignored. The dead load should be carried by continuity tendons. The live loads will be carried
by the longitudinal reinforcement. This system was used in the Clackmannanshire Bridge in
Scotland.
Prestressing, which will be active in both the launch and use phase, will be most effective. When the
same tendons can be used in both phases, the prestressing force doesn’t have to be limited during
launching and auxiliary supports may be avoided.

25
In a study by (Vermeulen, et al., 1993) a combination of system (3) and (4) was developed. Half of the
continuity tendons will be installed permanently before launching (4). The other half will be arranged
such that a central prestressing is acquired. Figure 2.5 illustrates, that after launching these tendons
are rearranged for the use phase (3).
Figure 2.5: Alternative tendon lay‐out Zeeburgerbrug(Vermeulen, et al., 1993).

26
2.9.2 Benefits of external prestressing
External prestressing has the following advantages over internal prestressing:
With the use of external prestressing the webs of a box girder will not contain ducts. The
shear capacity will not be reduced and the webs can be designed more slender. This will
cause a reduction in self‐weight and thus a reduction in the amount of reinforcement.
Because of the absence of ducts in the webs, the execution gets simplified with respect to
casting the concrete.
The tendons can be inspected and repaired more easily. Therefore, the chance of not fully
grouted cables is negligible. One can inject the ducts with grease to protect the cables
against corrosion.
The tendons are replaceable when the ducts and anchorage allow this replacement.
Depending on the cable type and anchorage the prestressing force can be adjusted.
A complicated tendon layout inside the concrete can be avoided, so friction losses will be
small and unintended curvature pressures are absent.
2.10 Ultra‐High Performance Concrete
Ultra‐High Performance Concrete (UHPC) indicates concrete mixtures with a very high characteristic
compressive strength between 150 and 250 MPa. These types of mixtures are characterized by a
very low water/cement ratio. Their high‐quality properties are based on three principles: an
improved homogeneity, packing density/microstructure and ductility, providing the mixture contains
fibers.
2.10.1 Fibers
When fibers are added to the concrete, one speaks of Ultra‐High Performance Fiber Reinforced
Concrete (UHPFRC). Short fibers bridge micro‐cracks and cause an increase in concrete strength.
Long fibers bridge macro‐cracks and cause an increase in ductility. Two types of fibers exist: steel and
synthetic fibers. Steel fibers provide and improved ductility, post‐cracking strength and compressive
strain limit. Synthetic fibers provide a fire resistance and reduced cracking due to plastic shrinkage.
2.10.2 Compressive strength
UHPC in compression performs elastic behavior until a maximum is reached. After the peak the
strain does not remain uniform. A sudden drop in stress can occur when fiber content is less than the
recommended value of two percent.

27
2.10.3 Tensile strength
Just like conventional concrete, UHPFRC exhibits linear elastic behavior until a certain peak value.
However, as opposed to conventional concrete, the stress will not become zero after this peak has
been exceeded. This is due to the fibers’ crack‐bridging properties. Different constitutive equations
exist. Strain‐hardening occurs when the post‐cracking strength is higher than the capacity of the
matrix itself, in concrete with high fiber content (Figure 2.6 left). Strain‐softening occurs when the
post‐cracking strength is lower than the capacity of the matrix in concrete with low fiber content and
inefficient fibers (Figure 2.6 right).
Figure 2.6: Tensile strength UHPFRC (Association Francaise de Génie Civil, 2013).
2.10.4 Fiber orientation
Fibers tend to align in the direction of flow. Fibers close to formwork walls are naturally aligned
parallel to them. However, this phenomenon stops when a certain distance to the formwork is
exceeded. The influence of fiber orientation on real strength values to be considered in calculations
is taken into account by a certain K‐factor. One can distinguish between a local and global factor. This
factor is only applicable after the concrete is cracked.
2.10.5 Durability
The mixture composition of UHPC and high binder content eliminate capillary porosity of the
concrete and result in good durability. Self‐healing properties provide long‐term maintaining of
tensile strength given that crack width is controlled. The improved durability properties may lead to a
reduced concrete cover and less maintenance.

28
2.10.6 Optimal use of UHPC
In order to make optimal use of UHPC the high compressive strength should be fully utilized. This is
especially important for elements that are loaded in pure bending. When fibers are forced to act as
reinforcement or when traditional reinforcement has been applied, the material cannot be used
effectively, as compression strength only acts in the concrete compression zone. UHPC is suitable for
high prestressing forces.
2.10.7 Reticence on a wide application for use of UHPC
One is reluctant to use the new material UHPC, because:
Production cost for UHPC are many times higher than for NSC.
There are still no (inter)national regulations on designing with UHPC that are acknowledged,
so it is hard to prove the reliability of a structure.
There is no proof that structures remain reliable throughout their lifetime.
Due to the higher production cost of UHPC in comparison with NSC, it will take a long time to
exploit the better durability properties and thus lower maintenance cost to reach break‐
even. Today’s Design Build Finance and Maintain (DBFM) contracts often run for 25 years.
The break‐even point may lie much further away.
2.11 Building incrementally launched bridges in UHPC
All incrementally launched bridges that were discussed in the preliminary study (Oostra, 2014) were
built with normal strength concrete. However, UHPC is a different material. Production of UHPC
differs from production of NSC. The concrete mixture is composed differently, quality control of the
production process is stricter and highly skilled personnel are required. To ensure fiber continuity,
concrete should be poured without interruption. High drop heights should be avoided to minimize
the probability of segregation of fibers from the cement paste or formation of fiber clusters. Fiber
orientation defines the behavior of UHPC and should be monitored closely. UHPC hardens a lot
quicker than NSC. Heat treatment should be carried out to minimize shrinkage and creep. Further
research should be done on whether precast or in‐situ UHPC units should be used in incremental
bridge launching.

29
2.12 Why UHPC and incremental bridge launching might complete each other
Due to the high mechanical properties of UHPC, structures may have a much lighter design, which
simplifies assembly and requires less central prestressing. It would then also reduce the forces that
have to be carried by the substructure. Furthermore, consumption of materials may be reduced,
which is usually high for incremental bridge launching in comparison with other construction
techniques.
The structural efficiency can be enlarged by a lighter design. This permits the superstructure to
remain slender, which is very rare for incrementally launched bridges and positive on aesthetics.
Incrementally launched bridges without temporary piers are located in the area of transition
between constant and variable height superstructures. Since variable height superstructures usually
have higher construction cost and longer construction times, increasing the application range of full
span incremental bridge launching may be beneficial. Moreover, the length of precast girders is
restricted by crane capacity and transportation.
Prestressing turned out to be most effective when it can be active in both launch and use phase.
When the same tendons are used for both phases, the level of prestressing does not need to be
limited during launch. UHPC can be highly prestressed and one might not need auxiliary supports.
Because of the quick hardening properties of UHPC and since passive reinforcement might be
avoided, the cycle to construct a segment might be accelerated to find a shorter total construction
time.
2.13 Research goals for the main study
2.13.1 The Dutch market
Infrastructural improvements in The Netherlands in the near future need to be reviewed to see if
they are suitable for application of incremental bridge launching. A location and corresponding
requirements and boundary conditions should be defined to examine the competitiveness of an
UHPC incrementally launched bridge in The Netherlands.

30
2.13.2 Design and execution of an UHPC incrementally launched bridge
The influence of the use of UHPC in the design and execution of the incrementally launched bridge
should be further investigated. Requirements regarding quality control of production need to be
prescribed and the quick hardening properties of UHPC and the possibilities for a shortened total
construction time should be studied. Finally, the production cycle needs to be defined.
2.13.3 Optimization of the cross‐section
Optimization studies with respect to the cross‐section for different concrete strength classes need to
be performed. Normal strength concrete, high strength concrete, very high performance concrete
and ultra‐high performance concrete are different materials and their influence on the cross‐
sectional capacity need to be examined. All possible load cases and load combinations during launch
and lifetime should be interpreted in order to perform checks regarding the bending moment
capacity, shear force capacity and crack width criterion.
2.13.4 Prestressing in incremental bridge launching
The type and amount of prestressing for the launch and use phase must be determined. In order to
use UHPC effectively a huge amount of prestressing may be required. The fitting of a lot of anchors
inside a light UHPC cross‐section may cause problems and needs to be sorted out. Force introduction
must be checked, as well as the preconditions for possible re‐use of central prestressing.
2.13.5 An optimal span length
The lightweight nose has an optimal length that should be determined. The limiting factors for
maximum span length should be defined. The case study should be used to determine if the bridge
can be launched without auxiliary supports and which span length gives the lowest cost.
2.13.6 Alternative execution method
Finally, the bridge must be compared to the best alternatively executed bridge for that location to
determine whether we have an economical bridge design.

31
3 Designing with UHPFRC
This chapter discusses the differences in design calculations between regular reinforced concrete and
UHPFRC. Three design guidelines are compared on the stress‐strain relationships that they use for
the design. Finally, the cross‐sectional capacity of several types of beams, designed with different
types of concrete, is analyzed to identify the parameters that influence the bending moment and
shear capacity to start the optimization process.
Designing with UHPFRC differs from designing with NSC and HSC, due to differences in stress‐strain
diagrams. The stress‐strain relation in compression has a similar shape for UHPFRC (Figure 3.2) and
NSC/HSC (Figure 3.1), but the fibers cause a different stress‐strain relation in tension. NSC and HSC
have a small tensile capacity that will be neglected whenever the concrete has cracked and the
reinforcement is activated. However, the fibers in UHPFRC provide a tensile capacity that co‐operates
with (shear) reinforcement and prestressing.
Figure 3.1: bi‐linear stress‐strain relation for NSC and HSC in compression (NEN‐EN 1992‐1‐1).
Figure 3.2 shows two stress‐strain diagrams that have been developed by (Association Francaise de
Génie Civil, 2013) for UHPC design in the ultimate limit state. The left one illustrates strain hardening
behavior, while the right one illustrates strain softening behavior.

32
Figure 3.2: stress‐strain diagrams for UHPC ULS design (Association Francaise de Génie Civil, 2013).
Figure 3.3 shows a stress‐strain design curve for Ductal UHPC in compression and was obtained from
measurements taken in a standard compression test on a 70 mm diameter cylinder (Behloul, 1999).
The ascending part OA can be assumed to be linear up to the peak stress. The plateau AB represents
the ductility provided by the steel fibers. The shape of the plateau and the descending part depend
on the type and amount of fibers. For design purposes, (VSL Australia, 2000) has developed an
idealized stress‐strain relationship as shown in Figure 3.4.
When the concrete compressive strength of UHPC increases, the linear elastic part extends and the
length of the plastic phase decreases: 0.85 / . Similar behavior can be noticed
for NSC and HSC: .
Figure 3.3: typical stress‐strain relationship in compression (Behloul, 1999).

33
Figure 3.4: design stress‐strain relationship in compression (VSL Australia, 2000).
The behavior of Ductal UHPC in tension is illustrated in Figure 3.5. It was obtained from
measurements in a direct tensile test on a 70 mm diameter notched cylinder (Behloul, 1999). The
behavior after cracking highly depends on the type, amount and orientation of the steel fibers
bridging the cracks. An important observation that can be made from Figure 3.5 is, that the average
tensile stress on the cracked surface increases after first cracking before starting to decrease at a
crack width of 0.2 – 0.3 mm. This is typical strain hardening behavior. For design purposes,
(VSL Australia, 2000) has developed an idealized stress‐strain relationship in tension as shown in
Figure 3.6.
Figure 3.5: behavior in direct tension (Behloul, 1999).

34
Figure 3.6: design stress‐strain relationship in tension (VSL Australia, 2000).
The end of the plateau in the stress‐strain relationship for UHPC in tension is given by:
, 0.16 /1.2 0.004. This means that for longer fibers and for more slender cross‐sections
the length of the plateau will increase and thus the ductility of the member increases.
The ultimate tensile strain is given by: , /1.2 , which means that slender members having
longer fibers have the largest ultimate tensile strain.
Figure 3.7 shows an idealized stress‐strain design curve developed by (CAE Nederland B.V., 2011) for
UHPC design in the ultimate limit state. It is based on(Association Francaise de Génie Civil, 2013). To
simplify calculations and to incorporate safety, the hatched area is neglected and a design curve
similar to the (VSL Australia, 2000) one is obtained.
Figure 3.7: idealized stress‐strain diagram for ULS design (CAE Nederland B.V., 2011).

35
The (VSL Australia, 2000) design stress‐strain relationships will be used for the analysis of a design in
UHPFRC. They apply to structural members made of DUCTAL that have the following properties:
a characteristic compressive strength at 28 days in the range 150 – 220 MPa.
a minimum fiber content of 2% by volume, a fiber length of 13 mm, a diameter of 0.2 mm
and a minimum fiber tensile strength of 1800 MPa.
a saturated, surface‐dry density in the range 2400 – 2650 kg/m3.
a minimum characteristic strength at transfer of 100 MPa and a minimum modulus of
elasticity at transfer of 40000 MPa.
In the guidelines that have been addressed in this paragraph, different symbols are used for the
mechanical properties. Table 3.1 presents an overview.
VSL Australia AFGC/Setra 2002 NEN‐EN‐1992 CAE NL
characteristic compressive strength at 28 days ‐
characteristic tensile strength at first crack ; , ‐
design value tensile strength at first crack * / ‐
ultimate compressive strain * ‐
compressive strain at start plastic phase * ‐
modulus of elasticity ‐
tensile strain at first crack * ‐
limiting tensile strain in concrete , ‐ ‐ ‐
ultimate tensile strain , ‐
yield strain in prestressing steel ‐ / ‐
design value compressive strength 0.85 ‐
tensile strain at 0,3 mm crack width ‐ , ‐ ,
tensile strain at 1% crack width ‐ % ‐ %
tensile stress at 1% crack width ‐ % ‐ ‐
tensile stress at fully developed crack pattern ‐ ‐
crack width of 0,3 mm ‐ , ‐ ‐
crack width of 1% of sample height ‐ % ‐ ‐
characteristic length ‐ ‐ ‐
fiber length ‐ ‐
fiber orientation factor ‐ K ‐ k
Table 3.1: a list of the symbols used in the guidelines

36
In order to understand the behavior of UHPFRC in design calculations, the next paragraphs present
an analysis on the cross‐sectional capacity of the following types of beams:
Rectangular reinforced NSC/HSC beam;
Rectangular doubly reinforced NSC/HSC beam;
Rectangular doubly reinforced NSC/HSC beam + normal force;
Rectangular prestressed NSC/HSC beam;
Reinforced NSC/HSC box girder;
Prestressed NSC/HSC box girder;
Rectangular unreinforced UHPFRC beam;
Rectangular prestressed UHPFRC beam;
Unreinforced UHPFRC box girder;
Prestressed UHPFRC box girder.
3.1 Rectangular reinforced NSC/HSC beam
Figure 3.8: rectangular reinforced concrete beam
Figure 3.9 illustrates a typical moment‐strain diagram for the rectangular normal strength reinforced
concrete beam from Figure 3.8. In this case, the characteristic concrete compressive strength:
20 / . The point of cracking can be clearly distinguished at a concrete compressive strain
of approximately 0.35‰. The beam fails after the concrete compressive strain limit is reached:
, which is 3.5‰ for normal strength concrete.

37
Figure 3.9: moment‐strain diagram for a rectangular reinforced normal strength concrete beam
Figure 3.10 illustrates the moment‐curvature diagram of the same beam. The dots represent
consecutively the cracking moment, yield moment, plastic moment and ultimate moment.
Figure 3.10: moment‐curvature diagram for a rectangular reinforced normal strength concrete beam
Figure 3.11 illustrates the moment‐strain diagram for a rectangular reinforced high strength concrete
beam. In this case, the characteristic concrete compressive strength: 90 / . For high
strength concrete, the concrete compressive strain limit is lower than for normal strength concrete:
2.6‰.
0
20
40
60
80
100
120
140
160
180
200
0
0,2
0,4
0,6
0,8 1
1,2
1,4
1,6
1,75
1,9
2,1
2,3
2,5
2,7
2,9
3,1
3,3
3,5
M [Nmm]
*10^6
εc [‰]
1,3
8,2
10,7 32,0
0
20
40
60
80
100
120
140
160
180
200
0 5 10 15 20 25 30 35
M [Nmm]
*10^6
κ [1/mm*10^6]

38
Figure 3.11: moment‐strain diagram for a rectangular reinforced high strength concrete beam
For a rectangular reinforced concrete beam, which is loaded in pure bending, an increase in concrete
compressive strength from 20 / to 90 / will only lead to a small increase in
bending moment resistance. Appendix 11.1 and appendix 11.2 show an increase by a factor of:
1.91 · 10 /1.78 · 10 1.07. The shear capacity and moment capacity in SLS will increase a lot
more: 6.64 · 10 /4.50 · 10 1.48 and 1.38 · 10 /9.75 · 10 1.41 respectively.
For regular reinforced concrete the shear capacity consists of a concrete part and a shear
reinforcement part , . When the shear resistance of the concrete part is exceeded, the shear
reinforcement must sustain the entire shear force and the contribution of the concrete part must be
ignored. The shear force is limited by crushing of the concrete compression struts: , . The
increase in concrete compressive causes an increase in shear capacity by improving the strength of
these concrete compression struts
A beam with a concrete compressive strength of 90 / can hold much more reinforcement
than the same beam with a concrete compressive strength of 20 / . Appendix 11.3 shows that
an increase in bending moment resistance by a factor of 6,96 · 10 /1,78 · 10 3.91 is possible. So
using high strength concrete instead of normal strength concrete will only be beneficial if the cross‐
section is heavily reinforced. However, there is a limit; the maximal number of reinforcing bars is
restricted by the bar spacing.
0
50
100
150
200
250
M [Nmm]
*10^6
εc [‰]

39
3.2 Rectangular doubly reinforced NSC/HSC beam
Figure 3.12: rectangular doubly reinforced concrete beam
Appendix 11.4 demonstrates that adding a top layer of reinforcement (Figure 3.12) to the concrete
beam from paragraph 3.1, which only has bottom reinforcement and is loaded in pure bending,
hardly affects the bending moment capacity. The same holds for the shear capacity and moment
capacity in SLS.
3.3 Rectangular doubly reinforced NSC/HSC beam + normal force
Figure 3.13: rectangular doubly reinforced concrete beam + normal force
Compared to the beam from paragraph 3.2, which is loaded in pure bending only, a beam subject to
a bending moment and a compressive force , as shown in Figure 3.13, will have an increased
ultimate bending moment capacity. Because of the large compressive force, the plastic moment will
often be reached before the yield moment. Appendix 11.6 shows an improvement in bending
moment capacity of: 3.28 · 10 /1.81 · 10 1.81. The shear capacity only increases by a factor of:
4.87 · 10 /4.68 · 10 1.04.
The moment‐strain diagram can be seen in Figure 3.14. The first part of the graph has negative and
incorrect values, probably caused by the fact, that the cross‐section is fully compressed and does not
have a compressive and tensile region on which the calculation in the uncracked phase was based.

40
Figure 3.14: moment‐strain diagram for a rectangular doubly reinforced normal strength concrete beam + normal force
The M‐N‐κ‐diagram of the beam can be seen in Figure 3.15. The consecutive points in the graph
represent the cracking moment, plastic moment, yield moment of the top reinforcement, yield
moment of the bottom reinforcement and the ultimate bending moment.
Figure 3.15: moment‐normal force‐curvature diagram for a rectangular doubly reinforced normal strength concrete beam
‐150
‐100
‐50
0
50
100
150
200
250
300
350
0
0,2
0,4
0,6
0,8 1
1,2
1,4
1,6
1,75
1,9
2,1
2,3
2,5
2,7
2,9
3,1
3,3
3,5
M [Nmm]
*10^6
εc [‰]
3,2
5,5
10,211,6 14,0
0
50
100
150
200
250
300
350
0 5 10 15
M [Nmm]
*10^6
κ [1/mm*10^6]

41
3.4 Rectangular prestressed NSC/HSC beam
Figure 3.16: rectangular prestressed concrete beam
Appendix 11.7 illustrates, that by using three Ø16 Y1860S7 prestressing strands instead of three Ø16
B500 reinforcement bars in the rectangular normal strength concrete beam from Figure 3.16, the
bending moment capacity increases with a factor: 1.99 · 10 /1.11 · 10 1.79. However, the shear
capacity hardly increases: 4.98 · 10 /4.68 · 10 1.06.
If the concrete compressive strength is increased from 20 to 90 / , three strands will not
suffice anymore; the strain in the prestressing steel exceeds the ultimate strain and the
full capacity of the concrete cannot be used (Appendix 11.8). High strength concrete can hold much
more prestressing than normal strength concrete. However, there are limits with respect to strand
spacing and concrete cracking at 0 when the beam is only subjected to its self‐weight. When the
prestressing force is too high cracking might occur at the top of the beam.
3.5 Reinforced NSC/HSC box girder
Figure 3.17: reinforced concrete single cell box girder

42
Box girders have, for the same amount of concrete, an increased moment of inertia and moment of
resistance compared to rectangular cross‐sections. Based on dimensions from (van der Veen, 2014)
and (van der Meulen, 1991), a reinforced normal strength concrete single cell box girder, as shown in
Figure 3.17, has been designed in Appendix 11.9.
The results show, that the ultimate bending moment capacity is reached, when the steel strain is:
4,06 · 10 . This cannot occur, because 2,25 · 10 . Thus the steel reinforcement fails
before and the concrete is not being used to its full potential. A solution is to apply more
steel reinforcement bars. However, the bar spacing is limited to make sure that the concrete can
easily flow through the bars, gets fully distributed and no weak spots will form. To economically use
higher strength concretes to save weight, prestressing steel should be applied.
3.6 Prestressed NSC/HSC box girder
Figure 3.18: prestressed concrete single cell box girder
Based on dimensions from (van der Meulen, 1991) and (van der Veen, 2014), a prestressed normal
strength concrete single cell box girder as shown in Figure 3.18 has been designed in Appendix 11.20.
The analysis demonstrates that in order to fully use the concrete compressive strength ,
six tendons with 55 strands should be present in the concrete cross‐section . These
anchors need a clearance of 580 mm (Figure 3.20) and thus will never fit in the 150 mm thick bottom
floor. They need to be anchored in haunches. The ducts have a diameter of 167 mm and will also not
fit in the floor (Figure 3.19). A solution to this problem could be to apply the tendons externally.

43
To minimize the amount of prestressing that is required, the concrete cross‐section must be reduced,
for example by decreasing the deck thickness. However, one should pay attention to the possibility of
punching shear failure due to axle loads. Tendons containing fewer strands may be a possibility if
they can be installed in couples to satisfy the anchor spacing condition.
Figure 3.19: dimensions of corrugated duct (Dywidag‐Systems International, 2015)
Figure 3.20: details of the anchorage zone (Dywidag‐Systems International, 2015)

44
3.7 Rectangular unreinforced UHPFRC beam
Figure 3.21: rectangular unreinforced UHPFRC beam
For NSC, the ultimate bending moment resistance is reached when the concrete compressive strain
at the end of the moment‐strain diagram, as can be seen in Figure 3.9. For unreinforced
UHPFRC, the ultimate bending moment resistance is reached just after , , which is not at the
end of the graph. Figure 3.6 & Figure 3.22 illustrate, that the beam can undergo further deformation
until , .
Figure 3.22: moment‐strain diagram for a rectangular unreinforced UHPFRC beam
Unreinforced UHPC, which is loaded in pure bending, is not used efficiently. Appendix 11.11 shows
that only a slight amount of concrete 1.65 · 10 /2.00 · 10 0.825 17.5% can be saved to
reach a moment capacity similar to the reinforced NSC beam from paragraph 3.1.
0
20
40
60
80
100
120
140
160
180
200
M [Nmm]
*10^6
ε [‐]

45
The cross‐sectional analysis in Appendix 11.11 also shows that an unreinforced UHPC beam, loaded
in pure bending, fails in tension ( , ) long before the maximum compressive strain at the top of
the beam is reached ( , ). To make use of the strength of the material UHPC, which is the high
compressive strength, a large compressive force should be introduced onto the cross‐section.
3.8 Rectangular prestressed UHPFRC beam
Figure 3.23: rectangular prestressed UHPFRC beam
The cross‐sectional analysis of the rectangular prestressed UHPFRC beam from Figure 3.23 can be
found in Appendix 11.12. Figure 3.24 shows that for a small amount of prestressing steel the top of
the moment‐strain diagram can be found just after , . Then the curve descends until the
prestressing steel reaches its maximal strain, when and fails. The concrete has a lot of
capacity left , and is not used efficiently.
Figure 3.24: moment‐strain diagram for a rectangular UHPFRC beam with little prestressing
0
20
40
60
80
100
120
140
160
180
0 0,2 0,4 0,6 0,8 1 1,2 1,4 1,6 1,8 2
M [Nmm]
*10^6
ε0 [‰]

46
In order to use the full capacity of the concrete a huge amount of prestressing steel is required.
Appendix 11.13 presents the cross‐sectional analysis of a heavily prestressed UHPFRC beam. As
opposed to the moment‐strain diagram from Figure 3.24, Figure 3.25 shows that after a small bump
in the curve just after , , the curve continues to rise until .
The analysis also shows that eight strands are required to use the full capacity of the concrete.
However, these eight strands will not fit next to each other in the cross‐section and need to be
bundled to fulfill the strand spacing criterion.
Figure 3.25: moment‐strain diagram for a rectangular heavily prestressed UHPFRC beam
For UHPFRC the shear capacity consists of three parts. Just like for conventional concrete there is
the contribution of the concrete and the shear reinforcement . Additionally, there is the
participation of the fibers . The contribution of all three components to the total shear capacity is
presented in Appendix 11.12. It can be seen, that the fibers have a substantial contribution to the
total shear capacity: 4.20 · 10 /8.63 · 10 · 100 49%.
0
50
100
150
200
250
300
350
400
450
500
0 0,3 0,6 0,9 1,2 1,5 1,8 2,1 2,4 2,7 3 3,3 3,6 3,9
M [Nmm]
*10^6
ε0 [‰]

47
3.9 Unreinforced UHPFRC box girder
Figure 3.26: unreinforced UHPFRC single cell box girder
Based on dimensions from (van der Meulen, 1991) and (van der Veen, 2014), an unreinforced
UHPFRC single cell box girder (Figure 3.26) has been designed with dimensions and properties that
can be found in Appendix 11.14.
Figure 3.27 shows the moment‐strain diagram of the unreinforced UHPFRC box girder. The maximum
can be found just after: , 0.000125 (Appendix 11.14). The box girder fails in tension
, 0.000209 long before the concrete reaches the plastic phase, when
0.00255 or even fails at , 0.004. This confirms the fact, that UHPFRC must
be prestressed heavily in order to have an efficient use.
Figure 3.27: moment‐strain diagram for an unreinforced UHPFRC single cell box girder
0
5000
10000
15000
20000
25000
M [Nmm]
*10^6
ε [‐]

48
3.10 Prestressed UHPFRC box girder
Figure 3.28: prestressed UHPFRC single cell box girder
Based on dimensions from (van der Meulen, 1991) and (van der Veen, 2014), a prestressed UHPFRC
single cell box girder (Figure 3.28) has been designed with dimensions and properties that can be
found in Appendix 11.15.
Figure 3.29 shows the moment‐strain diagram for a UHPFRC box girder with little prestressing. The
top of the graph is reached just after , Appendix 11.15. After this point, the graph descends
and again rises until the prestressing steel reaches its maximal strain, when and fails. The
shape of the moment‐strain diagram shows similarities to the moment‐strain diagram of a
rectangular prestressed UHPFRC beam (Figure 3.24).
Figure 3.29: moment‐strain diagram for a UHPFRC box girder with little prestressing
0
10000
20000
30000
40000
50000
60000
70000
0 0,1 0,2 0,3 0,4 0,5 0,6 0,7 0,8 0,9 1 1,1
M [Nmm]
*10^6
ε0 [‰]

49
When the cross‐section is subject to much more prestressing (Appendix 11.16), the moment‐strain
behavior (Figure 3.30) changes and shows parallelism to (Figure 3.25) where the first extreme just
after , disappears and the top is found at the end of the graph, when .
Figure 3.30: moment‐strain diagram for a heavily prestressed UHPFRC box girder
0
50000
100000
150000
200000
250000
300000
350000
400000
0 0,1 0,2 0,3 0,4 0,5 0,6 0,7 0,8 0,9 1 1,1 1,2 1,3 1,4 1,5
M [Nmm]
*10^6
ε0 [‰]

50
In the literature review (Oostra, 2014), it was found that the moment of resistance above the neutral
axis needed to be twice the moment of resistance below the neutral axis for a favorable box girder
cross‐section for incremental bridge launching. As a first step in optimization of the cross‐section, the
influence of varying the cross‐sectional dimensions on the bending moment capacity, shear capacity
and the ratio of moment of resistance above and below the neutral axis will be studied. As a start,
we take the dimensions from Appendix 11.15.
3.10.1 Varying the deck depth
By reducing the box girder deck depth, huge savings in the amount of concrete can be made – the
steepest line in Figure 3.31 represents the effect of changing the deck depth – and the W0/Wb‐ratio
decreases fast (Figure 3.32). The effect on the ultimate bending moment capacity is small compared
to changing the box girder height (Figure 3.33) and the effect on the shear capacity is negligible
(Figure 3.34).
3.10.2 Varying the web width
By reducing the box girder web width, substantial savings in the amount of concrete can be made
(Figure 3.31) and the W0/Wb‐ratio has a moderate increase (Figure 3.32). The effect on the ultimate
bending moment capacity is small (Figure 3.33), but the effect on the shear capacity is huge
(Figure 3.34).
3.10.3 Varying the floor depth
Reducing the box girder floor depth has the smallest effect on the concrete cross‐sectional area
(Figure 3.31) and the W0/Wb‐ratio increases fast (Figure 3.32). The effect on the ultimate bending
moment capacity is small (Figure 3.33) and the effect on the shear capacity is negligible (Figure 3.34).
3.10.4 Varying the box girder height
By reducing the box girder height, substantial savings in the amount of concrete can be made (Figure
3.31) and the W0/Wb‐ratio has a moderate increase (Figure 3.32). The effect on the ultimate bending
moment capacity is huge (Figure 3.33), so is the effect on the shear capacity (Figure 3.34).

51
Figure 3.31: size of box girder components vs. cross‐sectional area
Figure 3.32: size of box girder components vs. moment of resistance ratio
5
5,5
6
6,5
7
7,5
8
8,5
‐50 0 50
Cross‐sectional area Ac [m^2]
[%]
Box girder cross‐sectional area
Deck depth
Web width
Floor depth
Box girder height
1,2
1,4
1,6
1,8
2
2,2
2,4
‐50 0 50
W0/Wb [‐]
[%]
W0/Wb
Deck depth
Web width
Floor depth
Box girder height

52
Figure 3.33: size of box girder components vs. ultimate bending moment capacity
Figure 3.34: size of box girder components vs. ultimate shear force capacity
0
10000
20000
30000
40000
50000
60000
70000
‐50 0 50
Bending moment Mu
[kNm]
[%]
Ultimate bending moment capacity
Deck depth
Web width
Floor depth
Box girder height
0
10000
20000
30000
40000
50000
60000
‐50 0 50
Shear force Vu [kN]
[%]
Ultimate shear force capacity
Deck depth
Web width
Floor depth
Box girder height
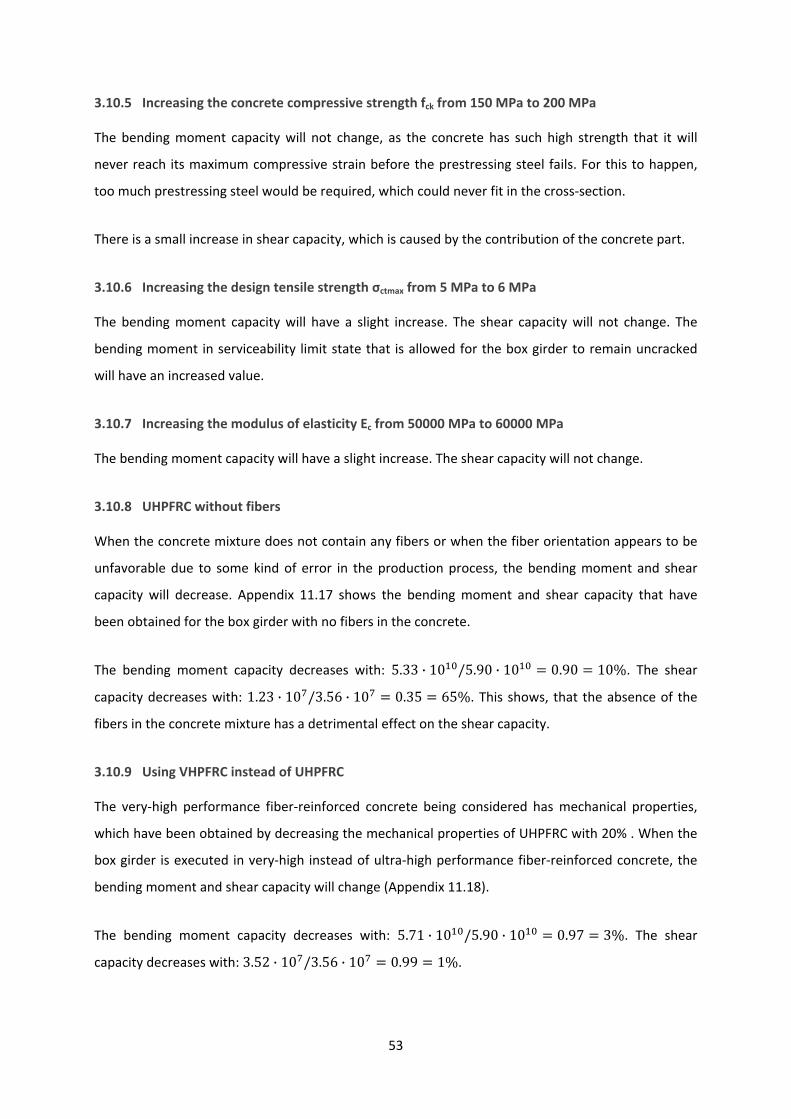
53
3.10.5 Increasing the concrete compressive strength fck from 150 MPa to 200 MPa
The bending moment capacity will not change, as the concrete has such high strength that it will
never reach its maximum compressive strain before the prestressing steel fails. For this to happen,
too much prestressing steel would be required, which could never fit in the cross‐section.
There is a small increase in shear capacity, which is caused by the contribution of the concrete part.
3.10.6 Increasing the design tensile strength σctmax from 5 MPa to 6 MPa
The bending moment capacity will have a slight increase. The shear capacity will not change. The
bending moment in serviceability limit state that is allowed for the box girder to remain uncracked
will have an increased value.
3.10.7 Increasing the modulus of elasticity Ec from 50000 MPa to 60000 MPa
The bending moment capacity will have a slight increase. The shear capacity will not change.
3.10.8 UHPFRC without fibers
When the concrete mixture does not contain any fibers or when the fiber orientation appears to be
unfavorable due to some kind of error in the production process, the bending moment and shear
capacity will decrease. Appendix 11.17 shows the bending moment and shear capacity that have
been obtained for the box girder with no fibers in the concrete.
The bending moment capacity decreases with: 5.33 · 10 /5.90 · 10 0.90 10%. The shear
capacity decreases with: 1.23 · 10 /3.56 · 10 0.35 65%. This shows, that the absence of the
fibers in the concrete mixture has a detrimental effect on the shear capacity.
3.10.9 Using VHPFRC instead of UHPFRC
The very‐high performance fiber‐reinforced concrete being considered has mechanical properties,
which have been obtained by decreasing the mechanical properties of UHPFRC with 20% . When the
box girder is executed in very‐high instead of ultra‐high performance fiber‐reinforced concrete, the
bending moment and shear capacity will change (Appendix 11.18).
The bending moment capacity decreases with: 5.71 · 10 /5.90 · 10 0.97 3%. The shear
capacity decreases with: 3.52 · 10 /3.56 · 10 0.99 1%.
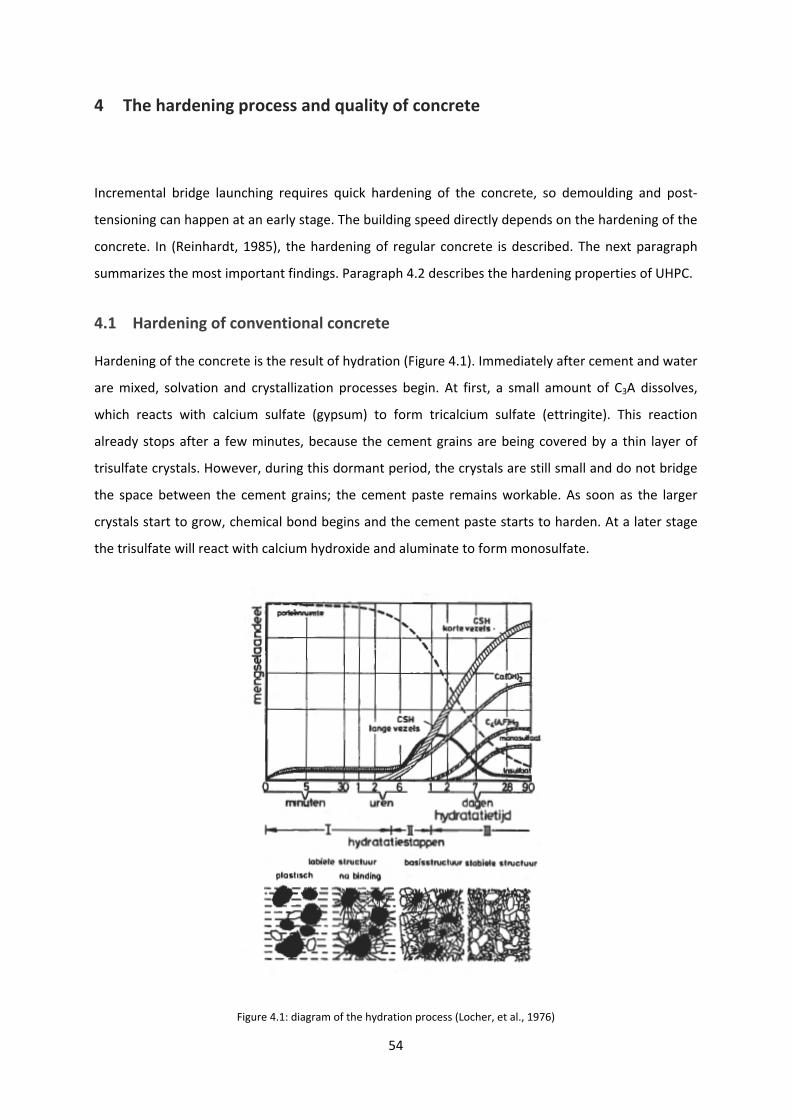
54
4 The hardening process and quality of concrete
Incremental bridge launching requires quick hardening of the concrete, so demoulding and post‐
tensioning can happen at an early stage. The building speed directly depends on the hardening of the
concrete. In (Reinhardt, 1985), the hardening of regular concrete is described. The next paragraph
summarizes the most important findings. Paragraph 4.2 describes the hardening properties of UHPC.
4.1 Hardening of conventional concrete
Hardening of the concrete is the result of hydration (Figure 4.1). Immediately after cement and water
are mixed, solvation and crystallization processes begin. At first, a small amount of C3A dissolves,
which reacts with calcium sulfate (gypsum) to form tricalcium sulfate (ettringite). This reaction
already stops after a few minutes, because the cement grains are being covered by a thin layer of
trisulfate crystals. However, during this dormant period, the crystals are still small and do not bridge
the space between the cement grains; the cement paste remains workable. As soon as the larger
crystals start to grow, chemical bond begins and the cement paste starts to harden. At a later stage
the trisulfate will react with calcium hydroxide and aluminate to form monosulfate.
Figure 4.1: diagram of the hydration process (Locher, et al., 1976)

55
In the first minutes calcium hydroxide is formed as well. Without gypsum, the cement and water
mixture would stiffen instantly. The reason is the formation of tetracalcium aluminate hydrate, which
connects the cement grains and prevents them from being mobile. The right composition of C3A and
gypsum defines the bonding properties and workability of the cement.
Concrete hardening starts when C3S dissolves and forms calcium silicate hydrate. C2S forms calcium
silicate hydrate as well, but at a later stage and in a more fine distribution. Calcium silicate hydrate is
responsible for the concrete strength.
The amount and composition of cement are responsible for the speed of hardening. The amount of
cement in a concrete mixture can be defined by the water‐cement ratio. Higher strength concretes
have a lower water‐cement ratio than normal strength concretes and will thus harden more quickly.
Cement contains the following four important clinker compounds:
1. Tricalcium silicate (C3S);
2. Dicalcium silicate (C2S);
3. Tricalcium aluminate (C3A);
4. Tetracalcium aluminate ferrite (C4AF).
The clinker has hydraulic properties. Being hydraulic means, the matter can react with water, has the
ability to harden under water and does not dissolve in water after it has hardened. The compressive
strength development of the individual clinker compounds has been plotted in Figure 4.2. The quick
chemical reaction of C3S: 2(3CaO.SiO2) with the corresponding strength development and the much
slower strength development of C2S: 2(2CaO.SiO2) can clearly be seen. A high C3S content practically
means quick hardening of the concrete.
The speed of reaction depends on the reachability of the water. A surface reaction happens at a fast
rate. However, as soon as the water needs to penetrate through the thin layer of ettringite, deeper
into the cement grains, the reaction will slow down. Such movement is called diffusion.
The speed of reaction is positively influenced when the particle size of the cement is reduced, as the
surface – the first reaction in the hydration process is a surface reaction – is increased.
Hydration rate increases for higher temperatures, so concrete in a warm environment will develop its
strength more quickly than concrete in a cold environment.

56
High pressures during hydration will increase the hydration rate. A high pressure will squeeze the
water molecules into the cement gel and the unhydrated cement and will therefore favor diffusion
and hydration.
Finally, accelerators can be added to the concrete mixture to speed up the hydration process. The
most frequently used accelerator is calcium chloride, which accelerates the chemical bond and
hardening process. However, the chloride will only be partly chemically bonded. The remaining
chloride may contribute to corrosion of reinforcing or prestressing steel.
Figure 4.2: comparison of compressive strengths of cement compounds (in pounds per square inch)(Bogue & Lerch, 1934)
The final strength for concrete that undergoes quick hardening is lower, because the composition of
the concrete is less structured and more porous when the hydration rate is high.
A slow hydration rate benefits the concrete quality, because the corresponding heat development is
reduced and the concrete can cool down without cracking. Cooling, shrinkage and the ability of the
young concrete to deform under tension, together determine the concrete cracking.

57
4.2 Hardening of ultra‐high performance concrete
Ultra‐high performance concrete has a very low water‐cement ratio and degree of hydration. The
degree of hydration is a measure for the amount of cement that has hydrated during the hardening
process. This means, that a lot of cement stays unhydrated. The unhydrated cement will act as filler
for the capillary pores, which appear during the hardening of the concrete, to improve the packing
density and microstructure of the concrete.
Besides the unhydrated cement that acts as filler, silica fume can be added to the concrete mixture.
Silica fume are ultra‐fine particles that improve the tightness and strength of the concrete. They
react with calcium hydroxide to form additional calcium silicate hydrates.
In (Burge, 1982), it was demonstrated that silica fume contributes to an early strength development.
Just after one day, it is possible to reach a concrete compressive strength over 100 MPa (Figure 4.3).
Figure 4.3: compressive strength plotted against water‐cement factor for concrete with silica fume (Burge, 1982)
In (Association Francaise de Génie Civil, 2013), the effects of heat treatment are explained. Two types
of heat treatment can be distinguished:
1. The first type must be carried out during the first couple of hours of the hydration process to
speed up concrete hardening. A moderate temperature 65 is required to avoid any
risk of delayed ettringite formation.
2. The second type can be carried out when the concrete has set. The goal is to further develop
the concrete strength and to reduce any delayed time‐dependent deformations. The
temperature will be raised up to 90 .

58
The main effects of heat treatment are:
an accelerated maturity;
a total shrinkage equal to zero;
significantly reduced creep: the creep coefficient is 0.2 instead of 0.8;
an improved durability due to a reduced porosity.
It can be said, that the quick hardening of ultra‐high performance concrete leads to a porous
microstructure. However, due to the presence of a lot of unhydrated cement and additives like silica
fume, a dense microstructure may be obtained. Heat treatment can be carried out to reduce time‐
dependent deformations and to improve durability.

59
5 Building with ultra‐high performance fiber‐reinforced concrete
This chapter presents two UHPC manufacturers that offer premix kits ready to be batched on‐site, a
typical mixture composition and the preconditions for on‐site production and application of the
material.
5.1 Ultra‐high performance concrete manufacturers
Quantz is an ultra‐high performance fiber‐reinforced concrete technology that has been developed
by G.tecz engineering. Material parameters can be adapted regarding the designers requirements
(Figure 5.1). After development, the technology will be transferred to the consumer and production
can immediately start. In (G.tecz Engineering, 2015), Quantz is claimed to be three to four times
cheaper than regular ultra‐high performance concretes.
Figure 5.1: mechanical properties of Quantz (G.tecz Engineering, 2015)
Ductal is an ultra‐high performance fiber‐reinforced concrete that has been developed by Lafarge
and Bouygues. Ductal elements can be precast in a plant and shipped to the site location or, in some
cases, may be poured on‐site (Lafarge and Bouygues, 2015). When there is need to build with
minimal interruption to the public, Ductal provides a solution for accelerated bridge construction.
Ductal is sold as a kit including the premix powder, fibers and admixtures.

60
5.2 Mixture composition
The ultra‐high performance fiber‐reinforced concrete mixture differs from conventional concrete
mixtures. Figure 5.2 illustrates a typical composition of Ductal. The meaning of the water‐cement
ratio and the function of silica fume and steel fibers have been addressed in chapter 4 and the
literature review (Oostra, 2014).
Figure 5.2: typical composition of Ductal (VSL Australia, 2000)
In ultra‐high performance concrete, the aggregate forms the weakest link, as the cement paste has
such high strength. Unlike conventional concrete, cracking will develop through the aggregate grains
and not at the interface between cement paste and aggregate. High‐strength aggregates, like
crushed quartz, are required to prevent loss of concrete strength.
Figure 5.3: comparing Quantz to regular, high performance and ultra‐high performance concrete (G.tecz Engineering, 2015)

61
Figure 5.3 shows some remarkable properties of Quantz. Unlike other ultra‐high performance
concretes, Quantz has medium cement content, contains little silica fume, has a moderate water‐
cement ratio and remains supremely workable.
5.3 Preconditions and equipment for on‐site production and application of UHPC
In (Association Francaise de Génie Civil, 2013) an overall design approach for ultra‐high performance
concrete is presented. The concrete must satisfy this procedure’s conditions to qualify for application
in the incrementally launched bridge.
At the very beginning of the project design stage, the constitutive laws and characteristics of the
required material must be known. Assuming the concrete mixture that has been batched in the
factory has attained the characteristics required by the designer, it should pass full‐scale tests in
order to qualify for the proposed application. A mockup of the actual structure, under the same
conditions of on‐site placement, must be produced to validate constitutive laws and characteristics
of the concrete. To determine the K‐factor, which takes the disparity in fiber orientation into
account, samples must be taken from the mockup along the directions of principal stresses.
Tolerances for premix need to be defined and checked with the manufacturer’s quality sheet, which
must come with each delivery. The contractually bound mix design is defined by the overall quantity
of premix, admixtures, water and fibers. The batch plant must be sufficiently accurate to meet a
tolerance of at least 2% for all mixture components. If the premix manufacturer can guarantee a
tolerance of 1%, the batch plant must be able to have that accuracy as well.
A mobile concrete batch plant is required that can be installed on the construction site. The
quantities of water as well as the regularities of the mixtures components that go into the batch
plant must be carefully monitored. Routine checks must be performed on the mix design after
production.
The time between batching of the ultra‐high performance concrete and completion of placement
must be consistent. It is strictly prohibited to add water or admixtures, after the concrete has been
batched.
Drop heights exceeding half a meter should be avoided concerning segregation of fibers from the
cement paste and formation of fiber clusters. Besides that, concrete should be poured without
interruption to guarantee fiber continuity.

62
In cold weather, special arrangements should be made to guarantee the strength development of the
concrete, such as heating of the aggregate and water, insulation and hardening accelerators. Three
follow‐up specimens must be taken during concrete pouring. Their maturity must be monitored.
Demoulding cannot happen until the strength development is sufficient. When the outdoor
temperature exceeds 35 , the same precautions as for conventional concrete must be taken to
prevent high temperatures inside thick elements.
Since ultra‐high performance concrete has little or no bleeding, special attention should be paid to
the curing. When evaporation occurs at a faster rate than bleeding, the concrete surface will dry and
capillary stresses arise. The concrete wants to shrink, but is held in place by the mould, resulting in
tensile stresses and cracking. Curing must be carried out carefully in order to prevent the concrete
from drying out before it has set.
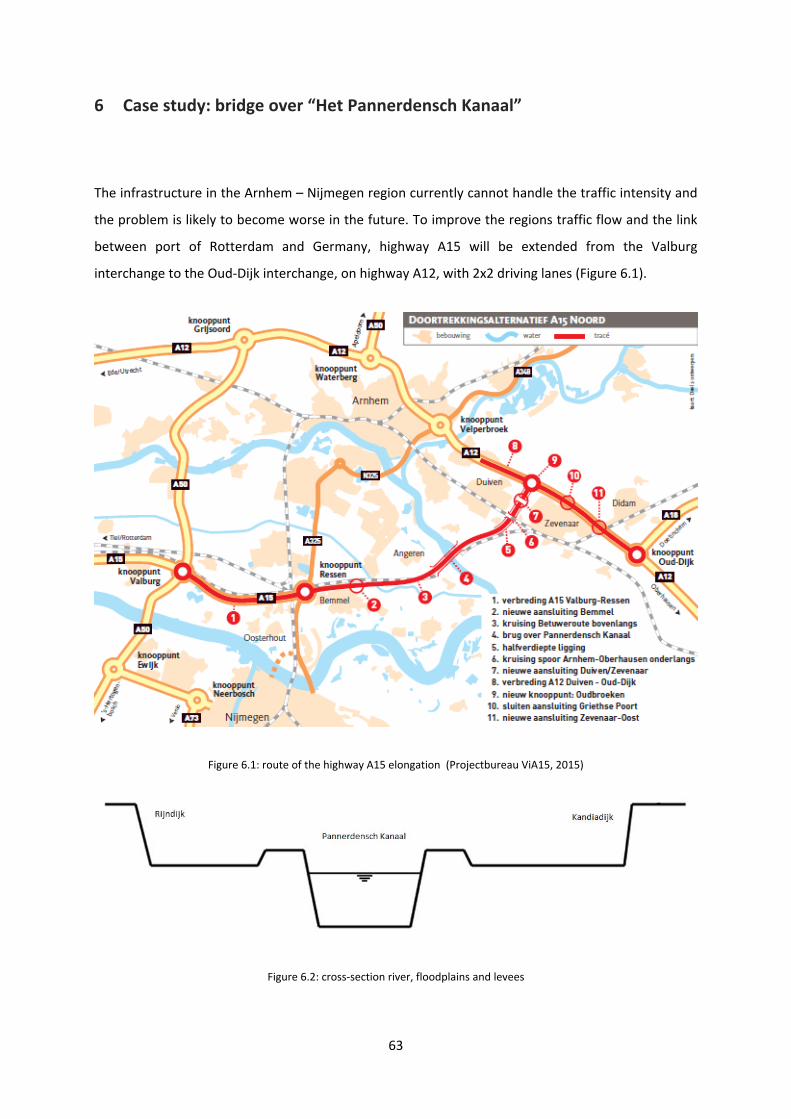
63
6 Case study: bridge over “Het Pannerdensch Kanaal”
The infrastructure in the Arnhem – Nijmegen region currently cannot handle the traffic intensity and
the problem is likely to become worse in the future. To improve the regions traffic flow and the link
between port of Rotterdam and Germany, highway A15 will be extended from the Valburg
interchange to the Oud‐Dijk interchange, on highway A12, with 2x2 driving lanes (Figure 6.1).
Figure 6.1: route of the highway A15 elongation (Projectbureau ViA15, 2015)
Figure 6.2: cross‐section river, floodplains and levees

64
Part of the route is a bridge that crosses “het Pannerdensch Kanaal”. The channel is positioned
between the Rijndijk in the west and the Kandiadijk in the east (Figure 6.2). The approach bridges
span the channels floodplains and connect the main span with the infrastructure on the protected
lowland. Because of the repetitive flooding of the floodplains and poor ground conditions, the
approach bridges cannot be constructed on stationary or movable scaffolding on rollers, so that
incremental bridge launching may be a good solution.
Figure 6.3: preliminary draft of the eastern approach bridge (Rijkswaterstaat, 2013)
Other optional construction techniques are the span‐by‐span casting method with an assembly truss
and construction with precast beams. The assembly truss can be placed beneath the superstructure
when the construction clearance provides enough space for the formwork. The bridge piers need to
be adapted to be able to launch. The assembly truss can also be placed above the superstructure.
However, a major disadvantage is that the formwork requires termporary suspension rods passing
through the superstructure. The span‐by‐span casting method with an assembly truss requires a high

65
capital investment, which must often be recovered in one or only a couple of structures. Both span‐
by‐span casting and construction with precast beams are limited by their maximal span length of
around 60 meters. In general, incremental bridge launching enables longer spans and requires fewer
bridge piers.
The preliminary draft of the eastern approach bridge seems to meet the preconditions for use of
incremental bridge launching (Figure 6.3). Over a length of more than 550 meters the approach
bridge has a constant horizontal and vertical curvature.
6.1 Functional requirements
The approach bridge must be designed for a working life of 100 years.
The approach bridge can be classified in consequence class CC3. In the launch phase, the
approach bridge may temporarily be classified in consequence class CC1.
The approach bridge is part of a highway and must therefore be able to carry Load Model 1.
The approach bridge must accommodate 2x2 driving lanes, two hard shoulders, two hard
strips, two verges, a central reserve, safety barriers, a side path designated for pedestrians
and cyclists and parapets.
The approach bridge must connect the main span with the new highway that begins at the
eastern abutment near Zevenaar.
6.2 Geometrical requirements
The approach bridge has a total length of 550 meters (Rijkswaterstaat, 2013).
According to (Rijkswaterstaat, 2011) a high water clearance of 9.1 meters is required for “Het
Pannerdensch Kanaal”.
The traffic clearance at a levee (Kandiadijk) must be at least 4.2 meters.
At the floodplains, the bottom of the box girder floor must always exceed high water level .
The cross‐section must be uniform.
All intermediate spans must be equal in length. End spans must have 80% of that length.
Joints cannot be positioned above a support or at mid‐span.
The approach bridge has a radius of curvature of 4,000 meters in its horizontal plane.
The approach bridge has a constant elevation of 1.386% in its vertical alignment.
The deck must be sufficiently thick to prevent punching shear failure caused by axle loads.
The deck, webs and floor must provide enough space for reinforcement and ducts when
internal prestressing will be used. Continuity prestressing is anchored in haunches.

66
The floor must be sufficiently thick to prevent punching shear failure when the cross‐section
slides over a support.
The maximum deflection with respect to the characteristic value of traffic loading:
/300 for 10 meters (Rijkswaterstaat, 2013).
6.3 Physical requirements
The approach bridge must be built with reinforced or prestressed concrete.
The volumetric mass density of reinforced or prestressed NSC/HSC is 25 kN/m3
The volumetric mass density of prestressed UHPFRC is 26 kN/m3.
6.4 Boundary conditions
The approach bridge will be launched from the eastern (lower) abutment near Zevenaar,
which makes a braking system unnecessary. The abutment and embankment will not be
considered in the design.
The superstructure is supported by bridge piers that will not be considered in the design.
The number of bridge piers is still to be determined. For the preliminary design, the bridge
piers are positioned according to (Rijkswaterstaat, 2013).
All segments should exactly fit into the span to achieve high repetition in lay‐out of
reinforcement and cable alignment.
In relation with seep or piping, bridge piers are not permitted within four meters of a levee .
The approach bridge should be constructed without auxiliary supports.
Continuity prestressing must be anchored at zero bending moment points at approximately
one fifth of the span length.
6.5 Design assumptions
The approach bridge will be built up out of two single‐cell concrete box girders that will
operate independent of each other. Between both box girders, a one meter interspace will
be present that will be bridged by grids.
A single box girder will be considered in the design.
All bridge piers will support both box girders. The bearings are positioned directly beneath
the webs to avoid bending moments caused by eccentric reactions.
The protected lowland provides sufficient space and load bearing capacity to erect a
fabrication yard.

67
Aesthetics will not be considered in the design.
Cross‐beams may be required above the supports to ensure (torsion) stability.
The superstructure can be classified in structural class S4, assuming the concrete strength to
be ≥ C45/55 and a special quality control that can be ensured by the factory‐like conditions.
The superstructure can be classified in exposure classes XC4, XD3 and XF4.
Longitudinal and shear reinforcement will be fabricated from B500 steel.
Y1860S7 prestressing strands will be used in the design.
Only load model 1 will be considered in the design.
Loads and load combinations will be determined with (NEN‐EN 1991).
Central prestressing can be re‐used as continuity prestressing.
The batch plant on‐site is sufficiently accurate to guarantee the required quality for UHPC.

68
7 Box girder dimensions for preliminary design
Before we can start with the design and optimization process we need to define the box girder shape
and dimensions.
7.1 The shape of the box girder
The shape of the box girder will be based on a study by (van der Meulen, 1991). He investigated the
optimal box girder cross‐section for different span lengths and execution methods.
7.1.1 Inclined webs versus straight webs
Inclined webs reduce the span of the box girder floor, so it may be designed more slender. Bridge
piers may become less wide and inclined webs work aesthetically pleasing. The force distribution for
a box girder with inclined webs differs from a box girder with straight webs. Self weight causes a
compressive stress in the floor and a tensile stress in the deck (Figure 7.1). Prestressing cables in the
webs that have a parabolic lay‐out cause a tensile stress in the floor.
Figure 7.1: box girder with inclined webs (Leonhardt, 1979)
For conventional reinforced concrete box girders inclined webs may cause difficulties with respect to
pouring and vibrating the concrete and installation of reinforcement. Straight webs may simplify
execution. An ultra‐high performance fiber‐reinforced concrete box girder that does not have
longitudinal reinforcement does not have these problems. However, the fiber orientation for inclined
and straight webs may deviate, as fibers tend to align in the direction of flow and fibers close to
formwork walls are naturally aligned to them.
The shear capacity of ultra‐high performance fiber‐reinforced concrete consists of a concrete part, a
shear reinforcement part and a fiber part. Since the fiber orientation and the shear plane of the
concrete differ for inclined and straight webs the shear capacity will differ as well.

69
Because the floor of a box girder with inclined webs has less concrete and thus a smaller compressive
capacity, the internal lever arm must be increased to provide sufficient capacity. This means an
increase in construction depth. In order to meet the clearance criterion for the bridge or viaduct, the
embankment must be enhanced, which provides additional cost. Also, approach bridges often are
connected to balanced cantilever bridges. Balanced cantilever box girder bridges with varying depth
cannot have inclined webs, because they lead to a varying floor width and thus a complicated
execution. Therefore almost all incrementally launched box girder bridges in The Netherlands have
straight webs, except for Viaduct Ravensbosch that crosses a 25 meters deep valley (Thomaes, et al.,
1974).
Since clearance is an important geometrical requirement at the approach bridge location, and to
simplify calculations, the box girder will have straight webs and will have the shape from Figure 7.2.
Figure 7.2: box girder dimensions (van der Veen, 2014)
7.2 The deck width
The deck width will be based on dimensions from Figure 7.3 and (Rijkswaterstaat, 2013).
The single cell box girder must accommodate:
two driving lanes + centre line: 2x3.50m + 0.15m.
a hard shoulder + side line: 3.15m + 0.15m.
a verge + safety barrier + footpath: 0.50m + 1.41m.
a hard strip + side line: 1.50m + 0.15m.
a safety barrier + footpath: 1.41m.
total: 15.42m.
For purpose of execution the deck width will be set to: 15.50 .

70
Figure 7.3: dimensions on a bridge deck (van der Veen, 2014)
7.3 Remaining box girder dimensions
The remaining box girder dimensions will be determined with rules of thumb from (van der Meulen,
1991) and (van der Veen, 2014).
For an incrementally launched conventional concrete box girder without auxiliary supports the span
to depth ratio is: / 18. When temporary bridge piers are used, a slenderness of: / 25 can
be reached.
The approach bridge has a constant curvature in its horizontal and vertical alignment for a length of
550 meters. The span length for incrementally launched conventional concrete box girder bridges is
35 to 75 meters. End spans must have a length of about 80% of the intermediate span length. As a
start, the span length will be set to 57.3 meters. End spans will be 45.8 meters long.
The box girder depth: /18 57.3/18 3.2 .
The cantilever length: 2 3.5 .
The box girder width: 5 7 .
0.45
2 15.5 3.75 & 8 .
The width of the upper haunch: .
The deck width in between webs: .
2 8 2 · 0.35 7.3 .

71
0.2 0.2 · 7.3 1.4
The thickness at the cantilever’s end: .
The thickness of the cantilever at the web: .
For a conventional concrete box girder the thickness of the cantilever will be governed by the
bending moment and shear forces in transverse direction.
0.2 0.2 .
2 à 3 0.4
The thickness of the deck: .
The web thickness: .
The floor thickness: .
For an incrementally launched conventional concrete box girder the web thickness will be governed
by the shear forces in longitudinal direction. The floor thickness will be governed by the bending
moment at the support.
300.2
7.330
0.2 0.25
0.35 0.35 .
0.15 0.15 .
The height of the upper haunch: .
0.25 .

72
8 Design of the superstructure
This chapter describes the special procedure for box girder design and provides an analysis of the
force distribution and capacity in transverse direction to optimize the dimensions that were adopted
for the preliminary design.
When the slenderness / 4, the span length 1.5 and the box girder is loaded symmetrically
in the transverse direction, the box girder may be designed longitudinally as a beam and transversely
as a frame, independent of each other. When the loads are positioned asymmetrically in transverse
direction, the box girder may not be designed separate and independent in longitudinal and
transverse direction (Schlaich & Scheef, 1982).
8.1 Design procedure
The design of the box girder cross‐section takes the following procedure:
1. Determination of governing load cases in longitudinal and transverse direction.
2. Beam analysis with a rigid cross‐section in longitudinal direction, yielding , , & .
3. Splitting up the loading into a symmetrical and an asymmetrical part (Figure 8.1).
4. Frame analysis in transverse direction for symmetrical loading, yielding , , .
5. Frame analysis in transverse direction for asymmetrical loading, yielding , , & .
6. Superposition of the sectional forces in transverse direction, yielding , & .
7. Determination of longitudinal stresses and transverse bending moments , which are a
result of the diagonal force caused by the combination of longitudinal and transverse
bending (Figure 8.1d).
8. Superposition of with and with , yielding the actual longitudinal and transverse
stresses.
8.2 The loads
8.2.1 Self weight
The volumetric mass density of UHPFRC: 26 / . The self‐weight is permanently present in
both the launch phase and the use phase.

73
8.2.2 Super imposed dead load
The super imposed dead load consists of the weight of non‐structural elements, such as asphalt and
safety barriers. The super imposed dead load is a permanent load and is only present in the use
phase. (Rijkswaterstaat, 2013) demands an asphalt layer thickness of 50 70 , with:
20304
50
Assume: 50 25 .
The volumetric mass density of dense asphalt concrete (DAB): 23 / .
The volumetric mass density of ZOAB: 21.5 / .
Estimated dead load from asphalt: 0.145 · 23 3.3 3.5 / .
Figure 8.1: splitting up of the structural system and the loading of a box girder (Schlaich & Scheef, 1982)

74
The weight of the safety barrier: 1 / .
The weight of the footpath (Figure 8.2): · 0.15 · 0.4 0.6 0.3 · 0.4 · 25 6.75 / .
The weight of the parapet: 0.75 / .
Figure 8.2: safety barrier, footpath and parapet
8.2.3 Traffic loading
Traffic loading is a live load that is active in the use phase. Only load model 1 will be considered in the
design. Load model 1 consists of two partial systems: a uniformly distributed load (UDL) and a
tandem system (TS).
The UDL has the following weight per square meter of notional lane: , with from NEN‐EN
1991‐2 NB 4.3.2 and from NEN‐EN 1991‐2 Table 4.2.
The tandem system consists of double‐axle concentrated loads, each axle having following weight:
, with from NEN‐EN 1991‐2 Table NB1 and from NEN‐EN 1991‐2 Table 4.2.

75
8.2.4 Temperature loading
Due to daily variations, the bridge deck its upper surface will heat up and cool down. These
temperature differences may cause bending moments in the box girder when the bridge deck cannot
freely deform. The bridge deck can be classified into type 3 in accordance with NEN‐EN 1991‐1‐5
6.3.2. The effect of vertical temperature differences can be considered by using equivalent linear
temperature difference components ∆ , and ∆ , combined with a factor conform
NEN‐EN 1991‐1‐5 Table 6.1 & Table 6.2.
8.3 Load combinations
8.3.1 Ultimate limit state
The ULS combinations consist of:
ULS – EQU: loss of equilibrium of the structure, e.g. buckling.
ULS – STR: failure by excessive deformation or transformation of the structure into a
mechanism.
ULS – GEO: failure or excessive deformation of the ground.
ULS – FAT: failure caused by fatigue or other time‐dependent effects.
For ULS – STR, the less favorable of the two following fundamental combinations applies (NEN‐EN
1990: equations 6.10a & 6.10b):
, , , , , , , ,
, , , , , , ,
The partial factors follow from NEN‐EN 1990: Table NB.13 – A2.4(B). The factors must be derived
from NEN‐EN 1990: NB.9 – A2.1.

76
8.3.2 Serviceability limit state
The SLS combinations consist of:
a characteristic combination;
a frequent combination;
a quasi‐permanent combination.
For the frequent combination the following expression applies (NEN‐EN 1990: equation 6.15b):
, , , , ,
For the quasi‐permanent combination the following expression applies (NEN‐EN 1990: equation
6.16b):
, , ,
In SLS all partial factors are set to zero (NEN‐EN 1990: A2.4.1).
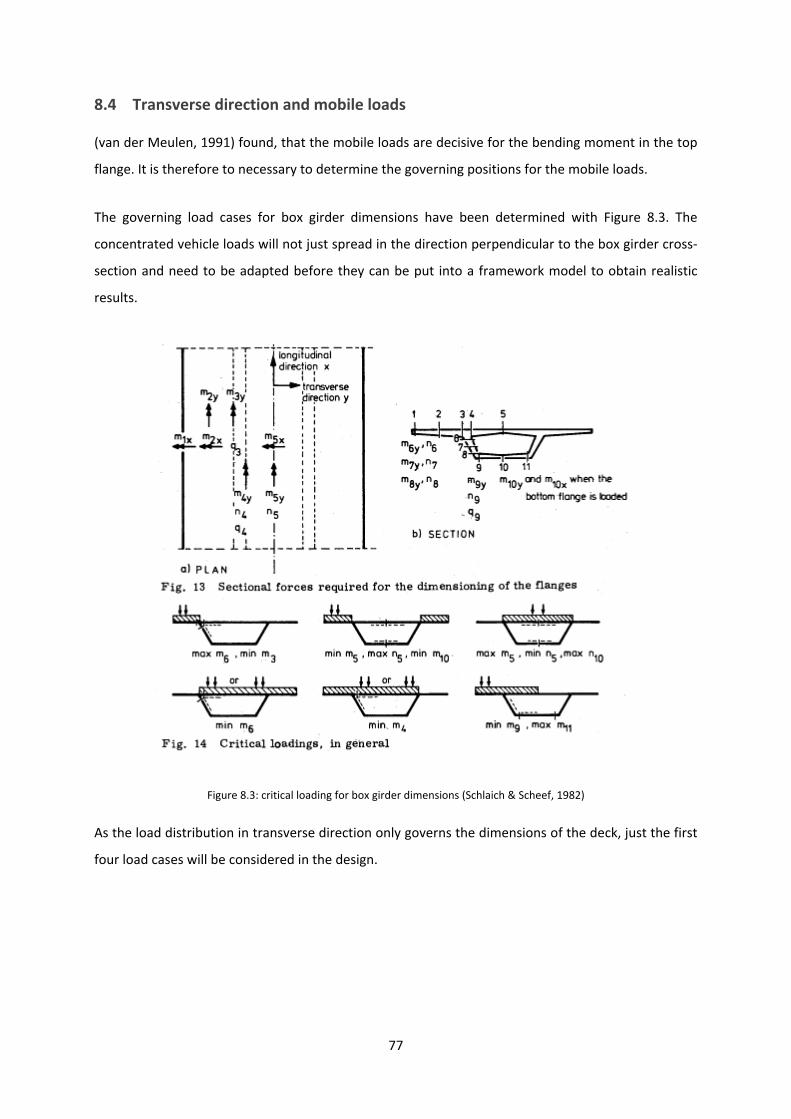
77
8.4 Transverse direction and mobile loads
(van der Meulen, 1991) found, that the mobile loads are decisive for the bending moment in the top
flange. It is therefore to necessary to determine the governing positions for the mobile loads.
The governing load cases for box girder dimensions have been determined with Figure 8.3. The
concentrated vehicle loads will not just spread in the direction perpendicular to the box girder cross‐
section and need to be adapted before they can be put into a framework model to obtain realistic
results.
Figure 8.3: critical loading for box girder dimensions (Schlaich & Scheef, 1982)
As the load distribution in transverse direction only governs the dimensions of the deck, just the first
four load cases will be considered in the design.

78
For load case 1, the UDL and TS are applied on one of the flanges (Figure 8.3 top left). It will provide
the extreme:
cantilever bending moment
bending moment at the top of the web
For load case 2, the UDL and TS are applied at both flanges (Figure 8.3 top middle). It will provide the
extreme:
negative bending moment at the centre of the deck
normal force (tension) in the deck
negative bending moment at the centre of the floor
For load case 3, the UDL + TS are applied on the deck between the webs (Figure 8.3 top right). It will
provide the extreme:
positive bending moment at the centre of the deck
normal force (compression) in the deck
normal force (tension) in the floor
For load case 4, the UDL is applied on the deck between the webs and on one of the flanges. The TS is
applied close to the web (Figure 8.3 bottom left). It will provide the extreme bending moment at the
web‐deck connection.
A single cell box girder will now be considered with dimensions from Table 8.1.
h 3200 mm
lb 15500 mm
l1 3925 mm
l2 7650 mm
d1, d2, d3 250 mm
d4 350 mm
d5 150 mm
Table 8.1: single cell box girder dimensions

79
8.4.1 Load case 1
Figure 8.4 illustrates the spreading of the axle loads under an angle of 45°. The tandem system is
applied at the most unfavorable position on the cantilever; as close to the edge as possible. Only the
uniformly distributed load 9 / and the tandem system 300 of lane number 1
(the slow lane) will be applied in load case 1.
Figure 8.4: spreading of axle loads from load case 1
The cantilever bending moment due to the tandem system:
2 · 150 · 2.0651.2 2 · 2.065
116 /
The distribution of the concentrated vehicle loading can also be evaluated by an influence surface for
a cantilever slab with a thickness ratio 1:2 (Figure 8.5).

80
Figure 8.5: influence surface for a cantilever slab(Homberg & Ropers, 1965)
The cantilever bending moment due to the tandem system:
0.41 0.41 · 150 123 /
In order to obtain a similar bending moment value in the framework model, a point load of 59 kN
needs to be applied on the flange:
59 · 2.065 122 /
The cantilever bending moment due to the uniformly distributed load:
12· 10.35 · 3.925 1.41 33 /
Load case 1 gives (Appendix 12):
155 /
85 /
130 /
44 /

81
8.4.2 Load case 2
For load case 2 the influence surface of Figure 8.5 can be evaluated again. The left flange is subject to
the same loading as for load case 1, i.e. the UDL = 9 kN/m2 and the heaviest tandem system of 300
kN. The right flange will be subjected to the UDL = 2.5 kN/m2 and the second heaviest tandem system
of 200 kN (Figure 8.6).
Figure 8.6: tandem system position for load case 2
The cantilever bending moment due to the tandem system from lane number two:
0.41 0.41 · 100 82 /
In order to obtain a similar bending moment value in the framework model, a point load of 40 kN
needs to be applied on the flange:
40 · 2.065 83 /

82
The cantilever bending moment due to the uniformly distributed load from lane number two:
12· 3.5 · 3.925 1.41 11 /
Load case 2 gives (Appendix 12):
11 / .
30 / (tension).
1 / .

83
8.4.3 Load case 3
Figure 8.7 illustrates the most unfavorable position of the tandem system for load case 3; as close to
the centre of the deck as possible.
Figure 8.7: most unfavorable tandem system position for load case 3
The distribution of the concentrated vehicle loading can be determined with the influence surface
from Figure 8.8.
The bending moment at mid span due to the tandem system from load case 3 (Figure 8.8):
, , 2 · 0.15 2 · 0.01 · 150 2 · 0.07 2 · 0.003 · 100 63 / .
The bending moment at the support due to the tandem system from load case 3 (Figure 8.10):
, , 2 · 0.21 2 · 0.04 · 150 2 · 0.26 2 · 0.31 · 100 189 /

84
Figure 8.8: influence surface for the moment at mid span for a double clamped slab
In order to obtain a similar bending moment value in the framework model, the magnitude of the
point loads that need to be applied in the framework program can be determined with the fourth
order Euler‐Bernoulli bending beam differential equation.
The bending moment at mid span due to a point load at a distance from the left support can be
expressed by:
12
12
2 3 2
12
12
2 3 2
The contribution of all axle loads to the bending moment at mid span:
2 · 0.003 · 100 1 / .
2 · 0.07 · 100 14 / .
2 · 0.15 · 150 45 / .
2 · 0.01 · 150 3 / .
With , , and being known, the point load can be determined.

85
Resulting in:
0.0634 1 16 .
0.582 14 24 .
0.878 45 51 .
0.181 3 17 .
Appendix 13 shows how to determine the contribution of axle load 1 to the bending moment at mid
span. The same procedure can be followed for the other axle loads.
All point loads can now be put into the framework program.
SCIA Engineer gives:
, 71 / .
The deviation can be explained by the fact that web‐deck connection is not a 100% fixed support. The
web‐deck connection has certain rotational stiffness, which depends on the geometry of the webs
and the deck. For thick webs and a slender deck, the connection shifts to a fixed support. For thin
webs and a heavy deck, the connection shifts to a hinge. Using the influence surface for a double
clamped slab to determine the bending moment diagram for the deck of the box girder due to
concentrated vehicle loading will underestimate the bending moment at mid span and overestimate
the bending moment at the support.
Load case 3 gives (Appendix 12):
92 /
38 / (compression).
37 / (tension).

86
8.4.4 Load case 4
Figure 8.9 illustrates the most unfavorable position of the tandem system for load case 4.
Figure 8.9: most unfavorable tandem system position for load case 4
The distribution of the concentrated vehicle loading can be determined with the influence surface
from Figure 8.5 and Figure 8.10.
The bending moment at mid span due to the tandem system from load case 4 (Figure 8.8):
, , 2 · 0.15 2 · 0.01 · 100 2 · 0.07 2 · 0.003 · 150 54 /
The bending moment at the support due to the tandem system from load case 4 (Figure 8.10):
, , 2 · 0.21 2 · 0.04 · 100 2 · 0.26 2 · 0.31 · 150 221 /

87
The bending moment at the support due to the tandem system from load case 4 (Figure 8.5):
, , 0.41 0.41 · 50 41 / .
Figure 8.10: influence surface for the support moment for a double clamped slab
In order to obtain a similar bending moment value in the framework program, the magnitude of the
point loads that need to be applied in the framework program can be determined with the fourth
order Euler‐Bernoulli bending beam differential equation.
The bending moment at the support due to a point load at a distance from the left support can
be expressed by:
2
The contribution of all axle loads to the bending moment at the support:
2 · 0.26 · 150 78 / .
2 · 0.31 · 150 93 / .
2 · 0.21 · 100 42 / .
2 · 0.04 · 100 8 / .

88
With , , and being known, the point load can be determined.
Resulting in:
0.748 78 104 .
1.11 93 84 .
0.915 42 46 .
0.284 8 28 .
Appendix 14 shows how to determine the contribution of axle load 1 to the bending moment at the
support. The same procedure can be followed for the other axle loads.
All point loads can now be put into the framework program.
SCIA Engineer gives:
, 203 / .
Load case 4 gives (Appendix 12):
237 /
The mobile loading on the cantilever and the deck causes extreme bending moments at the top of
the box girder. The bending moment diagrams from load case 1 to 4 show, that the bending
moments are directly transmitted to the webs. The bending moments in the floor and at the bottom
of the web, due to the mobile loading on the top flange, are negligible.

89
8.5 Flange design
Load case 1 provides the extreme cantilever bending moment and shear force. The capacity of cross‐
section A (Figure 8.11) must be sufficient to transmit the load through the webs to the supports.
Figure 8.11: transverse prestressing in the cantilever
8.5.1 Self‐weight
The bending moment and shear force due to the self‐weight of the cantilever (Figure 8.12 & Figure
8.13):
,12
13
12· 26 · 0.15
130.3 0.15 · 3.925
40 /
,12
12· 26 · 0.15 0.3 · 3.925 23 /
8.5.2 Asphalt layer
The asphalt layer causes a uniformly distributed load up to 1.41 m from the cantilever’s edge, giving
a bending moment and shear force of:
,12 , 1.41
12· 3.5 · 3.925 1.41 11.1 /
, , 3.5 · 3.925 1.41 8.8 /

90
8.5.3 Footpath and edge element
The footpath and edge element cause line loads and at 0.8 m and 0.15 m from the cantilever’s
edge, resulting in a bending moment and shear force of:
, 0.8 0.15
0.15 · 26 · 0.4 0.6 · 3.925 0.8 0.4 · 26 · 0.3 · 3.925 0.15 24 /
, 0.15 · 26 · 0.4 0.6 0.4 · 26 · 0.3 7 /
8.5.4 Parapet
The parapet causes a line load at 0.15 m from the cantilever’s edge, resulting in the following
bending moment and shear force:
, 0.15 0.75 · 3.925 0.15 2.8 /
, 0.75 /
8.5.5 Safety barrier
The safety barrier causes a line load at 1.41 m from the cantilever’s edge, resulting in the
following bending moment and shear force:
, 1.41 1 · 3.925 1.41 2.5 /
, 1 /
The contribution from the asphalt layer, the footpath and edge element, the parapet and the safety
barrier to the bending moment and shear force is combined to the super imposed dead load curve in
Figure 8.12 & Figure 8.13.
8.5.6 All permanent loads
The characteristic value of the bending moment and shear force due to all permanent loads:
, , , , , 40 11.1 24 2.8 2.5 80 /
, , , , , 23 8.8 7 0.75 1 41 /

91
8.5.7 UDL
The UDL from the slow lane works up to 1.41 m from the cantilever’s edge, resulting in the following
characteristic values for bending moment and shear force (Figure 8.12 & Figure 8.13):
,12· · 1.41
12· 10.35 · 3.925 1.41 33 /
, · 1.41 10.35 · 3.925 1.41 26 /
Figure 8.12: cantilever bending moment due to self‐weight, super imposed dead load and UDL
Figure 8.13: cantilever shear force due to self‐weight, super imposed dead load and UDL
‐60
‐50
‐40
‐30
‐20
‐10
0
2 2,5 3 3,5 4 4,5
Bending moment M [kNm/m]
Cantilever length l1 [m]
Cantilever bending moment
Self‐weight UHPC
Super imposed dead load
UDL: 10,35 kN/m^2
d1 = 0,15md2 = 0,30m
0
5
10
15
20
25
30
35
2 2,5 3 3,5 4 4,5
Shear force V [kN/m]
Cantilever length l1 [m]
Cantilever shear force
Self‐weight UHPC
Super imposed dead load
UDL: 10,35 kN/m^2
d1 = 0,15md2 = 0,30m
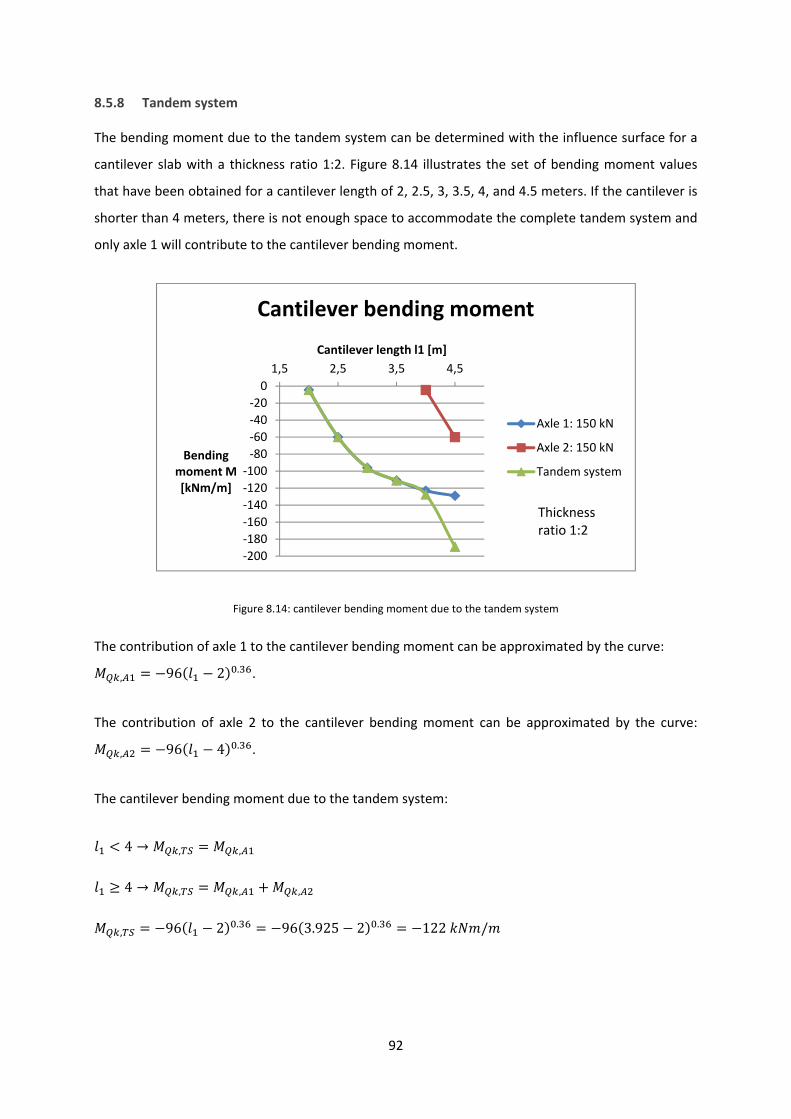
92
8.5.8 Tandem system
The bending moment due to the tandem system can be determined with the influence surface for a
cantilever slab with a thickness ratio 1:2. Figure 8.14 illustrates the set of bending moment values
that have been obtained for a cantilever length of 2, 2.5, 3, 3.5, 4, and 4.5 meters. If the cantilever is
shorter than 4 meters, there is not enough space to accommodate the complete tandem system and
only axle 1 will contribute to the cantilever bending moment.
Figure 8.14: cantilever bending moment due to the tandem system
The contribution of axle 1 to the cantilever bending moment can be approximated by the curve:
, 96 2 . .
The contribution of axle 2 to the cantilever bending moment can be approximated by the curve:
, 96 4 . .
The cantilever bending moment due to the tandem system:
4 , ,
4 , , ,
, 96 2 . 96 3.925 2 . 122 /
‐200
‐180
‐160
‐140
‐120
‐100
‐80
‐60
‐40
‐20
0
1,5 2,5 3,5 4,5
Bending moment M [kNm/m]
Cantilever length l1 [m]
Cantilever bending moment
Axle 1: 150 kN
Axle 2: 150 kN
Tandem system
Thicknessratio 1:2

93
Figure 8.15 illustrates the set of shear force values that have been obtained with the influence
surface for a cantilever slab with a thickness ratio 1:1. The influence surface for a cantilever slab with
a thickness ratio 1:2 is not available and therefore the shear force will be somewhat underestimated.
Figure 8.15: cantilever shear force due to the tandem system
The contribution of axle 1 to the cantilever shear force can be approximated by the equation:
3 , 106 1.99 .
3 , 25 3 106
The contribution of axle 2 to the cantilever shear force can be approximated by the equation:
, 106 3.99 .
The cantilever shear force due to the tandem system:
4 , ,
4 , , ,
, 25 3 106 25 3.925 3 106 83 /
0
20
40
60
80
100
120
140
160
180
1,5 2,5 3,5 4,5
Shear force V [kN/m]
Cantilever length l1 [m]
Cantilever shear force
Axle 1: 150 kN
Axle 2: 150 kN
Tandem system
Thicknessratio 1:1

94
8.5.9 ULS design
Design value of the bending moment and shear force at cross‐section A, according to NEN‐EN 1990:
equations 6.10a & 6.10b:
,, ,
, ,
,1.4 · 80 1.5 · 0.8 · 122 1.5 · 0.8 · 33 298 /
1.25 · 80 1.5 · 122 1.5 · 33 333 /
,, ,
, ,
,1.4 · 41 1.5 · 0.8 · 83 1.5 · 0.8 · 26 188 /
1.25 · 41 1.5 · 83 1.5 · 26 215 /
Appendix 15 shows that five 16 mm strands are required to provide sufficient bending moment and
shear force capacity for cross‐section A.
Unity check ultimate bending moment: , / 333/352 0.95
Unity check ultimate shear force: , / 215/2080 0.10

95
8.5.10 SLS design
As the cantilever is not restrained to deform in transverse direction due to temperature differences,
no additional bending moments have to be taken into account.
Design value of the bending moment at cross‐section A, according to NEN‐EN 1990: equation 6.15b:
, , , 80 0.8 · 122 0.8 · 33 204 /
Requirement: the flange remains uncracked in the serviceability state.
0 check top fiber:
· ·
· 289 /
0 check bottom fiber:
· ·
· 55 /
∞ check top fiber:
· ·
· 247 /
∞ check bottom fiber:
· ·
· 71 /
Unity check serviceability limit state bending moment: , / 205/247 0.83
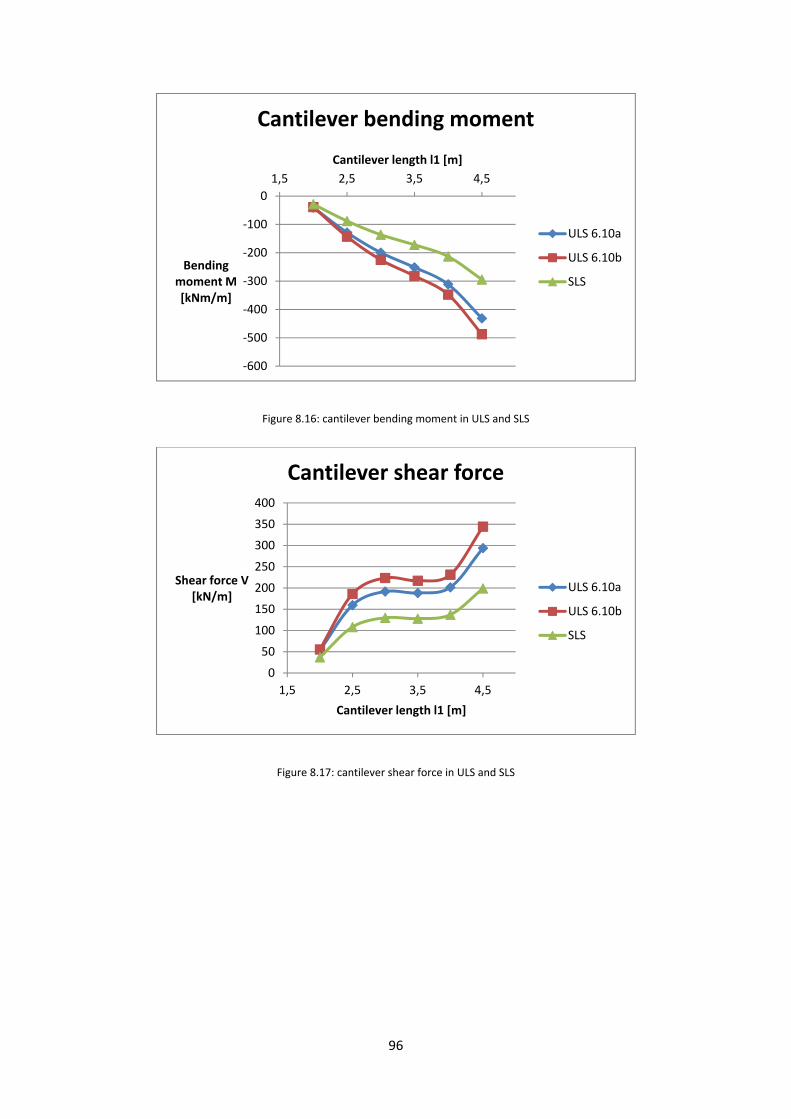
96
Figure 8.16: cantilever bending moment in ULS and SLS
Figure 8.17: cantilever shear force in ULS and SLS
‐600
‐500
‐400
‐300
‐200
‐100
0
1,5 2,5 3,5 4,5
Bending moment M [kNm/m]
Cantilever length l1 [m]
Cantilever bending moment
ULS 6.10a
ULS 6.10b
SLS
0
50
100
150
200
250
300
350
400
1,5 2,5 3,5 4,5
Shear force V [kN/m]
Cantilever length l1 [m]
Cantilever shear force
ULS 6.10a
ULS 6.10b
SLS

97
8.6 Deck support
Load case 4 provides the extreme bending moment and shear force in the deck at the support. The
capacity of cross‐section B (Figure 8.18) must be sufficient to transmit the load through the webs to
the supports.
Figure 8.18: transverse prestressing in the deck
The maximum bending moment in the deck at the support, due to the tandem system, can be
determined with influence surfaces. (van der Meulen, 1992) demonstrated, that for the deck
between the webs, including haunches, the support moment is best approximated with the influence
surface for a double clamped slab with a parabolic bottom edge and a thickness ratio 1:2.
8.6.1 Self‐weight
The bending moment and shear force at the support, due to the self‐weight of a double clamped slab
with a parabolic bottom edge and a thickness ratio 1:2, are equal to (Figure 8.19 & Figure 8.20):
, 0.1216 0.1216 · 26 · 0.2 · 7.65 37 /
, 0.5832 0.5832 · 26 · 0.2 · 7.65 23 /

98
8.6.2 Asphalt
The bending moment and shear force at the support, due to a uniformly distributed load on a
double clamped slab with a parabolic bottom edge and thickness ratio 1:2 (Figure 8.19 & Figure
8.20):
, 0.1025 , 0.1025 · 3.5 · 7.65 21 /
,12 ,
12· 3.5 · 7.65 13 /
8.6.3 Permanent loads
Characteristic value of the bending moment and shear force due to the permanent loads:
, , 37 21 58 /
, , 23 13 36 /
Figure 8.19: bending moment in the deck at the support due to self‐weight, super imposed dead load and UDL
‐80
‐70
‐60
‐50
‐40
‐30
‐20
‐10
0
6,5 7,5 8,5 9,5 10,5
Bending moment M [KNm/m]
Deck length l2 [m]
Bending moment deck support
Self‐weight UHPC
Super imposed dead load
UDL: 10,35 & 3,5 kN/m^2
d3 = 0,20mhv = 0,20m

99
Figure 8.20: shear force in the deck at the support due to self‐weight, super imposed dead load and UDL
8.6.4 UDL
The bending moment and shear force due to the UDL can be determined with the Euler‐Bernoulli
bending beam differential equation. The bending stiffness of the deck is assumed to be constant over
the whole length. Bending moment and shear force values have been found for a deck length of 6.5,
7.5, 8.5, 9.5 and 10 meters (Figure 8.19 & Figure 8.20). From these values, a trend line can be
derived. The characteristic value of the bending moment and shear force due to the UDL can be
approximated by the following equations:
, 9 3.5 9 · 7.65 3.5 37 /
, 1.5 12 1.5 · 7.65 12 29 /
Appendix 19 shows how to determine the bending moment and shear force at the support due to
the UDL for a deck length of 7.5 meters. The same procedure can be followed for the other deck
lengths.
0
5
10
15
20
25
30
35
40
6,5 7,5 8,5 9,5 10,5
Shear force V [kN/m]
Deck length l2 [m]
Shear force deck support
Self‐weight UHPC
Super imposed dead load
UDL: 10,35 & 3,5 kN/m^2
d3 = 0,20mhv = 0,20m

100
8.6.5 Tandem system
The bending moment due to the tandem system can be determined with the influence surface for a
double clamped slab with a parabolic bottom edge and a thickness ratio 1:2. Bending moment values
have been found for a deck length of 6.5, 7.5, 8.5, 9.5 and 10 meters (Figure 8.21). The same
procedure can be followed to determine the shear forces (Figure 8.22). However, since the influence
surface for a cantilever slab with a thickness ratio 1:2 is not available, shear forces will be determined
with a thickness ratio 1:1 and will therefore be somewhat underestimated.
From these values, a trend line can be derived. The characteristic value of the bending moment and
shear force due to the tandem system can be approximated by the following equations:
, 45 6.5 . 170 45 7.65 6.5 . 170 220 /
, 13 22 13 7.65 22 187 /
Figure 8.21: bending moment in the deck at the support due to the tandem system
‐350
‐300
‐250
‐200
‐150
‐100
‐50
0
6 8 10
Bending moment M [kNm/m]
Deck length l2 [m]
Bending moment deck support
Tandem system
Thicknessratio 1:2

101
Figure 8.22: shear force in the deck at the support due to the tandem system
8.6.6 ULS design
The design value of the bending moment and shear force at cross‐section B according to
NEN‐EN 1990: equations 6.10a & 6.10b:
,, ,
, ,
,1.4 · 58 1.5 · 0.8 · 37 220 390 /1.25 · 58 1.5 · 37 220 458 /
,, ,
, ,
,1.4 · 36 1.5 · 0.8 · 29 187 310 /1.25 · 36 1.5 · 29 187 369 /
Appendix 16 shows that five 16 mm strands are required to provide sufficient bending moment and
shear force capacity for cross‐section B.
Unity check ultimate bending moment: , / 458/561 0.82
Unity check ultimate shear force: , / 369/2780 0.13
0
50
100
150
200
250
6 7 8 9 10 11
Shear force V [kN/m]
Deck length l2 [m]
Shear force deck support
Tandem system
Thicknessratio 1:1

102
8.6.7 SLS design
As the deck between the webs cannot freely deform due to temperature differences, a temperature
induced bending moment will arise.
When a double clamped slab is exposed to a uniform temperature drop ∆ , it wants to shorten.
This deformation is restrained and leads to a normal force in the slab:
, ∆ , with:
: the axial stiffness
: the coefficient of thermal dilation
When a double clamped slab is exposed to a temperature differential ∆ , it wants to bend. The
rotations at the slab ends cannot occur since they are prevented by the fixed supports. This will lead
to a bending moment in the slab:
, ∆ , with:
∆
: the bending stiffness
: the curvature
Due to limited time available the magnitude of this temperature induced bending moment is not
determined.

103
Design value of the bending moment at cross‐section B according to NEN‐EN 1990: equation 6.15b:
, , , 58 0.8 37 220 264 /
Requirement: the deck remains uncracked in the serviceability state.
0 check top fiber:
· ·
· 453 /
0 check bottom fiber:
· ·
· 114 /
∞ check top fiber:
· ·
· 393 /
∞ check bottom fiber:
· ·
· 139 /
Unity check serviceability limit state bending moment: , / 264/393 0.67

104
Figure 8.23: bending moment in the deck at the support in ULS and SLS
Figure 8.24: shear force in the deck at the support in ULS and SLS
‐700
‐600
‐500
‐400
‐300
‐200
‐100
0
6 7 8 9 10 11
Bending moment M [kNm/m]
Deck length l2 [m]
Bending moment deck support
ULS 6.10a
ULS 6.10b
SLS
0
50
100
150
200
250
300
350
400
6 7 8 9 10 11
Shear force V [kN/m]
Deck length l2 [m]
Shear force deck support
ULS 6.10a
ULS 6.10b
SLS

105
8.7 Deck end haunch
Load case 4 provides the extreme bending moment and shear force in the deck at the haunch’s end.
The capacity of cross‐section C (Figure 8.18) must be sufficient to transfer the load to the webs.
The maximum bending moment in the deck at the haunch’s end, due to the tandem system, can be
determined with influence surfaces. (van der Meulen, 1992) demonstrated, that for the deck
between the webs, including haunches, the bending moment at the haunch’s end is best
approximated with the influence surface for a double clamped slab with a parabolic bottom edge and
a thickness ratio 1:2.
8.7.1 Self‐weight
The bending moment and shear force in the deck at the haunch’s end, due to the self‐weight of a
double clamped slab with a parabolic bottom edge and a thickness ratio 1:2, are equal to
(Figure 8.25 & Figure 8.26):
, 0.0235 0.0235 · 26 · 0.2 · 7.65 7 /
,12
· 0.612· 26 · 0.2 · 0.6 · 7.65 12 /
8.7.2 Asphalt
The bending moment and shear force in the deck at the haunch’s end, due to a uniformly distributed
load on a double clamped slab with a parabolic bottom edge and a thickness ratio 1:2, are equal to
(Figure 8.25 & Figure 8.26):
, 0.0225 , 0.0225 · 3.5 · 7.65 5 /
,12 , · 0.6
12· 3.5 · 0.6 · 7.65 8 /
8.7.3 Permanent loads
The characteristic value of the bending moment and shear force due to the permanent loads:
, , 7 5 12 /
, , 12 8 20 /

106
Figure 8.25: bending moment in the deck at the haunch’s end due to self‐weight, super imposed dead load and UDL
Figure 8.26: shear force in the deck at the haunch’s end due to self‐weight, super imposed dead load and UDL
‐16
‐14
‐12
‐10
‐8
‐6
‐4
‐2
0
2
4
6,5 7,5 8,5 9,5 10,5
Bending moment M [kNm/m]
Deck length l2 [m]
Bending moment end haunch
Self‐weight UHPC
Super imposed dead load
UDL: 10,35 & 3,5 kN/m^2
d3 = 0,20mhv = 0,20mlv = 0,2l2
0
5
10
15
20
25
30
6,5 7,5 8,5 9,5 10,5
Shear force V [kN/m]
Deck length l2 [m]
Shear force end haunch
Self‐weight UHPC
Super imposed dead load
UDL: 10,35 & 3,5 kN/m^2
d3 = 0,20mhv = 0,20mlv = 0,2l2

107
8.7.4 UDL
The bending moment and shear force due to the UDL can be determined with the Euler‐Bernoulli
bending beam differential equation. The bending stiffness of the deck is assumed to be constant over
the whole length. Bending moment and shear force values have been found for a deck length of 6.5,
7.5, 8.5, 9.5 and 10 meters (Figure 8.25 & Figure 8.26). From these values, a trend line can be
derived. The characteristic value of the bending moment and shear force due to the UDL can be
approximated by the following equations:
, 1 1 /
, 2 1.5 2 7.65 1.5 18 /
Appendix 20 shows how to determine the bending moment and shear force at the haunch’s end due
to the UDL for a deck length of 8.5 meters. The same procedure can be followed for the other deck
lengths.
8.7.5 Tandem system
The bending moment due to the tandem system can be determined with the influence surface for a
double clamped slab with a parabolic bottom edge and a thickness ratio 1:2. Bending moment values
have been found for a deck length of 6.5, 7.5, 8.5, 9.5 and 10 meters (Figure 8.27). The same
procedure can be followed to determine the shear forces (Figure 8.28). However, since the influence
surface for a cantilever slab with a thickness ratio 1:2 is not available, shear forces will be determined
with a thickness ratio 1:1 and will therefore be somewhat underestimated. From the obtained
values, a trend line can be derived. The characteristic value of the bending moment and shear force
due to the tandem system can be approximated by the following equations:
7.5 , 50.5
7.5 , 4 9 33
, 4 9 33 4 7.65 9 33 40 /
, 2 9 50 2 7.65 9 50 54 /

108
Figure 8.27: bending moment in the deck at the haunch’s end due to the tandem system
Figure 8.28: shear force in the deck at the haunch’s end due to the tandem system
‐50
‐45
‐40
‐35
‐30
‐25
‐20
‐15
‐10
‐5
0
6 8 10
Bending moment M [kNm/m]
Deck length l2 [m]
Bending moment end haunch
Tandem system
Thicknessratio 1:2
0
10
20
30
40
50
60
70
6 8 10
Shear force V [kN/m]
Deck length l2 [m]
Shear force end haunch
Tandem system

109
8.7.6 ULS design
Design value of the bending moment and shear force at cross‐section C according to NEN‐EN 1990:
equations 6.10a & 6.10b:
,, ,
, ,
,1.4 · 12 1.5 · 0.8 · 40 1 64 /1.25 · 12 1.5 · 40 1 74 /
,, ,
, ,
,1.4 · 20 1.5 · 0.8 · 18 54 114 /1.25 · 20 1.5 · 18 54 133 /
Appendix 17 shows that five 16 mm strands are required to provide sufficient bending moment and
shear force capacity for cross‐section C.
Unity check ultimate bending moment: , / 74/145 0.51
Unity check ultimate shear force: , / 133/545 0.24

110
8.7.7 SLS design
Design value of the bending moment at cross‐section C according to NEN‐EN 1990: equation 6.15b:
, , , 12 0.8 40 1 43 /
Requirement: the deck remains uncracked in the serviceability state.
0 check top fiber:
· ·
· 67 /
0 check bottom fiber:
· ·
· 109 /
∞ check top fiber:
· ·
· 64 /
∞ check bottom fiber:
· ·
· 95 /
Unity check serviceability limit state bending moment: , / 43/64 0.67

111
Figure 8.29: bending moment in the deck at the haunch’s end in ULS and SLS
Figure 8.30: shear force in the deck at the haunch’s end in ULS and SLS
‐100
‐90
‐80
‐70
‐60
‐50
‐40
‐30
‐20
‐10
0
6 7 8 9 10 11
Bending moment M [kNm/m]
Deck length l2 [m]
Bending moment end haunch
ULS 6.10a
ULS 6.10b
SLS
0
20
40
60
80
100
120
140
160
180
6 7 8 9 10 11
Shear force V [kN/m]
Deck length l2 [m]
Shear force end haunch
ULS 6.10a
ULS 6.10b
SLS

112
8.8 Deck mid span
Load case 3 provides the extreme bending moment in the deck at mid span. The capacity of cross‐
section D (Figure 8.18) must be sufficient to transfer the load to the webs.
The maximum bending moment in the deck at mid span, due to the tandem system, can be
determined with influence surfaces. (van der Meulen, 1992) demonstrated, that for the deck
between the webs, including haunches, the bending moment at mid span is best approximated with
the influence surface for a double clamped slab with a parabolic bottom edge and a thickness ratio
1:1.5.
8.8.1 Self‐weight
The bending moment at mid span, due to the self‐weight of a double clamped slab with a parabolic
bottom edge and a thickness ratio 1:1.5, equals (Figure 8.31):
, 0.0307 0.0307 · 26 · 0.2 · 7.65 9 /
8.8.2 Asphalt
The bending moment at mid span, due to a uniformly distributed load on a double clamped slab
with a parabolic bottom edge and a thickness ratio 1:1.5, equals (Figure 8.31):
, 0.0295 , 0.0295 · 3.5 · 7.65 6 /
8.8.3 Permanent loads
The characteristic value of the bending moment due to the permanent loads:
, , 9 6 15 /
8.8.4 UDL
The bending moment due to the UDL can be determined with the Euler‐Bernoulli bending beam
differential equation. The bending stiffness of the deck is assumed to be constant over the whole
length. Bending moment values have been found for a deck length of 6.5, 7.5, 8.5, 9.5 and 10 meters
(Figure 8.31). From these values, a trend line can be derived. The characteristic value of the bending
moment due to the UDL can be approximated by the equation:
, 5 3.9 5 7.65 3.9 19 /

113
Appendix 21 shows how to determine the bending moment and shear force at mid span due to the
UDL for a deck length of 9.5 meters. The same procedure can be followed for the other deck lengths.
8.8.5 Tandem system
The bending moment due to the tandem system can be determined with the influence surface for a
double clamped slab with a parabolic bottom edge and a thickness ratio 1:1.5. Bending moment
values have been found for a deck length of 6.5, 7.5, 8.5, 9.5 and 10 meters (Figure 8.31). The
characteristic value of the bending moment due to the tandem system can be approximated by the
equation:
, 9 0.5 9 7.65 0.5 64 /
Figure 8.31: bending moment in the deck at mid span due to self‐weight, super imposed dead load, UDL and tandem system
0
10
20
30
40
50
60
70
80
90
100
6,5 7,5 8,5 9,5 10,5
Bending moment M [kNm/m]
Deck length l2 [m]
Bending moment deck midspan
Self‐weight UHPC
Super imposed dead load
UDL: 10,35 & 3,5 kN/m^2
Tandem system
d3 = 0,20mhv = 0,20m

114
8.8.6 ULS design
Design value of the bending moment at cross‐section D according to NEN‐EN 1990: equations 6.10a
& 6.10b:
,, ,
, ,
,1.4 · 15 1.5 · 0.8 · 19 64 121 /1.25 · 15 1.5 · 19 64 143 /
Appendix 18 shows that five 16 mm strands are required to provide sufficient bending moment
capacity for cross‐section D.
Unity check ultimate bending moment: , / 143/186 0.77
Figure 8.32: bending moment in the deck at mid span in ULS and SLS
0
50
100
150
200
250
6 7 8 9 10 11
Bending moment M [kNm/m]
Deck length l2 [m]
Bending moment deck midspan
ULS 6.10a
ULS 6.10b
SLS

115
8.8.7 SLS design
Design value of the bending moment at cross‐section D according to NEN‐EN 1990: equation 6.15b:
, , , 15 0.8 · 83 81 /
Requirement: the deck remains uncracked in the serviceability limit state.
0 check top fiber:
· ·
· 23 /
0 check bottom fiber:
· ·
· 153 /
∞ check top fiber:
· ·
· 31 /
∞ check bottom fiber:
· ·
· 128 /
Unity check serviceability limit state bending moment: , / 81/128 0.63

116
8.9 Force distribution in the webs
The webs are loaded by the resulting bending moment from the cantilever and the deck between the
webs. The sum of the shear forces from the cantilever and the deck cause a centric normal force on
the webs. This results in the following two load cases:
1. Maximum live load on cantilever (load case 1), deck between the webs loaded by self‐weight
and super imposed dead load.
2. Maximum live load on deck between the webs (load case 4), cantilever loaded by self‐weight
and super imposed dead load.
8.9.1 Mobile loading on cantilever (load case 1)
ULS
The design value of the bending moment and normal force on the web in ultimate limit state:
, , , , , , ,
, , , , , , ,
SLS
The design value of the bending moment and normal force on the web in serviceability limit state:
, , , , , , ,
, , , , , , ,
8.9.2 Mobile loading on deck between the webs (load case 4)
ULS
The design value of the bending moment and normal force on the web in ultimate limit state:
, , , , , , ,
, , , , , , ,

117
SLS
The design value of the bending moment and normal force on the web in serviceability limit state:
, , , , , , ,
, , , , , , ,
Figure 8.33 & Figure 8.34 show the resulting bending moment and normal force on the web for load
cases 1 and 4. The cross‐section at the top of the web should be able to withstand these bending
moments in combination with the normal force.
Figure 8.33: resulting bending moment on the web
0
100
200
300
400
500
600
700
2,5 3 3,5 4 4,5
Resulting bending
moment M [kNm/m]
Cantilever length l1 [m]
Resulting bending moment on web
Load case 1: ULS 6.10b
Load case 1: SLS
Load case 4: ULS 6.10b
Load case 4: SLS

118
Figure 8.34: resulting normal force on the web
0
50
100
150
200
250
300
350
400
450
500
2,5 3,5 4,5
Resulting normal force N
[kN/m]
Cantilever length l1 [m]
Resulting normal force on web
Load case 1: ULS 6.10b
Load case 1: SLS
Load case 4: ULS 6.10b
Load case 4: SLS

119
8.10 Force distribution in the floor
The bottom floor does not have any haunches, so the cross‐section at the floor‐web connection will
be governing for the bending moment and shear force.
8.10.1 Self‐weight
The bending moment and shear force at the floor‐web connection, due to the self‐weight of the
bottom floor:
,112
112
· 26 · 0.15 · 7.65 19 /
,12
12· 25 · 0.15 · 7.65 14 /
8.10.2 Vehicle with hydraulic jack
The load due to the presence of a vehicle with a hydraulic jack in order to stress the tendons is
assumed to be 3 / . The bending moment and shear force at the floor‐web connection will
become:
,112
· 3 · 7.65 15 /
,12· 3 · 7.65 12 /
8.10.3 Tensile force in the floor due to mobile loading on deck
When the tandem system is positioned on the deck between the webs, it will cause a tensile force in
the bottom floor, which has the following value:
, ,, , , ,
12
12
| 449 · 10 | | 101 · 10 |
320012 · 200
12 · 150
115 /
, ,, , , ,
12
12
| 259 · 10 | | 80 · 10 |
320012 · 200
12 · 150
59 /

120
8.10.4 ULS design
Design value of the bending moment and shear force at the floor‐web connection, according to
NEN‐EN 1990: equations 6.10a & 6.10b:
,, ,
, ,
,1.4 · 19 1.65 · 1.0 · 15 51 /1.25 · 19 1.65 · 15 49 /
combined with the tensile force: , , .
,, ,
, ,
,1.4 · 14 1.65 · 1.0 · 12 39 /1.25 · 14 1.65 · 12 37 /
Appendix 22 shows that one 16 mm strand is required to provide sufficient bending moment and
shear force capacity for the bottom floor.
Unity check ultimate bending moment: , / 51/63 0.81
Unity check ultimate shear force: , / 37/892 0.04

121
8.10.5 SLS design
Design value of the bending moment at the floor‐web connection according to NEN‐EN 1990:
equation 6.15b:
, , , 34 / , combined with the tensile force: , , .
Requirement: the floor remains uncracked in the serviceability state.
0 check top fiber:
· , , · , ,
· , , 43 /
0 check bottom fiber:
· , , · , ,
· , , 28 /
∞ check top fiber:
· , , · , ,
· , , 40 /
∞ check bottom fiber:
· , , · , ,
· , , 28 /
Unity check serviceability limit state bending moment: , / 34/40 0.85

122
8.11 A different deflection at both webs
This paragraph is based on (Krebs & Lindlar, 1988) and (van der Meulen, 1992). When the tandem
system is located near one of the webs, the deflection at that web will be larger than at the other
web. The difference in deflection will cause bending moments in the box girder cross‐section. This
load case is illustrated in Figure 8.35, where the point load at the left web is split up into a
symmetrical and asymmetrical part. The asymmetrical load is equivalent to the combination of pure
torsion forces (Figure 8.35d) and distortion forces (Figure 8.35e).
Figure 8.35: Splitting up the point load into a symmetrical and an asymmetrical part (Krebs & Lindlar, 1988).
The load caused by the box girder distortion is equal to:
4
with : the force difference between both webs.
In the design, the box girder cross‐section will be replaced, in longitudinal direction, by a infinitely
long beam on elastic foundation with moment of inertia: .
The frame stiffness of the box girder cross‐section against distortion is equal to:
2

123
In longitudinal direction, the box girder cross‐section will be modeled with hinged nodes. In
transverse direction the box girder cross‐section will be modeled with stiff nodes (Figure 8.36). The
longitudinal and transverse direction will be coupled by equalizing the rotation between the deck
and web for both models (Figure 8.37).
Figure 8.36: box girder cross‐section model in longitudinal and transverse direction (Krebs & Lindlar, 1988).
Figure 8.37: frame deformation for hinged nodes (left) and stiff nodes (right) (Krebs & Lindlar, 1988).
, 24
,2
, , 2
1 2
The frame stiffness can be derived by considering half of the box girder cross‐section and by
determining the deflection at the web due to a unit load 1 (Figure 8.38). The cantilevers
will not be considered. This unit deflection can be approximated by a simply supported slab with a
length and a point load 2 (Figure 8.39).

124
The deflection at mid span will be equal to the deflection at the web in the model with half of the
box girder cross‐section. The maximum bending moment at mid span is then equal to the sum of the
support moments at the box girder deck and bottom floor. In this model, the webs are assumed to
be infinitely stiff.
Figure 8.38: model of half the box girder cross‐section (van der Meulen, 1992).
Figure 8.39: model simply supported slab (van der Meulen, 1992).
The maximum deflection and bending moment of a simply supported slab:
48
14
2
The moment of inertia of the deck and floor together, with 1 :
112
with : the mean thickness of the deck.

125
The unit displacement and frame stiffness become:
2
48 · ·112
2
2 4
The support moments in the deck and floor due to a unit load:
·14· 2 ·
2
·14· 2 ·
2
The difference in deflection at both webs will reach a maximum at mid span in longitudinal direction.
In longitudinal direction, the box girder cross‐section will be replaced by a infinitely long beam on
elastic foundation with moment of inertia . In transverse direction, the bending moments can be
determined with:
· ·
with : the deflection of the elastically supported beam, under the point load, in longitudinal
direction.
Figure 8.40: for rectangular box girder cross‐sections (Krebs & Lindlar, 1988).

126
Figure 8.40 can be used to derive . However, this figure is valid for a box girder with the following
properties:
0.45
0.30
For 0.2 , 0.35 and 0.15 , these ratio’s become:
0.20.35
0.57
0.43
Since these values are substantially deviating from the values corresponding to Figure 8.40, will
probably deviate as well. However, when Figure 8.40 is used, becomes:
15.58
1.94
3.215.5
0.21
0.17 0.17
The maximum deflection of the elastically supported beam, under the point load, in longitudinal
direction:
2
4

127
with:
: a parameter in the differential equation for a beam on elastic foundation.
: the foundation constant.
4 · 0.17 ·
2
The support moments in the deck and floor due to the total point load become:
· ·4
·0.17
·
· ·4
·0.17
·
Maxwell’s reciprocal theorem states, that the displacement at A, due to a unit load at B, is equal to
the displacement at B, due to a unit load at A. When the two tandem system axes are located at A
and B in longitudinal direction, the total deflection at A will be caused by the axis at B. When the
tandem system is located centrically above the web, 2 300 . When the tandem
system is located eccentrically above the web, will be equal to the force difference between both
webs.
Figure 8.41: force difference between both webs
0
50
100
150
200
250
300
350
400
2,5 3 3,5 4 4,5
Force difference Pd
[kN]
Cantilever length l1 [m]
Force difference between both webs
Tandem system
d4 = 0,35m

128
Figure 8.41 illustrates the force difference between both webs, when the tandem system is
applied as close to the edge as possible, for a cantilever length of 2, 2.5, 3, 3.5, 4 and 4.5 meters.
2 1.41 0.25 0.2 12 2
2.861
The load and bending moments caused by box girder distortion now become:
4 22.86
1
8·
0.17·
2.861
8·
0.17·
2.861
These formulas only take into account the influence of the tandem system on the bending moment,
since the tandem system is responsible for almost the entire bending moment in the deck.
Figure 8.42 illustrates the bending moment in the deck and floor and the shear force in the floor
caused by box girder distortion.
Figure 8.42: bending moments and shear force caused by box girder distortion
0
2
4
6
8
10
2,5 3 3,5 4 4,5
Bending moment M [kNm/m] & shear force V
[kN/m]
Cantilever length l1 [m]
Bending moments and shear force caused by box girder distortion
md
mf
vf

129
8.11.1 Force distribution in the floor caused by box girder distortion
Design value of the bending moment and shear force at the floor‐web connection, according to NEN‐
EN 1990: equations 6.10a & 6.10b:
,, , ,
, , ,
,1.4 · 19 1.65 · 1.0 · 15 1.5 · 0.8 · 2 54 /
1.25 · 19 1.65 · 15 1.5 · 2 52 /
,, , ,
, , ,
,1.4 · 14 1.65 · 1.0 · 12 1.5 · 0.8 · 1 41 /
1.25 · 14 1.65 · 12 1.5 · 1 39 /
Unity check ultimate bending moment (Appendix 22): , / 54/63 0.86
Unity check ultimate shear force (Appendix 22): , / 41/892 0.05
130
9 Longitudinal direction
In this chapter the loads, which occur during launch and service life, are investigated to determine
the amount of prestressing that is required and the tendon arrangement. It also contains an
optimization study of the steel nose.
9.1 General properties
Total length of the approach bridge: 550 .
Number of spans: 10.
Intermediate span length: 57.9 .
End span length: 43.4 .
Segment length: 29.0 .
Box girder depth: 3.2 .
Box girder width: 15.5 .
Slenderness: / 18.
Box girder cross‐section:
Box girder moment of inertia:
Distance neutral axis to top fiber:
Distance neutral axis to bottom fiber:
Box girder moment of resistance top part:
Box girder moment of resistance bottom part:

131
9.2 Extreme bending moments at support and span during launch
9.2.1 Self‐weight
The bending moments due to the self‐weight of the box girder and the steel nose, are equal to:
, ,112
, ,124
, ,12
9.2.2 ULS design
Design value of the bending moment according to NEN‐EN 1990: equations 6.10a & 6.10b:
, 1.2 ,
9.2.3 SLS design
Design value of the bending moment according to NEN‐EN 1990: equation 6.15b:
, ,
9.3 Central prestressing
The amount of central prestressing that is required follows from the following requirement:
The maximum bending moment in the launch phase cannot exceed the maximum bending moment
in the use phase in serviceability limit state.
The maximum concrete tensile stress in serviceability limit state at the support:
,, ,
The number of required prestressing tendons follows from:

132
The prestressing tendons should be arranged over the top and bottom section of the box girder in
such a way, that the resulting prestressing force will be introduced at the box girder’s neutral axis:
· ·
with , the number of tendons above and beneath the neutral axis and , their eccentricities.
The maximum eccentricity of the upper tendons is given by:
12
The eccentricity of the lower tendons will become:
9.3.1 The initial prestressing force
The value of the initial prestressing force immediately after tensioning and anchoring is obtained
by subtracting the immediate losses ∆ from the force at tensioning and should not exceed
the following value:
with min 0.75 , 0.85 , min 0.75 · 1860, 0.85 · 1674 1395 /
9.3.2 The working prestressing force
The working prestressing force is equal to:
∆
with ∆ : the losses due to time‐dependent behavior.
9.3.3 Shrinkage
UHPFRC shrinkage is mainly autogenous. When it has been heat treated, UHPFRC has no further
shrinkage (Association Francaise de Génie Civil, 2013). Therefore, time‐dependent losses due to
concrete shrinkage will be neglected and will not be taken into account.

133
9.3.4 Creep
Heat treatment significantly reduces creep. The creep coefficient is 0.2 instead of 0.8 without heat
treatment (Association Francaise de Génie Civil, 2013). For the calculation of the losses due to
concrete creep, the concrete compressive stress in serviceability limit state must be used. As the
centre of gravity of the tendons in the launch phase is alternating between the deck and the floor,
the centre of gravity of the central prestressing may be chosen equal to the neutral axis of the box
girder cross‐section.
The concrete compressive stress at the neutral axis of the box girder cross‐section:
The creep deformation of the concrete:
The loss in prestress due to creep:
∆
9.3.5 Relaxation
The relaxation of the prestressing steel can be determined with NEN‐EN 1992‐1‐1 3.3.2. The
prestressing steel is classified into relaxation class 2. The loss in prestress due to relaxation:
∆ 0.66 .1000
.
· 10 ·
with:
2.5: the value of relaxation loss at 1000 hours after tensioning and at a mean temperature
of 20°C.
0.75
: the time after tensioning. When the launch phase is assumed to last half a year, 4380 hours.

134
9.3.6 The required amount of central prestressing
The required amount of central prestressing can be determined with the following procedure:
1. Determine the maximum bending moment in the use phase in SLS.
2. Assume a certain amount of prestressing steel and arrange them such that the resulting
prestressing force will be introduced at the box girder’s neutral axis.
3. Calculate the time‐dependent losses.
4. Check if there will not occur any tensile stresses in the concrete with the equation below:
, 0
9.3.7 The ultimate bending moment capacity
In the launch phase, the box girder and central prestressing should provide sufficient ultimate
bending moment resistance. For this calculation the following simplifications are made:
1. A mean deck thickness over the whole box girder.
2. Cross‐sectional properties: , , , of the initial box girder are used.
3. The prestressing steel working at the compressed area of the cross‐section will be neglected
in force and moment equilibrium, i.e. at mid span the upper tendons are neglected and at
the support the lower tendons are neglected.
4. The moment‐strain diagram is valid for a simply supported prestressed box girder subjected
to pure bending. The box girder is compressed at the top, while under tension at the
bottom. The diagram will be used for the ultimate bending moment capacity at mid span. At
the support, the top section is under tension, while the bottom section is compressed.
Therefore in order to use the same diagram, the box girder needs to be reversed
0, 2 , , , .
9.3.8 The maximum compressive stress
The compressive stress in the concrete should be limited to 0.6 during construction, reduced to
0.55 if the element is less than 3 days old (Association Francaise de Génie Civil, 2013). The
maximum compressive stress will occur at the support when the box girder cantilever length reaches
its maximum just before the steel nose reaches the next support.

135
9.4 Nose optimization
The steel nose will be fabricated from an IPE‐profile. The profile must be diagonally cut to form two
tapered steel profiles. The height of the profile should be: /10 with 2 . The weight of
the steel nose will cause a shear force and a bending moment at the end of the
cantilever part.
·12
78.5 /
2 2
25
, /25 & /50
9.4.1 Central prestressing and nose length
In this paragraph the maximum box girder cantilever length will be studied for different levels of
central prestressing and nose lengths.
Table 9.1 shows the maximum box girder cantilever length that can be reached for different
levels of central prestressing without the use of a steel nose. is the maximum cantilever
moment.
P (N/mm^2) M (Nmm) lcant (mm) ltot (mm)
0 0 0 0
5 4,38E+10 22418 22418
10,17 8,90E+10 31967 31967
15 1,31E+11 38829 38829
20 1,75E+11 44836 44836
Table 9.1: maximum cantilever length without a steel nose

136
The bending moment capacity for a certain level of central prestressing:
0
Without a steel nose becomes:
12
12
2
When a steel nose will be used, the following quadratic equation must be solved for :
12
12
0
Table 9.2 shows the maximum box girder cantilever length that can be reached for different
levels of central prestressing and a 10 meters long steel nose.
P (N/mm^2) M (Nmm) lcant (mm) ltot (mm)
0 0 0 0
5 4,38E+10 21325 31325
10,17 8,90E+10 30929 40929
15 1,31E+11 37815 47815
20 1,75E+11 43836 53836
Table 9.2: maximum cantilever length with a 10 m long nose
Table 9.3 shows the maximum box girder cantilever length that can be reached for different
levels of central prestressing and a 15 meters long steel nose.
P (N/mm^2) M (Nmm) lcant (mm) ltot (mm)
0 0 0 0
5 4,38E+10 18521 33521
10,17 8,90E+10 28324 43324
15 1,31E+11 35290 50290
20 1,75E+11 41361 56361
Table 9.3: maximum cantilever length with a 15 m long nose

137
Table 9.4 shows the maximum box girder cantilever length that can be reached for different
levels of central prestressing and a 20 meters long steel nose.
P (N/mm^2) M (Nmm) lcant (mm) ltot (mm)
0 0 0 0
5 4,38E+10 12983 32983
10,17 8,90E+10 23218 43218
15 1,31E+11 30353 50353
20 1,75E+11 36526 56526
Table 9.4: maximum cantilever length with a 20 m long nose
Table 9.1 ‐ Table 9.4 show that, when the maximum cantilever bending moment in the launch phase
and the serviceability limit state bending moment in the use phase 8.90 · 10 are equal, the
maximum cantilever length, including , will never reach . This means, that more central
prestressing is required to be able to launch the box girder to the next support. The cost for
fabrication of the steel nose and the application of central prestressing will decide whether one
should use higher levels of central prestressing or a longer steel nose.
Figure 9.1 shows that a steel nose of 15 and 20 meters nearly give the same reach. This means that
for lengths over 15 meters, the steel nose becomes too heavy and loses its purpose.
Figure 9.1: maximum cantilever box girder length for different levels of prestressing and nose lengths
0
10
20
30
40
50
60
0 5 10,17 15 20
Cantilever box girder length
ltot [m]
Level of prestressing P [N/mm^2]
Nose optimization
lnose = 0 m
lnose = 10 m
lnose = 15 m
lnose = 20 m

138
The cost for fabrication of the steel nose are €3/kg. The cost for central prestressing, including the
anchors are €2.5/kg.
The cross‐sectional area of the steel nose can be expressed in through the following equation:
2 263
31250
Figure 9.2 illustrates the price for fabrication of the steel nose for different nose lengths.
For a certain nose length the cantilever bending moment will become:
12
With the cantilever bending moment known, the required amount of central prestressing can be
determined:
0 ,
For a certain nose length the required amount of central prestressing will be the lowest. By choosing
another nose length an additional amount of central prestressing will be required: ∆ . Since
(Iversen, et al., 1993) showed that peak moments developed during launch over approximately the
first two spans, the total quantity of extra prestressing ∆ will only be required for the first two
spans. Figure 9.2 illustrates the cost for this additional central prestressing. The green line represents
the total cost, that is the cost for the steel nose and the additional central prestressing.

139
Figure 9.2: cost vs. steel nose length
9.4.2 The required amount of central prestressing for the cantilever bending moment
Figure 9.2 shows that a steel nose length of 15 meters gives the lowest total cost. The required
amount of central prestressing , for the cantilever bending moment can be determined with
the formula from paragraph 9.4.1. This amount of prestressing steel is not required for the entire box
girder. The rear deck sections require less prestressing (Table 9.5).
9.4.3 The ultimate bending moment capacity
During launch, the box girder and central prestressing should provide sufficient ultimate bending
moment resistance. Table 9.5 shows the required amount of central prestressing for the ultimate
limit state.
M (Nmm) tendons Ap (mm^2)
cantilever bending moment SLS ‐1,87E+11 16 49/16 mm 117600
bending moments rear deck sections SLS ‐4,87E+10 4 49/16 mm 29400
cantilever bending moment ULS ‐2,25E+11 2 x 6 49/16 mm 88200
bending moment rear deck sections ULS ‐5,84E+10 2 x 2 49/16 mm 29400
Table 9.5: central prestressing to withstand the bending moments during launch
€ 0
€ 50.000
€ 100.000
€ 150.000
€ 200.000
€ 250.000
€ 300.000
€ 350.000
€ 400.000
€ 450.000
Cost [€]
Steel nose length [mm]
Nose optimization
Steel nose
Central prestressing
Total cost

140
9.5 Extreme shear forces at the support during launch
9.5.1 Self‐weight
The shear forces at the supports, due to the self‐weight of the box girder and the steel nose, are
equal to:
, ,12
, ,
9.5.2 ULS design
Design value of the shear force according to NEN‐EN 1990: equations 6.10a & 6.10b:
, 1.2
9.5.3 Ultimate shear capacity
The ultimate shear capacity is given by (Association Francaise de Génie Civil, 2013):
When .
In case of prestressed concrete, the participation of the concrete will be:
1 0.24
with:
: a safety coefficient.
2 : the total web thickness.
: the internal lever arm.
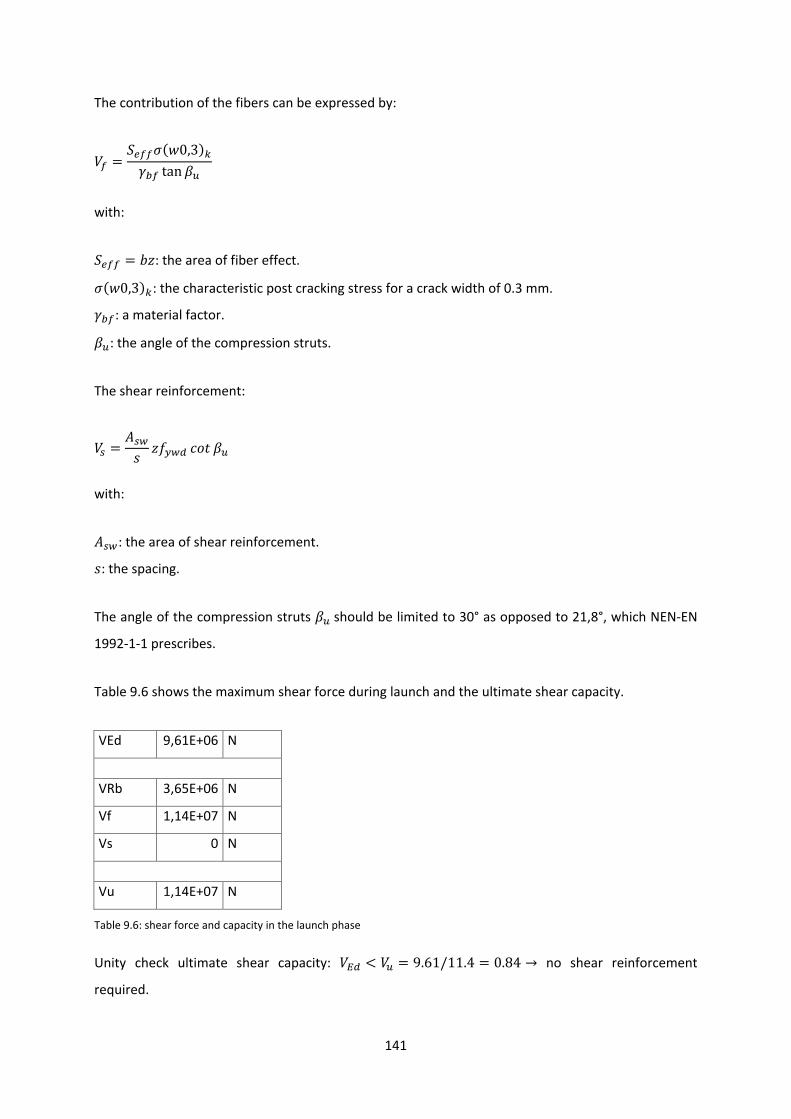
141
The contribution of the fibers can be expressed by:
0,3tan
with:
: the area of fiber effect.
0,3 : the characteristic post cracking stress for a crack width of 0.3 mm.
: a material factor.
: the angle of the compression struts.
The shear reinforcement:
with:
: the area of shear reinforcement.
: the spacing.
The angle of the compression struts should be limited to 30° as opposed to 21,8°, which NEN‐EN
1992‐1‐1 prescribes.
Table 9.6 shows the maximum shear force during launch and the ultimate shear capacity.
VEd 9,61E+06 N
VRb 3,65E+06 N
Vf 1,14E+07 N
Vs 0 N
Vu 1,14E+07 N
Table 9.6: shear force and capacity in the launch phase
Unity check ultimate shear capacity: 9.61/11.4 0.84 no shear reinforcement
required.

142
9.6 The Use Phase
9.6.1 Self‐weight
The self‐weight causes a uniformly distributed load equal to:
, 26 · 26 · 6.70 · 10 174 /
9.6.2 Super imposed dead load
The super imposed dead load combines the loads caused by the asphalt layer, the footpath and edge
element, the parapet and the safety barrier. The asphalt layer causes a uniformly distributed load
, 3.5 / up to 1.41 m from the cantilever’s edge, the footpath and edge element cause
line loads 3.9 / and 3.1 / at 0.8 m and 0.15 m from the cantilever’s edge, the
parapet causes a line load 0.75 / at 0.15 m from the cantilever’s edge and the safety
barrier causes a line load 1 / at 1.41 m from the cantilever’s edge.
, , 3.5 2 · 1.41 2 3.9 3.1 0.75 1
3.5 15.5 2 · 1.41 2 3.9 3.1 0.75 1 62 /
9.6.3 Traffic loading
The traffic loading consists of a uniformly distributed load (UDL) and a tandem system (TS), that need
to be applied at the most unfavorable locations.
The uniformly distributed load works up to 1.41 m from the cantilever’s edge:
, · 3 3 2 · 1.41 10.35 · 3 3.5 15.5 3 2 · 1.41
65 /
In order to determine the longitudinal bending moment due to the tandem system, the double axle
loads should be split up into a symmetrical and asymmetrical part. The symmetrical part affects the
bending moment, while the asymmetrical part has an impact on the torsional moment. The result for
the symmetrical part will become:
6300 200 100
6100
per axle.

143
9.7 Extreme bending moments for a bridge with multiple spans
The governing bending moments for a bridge with multiple spans can be determined with the force
method for analysis of indeterminate structures. For a governing span, adjacent spans will be
modeled as a rotational spring with a certain stiffness, to be able to calculate the bending moments
at the supports and in the span.
9.7.1 Calculation of the extreme bending moments at the supports
Figure 9.3: forces acting on governing span (van der Meulen, 1992)
Figure 9.3 illustrates the forces that act on the governing span, with:
, : bending moments at support A and B.
, : rotational spring stiffnesses.
, , , : external bending moments caused by adjacent spans.
, , , : rotation caused by loads on span.
The bending moments at the supports and can be calculated using forget‐me‐nots:
,,
, 3 6 ,
, 6 3 ,
,,

144
By equalizing , , and , , the following equations arise:
,
3 6 , 2 , ,
6 3 ,, 2 , ,
with:
6
These equations can be solved for and :
, , 2 , ,
2 2 1
, , 2 , ,
2 2 1
In order to be able to calculate the bending moments at the supports and , the rotations
, and , , due to the load on the span that is concerned, are required.
For rotation the following equation applies:
For a point load on a distance from support , the rotation becomes:
,3 2
6
, 22
6 63
2

145
For the tandem system with the first double axle on a distance from support , the rotation
becomes:
,3 2 1.2 1.2 3 1.2 2
6
, 63
2 1.26
31.2 2
For an uniformly distributed load over the whole beam length, the rotation becomes:
, , 24
The rotations , and , need to be inserted in the formula for to find distance , which
corresponds with the maximum value for . For this purpose, the following condition should be
met:
0
This gives the following quadratic equation that needs to be solved for (Appendix 24.4):
6 3 6 1.2 3 2 2 2 3 2 6 1.2 2
3 1.2 3 0
9.7.2 Extreme bending moment for an intermediate beam in the span
The extreme bending moment for an intermediate beam is located at mid span and can be expressed
by:
| |
2

146
For a point load on a distance from support , the bending moment at mid span becomes:
12
12
12
12
The extreme bending moment at mid span due to the tandem system can be found when the first
axle is located at mid span:
12
·12
12
12
1.212
1.2
For an uniformly distributed load over the whole beam length, the bending moment at mid span
becomes:
18
The internal bending moment:
12
1.218
In order to determine bending moments and , the rotations , and , , which
correspond with the position of the tandem system that was mentioned before, are required.
By substituting in the formulas for , and , , the rotations at support and can be
obtained:
,
·12 ·
12 3 ·
12 · 2
12 1.2
12 1.2 3
12 1.2 2
6
,
·12
63
12 2 1
2 1.2
63
12 1.2 2

147
9.7.3 Extreme bending moment for an end beam in the span
The extreme bending moment for an end beam is located at a distance 0.4l from the end support and
can be expressed by:
0.4| |
For a point load on a distance from support , the bending moment at a distance 0.4l from the
end support becomes:
25
35
25
25
The extreme bending moment in the span due to the tandem system can be found when the second
axle is located at 0.4 :
35
25
1.235
·25
35
45
65
125
12 18
For an uniformly distributed load over the whole beam length, the bending moment at 0.4
becomes:
325
The internal bending moment:
125
12 18325
In order to determine bending moment , the rotation , , which corresponds with the position
of the tandem system that was mentioned before, is required:
By substituting 0.4 1.2 in the formula for , , the rotation at support can be obtained:
,0.4 1.26
30.4 1.2 2 · 0.4
63
0.4 2

148
The bending moment can be determined with the following equation:
2 , ,
, ,
2
9.7.4 Calculation of the external bending moments for a bridge with multiple spans
The maximum bending moments at the support and in the span for a continuous beam due to live
loading can be determined with influence lines. The maximum support moment is found when two
adjacent spans are fully loaded and the remaining spans are not. The maximum bending moment in
the span is found when a single span is loaded and the other spans are not.
The calculation of the external bending moments , and , requires the contribution of
every other loaded span to these moments. For the maximum bending moment in the span, all
adjacent spans are subject to dead loading. For the maximum support moment, the directly adjacent
span is subject to live loading as well. Table 9.7 reviews the contribution of a number of adjacent
spans to the external bending moment, by assuming the left support to be fixed and
0.75 . For the complete calculation, see Appendix 24.5 & 24.6.
number of adjacent spans contribution n spans to contribution adjacent span to
1 9/128 9/128
2 133/1536 5/48
3 95/1152 19/180
4 599/7168 71/672
5 6683/80256 265/2508
6 4993/59904 989/9360
Table 9.7: contribution of adjacent spans to the external bending moment

149
9.7.5 Rotational spring stiffness for a beam with multiple spans
The resistance of the adjacent spans can be modeled as a rotational spring with stiffness . The
stiffness can be calculated with forget‐me‐nots (Figure 9.4 & Appendix 24.7).
Figure 9.4: procedure of finding the rotational spring stiffnesses
Table 9.8 reviews the stiffness obtained for a number of spans and 0.75 .
number of adjacent spans rotational spring stiffness /
1 4
2 7/2
3 52/15
4 97/28
5 724/209
6 1351/390
Table 9.8: rotational spring stiffness for a number of spans

150
9.8 Calculation of the required amount of continuity prestressing
The amount of continuity prestressing that is required will be determined in serviceability limit state.
In the use phase, the joints always need to be fully compressed.
The maximum concrete tensile stresses in serviceability limit state at the support and mid span:
,, ,
,, ,
When the continuity tendons are two spans long and anchored at the zero bending moment points,
i.e. at about one‐fifth of the span length, one‐and‐a‐half times the amount of prestressing steel in the
span, will be present at the support.
The following requirements should be met:
32 , 0
, 0
The maximum tendon eccentricities:
12
12
9.8.1 Tendon arrangement
The tendon lay‐out and bending moment by prestressing (Figure 9.5):
tan tan
sin
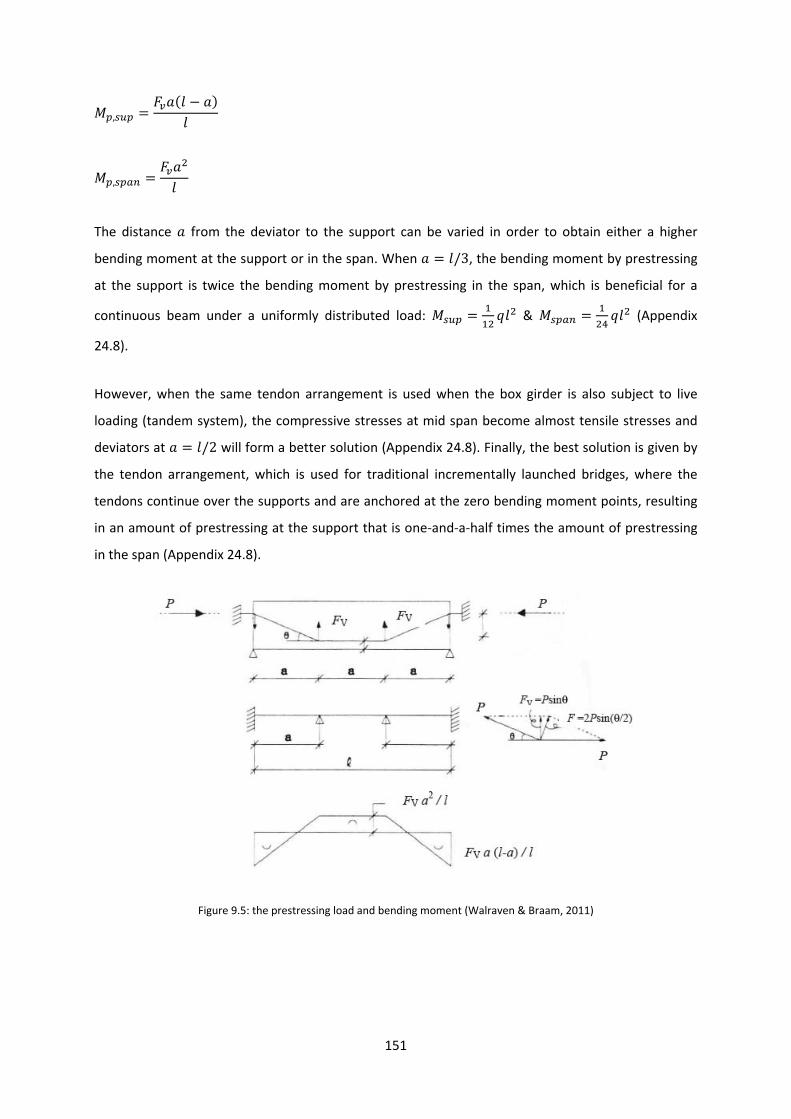
151
,
,
The distance from the deviator to the support can be varied in order to obtain either a higher
bending moment at the support or in the span. When /3, the bending moment by prestressing
at the support is twice the bending moment by prestressing in the span, which is beneficial for a
continuous beam under a uniformly distributed load: & (Appendix
24.8).
However, when the same tendon arrangement is used when the box girder is also subject to live
loading (tandem system), the compressive stresses at mid span become almost tensile stresses and
deviators at /2 will form a better solution (Appendix 24.8). Finally, the best solution is given by
the tendon arrangement, which is used for traditional incrementally launched bridges, where the
tendons continue over the supports and are anchored at the zero bending moment points, resulting
in an amount of prestressing at the support that is one‐and‐a‐half times the amount of prestressing
in the span (Appendix 24.8).
Figure 9.5: the prestressing load and bending moment (Walraven & Braam, 2011)

152
9.8.2 Creep
The concrete compressive stress at the support at the lowest level of the tendons:
32
The creep deformation of the concrete:
The loss in prestress due to creep:
∆
9.8.3 Relaxation
The loss in prestress due to relaxation:
∆ 0.66 .1000
.
· 10 ·
with: 876000 hours (100 years).
9.8.4 The required amount of continuity prestressing
The required amount of continuity prestressing can be determined with the following procedure:
1. Determine the maximum concrete tensile stress at support and mid span in SLS.
2. Determine the maximum tendon eccentricities, prestressing load and bending moment
(Figure 9.5).
3. Assume a certain amount of prestressing steel and estimate the time‐dependent losses.
4. Calculate the real time‐dependent losses.
5. Check if there will not occur any tensile stresses in the concrete with the equations below:
32 , 0
, 0

153
The requirements above result in four tendons with 49 strands per tendon 29400 . For
full calculations see Appendix 24.1.
9.8.5 The ultimate bending moment capacity
In the use phase, the box girder and continuity prestressing should provide sufficient ultimate
bending moment resistance. For this calculation, the following simplifications are made:
1. A mean deck thickness over the whole box girder.
2. Cross‐sectional properties: , , , of the initial box girder are used.
3. The moment‐strain diagram is valid for a simply supported prestressed box girder subjected
to pure bending. The box girder is compressed at the top, while under tension at the bottom.
The diagram will be used for the ultimate bending moment capacity at mid span. At the
support, the top section is under tension, while the bottom section is compressed.
Therefore in order to use the same diagram, the box girder needs to be reversed
0, 2 , , , .
At mid span, six tendons with 49 strands per tendon 44100 are required to provide
sufficient bending moment resistance (Appendix 24.2). That means, there will be nine tendons with
49 strands per tendon 66150 present at the supports that suffice as well (Appendix
24.3).

154
9.9 Extreme shear forces at the supports in the use phase
The maximum shear force in the use phase can be found when the first axle is located above the
support:
| | 12
11.2
In order to determine bending moments and , the rotations , and , , which
correspond with this position of the tandem system, are required. The rotations can be determined
with the formula’s from paragraph 9.7.1 and 0. | | reaches its maximum when the
directly adjacent span from support A is subject to both dead load and live load.
9.9.1 Ultimate shear capacity
The ultimate shear capacity is given by (Association Francaise de Génie Civil, 2013):
When .
Table 9.9 shows the maximum shear force in the use phase and the ultimate shear capacity.
VEd 1,36E+07 N
VRb 3,38E+06 N
Vf 1,84E+07 N
Vs 0 N
Vu 1,84E+07 N
Table 9.9: shear force and shear capacity in the use phase
Unity check ultimate shear capacity: 1.36/1.84 0.74.
There is no shear reinforcement required to withstand the shear forces in the use phase.

155
9.10 The length of a segment
The optimum length of the mould can be found when assembly cost and launching cost are at their
minimum (van den Broek & van den Hoonaard, 1975).
: length of the mould (m).
: cost per meter of formwork.
: total length of launching part (m).
: cost per launching operation.
/ : number of launching operations.
: cost independent on .
is at its minimum when / 0.
0
For “the new bridge crossing the IJssel near Zutphen” the following cost applied:
Total cost for purchase and assemblage of the mould including foundation: 300.000, .
For a mould of 20 meters this will result in : 15.000, .
The launching cost per unit: 5.000, .
However, these cost will nowadays not apply anymore. Gerard Filé, cost engineer at Royal
HaskoningDHV, and Jan Schenk, cost engineer at Van Hattum en Blankevoort, suggest that for a
mould with dimensions similar to the mould of “the new bridge” (van den Broek & van den
Hoonaard, 1975), the cost will be € 300.000 350.000 and the cost for the foundation will be
€ 150.000 200.000, resulting in total cost of about € 500.000, . The cost per launching
operation based on the production of a single unit per week and the presence of twelve workmen
will be € 20.000, . These twelve men lift and lower the formwork, assemble the prestressing and
cast the concrete. They also carry out the launching itself. However, additional manpower is required
to control the launch process and to insert the temporary sliding bearings.

156
For:
€ 20.000,
€ 25.000,
The optimum length of the mould becomes:
· 2000025000
0.89√ 0.89√550 20.1
Thus, the span will be ideally cast in three segments of 19.3 meters. Then the total cost will be equal
to:
20 · 25000 27 · 20000 € 1.040.000
However, three segments per span will jeopardize the structural safety of the bridge. Figure 9.6
illustrates the ideal tendon arrangement for the use phase. The anchor zones are located at one fifth
of the span length. Deviators can be found above the supports and at mid span. As maximum
bending moments occur at the supports we should avoid joints at these locations. Unfortunately,
when a span is divided in three segments, moving the joints by one sixth of the span length means
creating joint positions at mid span and near the anchorage zone. Positions where the fiber
continuity is needed the most, since there is no continuous longitudinal reinforcement present in the
box girder. For structural safety it is better to work with segments that have one fourth or half of the
span length.
Figure 9.6: continuity tendon arrangement and joint positions for three segments per span

157
The total cost for two and four segments per span:
30 · 25000 19 · 20000 € 1.130.000
15 · 25000 37 · 20000 € 1.115.000
As shown in the calculation above, the total cost for two and four segments per span are nearly the
same. In order to avoid as many weak points in the structure as possible, the bridge will be designed
with two segments per span. Figure 9.7 illustrates the continuity tendon arrangement and joint
positions when two segments are used per span.
Figure 9.7: continuity tendon arrangement and joint positions for two segments per span

158
9.11 The final box girder design
Figure 9.8 shows the final box girder design and its dimensions and the transverse prestressing that
will be applied internally in the deck and floor. Because of the presence of the fibers, conventional
reinforcement and shear reinforcement will not be necessary. The absence of conventional
reinforcement is not just positive. Since there is no continuous reinforcement in the joints, tensile
stresses will force the joints to open. To prevent this, the cross‐section must always remain
compressed and the tensile capacity of the concrete cannot be used to generate savings in the
amount of prestressing that is required.
Figure 9.8: the final box girder design
9.11.1 Reduction of web thickness
The webs will be 350 mm thick. However, Appendix 25 shows that for a web thickness of 300 mm
their capacity is still sufficient to carry the shear forces during launch and in the use phase. This
reduction will change other box girder dimensions and thus will influence the force distribution in
transverse direction. In order to check if the capacity in transverse direction is still sufficient, the
procedure in Chapter 8 needs to be followed again.
9.11.2 Maximum span length
Increasing the span length by using one permanent bridge pier less, i.e. ten instead of eleven, and
keeping all the box girder dimensions constant at the same time, appears to be possible (Appendix
26). However, in order to provide sufficient bending moment capacity, a lot of prestressing tendons
would be required, which could give problems with force introduction and execution.

159
10 Execution
Now that we know the final box girder design the execution plan must be established. The
construction of the incrementally launched bridge will be carried out in the following phases:
1. preparation of the construction site.
2. installation of the fabrication yard with a solid foundation.
3. construction of the substructure, i.e. permanent bridge piers and abutments.
4. assembling the nose and formwork system.
5. construction cycle of the deck segments.
6. installation of the continuity prestressing.
10.1 The construction site and fabrication yard
The box girder will be executed from the eastern, lower, abutment near Zevenaar. Launching from
the lower abutment makes a braking system unnecessary. At first, the construction site should be
prepared. The site infrastructure, accommodations and auxiliaries must be taken care of. The site
infrastructure is important to transport materials to the construction site. The site infrastructure can
be divided into an access road, roads at the site itself and the use of space.
Figure 10.1: plan of the construction site
Traditionally, a temporary fabrication yard will be installed behind the abutment, arranged with
separate areas to accommodate for the tower crane and concrete batch plant, to preassemble and
store the reinforcement and prestressing, to cast the concrete and to launch the deck (Figure 10.1).
As nearly all activities are concentrated here, transport distances are, therefore, very short.

160
However, at less than 5 km away, there is a big concrete plant facility owned by a company called
“Cementbouw BV” (Figure 10.2). As shown in paragraph 10.4, the total volume of concrete per
segment is only 194 m3. It may, therefore, be cheaper to use the facilities of “Cementbouw BV”,
instead of installing a temporary batch plant on site. Especially since the transport distance is very
short. The concrete would then be batched in the central mix plant and brought to the construction
site with truck mixers. It is very important, that the time between batching of the concrete and
completion of placement is consistent and short, since hydration begins at the plant. Since the
mixture contains fibers we would need permission to use one of the company’s batch plants; regular
concrete does not use steel fibers and some fibers may remain and get stuck in the plant, which
would then have to be removed. This option also has a big impact on the construction cycle of the
deck segments. We need to make sure that the company can provide sufficient capacity at the
scheduled days of placement.
Figure 10.2: “Betonmortelbedrijf Cementbouw BV” close to the construction site
The fabrication yard requires a solid foundation to provide sufficient resistance against the very large
horizontal forces during the launch operation. The whole area should be completely covered, so
factory‐like conditions independent of the weather are created and concrete can be produced of
high quality. When the casting area has a length of 73.4 meters, that is the length of the first span
plus the length of the nose, the weight of the cantilever will be secured in the initial stages of launch
(Figure 10.3 second and third picture).

161
Figure 10.3: the launch process
10.2 The steel nose
After the construction site, the infrastructure, the equipment and accommodations are ready, the
steel nose can be assembled in position at the front of the casting yard at the beginning of the
construction of the bridge deck (Figure 10.3 top).
10.3 The formwork system
The next step is the fabrication of the mould. A hydraulic steel formwork system is supported by two
skidding beams located directly under the webs. The bottom and outer side shutters can be stripped
downwards and sideways, whereas the internal shutters can be lifted and collapsed (Figure 10.4).

162
This formwork system is based on the formwork system that was used in the execution of the
Zeeburgerbrug (Lugthart, 1987). The big difference between both systems is a strip at the web‐floor
connection, of at least one meter width. This strip must prevent the fresh concrete in the floor from
rising, because of the large pressure that is exerted by the weight of the concrete being poured in the
web sections. The internal shutters rest on cones that are mounted on the floor shutters. At the top,
the cones are provided with rollers in order to be able to move the internal shutters from the
fabricated unit. The deck will be pushed from the rear by hydraulic jacks, which are clamped to the
sides of the skidding beams.
Figure 10.4: cross‐section of the box girder formwork
10.4 Casting of concrete
At this moment, the actual construction cycle of a deck segment can begin. A complete section will
be cast in a single pour to ensure fiber continuity by avoiding a cold joint in the box girder cross‐
section, and to take an activity away from the cycle to speed up production. The total volume of
concrete per segment is equal to: · 6.70 · 28.9 194 . When a complete segment should
be cast in a single day, the concrete batch plant should be able to produce and the workmen should
be able to pour 194 m3 concrete per day.
As any flow tends to align fibers in the direction of flow, care should be taken during concrete
pouring. In order to obtain the highest tensile and flexural properties, one should pour the concrete
in layers (Figure 10.5). Such an optimum fiber orientation may probably be difficult to achieve as the
presence of prestressing ducts and the complex shuttering for the box girder have an additional
influence on the flow of the fiber concrete.

163
Figure 10.5: pouring process of fiber concrete (Markovic, 2006).
It is important to achieve a homogeneous fiber distribution in all parts of the box girder. Too large
spaces without fibers, as well as fiber segregation should be avoided. The best possible solution is to
use self‐compacting concrete. This concrete flows under its own weight and fibers therefore may
orient in appropriate directions during flowing in the formwork. As no additional compaction is
required, fibers will remain in their original positions (Markovic, 2006).
10.5 Curing of concrete and heat treatment
Curing of concrete is essential for optimum hardening conditions. Optimum hardening will result in
optimum strength development and durability. Normal curing at 20 produces 30 at 24
hours after initial set and 150 at 28 days. A thermal treatment of 90 at 90% relative
humidity produces 180 at 48 hours after final set (Lafarge Ductal, 2009). An early
strength development is vital in order to be able to begin with the launch operation quickly. In order
to qualify the increase in strength of UHPFRC maturity monitoring can be envisaged.
The compressive stress in the concrete should be limited to 0.6 during construction, reduced to
0.55 if the element is less than 3 days old (Association Francaise de Génie Civil, 2013). The central
prestressing consists of 16 tendons with 49/16 mm cables and will introduce a compressive stress in
the concrete:
117600 · 13956.70 · 10
24 /
The central prestressing will be applied when the box girder is still supported by the skidding beams,
so no external additional compressive stresses will be present in the concrete. Since normal curing at
20 already produces 30 at 24 hours after initial set, prestressing can start after the
concrete has hardened for a full day.

164
When we assume a linear strength development, the concrete compressive strength 60 a
week later. The maximum concrete compressive stress will occur at the support when the cantilever
length reaches its maximum just before the steel nose reaches the next support and is equal to
(Appendix 23.1):
64 /
However, Figure 10.3 points out that it will take more than one week to reach the maximum
cantilever length. This means, that normal curing provides an early strength development, which is
sufficient to withstand the compressive forces during launch. Heat treatment is not required for
strength development.
10.6 Anchors and deviators
The central and continuity tendons will be applied outside the concrete cross‐section. They are
typically two spans long. Anchors and deviators will be positioned outside the concrete cross‐section
as well. However, the inside of the box girder needs to remain uniform in order to be able to use the
inner mould properly. Provisions for anchoring and deviating the tendons as shown in Figure 9.7 are
not possible. Provisions for anchors and deviators can be applied outside the cross‐section, but only
after the complete segment is cast and the inner mould is moved to the next segment.
Figure 10.6: a boss type anchor and deviator (Powell, et al., 1988)
Figure 10.6 shows the principle of a boss type anchor. This solution is used for bridge strengthening
and repair by adding external prestressing tendons to the existing bridge. Anchors and deviators are
prestressed to the existing webs or flanges. This system is advantageous, since the additional
prestress force can be distributed over a fairly long part of the structure. However, localized stresses
will still arise, which are additive to the existing state of stress.

165
Experience has shown that the clamping force should be at least two times the prestressing force to
create a good force transmission and bond between the boss and the structure (Powell, et al., 1988).
Additionally, if necessary, the surface could be slightly roughened. The same system could be used
for deviating devices (Figure 10.6 right).
Figure 10.7: ankerbus
Instead of drilling holes in the concrete cross‐section and using prestressing pins for the connection,
it might be better to make use of cast‐in provisions in the concrete: so‐called ankerbussen
(Figure 10.7) and bolts. When the segment is finished and the concrete has set, a steel plate can be
bolted to the box girder section to form a base for a steel construction that accommodates for the
anchor or deviator (Figure 10.8). The steel construction must have sufficient strength to transfer the
prestressing force to the concrete. The force will be transmitted by shear. The fiber concrete should
be perfectly able to distribute the localized stresses that will occur during this force transmission, and
no heavy ordinary reinforcement would be required. The bolts will be loaded in shear and must
provide resistance against slip.
Figure 10.8: provisions to anchor and deviate the tendons
The complete central and continuity tendon arrangement is shown in detail in Appendix 27 and 28.

166
10.7 Temporary launch bearings and launch procedure
The box girder slides over the bridge piers on temporary launch bearings, made of a high strength
concrete block covered with a stressed chrome‐steel plate. On top of these elements, steel
reinforced neoprene sliding plates, with a Teflon coating on one face, are inserted in a repeating
cycle to reduce friction during launch.
Every bridge pier requires a platform, which provides the necessary access to insert the sliding plates
and to position the jacks in order to remove the temporary bearings when the bridge is transferred
onto the permanent bearings. It would be obvious to use the platform of the bridge pier formwork.
The platforms on the bridge piers that are located on solid ground can be accessed by temporary
scaffolding. The access of the parts of the structure positioned above water depends on the chosen
method of execution for the substructure, that is with a temporary gangway (Figure 10.9) or with
floating equipment (Figure 10.10). During launch the launch operator is in contact with the personnel
on every bridge pier. They all have a kill switch to stop the launch operation in case of emergencies.
10.8 Sequence of work
Because no conventional reinforcement and shear reinforcement are required and prestressing will
be applied outside the concrete cross‐section, the production cycle of an ultra‐high performance
fiber‐reinforced concrete box girder will deviate from a conventional concrete box girder. The
sequence of work to cast the complete section in a single pour will be as follows:
1. Positioning all the shutters.
2. Assembling the tendon ducts at the deck and floor for the transverse prestressing and
assembling the cast‐in provisions for the anchors and deviators.
3. Casting the complete deck section over the full segment length.
4. Curing of concrete and carrying out heat treatment.
5. Installation of the transverse and central prestressing.
6. Lowering of the formwork.
7. Launching the deck forward by one increment.

167
Figure 10.9: a temporary gangway, which gives safe and reliable access to the substructure
Figure 10.10: bridge piers can only be accessed by boats
For The Zeeburgerbrug, a segment was constructed in a weekly cycle (Figure 10.11). Two and a half
days were available to assemble reinforcement and prestressing ducts. The weekends were
necessary for the concrete to develop sufficient strength to be able to apply the prestressing on
Mondays. Launching one segment of 29 meters long took approximately four hours (Lugthart, 1987).
Figure 10.11: the traditional weekly cycle, which was used for The Zeeburgerbrug
tasks
prestressing
lowering of formwork
launching by one segment
positioning of formwork
assembling reinforcement and prestressing ducts
casting of complete section
hardening of concrete
sa su momo tu we th fr

168
The use of UHPC enables a quicker cycle to shorten the total construction time. Instead of using the
weekends, just one full day of hardening should be enough for the concrete to develop sufficient
strength. Since conventional and shear reinforcement are not required, one day should be enough to
assemble the tendon ducts and cast‐in provisions. This leaves a full day to cast the complete section,
another full day to install the auxiliary steel construction to anchor or deviate the tendons and, lastly,
a full day to install the transverse and central prestressing and launch the bridge by one segment.
This will result in a five day cycle (Figure 10.12). However, when we adopt this five day cycle, there is
no room for errors. Each activity can only take place when the previous one is finished. They all form
one big critical path, and since this cycle includes shifts during the weekends, disturbance of the cycle
will immediately have consequences for the entire building schedule.
Figure 10.12: a five day cycle
With this in mind, it is better to use the weekly cycle of Figure 10.13, where the complete section is
cast on Thursday, curing of concrete takes place on Friday and the weekends remain empty and can
be used in case of an unexpected delay, for instance in the event of any problems with supply of
concrete. Heat treatment is not required for early strength development but may be carried out on
Friday to reduce any delayed time‐dependent deformations and to improve durability. The auxiliary
steel construction is connected to the inside of the box girder on Monday, and prestressing, lowering
of formwork and launching happens on Tuesday. On Wednesday the cycle starts again with
positioning of formwork and assembling ducts and cast‐in provisions.
Figure 10.13: a weekly cycle for the use of UHPC
tasks
prestressing
lowering of formwork
launching by one segment
positioning of formwork
assembling ducts and cast‐in provisions
casting of complete section
curing of concrete with optional heat treatment
installation of steel construction for anchor/deviator
sa su momo tu we th fr
tasks
installation of steel construction for anchor/deviator
prestressing
lowering of formwork
launching by one segment
positioning of formwork
assembling ducts and cast‐in provisions
casting of complete section
curing of concrete with optional heat treatment
mo tu we th fr sa su mo

169
11 Cost
This chapter provides the cost to produce and launch the UHPFRC box girder and compares them to
the cost of the design of The Zeeburgerbrug, which is an incrementally launched bridge built with
normal strength concrete.
11.1 Cost of production of UHPC and NSC
The cost of production of UHPC are many times higher than the cost of production of traditional
reinforced or prestressed concrete. Table 11.1 lists the cost of production of one cubic meter
unreinforced UHPC. These are the cost just after leaving the batch plant when the concrete is ready
to be cast in the box girder mould. As transportation distances are very short they are not taken into
account. The cost have been provided by Gerard Filé, cost engineer at Royal HaskoningDHV. The
quantities of the mixture components have been determined with Figure 5.2, which presents the
typical composition of Ductal UHPC.
UHPFRC B150
material quantity ppu (€) total (€)
cement 705 kg 0,120 84,60
sand/gravel 1010 kg 0,018 18,18
crushed quartz 210 kg 0,030 6,30
silica fume 230 kg 0,300 69,00
superplasticizer 17 kg 0,500 8,50
reinforcing steel 0 kg 1,000 0,00
steel fibers 190 kg 1,500 285,00
prestressing steel 0 kg 2,500 0,00
manufacture 1 30,00 30,00
transport 0 ‐ ‐
assembly 0 ‐ ‐
€ 502 cost per m^3 concrete
Table 11.1: cost of production of UHPC

170
Table 11.2 lists the cost of production of one cubic meter normal strength unreinforced concrete.
The cost of manufacture of normal strength concrete €15/ are considerably lower than for
UHPC €30/ , because there are no fibers present in the mixture.
NSC B45
material quantity ppu (€) total (€)
cement 350 kg 0,12 42,00
gravel 1200 kg 0,018 21,60
sand 600 kg 0,012 7,20
filler 25 kg 0,15 3,75
plasticizer 1 kg 0,5 0,50
reinforcing steel 0 kg 1 0,00
prestressing steel 0 kg 2,5 0,00
manufacture 1 15 15,00
transport 0 ‐ ‐
assembly 0 ‐ ‐
€ 90 cost per m^3 concrete
Table 11.2: cost of production of normal strength concrete
As shown in Table 11.1 & Table 11.2 the cost of production of UHPC are approximately five times
higher than of normal strength concrete. The question is: can these investments somehow be
recovered in the longer term to make a profitable design in UHPC? To answer this question, the
design of the UHPC box girder will be compared to the design of The Zeeburgerbrug by using them
for the case study and then integrating all cost into a price per cubic meter of concrete.
11.1.1 General properties of The Zeeburgerbrug
The Zeeburgerbrug has a total length of 1,182 meters. The launched part consists of two double cell
box girders of 864 meters long and has a typical span length of 58 meters. The spans are divided in
two segments with joints at one fourth of the span length. The bridge is designed with concrete
strength class B45. Auxiliary bridge piers were used to reduce peak bending moments during launch.

171
11.2 Cost components
11.2.1 Formwork
The cost per meter of formwork have been determined in paragraph 9.10. As both designs have
nearly the same span length and each span is cast in two segments, the length of the formwork will
be the same. The concrete cross‐section of The Zeeburgerbrug has about twice the area of the cross‐
section of the design in UHPC. Therefore, the cost of the formwork and foundation will be a lot
higher. The total cost of the formwork and foundation need to be divided by the total volume of
concrete to find the cost of formwork per cubic meter of concrete.
11.2.2 Reinforcement and prestressing
The Zeeburgerbrug contains 110 kg reinforcing steel, 15.6 kg central prestressing steel and 21.2 kg
continuity prestressing steel per cubic meter of concrete (van der Meulen, 1991).
The design in UHPC contains no ordinary reinforcing steel, 15 kg transverse prestressing steel, 140 kg
central prestressing steel for the first two spans, 35 kg central prestressing steel for the rear spans
and 53 kg continuity prestressing steel per cubic meter of concrete (Appendix 29).
11.2.3 Launching
Since the span length for both designs is almost equal and both designs have two segments per span,
the number of launch operations will be the same. However, the cost per launch operation may
differ. For traditional reinforced and prestressed concrete, the cost per launch operation have been
already discussed in paragraph 9.10. The weight of the UHPC box girder is fairly lower than of The
Zeeburgerbrug, which should benefit the launch process. For the design in UHPC, no longitudinal and
shear reinforcement are required, which should simplify execution. However, the casting and curing
of UHPC must be carefully carried out and may be time‐consuming. The total cost for all launch
operations should be divided by the total volume of concrete to find the launch cost per cubic meter
of concrete.
11.2.4 Nose
The steel nose that was used for the execution of The Zeeburgerbrug had a length of 18 meters. The
steel nose that will be used for the design in UHPC has a length of 15 meters. The cost of the steel
nose must be divided by the total volume of concrete to find the cost of the steel nose per cubic
meter of concrete.

172
11.2.5 Auxiliary bridge piers
During the execution of The Zeeburgerbrug, auxiliary bridge piers were used to control the bending
moments. The total cost for all auxiliary bridge piers need to be divided by the total volume of
concrete to find the cost of the auxiliary bridge piers per cubic meter of concrete.
11.3 Price index
The cost of all auxiliary bridge piers for The Zeeburgerbrug were 2,650,000. in 1985. These cost
must be multiplied by the price index over the period 1985 – 2015 to find cost that will apply
nowadays. Table 11.3 presents the price index for the construction cost of a bridge over the period
1995 – 2015.
Index 1995‐2015 (GWW 1995)
cost component estimated part (%) t = 0 (nov 95) t = 1 (jan 15) cost t = 0 (€) cost t = 1 (€)
personnel 40 100 171,5 40 68,60
fuel 1 100 223,1 1 2,23
steel 18 100 176,8 18 31,82
concrete 26 100 126,6 26 32,92
equipment 15 100 105,4 15 15,81
total 100 100 151,38
Table 11.3: price index construction cost 1995 – 2015
The price index for construction cost over the period 1985 – 1991 is 1.16 (van der Meulen, 1991).
When this development is extrapolated until 1995 a price index of 1.29 is found. Combining both
periods will give a price index of 1.96 for the period 1985 – 2015.
11.4 Comparing the designs in UHPC and NSC
When not just the cost of production, but also the cost of bridge execution are integrated in the
price, the outcome is completely different. Table 11.4 & Table 11.5 show that the cost per cubic
meter of UHPC have dropped from five times to twice the cost per cubic meter of NSC. The
difference in cost per square meter of bridge deck is even smaller: just 30 %. The complete
calculation can be found in Appendix 29. It should be said, however, that the cost per meter of
formwork and the cost per launch operation were held the same for both designs, and that possible
re‐use of central prestressing in the UHPC box girder design was not taken into account. Which
means, that a further reduction in cost per cubic meter of UHPC may be accomplished.

173
Incrementally launched UHPFRC box girder
material quantity ppu (€) total (€)
cement 705 kg 0,120 84,60
sand/gravel 1010 kg 0,018 18,18
crushed quartz 210 kg 0,030 6,30
silica fume 230 kg 0,300 69,00
superplasticizer 17 kg 0,500 8,50
reinforcing steel 0 kg 1,000 0,00
steel fibers 190 kg 1,500 285,00
prestressing steel 124 kg 2,500 309,10
manufacture 1 30,00 30,00
formwork 1 203,49
launching 1 103,10
nose 1 44,32
€ 1.162 cost per m^3 concrete
€ 502 cost per m^2 bridge deck
Table 11.4: integral cost of the incrementally launched UHPFRC box girder
As can be seen in Table 11.1, steel fibers are a major cost factor in the cost of production of UHPC.
There might be temptations to reduce the quantities. However, modifications in the fiber content
will induce drastic changes in material behavior. The higher cost of production need to be
compensated in a different way. The improved durability properties of UHPC compared to
conventional concrete could be a solution, because they can reduce the maintenance cost of the
structure significantly. Furthermore, the lower self‐weight of the UHPC box girder should enable the
engineer to design the substructure lighter to save more cost.

174
Design Zeeburgerbrug
material quantity ppu (€) total (€)
cement 350 kg 0,12 42,00
gravel 1200 kg 0,018 21,60
sand 600 kg 0,012 7,20
filler 25 kg 0,15 3,75
plasticizer 1 kg 0,5 0,50
reinforcing steel 110 kg 1 110,00
prestressing steel 37 kg 2,5 92,09
manufacture 1 15 15,00
formwork 1 100,49
launching 1 50,91
nose 1 38
auxiliary bridge piers 1 101
€ 582 cost per m^3 concrete
€ 394 cost per m^2 bridge deck
Table 11.5: integral cost of The Zeeburgerbrug design

175
12 Conclusion
The main goal of this research project was to determine whether UHPFRC can increase the
application range of incremental bridge launching and whether the combination results in an
economical bridge design in The Netherlands. To answer this question a case study approach was
used.
The following conclusions are based on the analysis of the cross‐sectional capacity, in longitudinal
direction, of simply supported concrete beams, which are loaded in pure bending.
An increase in concrete compressive strength only leads to a small increase in bending
moment capacity. The shear capacity is increased much more due to stronger concrete
compression struts. The higher strength of the concrete can only be utilized when the
amount of reinforcement or prestressing is increased.
(Ultra) High strength concrete box girders can hold such large prestressing forces that it may
not be possible to fit anchors and ducts inside the cross‐section, so prestressing needs to be
applied externally.
Fibers have a huge contribution to the total shear capacity of UHPFRC. Absence of fibers in
the concrete mixture or an unfavorable fiber orientation would have a detrimental effect on
the shear capacity.
Using very‐high performance fiber‐reinforced concrete instead of UHPFRC barely reduces the
longitudinal bending moment and shear capacity of the box girder.
The following conclusions are based on the prestressed UHPFRC single cell box girder design that is
used in the case study. This design is compared to the design of The Zeeburgerbrug, which used NSC,
by using them at the location of the case study.
Transverse prestressing is required to use UHPFRC efficiently and to transmit the mobile
loads through the webs to the substructure. In contrast to conventional concrete box girders,
transverse and shear reinforcement are not necessary.
The fibers make shear reinforcement unnecessary and therefore allow very thin web design.
The box girder can be launched without auxiliary supports.
A steel nose longer than approximately one fourth of the span length already becomes too
heavy and loses its purpose, and therefore is less effective than for traditional incrementally
launched bridges.
The required amount of central and continuity prestressing does not fit in the cross‐section.

176
Anchors and deviators do not fit in the concrete cross‐section and need to be positioned
outside the cross‐section as well. As the inside of the box girder needs to remain uniform in
order to be able to use the inner mould properly, anchors and deviators can only be installed
after the complete segment is cast and the inner mould is moved to the next segment.
As the box girder is designed without continuous longitudinal reinforcement, joints must
always remain compressed and positioned at locations where peak moments will not
develop.
A complete section can be cast in a single pour, which ensures fiber continuity by avoiding a
cold joint between the floor and the webs, and an activity can be taken away from the cycle.
Pouring concrete in layers may result in an optimum fiber orientation to obtain the highest
tensile and flexural properties.
Prestressing can start after the concrete has hardened for just one day when a normal curing
procedure is carried out. Heat treatment is not required for early strength development.
The traditional weekly cycle can be accelerated to a five day cycle to shorten the total
construction time. However, when we adopt this five day cycle, disturbance of the cycle will
immediately have consequences for the entire building schedule.
The cost of production of one cubic meter of UHPFRC, just after batching, are approximately
five times higher than the cost of producing the same amount of NSC. When execution cost
are integrated in the price, the cost per cubic meter of UHPFRC are reduced to approximately
twice the cost per cubic meter of NSC. The difference in cost per square meter of bridge deck
is even smaller: just 30 %.
The remaining part of the higher cost of production of UHPFRC need to be recovered in a
different way, for instance by savings in maintenance cost due to better durability properties
or by a lighter substructure as we are able to save a lot of weight in the superstructure.
When the superstructure is considered only, it may be hard to design and execute an UHPFRC
box girder, which is more economical than the design of The Zeeburgerbrug, which used NSC.
However, when the total bridge (including the substructure) is considered over the entire service
life we might have a competitive design.

177
13 Discussion
13.1 General remarks
Longitudinal reinforcement has proved to be unnecessary. However, the absence of reinforcement is
not just positive. Since there is no continuous reinforcement in the joints, tensile stresses will force
the joints to open and thus cannot occur. This means, that the tensile capacity of the concrete
cannot be used to generate savings in the amount of prestressing that is required.
The length of a segment is very important for the structural safety of the bridge. Joints should be
positioned away from locations where peak moments develop. For structural safety, it is best to work
with two segments per span. Even though this might not be the cheapest option, it creates the least
weak points in the structure.
It may be difficult to achieve an optimum fiber orientation, as the presence of prestressing ducts and
the complex shuttering for the box girder have an additional influence on the flow of the fiber
concrete. Since fiber orientation defines the mechanical behavior of UHPFRC it should be monitored
closely. In addition, it is important to achieve a homogeneous fiber distribution in all parts of the box
girder. Too large spaces without fibers and fiber segregation should be avoided. Self‐compacting
concrete can be an outcome, as it flows under its own weight and fibers therefore may align in
appropriate directions during flow. And since additional compaction is unnecessary, fibers will
remain in their original positions.
13.2 Limitations
While this study has tried to assess whether application of UHPFRC in incremental bridge launching
can result in economical bridge designs, the study itself was not completely free from limitations. For
one, there are still no (inter)national acknowledged regulations for designing with UHPFRC, making it
hard to prove that a structure has sufficient reliability. Work towards such regulations has recently
been conducted. (Association Francaise de Génie Civil, 2013) have developed recommendations for
designing with UHPFRC. This document is compatible with the Eurocode, the regulation document
for conventional concrete. (VSL Australia, 2000), the Australian office of the producer of Ductal
UHPFRC, has developed a design guideline for Ductal prestressed concrete beams, which is based on
the AFGC recommendations. These two documents are used for the design of the UHPFRC box
girder, however as these documents are not finalized it is hard to get an UHPFRC structure approved
by the authorities.

178
Another limitation of this study is the result of the limited literature available on box girder
distortion. This study has shown that bending moments in the deck and floor due to box girder
distortion are negligible. However, due to the limited literature available, the moment values are
based on a box girder with other dimensions than the UHPFRC box girder. This means that there
might be a slight deviation in the outcome.
Finally, for the launch phase, only the critical load case, where the box girder cantilever is maximum
and the steel nose ends just before the next support, has been addressed. The load case where the
steel nose has passed the next bridge pier was not considered.
13.3 Recommendations for further research
The analysis of the cross‐sectional capacity of a simply supported UHPFRC prestressed box girder,
loaded in pure bending, has revealed that a design in very‐high performance fiber‐reinforced
concrete will hardy affect the bending moment and shear capacity in longitudinal direction, just 3%
and 1% respectively. However, since there is no datasheet with the mechanical properties of a
VHPFRC mixture available, they have been obtained by reducing the mechanical property values of
UHPFRC by 20%. As the UHPFRC box girder can easily handle all compressive forces during launch
and lifetime and early strength development is not an issue, further work on using VHPFRC in the
design and execution, to save in cost of production, would be beneficial.
Until now, UHPFRC has not been applied on a large scale in The Netherlands. Due to strict rules
regarding quality control, UHPFRC is usually produced in a factory. To guarantee the reliability of the
material, one could investigate a different concept where the segments are precast in a factory, then
transported to the construction site and connected by external prestressing.
The optimization study of the nose has identified that a nose, which is longer than approximately one
fourth of the span length, becomes too heavy and loses its purpose, whereas for incrementally
launched bridges, designed in conventional concrete, the steel nose has usually a length of 60% of
the span length. In order to reach longer spans, and to save in the amount of central prestressing
that is required, further studies regarding possible weight reduction of the steel nose would be
worthwhile. Perhaps, a truss girder can provide the answer. Maybe it is even possible to reduce the
cantilever moment by combining a nose with guying from a mast. This, however, requires constant
adjustment to the forces in the cables during launch.

179
This study has shown that UHPC can easily handle the high prestressing forces, even after just one
full day of hardening. However, since the prestressing tendons are applied outside the concrete
cross‐section, the prestressing forces must be transferred to the concrete from steel auxiliary
constructions that are connected to the concrete with bolts and cast‐in provisions. The connection
might be a source of weakness, which has not been evaluated in the study. More research is required
to determine the limitations and failure mechanisms of this solution. If it proves to be able to
transfer such high prestressing forces into the concrete, even longer spans will be possible and
bridge spans that are build with precast elements, and therefore have limited span length due to
crane capacity and transport, can be outreached.
UHPC enables the box girder to be designed with light and slender elements. Due to the absence of
auxiliary supports, the first segments will be subject to very high compressive forces exerted by the
huge amount of central prestressing that is required to balance the massive cantilever bending
moment. This study does not include a check on buckling of the thin‐walled box girder. Further
research on the buckling capacity of an UHPC box girder needs to be carried out to determine
whether these high compressive forces will not cause instability.
The cost comparison has shown that the cost per cubic meter of UHPC are only twice the cost per
cubic meter of NSC when the cost of execution are also integrated in the price. However, the cost per
meter of formwork and the cost per launch operation were held the same for both designs, although
the superstructure of The Zeeburgerbrug is a lot heavier than the UHPC box girder, uses auxiliary
supports that need to be staffed during launch and possible reuse of central prestressing was not
taken into account. Therefore, further compensation of the higher cost of production of UHPC is
likely. More research is required to determine under what circumstances central prestressing may be
reused as continuity prestressing.
180
14 References
Association Francaise de Génie Civil, 2013. Ultra high performance fibre‐reinforced concretes ‐
recommendations. revised ed. Paris: AFGC.
Behloul, M., 1999. Design rules for DUCTAL prestressed beams, s.l.: s.n.
Bogue, R. & Lerch, W., 1934. Hydration of Portland Cement Compounds. Industrial & Engineering
Chemistry, 26(8), pp. 837‐847.
Bourne, S., Minto, B., Platt, F. & Slater, D., 2009. Design and construction of Clackmannanshire
Bridge, Scotland. Proceedings of the institution of Civil Engineers ‐ Bridge Engineering, 162(BE4), pp.
167‐187.
Burge, T. A., 1982. 14,000 psi within 24 hours. Concrete International , 5(9), pp. 36‐41.
CAE Nederland B.V., 2011. Rekenmodel VVUHSB. Cement, 60(3), pp. 50‐57.
Caffrey, J., Burton, T. & Higgins, J., 2003. Broadmeadow Estuary Bridge: Integration of Design and
Construction, Dublin: The Intitution of Engineers of Ireland ‐ Civil Division.
Cement, 1966. Access viaducts. Cement, 18(4‐5), pp. 225‐228.
Cement, 1990. Ringweg om Amsterdam voltooid. Cement, 42(10), pp. 8‐12.
Cement, 2012. Ultra hogesterktebeton. Cement, 64(6).
de Ridder, J., de Clercq, E. & Vanhaleweyk, J., 2003. Schuiven en vijzelen binnen de perken. Cement,
55(4), pp. 44‐47.
Dywidag‐Systems International, 2015. Dywidag Bonded Post‐Tensioning Systems using Strands.
[Online]
Available at: http://www.dywidag‐systems.com/
Eberwijn, J., 1984. Tendenzen in de bruggenbouw. Cement, 36(2), pp. 88‐93.

181
G.tecz Engineering, 2015. Quantz technology, the next generation of UHPC. [Online]
Available at: http://www.gtecz‐engineering.com/concrete‐technologies/quantz‐uhpc‐
technology/performance/
Hewson, N., 2003. Incrementally launched box girder bridges. In: Prestressed Concrete Bridges:
Design and Construction. London: Thomas Telford, pp. 262‐281.
Hofstede, K., Hok‐Bhe, T., Licht, R. & van Waarde, F., 2014. Van spoorstaafspanning naar
betonspanning. Cement, 66(6), pp. 45‐51.
Homberg, H. & Ropers, W., 1965. Fahrbahnplatten mit veränderlicher dicke. Berlin ‐ New York:
Springer ‐ Verlag.
Iversen, N., Faulds, J. & Rowley, F., 1993. Design and construction of the Dornoch Firth Bridge.
Proceedings of the Institution of Civil Engineers ‐ Transport, 100(3), pp. 133‐144.
Krebs, A. & Lindlar, H.‐G., 1988. Zur Profilverformung einzelliger Kastenträger. Beton‐ und
Stahlbetonbau, 83(1), pp. 13‐18.
Kuiper, B., 2003. Een reuze viaduct voor een wereldgigant. Cement, 55(6), pp. 24‐27.
Lafarge and Bouygues, 2015. Ductal. [Online]
Available at: http://www.ductal.com/wps/portal/ductal/2‐Structural
Lafarge Ductal, 2009. Technical Datasheet Ductal FM Grey, s.l.: Lafarge Ciments.
Lau, C., Hul, C., Wong, K. & Leung, Y., 2000. Prestressed concrete application in bridges in the Hong
Kong Airport Core Programme projects. Structural Concrete, 1(1), pp. 27‐45.
Leonhardt, F., 1979. Vorlesungen über Massivbau ‐ Sechster Teil: Grundlagen Des
Massivbruckenbaues. Berlin: Springer‐Verlag.
Locher, F., Richartz, W. & Sprung, S., 1976. Erstarren von Zement Toil 1: Reaktionen und
Gefugeentwicklung. Zement‐Kalk‐Gips, 29(10), pp. 435‐442.
Lugthart, J., 1987. Uitvoeringstechnische aspecten Zeeburgerbrug. Cement, 39(8), pp. 51‐55.

182
Mandic Ivankovic, A., Kresimir, I. & Martinkovic, B., 2014. Competitiveness and progress in
application of incremental bridge launching. 37th Madrid IABSE Symposium 2014, pp. 3‐10.
Markovic, I., 2006. High‐Performance Hybrid‐Fibre Concrete ‐ Development and Utilisation ‐ , Delft:
DUP Science.
Markovic, I., 2006. High‐Performance Hybrid‐Fibre Concrete: development and utilisation, Delft: DUP
Science.
Meester, H., 1979. Schuiven ‐ viaductenbouw zonder verkeersstremmingen. Cement, 31(5), pp. 215‐
219.
Nelissen, M., 1987. Doorbraak in toepassing van uitwendige voorspankabels. Cement, 37(12), pp. 56‐
59.
Oostra, A. J., 2014. Literature Review MSc Thesis: UHPFRC in incremental bridge launching, Delft: s.n.
Oostra, A. J., 2014. Literatuurstudie MSc Thesis ‐ UHPC in schuifbruggen, Amsterdam: s.n.
Powell, L., Breen, J. & Kreger, M., 1988. State of the art externally post‐tensioned bridges with
deviators, Austin: Center for transportation research, Bureau of engineering research, The university
of Texas at Austin.
Projectbureau ViA15, 2015. Doortrekkingsalternatief A15. [Online]
Available at: http://via15.nl/kaart/trace‐verlegde‐bocht.html
Projectbureau ViA15, 2015. ViA15. [Online]
Available at: http://www.via15.nl/
Quartel, K., 1989. Tweede van Brienenoordbrug snel klaar dankzij prefabricage. Cement, 39(3), pp.
10‐20.
Quartel, K., 2011. KW520: Ontwerp. Cement, 63(6), pp. 38‐44.
Reinhardt, H., 1985. Beton als constructiemateriaal ‐ eigenschappen en duurzaamheid. Delft: Delftse
Universitaire Pers.

183
Rijkswaterstaat, 2011. Richtlijnen Vaarwegen. Delft: RWS Dienst Verkeer en Scheepvaart.
Rijkswaterstaat, 2013. Richtlijnen Ontwerpen Kunstwerken. 1.2 ed. s.l.:RWS Dienst Infrastructuur.
Rijkswaterstaat, 2013. ViA15 Werktekening, Voorlopig Ontwerp. s.l.:s.n.
Rijkswaterstaat, 2015. A27: verbreding traject Houten ‐ Hooipolder. [Online]
Available at: http://www.rws.nl/wegen/plannen_en_projecten/a_wegen/a27/houten_hooipolder/
Rijkswaterstaat, 2015. Bezoekerscentrum Schiphol ‐ Amsterdam ‐ Almere. [Online]
Available at: http://bezoekerscentrum.rijkswaterstaat.nl/SchipholAmsterdamAlmere/?work=tweede‐
hollandse‐brug
Rosignoli, M., 1997. Influences of the incremental launching construction method on the sizing of
prestressed concrete bridge decks. Proceedings of the Institution of Civil Engineers ‐ Structures &
Buildings, 122(3), pp. 316‐325.
Savor, Z., 2008. Croatian Bridges designed by Structural department of Zagreb Civil Engineering
Faculty utilizing Sofistik software, Zagreb: University of Zagreb.
Schlaich, J. & Scheef, H., 1982. Concrete Box Girder Bridges. Stuttgart: International Association for
Bridge and Structural Engineering.
ten Voorde, A., Barten, P., Jansen, R. & Laurijsen, H., 2011. Brugligger zonder druklaag. Cement,
63(7), pp. 78‐82.
Thomaes, T., Janssen, H., Maas, P. & Robaard, M., 1974. Viaduct Ravensbosch; eerste toepassing
schuifmethode in Nederland. Cement, 26(3), pp. 102‐121.
van Breugel, K., 2013. Course CIE5110 ‐ Concrete, Science & Technology, s.l.: TU Delft.
van den Broek, H. & van den Hoonaard, J., 1975. De nieuwe brug over de IJssel bij Zutphen. Cement,
27(5), pp. 187‐197.
van der Horst, A. et al., 2012. Fietsbrug over de Deltawerken. Cement, 64(2), pp. 70‐73.
van der Horst, A. et al., 2012. Geribbelde en gelijmde moten. Cement, 64(5), pp. 56‐60.

184
van der Horst, A. et al., 2012. Voorspanning in fietsbrug. Cement, 64(3), pp. 18‐23.
van der Meulen, C., 1991. Optimalisering kokerbrug: voorstudie afstudeeropdracht, Tilburg: TU Delft,
Faculteit der Civiele Techniek, Vakgroep Mechanica en Constructies, Sectie Betonconstructies.
van der Meulen, C., 1992. Algemene ontwerpberekening prismatische kokerbruggen ‐ eindstudie,
Tilburg: s.n.
van der Veen, C., 2014. Course CIE5127 ‐ Concrete Bridges, s.l.: TU Delft.
van der Veen, C., 2014. Course CIE5127 ‐ Concrete Bridges, Delft: TU Delft.
Vermeulen, G., Kaptijn, N. & van der Veen, C., 1993. Uitwendige voorspanning in schuifbruggen.
Cement, 45(12), pp. 46‐51.
Virlogeux, M., 1993. Normandie Bridge Design and construction. Proceedings of the Institution of Civil
Engineers ‐ Structures & Buildings, 99(3), pp. 281‐302.
Virlogeux, M., 2002. New trends in prestressed concrete bridges. Structural Concrete, 3(2), pp. 67‐97.
Völkers, E., 2012. Nieuwe tuibrug in A50. Cement, 64(3), pp. 12‐17.
Vriend, H. d., 1975. Prefabricage of ter plaatse storten. Cement, 27(6), pp. 317‐320.
VSL Australia, 2000. Design guidelines for Ductal prestresed concrete beams, Sydney: School of Civil
and Environmental Engineering, The University of New South Wales.
VSL International LTD., 1977. The incremental launching method in prestressed concrete bridge
construction, Bern: Gerber AG, Schwarzenburg.
Walraven, J. C. & Braam, C. R., 2011. Course CIE4160: Prestressed Concrete ‐ Textbook, Delft: s.n.
Zellner, W. & Svensson, H., 1983. Incremental Launching of Structures. Journal of Structural
Engineering, 109(2), pp. 520‐537.