Ultra>Deep*Sea*Water*Buoy* - TI.com · The Buoy System1 is composed of four parts: the buoy, the...
68
University of Puerto Rico Mayagüez Campus Mayagüez, Puerto Rico Department of Electrical and Computer Engineering UltraDeep Sea Water Buoy by Manuel J. Orán Omar Roldán Rafael O. Vázquez (PM) Giovanni Viera Prepare for: Manuel Jiménez, TI Analog Design Contest Course: ICOM 5217, Section 086096 Date: June 2, 2011.
Transcript of Ultra>Deep*Sea*Water*Buoy* - TI.com · The Buoy System1 is composed of four parts: the buoy, the...
University of Puerto Rico
Mayagüez Campus
Mayagüez, Puerto Rico
Department of Electrical and Computer Engineering
Ultra-‐Deep Sea Water Buoy
by
Manuel J. Orán
Omar Roldán
Rafael O. Vázquez (PM)
Giovanni Viera
Prepare for: Manuel Jiménez,
TI Analog Design Contest
Course: ICOM 5217, Section 086-‐096
Date: June 2, 2011.

Ultra Deep-‐Sea Water Buoy 2 | P a g e
I. Abstract
The Ultra Deep Sea Water Buoy is an electronic device that collects and stores
oceanic data that can be used by oceanographers to predict natural disasters like
earthquakes and tsunamis. The device can be used as a buoy retrieval system, a data
gathering system or as both. As a buoy retrieval system the device is in charge of
activating the release mechanism once the buoy hits the ocean floor, when the buoy
reaches the surface it will start emitting RF signals with a strobe light for easy retrieval.
As a data gathering system the device collects the acceleration, temperature and pressure
that are being applied inside the system, later on that data can be collected through a
computer user interface. The data being measured by the accelerometer and the sensors of
pressure and temperature will be interpreted by the MSP430F5438 microcontroller and
saved on a 2GB SD card.

Ultra Deep-‐Sea Water Buoy 3 | P a g e
Table of Contents: I. Abstract ................................................................................................................................................... 2
II. Introduction ........................................................................................................................................... 4
III. Theory ................................................................................................................................................... 5
A. Buoy System ...................................................................................................................................... 5
B. Battery Monitor ................................................................................................................................. 5
C. Sensors ............................................................................................................................................. 10
D. Memory ........................................................................................................................................... 11
E. Wireless Communication ................................................................................................................. 12
IV. Discussion ........................................................................................................................................... 13
A. Block Diagram .................................................................................................................................. 13
B. Power Consumption ........................................................................................................................ 15
C. Driving Analysis ................................................................................................................................ 17
D. Timing Analysis ................................................................................................................................ 18
E. Memory Map ................................................................................................................................... 20
F. Hardware Schematic ........................................................................................................................ 21
G. Schematic Legend ............................................................................................................................ 22
H. Hardware Termination Level ........................................................................................................... 24
I. Operating Diagrams .......................................................................................................................... 25
J. Embedded Software Description: ..................................................................................................... 49
K. Software Termination Level ............................................................................................................. 50
L. Efficiency and Trustworthiness ........................................................................................................ 51
V. User Guide ............................................................................................................................................ 52
VI. Conclusion ........................................................................................................................................... 56
VII. References ......................................................................................................................................... 57
VIII. Appendix .......................................................................................................................................... 58
A. Components used in our device ...................................................................................................... 58
B. Part List ............................................................................................................................................ 63
C. Standoffs Plastic Short ..................................................................................................................... 64
D. Task Distribution .............................................................................................................................. 65
IX. Description of the Project ................................................................................................................... 67
X. TI Parts Explanation .............................................................................................................................. 68
Ultra Deep-‐Sea Water Buoy 4 | P a g e
II. Introduction
The inspiration for the project came from a visit to the physics department in
search of an idea. There we met with Dr. Wilford Schmidt, a Physical Oceanography
professor at the University of Puerto Rico at Mayaguez Campus. Dr. Schmidt is
currently working on a project called “Free-fall and on-bottom ADCM (Acoustic-
Doppler Current Meter) measurements in the Puerto Rico Trench” at 19.75° N,
66.40° W. The purpose of this ongoing project is to study the ocean floor of the ultra-
deep-sea water (>5000m). The study includes taking samples of the oceanic water,
sand composition, temperature and pressure.
The old system was composed of a buoy, an embedded circuitry and a load.
The system was thrown to the ocean with a free-fall motion to the bottom of the
ocean. When it makes contact with the ocean floor, a pre-programmed timer sends a
signal that releases the weights used for submersion allowing the buoy to come back
to the surface. The system’s strobes lights and RF beacon were always turned on
before the system was submerged; this causes the batteries to be drained quickly.
Our system solves the previous problems which were a lack of a user-
interface, a poor circuitry layout and a poor use of power. Our user interface connects
wirelessly through Xbees and communicates with the micro-controller to obtain the
data collected from the different sensors, make a diagnostic and finally run the main
program. With the use of a micro-controller we built a better, more robust and more
secure buoy system that worked according to the specifications.

Ultra Deep-‐Sea Water Buoy 5 | P a g e
III. Theory
A. Buoy System The Buoy System1 is composed of four parts: the buoy, the crystal sphere, the
load and the weight load. The buoy is responsible of increasing the buoyancy of the
whole system, it allows the system to come back to the surface once it doesn’t have a
weight load attached. Our device will be inside the crystal sphere which is the one that
protects it from water and from the huge amounts of pressure at the bottom of the ocean
floor. The load is an optional load that allows taking sand and water samples or measure
the pressure outside of the buoy. The weight load is the counter part of the buoy, if the
weight load weights more than the buoyancy of the buoy the system will sink to the
bottom of the ocean floor.
While we were designing the buoy we found out two important constraints in the
buoy system. One of them was the space that we had inside the sphere, we only had a 17
inches diameter sphere which restricted our space to a 10 by 11 in2 area to work on. The
second constraint was that the buoyancy of the whole system will be affected by the
weight of our circuit. If we used a lot of batteries the weight of the system will increase
and the buoys would need to be replaced so they could come back to the surface.
B. Battery Monitor
The Ultra Deep Sea Water Buoy has two different battery packs, one for the
system and one for the weight release mechanism. The battery pack of the weight release
mechanism will discharge in sea water and it will drain approximately around 200mA.
By having a separate battery pack for the system, a complete discharge of the release
mechanism batteries will not affect the system functionality.
Because of the application requirements a battery monitor chip would not be the
wisest way to implement the battery life estimation. There are two different battery packs 1 Buoy System-‐ Refer to the Figure X on the Appendix

Ultra Deep-‐Sea Water Buoy 6 | P a g e
of different batteries (Li-Ion Yuntong 3.7v @2650mAh and Li-Ion 3.7v@6Ah). This
means that the system will need two different kinds of battery chips for a battery life
analysis. The problem of having two different battery monitors is that it compromises the
application efficiency by adding more code to the system and the chip count increases.
Most of the battery monitor chips have features that are not needed in this application.
Battery manager chips estimate the battery life by measuring three parameters: voltage,
temperature and current. These three parameters are done by a built in ADC that
measures the battery voltage, the temperature through a thermo resistor and implements
the coulomb-counter 2 technique for current integration. All these parameters are
calculated over time, battery monitor chips feature its own registers and memory for data
logging and mathematical manipulation. The program that analyses the batteries
calculates more information than what the system requires to, leading to a higher power
consumption of the system. For example, the coulomb counting technique consists of
reading through an ADC the output of a small resistor in the anode of the battery. With
the voltage value obtained by the ADC at both points of the resistor and the value of the
resistor, the discharge current flowing out of the battery can be calculated. This
calculated current has to be stored in memory over time for an accurate integration. The
integration of the current with respect to time, estimates the charge left in the battery.
Since we have a limited space (17 in diameter sphere) and power efficiency is one
of the main characteristics of the system circuitry, the alternative method chosen consists
of measuring the batteries voltages across the Analog to Digital Converter. By only
taking into account the battery voltage for a battery life prediction the result may be
unreliable3 . Coulomb Counting is recommended for precise estimation, but it is not
necessary if other parameters in life estimation such a temperature are considered in the
analysis. In this application the only parameter read from the ADC is the battery voltage.
With this parameter and the temperature parameter, mathematical manipulations of the
2 Coulomb Counting : http://www.liionbms.com/php/wp_soc_estimate.php 3Accurately Measuring Charge Level: http://www.maxim-‐ic.com/app-‐notes/index.mvp/id/3958

Ultra Deep-‐Sea Water Buoy 7 | P a g e
LI- ION Battery Voltage vs Battery Life%4 characteristic curve make possible a precise
approximation. This way a single battery voltage measure from the ADC is sent through
the Xbee to the PC to perform the approximations of the measured value. With this
approach there is no battery life analysis code compromised in the system. All the battery
analysis software is in the PC not in the system code.
To read the battery voltage, a voltage divider is used such that the 3.3V reference
voltage is not exceeded .The input calibrating voltage is 4.095Vand the voltage divider
output gives 2.896V. For example, when the ADC reads 2.896V it has to be scaled up the
correction factor is added to the ADC measure to scale it up to the original voltage value
before the voltage divider.
Vin-Vout(voltage divider) = correctionFactor
Vout is the measure of the ADC (voltage divider output)
4.095-2.896=1.199
4.090-2.893 =1.197
4.070- 2.879= 1.191
4.000- 2.832= 1.168
3.900-2.761=1.139
3.850-2.726=1.124
3.800-2.690=1.111
Average Correction factor=1.161 for (4.095,3.450] interval
3.750-2.655=1.095
3.700-2.620=1.080
3.650-2.584=1.066
3.600-2.549=1.051
4 LI-‐ ION Bat Voltage vs Battery Life% :http://www.ibt-‐power.com/Battery_packs/Li_Ion/Lithium_ion_tech.html

Ultra Deep-‐Sea Water Buoy 8 | P a g e
3.550-2.514=1.036
3.500-2.478=1.022
3.450-2.443=1.007
Average Correction Factor =1.051 for (3.750,3.450] interval
3.350-2.372 = .978
3.300 -2.337 = .936
3.250 - 2.301 =.949
3.200 - 2.266 =.934
Average Correction Factor =.949 for (3.350,3.20] interval
The correction factors are applied in the ADC conversion formula.
batVoltage = ((ADCmeasurement / 4095) * 3.3) + correctionFactor.
LI- ION Battery Voltage vs Battery Life% Linearization code was performed as follows:
Figure 1: Characteristic Curve
2.5 2.6 2.7 2.8 2.9 3
3.1 3.2 3.3 3.4 3.5 3.6 3.7 3.8 3.9 4
4.1 4.2 4.3
0 20 40 60 80 100
Ba^ery Vo
ltage
Ba^eryLife%
Ba^ery Voltage vs Ba^eryLife% at 25 °C

Ultra Deep-‐Sea Water Buoy 9 | P a g e
During the Li-Ions battery life there are three different discharge rates as Figure 1.0
shows.
From the linear equation:
Vbat1 = BatLife*m + b
1. From 4.2v to 3.8v discharge rate of change
m1 = (3.8-4.2) / (20-0) = -.02
Let Vbat1 = 4.2, BatLife = 0
4.2 =0*(-.02) + b1
b1=4.2
Equation #1 : Vbat1= -.02*BatLife + 4.2
2. From 3.8v to 3.5v discharge rate of change
m2 = (3.5-3.8) / (90-20) = -.004286
Let Vbat2 =3.8, BatLife = 20
3.8 =20*(-.004286) + b2
b2=3.8857
Equation #2 : Vbat2= -.004286*BatLife + 3.8857
3. From 3.8v to 3.5v discharge rate of change
m3 = (3.0-3.5) / (100-90) = -.05
Let Vbat3 =3.5, BatLife = 90
3.5 =90*(-.05) + b3
b3=8

Ultra Deep-‐Sea Water Buoy 10 | P a g e
Equation #3 : Vbat3= -.05*BatLife + 8
The PC software5 uses the following derivation to make the approximation at
25 degrees Celsius. The corrected Voltage read by the ADC is the input of the
following functions sent to PC through Xbee.
From Equation #1: BatLife = (Vbat-4.2) / (-.02)
From Equation #2: BatLife = (Vbat-3.8857) / (-.004286)
From Equation #3: BatLife = (Vbat-8) / (-.05)
C. Sensors The Ultra Deep Sea Water Buoy contains the following analog sensors: the accelerometer
(ADXL335), temperature sensor (LM335A) and the pressure sensor (MP3H6115A). When
analog sensors are utilized their readings cannot be directly interpreted by a microcontroller. In
order to get the readings we need to use the Analog to Digital Converter (ADC) of the
microcontroller. The ADC of a microcontroller always uses a reference voltage called Vref to
compare a sensor reading. As a rule of thumb, the maximum value of a sensor reading should be:
!!!!
Vref, where n is the number of bits of the ADC
When an analog sensor takes a reading the ADC interprets that voltage as a quantized
number that number needs to be divided by the resolution of the ADC and then multiplied by Vref
to get the actual reading of the sensor. The reading that we obtain is a close approximation of the
actual reading of the sensor. If we take for example a LM335A in a 12 bit ADC and we measure a
2.76 V output from it the ADC will work as follows:
!"# !"#$%&'() !"#$%& = 3413.33, number converted by the ADC
5 Refer to The Flow Chart Page #43 to see the implementation
Ultra Deep-‐Sea Water Buoy 11 | P a g e
Now we need to interpret that quantized number to a function of the Vref voltage, to do this you
must divide the number by the ADC resolution
!"# !"#$%&'($) = 2! − 1, !ℎ!"! ! !" !ℎ! !"#$%& !" !"#$ !" !ℎ! !"#
!"# !"#$%&'($) = 2!" − 1 = 4095
!"#$ !"#$%&'# = !"#!.!!!"#$
= 0.8335 ∗ !"#$
This means that the actual reading of the LM335A is 0.8335 Vref, if we multiply by Vref = 3.30 V
!"#$%& !"#$%&' = 0.8335 ∗ 3.30 ! = 2.75 !
This gives us a very close approximation of the actual reading of the sensor
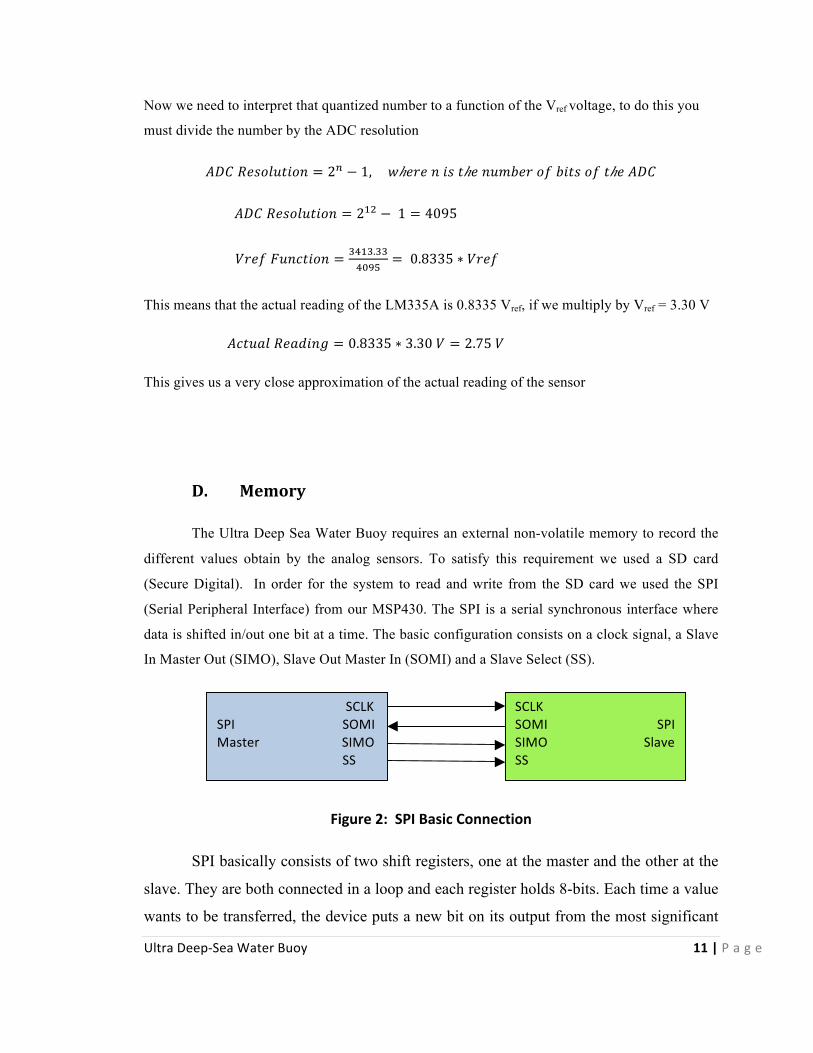
D. Memory The Ultra Deep Sea Water Buoy requires an external non-volatile memory to record the
different values obtain by the analog sensors. To satisfy this requirement we used a SD card
(Secure Digital). In order for the system to read and write from the SD card we used the SPI
(Serial Peripheral Interface) from our MSP430. The SPI is a serial synchronous interface where
data is shifted in/out one bit at a time. The basic configuration consists on a clock signal, a Slave
In Master Out (SIMO), Slave Out Master In (SOMI) and a Slave Select (SS).
Figure 2: SPI Basic Connection
SPI basically consists of two shift registers, one at the master and the other at the
slave. They are both connected in a loop and each register holds 8-bits. Each time a value
wants to be transferred, the device puts a new bit on its output from the most significant
SCLK SOMI SPI SIMO Slave SS
SCLK SPI SOMI Master SIMO SS

Ultra Deep-‐Sea Water Buoy 12 | P a g e
bit of the shift register when the clock has a negative edge. The data is read into the
lowest significant bit of the shift register on the positive edge of the clock. This means
that a bit is transferred on each direction during each clock cycle. Once the 8-bits are
filled, the contents of the registers have been transferred and the process is completed.
Figure 3: SPI between Master and Slave6
E. Wireless Communication Wireless is a type of communication in which the emitter and receiver are not
connected through a physical medium. Wireless communication utilizes the modulation
of electromagnetic waves through space. It allows the transfer of data over a certain
amount of distance where is impossible or impractical the use of wires. Our system
required a wireless communication module to be able to communicate with a computer to
extract and set parameters remotely without the need of having to compromise the rest of
the system. To accomplish this we used the Xbee technology which uses the IEEE
standard of 802.15.4. The 802.15.4 standard basically defines the physical layer and the
medium access controls of wireless personal networks (low-rate wireless personal area
network, LR-WPAN).
The Xbee module operates in the 2.4GHz with speeds of up 250kps. Before
starting any communication with the Xbee, they need to be setup. For our application the
master and slave configuration was not needed since both our act as transmitter and
receiver. As for the baud rate and channel id we set them to 9600 and 1515 respectively.
Another important thing that can be pointed out is that we are using the simple
configuration which includes VCC, GND, DI and DO. When data enters the RF module
6 This picture was taken from the MSP430 Microcontroller Basics by John Davis

Ultra Deep-‐Sea Water Buoy 13 | P a g e
through the DI (Data In) pin, the data is stored in the DI buffer until it can be processed.
To send data, the data enters the DO (Data Out) buffer and it’s sent out the serial port to
the receiving device. If the DO buffer reaches full capacity, any incoming RF data will be
lost.
IV. Discussion
A. Block Diagram
Figure 4: Block Diagram
Ultra Deep-‐Sea Water Buoy 14 | P a g e
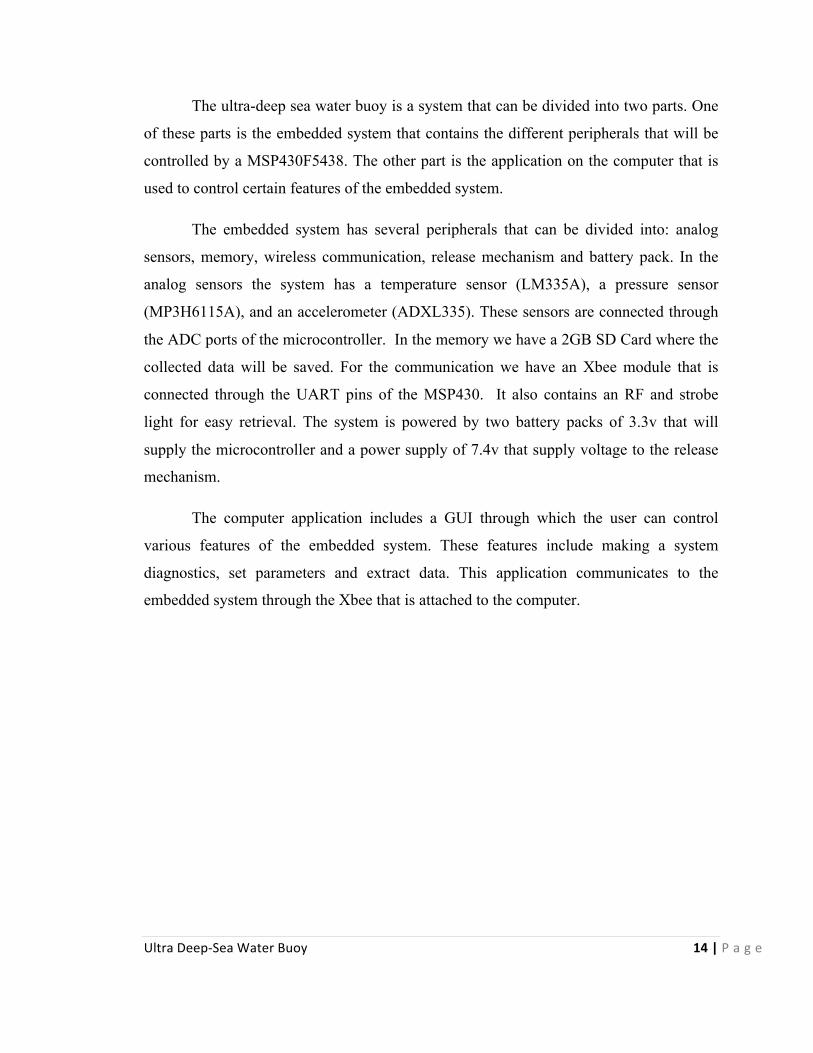
The ultra-deep sea water buoy is a system that can be divided into two parts. One
of these parts is the embedded system that contains the different peripherals that will be
controlled by a MSP430F5438. The other part is the application on the computer that is
used to control certain features of the embedded system.
The embedded system has several peripherals that can be divided into: analog
sensors, memory, wireless communication, release mechanism and battery pack. In the
analog sensors the system has a temperature sensor (LM335A), a pressure sensor
(MP3H6115A), and an accelerometer (ADXL335). These sensors are connected through
the ADC ports of the microcontroller. In the memory we have a 2GB SD Card where the
collected data will be saved. For the communication we have an Xbee module that is
connected through the UART pins of the MSP430. It also contains an RF and strobe
light for easy retrieval. The system is powered by two battery packs of 3.3v that will
supply the microcontroller and a power supply of 7.4v that supply voltage to the release
mechanism.
The computer application includes a GUI through which the user can control
various features of the embedded system. These features include making a system
diagnostics, set parameters and extract data. This application communicates to the
embedded system through the Xbee that is attached to the computer.
Ultra Deep-‐Sea Water Buoy 15 | P a g e
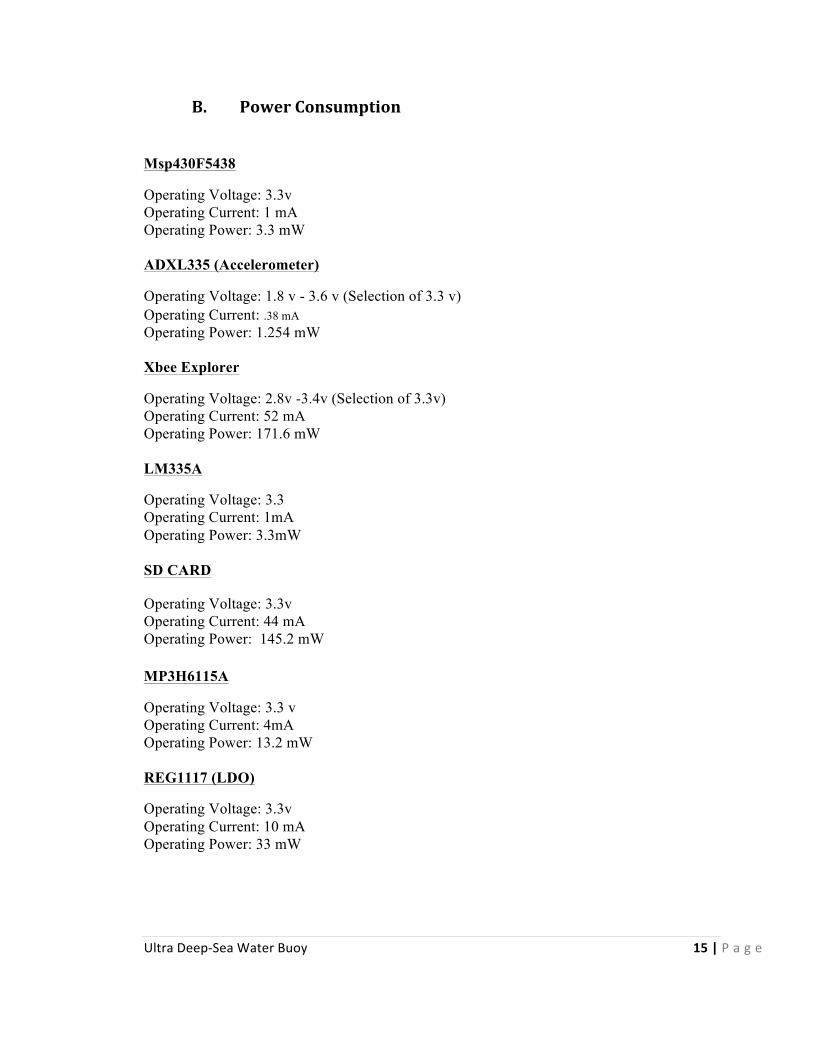
B. Power Consumption
Msp430F5438
Operating Voltage: 3.3v Operating Current: 1 mA Operating Power: 3.3 mW ADXL335 (Accelerometer)
Operating Voltage: 1.8 v - 3.6 v (Selection of 3.3 v) Operating Current: .38 mA Operating Power: 1.254 mW Xbee Explorer
Operating Voltage: 2.8v -3.4v (Selection of 3.3v) Operating Current: 52 mA Operating Power: 171.6 mW LM335A
Operating Voltage: 3.3 Operating Current: 1mA Operating Power: 3.3mW SD CARD
Operating Voltage: 3.3v Operating Current: 44 mA Operating Power: 145.2 mW MP3H6115A
Operating Voltage: 3.3 v Operating Current: 4mA Operating Power: 13.2 mW REG1117 (LDO)
Operating Voltage: 3.3v Operating Current: 10 mA Operating Power: 33 mW
Ultra Deep-‐Sea Water Buoy 16 | P a g e
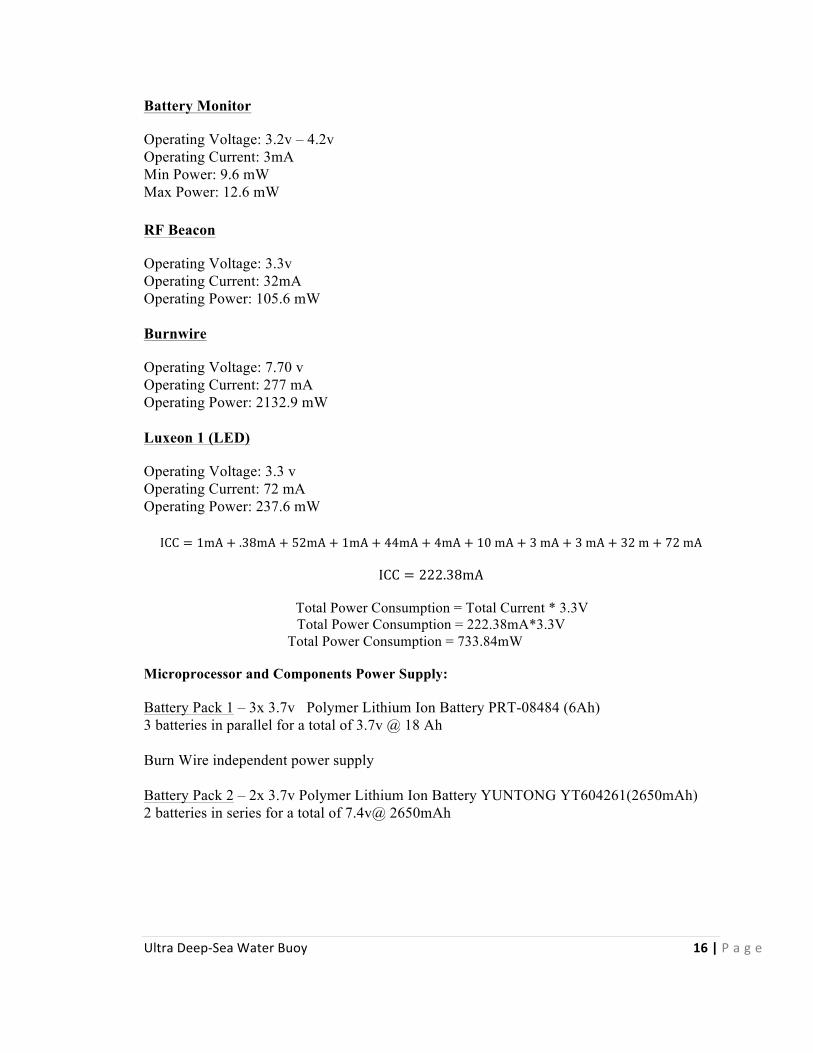
Battery Monitor
Operating Voltage: 3.2v – 4.2v Operating Current: 3mA Min Power: 9.6 mW Max Power: 12.6 mW RF Beacon
Operating Voltage: 3.3v Operating Current: 32mA Operating Power: 105.6 mW Burnwire
Operating Voltage: 7.70 v Operating Current: 277 mA Operating Power: 2132.9 mW Luxeon 1 (LED)
Operating Voltage: 3.3 v Operating Current: 72 mA Operating Power: 237.6 mW ICC = 1mA + .38mA + 52mA + 1mA + 44mA + 4mA + 10 mA + 3 mA + 3 mA + 32 m + 72 mA
ICC = 222.38mA
Total Power Consumption = Total Current * 3.3V Total Power Consumption = 222.38mA*3.3V
Total Power Consumption = 733.84mW
Microprocessor and Components Power Supply:
Battery Pack 1 – 3x 3.7v Polymer Lithium Ion Battery PRT-08484 (6Ah) 3 batteries in parallel for a total of 3.7v @ 18 Ah Burn Wire independent power supply Battery Pack 2 – 2x 3.7v Polymer Lithium Ion Battery YUNTONG YT604261(2650mAh) 2 batteries in series for a total of 7.4v@ 2650mAh
Ultra Deep-‐Sea Water Buoy 17 | P a g e
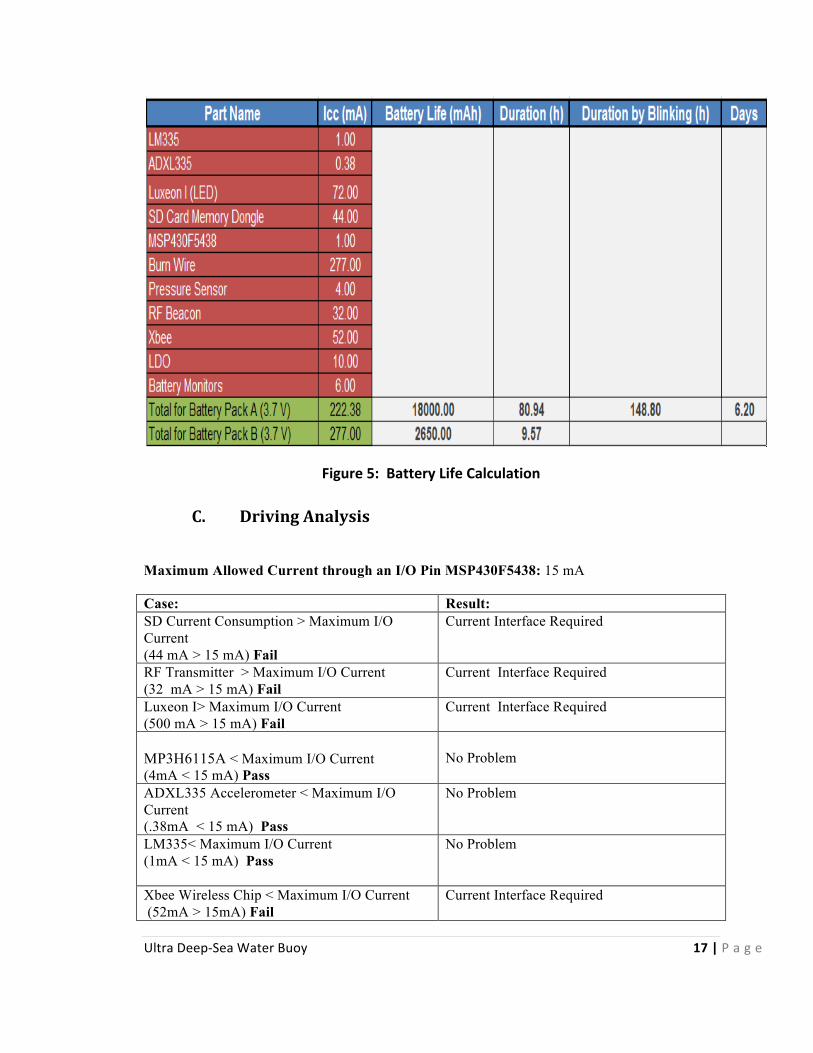
Figure 5: Battery Life Calculation
C. Driving Analysis
Maximum Allowed Current through an I/O Pin MSP430F5438: 15 mA
Case: Result: SD Current Consumption > Maximum I/O Current (44 mA > 15 mA) Fail
Current Interface Required
RF Transmitter > Maximum I/O Current (32 mA > 15 mA) Fail
Current Interface Required
Luxeon I> Maximum I/O Current (500 mA > 15 mA) Fail
Current Interface Required
MP3H6115A < Maximum I/O Current (4mA < 15 mA) Pass
No Problem
ADXL335 Accelerometer < Maximum I/O Current (.38mA < 15 mA) Pass
No Problem
LM335< Maximum I/O Current (1mA < 15 mA) Pass
No Problem
Xbee Wireless Chip < Maximum I/O Current (52mA > 15mA) Fail
Current Interface Required

Ultra Deep-‐Sea Water Buoy 18 | P a g e
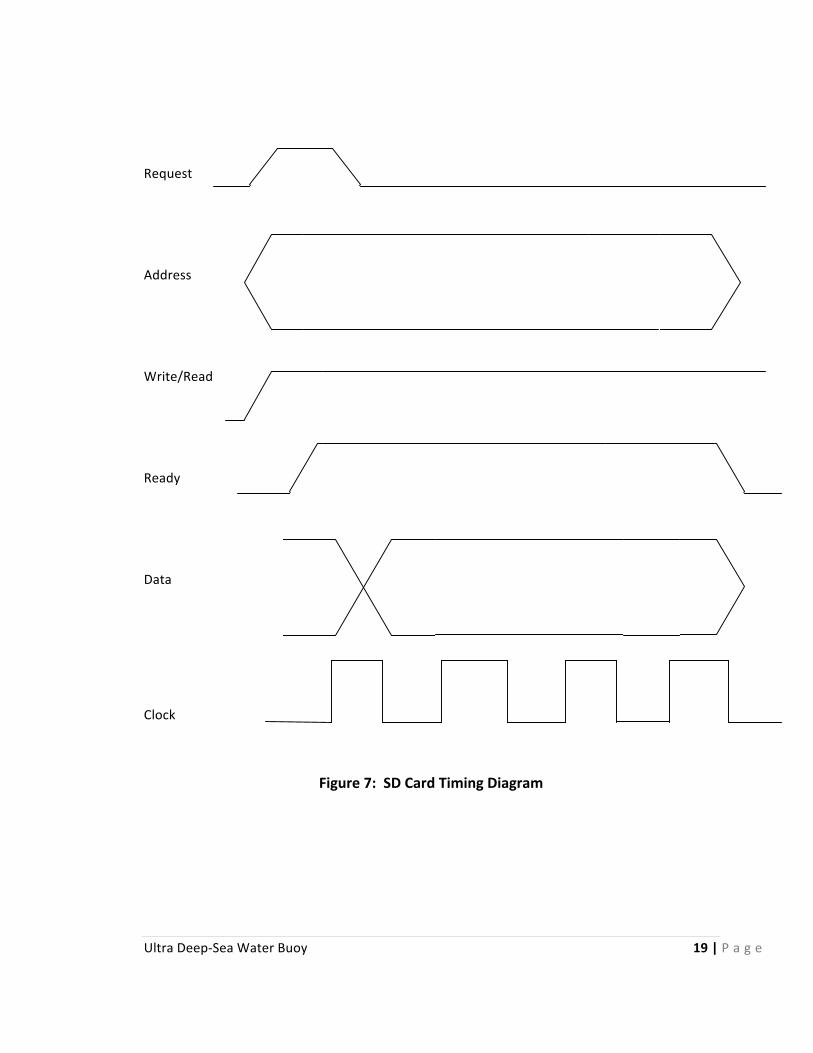
D. Timing Analysis
UCLK
SOMI
SIMO
Figure 6: SPI Master Timing
tvalid, MO
tsu,MI
tHD,MI
Ultra Deep-‐Sea Water Buoy 19 | P a g e
Request
Address
Write/Read
Ready
Data
Clock
Figure 7: SD Card Timing Diagram
Ultra Deep-‐Sea Water Buoy 20 | P a g e
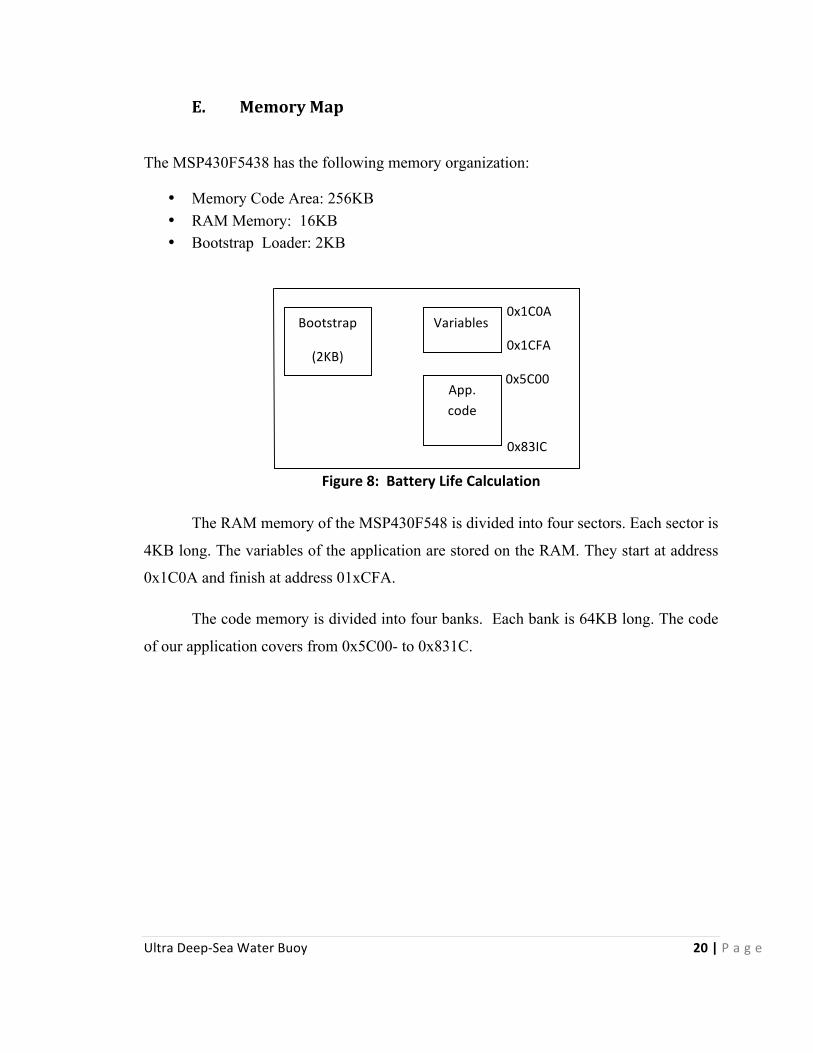
E. Memory Map
The MSP430F5438 has the following memory organization:
• Memory Code Area: 256KB • RAM Memory: 16KB • Bootstrap Loader: 2KB
0x1C0A
0x1CFA
0x5C00
0x83IC
Figure 8: Battery Life Calculation
The RAM memory of the MSP430F548 is divided into four sectors. Each sector is
4KB long. The variables of the application are stored on the RAM. They start at address
0x1C0A and finish at address 01xCFA.
The code memory is divided into four banks. Each bank is 64KB long. The code
of our application covers from 0x5C00- to 0x831C.
Bootstrap
(2KB)
Variables
App. code

Ultra Deep-‐Sea Water Buoy 21 | P a g e
F. Hardware Schematic
7
7 Bigger size available at the Appendix

Ultra Deep-‐Sea Water Buoy 22 | P a g e
G. Schematic Legend
ADXL335:
The ADXL335 is a low power 3-axis accelerometer. The accelerometer can measure
acceleration of gravity and dynamic acceleration. It measure acceleration between the
ranges from -3g to +3g. The output signal is a voltage that is proportional to acceleration.
The output for zero g is Vs/ for all supply voltages. The sensitivity of the output change
with the Vs for Vs=3.6V sensitivity is 360mV/g. For Vs=2V the sensitivity is 195mV/g.
LM335A:
The LM335A is an analog temperature sensor. It can operate from -40 Celsius to 100
Celsius. The sensor can be easily calibrated using two resistors. We calibrate it using a
variable resistance of 10KΩ and other resistor of 270Ω. With this configuration the
output sensitivity is proportionally to 10mV/K.
MP3H6115A:
The MP3H6115A is an analog pressure sensor for measuring absolute pressure. It
measure from 15 to 115kPa with an output from 0.12 to 2.8V. We interface it using a
51kΩ between the output pin and ground. The output sensitivity is 27mV/ kPa.
Vpack 5V Step-Up:
The Vpack 5V Step-Up is a DC to DC voltage converter. It converts the input voltage to
a higher voltage. The minimum input voltage to make it works is 1.0V. The output rage
is from 3V to 6.5V but it is default set to provide en output of 5V.
Luxeon I:
The Luxeon I is a high power LED. It provides light with a high flux density. The red
one has a range of lumens from 50 to 102 at Vs=3.3V. Since it requires too much current
to turn on we interface it using a 2n222 transistor with base resistance of 390Ω to drive it.
It is used as signaling LED.
Ultra Deep-‐Sea Water Buoy 23 | P a g e
REG1117:
The REG1117 is a low dropout regulator (LDO). The minimum dropout voltage is 1.2V.
The output can be adjusted to Vomax=13.8v from a Vinmax = 15v . The regulator is
interfaced with a 10µF electrolytic capacitor in Vin node, an equal capacitor in the GND
node and another equal capacitor in the Vout node. With the resistors we can vary the
output Voltage. The buoy implementation has fixed R’s values. With R1=115 Ω and
R2=187 Ω the output is fixed to 3.3v
Battery Monitor 1:
This circuit is a voltage divider of the input battery voltage. This is required to
meet the driving specification of the microcontroller. The voltage divider ha R1= 410.8 Ω
and R2=1k Ω.
Design Considerations and Reliability:
With the above information we can see that the sensors and devices chosen are
low power and energy efficient. Due to the weight and space limitations that our system
have, our design was based on low power consumption. By reducing the amount of
power consumed we managed to use fewer batteries than the previous design. The design
includes a system diagnostic feature that allows the user to verify if any component is
measuring properly. This feature also allows the user to verify the amount of charge left
on the batteries; if the batteries are low the system could be plugged in to charge the
batteries. Developing our system without a battery monitor would be a high risk because
the system could be left at the bottom of the ocean floor forever.
By having features like this, we make sure that the system is more reliable and secure for
investigation purposes.

Ultra Deep-‐Sea Water Buoy 24 | P a g e
H. Hardware Termination Level
The Ultra Deep-Sea Water Buoy has all the necessary hardware components for
the system to perform the essential task required by our customer. Our system is the
essential component of the “Buoy System” developed by Dr. Wilford Schmidt. The
system currently uses a 7.4V release mechanism but in a near future we will be adding a
12V release mechanism so that the burn wire could be released faster. Another feature we
will add in the future is a camera system which will be able to take pictures of living
organisms at the ultra deep depths.
Dr. Schmidt also wanted to add an IPhone feature capable of setting up all
the diagnostics and parameters instead of a computer. Even though this is not a critical
requirement is something that we are planning to incorporate in the near future.

Ultra Deep-‐Sea Water Buoy 25 | P a g e
I. Operating Diagrams
Function main:
This function will initialize the different components of the system. The components
include the Xbee, set the ADC registers, set the timer and the memory. Also this function
will enable the global interrupts of the microcontroller.
Start
Init. Xbee
Enable Xbee interrupts
Init. Memory
Set ADC registers
Enable ADC interrupts
Init. Timer
Enable Timer interrupts
Enable Global interrupts
Call diagnostic Call waitForInterrupts
Ultra Deep-‐Sea Water Buoy 26 | P a g e
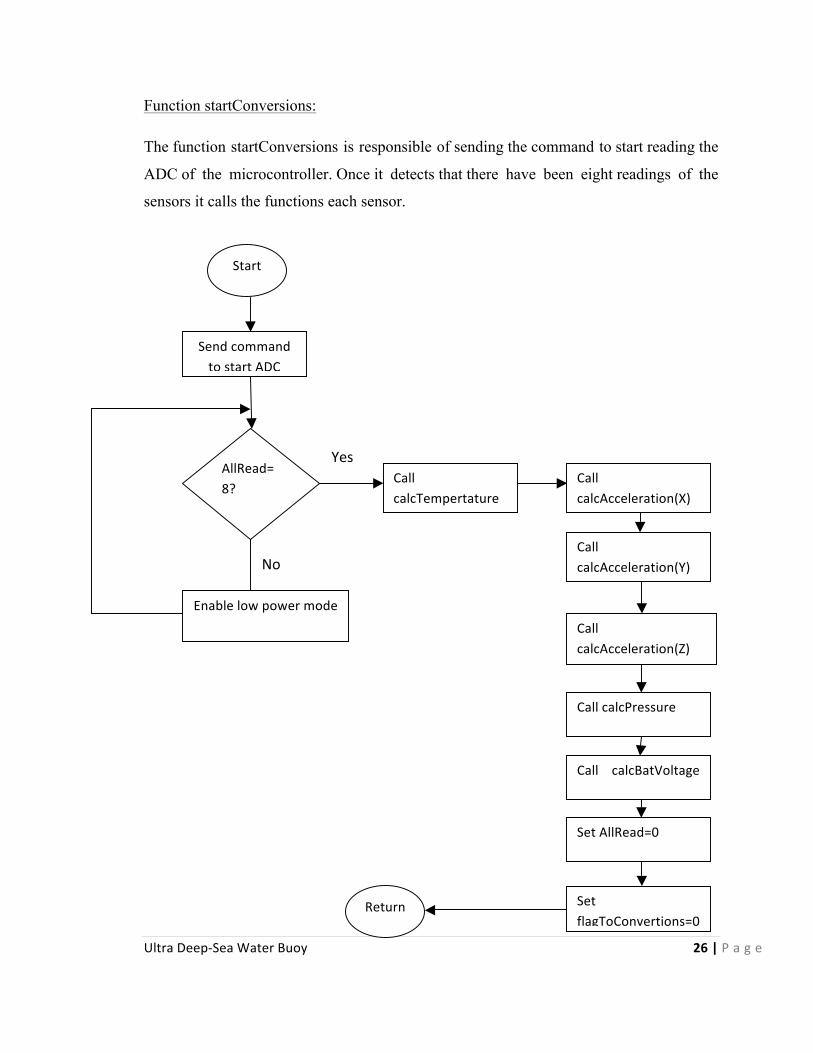
Function startConversions:
The function startConversions is responsible of sending the command to start reading the
ADC of the microcontroller. Once it detects that there have been eight readings of the
sensors it calls the functions each sensor.
Yes
No
Start
Send command to start ADC
AllRead=8?
Call calcTempertature
Call calcAcceleration(X)
Call calcAcceleration(Y)
Call calcAcceleration(Z)
Call calcPressure
Call calcBatVoltage
Set AllRead=0
Set flagToConvertions=0
Return
Enable low power mode

Ultra Deep-‐Sea Water Buoy 27 | P a g e
Function waitForInterrupts:
This function will wait for interrupts to occur. Once a timer interrupt occur the timer ISR
will set a flag. This function will be pending if that flag change in value. If change it will
call the function to start conversions and places the flag=0. If the flag does not change its
value send the microcontroller to low power mode.
YES
NO
Start
startConvertionsFlag=1
Call startConvertions
startConvertionFlag=0
Enable low power mode
Ultra Deep-‐Sea Water Buoy 28 | P a g e
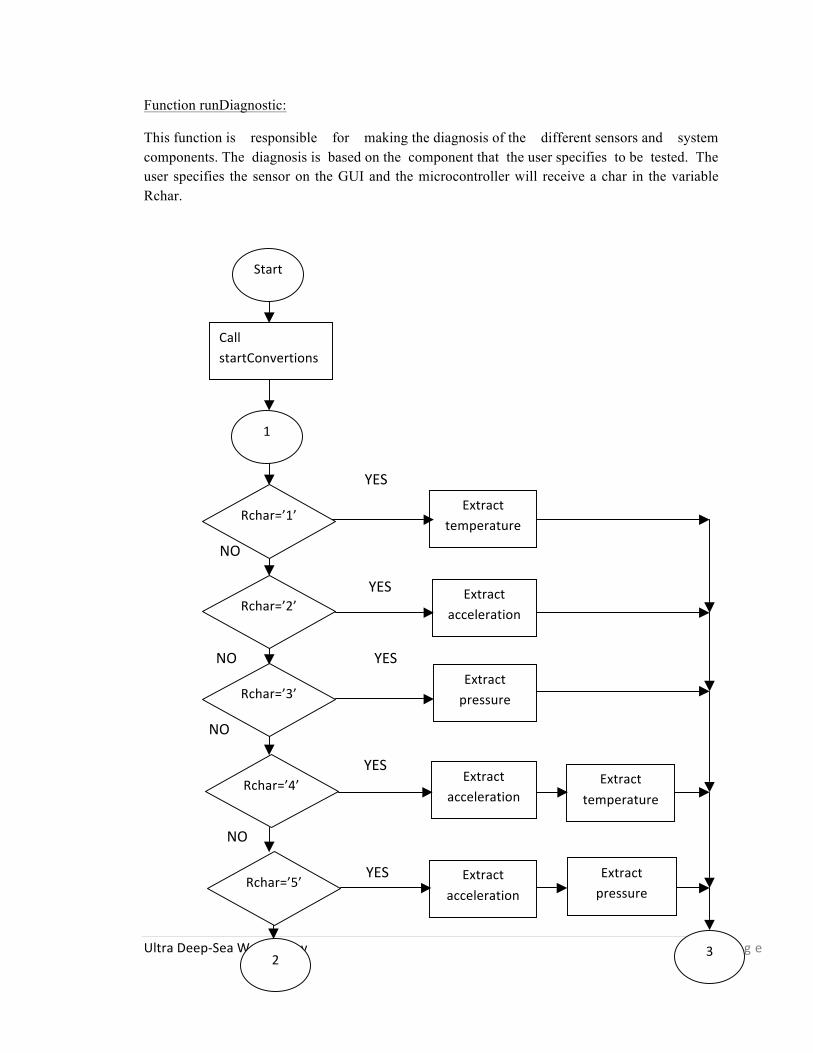
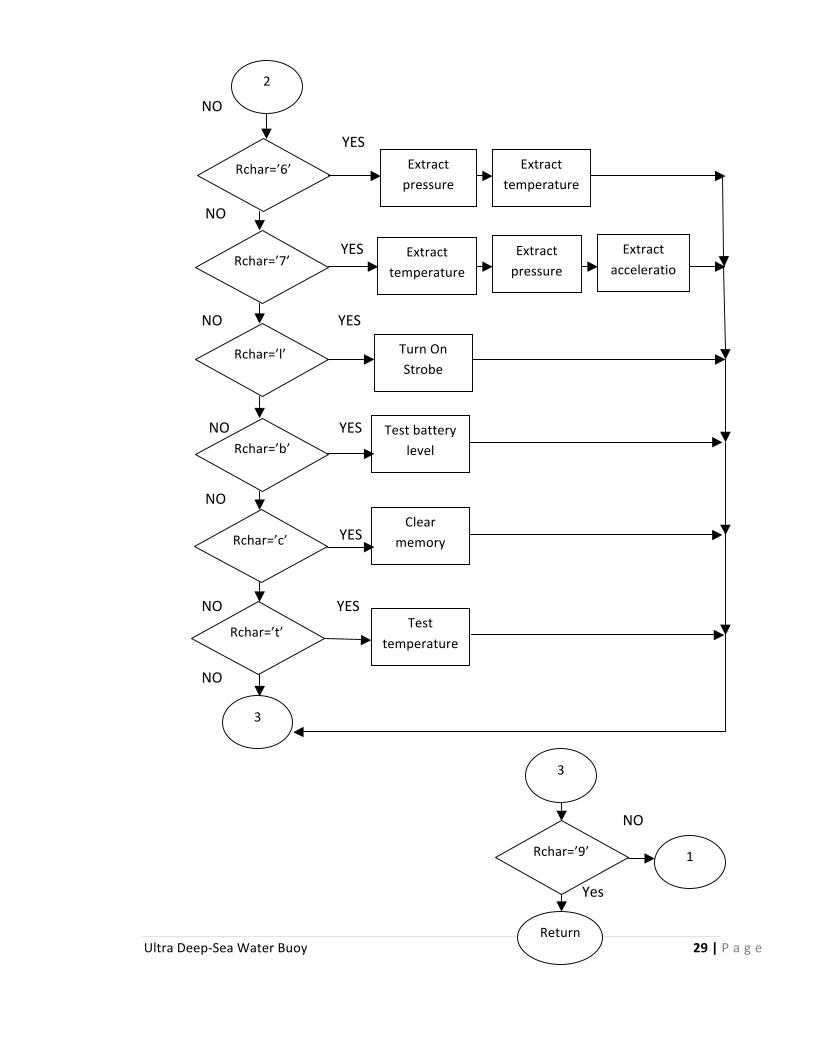
Function runDiagnostic:
This function is responsible for making the diagnosis of the different sensors and system components. The diagnosis is based on the component that the user specifies to be tested. The user specifies the sensor on the GUI and the microcontroller will receive a char in the variable Rchar.
YES
NO
YES
NO YES
NO
YES
NO
YES
Start
Call startConvertions
Rchar=’1’
Rchar=’2’
Rchar=’3’
Rchar=’4’
Rchar=’5’
1
2
Extract temperature
Extract acceleration
Extract pressure
Extract acceleration
Extract temperature
Extract acceleration
Extract pressure
3
Ultra Deep-‐Sea Water Buoy 29 | P a g e
NO
YES
NO
YES
NO YES
NO YES
NO
YES
NO YES
NO
NO
Yes
2
Rchar=’6’
Rchar=’7’
Rchar=’l’
Rchar=’b’
Rchar=’c’
Rchar=’t’
Rchar=’9’
3
3
Extract pressure
Extract temperature
Extract pressure
Extract acceleratio
n
Turn On Strobe
Test battery level
Clear memory
Test temperature
1
Return
Extract temperature
Ultra Deep-‐Sea Water Buoy 30 | P a g e
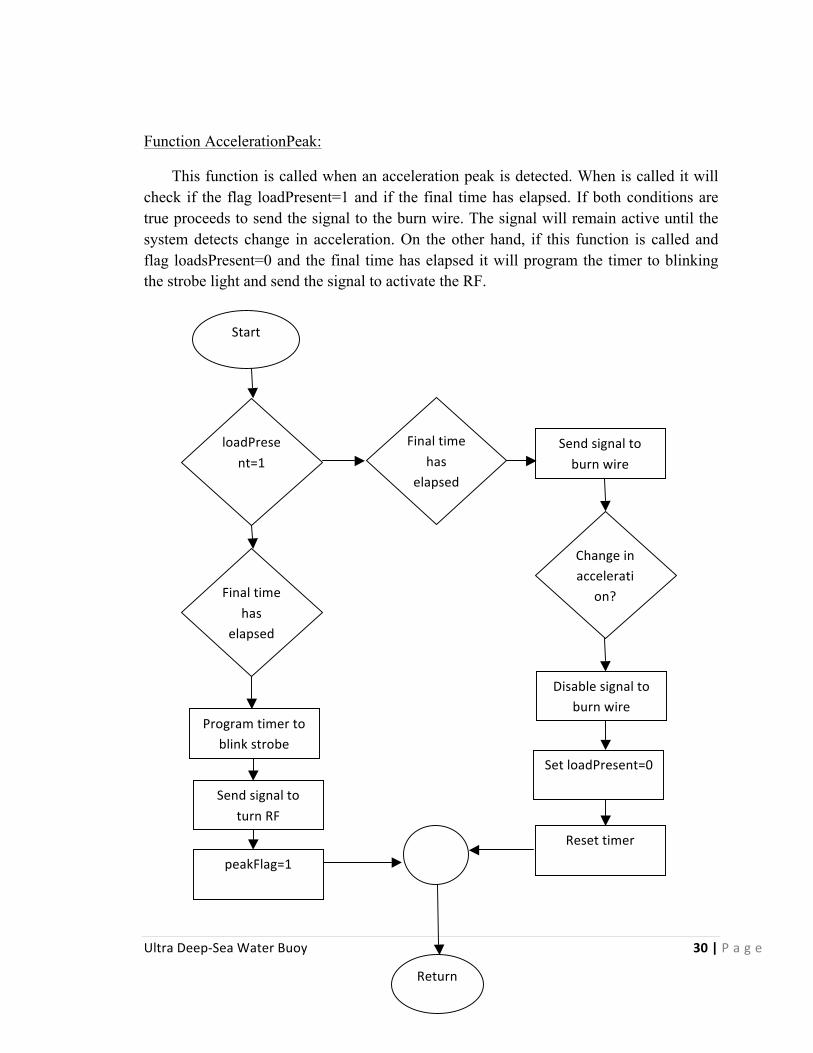
Function AccelerationPeak:
This function is called when an acceleration peak is detected. When is called it will check if the flag loadPresent=1 and if the final time has elapsed. If both conditions are true proceeds to send the signal to the burn wire. The signal will remain active until the system detects change in acceleration. On the other hand, if this function is called and flag loadsPresent=0 and the final time has elapsed it will program the timer to blinking the strobe light and send the signal to activate the RF.
Start
Final time has
elapsed
loadPresent=1
Send signal to burn wire
Change in accelerati
on?
Disable signal to burn wire
Set loadPresent=0
Reset timer
Final time has
elapsed
Program timer to blink strobe
Send signal to turn RF
peakFlag=1
Return
Ultra Deep-‐Sea Water Buoy 31 | P a g e
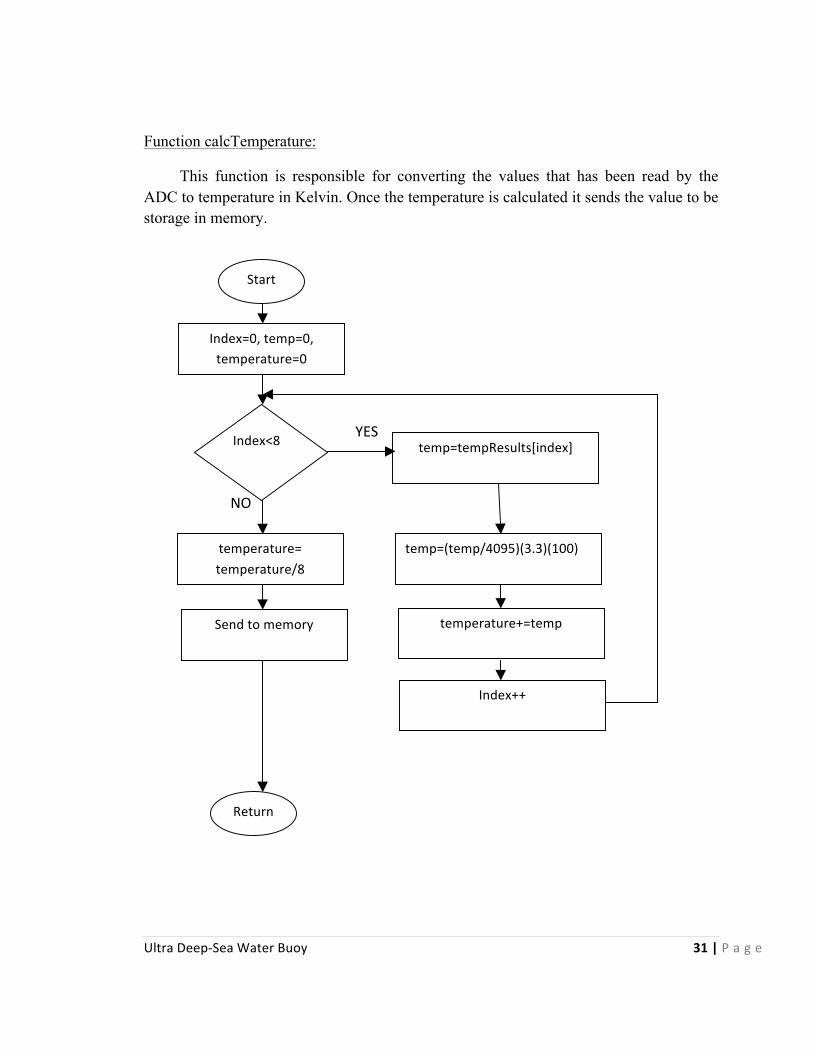
Function calcTemperature:
This function is responsible for converting the values that has been read by the ADC to temperature in Kelvin. Once the temperature is calculated it sends the value to be storage in memory.
YES
NO
Start
Index=0, temp=0, temperature=0
Index<8 temp=tempResults[index]
temp=(temp/4095)(3.3)(100)
temperature+=temp
Index++
temperature= temperature/8
Send to memory
Return
Ultra Deep-‐Sea Water Buoy 32 | P a g e
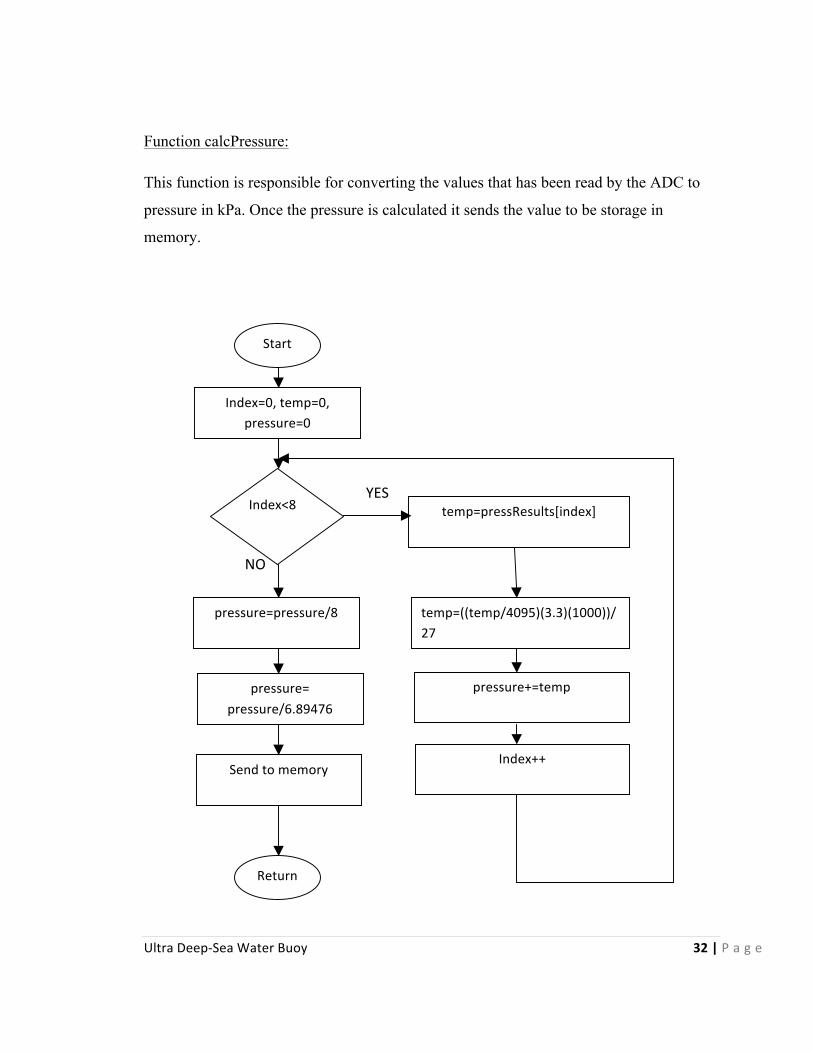
Function calcPressure:
This function is responsible for converting the values that has been read by the ADC to
pressure in kPa. Once the pressure is calculated it sends the value to be storage in
memory.
YES
NO
Start
Index=0, temp=0, pressure=0
Index<8 temp=pressResults[index]
temp=((temp/4095)(3.3)(1000))/27
pressure+=temp
Index++
pressure=pressure/8
pressure= pressure/6.89476
Return
Send to memory

Ultra Deep-‐Sea Water Buoy 33 | P a g e
Function calcAcceleration:
This function is responsible for converting the values that have been read by the
ADC to acceleration in g’s. Once the acceleration is calculated it sends the value to be
storage in memory. If this function determines a negative acceleration peak it will call
the function acceleration peak.
YES
NO
Start
Index<8 temp=accResults[index]
temp=((temp/4095)(3.3)-‐1.65
acceleration+=temp
Index++
acceleration= acceleration/8
1
Index=0, temp=0, acceleration=0
temp=temp*1000/330

Ultra Deep-‐Sea Water Buoy 34 | P a g e
YES
NO
YES
NO
NO
YES
1
Axis=x
Axis=z
accY<0
accX=acceleration
accZ=acceleration
Save to memory
accZ= accZ/2.45
accY=acceleration Save to memory
Call accelerationPeak
Return
Save to memory
Ultra Deep-‐Sea Water Buoy 35 | P a g e
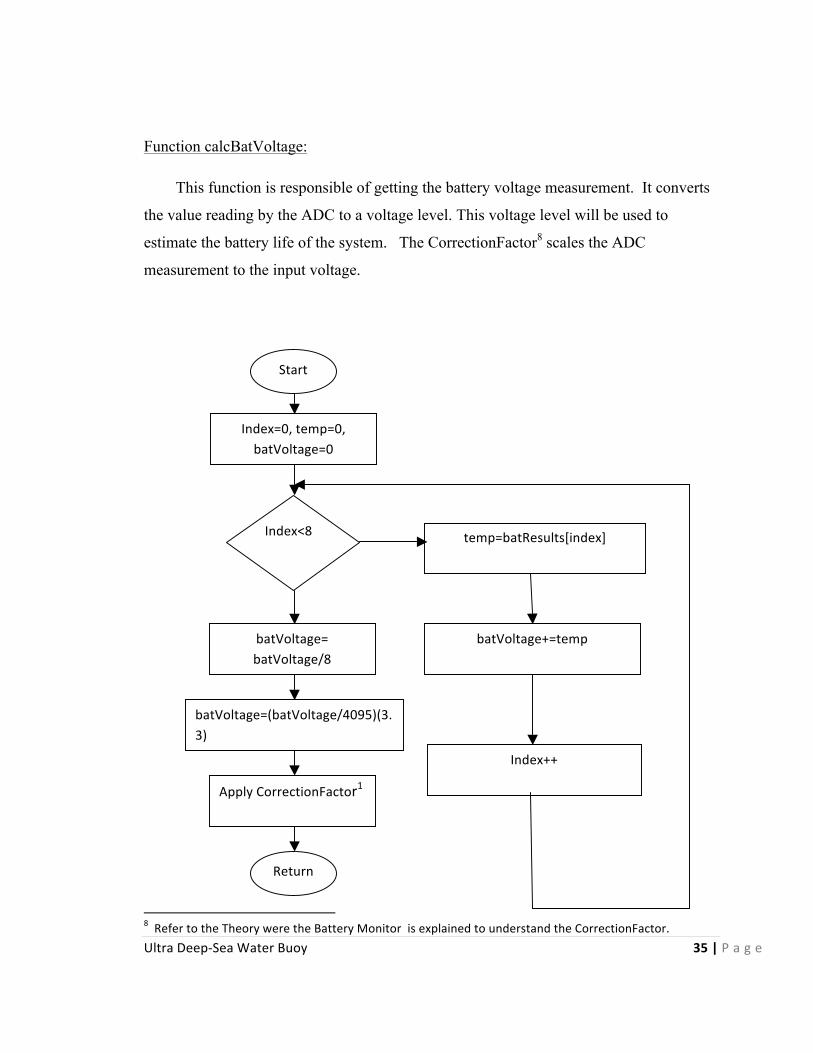
Function calcBatVoltage:
This function is responsible of getting the battery voltage measurement. It converts
the value reading by the ADC to a voltage level. This voltage level will be used to
estimate the battery life of the system. The CorrectionFactor8 scales the ADC
measurement to the input voltage.
8 Refer to the Theory were the Battery Monitor is explained to understand the CorrectionFactor.
Start
Index=0, temp=0, batVoltage=0
Index<8 temp=batResults[index]
batVoltage=(batVoltage/4095)(3.3)
batVoltage+=temp
Index++
batVoltage= batVoltage/8
Apply CorrectionFactor1
Return

Ultra Deep-‐Sea Water Buoy 36 | P a g e
Function Transmit:
This function is responsible of communicating the microcontroller with the PC application. The main task is to sending the data thought the transmission buffer (TX) r to the received buffer (RX) of the Xbee that is connected to the computer.
NO
YES
YES NO
Start
Prepare the byte to be transmitted
All bytes are already
transmitted?
Transmission buffer is ready?
Transmit byte
Return
Ultra Deep-‐Sea Water Buoy 37 | P a g e
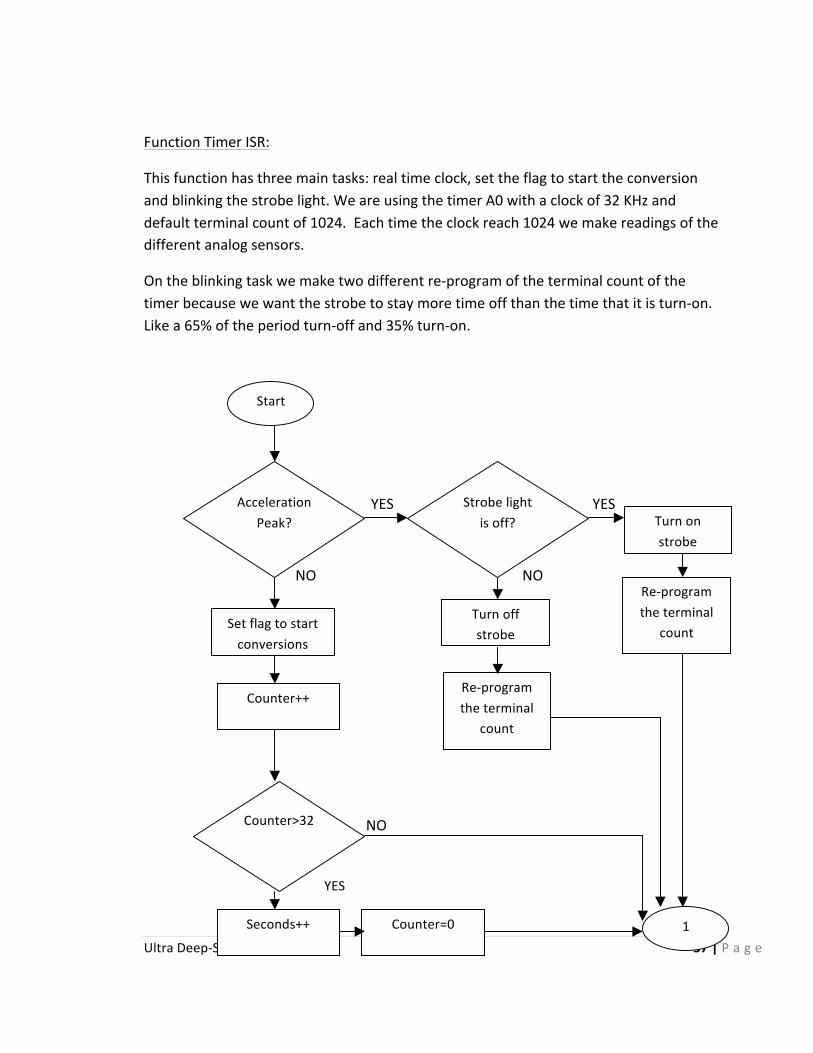
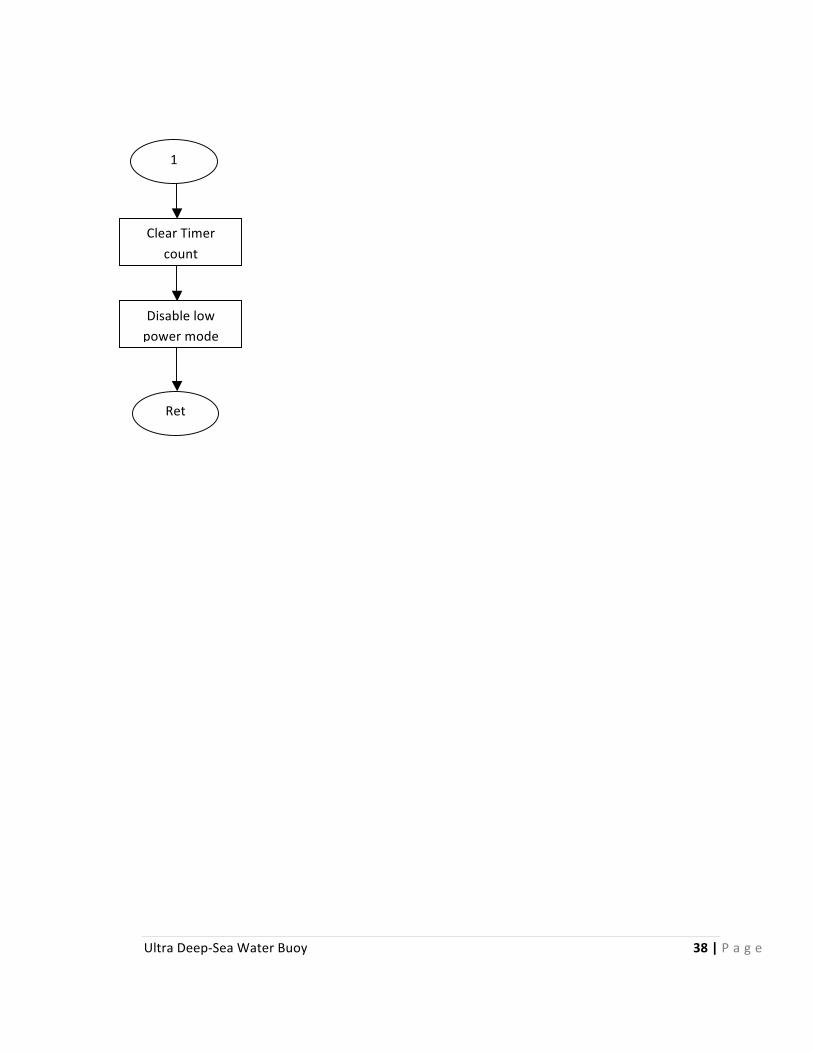
Function Timer ISR:
This function has three main tasks: real time clock, set the flag to start the conversion and blinking the strobe light. We are using the timer A0 with a clock of 32 KHz and default terminal count of 1024. Each time the clock reach 1024 we make readings of the different analog sensors.
On the blinking task we make two different re-‐program of the terminal count of the timer because we want the strobe to stay more time off than the time that it is turn-‐on. Like a 65% of the period turn-‐off and 35% turn-‐on.
YES YES
NO NO
NO
Start
Acceleration Peak?
Strobe light is off? Turn on
strobe
Re-‐program the terminal
count Turn off strobe
Re-‐program the terminal
count
Set flag to start conversions
Counter++
Counter>32
1 Seconds++ Counter=0
YES
Ultra Deep-‐Sea Water Buoy 38 | P a g e
1
Clear Timer count
Disable low power mode
Ret

Ultra Deep-‐Sea Water Buoy 39 | P a g e
Function ADC12 ISR:
This function is responsible to handle the analog to digital converter (ADC) interrupt. When the interrupt occur this ISR will storage the values contained on the ADC register to an array for future calculations. Also this function will set a flag to indicate that eight readings of the analogs sensors have been done.
Start
Index=0
Storage the ADC registers on the different arrays
Index++
Index=8?
Set allReads flag=1
Index=0
Disable Low power mode
Ret

Ultra Deep-‐Sea Water Buoy 40 | P a g e
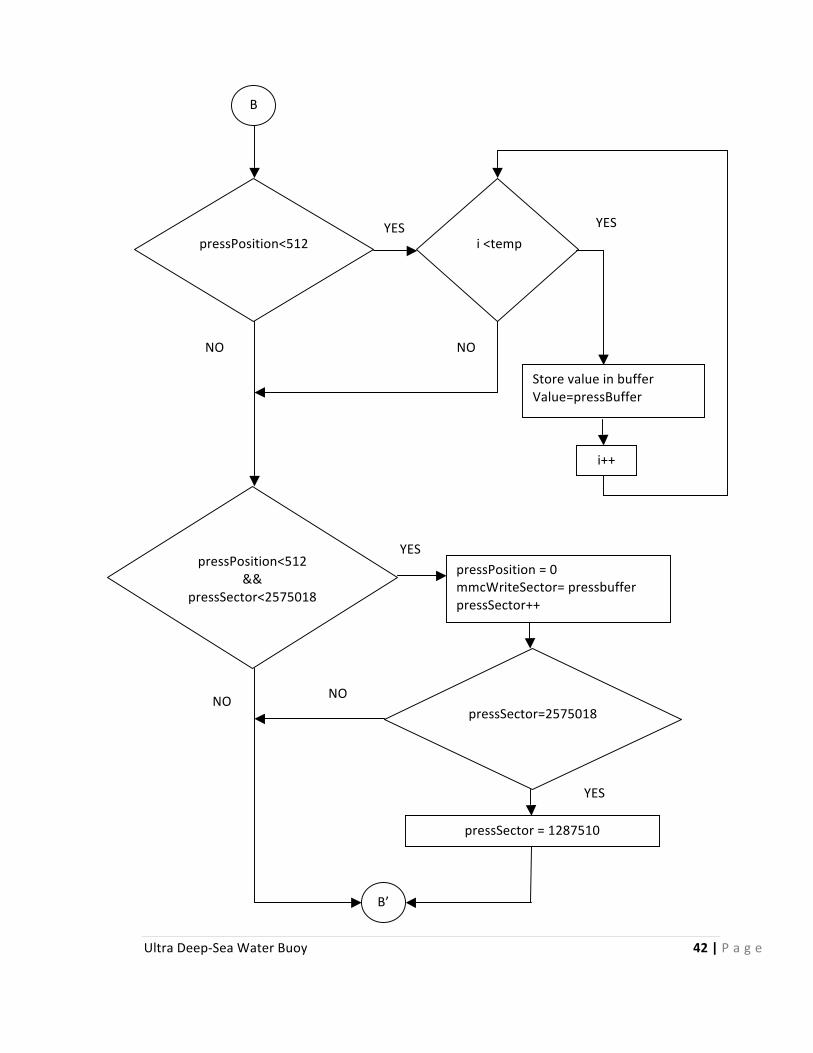
Function saveData:
The function saveData takes two parameters, a float number “value” and an integer
“type”. The float number will be the data to be saved and the integer is the type of data
to be saved. The purpose of this function is to save the value to an SD card.
NO
NO
Start
Set temporary variables:
int temp= 0, char toSave[10], temp = size(toSave) i=0
type == 1 (Pressure)
A
B
type == 2 (Temperature)
YES
YES
C
YES
type == 0 (Acceleration)
A’
B’
C’

Ultra Deep-‐Sea Water Buoy 41 | P a g e
accPosition<512
A
i <temp
Store value in buffer value-‐>accBuffer
i++
YES
accPosition<512
&& accSector<1237509
accPosition -‐> 0 mmcWriteSector -‐> buffer accSector++
accSector=123750
9
accSector =0
A’
YES
NO NO
YES
NO NO
YES
Ultra Deep-‐Sea Water Buoy 42 | P a g e
pressPosition<512
B
i <temp
Store value in buffer Value=pressBuffer
i++
YES
pressPosition<512
&& pressSector<2575018
pressPosition = 0 mmcWriteSector= pressbuffer pressSector++
pressSector=2575018
pressSector = 1287510
B’
YES
NO NO
NO
YES
NO
YES

Ultra Deep-‐Sea Water Buoy 43 | P a g e
tempPosition<512
C
i <temp
Store value in buffer Value=tempBuffer
i++
YES
tempPosition<512
&& tempSector<3862527
tempPosition = 0 mmcWriteSector =tempbuffer tempSector++
tempSector=3862527
tempSector = 2575019
C’
YES
NO NO
NO
YES
NO
YES

Ultra Deep-‐Sea Water Buoy 44 | P a g e
User Interface Software Plan
Main Function:
This Function shows the User Interface to the user, initializes all the parameters and
connections and checks for click_events, which is the function that is invoked once the
user makes a click on the interface. If the done button is clicked, the user interface will
send a signal through the Xbee so the microcontroller knows that the application was
terminated. As soon as the signal is sent the application will terminate.
YES
NO
Start
Init GUI
DONE = 1? Exit
Call Click_Event
Toggle Finished Signal
Ultra Deep-‐Sea Water Buoy 45 | P a g e
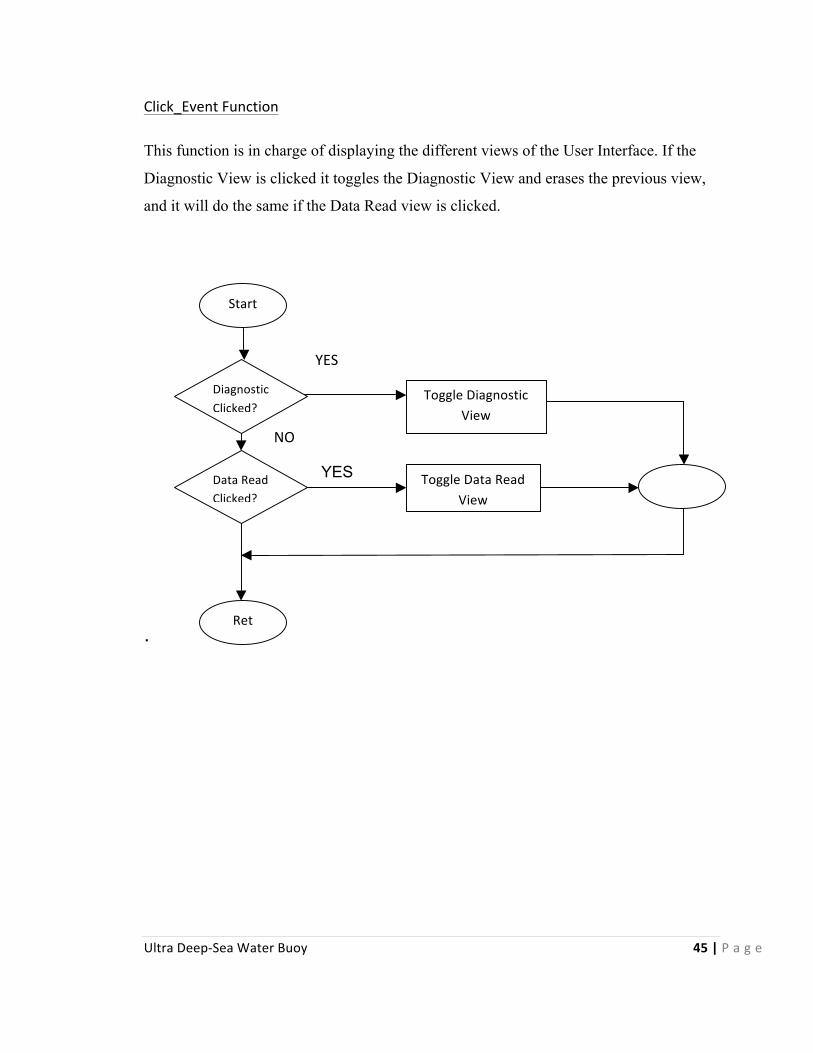
Click_Event Function This function is in charge of displaying the different views of the User Interface. If the
Diagnostic View is clicked it toggles the Diagnostic View and erases the previous view,
and it will do the same if the Data Read view is clicked.
YES
NO
YES
.
Start
Diagnostic Clicked?
Data Read Clicked?
Toggle Diagnostic View
Toggle Data Read View
Ret

Ultra Deep-‐Sea Water Buoy 46 | P a g e
Extract_Button Function
This function verifies if the temperature, acceleration or pressure checkboxes were marked by a user click. When the extract button is clicked then it will send the proper character according to the checkboxes that were marked. The character is sent through the Xbee and lets the microcontroller know the data that will be extracted from the SD Card.
All Marked?
Send “6”
Send “7”
Start
Temperature Marked?
Acceleration
Marked?
Send “1”
Send “2”
Send “3”
Send “4”
Send “5”
Pressure Marked?
YES
YES
YES
YES
YES
YES
YES
NO
NO
NO
NO
NO
NO
RETtart
Acceleration&&Temp
Marked?
Acceleration&&Pressure Marked?
Temp&&Pressure Marked?
NO
Ultra Deep-‐Sea Water Buoy 47 | P a g e
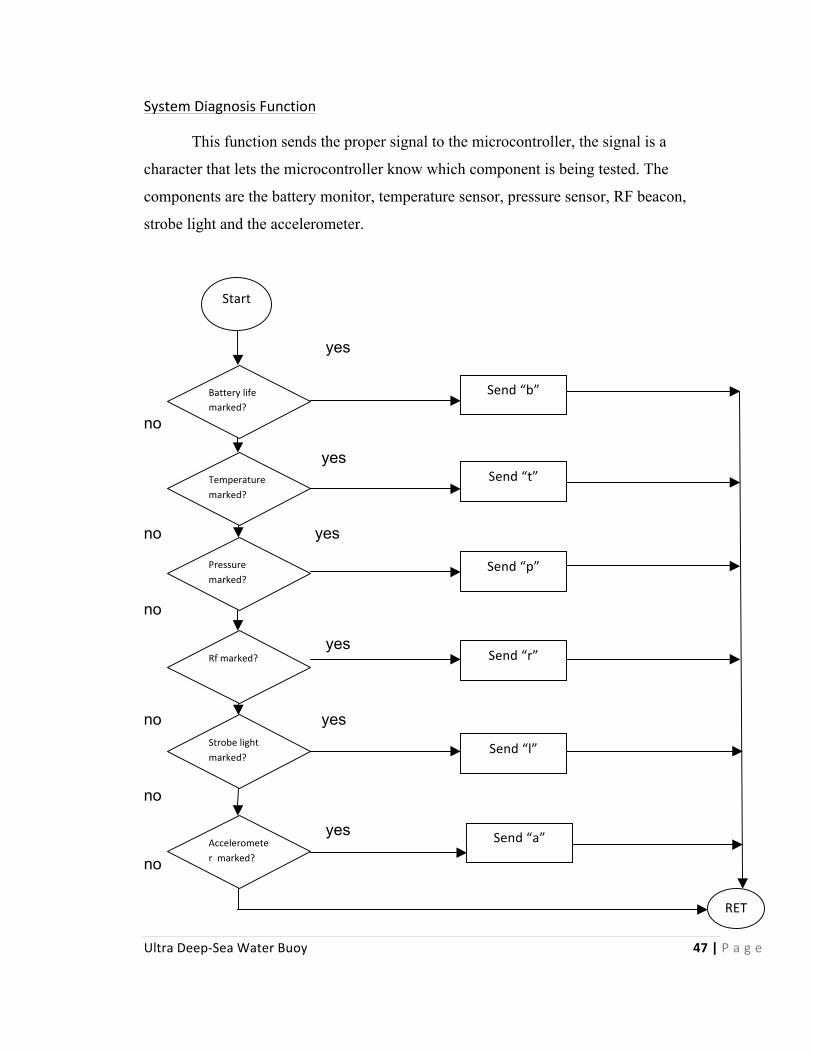
System Diagnosis Function
This function sends the proper signal to the microcontroller, the signal is a
character that lets the microcontroller know which component is being tested. The
components are the battery monitor, temperature sensor, pressure sensor, RF beacon,
strobe light and the accelerometer.
yes
no yes
no yes
no yes
no yes
no yes no
Start
Temperature marked?
Battery life marked?
Pressure marked?
Rf marked?
Strobe light marked?
Accelerometer marked?
Send “b”
Send “t”
Send “p”
Send “r”
Send “l”
Send “a”
RETtart

Ultra Deep-‐Sea Water Buoy 48 | P a g e
Li-‐IonBatteryAnalyzer Function
This function approximates the battery life percentage with the read measure from the Xbee. The code uses the linear approximation equations of the BatVoltage vs BatLife%.
yes
no
yes
no
yes
Start
inputVoltage=0;
batLife=0;
inputVoltage=
readInputVoltage();
inputVoltage<=4.2 && inputVoltage >=3.8
inputVoltage >4.2
inputVoltage >4.2
inputVoltage<3.8 && inputVoltage >=3.5
inputVoltage >4.2
inputVoltage >4.2
inputVoltage<3.5 && inputVoltage >=3.0
inputVoltage >4.2
inputVoltage >4.2
batLife= (inputVoltage-‐4.2)/ (-‐.02)
batLife= (inputVoltage-‐3.8857)/ (-‐.00428)
batLife= (inputVoltage-‐8)/ (-‐.05)
RET
batLife

Ultra Deep-‐Sea Water Buoy 49 | P a g e
J. Embedded Software Description: When we turn on our device the microcontroller will enter to the diagnosis state.
In this state the user can verify if all system components works properly. After finish the
diagnostic state the system enters to the free fall state in which the system is collecting
data until it detects an acceleration spike. Once that spike is detected the device pass to
the activate release mechanism state. After the loads are released the next state is the
upward state in which will collecting data until it detects another acceleration spike.
Once that last spike is detected the system enters to the retrieval state.
On the diagnosis state using the computer application the user can test all of the
system components. The user can send different commands to: turn on strobe, get
measurements of temperature, acceleration and pressure. Also the user can extract the
data that was previously saved to the memory. When all components are tested the user
send the finish diagnostic command and the system will pass to the free fall state.
When the system is on the free fall state it will be collecting the data of the
different sensors. This data will be stored on the memory for future retrieval. Each time it
reads the acceleration of the system will verify if a negative spike is measured. When the
spike occurs the device will enter to active the release mechanism.
On the release mechanism state the system will send a signal to turn on the
release. This signal will cause that the burn wire get burned. The mechanism will be
active until the system detects a change in acceleration. Once the system change in
acceleration is detected the system turn off the signal and enters in the upward state.
The upward state is very similar to the free fall state the system will be collecting
data of the different sensors and store it on memory. Once an acceleration spike is
detected the system enters on the retrieval state.
On the retrieval state the system will sends signals to turn on the strobe light and
turn on the RF. The strobe and the RF will be blinking until the buoy is retrieved by the
user. Then the user can simply turn off the device or retrieve the information.

Ultra Deep-‐Sea Water Buoy 50 | P a g e
K. Software Termination Level
The software of our device is divided into two parts: the embedded software and
the computer application. The device software provides all the functions that are
necessaries to do the main functionalities of the system. Also the computer application
provides all the necessaries basic functions to control the device.
The embedded software implements the functions that control all the peripherals
of the microcontroller. This function includes the calculation of acceleration,
temperature and pressure, the blinking strobe light and the release mechanism. Also we
have implemented the functions that manage the collection of data which include sending
data to memory and retrieving it from memory. We also added the function to
communicate the embedded system with the computer application. This function is
responsible of establish the connection and the exchange of data between the
microcontroller and the computer application. We still need to do an optimization of the
functions to send and receive.
The computer application provides a user interface (UI) that allows the user to
interact with the system. The UI implements all the basic functionalities to control the
system. It includes the functions to send and retrieve data from microcontroller. Also it
provides the function to make the diagnosis. The UI can be improved to add more
functionality that depending of the arrivals of new requirements by the customer.

Ultra Deep-‐Sea Water Buoy 51 | P a g e
L. Efficiency and Trustworthiness
The efficiency and reliability of an embedded system is an important part
that should be considered in the design time. Efficiency does not mean having a high
speed microcontroller. The speed of a system will directly affect negatively the power
consumption. With more efficient software the system will require a lower speed which
helps to save power.
To achieve efficient code and use the least amount of power we
take several aspects into consideration. First we use a modular code where each of the
functions has a specialized and unique task. We also try to use the simplest
algorithms that could perform the required work. Also avoid the excessive
use of conditionals and loops because these statements do not only affect efficiency but
will also affect the reliability of the system.
Another aspect that we consider in our design was to use the interrupt and low
power modes. The analogs to digital, the timers and the serial communication were
served by interrupts. The use of interrupts allows the microcontroller to perform other
task while is waiting to serve that component or simply set the microcontroller to low
power mode.
The reliability of our system depends greatly on the failure tolerance that the
software would provide. To solve the failure tolerance we add a diagnostic function that
must be executed as soon as the system turns on. With this function we can verify that all
components are working properly. One of the key components that our software must
manage is the mechanism release. The software must ensure that this mechanism is
activated and that it really burns the burn wire. To solve this problem the software
combines the activation of the signal with the accelerometer. Once the mechanism
receives the signal it should keep activated until a change in acceleration is detected. This
change in acceleration will predict that in fact the cable was burnt and the loads were
released.
Ultra Deep-‐Sea Water Buoy 52 | P a g e
V. User Guide
We start by giving a typical scenario of the Ultra Deep Sea Water Buoy User
Interface. The user can utilize this application to verify that the sensors are measuring
correctly and to extract the data that was stored on the SD card. The following images
show both applications of the user interface and how to access the user interface. The
display of the user interface may change in a near future, but the functionality will remain
the same.
The scenario starts by opening the application, to do this the user will just double
click an icon on the Desktop of the computer. When the application start it will show the
main view, in this view the action button will be the only button that interacts with the
user. If the action button is clicked then another panel will show allowing the user to
select between the read data and diagnostic menus.
The read data menu will allow the user to select the data that he wants to retrieve
from the SD memory. The temperature, acceleration and pressure data are all available to
be selected through a checkbox; the user marks the data that he wants and clicks the
extract button to retrieve it. The data will be stored in the Desktop through a .txt file.
The diagnostic menu will allow the user to measure and test all the devices that
are incorporated in the system. The user can verify the LED lights, RF beacon, battery
percentage and measure data from the temperature, pressure and acceleration sensors. If
the user is satisfied with the obtained outputs the button “done” may be clicked to
prepare the buoy system to be dropped to the bottom of the ocean floor. By clicking the
“done” button the application will automatically close and send a signal to our device so
the microcontroller knows that it should be ready to enter the free fall state.

Ultra Deep-‐Sea Water Buoy 53 | P a g e
Ultra Sea Water Buoy Application:
Figure 9
Ultra Deep Sea Water Buoy User Interface Main Screen
Figure 10

Ultra Deep-‐Sea Water Buoy 54 | P a g e
User Pressing the Action Button of the User Interface
Figure 11
User selecting the Read Data option from the Figure 1.2
Figure 12

Ultra Deep-‐Sea Water Buoy 55 | P a g e
User selecting the Diagnostic option from the Figure 1.2
Figure 13

Ultra Deep-‐Sea Water Buoy 56 | P a g e
VI. Conclusion
After all the initial system requirements were reviewed, the final result is a
device that meets the client expectations. The system is capable of storing and
obtaining the data of acceleration, temperature and pressure while is ascending or
descending to the ocean. The system uses the Xbee radios effectively to
communicate to a computer and send the data that was stored on memory. The
system also meets with all the limitations that were given by the client.
Some software design choices were made which allow the user to verify
the amount of charge that is left on the batteries. These choices include writing
efficient code, minimizing loops, conditionals and using interrupts wherever
possible. In order to save power and space we used lithium polymer batteries
which are smaller and lighter. We had to do this because our system had space
and weight constrictions.
Some improvements for our system include: a 12V battery upgrade for the
burn wire. Doing this the system will be able burn the wire quicker and thus
giving us more battery life. Another enhancement our system will have in the
future is the camera and light system which will be able to take pictures of the
marine life at great depths. Our customer, Dr. Wilford Schmidt, would also like
an IPhone application to replace our current computer application.
This device could be a part of another system where a data gathering or a
release mechanism is needed. Our device could be very useful for different
applications that require traveling long distances underwater where data collection
might be needed. Another application for our device could be in the military were
ultra deep water exploration is needed.

Ultra Deep-‐Sea Water Buoy 57 | P a g e
VII. References
National Semiconductor.(2009). Characteristics of Rechargeable Batteries. Retrieved on 4, 2011 from http://www.national.com/appinfo/power/files/f19.pdf
Maxim Innovation Delivered. (2011). Accurately Measuring Charge Level. Retrieved on 4,2011 from http://www.maxim-ic.com/app-notes/index.mvp/id/3958.
Li-Ion BMS. (2008). Estimating the State the State of Charge of Li-Ion batteries. Retrived on 4, 2011 from http://www.liionbms.com/php/wp_soc_estimate.php.
IBT Power. (2001). Lithium Ion Technical Data. Retrieved on 4, 2011from http://www.ibt-power.com/Battery_packs/Li_Ion/Lithium_ion_tech.html.
Davies, J. (2008). MSP430 Microcontroller Basics. Newnes.
Lutz, B. (2000). MSP430 Mixed-Signal Microcontroller Application Reports. Texas Instruments.

Ultra Deep-‐Sea Water Buoy 58 | P a g e
VIII. Appendix
A. Components used in our device
SD Card Memory Dongle
Xbee Chip
Xbee Dongle
Ultra Deep-‐Sea Water Buoy 59 | P a g e
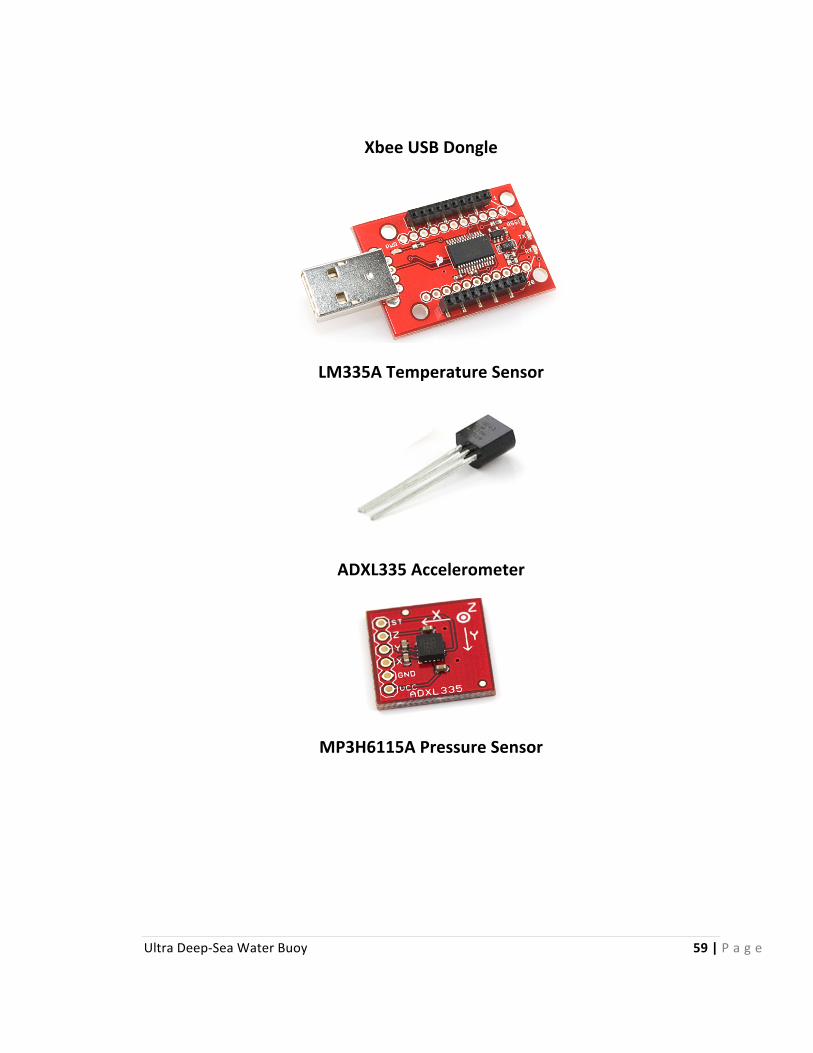
Xbee USB Dongle
LM335A Temperature Sensor
ADXL335 Accelerometer
MP3H6115A Pressure Sensor
Ultra Deep-‐Sea Water Buoy 60 | P a g e
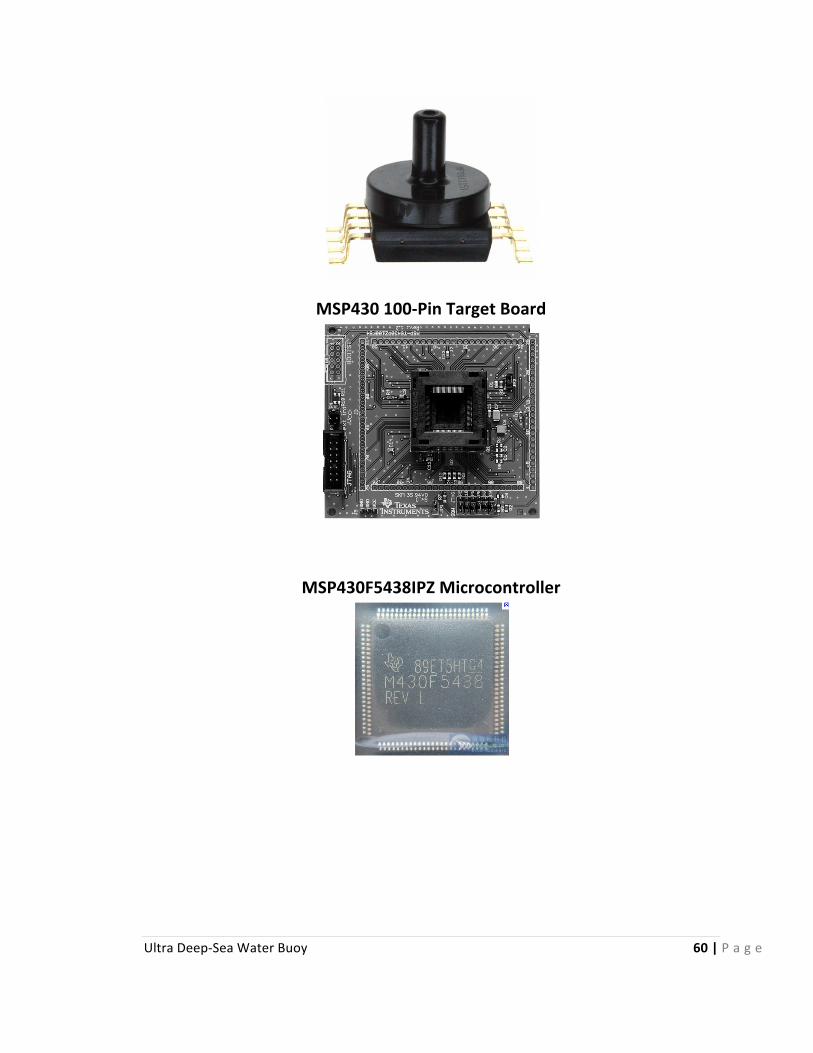
MSP430 100-‐Pin Target Board
MSP430F5438IPZ Microcontroller
Ultra Deep-‐Sea Water Buoy 61 | P a g e
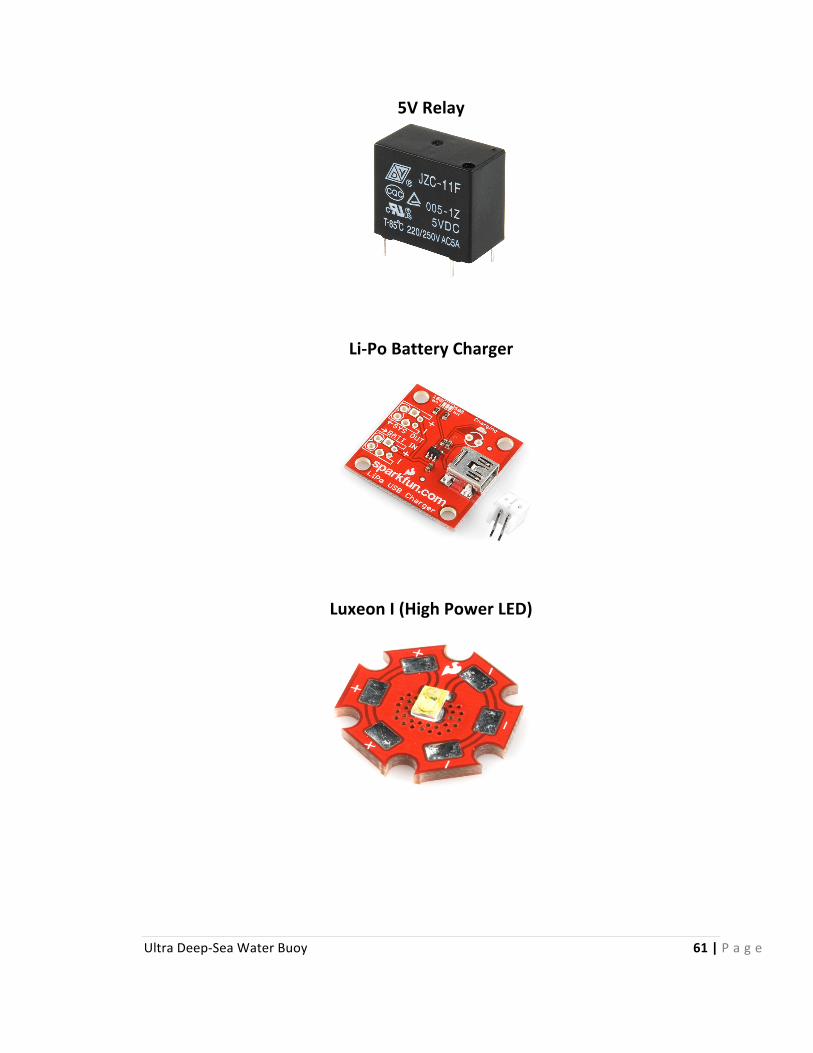
5V Relay
Li-‐Po Battery Charger
Luxeon I (High Power LED)

Ultra Deep-‐Sea Water Buoy 62 | P a g e
2GB SD Card
TTA-‐100 (RF Transmitter)

Ultra Deep-‐Sea Water Buoy 63 | P a g e
B. Part List
Item Number Quantity Part Number Description Part Reference Value
1 1 BQ20Z40EVM-‐001 Battery Manager BQ1 $0.00
2 3 MSP430F5436 Micro-‐Controller U1 $11.20
3 2 XBEE-‐1B3 Xbee Wireless Chip U2 $22.95
4 4 LM135 Temperature Sensor (Analog) U3 $1.50/each
5 2 5 Pack Step Up $9.95
6 2 MP3H6115A Barometric Pressure Sensor U4 $9.95
7 1 ADXL335 Accelerometer Breakout Board
$24.94
8 4 NPN 2n2222 Transistor U5 $8.00
9 1 LUXEON I High-‐Luminance LED U6 $5.95
10 10 Capacitors (100nF, 10uF) $15.00
11 1 SD SanDisk 2 GB U7 $1.97
12 1 BOB-‐00204 SD Breakout Board U8 $9.95
13 1 XBEE_EXPLORER Xbee Dongle Board U11 $9.95
14 1 TTA-‐100 RF Transmitter U12 $209.95
15
16
1
2
PRT-‐08484
PRT-‐08483
3.7 Volts/6Ah Polymer Lithium Ion Battery
3.7 Volts/ 2000mAhPolymer Lithium Ion Battery
BT3-‐5 BT1&BT2
$39.95
$33.84
17 2 PRT-‐10161 USB-‐LiPoly Battery Single Cell Battery Charger
$29.90
Ultra Deep-‐Sea Water Buoy 64 | P a g e
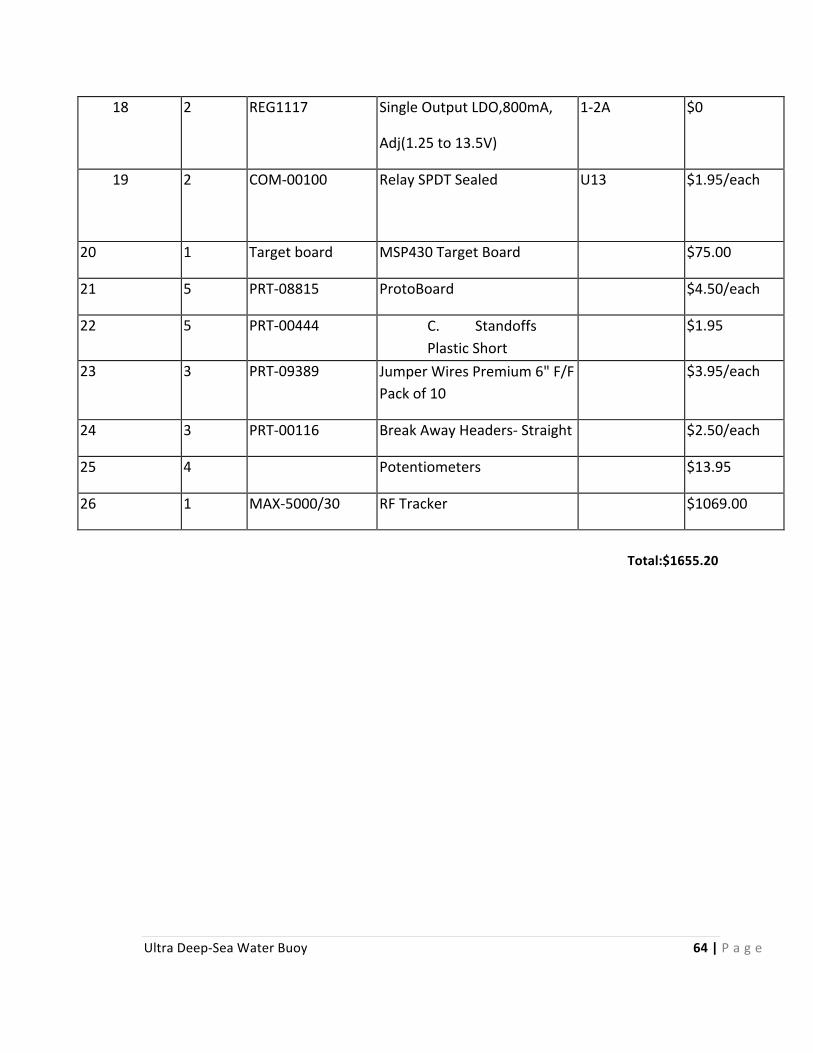
18 2 REG1117 Single Output LDO,800mA,
Adj(1.25 to 13.5V)
1-‐2A $0
19 2 COM-‐00100 Relay SPDT Sealed
U13 $1.95/each
20 1 Target board MSP430 Target Board $75.00
21 5 PRT-‐08815 ProtoBoard $4.50/each
22 5 PRT-‐00444 C. Standoffs Plastic Short
$1.95
23 3 PRT-‐09389 Jumper Wires Premium 6" F/F Pack of 10
$3.95/each
24 3 PRT-‐00116 Break Away Headers-‐ Straight $2.50/each
25 4 Potentiometers $13.95
26 1 MAX-‐5000/30 RF Tracker $1069.00
Total:$1655.20

Ultra Deep-‐Sea Water Buoy 65 | P a g e
D. Task Distribution
Tasks Manuel J Orán Omar Roldán Rafael Vázquez Giovanni Viera
1.Finding a problem x x
2.Solution to problem x x x x
3.MCU Selection x X x x
4. Poster/Web Page & Operating Chart x x x x
5. Schematics x x x x
6. Part List x
x
7. Timing & Power Analysis x
x x
8. BDv3 x x
9. Xbee
x x
11. Strobe and Light sensor Controller
x
12. Accelerometer
x
13. Thermometer
x

Ultra Deep-‐Sea Water Buoy 66 | P a g e
Sensor
14. Pressure Sensor x
15. Power Supply x
x
16. Battery Monitor x
17. User Interface x x
18. Memory x
19. Software Integration x x
20. Hardware Integration x x
21. Burnwire Launcher x
22. Prototype Mounting x x x x

Ultra Deep-‐Sea Water Buoy 67 | P a g e
IX. Description of the Project
The Ultra-Deep Sea Water Buoy System consists on three important parts:
the circuitry which is the part that takes care of all the sensors and peripherals, a
load which an additional device used for different tasks (include a barometer to
measure outside pressure or a fish trap or and a water and sand gathering sample
tube). The third part is the buoyancy system, which includes the two buoys and a
counterweight mechanism that allows the whole system to travel to the bottom of
the ocean.
Our project consists on the circuitry, which basically is the heart and brain
of the complete system. The circuitry consists of a power supply and the micro-
controlled peripherals. The micro-controlled system consists of a TI MSP430F5
series micro controller, an accelerometer, a barometer, a LED strobe light, a RF
Transmitter, a temperature sensor, an Xbee module for wireless communication, a
memory card, and a circuit to activate the release mechanism. The system works
in the following matter: First the system is powered on, once it is “powered on” it
goes to the system diagnostics, which in this case is controlled using a computer
and communicates to the system wirelessly. In the diagnostic all the sensors, and
lights can be tested to ensure the system is working property. Once the user is
done with the diagnostic and closes the Graphical User Interface, the system starts
collecting data from the sensors and starts saving in the Memory Card. When the
system touches the ocean floor (about three hours later) a spike in acceleration
occurs therefore signaling the MCU to activate the release mechanism. After the
release the signal is stopped and the system start ascending to the surface. Once at
the surface the accelerometer detects changes in acceleration, which this triggers,
the RF Transmitter and LED Strobe lights so that we can find the system in the
middle of the ocean.

Ultra Deep-‐Sea Water Buoy 68 | P a g e
X. TI Parts Explanation
1. MCU à We used a TI MSP430F5438. We chose the MSP430F5 series because our project required several I/O ports and UART ports for the completion of our design. We could have used another TI MCU but this was the one available that fed all our needs. The MCU benefitted our design in that it allowed us to easily incorporate the Analog sensors without the need of an external Analog to Digital Converter (ADC). Another benefit was that the MS430F5438 and its board provided us with a 32KHz clock without the need of an external circuit and clock.
2. LDO à We used TI REG1117 which is a Single Output LDO, 800mA, Adj(1.25 to 13.5V). This IC allowed us to effectively obtain 3.3V from the 7.4V that we have in the power supply. This chip helped our design because without this chip we would have to find another way to regulate the voltages so that the system would work. With the REG1117, our system was reduced in hardware, which was key in the designing due to our weight and space constraints.
3. Battery Monitor à We used TI’s BQ20Z40EVM-001 battery monitor to monitor the battery life and system overall power consumption. Due to a complication in the interfacing with this battery monitor we opted to use the BQ20Z40EVM-001 with the provided interface from TI. The BQ20Z40EVM-001 really benefited us to measure the true power consumption and the currents being drawn by the system, but due to a failure in communicating with the MCU, the BQ20Z40EVM-001 only communicates with the computer through a USB cable. For that reason the BQ20Z40EVM-001 is only being used in firm ground for testing and comparisons.