Ultracapacitor Characterization Using a Novel Dynamic ... · An ultracapacitor is an energy storage...
75
Ultracapacitor Characterization Using a Novel Dynamic Parameter Identification Modeling Technique for Electric Transportation Applications By Amandeep Singh Presented in Partial Fulfillment of the Requirements for the Degree of Master of Applied Science (Electrical and Computer Engineering) at University of Ontario Institute of Technology Oshawa, Ontario, Canada September 2015 © Amandeep Singh, 2015
Transcript of Ultracapacitor Characterization Using a Novel Dynamic ... · An ultracapacitor is an energy storage...
Ultracapacitor Characterization Using a Novel Dynamic
Parameter Identification Modeling Technique for Electric
Transportation Applications
By
Amandeep Singh
Presented in Partial Fulfillment of the Requirements for the Degree of
Master of Applied Science (Electrical and Computer Engineering) at
University of Ontario Institute of Technology
Oshawa, Ontario, Canada
September 2015
© Amandeep Singh, 2015
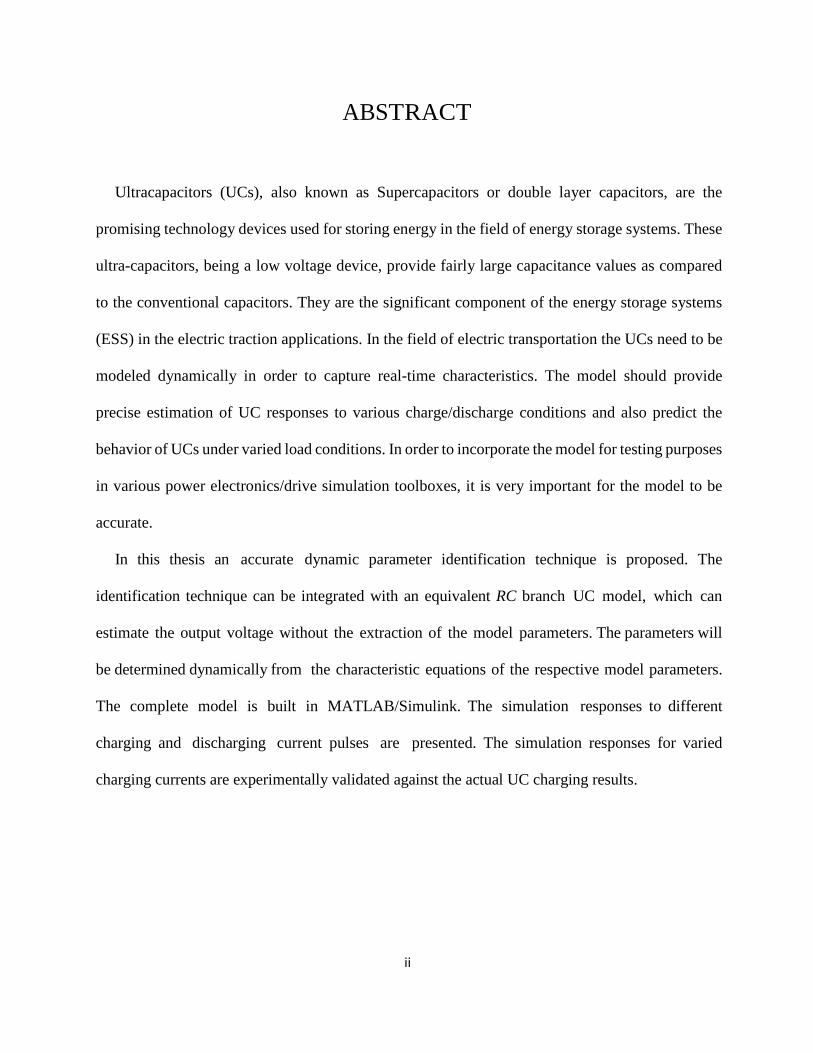
ABSTRACT
Ultracapacitors (UCs), also known as Supercapacitors or double layer capacitors, are the
promising technology devices used for storing energy in the field of energy storage systems. These
ultra-capacitors, being a low voltage device, provide fairly large capacitance values as compared
to the conventional capacitors. They are the significant component of the energy storage systems
(ESS) in the electric traction applications. In the field of electric transportation the UCs need to be
modeled dynamically in order to capture real-time characteristics. The model should provide
precise estimation of UC responses to various charge/discharge conditions and also predict the
behavior of UCs under varied load conditions. In order to incorporate the model for testing purposes
in various power electronics/drive simulation toolboxes, it is very important for the model to be
accurate.
In this thesis an accurate dynamic parameter identification technique is proposed. The
identification technique can be integrated with an equivalent RC branch UC model, which can
estimate the output voltage without the extraction of the model parameters. The parameters will
be determined dynamically from the characteristic equations of the respective model parameters.
The complete model is built in MATLAB/Simulink. The simulation responses to different
charging and discharging current pulses are presented. The simulation responses for varied
charging currents are experimentally validated against the actual UC charging results.
ii

ACKNOWLEDGEMENT
I would like to express my sincere gratitude and deepest appreciation to my supervisor, Dr.
Sheldon S. Williamson for continuous guidance, commitment and support throughout the course
of this research. Without his persistent help and support this thesis would not have been possible.
Besides my supervisor, I would also like to express my gratitude and gratefulness to Dr. Najath
Abdul Azeez, Post-Doctoral fellow, for his valuable guidance and support, which enabled me to
start and carry out this project till the end.
I thank my fellow lab mates at STEER group for their help regarding my work, for sharing
knowledge and always motivating me in learning new things. I will always remember all the fun
and good time we had during my studies.
Last but not the least, I would like to sincerely thank my parents, brother and sister, for their
continued love and support throughout my life.
iii

Dedicated to my parents, brother and sister
iv
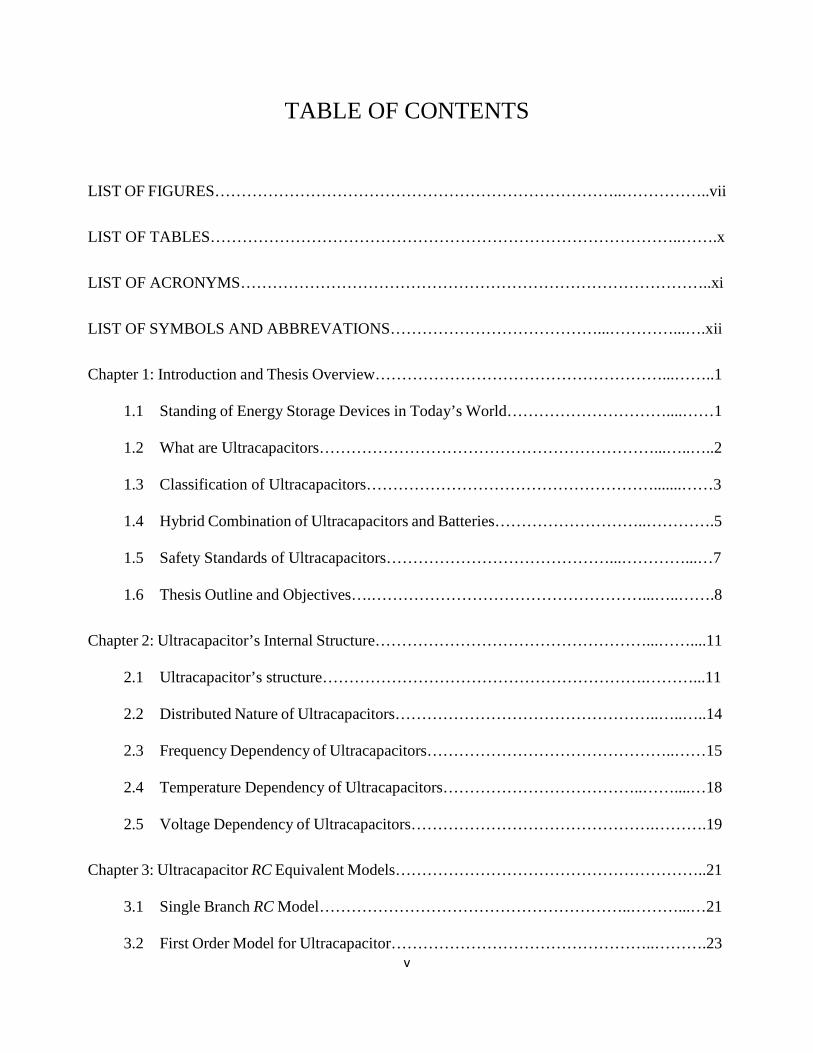
TABLE OF CONTENTS
LIST OF FIGURES…………………………………………………………………..……………..vii
LIST OF TABLES……………………………………………………………………………..…….x
LIST OF ACRONYMS……………………………………………………………………………..xi
LIST OF SYMBOLS AND ABBREVATIONS…………………………………...…………...….xii
Chapter 1: Introduction and Thesis Overview………………………………………………...……..1
1.1 Standing of Energy Storage Devices in Today’s World…………………………....……1
1.2 What are Ultracapacitors………………………………………………………...…..…..2
1.3 Classification of Ultracapacitors……………………………………………….......……3
1.4 Hybrid Combination of Ultracapacitors and Batteries………………………..………….5
1.5 Safety Standards of Ultracapacitors……………………………………...…………...…7
1.6 Thesis Outline and Objectives….……………………………………………...…..…….8
Chapter 2: Ultracapacitor’s Internal Structure……………………………………………...……....11
2.1 Ultracapacitor’s structure…………………………………………………….………...11
2.2 Distributed Nature of Ultracapacitors…………………………………………..…..…..14
2.3 Frequency Dependency of Ultracapacitors………………………………………..……15
2.4 Temperature Dependency of Ultracapacitors………………………………..……....…18
2.5 Voltage Dependency of Ultracapacitors……………………………………….……….19
Chapter 3: Ultracapacitor RC Equivalent Models…………………………………………………..21
3.1 Single Branch RC Model…………………………………………………..………...…21
3.2 First Order Model for Ultracapacitor…………………………………………..……….23 v

3.3 RC Equivalent Model………………………………………………...………..……….23
3.4 RC Transmission Line Model…………………………………………………..…..…..24
3.5 RC Series Parallel Branch Model…………………………………………….....…...…25
3.6 RC Multi Stage Ladder Model…………………………………………………..……...26
3.7 Four Branches (Zubeita Model)………………………………………..……...…….....27
3.8 Two Branches (Franda Model)…………………………………………..……………..28
3.9 Chosen UC Model for EV Traction……………………………………….……...…….29
Chapter 4: Proposed Dynamic Parameter Identification Technique…………………………….….30
4.1 Characteristic Equations and Mathematical Model……………………...…...….……..30
4.2 Proposed Method to Dynamically Estimate the Characteristic Equation Parameters.....34
4.3 Equations of the UC Model……………………………………...……………..…...….38
Chapter 5: Model Simulation Results……………………………………………………………....41
5.1 Simulation Results…………………………………………………………..…….……41
Chapter 6: Experimental Results and Validation……………………………………………….…..47
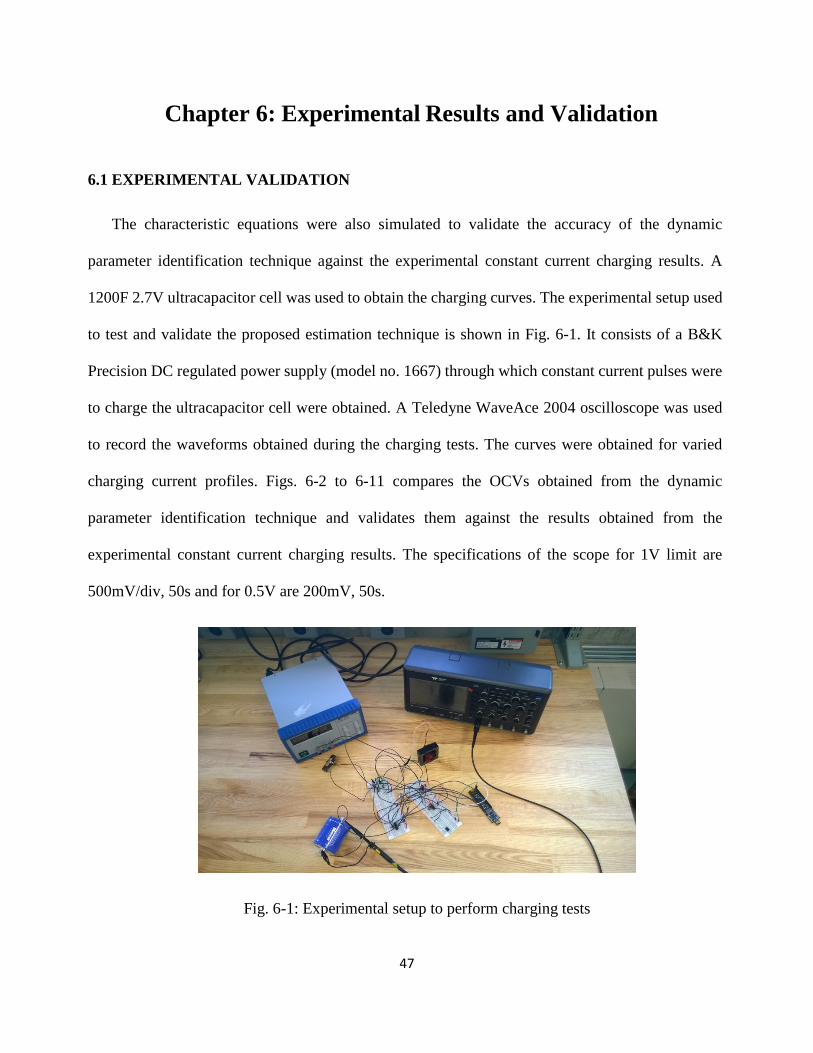
6.1 Experimental Validation……………………...……………………………..……...….47
Chapter 7: Conclusions, Contributions and Future Work………………………….…………....….55
7.1 Conclusion…………………………………………………………………….…….…55
7.2 Thesis Contributions………………………………………………………………..….56
7.3 Future Work…………………………………………………………...………....…….57
vi
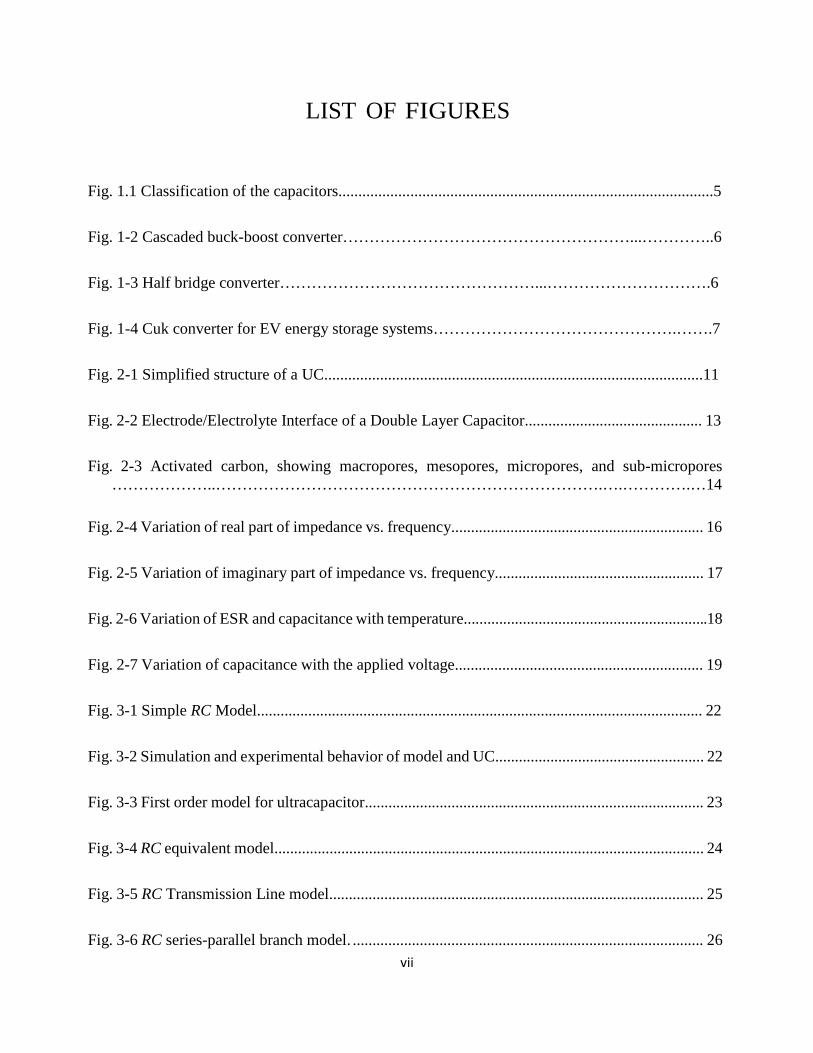
LIST OF FIGURES
Fig. 1.1 Classification of the capacitors..............................................................................................5
Fig. 1-2 Cascaded buck-boost converter………………………………………………...…………..6
Fig. 1-3 Half bridge converter…………………………………………...………………………….6
Fig. 1-4 Cuk converter for EV energy storage systems……………………………………….…….7
Fig. 2-1 Simplified structure of a UC...............................................................................................11
Fig. 2-2 Electrode/Electrolyte Interface of a Double Layer Capacitor............................................. 13
Fig. 2-3 Activated carbon, showing macropores, mesopores, micropores, and sub-micropores ………………..……………………………………………………………….….………….…14
Fig. 2-4 Variation of real part of impedance vs. frequency................................................................ 16
Fig. 2-5 Variation of imaginary part of impedance vs. frequency..................................................... 17
Fig. 2-6 Variation of ESR and capacitance with temperature..............................................................18
Fig. 2-7 Variation of capacitance with the applied voltage............................................................... 19
Fig. 3-1 Simple RC Model................................................................................................................. 22
Fig. 3-2 Simulation and experimental behavior of model and UC..................................................... 22
Fig. 3-3 First order model for ultracapacitor...................................................................................... 23
Fig. 3-4 RC equivalent model............................................................................................................. 24
Fig. 3-5 RC Transmission Line model............................................................................................... 25
Fig. 3-6 RC series-parallel branch model. ......................................................................................... 26 vii
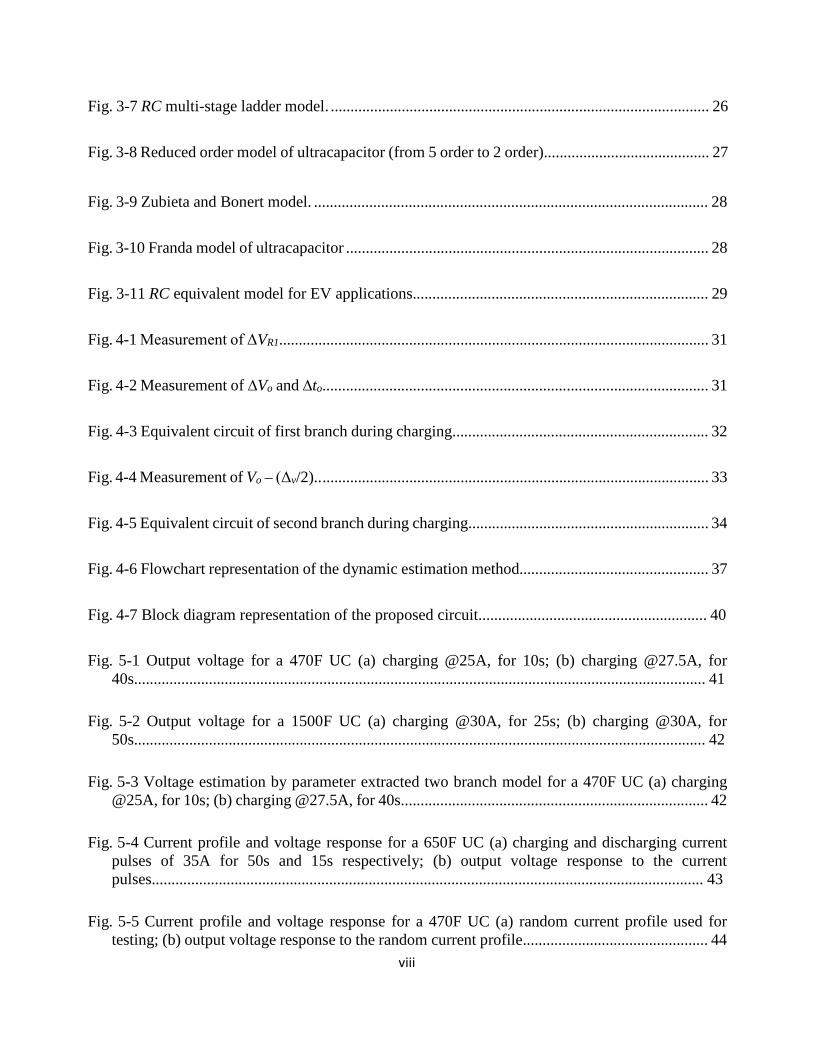
Fig. 3-7 RC multi-stage ladder model. ................................................................................................ 26
Fig. 3-8 Reduced order model of ultracapacitor (from 5 order to 2 order).......................................... 27
Fig. 3-9 Zubieta and Bonert model. .................................................................................................... 28
Fig. 3-10 Franda model of ultracapacitor ............................................................................................ 28
Fig. 3-11 RC equivalent model for EV applications........................................................................... 29
Fig. 4-1 Measurement of ΔVR1............................................................................................................. 31
Fig. 4-2 Measurement of ∆Vo and ∆to.................................................................................................. 31
Fig. 4-3 Equivalent circuit of first branch during charging................................................................. 32
Fig. 4-4 Measurement of Vo – (Δv/2).................................................................................................... 33
Fig. 4-5 Equivalent circuit of second branch during charging............................................................. 34
Fig. 4-6 Flowchart representation of the dynamic estimation method................................................ 37
Fig. 4-7 Block diagram representation of the proposed circuit.......................................................... 40
Fig. 5-1 Output voltage for a 470F UC (a) charging @25A, for 10s; (b) charging @27.5A, for 40s................................................................................................................................................. 41
Fig. 5-2 Output voltage for a 1500F UC (a) charging @30A, for 25s; (b) charging @30A, for 50s................................................................................................................................................. 42
Fig. 5-3 Voltage estimation by parameter extracted two branch model for a 470F UC (a) charging @25A, for 10s; (b) charging @27.5A, for 40s.............................................................................. 42
Fig. 5-4 Current profile and voltage response for a 650F UC (a) charging and discharging current pulses of 35A for 50s and 15s respectively; (b) output voltage response to the current pulses............................................................................................................................................ 43
Fig. 5-5 Current profile and voltage response for a 470F UC (a) random current profile used for testing; (b) output voltage response to the random current profile............................................... 44
viii

Fig. 5-6 Magnified current profile and output voltage response during charging, from 30s to 40s ....................................................................................................................................................... 44
Fig. 5-7 Magnified current profile and output voltage response during discharging, from 90s to 100s............................................................................................................................................... 45
Fig. 5-8 Current profile and voltage response for a 470F UC (a) random current profile used for testing; (b) output voltage response to the random current profile............................................... 45
Fig. 6-1 Experimental setup to perform charging tests……………………………………..……….47
Fig. 6-2: Output voltage profile for 3.5A charging current and 1V limit (a) actual charging response; (b) simulation result……………………………………………………………………………..48
Fig. 6-3: Output voltage profile for 3.5A charging current and 0.5V limit (a) actual charging response; (b) simulation result…………………………………………………………………………..…48
Fig. 6-4: Output voltage profile for 2.5A charging current and 1V limit (a) actual charging response; (b) simulation result……………………………………………………………………..………49
Fig. 6-5: Output voltage profile for 2.5A charging current and 0.5V limit (a) actual charging response; (b) simulation result……………………………………………………………………………..49
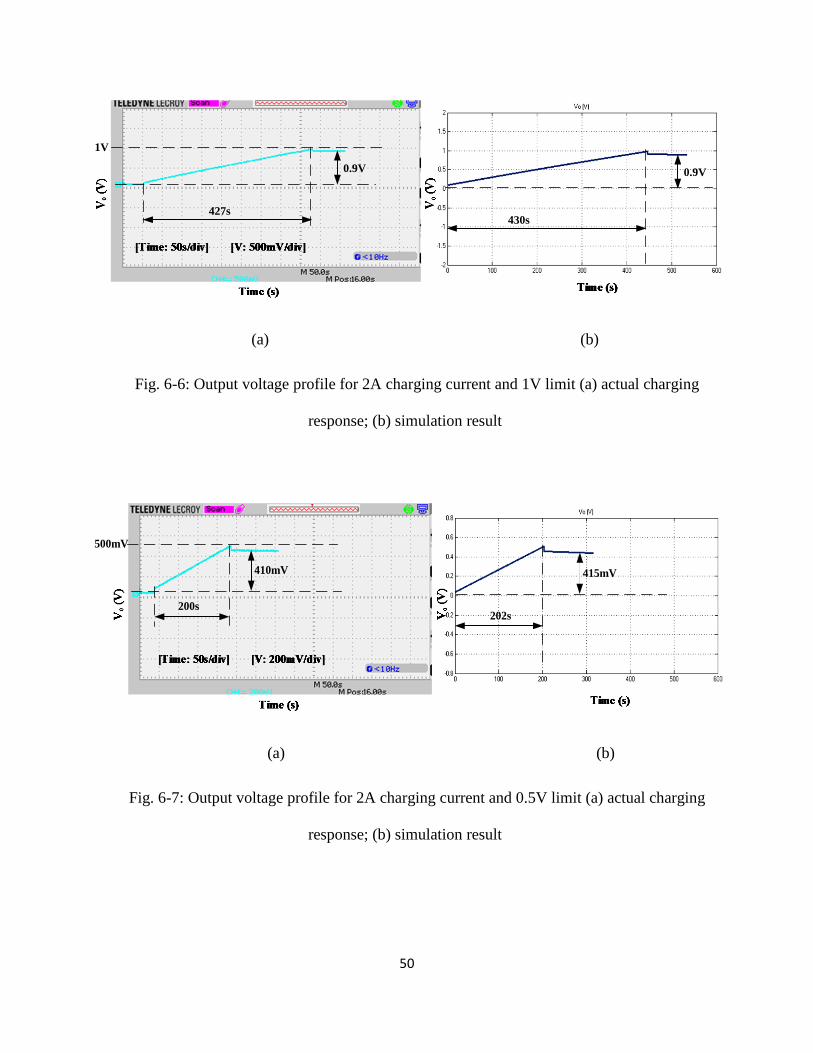
Fig. 6-6: Output voltage profile for 2A charging current and 1V limit (a) actual charging response; (b) simulation result………………………………………………………………………..……50
Fig. 6-7: Output voltage profile for 2A charging current and 0.5V limit (a) actual charging response; (b) simulation result……………………………………………………………………………..50
Fig. 6-8: Output voltage profile for 1.5A charging current and 1V limit (a) actual charging response; (b) simulation result……………………………………………………………………………..51
Fig. 6-9: Output voltage profile for 1.5A charging current and 0.5V limit (a) actual charging response; (b) simulation result……………………………………………………………………………..51
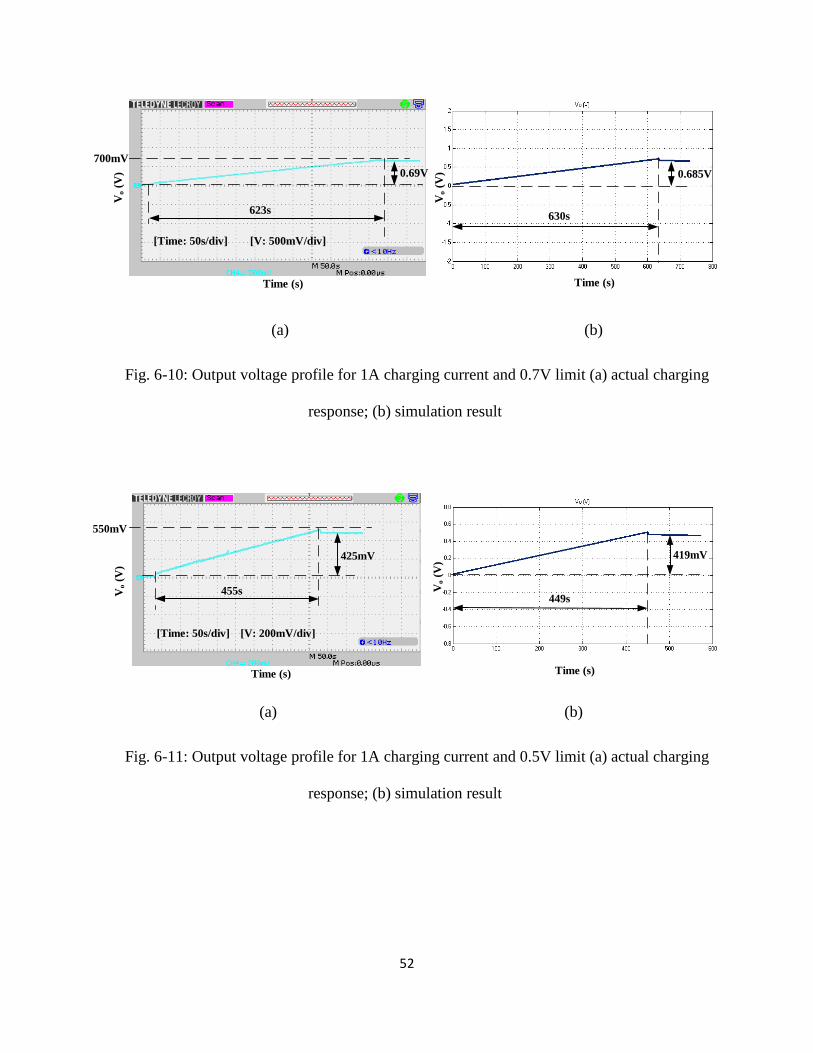
Fig. 6-10: Output voltage profile for 1A charging current and 0.7V limit (a) actual charging response; (b) simulation result……………………………………………………………………………..52
Fig. 6-11: Output voltage profile for 1A charging current and 0.5V limit (a) actual charging response; (b) simulation result………………………………………………………………………….….52
ix
LIST OF TABLES
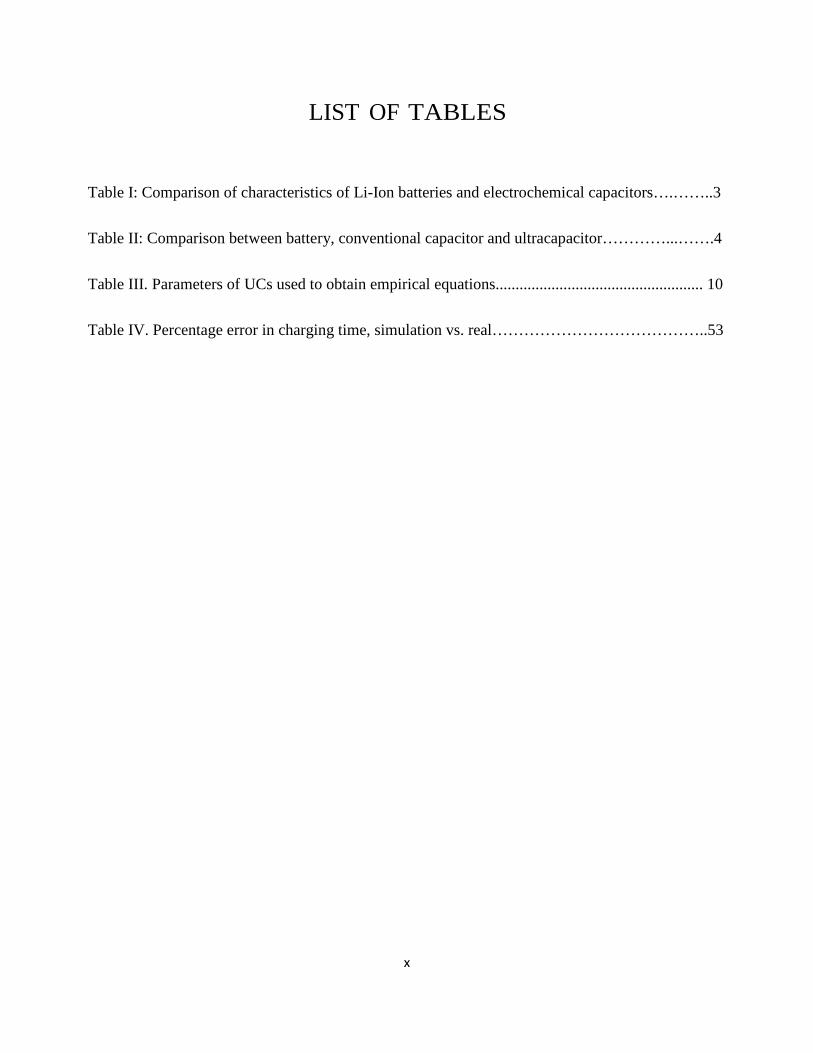
Table I: Comparison of characteristics of Li-Ion batteries and electrochemical capacitors….……..3
Table II: Comparison between battery, conventional capacitor and ultracapacitor…………...…….4
Table III. Parameters of UCs used to obtain empirical equations.................................................... 10
Table IV. Percentage error in charging time, simulation vs. real…………………………………..53
x

LIST OF ACRONYMS
DC Direct current
DLC Double Layer Capacitor
EV Electric Vehicle
ESS Energy Storage System
ESR Equivalent Series Resistance
EIS Electrochemical Impedance Spectroscopy
HEV Hybrid Electric Vehicles
OCV Open Circuit Voltage
PHEV Plug-in Hybrid Electric Vehicles
TCF Temperature Correction Factor
UC Ultracapacitor
Vmin Minimum Voltage
Vrated Rated Voltage
xi
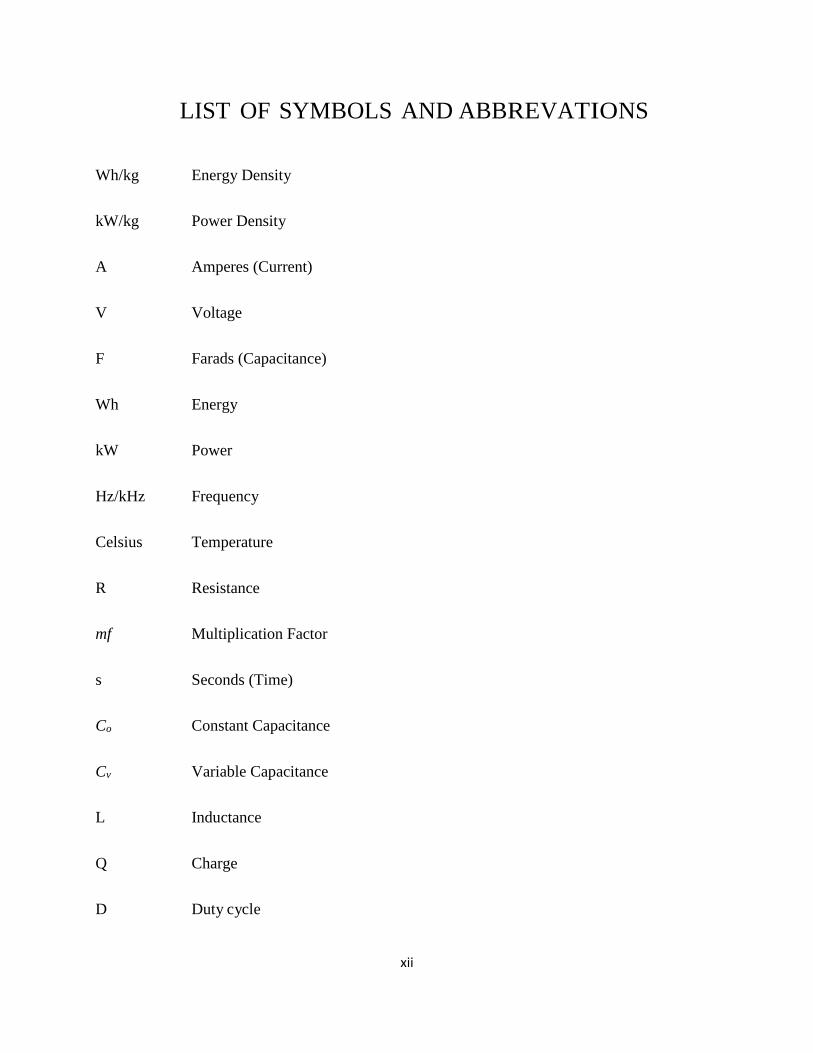
LIST OF SYMBOLS AND ABBREVATIONS
Wh/kg Energy Density
kW/kg Power Density
A Amperes (Current)
V Voltage
F Farads (Capacitance)
Wh Energy
kW Power
Hz/kHz Frequency
Celsius Temperature
R Resistance
mf Multiplication Factor
s Seconds (Time)
Co Constant Capacitance
Cv Variable Capacitance
L Inductance
Q Charge
D Duty cycle
xii

Chapter 1: Introduction and Thesis Overview
1.1 STANDING OF ENERGY STORAGE DEVICES IN TODAY’S WORLD
In today’s world electrical energy storage is needed in various applications such as
telecommunication sector like cell phones, standby power systems, electric vehicles or hybrid
vehicles [1]. A storage device must be suitable for the particular application and must satisfy all the
requirements. The most common energy storage devices as of now are the batteries. They are being
used in a number of applications and suits all the requirements of the application they are employed
in. But unfortunately the batteries suffer from various disadvantages like short shelf and cycle life,
low power density, very large charging times. Hence there is a need to replace the batteries as the
energy storage medium or use another device like ultracapacitor or fuel cells in combination with the
batteries in the applications where the power is needed in pulses (in short durations).
Electric vehicles (EVs) of the future as well as the mass electric transportation industry (electric
buses, trains, and trams) will extensively use power peaking devices, such as ultracapacitors (UCs)
for electric traction [2]-[5]. The most common EV energy storage device is the Li-ion battery.
Unfortunately, batteries suffer from critical drawbacks, such as short shelf/cycle life, low power
density, and long charging times. Thus, electric mass transit vehicles do not make efficient use of
batteries. Hence, in such high-power cyclic applications, which need short bursts of power (not
energy), there is a need to replace batteries with UCs as the storage medium. UCs can also be used
a power peaking device, in parallel with batteries. UC cells with capacitance values as high as 3400F
are now available commercially (Maxwell K2® UCs) [6].
1
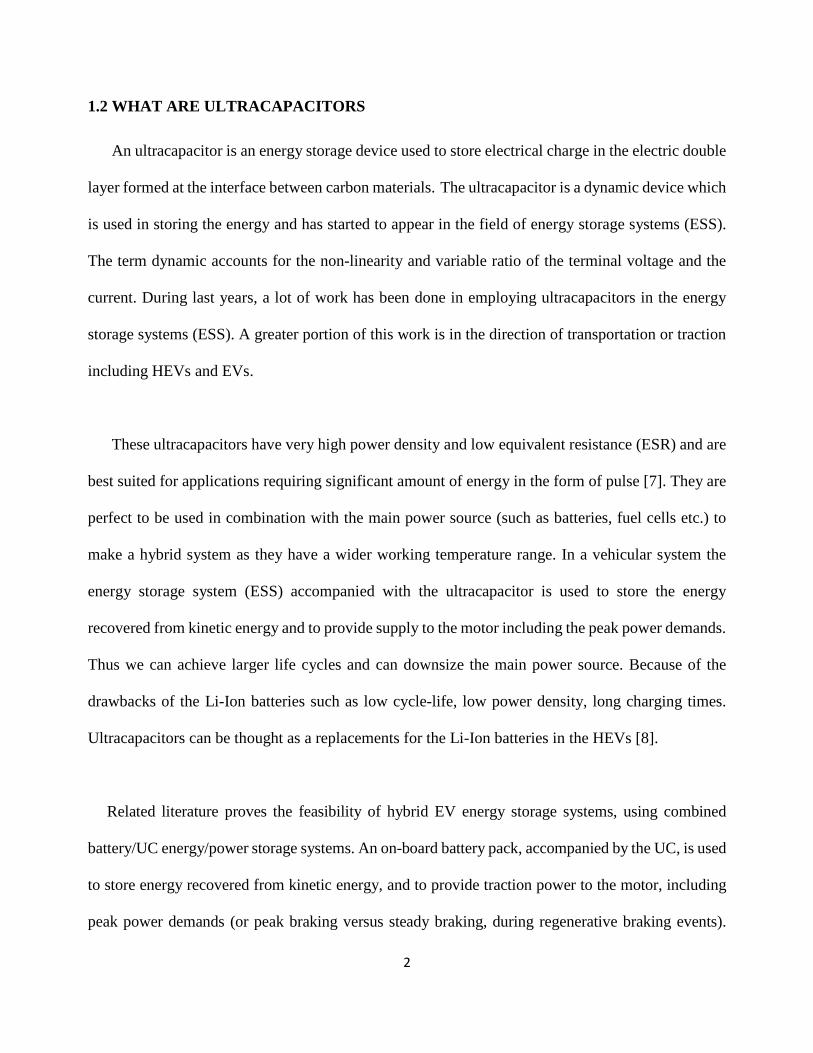
1.2 WHAT ARE ULTRACAPACITORS
An ultracapacitor is an energy storage device used to store electrical charge in the electric double
layer formed at the interface between carbon materials. The ultracapacitor is a dynamic device which
is used in storing the energy and has started to appear in the field of energy storage systems (ESS).
The term dynamic accounts for the non-linearity and variable ratio of the terminal voltage and the
current. During last years, a lot of work has been done in employing ultracapacitors in the energy
storage systems (ESS). A greater portion of this work is in the direction of transportation or traction
including HEVs and EVs.
These ultracapacitors have very high power density and low equivalent resistance (ESR) and are
best suited for applications requiring significant amount of energy in the form of pulse [7]. They are
perfect to be used in combination with the main power source (such as batteries, fuel cells etc.) to
make a hybrid system as they have a wider working temperature range. In a vehicular system the
energy storage system (ESS) accompanied with the ultracapacitor is used to store the energy
recovered from kinetic energy and to provide supply to the motor including the peak power demands.
Thus we can achieve larger life cycles and can downsize the main power source. Because of the
drawbacks of the Li-Ion batteries such as low cycle-life, low power density, long charging times.
Ultracapacitors can be thought as a replacements for the Li-Ion batteries in the HEVs [8].
Related literature proves the feasibility of hybrid EV energy storage systems, using combined
battery/UC energy/power storage systems. An on-board battery pack, accompanied by the UC, is used
to store energy recovered from kinetic energy, and to provide traction power to the motor, including
peak power demands (or peak braking versus steady braking, during regenerative braking events).
2
Thus, the overall ESS achieves larger charge/discharge cycles, while at the same time, battery life can
be theoretically doubled. Recent studies show that it is very advantageous to use an UC in place of a
battery or along with the battery [8]. The generalized average charge/discharge efficiency of a UC is
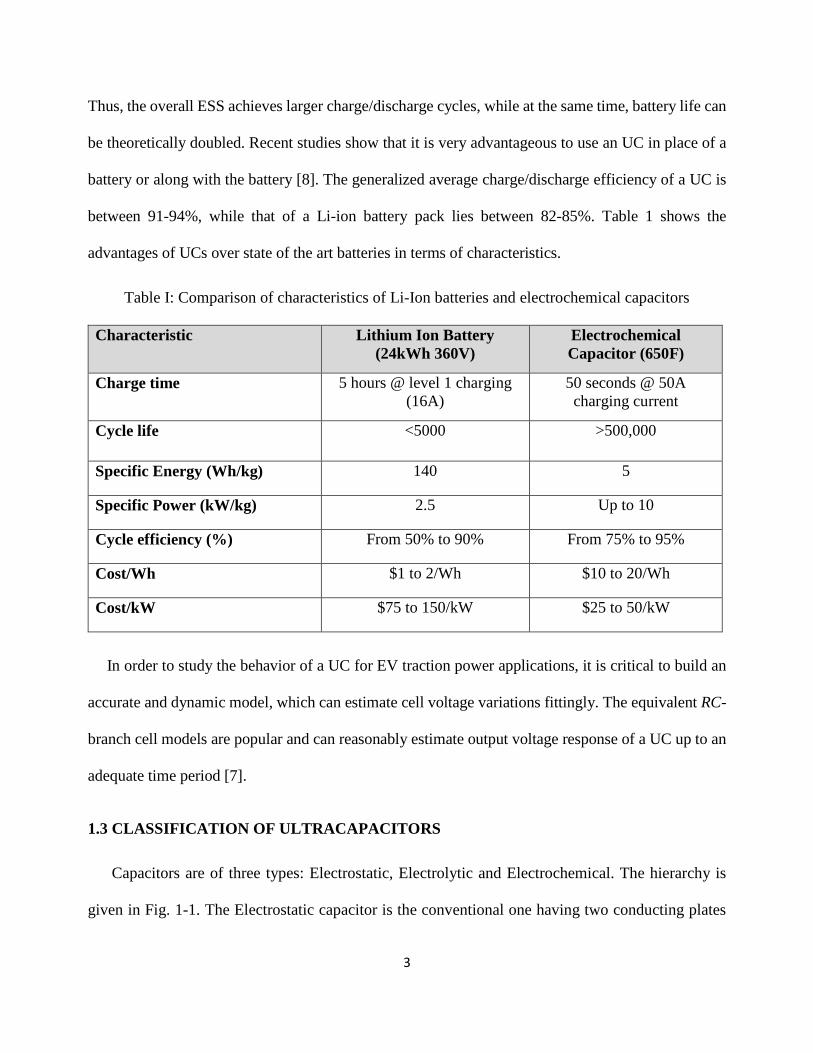
between 91-94%, while that of a Li-ion battery pack lies between 82-85%. Table 1 shows the
advantages of UCs over state of the art batteries in terms of characteristics.
Table I: Comparison of characteristics of Li-Ion batteries and electrochemical capacitors
Characteristic Lithium Ion Battery (24kWh 360V)
Electrochemical Capacitor (650F)
Charge time 5 hours @ level 1 charging (16A)
50 seconds @ 50A charging current
Cycle life <5000 >500,000
Specific Energy (Wh/kg) 140 5
Specific Power (kW/kg) 2.5 Up to 10
Cycle efficiency (%) From 50% to 90% From 75% to 95%
Cost/Wh $1 to 2/Wh $10 to 20/Wh
Cost/kW $75 to 150/kW $25 to 50/kW
In order to study the behavior of a UC for EV traction power applications, it is critical to build an
accurate and dynamic model, which can estimate cell voltage variations fittingly. The equivalent RC-
branch cell models are popular and can reasonably estimate output voltage response of a UC up to an
adequate time period [7].
1.3 CLASSIFICATION OF ULTRACAPACITORS
Capacitors are of three types: Electrostatic, Electrolytic and Electrochemical. The hierarchy is
given in Fig. 1-1. The Electrostatic capacitor is the conventional one having two conducting plates
3

and a dielectric in between. In case of Electrolytic capacitors there is a conducting dielectric in
between the electrodes. Hence reducing the effective plate separation and increasing the capacitance.
The Electrochemical capacitors have porous electrodes with the electrolyte which increases the
surface area for the electrolyte to react with the electrodes and hence the capacitance.
The Electrochemical capacitors are further divided depending upon their energy storing
mechanism and their physical structure into three categories: symmetric electrochemical double layer
capacitors, asymmetric capacitors and hybrid capacitors [10]. The difference between symmetric and
asymmetric capacitors is the symmetric capacitor has both the electrodes of the same material but in
the latter one the electrodes are of different materials.
The electrochemical double layer capacitors store the electrostatic charge at the interface of the
electrolyte and electrode. The asymmetric pseudo capacitor store charge primarily through faradic
reduction and oxidation reaction at the interface of the electrolyte and electrode. In electrochemical
double layer capacitors also there is unwanted faradic processes that affect the discharge profile of
the ultracapacitor [10].
Table II: Comparison between battery, conventional capacitor and ultracapacitor
4

Fig. 1-1: Classification of the capacitors
Table 2 gives the comparison between the characteristics of the battery, electrolytic
(conventional) capacitor and the ultracapacitor [11]. It can be seen clearly that the ultracapacitor has
several advantages over the conventional energy storage mediums and have been started getting
employed in electric vehicles [12] and distributed energy systems [13].
1.4 HYBRID COMBINATION OF ULTRACAPACITORS AND BATTERIES
The ultra-capacitor combines the electrical storage capacity needed for high output and high
responsiveness with solid reliability. The hybrid combination of both batteries and UCs can
downsize the energy storage system hugely. The UCs employed in the hybrid combination stores
energy produced during deceleration and braking and provides powerful drive assist during startup,
acceleration and at other times when an extra boost is required. There are various converters
available in the literature which can be used to deliver the power to the motor.
5
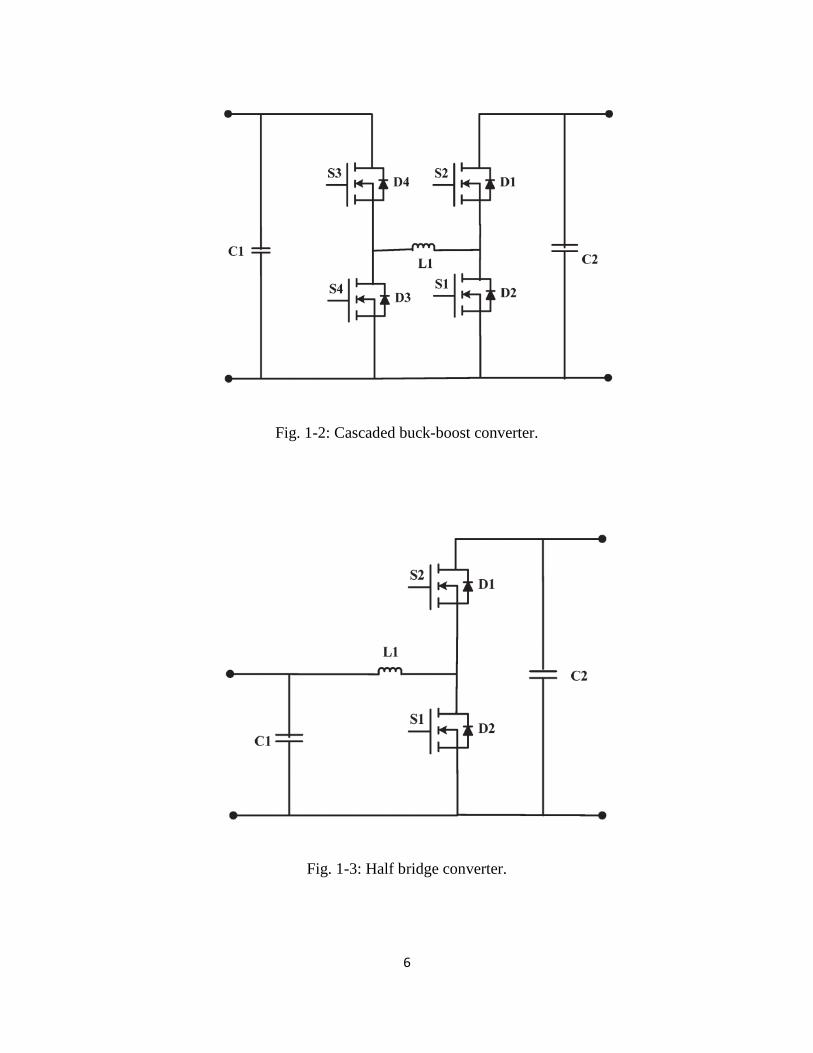
Fig. 1-2: Cascaded buck-boost converter.
Fig. 1-3: Half bridge converter.
6
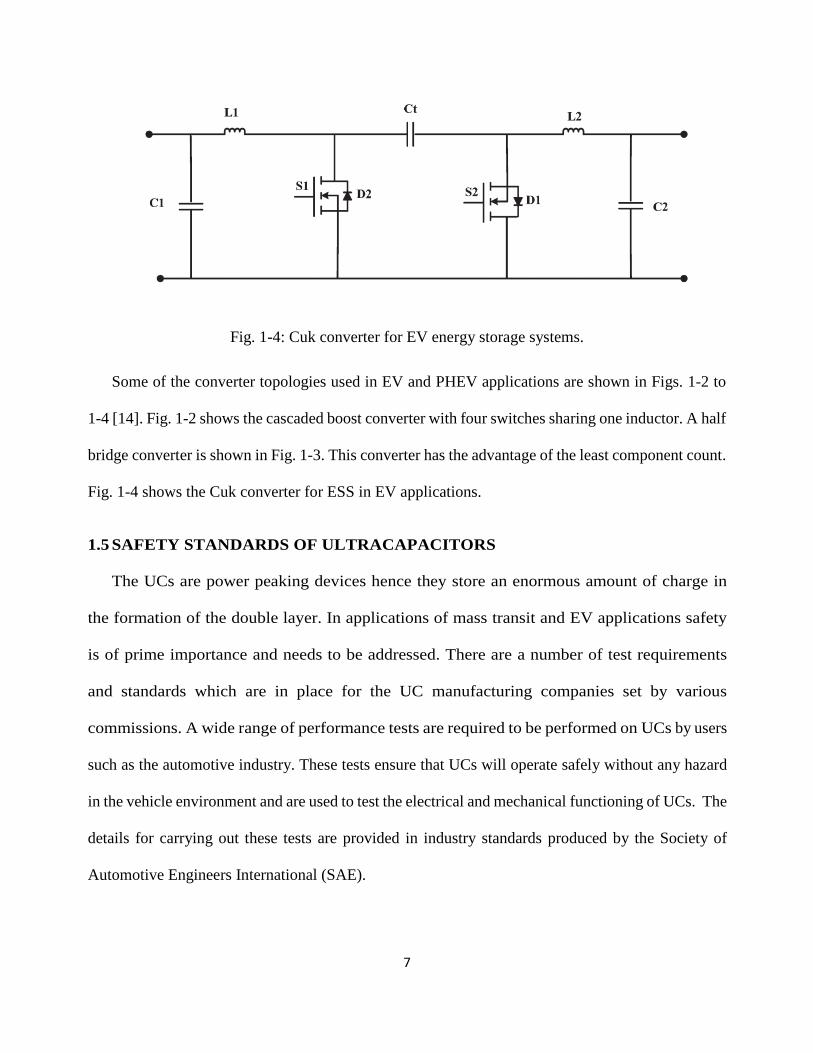
Fig. 1-4: Cuk converter for EV energy storage systems.
Some of the converter topologies used in EV and PHEV applications are shown in Figs. 1-2 to
1-4 [14]. Fig. 1-2 shows the cascaded boost converter with four switches sharing one inductor. A half
bridge converter is shown in Fig. 1-3. This converter has the advantage of the least component count.
Fig. 1-4 shows the Cuk converter for ESS in EV applications.
1.5 SAFETY STANDARDS OF ULTRACAPACITORS
The UCs are power peaking devices hence they store an enormous amount of charge in
the formation of the double layer. In applications of mass transit and EV applications safety
is of prime importance and needs to be addressed. There are a number of test requirements
and standards which are in place for the UC manufacturing companies set by various
commissions. A wide range of performance tests are required to be performed on UCs by users
such as the automotive industry. These tests ensure that UCs will operate safely without any hazard
in the vehicle environment and are used to test the electrical and mechanical functioning of UCs. The
details for carrying out these tests are provided in industry standards produced by the Society of
Automotive Engineers International (SAE).
7
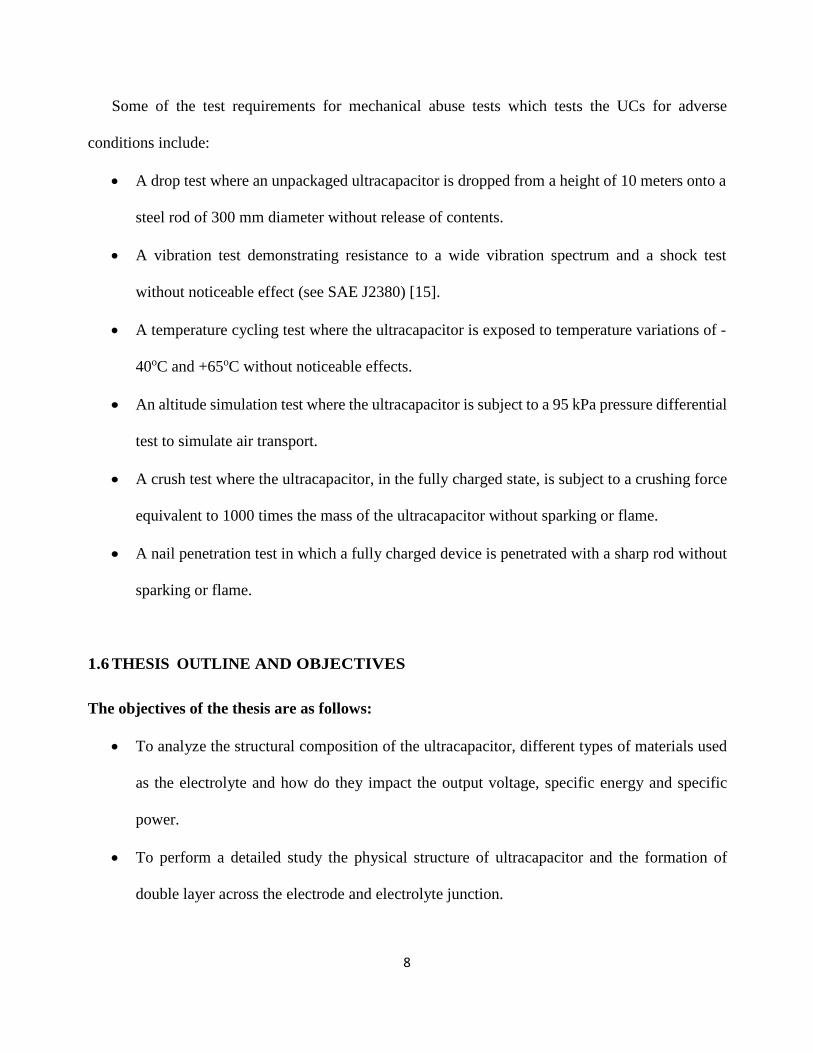
Some of the test requirements for mechanical abuse tests which tests the UCs for adverse
conditions include:
• A drop test where an unpackaged ultracapacitor is dropped from a height of 10 meters onto a
steel rod of 300 mm diameter without release of contents.
• A vibration test demonstrating resistance to a wide vibration spectrum and a shock test
without noticeable effect (see SAE J2380) [15].
• A temperature cycling test where the ultracapacitor is exposed to temperature variations of -
40oC and +65oC without noticeable effects.
• An altitude simulation test where the ultracapacitor is subject to a 95 kPa pressure differential
test to simulate air transport.
• A crush test where the ultracapacitor, in the fully charged state, is subject to a crushing force
equivalent to 1000 times the mass of the ultracapacitor without sparking or flame.
• A nail penetration test in which a fully charged device is penetrated with a sharp rod without
sparking or flame.
1.6 THESIS OUTLINE AND OBJECTIVES
The objectives of the thesis are as follows:
• To analyze the structural composition of the ultracapacitor, different types of materials used
as the electrolyte and how do they impact the output voltage, specific energy and specific
power.
• To perform a detailed study the physical structure of ultracapacitor and the formation of
double layer across the electrode and electrolyte junction.
8

• To perform a comprehensive review of the RC equivalent circuit models of the ultracapacitor
available in the literature.
• To develop a dynamic parameter estimation technique to identify the RC equivalent branch
parameters dynamically.
• To implement the parameter estimation technique along with the RC equivalent model in
MATLAB/Simulink.
• To validate the simulation results obtained from the model with the experimental charging
results.
The structure of the thesis is as follows. Chapter 2 presents a brief overview of the internal
structure of the ultracapacitor. The different types of electrolyte material used, the micro
structure (micropores and macropores) of the electrolyte, how the double layer is formed is
discussed. The variation of the ultracapacitor characteristics and internal resistance with the
frequency of the applied voltage and current, temperature are also discussed. Finally the
voltage dependency of the ultracapacitor is presented.
Chapter 3 discusses various RC equivalent models available in the literature like single
branch RC equivalent model, RC transmission line model, RC series-parallel model etc. A
detailed analysis and comparison of the available models is presented. The chosen two branch
model is discussed for its advantages for EV and mass transit applications. The analysis and
modeling of the two branches physically with the ultracapacitor’s porous structure is presented.
Chapter 4 presents the proposed dynamic parameter estimation technique used to identify
9
the RC branch parameters of the two branch RC equivalent model. The characteristic equations
required to obtain the characteristic parameters are used. The whole algorithm and procedure
to estimate the branch parameters dynamically from the output voltage is discussed in detail.
A block diagram and flowchart presents more clarified picture of the whole dynamic estimation
technique.
Chapter 5 includes the simulation results obtained from the model using proposed dynamic
parameter estimation technique. The waveforms are presented for different charging and
discharging currents and for ultracapacitors of varied ratings. The results are compared with the
RC equivalent branch models with known branch parameters for clarity. The results for random
charging and discharging pulses are also presented.
Chapter 6 presents the validation of the simulation results against the experimental constant
charging results for different values of charging current.
Chapter 7 summarizes the thesis work and suggest the future work which can be done as the
current work’s expansion.
10

Chapter 2: Ultracapacitor’s Internal Structure
2.1 ULTRACAPACITOR’S STRUCTURE
Ultracapacitors store energy in the form of electric field (electrostatically) by polarizing the
electrolytic solution [16], [17]. A separator is placed between the activated carbon electrodes which
also acts as an insulator. Carbon which has a high surface material is used because it also has near
ideal charge/discharge characteristics. Other high surface area material besides carbon may be used,
but carbon because of its aforementioned qualities is employed [18]. Although there is no physical
contact, ion transfer occurs between the electrodes [19]. Fig. 2-1 illustrates the simplified structure
and different components of the DLC.
Contact
Contact
Separator
Carbon electrodes
Fig. 2-1: Simplified structure of a UC.
Ultracapacitors can have either an aqueous or non-aqueous electrolyte. If aqueous electrolyte is
used energy densities of 5500 Wh/m3 can be achieved. Similarly if non-aqueous electrolyte is
11
employed energy densities of 20,000 Wh/m3 can be achieved [20]. The selection of an aqueous
electrolyte versus a non-aqueous electrolyte is a tradeoff between the operating voltage and the
equivalent series resistance (ESR) of the DLC. Ultracapacitors with aqueous electrolytes exhibit a
lower value of ESR and lower operating voltage which further results in lower energy densities and
higher power densities than the ultracapacitors with non-aqueous electrolytes. On the other hand
ultracapacitors with non-aqueous electrolytes have higher operating voltage and higher value of ESR.
The maximum voltage which can be applied on an ultracapacitor is limited. If it’s too high the
electrolyte of the ultracapacitor suffers dissociation, which results in permanent deterioration of the
ultracapacitor. The voltage at which dissociation occurs, and therefore the maximum safe voltage,
varies with the type of electrolyte being used in the ultracapacitor. It is expected that the maximum
safe voltage should be high because the energy directly depends on the square of the voltage.
It is also expected to have lower value of ESR (equivalent series resistance) in order to achieve
high efficiency. The ultracapacitors with aqueous electrolyte have lower values of ESR as compared
to the ultracapacitors with non-aqueous electrolyte. Also in order to have large capacitance values
the area A should be maximized and the distance d should be minimized. The ultracapacitors are
made in such a way that it satisfies both the aforementioned criteria.
Fig. 2-2 shows inner and outer Helmholtz plane and a very small ionic separation distance d, that
in some cases is on the order of a few angstroms. The basic capacitor cell has porous activated carbon
electrodes and positive and negative current collector. The electrodes are separated by a separator.
This separator basically acts as an insulting medium between the two porous electrodes and lets the
conducting ions pass through it.
12

Fig. 2-2: Electrode/Electrolyte Interface of a Double Layer Capacitor
If the capacitance of a capacitor is to be increased then it is the contact surface area that needs to
be increased. To increase the contact surface area the electrodes of special material with the porous
structure should be employed which would apparently have large specific surface. The commonly
used materials for these types of electrodes is activated carbon or carbon nano-tubes having the
specific surface as high as 1000-3000 m2/g.
The cell construction of the UCs is comprised of in-line stack of electrodes, which is different
from a bobbin-type wound electrode design. This results in an extremely low series inductance which
allows easy stabilization with the switch mode chargers. The basic construction of UC with low
inductance results in fast pulse rise time. In case of the RC equivalent models an additional inductance
can be added to model the impacts of the fast changing loads.
13

2.2 DISTRIBUTED NATURE OF ULTRACAPACITORS
The capacitance in an ultracapacitor is created at the interface of the electrode bulk material and
the electrolyte once the ionic charges in the bulk material and the electrolyte accumulate at the
interface surface. Hence, if the surface area of the interface between electrode and electrolyte is
increased we can have large capacitance value, as the capacitance is directly proportional to the
effective interface surface area. Carbon as a porous electrode material has a specific surface area of
a few thousands m2/g. The porous structure of the carbon electrode has pores of varying sizes:
macropores, mesopores, micropores and submicropores. Fig. 2-3 shows the activated carbon with
macropores, mesopores and micropores. As the mobility of ions is finite, the ions are not able to
charge the entire surface of the electrode at all frequencies. The ions have sufficient time to reach the
even the smallest pores: micropores and submicropores at low frequencies (approaching DC). But as
the frequency is increased, the ions do not have sufficient time to totally charge the smaller pores,
and may only be able to charge the larger macropores.
Micropores
Macropores
Mesopore
Sub-micropore
Porous electrode
Fig. 2-3. Activated carbon, showing macropores, mesopores, micropores, and sub-micropores
14

Due to this fact there is a difference in the capacitance of the device, being at lower and higher
frequencies. At higher frequencies the effective surface area is mostly due to the surface area
contribution by macropores, however in case of the lower frequencies, the effective surface area is
due to the surface area contribution not only by macropores but mesopores, micropores and
submicropores also (assuming that sufficient time is allowed and ion mobility and population do not
hinder the process). Hence the ions populating these smaller pores greatly increase the effective
surface area of the interface and which further increases the capacitance of the device.
2.3 FREQUENCY DEPENDENCY OF ULTRACAPACITORS
The frequency of the applied voltage and current has an impact on the capacitance and the internal
resistance of the ultracapacitor. An approach to characterize the electrochemical behavior of the
ultracapacitors (energy storage systems) is the electrochemical impedance spectroscopy (EIS). EIS
allows us to analyze the effects of the frequency of the applied voltage and current on the internal
(ohmic) resistance and the capacitance of the ultracapacitor.
EIS gives us the freedom to determine the real and imaginary part of the impedance by measuring
the current amplitude and phase with respect to the injected voltage [21]. Fig. 2-4 gives the variation
of the real part of the impedance with the frequency. It can be seen that there is a steep rise in the
ohmic resistance when the frequency is low [10]. This steep rise is assumed to be because of the
following reasons: a leakage current through the separator, the charge redistribution effects inside
the electrode and self-discharge. The zone 1 (at low frequencies from 0.001 Hz to 0.01 Hz) basically
accounts for series and parallel resistances. But at very low frequencies parallel resistance is
dominating.
15
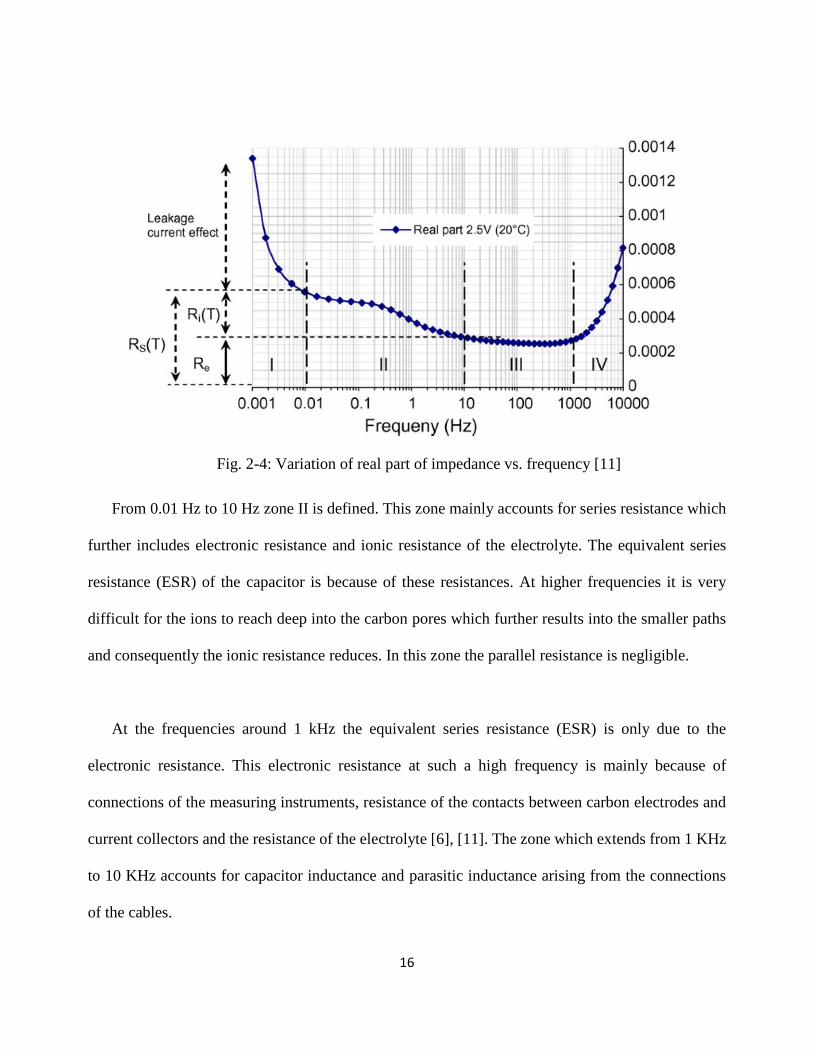
Fig. 2-4: Variation of real part of impedance vs. frequency [11]
From 0.01 Hz to 10 Hz zone II is defined. This zone mainly accounts for series resistance which
further includes electronic resistance and ionic resistance of the electrolyte. The equivalent series
resistance (ESR) of the capacitor is because of these resistances. At higher frequencies it is very
difficult for the ions to reach deep into the carbon pores which further results into the smaller paths
and consequently the ionic resistance reduces. In this zone the parallel resistance is negligible.
At the frequencies around 1 kHz the equivalent series resistance (ESR) is only due to the
electronic resistance. This electronic resistance at such a high frequency is mainly because of
connections of the measuring instruments, resistance of the contacts between carbon electrodes and
current collectors and the resistance of the electrolyte [6], [11]. The zone which extends from 1 KHz
to 10 KHz accounts for capacitor inductance and parasitic inductance arising from the connections
of the cables.
16
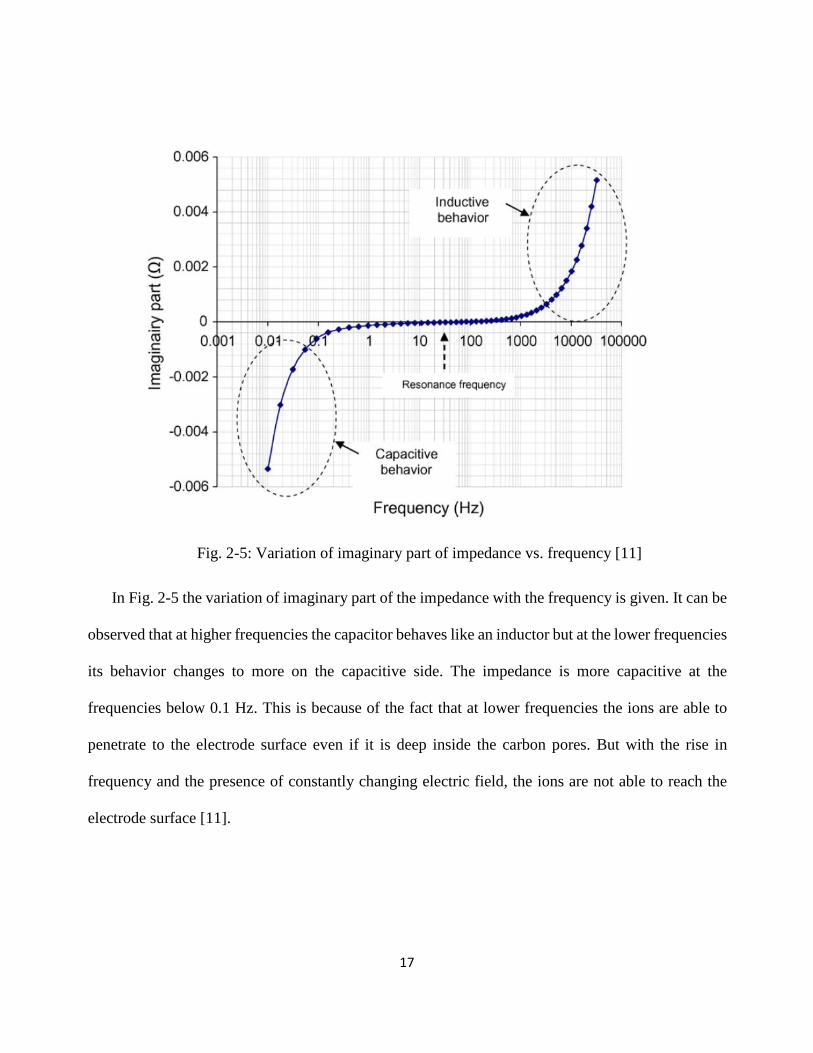
Fig. 2-5: Variation of imaginary part of impedance vs. frequency [11]
In Fig. 2-5 the variation of imaginary part of the impedance with the frequency is given. It can be
observed that at higher frequencies the capacitor behaves like an inductor but at the lower frequencies
its behavior changes to more on the capacitive side. The impedance is more capacitive at the
frequencies below 0.1 Hz. This is because of the fact that at lower frequencies the ions are able to
penetrate to the electrode surface even if it is deep inside the carbon pores. But with the rise in
frequency and the presence of constantly changing electric field, the ions are not able to reach the
electrode surface [11].
17

2.4 TEMPERATURE DEPENDENCY OF ULTRACAPACITORS
Both equivalent series resistance (ESR) and the capacitance are dependent on the operating
temperature of the application in the capacitor is employed in. The applications like electric vehicles
(EV) and hybrid electric vehicles (HEV) have different operating temperatures which stretches to
even below -10o C in some cases. The ionic resistance component of the equivalent series resistance
(ESR) is mainly effected by the temperature variation. This is because the viscosity changes with the
variation in temperature.
Fig. 2-6: Variation of ESR and capacitance with temperature [23]
The variation of the temperature also has an effect on the self-discharge rate. This is because at
higher temperatures the movement of the ions is accelerated and there are more ions near the
electrodes. Hence creating a higher diffusion and higher self-discharge rate [22]. Fig. 2-6 [23] depicts
the variation of the ESR and capacitance with the temperature.
18

2.5 VOLTAGE DEPENDENCY OF ULTRACAPACITORS
The capacitance of the ultracapacitor varies with the variation of the voltage, unlike the
conventional capacitor. The reason for the variation is not physically well interpreted in the literature
but it can thought that this may be because of the decrease in the distance between the charges at the
electrode and the electrolyte. The capacitance of the ultracapacitor has a part which varies with the
applied voltage and one should always take this variable part into account while making a dynamic
model of the ultracapacitor. This voltage dependent part is expressed by the differential capacitance
which the modified version of normal capacitance definition and is defined as the change in the
charge due to the change in the voltage.
dVdQCdiff = (1)
Fig. 2-7: Variation of capacitance with the applied voltage [11]
There are various methods in the literature to derive this differential capacitance. One of them is the
19

linear approximation, which is the most commonly used method of deriving the differential
capacitance. According to the linear approximation the expression for the differential capacitance is
given as:
VKCC VOdiff .+= (2)
Where Co is the constant part of the capacitance, Kv is the slope (F/V) and V is the applied voltage
[24], [25]. The variable Kv in (2) is the voltage dependent capacitance which can also be written as
Cv. Fig. 2-7 shows the generic form of variation of ultracapacitor’s capacitance with the voltage.
20

Chapter 3: Ultracapacitor RC Equivalent Models
The ultracapacitor has much more complex electrical characteristics than that of the conventional
ones. An ideal capacitor stores the energy without any energy losses but in case of the real capacitor
there are losses because of the internal resistance and leakage currents. Hence to have a correct idea
of the working of the ultracapacitor we need to have a dynamic model or an equivalent circuit, which
can accurately represent the behavior of the ultracapacitor [10].
In order to obtain the ultracapacitor response under various operating conditions we need to
design and model the ultracapacitors [26]. A dynamic electro-thermal model is presented in [27].
The electrical model of the UCs is not commonly known as these are the electrochemical devices.
Several models have been developed in recent years to illustrate the performance of the UCs. Three
modeling approaches have been used: mathematical modeling, electrical modeling and non-
electrical modeling (artificial neural network model). The mathematical models have complicated
computations and too many parameters that need to be identified experimentally. The non-electric
models have same types of shortcomings [7].
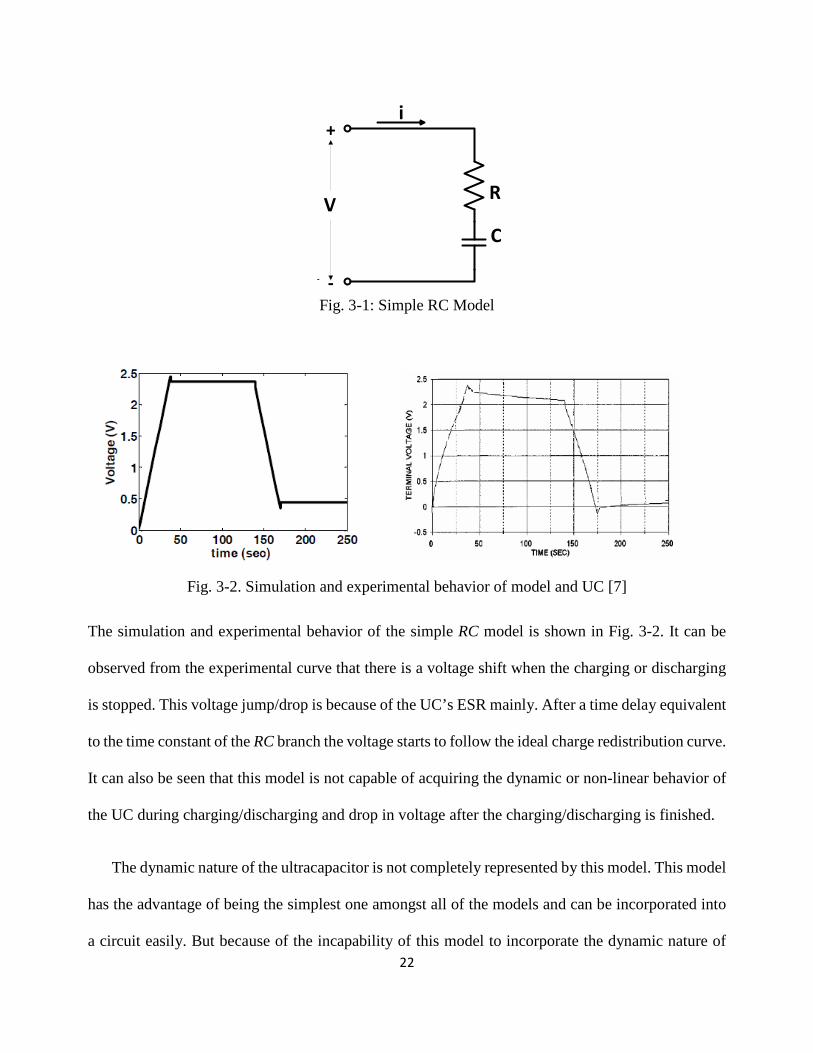
3.1 SINGLE BRANCH RC MODEL
The simplest and commonly used UC model in the literature is the RC model Fig. 3-1. This
model has only one branch composed of two elements: one resistor (ESR) and one capacitor. The
resistance R (ESR) models the UC’s ohmic losses and the capacitor C models the capacitance of
the UC.
21
R
C
i
V
+
- - Fig. 3-1: Simple RC Model
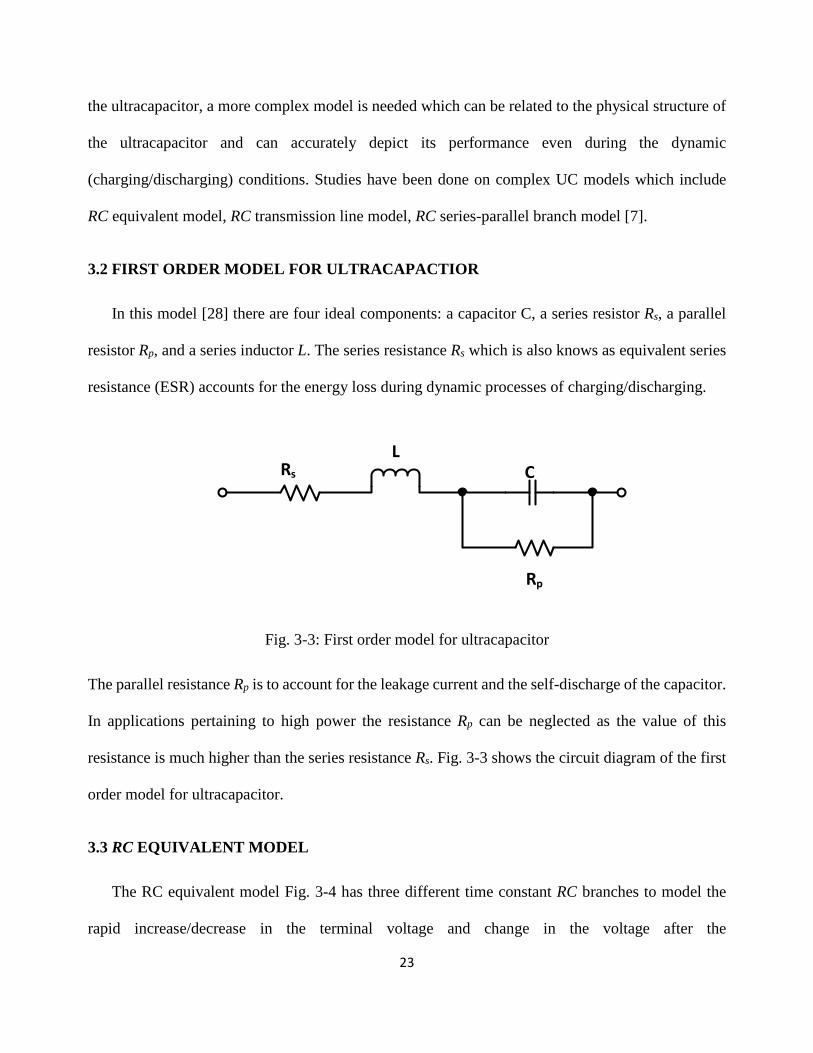
Fig. 3-2. Simulation and experimental behavior of model and UC [7]
The simulation and experimental behavior of the simple RC model is shown in Fig. 3-2. It can be
observed from the experimental curve that there is a voltage shift when the charging or discharging
is stopped. This voltage jump/drop is because of the UC’s ESR mainly. After a time delay equivalent
to the time constant of the RC branch the voltage starts to follow the ideal charge redistribution curve.
It can also be seen that this model is not capable of acquiring the dynamic or non-linear behavior of
the UC during charging/discharging and drop in voltage after the charging/discharging is finished.
The dynamic nature of the ultracapacitor is not completely represented by this model. This model
has the advantage of being the simplest one amongst all of the models and can be incorporated into
a circuit easily. But because of the incapability of this model to incorporate the dynamic nature of 22
the ultracapacitor, a more complex model is needed which can be related to the physical structure of
the ultracapacitor and can accurately depict its performance even during the dynamic
(charging/discharging) conditions. Studies have been done on complex UC models which include
RC equivalent model, RC transmission line model, RC series-parallel branch model [7].
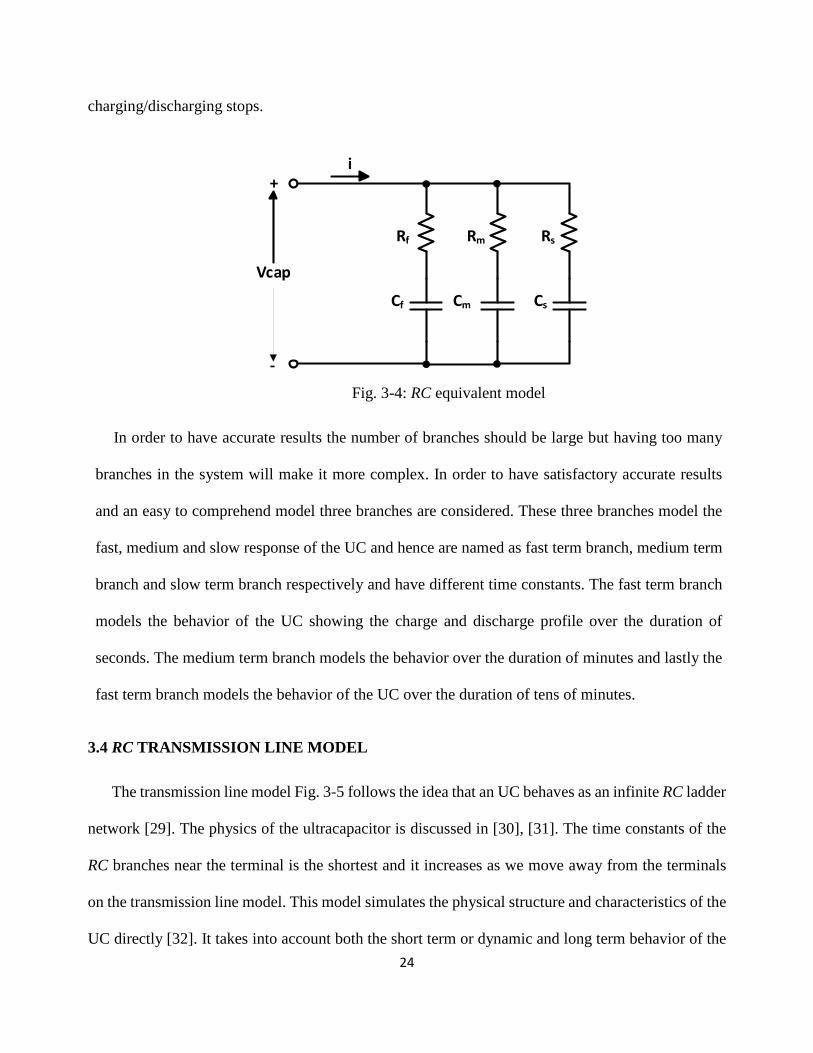
3.2 FIRST ORDER MODEL FOR ULTRACAPACTIOR
In this model [28] there are four ideal components: a capacitor C, a series resistor Rs, a parallel
resistor Rp, and a series inductor L. The series resistance Rs which is also knows as equivalent series
resistance (ESR) accounts for the energy loss during dynamic processes of charging/discharging.
Rs
L
Rp
C
Fig. 3-3: First order model for ultracapacitor
The parallel resistance Rp is to account for the leakage current and the self-discharge of the capacitor.
In applications pertaining to high power the resistance Rp can be neglected as the value of this
resistance is much higher than the series resistance Rs. Fig. 3-3 shows the circuit diagram of the first
order model for ultracapacitor.
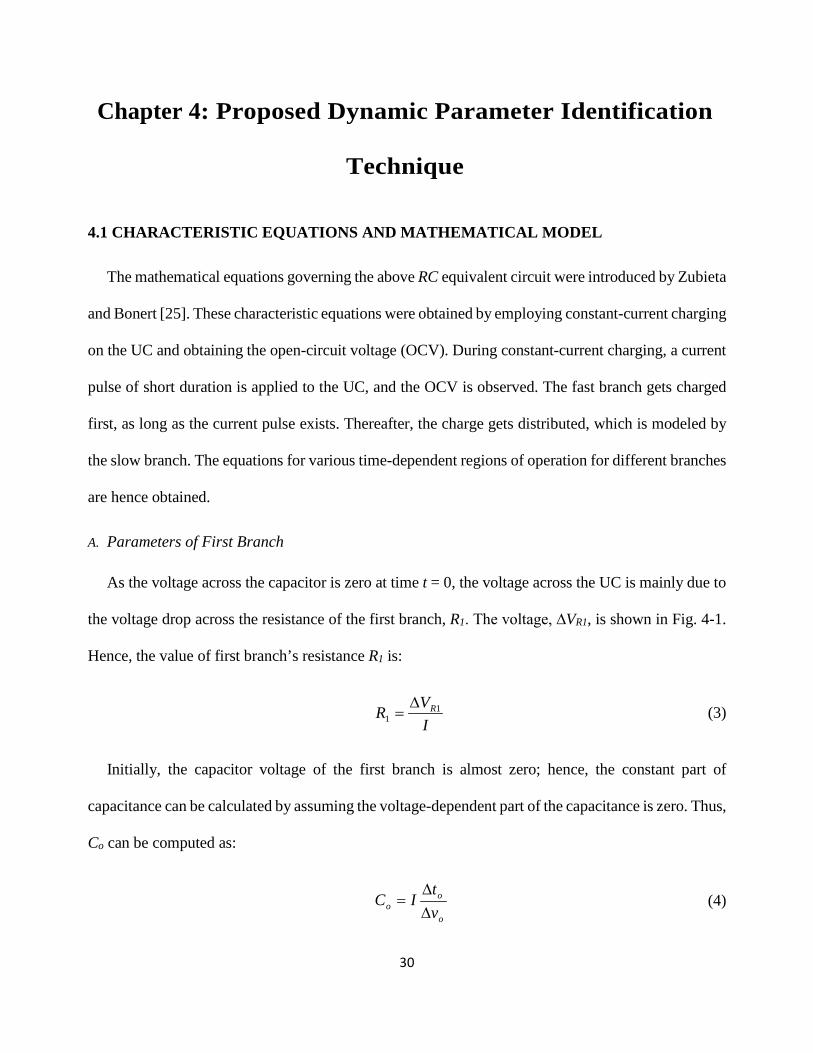
3.3 RC EQUIVALENT MODEL
The RC equivalent model Fig. 3-4 has three different time constant RC branches to model the
rapid increase/decrease in the terminal voltage and change in the voltage after the
23
charging/discharging stops.
Rf Rm Rs
Cf Cm Cs
-
+i
Vcap
Fig. 3-4: RC equivalent model
In order to have accurate results the number of branches should be large but having too many
branches in the system will make it more complex. In order to have satisfactory accurate results
and an easy to comprehend model three branches are considered. These three branches model the
fast, medium and slow response of the UC and hence are named as fast term branch, medium term
branch and slow term branch respectively and have different time constants. The fast term branch
models the behavior of the UC showing the charge and discharge profile over the duration of
seconds. The medium term branch models the behavior over the duration of minutes and lastly the
fast term branch models the behavior of the UC over the duration of tens of minutes.
3.4 RC TRANSMISSION LINE MODEL
The transmission line model Fig. 3-5 follows the idea that an UC behaves as an infinite RC ladder
network [29]. The physics of the ultracapacitor is discussed in [30], [31]. The time constants of the
RC branches near the terminal is the shortest and it increases as we move away from the terminals
on the transmission line model. This model simulates the physical structure and characteristics of the
UC directly [32]. It takes into account both the short term or dynamic and long term behavior of the 24

UC. But on the other hand it makes more complex analytical expression which is not easy to simulate.
If only the first three branches are considered, assuming that the time constants associated with the
branches beyond three are neglected, then it will take the form of RC equivalent model with three
branches.
R1 R2 R3 Rn
C1 C2 C3 Cn
i(t)
V(t)
Fig. 3-5: RC Transmission Line model
There are various advantages of this model. First of all it physically represents the distributed
nature of the ultracapacitor, secondly its performance curve accurately matches the experimental
data well within the wide range of frequencies. It can also be easily used in conjunction to the
various load and it is easy to implement by using the order reduction method. The only disadvantage
of this model is in the applications pertaining to power electronics where the working range of the
ultracapacitor is in seconds to a few minutes. So only two or three RC branches, with different time
constants, are needed to interpret the behavior of the ultracapacitor.
3.5 RC SERIES PARALLEL BRANCH MODEL
The RC series-parallel branch model Fig. 3-6 is formed by the combination of the series and
parallel RC branches. The series resistance represents the equivalent series resistance (ESR) and
series capacitance and parallel RC branches represents UC’s pore impedance.
25

Ra
R1
R2
Ca
C1
C2
i
V
+
-
Fig. 3-6: RC series-parallel branch model
3.6 RC MULTI STAGE LADDER MODEL
There are many models based on the porous electrode theory [33]-[35]. The RC multi stage ladder
model was first introduced by Miller et. al [36], [37]. The ladder circuit up to five stages gives
sufficiently accurate results for the frequency range up to 10 kHz. A general 5 stage ladder circuit is
given in the Fig. 3-7 [33]-[39].
R5 R4 R3 R2 R1
L
C5 C4 C3 C2 C1
+
-
Vt
Fig. 3-7: RC multi-stage ladder model
This multi stage ladder model has an advantage of being shortened up by the circuit reduction
method. In order to have a fourth order ladder from 5 order ladder, the fourth order capacitor and
resistor of the fourth order ladder is substituted the value C5+C4 and R5+R4 respectively. 26

R5+R4+R3+R2 R1
C5+C4+C3+C2 C1
+
-
Vt
Fig. 3-8: Reduced order model of ultracapacitor (from 5 order to 2 order)
To make further reduction in the order of the ladder, the values of the capacitor and resistor is
modified accordingly. For instance the values of 2 order capacitor and resistor in a 2 order ladder
will be C5+C4+C3+C2 and R5+R4+R3+R2 respectively as shown in Fig. 3-8 [39].
3.7 FOUR BRANCHES (ZUBEITA MODEL)
Zubieta and Bonert carried out experiments and proposed an RC circuit model having three
branches having different time constants which can provide sufficiently accurate results till the
desired time range [25]. In order to have a good accuracy till 30 minutes of operation then three
branches is the minimum number to include in the model. The difference between this model and the
RC equivalent circuit with three branches is that this model includes a differential capacitor. This
differential capacitor consists both a constant capacitance Cio and a capacitance Ci1*V which is
voltage dependent, in the immediate branch. The second branch has a different time constant and is
called delayed branch and dominated the behavior of the ultracapacitor for the duration of minutes.
The third branch has the longest time constant. It is called the long-term branch and accounts for the
behavior of the ultracapacitor for the duration longer than ten minutes. Fig. 3-9 shows the Zubieta
model.
27

Rd Rl
Ci0 Cd
Ri
Rlea
Ci1*Vci Cl
+
-
Vt
Vci
+
-
Fig. 3-9: Zubieta and Bonert model
3.8 TWO BRANCHES (FRANDA MODEL)
Franda proposed a two branches model which has only two RC branches in parallel [24]. This
model was proposed for power electronic applications where the ultracapacitor behavior is concerned
from seconds to a few minutes. In this model the first branch consists of resistor Ro and two parallel
capacitances, one constant Co and another variable one dependent upon the voltage Kv*V. This model
uses different method of parameter identification. The Franda model is shown in Fig. 3-10.
R2
Co C2
Ro
EPR
Kv.V
+
-
Vt
Fig. 3-10: Franda model of ultracapacitor
28

3.9 CHOSEN UC MODEL FOR EV TRACTION
It is proven in related literature that current profiles for UCs employed in EVs are composed of
repetitive charge and discharge cycles [34]-[36]. An RC equivalent UC model, with two RC branches
connected in parallel, for EV traction is shown in Fig. 3-11. This model is able to capture the dynamic
behavior of several UCs for sufficient amount of time, with different capacities and voltage ratings.
The choice of two branches is based on the fact that the estimation from two branches gives a correct
approximation for a sufficient amount of time.
Cv Co
R1 R2
C2
Vo
I I2
I-I2
+
-
A
A’ B’
B
Fig. 3-11: RC equivalent model for EV applications.
The first branch which consists of the resistor R1 and the parallel combination of Cv and Co i.e. (C1)
is the fast branch, where Cv is the voltage dependent capacitance. This branch is responsible for the
immediate behavior of the UC (charging/discharging) over a duration of seconds. This models the
physical behavior of the interaction of the ions with the macropores and mesopores of the electrode
surface. The other branch, with resistor R2 and capacitor C2, is the slow branch, and models the
redistribution of the ions to the micropores and sub-micropores, at the end of charging or discharging.
Thus, the RC equivalent model can be related to the UC physically.
29
Chapter 4: Proposed Dynamic Parameter Identification
Technique
4.1 CHARACTERISTIC EQUATIONS AND MATHEMATICAL MODEL
The mathematical equations governing the above RC equivalent circuit were introduced by Zubieta
and Bonert [25]. These characteristic equations were obtained by employing constant-current charging
on the UC and obtaining the open-circuit voltage (OCV). During constant-current charging, a current
pulse of short duration is applied to the UC, and the OCV is observed. The fast branch gets charged
first, as long as the current pulse exists. Thereafter, the charge gets distributed, which is modeled by
the slow branch. The equations for various time-dependent regions of operation for different branches
are hence obtained.
A. Parameters of First Branch
As the voltage across the capacitor is zero at time t = 0, the voltage across the UC is mainly due to
the voltage drop across the resistance of the first branch, R1. The voltage, ∆VR1, is shown in Fig. 4-1.
Hence, the value of first branch’s resistance R1 is:
IVR R1
1∆
= (3)
Initially, the capacitor voltage of the first branch is almost zero; hence, the constant part of
capacitance can be calculated by assuming the voltage-dependent part of the capacitance is zero. Thus,
Co can be computed as:
o
oo v
tIC∆∆
= (4)
30

Fig. 4-1: Measurement of ΔVR1.
The value of ∆Vo and ∆to is calculated from the initial data of the curve, and is shown in Fig. 4-2.
Fig. 4-2: Measurement of ∆Vo and ∆to.
The total capacitance of the first branch (or the differential capacitance) is computed as the sum of
the constant capacitance and the voltage dependent capacitance, multiplied by the voltage across the
first branch capacitor.
31

1Cvodiff VCCC += (5)
Differential capacitance can also be written as:
dVdQCdiff = (6)
From (5) and (6), the value of the capacitor having the same charge as that of the UC can be computed
as:
12 Cv
oq VCCC += (7)
Total charge supplied to the UC is:
VCQ q= (8)
From (7) and (8), Cv can be easily computed as:
)(22 oo
ov VCQ
VC −= (9)
Cv Co
R1
Vo
I
Fig. 4-3: Equivalent circuit of first branch during charging. 32
The equivalent circuit of the first branch is given in Fig. 4-3. This branch of the model is in function
during the time of charging i.e. when the ions interact with the macro-pores and meso-pores.
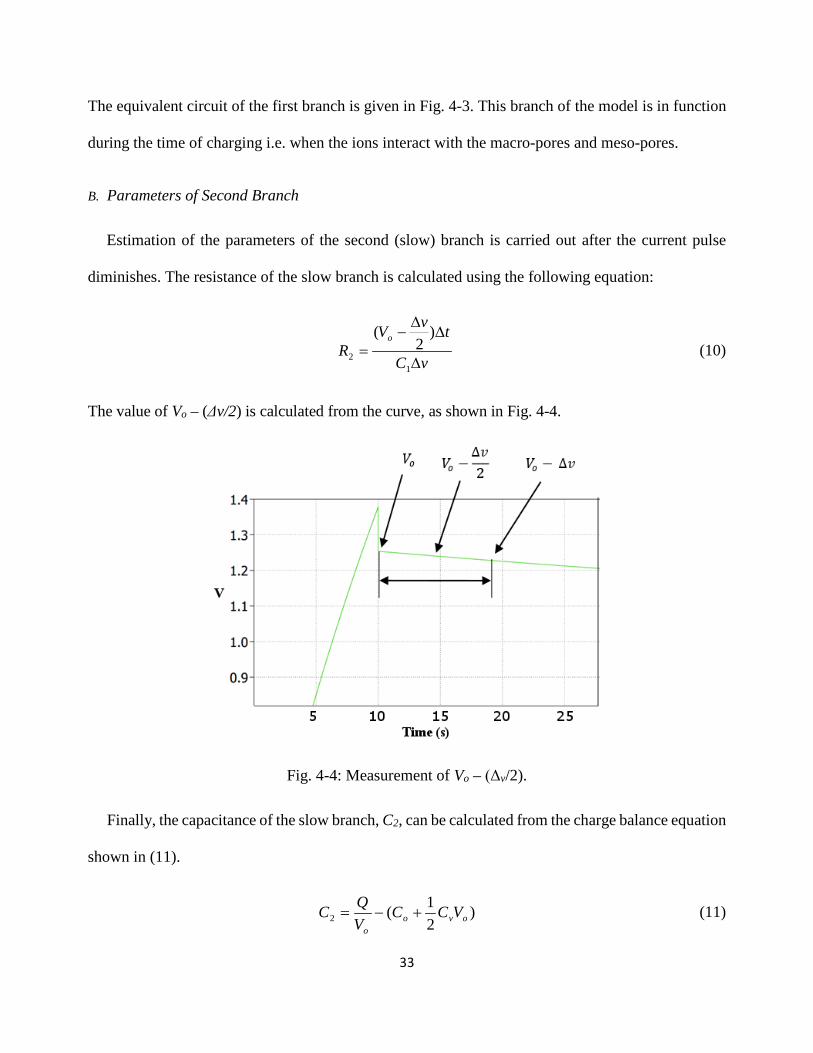
B. Parameters of Second Branch
Estimation of the parameters of the second (slow) branch is carried out after the current pulse
diminishes. The resistance of the slow branch is calculated using the following equation:
vC
tvVR
o
∆
∆∆
−=
12
)2
( (10)
The value of Vo – (Δv/2) is calculated from the curve, as shown in Fig. 4-4.
Fig. 4-4: Measurement of Vo – (Δv/2).
Finally, the capacitance of the slow branch, C2, can be calculated from the charge balance equation
shown in (11).
)21(2 ovo
o
VCCVQC +−= (11)
33

Cv Co
R1 R2
C2
I2
Fig. 4-5: Equivalent circuit of second branch during charging.
Fig. 4-5 shows the equivalent RC circuit of the model, when the charging is stopped, and the
charge is transferred from the first branch to second branch, i.e. during distribution of charge in the
micro and sub-micro pores takes place.
4.2 PROPOSED METHOD TO DYNAMICALLY ESTIMATE THE CHARACTERISTIC
EQUATION PARAMTERS
The characteristic equations’ parameters of the UC need to be estimated dynamically in order to
estimate the OCV of the UC. The model of UC requires the exact values of ∆vo, ∆to, ∆v, ∆t, and ∆VR1,
which vary with capacitance and with the current pulse applied. Also, the values of Co and Cv are
different for different UCs and depend on ∆v and ∆t. Hence, if an accurate estimation has to be made,
the values of ∆v, ∆t, ∆VR1, Co, Cv, and R2 need to be identified in real time. The values of the parameters
are to be calculated solely with the knowledge of the OCV and characteristic parameters (which are
determined by the characteristic equations) through dynamic parameter identification.
34

Firstly, it can be seen from the characteristic equations of Co and Cv that these parameters depend
on OCV. This forms an inter-dependent system. Hence, in order to compute the OCV and have the
model running, the initial values of these parameters must be estimated. Secondly, it is not possible to
obtain the values of ∆vo, ∆to, ∆v, and ∆t, used in the equations of Co and R2 (4) and (10), directly from
the output plot, especially if OCV plot is not known. These issues can be addressed, if a close enough
initial guess is made possible for the parameters’ values, so that the OCV can use the characteristic
equations later, to estimate an exact profile. The initial guess includes the estimation of the branch
parameters Co and R2.
A. Estimation of Co
The estimation of Co was done by running simulation tests on UCs for different ratings and values
of Co. It was observed that the value of Co varies almost linearly with the value of capacitance of the
UC. For instance, a 470F UC has a Co of 275F, while a 1500F capacitor has a Co of 900F. Hence, a
linear relationship can be easily formulated between UC capacity and Co. This helps determine the
initial value of Co and thereafter, Co adjusts itself and provides the appropriate output. For example,
for a UC with capacitance ranging from 250-500F, the linear equation for Co will be: Co = 57.23% of
the UC’s capacitance value, while for capacitance in the range of 500-750F, the value will be: Co =
58.57% of the UC’s capacitance value.
B. Estimation of R2
For R2, the estimation is performed after charging is stopped or the charging current pulse is
diminished. The problem with the equation of R2 is that it has ∆v/∆t in the denominator, which
increases instantly after charging is stopped, making estimation of R2 difficult. R2 can be estimated
by devising an empirical equation at different charging times and observing the decrease in voltage
due to the charge redistribution for a fixed time, after charging stops (40s, for example). This 35

empirical equation will be for a UC with capacitance in the medium range (450-600F). Once the
empirical equation for a particular capacitor is obtained, a multiplication factor can be formulated, in
order to obtain the value of R2 for different capacitances. This multiplication factor is obtained by
comparing the values of different extracted values of R2 for the same charging time. For instance,
empirical equation for R2 for 470F capacitor, at different charging times, can be expressed as:
))6977.1()12328.8()15901.3()9124.6()0003.0(321.1(
3
56422
on
onononon
tetetetetmfR
×−−
×−−×−+×−+×+×=
(12)
In (12), mf is the formulated multiplication factor, whose equation for a UC with the capacitance
ranging from 50-3000F is given as:
CCemf ×−×−+= )02841.0()133816.9(4903.16 6 (13)
In (13), C is the capacitance of the UC. Multiplying this multiplication factor with the value
obtained from the empirical equation of R2 (as a base value), the exact value of R2 can be determined.
Hence, accurate values of R2, for UCs between 50F and 3000F, can be estimated.
Table III. Parameters of UCs used to obtain empirical equations.
Value C = 470F C = 1500F C = 3000F
R1 2.5mΩ 1.5mΩ 1.38mΩ Co 270F 900F 1973F Cv 190F/V 600F/V 240F/V
R2 0.9Ω 0.4Ω 6.83Ω C2 100F 200F 592.07F
Table 3 summarizes the parameters of different UCs, which help assist in formulating the generic
parametric equations derived above. The parameters enlisted in Table 2 are for two RC branches.
36

Inputs (UC rating, charging current and time)
Guess the initial value of Co based on the UC rating
Estimate Cv once initial guess of Co is available
Estimate output voltage during charging/discharging (first branch only)
Estimate R2 from the empirical equation after the charging/discharging stops
Estimate output voltage after the charging/discharging stops (distribution of charge from first branch to second
branch)
Number of cycles over?
No
Yes
Start
Stop
Fig. 4-6: Flowchart representation of the dynamic estimation method.
The complete dynamic identification/estimation technique in the form of a flowchart is shown in Fig.
37
4-6. The steps listed are used to obtain the characteristic equations’ parameters.
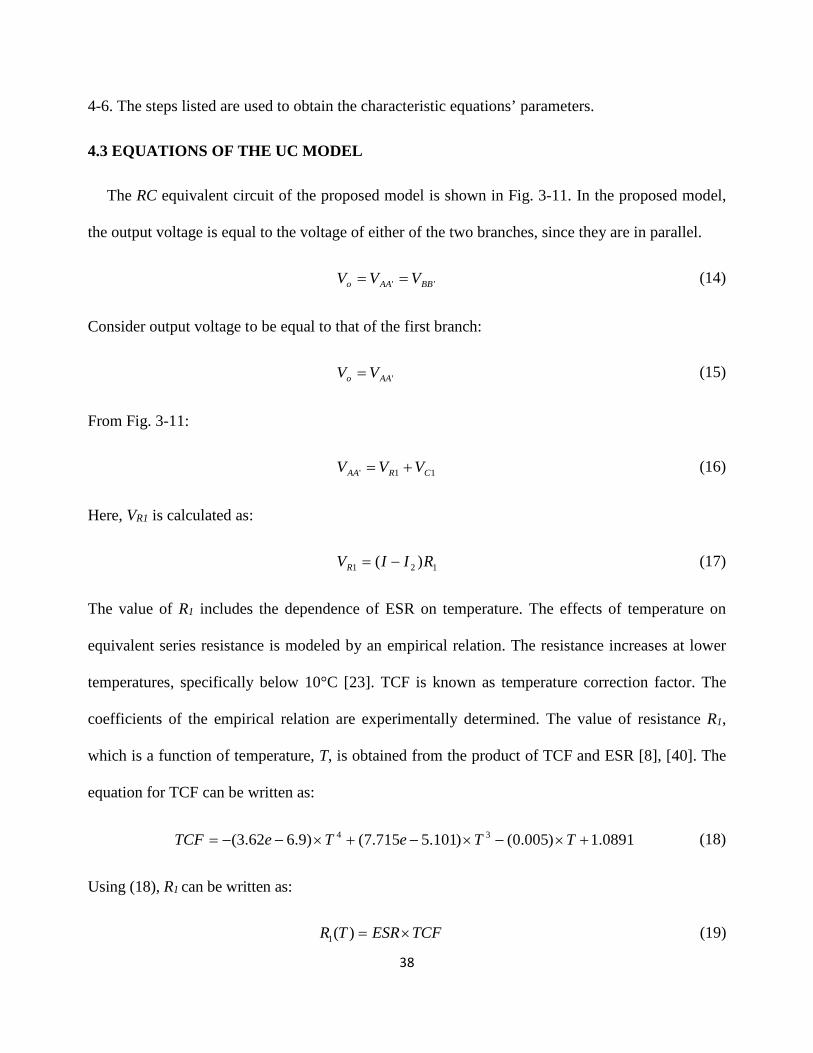
4.3 EQUATIONS OF THE UC MODEL
The RC equivalent circuit of the proposed model is shown in Fig. 3-11. In the proposed model,
the output voltage is equal to the voltage of either of the two branches, since they are in parallel.
'' BBAAo VVV == (14)
Consider output voltage to be equal to that of the first branch:
'AAo VV = (15)
From Fig. 3-11:
11' CRAA VVV += (16)
Here, VR1 is calculated as:
121 )( RIIVR −= (17)
The value of R1 includes the dependence of ESR on temperature. The effects of temperature on
equivalent series resistance is modeled by an empirical relation. The resistance increases at lower
temperatures, specifically below 10°C [23]. TCF is known as temperature correction factor. The
coefficients of the empirical relation are experimentally determined. The value of resistance R1,
which is a function of temperature, T, is obtained from the product of TCF and ESR [8], [40]. The
equation for TCF can be written as:
0891.1)005.0()101.5715.7()9.662.3( 34 +×−×−+×−−= TTeTeTCF (18)
Using (18), R1 can be written as:
TCFESRTR ×=)(1 (19)
38
The voltage across the differential capacitor of the first branch is given as:
∫+= dtIC
VV CC 11
'1
1 (20)
The current of the first branch can be written as: I1 = I – I2. Also, consider 'CV as the initial capacitor
voltage. Finally, the output voltage is:
∫++−=+= dtIC
VRIIVVV CCRo 11
'1211
1)( (21)
Since the voltage across both branches is the same, equal to the output voltage, the value of I2 can be
obtained easily. The value of I2 can be found by substituting the voltage of the second branch as the
output voltage.
22 CRo VVV += (22)
222 Co VRIV += (23)
Hence, from the above equation, I2 can be calculated as:
2
22 R
VVI Co −= (24)
In the above equation, VC2 can be computed as:
∫+= dtIC
VV CC 22
'2
1 (25)
)( 21 III −= (26)
Finally, current of the first branch, I1, can be calculated, in order to compute the main voltage, in
(21).
39
VoI1ESR
TCFR1
Co Cv VC1
VR1
R2
C1
I2
I I-I2
VR1+VC1
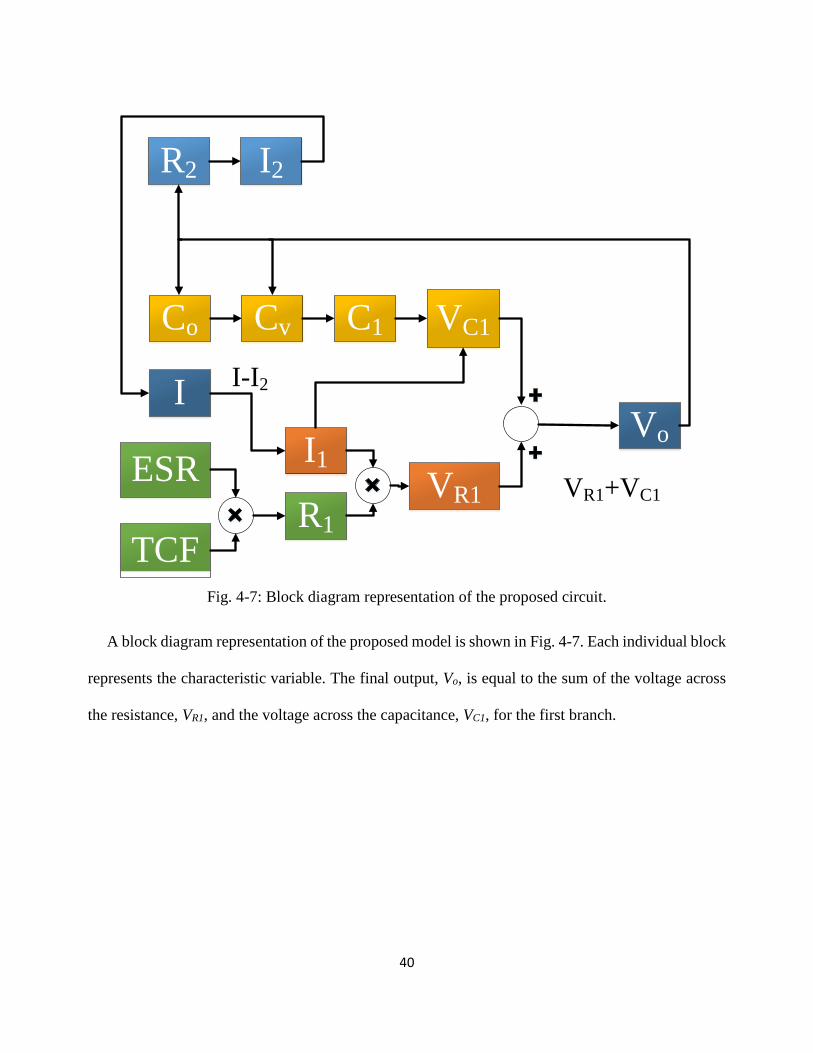
Fig. 4-7: Block diagram representation of the proposed circuit.
A block diagram representation of the proposed model is shown in Fig. 4-7. Each individual block
represents the characteristic variable. The final output, Vo, is equal to the sum of the voltage across
the resistance, VR1, and the voltage across the capacitance, VC1, for the first branch.
40
Chapter 5: Model Simulation Results
5.1 SIMULATION RESULTS
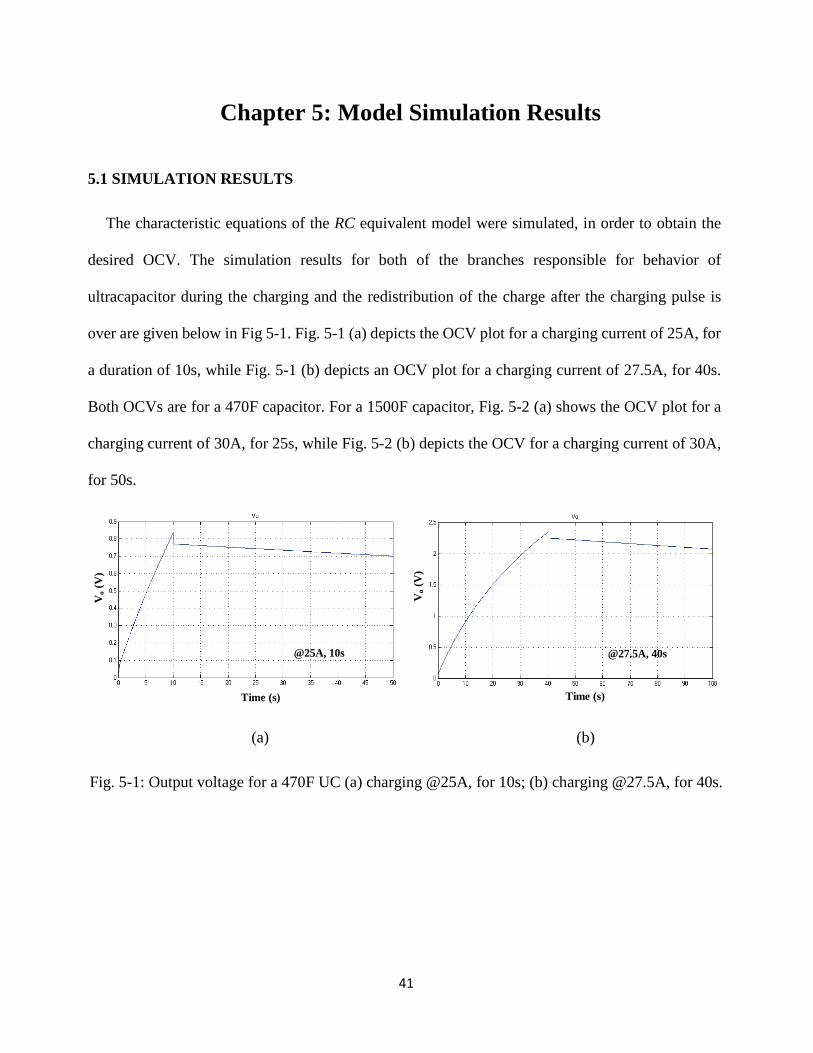
The characteristic equations of the RC equivalent model were simulated, in order to obtain the
desired OCV. The simulation results for both of the branches responsible for behavior of
ultracapacitor during the charging and the redistribution of the charge after the charging pulse is
over are given below in Fig 5-1. Fig. 5-1 (a) depicts the OCV plot for a charging current of 25A, for
a duration of 10s, while Fig. 5-1 (b) depicts an OCV plot for a charging current of 27.5A, for 40s.
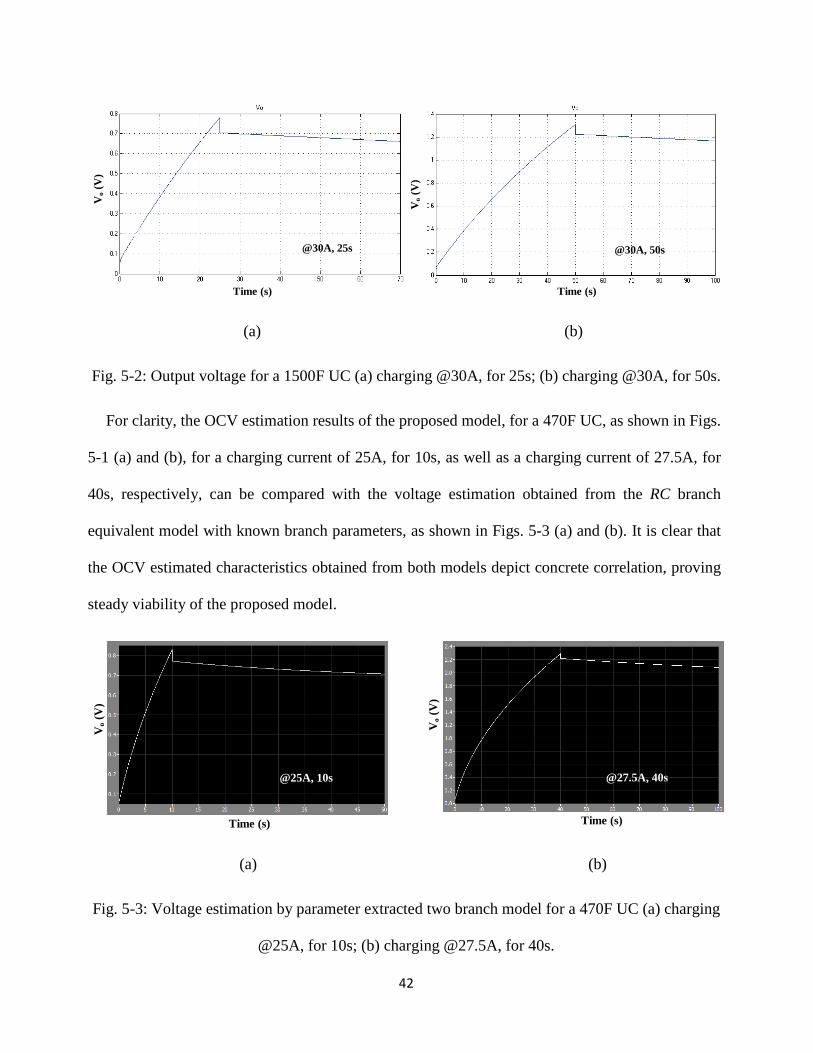
Both OCVs are for a 470F capacitor. For a 1500F capacitor, Fig. 5-2 (a) shows the OCV plot for a
charging current of 30A, for 25s, while Fig. 5-2 (b) depicts the OCV for a charging current of 30A,
for 50s.
(a) (b)
Fig. 5-1: Output voltage for a 470F UC (a) charging @25A, for 10s; (b) charging @27.5A, for 40s.
Vo (
V)
Time (s)
@25A, 10s
Vo (
V)
Time (s)
@27.5A, 40s
41
(a) (b)
Fig. 5-2: Output voltage for a 1500F UC (a) charging @30A, for 25s; (b) charging @30A, for 50s.
For clarity, the OCV estimation results of the proposed model, for a 470F UC, as shown in Figs.
5-1 (a) and (b), for a charging current of 25A, for 10s, as well as a charging current of 27.5A, for
40s, respectively, can be compared with the voltage estimation obtained from the RC branch
equivalent model with known branch parameters, as shown in Figs. 5-3 (a) and (b). It is clear that
the OCV estimated characteristics obtained from both models depict concrete correlation, proving
steady viability of the proposed model.
(a) (b)
Fig. 5-3: Voltage estimation by parameter extracted two branch model for a 470F UC (a) charging
@25A, for 10s; (b) charging @27.5A, for 40s.
Vo (
V)
Time (s)
@30A, 25s
Vo (
V)
Time (s)
@30A, 50s
Vo (
V)
Time (s)
@25A, 10s
Vo (
V)
Time (s)
@27.5A, 40s
42
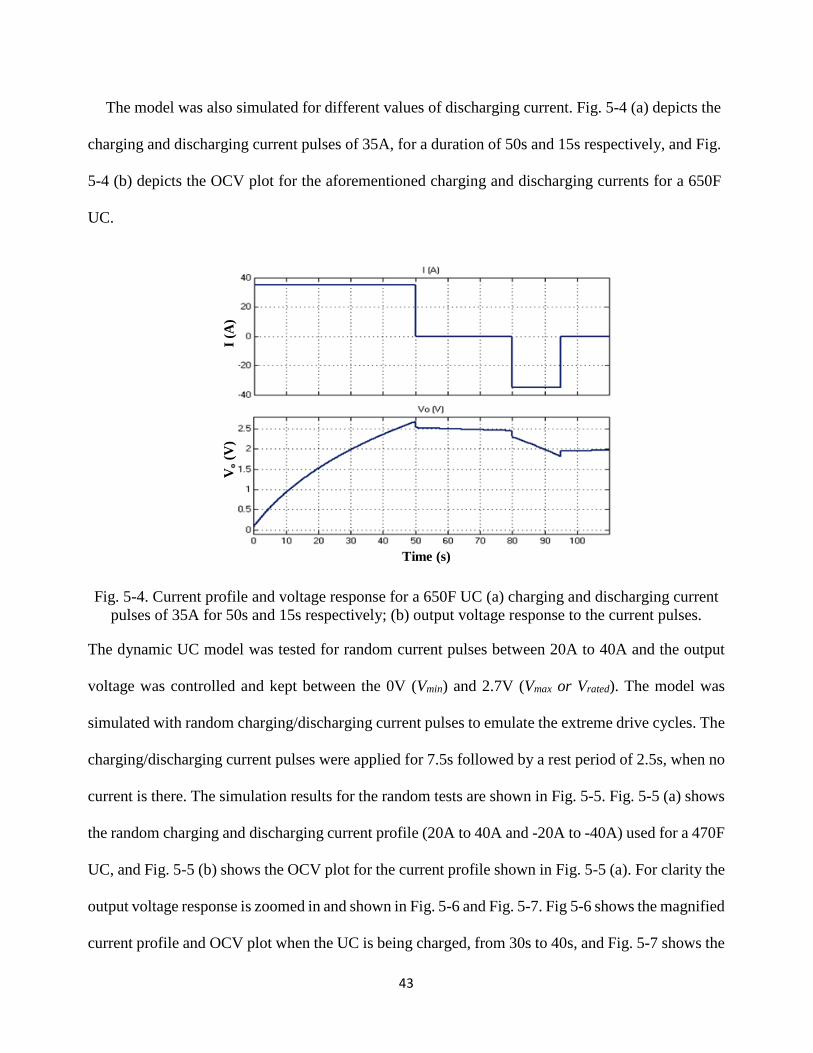
The model was also simulated for different values of discharging current. Fig. 5-4 (a) depicts the
charging and discharging current pulses of 35A, for a duration of 50s and 15s respectively, and Fig.
5-4 (b) depicts the OCV plot for the aforementioned charging and discharging currents for a 650F
UC. I (
A)
Vo (
V)
Time (s)
Fig. 5-4. Current profile and voltage response for a 650F UC (a) charging and discharging current pulses of 35A for 50s and 15s respectively; (b) output voltage response to the current pulses.
The dynamic UC model was tested for random current pulses between 20A to 40A and the output
voltage was controlled and kept between the 0V (Vmin) and 2.7V (Vmax or Vrated). The model was
simulated with random charging/discharging current pulses to emulate the extreme drive cycles. The
charging/discharging current pulses were applied for 7.5s followed by a rest period of 2.5s, when no
current is there. The simulation results for the random tests are shown in Fig. 5-5. Fig. 5-5 (a) shows
the random charging and discharging current profile (20A to 40A and -20A to -40A) used for a 470F
UC, and Fig. 5-5 (b) shows the OCV plot for the current profile shown in Fig. 5-5 (a). For clarity the
output voltage response is zoomed in and shown in Fig. 5-6 and Fig. 5-7. Fig 5-6 shows the magnified
current profile and OCV plot when the UC is being charged, from 30s to 40s, and Fig. 5-7 shows the
43
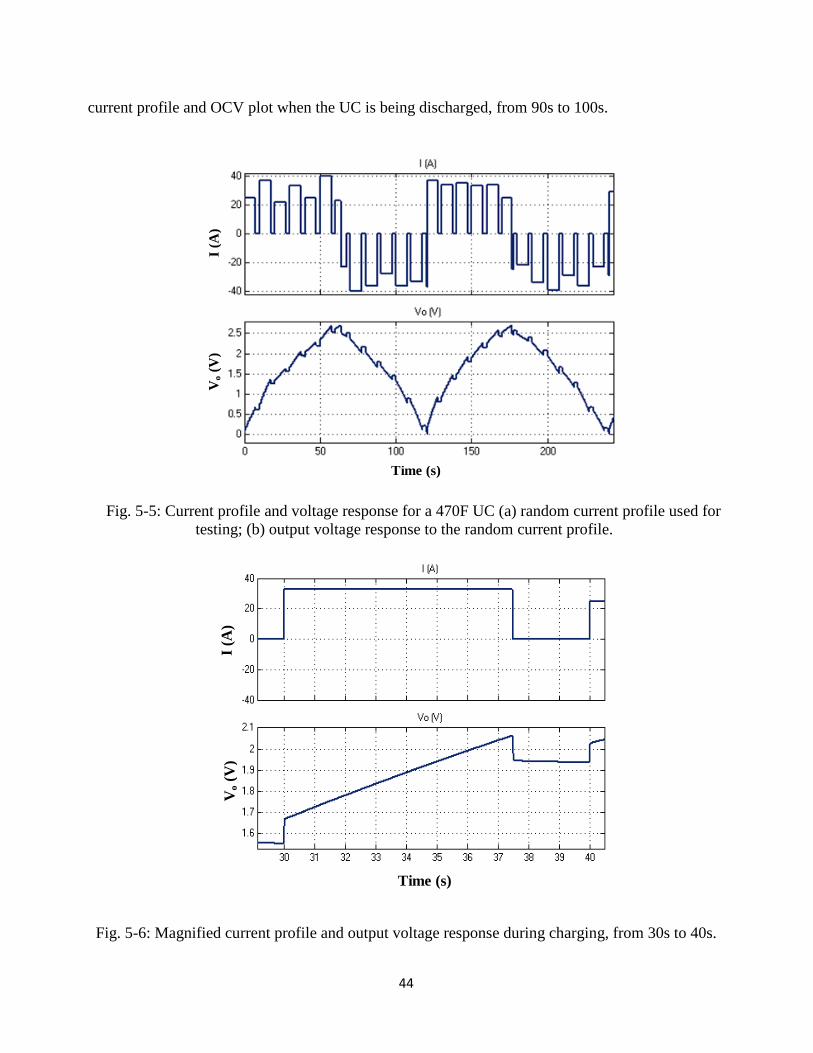
current profile and OCV plot when the UC is being discharged, from 90s to 100s.
I (A
)V
o (V
)
Time (s)
Fig. 5-5: Current profile and voltage response for a 470F UC (a) random current profile used for testing; (b) output voltage response to the random current profile.
Fig. 5-6: Magnified current profile and output voltage response during charging, from 30s to 40s.
I (A
)V
o (V
)
Time (s)
44

Fig. 5-7: Magnified current profile and output voltage response during discharging, from 90s to
100s.
I (A
)V
o (V
)
Time (s)
Fig. 5-8: Current profile and voltage response for a 470F UC (a) random current profile used for testing; (b) output voltage response to the random current profile.
I (A
)V
o (V
)
Time (s)
45

The UC model was also tested for full charge and discharge cycles with random current values
between 20A to 40A within the voltage limits Vmin (0V) and Vrated (2.7). The simulation results are
shown in Fig. 5-8. Fig. 5-8 (a) shows the random current profile for a 470F UC, and Fig. 5-8 (b)
shows the OCV plot for the random current profile.
46
Chapter 6: Experimental Results and Validation
6.1 EXPERIMENTAL VALIDATION
The characteristic equations were also simulated to validate the accuracy of the dynamic
parameter identification technique against the experimental constant current charging results. A
1200F 2.7V ultracapacitor cell was used to obtain the charging curves. The experimental setup used
to test and validate the proposed estimation technique is shown in Fig. 6-1. It consists of a B&K
Precision DC regulated power supply (model no. 1667) through which constant current pulses were
to charge the ultracapacitor cell were obtained. A Teledyne WaveAce 2004 oscilloscope was used
to record the waveforms obtained during the charging tests. The curves were obtained for varied
charging current profiles. Figs. 6-2 to 6-11 compares the OCVs obtained from the dynamic
parameter identification technique and validates them against the results obtained from the
experimental constant current charging results. The specifications of the scope for 1V limit are
500mV/div, 50s and for 0.5V are 200mV, 50s.
Fig. 6-1: Experimental setup to perform charging tests
47

(a) (b)
Fig. 6-2: Output voltage profile for 3.5A charging current and 1V limit (a) actual charging
response; (b) simulation result
(a) (b)
Fig. 6-3: Output voltage profile for 3.5A charging current and 0.5V limit (a) actual charging
response; (b) simulation result
1V
250s
0.9V 0.9V
256s
550mV
120s117s
410mV 407mV
48

1V
350s
0.9V 0.9V
352s
Vo (
V)
Time (s)
[Time: 50s/div] [V: 500mV/div]
Vo (
V)
Time (s)
(a) (b)
Fig. 6-4: Output voltage profile for 2.5A charging current and 1V limit (a) actual charging
response; (b) simulation result
(a) (b)
Fig. 6-5: Output voltage profile for 2.5A charging current and 0.5V limit (a) actual charging
response; (b) simulation result
530mV
170s175s
420mV 423mV
49
(a) (b)
Fig. 6-6: Output voltage profile for 2A charging current and 1V limit (a) actual charging
response; (b) simulation result
(a) (b)
Fig. 6-7: Output voltage profile for 2A charging current and 0.5V limit (a) actual charging
response; (b) simulation result
1V
427s
0.9V
430s
0.9V
500mV
200s202s
410mV 415mV
50
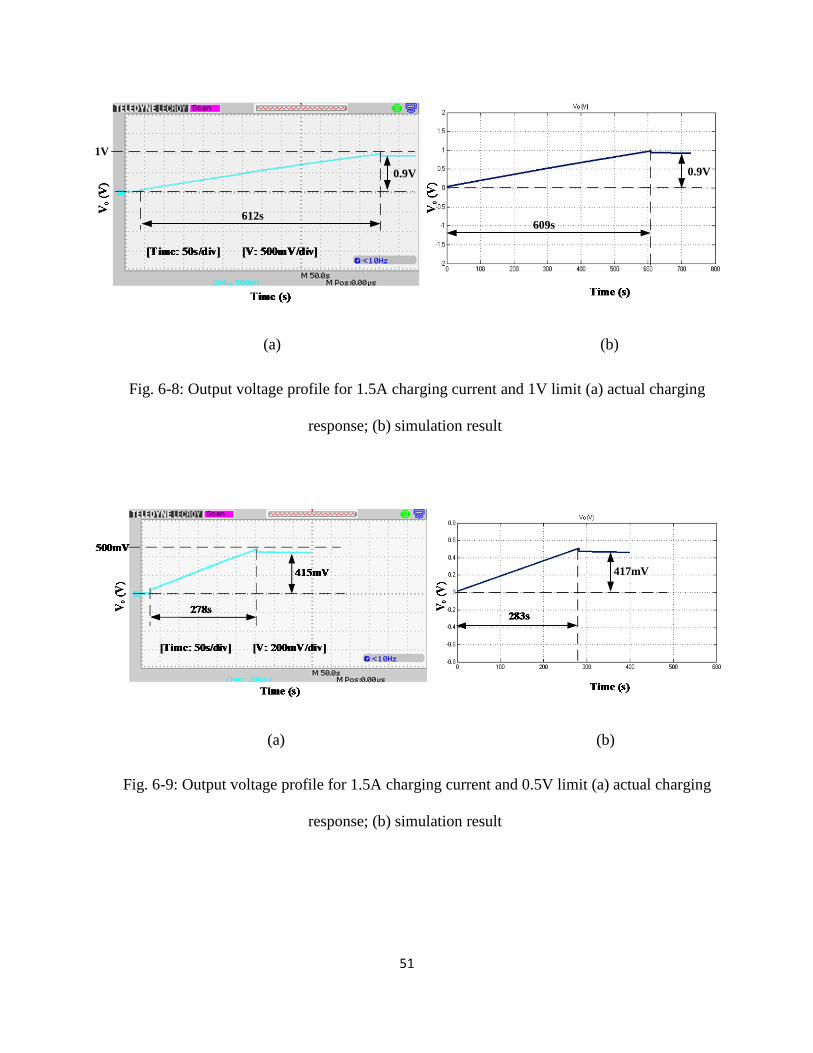
(a) (b)
Fig. 6-8: Output voltage profile for 1.5A charging current and 1V limit (a) actual charging
response; (b) simulation result
(a) (b)
Fig. 6-9: Output voltage profile for 1.5A charging current and 0.5V limit (a) actual charging
response; (b) simulation result
1V
612s
0.9V
609s
0.9V
417mV
51
700mV
623s
0.69V 0.685V
630s
Vo (
V)
Time (s) Time (s)
Vo (
V)
[Time: 50s/div] [V: 500mV/div]
(a) (b)
Fig. 6-10: Output voltage profile for 1A charging current and 0.7V limit (a) actual charging
response; (b) simulation result
550mV
455s449s
425mV 419mV
Vo (
V)
Time (s)
[Time: 50s/div] [V: 200mV/div]
Vo (
V)
Time (s)
(a) (b)
Fig. 6-11: Output voltage profile for 1A charging current and 0.5V limit (a) actual charging
response; (b) simulation result
52
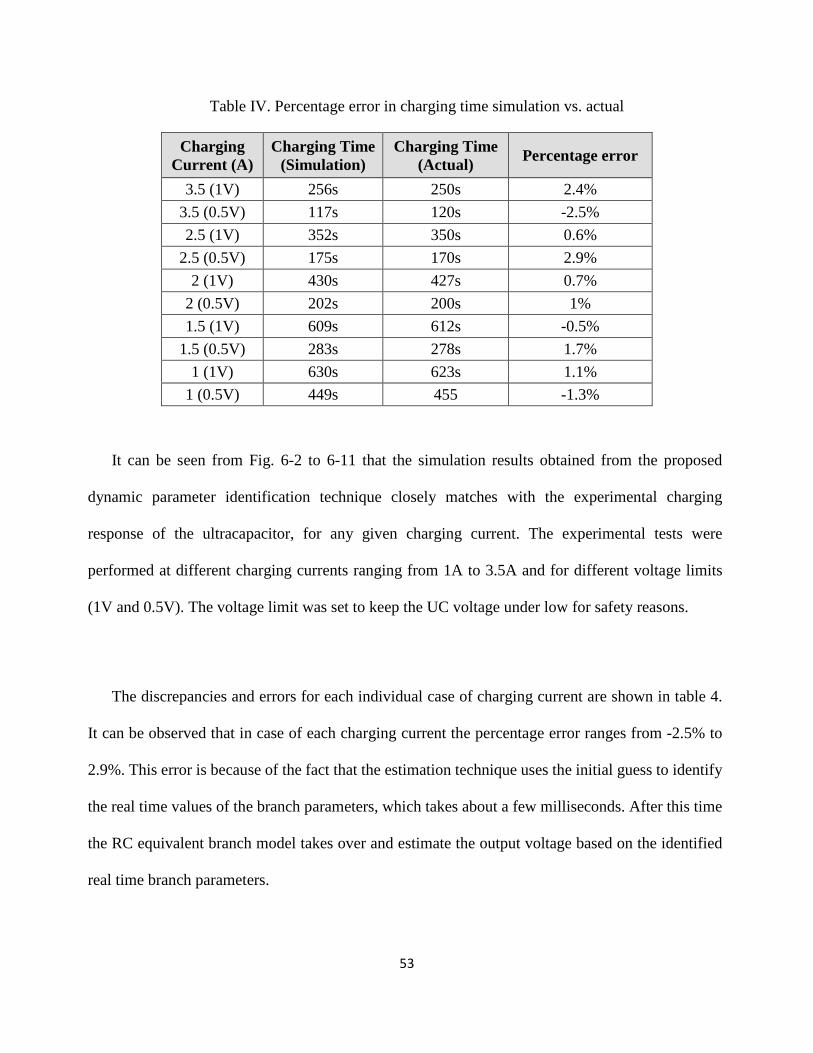
Table IV. Percentage error in charging time simulation vs. actual
Charging Current (A)
Charging Time (Simulation)
Charging Time (Actual) Percentage error
3.5 (1V) 256s 250s 2.4% 3.5 (0.5V) 117s 120s -2.5% 2.5 (1V) 352s 350s 0.6%
2.5 (0.5V) 175s 170s 2.9% 2 (1V) 430s 427s 0.7%
2 (0.5V) 202s 200s 1% 1.5 (1V) 609s 612s -0.5%
1.5 (0.5V) 283s 278s 1.7% 1 (1V) 630s 623s 1.1%
1 (0.5V) 449s 455 -1.3%
It can be seen from Fig. 6-2 to 6-11 that the simulation results obtained from the proposed
dynamic parameter identification technique closely matches with the experimental charging
response of the ultracapacitor, for any given charging current. The experimental tests were
performed at different charging currents ranging from 1A to 3.5A and for different voltage limits
(1V and 0.5V). The voltage limit was set to keep the UC voltage under low for safety reasons.
The discrepancies and errors for each individual case of charging current are shown in table 4.
It can be observed that in case of each charging current the percentage error ranges from -2.5% to
2.9%. This error is because of the fact that the estimation technique uses the initial guess to identify
the real time values of the branch parameters, which takes about a few milliseconds. After this time
the RC equivalent branch model takes over and estimate the output voltage based on the identified
real time branch parameters.
53
There are other factors also which could have contributed to the measured error. The UC cell
was discharged by self-discharge, which almost takes three to four hours to fully discharge the cell.
The variation in temperature during that time for consecutive charging tests could have caused some
variation in the ESR such that the voltage jump is comparatively larger after the charging current
pulse is over. Also the UC cell was stored for a long time without being charged, hence the aging
effects could have distorted the ESR and the voltage dependent part of capacitance.
54
Chapter 7: Conclusions, Contributions and Future Work
7.1 CONCLUSIONS
This thesis proposes a dynamic parameter estimation technique for RC equivalent model
of ultracapacitor. The dynamic estimation technique uses the characteristic and empirical
equations to identify the real time values of the branch parameters. The estimation method
can accurately estimate the OCV response of UCs of varied ratings without having to perform
the constant current tests on and extracting actual branch parameters. The OCV is estimated
solely based on the knowledge of the characteristic branch parameters, which are dynamically
obtained from the characteristic equations and the output voltage.
The two branch RC equivalent model was selected to obtain the OCV results and plots.
The selection was based on the fact that two branches gives good accuracy till sufficient
amount of time. The two RC branches were also physically related to the ultracapacitor’s
porous structure. The first branch models the interaction of ions with the macro and
mesopores, whereas the second branch models the interaction of ions with the smaller micro
and sub-micro pores. The equations of the RC equivalent circuit were formed in order to
obtain the output voltage. The characteristic parameters were then plugged into the RC
branch equations to have the OCV.
The proposed dynamic parameter estimation method was implemented in
MATLAB/Simulink using the RC equivalent model. The estimation method uses the
55

empirical equations formed for different branch parameters. These empirical equations were
formed by running simulation tests on UCs of varied ratings and capacities and observing
the variation of the performance and OCV with the branch parameters.
The parameter estimation technique was tested, for OCV assessment, for different
charging and discharging current values. The simulation tests for random charging and
discharging current pulses to charge/discharge the UC cell, within the rated voltage limit
(2.7V), were obtained to verify the dynamic performance of the proposed parameter
estimation method.
Finally the results obtained from the simulation of the dynamic identification technique
were compared and validated against the actual charging results of a 1200F 2.7V UC cell. It
was observed that the proposed dynamic parameter identification method efficiently
estimates the branch parameters, hence making an accurate estimation of the OCV.
7.2 THESIS CONTRIBUTIONS
The contributions of the thesis are as follows:
• A detailed analysis and study of the actual physical structure of ultracapacitor was
performed.
• Different types of materials used in the construction of the porous electrodes and their
impact on the ultracapacitor’s performance was analyzed.
• A comprehensive review and study of the RC equivalent circuit models of the ultracapacitor
available in the literature was performed.
56
• A dynamic parameter estimation technique to identify the real time values of the RC
equivalent branch parameters was proposed.
• The dynamic parameter estimation technique along with the RC equivalent model was
implemented in MATLAB/Simulink.
• The simulation results obtained from the proposed estimation technique using the RC
equivalent model was validated against the experimental charging results for various values
of charging current.
7.3 FUTURE WORK
• The dynamic estimation technique was only tested for constant current charging pulses. The
technique has to be validated against the constant current discharging pulses as well. To
perform discharging tests a power circuit can be built or a DC electronic load can be used. The
power circuit can simply be a DC-DC converter which behaves like a buck converter while
charging and boost converter while discharging.
• Since the model is meant for EV applications, checking the robustness of the dynamic parameter
estimation technique can be valuable. The robustness and dynamic efficiency can be checked
by loading the UC with random drive cycle charging and discharging current pulses and
performing the cycling tests. Hence analyzing the robustness and dynamic efficiency of the
estimation technique can be considered as future work.
• The performance and reliability of the UCs is a major concern which needs to be addressed
in order to improve their lifetime. The aging effects along with the operating temperature
57
cause the UC’s performance to degrade over a period of time hence the life expectancy
decreases. The balancing of the charge and voltage is essential and can be valuable to improve
the lifetime of UCs. Therefore another potential work is to study and analyze the charge and
voltage balancing circuits for UCs.
• In order to increase the performance and dynamic efficiency of the model, the study and
analysis of the effects of using the online parameter estimation technique along with the
proposed dynamic parameter identification method is valuable and can be considered as the
future work.
58

REFERENCES
[1] A. Burke, “Ultracapacitors: why, how, and where is the technology,” Journal of Power
Sources, vol. 91, no. 1, pp. 37-50, Nov. 2000.
[2] S. M. Lukic, J. Cao, R. C. Bansal, F. Rodriguez, and A. Emadi “Energy storage systems for
automotive applications,” IEEE Trans. on Industrial Electronics, vol. 55, no. 6, pp. 2258–
2267, Jun. 2008.
[3] J.-S. Lai, S. Levy, and M. F. Rose, “High energy density double-layer capacitors for energy
storage applications,” IEEE Aerospace and Electronic Systems Magazine, vol. 7, no. 4, pp.
14–19, Apr. 1992.
[4] M. Ortuzar, J. Moreno, and J. Dixon, “Ultracapacitor-based auxiliary energy system for an
electric vehicle: Implementation and evaluation,” IEEE Trans. on Industrial Electronics, vol.
54, no. 4, pp. 2147–2156, Aug. 2007.
[5] S. Lemofouet and A. Rufer, “A hybrid energy storage system based on compressed air and
supercapacitors with maximum efficiency point tracking (MEPT),” IEEE Trans. Industrial
Electronics, vol. 53, no. 4, pp. 1105–1115, Aug. 2006.
[6] Maxwell Technologies®, K2® Ultracapacitors, Data Sheet.
[7] L. Shi and M. L. Crow, “Comparison of ultracapacitor electric circuit models,” in Proc. IEEE
Power and Energy Society General Meeting, Pittsburgh, PA, July 2008, pp. 1-6.
[8] H. Gualous, D. Bouquain, A. Berthon, and J. M. Kauffmann, “Experimental study of
supercapacitor serial resistance and capacitance variations with temperature,” Journal of
Power Sources, vol. 123, no. 1, pp. 86-93, Sept. 2003.
59

[9] J. R. Miller and A. F. Burke, “Electrochemical capacitors: Challenges and opportunities for
real-world applications,” The Electrochemical Society Interface, vol. 17, no. 1, pp. 53-57,
Spring 2008.
[10] Lars Hagvaag Seim, Modeling, Control and Experimental Testing of a Supercapacitor/Battery
Hybrid System - Passive and Semi-Active Topologies, Norwegian University of Life Science,
2011
[11] F. Rafik et.al, “Frequency, thermal and voltage supercapacitor characterization and modeling,"
J. Science Direct, vol. 165, pp. 928-934, Dec. 2006.
[12] M. Uzunoglu and M. S. Alam, “Modeling and Analysis of an FC/UC Hybrid Vehicular Power
System Using a Novel-Wavelet-Based Load Sharing Algorithm,’’ IEEE Transactions on
Energy Conversion, vol. 23, no. 1, pp. 263-272, March 2008.
[13] Md. H. Rahman and S. Yamashiro, “Novel Distributed Power Generating System of PV-
ECaSS Using Solar Energy Estimation,’’ IEEE Transactions on Energy Conversion, vol. 22,
no. 2, June 2007.
[14] Z. Amjadi and S. S. Williamson,“Power-electronics-based solutions for plug-in hybrid electric
vehicle energy storage and management systems,”IEEE Trans. Ind. Electron., vol. 57, no. 2,
pp. 608–616, Feb. 2010. [15] SAE International. Vibration testing of electric vehicle batteries. [Online]. Available:
standards.sae.org/j2380_200903/
[16] B. Maher, “Ultracapacitors can help increase a system’s portability,” Portable
Design, pp. 49-52, 2001.
60

[17] A. F. Burke, and T.C. Murphy, “Material characteristics and the performance of
electrochemical capacitors for electric / hybrid vehicle applications,” in Proc.Materials
Research Society Symp., 1995, pp. 375-395.
[18] N. Khan, N. Mariun, M. Zaki, and L. Dinesh, “Transient analysis of pulsed charging in
supercapacitors,” in Proc. IEEE TENCON’00, vol. 3, Sept. 2000, pp. 193- 199.
[19] R. L. Spyker, and R. M. Nelms, “Optimization of double-layer capacitor Arrays,” IEEE Trans.
Ind. Applicat., vol. 36, pp. 194-198, Jan. / Feb. 2000.
[20] G.C. Ballard, H.B. Sierra-Alcazar, H.L. Lee, and J.L. Morris, “Operating principles of the
ultracapacitor,” IEEE Trans. Magn., vol. 25, pp. 102-106, Jan. 1989.
[21] Chia-Jui Chiang, Jing-Long Yang, and Wen-Chin Cheng, “Dynamic Modeling of the
Electrical and Thermal Behavior of Ultracapacitors,” 10th IEEE International Conference on
Control and Automation (ICCA), Hangzhou, China, June 12-14, 2013.
[22] H. Yang and Y. Zhang, “Self-discharge analysis and characterization of supercapacitor for
environmentally powered wireless sensor network applications," J. Power Sources, vol. 196,
pp. 8866-8873, Oct. 2011.
[23] “Datasheet, Bootscap Ultracapacitors,” Tech. Rep. Doc.No 1009364 Rev.3, Maxwell
Technologies, 2009.
[24] R. Faranda, M. Gallina, and D. Son, “A new simplified model of double layer capacitors,"
IEEE Conference ICCEP, pp. 706-710, May 2007.
[25] L. Zubieta and R. Bonert, “Characterization of double-layer capacitors for power electronics
applications,” IEEE Trans. on Industry Applications, vol. 36, no. 1, pp.199-205, Jan. 2000.
[26] Seneca Andrew Schepmann, Ultracapacitor heavy hybrid vehicle: Model predictive control
using future information to improve fuel consumption, MS Thesis, Clemson University, 2010.
61
[27] K.M. Do, “A Dynamic Electro-Thermal Model of Double Layer Supercapacitors for HEV
Powertrain Applications,” MS Thesis, Dept. of Mechanical Engineering, The Ohio State
University, 2004.
[28] Ambrosio B. Cultura II, Design, Modeling, Simulation and Evaluation of a distributed energy
system, Doctoral Thesis, University of Massacusettes Lowell, 2011.
[29] Yang Wang, Joan E. Carletta, Tom T. Hartley, and Robert J. Veillette, “An Ultracapacitor
Model Derived Using Time-Dependent Current Profiles,” 51st Midwest Symposium on
Circuits and Systems, pp. 726-729, Aug. 2008.
[30] R. Morrison, The Chemical Physics of Surfaces. Plenum, 1990.
[31] A. Kitahara and A. Watanabe, Electrical Phenomena at Interfaces: Fundamentals,
Measurements and Applications. Marcel Dekker, 1984.
[32] Nelms, R.M., Cahela, D.R. ; Newsom, R.L. ; Tatarchuk, B.J., “A comparison of two equivalent
circuits for double-layer capacitors,” 99th Applied Power Electronics Conference and
Exposition, vol. 2, pp. 692-698, March 1999.
[33] J. Newman, Electrochemical Systems, Prentice-Hall, Englewood Cliffs, NJ, 1991, pp. 454–
495.
[34] V. Srinivasan, C. Lin, J. Ritter, J. Weidner, “Mathematical modeling of sol–gel derived carbon
aerogels as double layer capacitors,” Proc. of the Symposium on Electrochemical Capacitors
II, pp. 153–166, 1996.
[35] C.J. Farahmandi, “A Mathematical model of an electrochemical capacitor with porous
electrodes,” Proc. of the Symposium on Electrochemical Capacitors II, pp. 167-179, 1996.
62

[36] J.R. Miller, “Battery-capacitor power source for digital communication applications:
simulations using advanced electrochemical capacitors,” Proc. of the Symposium on
Electrochemical Capacitors II, 29–95, pp. 246–254, 1995.
[37] A.F. Burke, J.R. Miller, “Test procedures for high energy density electrochemical capacitors,”
Proc. of the Symposium on Electrochemical Capacitors II, 29–95 (1995) 280–297.
[38] J.R. Miller, “Evaluation of capacitors and batteries for pulsed power applications associated
with satellite communications,” Part 2. Capacitor equivalent circuit models and ragone plots,
JME-MRJ2, JME, October 30, 2000.
[39] R.A. Dougal, L. Gao, S. Liu, “Ultracapacitor model with automatic order selection and
capacity scaling for dynamic system simulation,” Journal of Power Sources, vol. 126, issues
1-2, pp. 250–257, Feb. 2004.
[40] M. Vural, M. Uzunoglu, O. Erdinc, and O. C. Onar, “A dynamic ultra-Capacitor model for
vehicular applications,” in Proc. IEEE International conf. on Clean Electrical Power, Capri,
Italy, June 2009, pp. 595-598.
63