Ultra Portable and Rapidly Deployable Rotorcraft Platform ...
55
Ultra Portable and Rapidly Deployable Rotorcraft Platform for Tactical Compact Communications Relay A project present to The Faculty of the Department of Aerospace Engineering San Jose State University in partial fulfillment of the requirements for the degree Master of Science in Aerospace Engineering By Ben E. Nikaido December 2013 approved by Dr. Nikos Mourtos Faculty Advisor
Transcript of Ultra Portable and Rapidly Deployable Rotorcraft Platform ...

Ultra Portable and RapidlyDeployable Rotorcraft Platform forTactical Compact Communications
Relay
A project present to The Faculty of the Department of Aerospace Engineering
San Jose State University
in partial fulfillment of the requirements for the degree Master of Science in Aerospace Engineering
By
Ben E. Nikaido
December 2013
approved by
Dr. Nikos Mourtos Faculty Advisor

ABSTRACT
This report includes the motivation for and preliminary design of a man-portable, rapidly-deployable, and cost-effective rotorcraft platform to carry a communication relay payload. A quadrotor design with 0.427 meter (16.8 inch) diameter rotors was chosen. The estimated weightof the aircraft is 1.471 kilograms. Rotor momentum theory yields and estimated quadrotor vehicle hover endurance of 21 minutes. CFD and experimental analysis was conducted to evaluate rotor design at low operational Reynolds numbers. CFD (using the CFD-ACE+ code) showed slight efficiency gains of cambered plated designs at lower rotational speeds over traditional airfoils. Experimental testing yielded better performance of a commercial-off-the-shelf (COTS) flat-plate rotor over the streamlined airfoil rotor of a larger diameter.
Faculty Adviser:
____________________________________________
Dr. Nikos Mourtos
Director, Aerospace Engineering
San Jose State University
Advisory Committee:
ACKNOWLEDGEMENTS
I wish to thank my Aerospace Engineering faculty, Dr. Mourtos and Dr. Papadopoulos, for the many fun and challenging years and inspiring me to pursue this stage of higher education. I also wish to express my sincere gratitude to my technical advisory committee, Larry Young and Satish Chetty, for which this project would not be possible. On numerous occasions, Larry kindlyinvited me to NASA Ames to share his immense knowledge of rotorcraft, direct me during research, guide me through the engineering process. I am also grateful for the time Larry sacrificed to increase the accuracy and professionalism of this report. I am thankful to Satish for the years of assistance in and inspiration for electronics and robotics.

Contents
1.0 INTRODUCTION...............................................................................................................1
1.1 MISSION.............................................................................................................................3
1.2 SCOPE OF PROJECT.....................................................................................................5
1.3 TECHNICAL TASKS......................................................................................................5
1.4 TECHNICAL CHALLENGES........................................................................................6
2.0 CONCEPTUAL AND PRELIMINARY DESIGN..............................................................7
2.1 PLATFORM CONFIGURATION...................................................................................7
2.2 VEHICLE SIZING AND PACKAGING/STOWING.....................................................8
2.3 WEIGHT ESTIMATE....................................................................................................11
2.4 HOVER POWER ESTIMATE......................................................................................12
2.5 ENDURANCE ESTIMATE..........................................................................................13
3.0 PROOF-OF-CONCEPT (POC) DEVELOPMENT...........................................................14
4.0 CHALLENGES IN IMPROVING VEHICLE HOVER EFFICIENCY AND ENDURANCE...............................................................................................................................16
4.1 AIRFOILS AND ROTORS OPERATING IN THE LOW REYNOLDS NUMBER REGIME....................................................................................................................................17

4.2 BOUNDARY LAYERS ON AIRFOILS.......................................................................19
4.3 LAMINAR SERARATION BUBBLE..........................................................................20
4.4 AIRFOIL BEHAVIOR...................................................................................................21
5.0 ROTOR AERODYNAMICS AND HOVER PERFORMANCE......................................25
5.1 BLADE ELEMENT THEORY.....................................................................................25
5.2 BLADE ELEMENT MOMENTUM (BEM) THEORY................................................27
5.3 BEM ROTOR ANALYSIS............................................................................................28
6.0 ROTOR CFD ANALYSIS.................................................................................................30
6.1 APPROACH..................................................................................................................31
6.2 CFD RESULTS..............................................................................................................35
7.0 EXPERIMENTAL ROTOR TESTING.............................................................................39
7.1 EXPERIMENTAL RESULTS.......................................................................................41
8.0 CONCLUSIONS...............................................................................................................45
TO CONCLUDE.....................................................................................................................45
REFERENCES........................................................................................................................46

1.0 INTRODUCTION
In June of 2005, Navy SEAL Lieutenant Michael P. Murphy and his team were on acovert mission to find and monitor a Taliban leader deep in the mountains of Afghanistan.Taliban militants became aware of the SEAL's plans and subsequently ambushed them withheavy fire, forcing the American soldiers into a canyon. Because the mountainous terrainrestricted line-of-sight (LOS) radio communication, the SEALs were unable to call for airsupport. Lt. Murphy, determined to make the call, ventured out of the canyon and knowingly intothe plain sight of the opposition. While under continuous fire, and incurring a shot to his back,Murphy succeeded in placing a call to headquarters. Unfortunately, afterwards, Lt. Murphy, themajority of his SEAL team, and a large number of responding backup troops were killed byTaliban forces. Lt. Murphy was awarded the Congressional Medal of Honor for his heroicactions and sacrifice. [5]
Figure 1: Line-of-Sight obstructed by terrain.
Boeing Electronic and Mission Systems has recently developed a partial solution to theLOS problem, as shown in Figure 1, which plagued Lt. Murphy and still plagues warfighters insimilar dire situations. The Tactical Compact Communications Relay (TCCR) is a small, yethighly capable, electronic module that acts as a relay for military and emergency response radiocommunication systems. In theater since July 2011, the TCCR weighs 1 lb, is smaller than 37cubic inches in size, and can theoretically extend the range of radio communications to over 160nautical miles. Aerial platforms currently carrying the TCCR include the Boeing/Insitu ScanEagle, the Aeroviroment Puma, the S-100 rotorcraft, and aerostats. [6] The Scan Eagle, S-100,and Puma are shown in Figures 2a-c, respectively. All of the previously mentioned aircraftrequire significant planning and infrastructure to launch and most cannot be freely carried byground troops on tactical missions. The smallest known UAV platform to house the TCCR is theAeroviroment Puma. Although man-portable and hand-launched, the Puma requires a full-timehuman operator, is susceptible to inclement weather and wind, and cannot fit into a standardmilitary backpack.
1
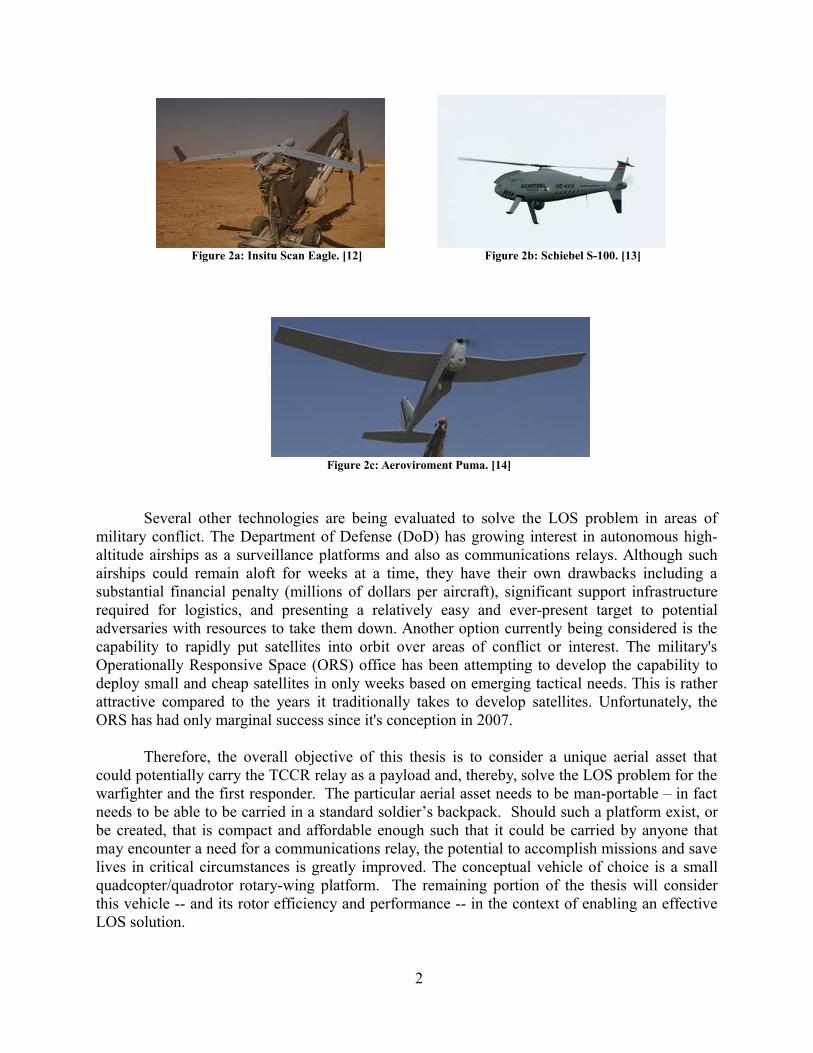
Figure 2a: Insitu Scan Eagle. [12] Figure 2b: Schiebel S-100. [13]
Figure 2c: Aeroviroment Puma. [14]
Several other technologies are being evaluated to solve the LOS problem in areas ofmilitary conflict. The Department of Defense (DoD) has growing interest in autonomous high-altitude airships as a surveillance platforms and also as communications relays. Although suchairships could remain aloft for weeks at a time, they have their own drawbacks including asubstantial financial penalty (millions of dollars per aircraft), significant support infrastructurerequired for logistics, and presenting a relatively easy and ever-present target to potentialadversaries with resources to take them down. Another option currently being considered is thecapability to rapidly put satellites into orbit over areas of conflict or interest. The military'sOperationally Responsive Space (ORS) office has been attempting to develop the capability todeploy small and cheap satellites in only weeks based on emerging tactical needs. This is ratherattractive compared to the years it traditionally takes to develop satellites. Unfortunately, theORS has had only marginal success since it's conception in 2007.
Therefore, the overall objective of this thesis is to consider a unique aerial asset thatcould potentially carry the TCCR relay as a payload and, thereby, solve the LOS problem for thewarfighter and the first responder. The particular aerial asset needs to be man-portable – in factneeds to be able to be carried in a standard soldier’s backpack. Should such a platform exist, orbe created, that is compact and affordable enough such that it could be carried by anyone thatmay encounter a need for a communications relay, the potential to accomplish missions and savelives in critical circumstances is greatly improved. The conceptual vehicle of choice is a smallquadcopter/quadrotor rotary-wing platform. The remaining portion of the thesis will considerthis vehicle -- and its rotor efficiency and performance -- in the context of enabling an effectiveLOS solution.
2

1.1 MISSION
The proposed mission is to design and demonstrate a man-portable, rapidly-deployable,and cost-effective aircraft platform to carry the TCCR or similar device. The nature of theaircraft's flight is relatively simple: it should be capable of being hand-launched, or takeoffdirectly from the ground, with minimal takeoff distance required; it must simply gain altitudeuntil it could satisfy LOS communication, as shown in Figure 3; it must be hover or loiter ataltitude to establish and maintain the LOS communications relay. Although the originalinspiration for the platform is tactical in nature, it should be noted that it could also be equallyuseful for situations outside of the military, including outdoorsmen and first-response personnel.For these applications the aircraft could be outfitted with a cellular and/or civil radio relay inplace of the TCCR.
Figure 3: Aerial relay platform enabling LOS to receiver and/or satellite, solving the obstruction problem as shown inFigure 1.
In contrast to the existing aircraft mentioned earlier that have carried the TCCR as apayload, the aerial vehicle to be considered in this study will require little to no input from theoperator. This semi-autonomous feature would enable the user to give the task at hand – i.e.establishing radio transmission - his/her undivided attention - without having to concurrentlyremote-pilot/operate a small aerial platform. The ability to “launch and forget” a relay may haveproven priceless for Lt. Murphy while under a hailstorm of enemy fire.
A set of objectives that define measures of mission/vehicle success are outlined below.The objectives are ranked in three discrete levels: minimum, intermediate, and optimal. The setof minimum objectives would yield an initial operating capability for the vehicle/mission.Performance values outlined are assuming sea level and standard day temperature and pressure.The more challenging intermediate and optimal sets of objectives would greatly enhance theoverall mission capability. The work for this study will mostly focus on the challenges ofmeeting the minimum objectives.
3

Minimum Objectives:
The aircraft must be able to, upon operator command, ascend vertically to 50 ft above ground level (AGL) and sustain 15 minutes or more of hovering flight.
The aircraft must carry a 1 lb payload and provide the requisite power for operating the TCCR module or equivalent device for the endurance of the flight.
The aircraft must fit into a standard 18" (1296 cubic inches) backpack in either collapsed or flight-ready configuration.
Intermediate Objectives:
The aircraft must be able to, upon operator command, ascend to an altitude of 150' AGL at a maximum of 10000' density altitude.
The hovering endurance must exceed 20 minutes upon reaching target altitude.
Figure 4: Flight profile for minimum and intermediate objectives.
Optimal Objectives:
The aircraft must be able to be launched and "forgot" by the operator, minimizing operator intervention.
The aircraft must consume only half the space of a standard size backpack in either collapsed or flight-ready configuration.
4

Hover endurance must be at least 30 minutes.
After launch and while ascending to the required altitude, the aircraft must be able to autonomously dodge obstacles such as canyon walls, cliff faces, and other types of rock formations.
The aircraft must autonomously ascent to an altitude and location that is in line-of-sight of both the sender and receiver.
The aircraft must be able to maintain required position under windy and gusty condition.
If in a hostile environment, the aircraft must autonomously fly randomly so as not to giveaway the sender's position on the ground.
It must autonomously return to the sender after mission or land/fall in a relatively distant location so to keep the sender's location discrete.
Figure 5: Flight profile for optimum objectives.
1.2 SCOPE OF PROJECT
This project will encompass designing, developing, and testing a rotorcraft platform thatcarries a previously working communications relay. In particular, small quadrotor/quadcoptervehicles will be considered. One key reason for this choice is that existing commercial-off-the-shelf (COTS) quadcopter vehicles already have many of the required attributes for the LOSmission. For example, sophisticated avionics, and ease of control, male this type of aerial vehiclevery accessible to novice operators. Additionally, many open-source software/hardware projectshave demonstrated semi- and fully-autonomous vehicles of this type. Finally, low-cost systemsare already commercially available. This study’s conceptual design phase will conclude withinclude with both a computational and experimental thorough aerodynamic assessment, analysis
5

and performance optimization, of the aircraft's lifting rotors that meets leads to the targetedvehicle endurance goals.
1.3 TECHNICAL TASKS
The following is a list of technical tasks that will be cultivated during the course of thisstudy to meet the identified mission specifications/objectives:
Design an airframe that could carry the requisite payload and reduce in size and weight toensure total man-portability.
Significantly improve the quadcopter flight endurance. Since the majority of the flight will be spent in hover, the focus will be on increasing the hover efficiency.
Equally important, but outside the scope of work performed, are the following tasks that
are recommended for future work:
Demonstrate a means of providing sufficient electric power to the TCCR, or similar device, for the entire duration of a mission-compatible flight.
Develop the flight control system to provide a high-level of autonomy and minimal operator input. Launching the aircraft will consist of quickly bringing it into flight-ready configuration and simply switching the system on.
Demonstrate that the TCCR or comparable communications relay, can be carried on a simulated mission and can – in mid-flight-- automatically find and maintain the appropriate geographic location and altitude that ensures transmissions between transmitter and receiver.
1.4 TECHNICAL CHALLENGES
The above lists of technical tasks present some unique technical challenges. Firstly, therotorcraft's airframe will have to employ folding and/or telescoping members to comply with the
6

dimensional restrictions as outlined in the mission specifications. The mechanisms and jointsmust be robust, simple, lightweight, and enable quick transformation from packed to flight-readyconfiguration.
Improving the aircraft's hover efficiency will be accomplished by improving the rotor'saerodynamic efficiency as well as maintaining a lightweight airframe and efficient drivetrain(s).For a given high efficiency and RPM motor, the rotor could be optimized to produce the mostamount of thrust with the least amount of rotational drag (torque). Theoretical models andcomputational fluid dynamics (CFD) will be utilized to obtain an efficient rotor design.
The system must autonomously attain and hold a position for the relay to be operational.This will require communication between the relay and the navigation and control system. Theremust be coded logic in the flight control computer that continuously attains input from the relayon whether or not the transmission is of requisite quality. If not, the system must quickly reach alocation that does permit and sustain a reliable radio link between transmitter and receiver. Thereare several off-the-shelf complete flight control systems for small electric aircraft that permit athigh-level of customization and programmable autonomy.
Lastly, there in ultimately a need to sense and avoid obstacles during climb to operatingaltitude, as well as possibly fly in a random/covert manner should the situation dictate suchaction, and maintain station keeping under adverse weather conditions. The sense and avoidfeature will require integration of optical and/or sonar sensors with the flight control computerand the requisite logic. As mentioned above, many existing flight control systems are compatiblewith and have I/O ports for such sensors. Flying in an unpredictable manner while maintainingrelay communication will require additional programming and relay-flight control computerintegration. The aircraft and it's systems will require weatherproofing to operate in heavy rainand snow. The stability and control system (integrated into most complete flight control systems)may require tweaking for the aircraft to fly to and maintain station in strong/gusty winds.
2.0 CONCEPTUAL AND PRELIMINARY DESIGN
2.1 PLATFORM CONFIGURATION
The primary factors driving the overall hardware design are:
7

Compactness in portable configuration
Hover efficiency (effective station-keeping)
Simple and robust airframe
Ease of transition from packet to flight-ready
Ability to carry payload (relay)
Low profile in tactical situations
Several configurations were considered in meeting these demands. A conventionalhelicopter (Figure 6a) satisfies five of the above criteria but requires an array or cams, pushrods,complex joints, and a tail rotor for control that greatly increase the about of complexity andmechanical fragility. A coaxial rotor design (Figure 6b) does away with the trail rotor but stillsuffers from the same mechanical intricacies as the conventional helicopter. Figure 6b shows aless-common trirotor or “Y” design. This has an advantage over the previous two configurationsin that it does not require as much control mechanisms, but still requires a method to tilt the rearrotor for yaw control. The quadrotor configuration as shown in Figure 6d satisfies all five of thedesign criteria and is the most mechanically elegant. A significant advantage with the quadrotoris that all of the vehicle's dynamics (yaw, pitch, roll, altitude, and translational flight) arecontrolled simply by varying input power to each motor as shown if Figure 7. This reduces thenumber of moving parts to essentially just the four motors/rotors, with the potential for costsavings and reliability. Another benefit to the quadrotor is its popularity amongst the hobbyistcommunity which presents a deal of resources for constructing a proof-of-concept (POC)aircraft.
8
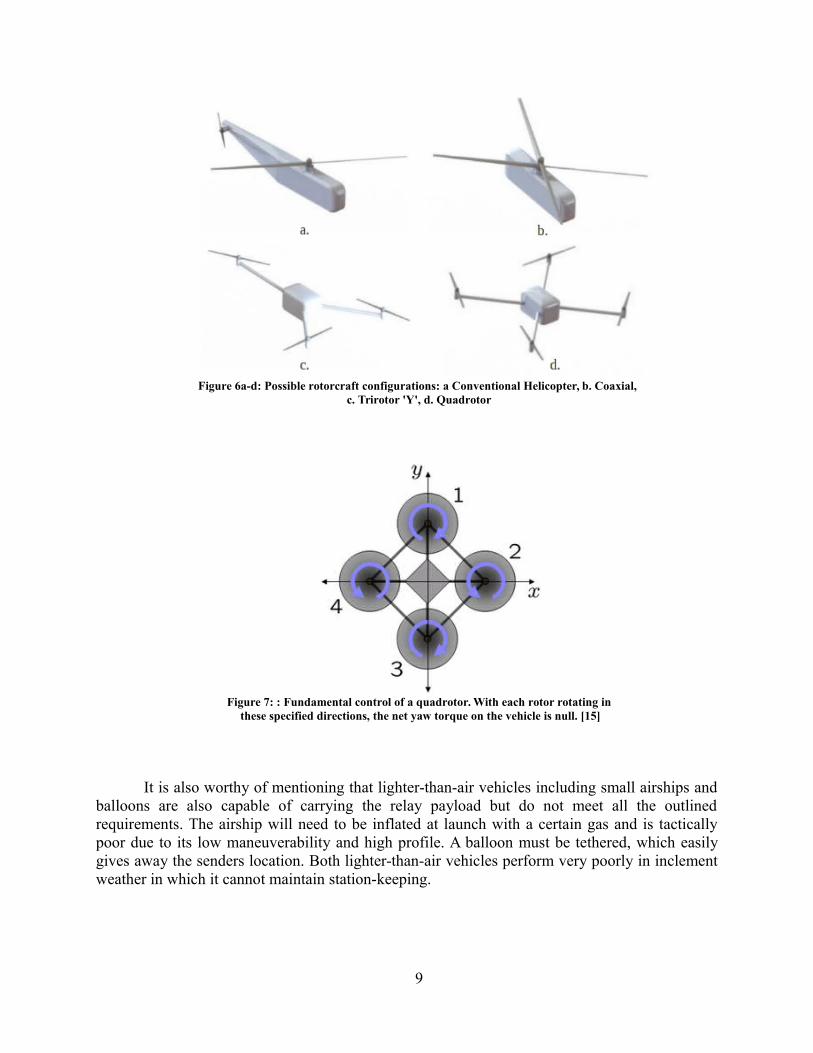
Figure 6a-d: Possible rotorcraft configurations: a Conventional Helicopter, b. Coaxial, c. Trirotor 'Y', d. Quadrotor
Figure 7: : Fundamental control of a quadrotor. With each rotor rotating in these specified directions, the net yaw torque on the vehicle is null. [15]
It is also worthy of mentioning that lighter-than-air vehicles including small airships andballoons are also capable of carrying the relay payload but do not meet all the outlinedrequirements. The airship will need to be inflated at launch with a certain gas and is tacticallypoor due to its low maneuverability and high profile. A balloon must be tethered, which easilygives away the senders location. Both lighter-than-air vehicles perform very poorly in inclementweather in which it cannot maintain station-keeping.
9
2.2 VEHICLE SIZING AND PACKAGING/STOWING
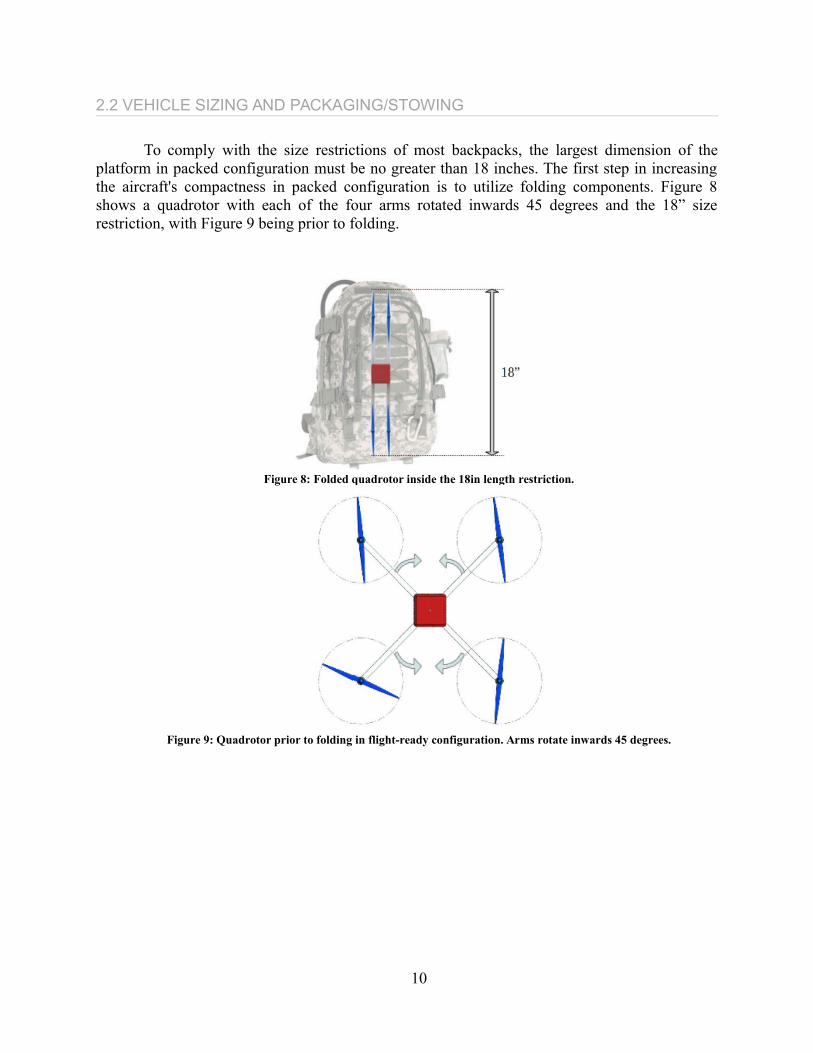
To comply with the size restrictions of most backpacks, the largest dimension of theplatform in packed configuration must be no greater than 18 inches. The first step in increasingthe aircraft's compactness in packed configuration is to utilize folding components. Figure 8shows a quadrotor with each of the four arms rotated inwards 45 degrees and the 18” sizerestriction, with Figure 9 being prior to folding.
Figure 8: Folded quadrotor inside the 18in length restriction.
Figure 9: Quadrotor prior to folding in flight-ready configuration. Arms rotate inwards 45 degrees.
10

Figure 10: Quadrotor dimensions in packed configuration.
Figure 10 shows representative dimensions of each major component and theextrapolated lengths in packed configuration. Note that l and w are defined for 'worse case'scenarios when the rotors are oriented such that they maximize l or w. When all the rotors areoriented 90 degrees to the arms as shown and w is maximized, l will not be as large as definedabove but rather: l = 2a + b. It will be noted in detail in following sections that the rotor diametermust be maximized within the dimensional restrictions for greater hover efficiency. Figure 11describes the condition such that the rotor blades do not intersect when flying.
Figure 11: Maximum diameter rotors. The rotor disk [diameter] is marked by the gray hatched circles.
When the rotor diameter d is maximized without rotor intersection as shown in Figure 10and adhering to the condition for l in Figure 8 and b = 3” (average relay dimension), thesearguments are derived:
11
2(a+ √(9 /2))2=d2
18=2a+ 3+ d
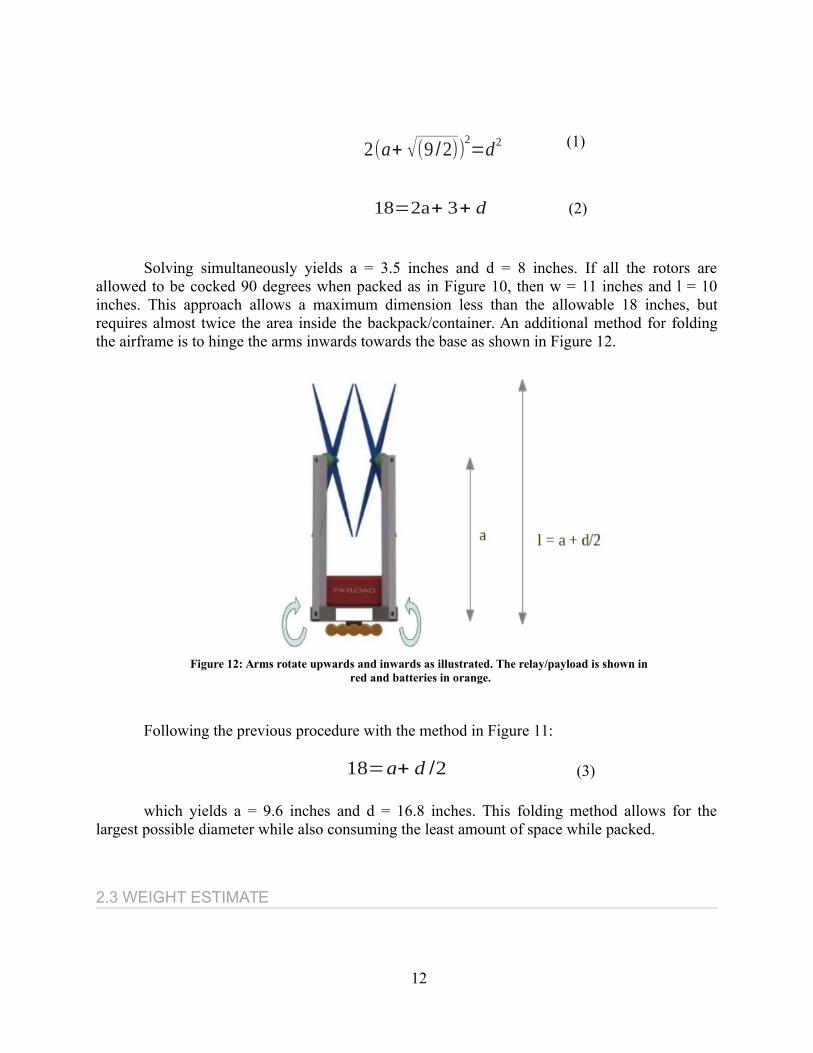
Solving simultaneously yields a = 3.5 inches and d = 8 inches. If all the rotors areallowed to be cocked 90 degrees when packed as in Figure 10, then w = 11 inches and l = 10inches. This approach allows a maximum dimension less than the allowable 18 inches, butrequires almost twice the area inside the backpack/container. An additional method for foldingthe airframe is to hinge the arms inwards towards the base as shown in Figure 12.
Figure 12: Arms rotate upwards and inwards as illustrated. The relay/payload is shown in red and batteries in orange.
Following the previous procedure with the method in Figure 11:
18=a+ d /2
which yields a = 9.6 inches and d = 16.8 inches. This folding method allows for thelargest possible diameter while also consuming the least amount of space while packed.
2.3 WEIGHT ESTIMATE
12
(1)
(2)
(3)

Table 1 summarizes weight estimates for the aircraft, its components, and payload(TCCR). Many of the listed hardware weights are from comparable hobbyist components.
Table 1: Weight estimates.Component Weight (g) Quantity Net Weight (g) % Of Total
Frame 312 1 312 21.2Motor 72 4 288 19.6ESC 21 4 84 5.7
APM Board (Control) 45 1 45 3.1Rotor 12 4 48 3.3
Payload 454 1 454 30.9Batteries (2200mAh) 190 1 190 12.9
Misc. Hardware 50 1 50 3.4
TOTAL 147114.5N
The 2200mAh battery noted provides a relatively high energy density and is commonlyused for small aircraft applications. All else being constant, adding additional battery packs inparallel will indeed increase the endurance but also increases the weight - requiring more thrustand thus more power to hover. The frame weight is based on an off-the-shelf aluminum hobbyistquadrotor frame shown in Image 3a-b. Utilizing much lighter carbon composite frame materialshas the potential to significantly reduce the airframe's total weight and increase endurance.
2.4 HOVER POWER ESTIMATE
The momentum theory is used to obtain preliminary estimates for rotorcraft performancein hover and climb. In short, the momentum theory is derived from the balance of mass,momentum, and energy through an actuator disk. However, this model does make someunderlying assumptions that produce and underestimate for power required, namely: the flow isincompressible, steady, inviscid, irrotational, uniform, one-dimensional, and that there is no swirlin the rotor's wake or tip losses. [7] The derived form for this estimate of power to hover, knownas ideal power, is given by:
Pideal=T∗√(
T2∗ρ∗A
)
where T is the thrust, rho is the air density, and A is the rotor's disk area (circle ofdiameter d). For the quadrotor configuration in [unaccelerated] hover:
W=∑ T=4T
13
(4)
(5)

With the above equation for ideal power and the net weight estimate, a MATLABprogram was written to plot ideal power as a function of rotor diameter. Figure 13 is the resultingplot showing the total ideal power to hover for all four rotors as a function of disk area. Utilizingthe latter folding method in the previous section with its 16.8 inch rotor diameter, the total idealpower is approximately 45 Watts.
Figure 13: MATLAB plot for total ideal power from momentum theory.
2.5 ENDURANCE ESTIMATE
An estimate for the aircraft's flight endurance [in hover] is estimated from the ideal powerand the average consumption by components. The efficiency of the electronic speed controllers(ESC) and motors are average values for similar hobby products. Figure 14 graphically depictsthe distribution of power from the battery to the all the respective components. Solving for theamperage draw for each component from the 2200mAh source yields a hover endurance of 21minutes. Several voltage step-ups and step-downs are required at each junction to modify thebattery's 11.25 V input voltage and are not included. The absence of theses deceives with theirown efficiency factors leaves the solution a slight overestimate.
14
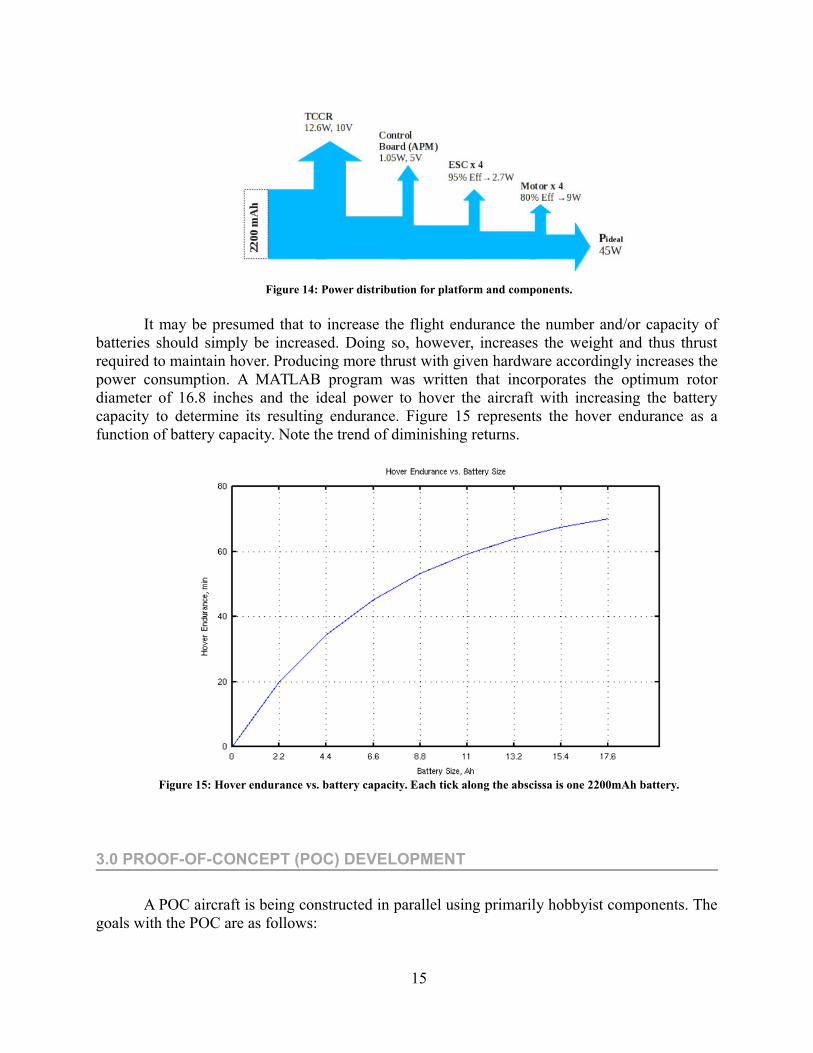
Figure 14: Power distribution for platform and components.
It may be presumed that to increase the flight endurance the number and/or capacity ofbatteries should simply be increased. Doing so, however, increases the weight and thus thrustrequired to maintain hover. Producing more thrust with given hardware accordingly increases thepower consumption. A MATLAB program was written that incorporates the optimum rotordiameter of 16.8 inches and the ideal power to hover the aircraft with increasing the batterycapacity to determine its resulting endurance. Figure 15 represents the hover endurance as afunction of battery capacity. Note the trend of diminishing returns.
Figure 15: Hover endurance vs. battery capacity. Each tick along the abscissa is one 2200mAh battery.
3.0 PROOF-OF-CONCEPT (POC) DEVELOPMENT
A POC aircraft is being constructed in parallel using primarily hobbyist components. Thegoals with the POC are as follows:
15
Test and validate rotors developed for the theoretical design
Integrate and test the off-the-shelf control system
Technology demonstration purposes
Two key components have been obtained: The ArduPilot 2.0 comprehensive controlboard and a folding quadrotor frame (Image 2a and 2b).
The ArduPilot Mega 2.0 (APM2) includes the following capabilities [11]:
Arduino Compatability
Plenty I/O straight pins for sensor/motor connectivity
Digital compass
GPS
Programmable autopilot
6-DOF accelerometer and gyros
Barometric pressure sensor/altimeter
PC-based API
16

Image 2a: Flight-ready Configuration. Image 2b: Collapsed Configuration.
One of the greatest benefits this device offers to the project is hardware flexibility. TheAPM2 delivers a dependable and compatible electronic platform on which to build upon. Allstability and control hardware and software is already included and will require minimalconfiguration, as that aspect is not in this project's scope. Once motors have been chosen, theyalong with their requisite motor controllers could be connected to the APM2. Of course someconfiguration and calibration will be required before safe and successful flight operations. Image3 is a screenshot of the APM2's API showing live data feeds from the board. Clockwise from theright side are attitude indicator, geographic location and heading, and a graph showing live pitch,roll, and yaw angles. Once the hardware is integrated with the APM2, simple instructions inArduino could command the aircraft to hover as the minimum design objectives specify. Oncethe aircraft could reliably and safely hover at 50 feet it will be outfitted with a compact Wi-Firouter as shown in Figure 16. The router will enable the system to perform a demonstrationwhereas the aircraft will hover at some 50 feet and allow two laptop computers that are otherwiseout of line-of-sight and/or range to successfully transmit data. Because Wi-Fi has a relativelyhigh dissipation rate and data transmissions could by explicitly verified gives this demonstrationgreat impact.
Image 3: Screenshot of live flight data from the APM2 board showing attitude, geographic location, and roll/pitchrates.
17

Figure 16:Initial mission for POC aircraft.
Unfortunately, other than general COTS and open-source software and hardwarefamiliarization, not much progress was made with respect to proof-of-concept vehicle test articledevelopment. However, the background research did lead to, first, a clarification of the technicalchallenges of sizing the vehicle and the necessity of improving the conceptual vehicle’s hoverefficiency and endurance and, second, the acquisition and development of single rotor testarticles for the experimental work conducted as a part of this study.
4.0 CHALLENGES IN IMPROVING VEHICLE HOVER EFFICIENCY AND ENDURANCE
The proof-of-concept work performed to date was overall quite promising but it is stillclear that substantial improvements to vehicle hover efficiency and endurance need to be madefor quadcopter configurations to achieve the size, weight, and payload requirements associatedwith the LOS communication relay mission. Chief among the challenges implicit in improvingquadcopter efficiency and performance is those related to rotor design and operation in low-Reynolds aerodynamic regimes. This section of the report will provide background informationinto airfoil and rotor aerodynamics while operating a low-Reynolds numbers.
4.1 AIRFOILS AND ROTORS OPERATING IN THE LOW REYNOLDS NUMBER REGIME
The low Reynolds numbers that aircraft of this size, weight, and speed operate in posesan additional technical challenge. Whereas the generic passenger-carrying aircraft operates inReynolds numbers greater than 100000, aircraft such as the quad rotor experience Reynoldsnumber of 10000 and less. Because of the focus in larger [transport] aircraft during the lastcentury, there is relatively little research in the area of low Reynolds number flight. Figure 17illustrates the vast range of Reynolds numbers.
18
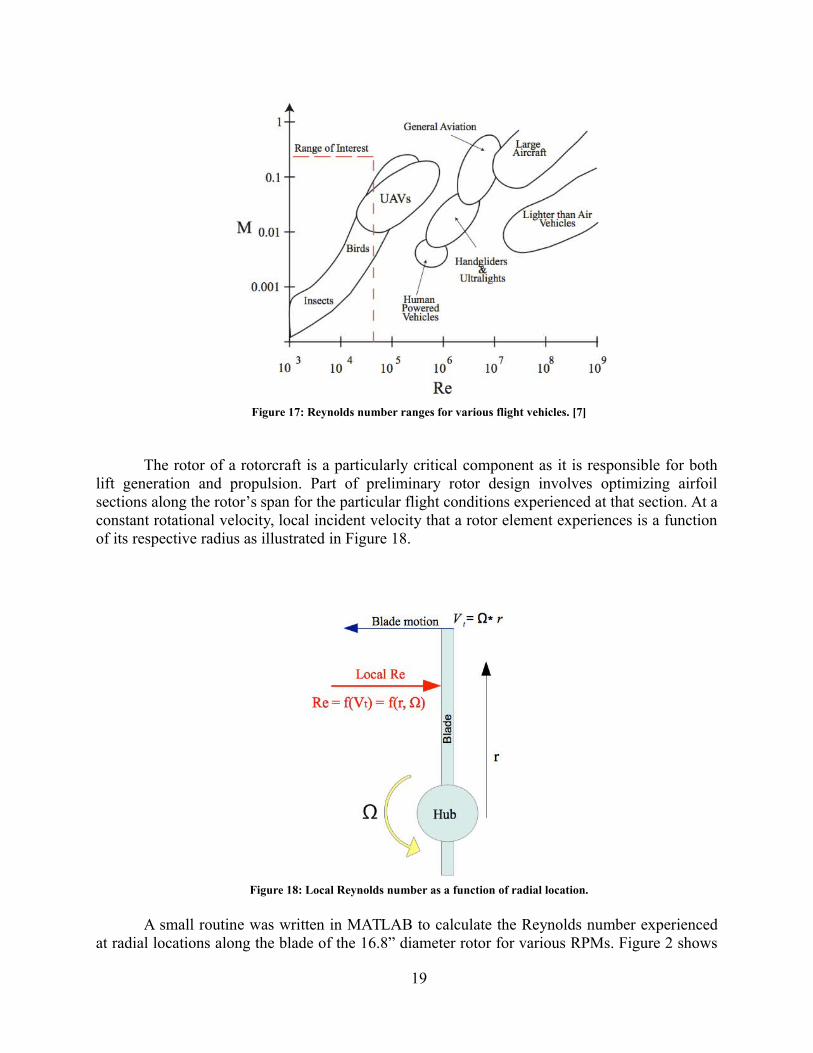
Figure 17: Reynolds number ranges for various flight vehicles. [7]
The rotor of a rotorcraft is a particularly critical component as it is responsible for bothlift generation and propulsion. Part of preliminary rotor design involves optimizing airfoilsections along the rotor’s span for the particular flight conditions experienced at that section. At aconstant rotational velocity, local incident velocity that a rotor element experiences is a functionof its respective radius as illustrated in Figure 18.
Figure 18: Local Reynolds number as a function of radial location.
A small routine was written in MATLAB to calculate the Reynolds number experiencedat radial locations along the blade of the 16.8” diameter rotor for various RPMs. Figure 2 shows
19
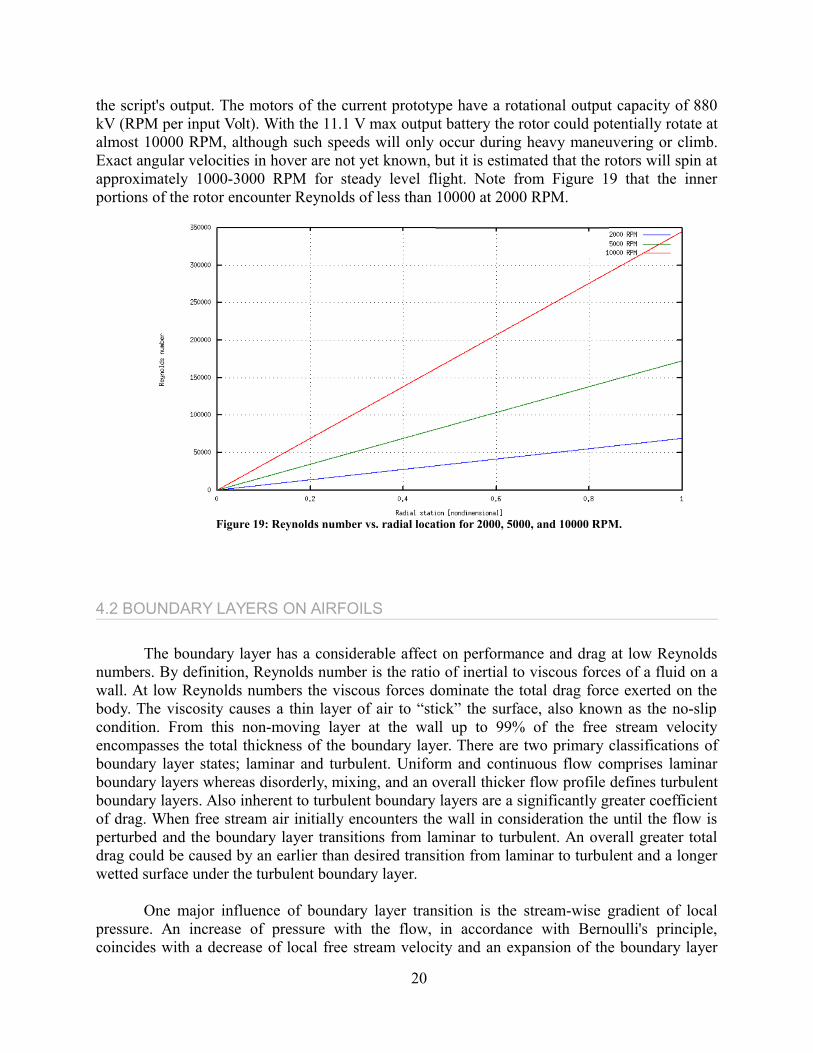
the script's output. The motors of the current prototype have a rotational output capacity of 880kV (RPM per input Volt). With the 11.1 V max output battery the rotor could potentially rotate atalmost 10000 RPM, although such speeds will only occur during heavy maneuvering or climb.Exact angular velocities in hover are not yet known, but it is estimated that the rotors will spin atapproximately 1000-3000 RPM for steady level flight. Note from Figure 19 that the innerportions of the rotor encounter Reynolds of less than 10000 at 2000 RPM.
Figure 19: Reynolds number vs. radial location for 2000, 5000, and 10000 RPM.
4.2 BOUNDARY LAYERS ON AIRFOILS
The boundary layer has a considerable affect on performance and drag at low Reynoldsnumbers. By definition, Reynolds number is the ratio of inertial to viscous forces of a fluid on awall. At low Reynolds numbers the viscous forces dominate the total drag force exerted on thebody. The viscosity causes a thin layer of air to “stick” the surface, also known as the no-slipcondition. From this non-moving layer at the wall up to 99% of the free stream velocityencompasses the total thickness of the boundary layer. There are two primary classifications ofboundary layer states; laminar and turbulent. Uniform and continuous flow comprises laminarboundary layers whereas disorderly, mixing, and an overall thicker flow profile defines turbulentboundary layers. Also inherent to turbulent boundary layers are a significantly greater coefficientof drag. When free stream air initially encounters the wall in consideration the until the flow isperturbed and the boundary layer transitions from laminar to turbulent. An overall greater totaldrag could be caused by an earlier than desired transition from laminar to turbulent and a longerwetted surface under the turbulent boundary layer.
One major influence of boundary layer transition is the stream-wise gradient of localpressure. An increase of pressure with the flow, in accordance with Bernoulli's principle,coincides with a decrease of local free stream velocity and an expansion of the boundary layer
20

profile. This stream-wise in increase in pressure is known as an adverse pressure gradient.Conversely, a favorable pressure gradient is a decrease in stream-wise pressure resulting in anincrease in local velocity that maintains the laminar profile of the boundary layer. These twoscenarios are illustrated in Figure 20 a) and b).
Figure 20a: Laminar boundary layer. [7]
Figure 20b: Transitional boundary layer. [7]
When an adverse pressure gradient adequately perturbs a laminar boundary layer it willeither separate and reattach as a fully turbulent boundary layer, separate and stall theairfoil/blade, or immediately transition into a turbulent boundary layer. The stream-wisecurvature of the particular wall is a fundamental source of pressure gradients. The affect oftransition and separation, whether due to airfoil curvature or angle of attack, could be mitigatedby the use of thin cambered airfoils. Figures 21a-c show three airfoil profiles and their respectivevelocity distributions over the upper and lower surfaces in inviscid flow at 3 degrees angle ofattack. Note the relatively slower velocity distribution on the lower surface of the camberedNACA 6406. This deceleration and accompanying higher pressure at the lower surface allowsthe airfoil to continue to produce lift when the flow on the upper surface may be separated andstalled.
21
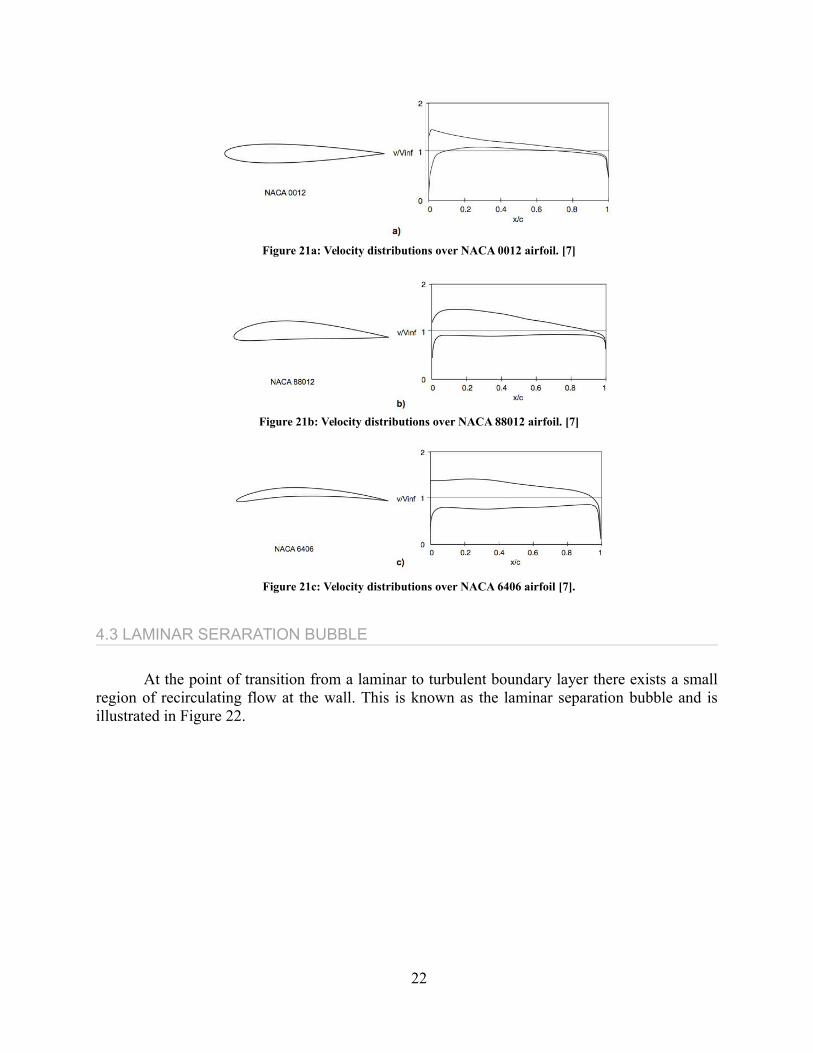
Figure 21a: Velocity distributions over NACA 0012 airfoil. [7]
Figure 21b: Velocity distributions over NACA 88012 airfoil. [7]
Figure 21c: Velocity distributions over NACA 6406 airfoil [7].
4.3 LAMINAR SERARATION BUBBLE
At the point of transition from a laminar to turbulent boundary layer there exists a smallregion of recirculating flow at the wall. This is known as the laminar separation bubble and isillustrated in Figure 22.
22

Figure 22: Transitional boundary layer showing separation bubble and turbulent reattachment. [7]
Within this bubble the lower portion of the flow is reversed and physically undergoes atransformation from laminar to turbulent flow. The downstream portion of the bubble containsfully turbulent flow. These bubbles are known to appear at Reynolds numbers from 30,000 to70,000. Referring to Figure 18, this range of Reynolds numbers would exist at the outer portionof the rotor at the highest rotational velocities. At Reynolds numbers below this range, laminarboundary layers separates without the occurrence of a bubble. Laminar separation bubbles alsocause streamlined airfoils to exhibit hysteresis with small variations in angle of attack andReynolds number. The Reynolds number at which transition occurs is known as the criticalReynolds number and differs for each airfoil.
4.4 AIRFOIL BEHAVIOR
Research performed by Schmitz [7] has concluded that there is a significant performancepenalty for traditional streamlined airfoils when they are operated below their critical Reynoldsnumber. Schmitz also discovered that flat plates and cambered airfoils do not exhibit hysteresisas do streamlined airfoils. Five distinct airfoils tested by Schmitz are shown if Figure 23. A plotof Cl_max for these airfoils over a range of Reynolds numbers is shown in Figure 24.
23
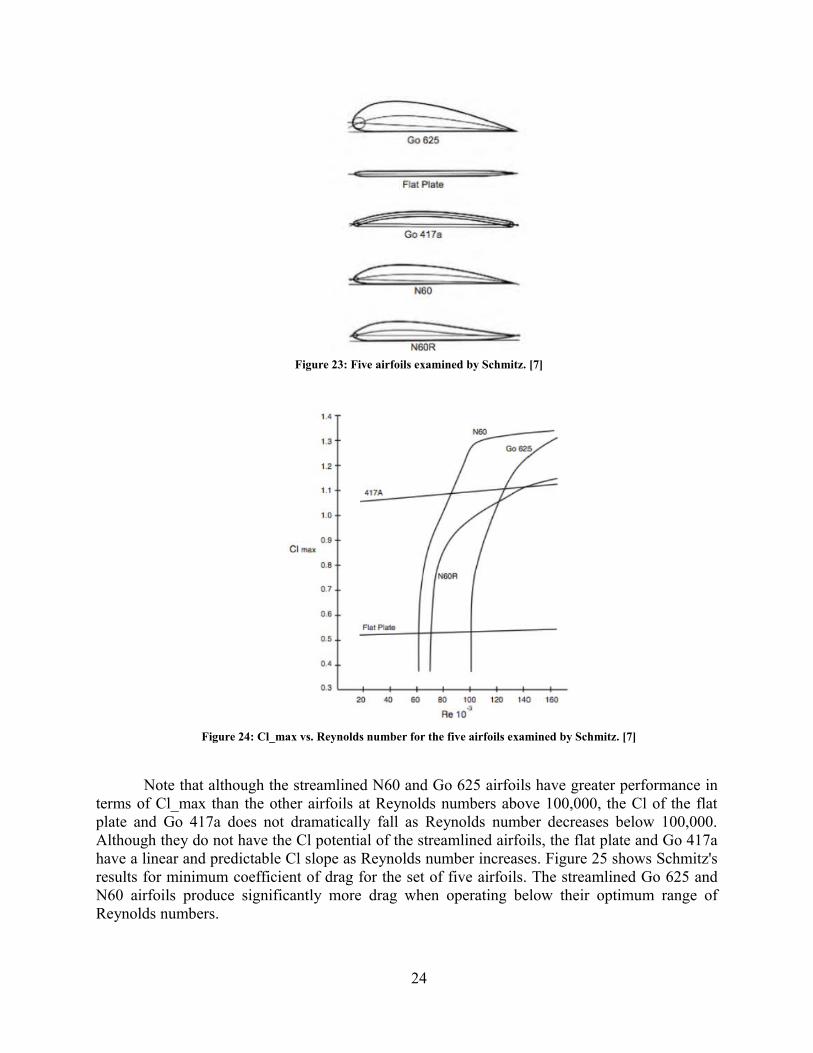
Figure 23: Five airfoils examined by Schmitz. [7]
Figure 24: Cl_max vs. Reynolds number for the five airfoils examined by Schmitz. [7]
Note that although the streamlined N60 and Go 625 airfoils have greater performance interms of Cl_max than the other airfoils at Reynolds numbers above 100,000, the Cl of the flatplate and Go 417a does not dramatically fall as Reynolds number decreases below 100,000.Although they do not have the Cl potential of the streamlined airfoils, the flat plate and Go 417ahave a linear and predictable Cl slope as Reynolds number increases. Figure 25 shows Schmitz'sresults for minimum coefficient of drag for the set of five airfoils. The streamlined Go 625 andN60 airfoils produce significantly more drag when operating below their optimum range ofReynolds numbers.
24
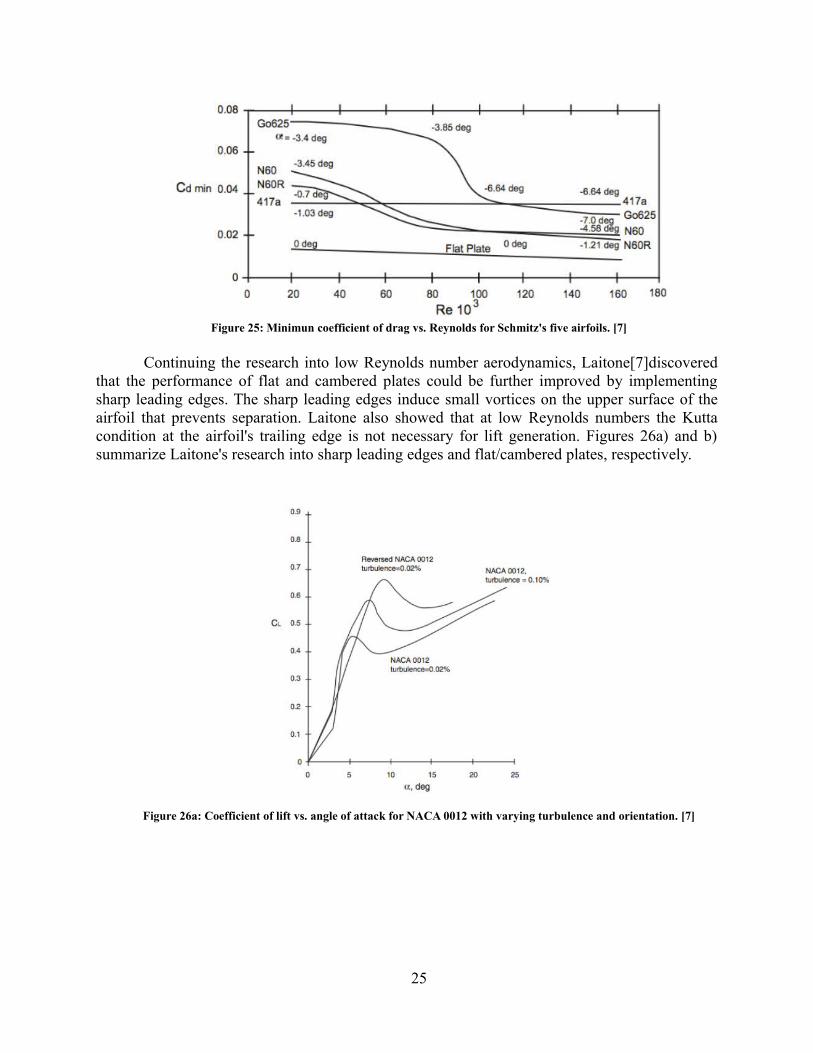
Figure 25: Minimun coefficient of drag vs. Reynolds for Schmitz's five airfoils. [7]
Continuing the research into low Reynolds number aerodynamics, Laitone[7]discoveredthat the performance of flat and cambered plates could be further improved by implementingsharp leading edges. The sharp leading edges induce small vortices on the upper surface of theairfoil that prevents separation. Laitone also showed that at low Reynolds numbers the Kuttacondition at the airfoil's trailing edge is not necessary for lift generation. Figures 26a) and b)summarize Laitone's research into sharp leading edges and flat/cambered plates, respectively.
Figure 26a: Coefficient of lift vs. angle of attack for NACA 0012 with varying turbulence and orientation. [7]
25
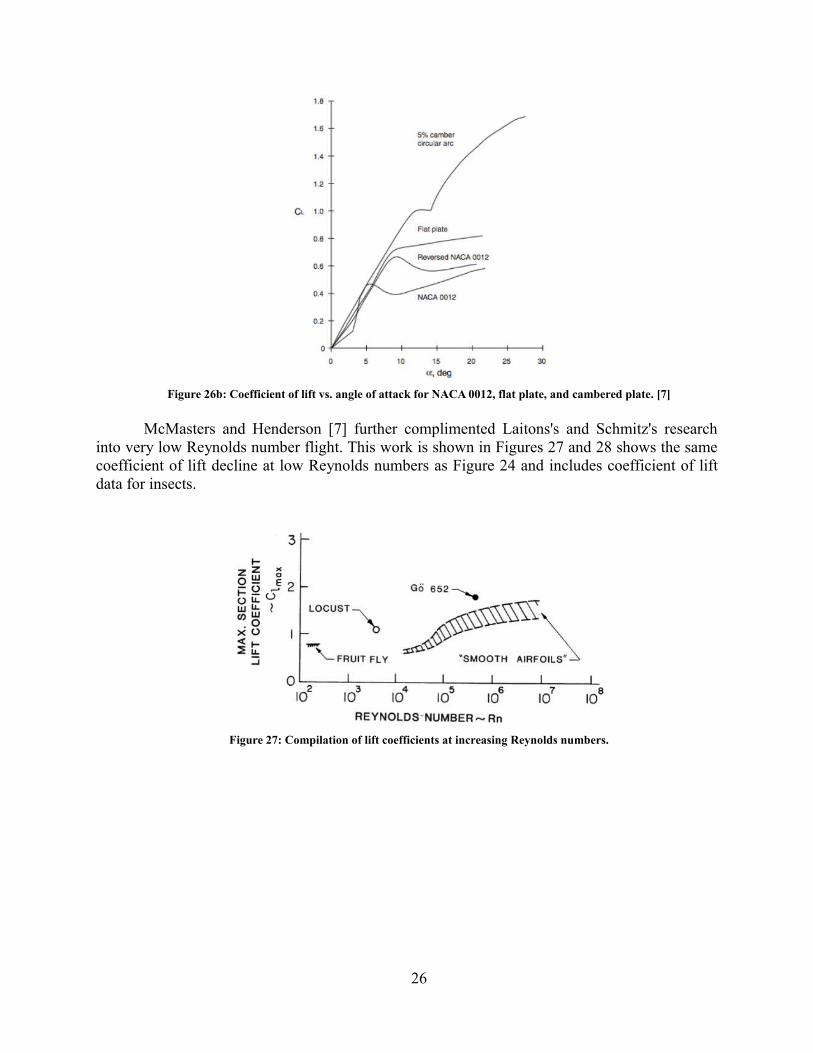
Figure 26b: Coefficient of lift vs. angle of attack for NACA 0012, flat plate, and cambered plate. [7]
McMasters and Henderson [7] further complimented Laitons's and Schmitz's researchinto very low Reynolds number flight. This work is shown in Figures 27 and 28 shows the samecoefficient of lift decline at low Reynolds numbers as Figure 24 and includes coefficient of liftdata for insects.
Figure 27: Compilation of lift coefficients at increasing Reynolds numbers.
26

Figure 28: Cl/Cd_max for various flight bodies over increasing Reynolds numbers.
5.0 ROTOR AERODYNAMICS AND HOVER PERFORMANCE
5.1 BLADE ELEMENT THEORY
Momentum theory provides a reasonable estimate for the power required to hover androtor diameter, but does not, in itself, provide any specific insights into the rotor's geometryincluding the number of blades, airfoil characteristics, and planform required for optimalperformance. The next step in rotor design involves determining the proper airfoil section andtypically utilizes the blade element theory. In Blade Element Theory, the lift and dragcharacteristics are analyzed at infinitesimally thin airfoil sections along the rotor blade and thenintegrated from the rotor's root to tip to obtain total thrust and power consumed. This isillustrated in Figure 29, where b is the number of blades. The rotors hub and blade joints take upa small yet significant diameter that does not generate lift and is known as the root cut out area.Elemental thrust and power are integrated over the blade's span to yield total thrust and power asexpressed in equations 6 and 7, respectively. [8]
27

Figure 29: Elemental rotor sections. [8]
An infinitesimal airfoil section, its pitch angle, and induced velocity are sketched inFigure 30. Equations 8 and 9 resolve the induced angle of attack and effective angle of attack,respectively.
Figure 30: Inflow velocity, pitch angle, and inflow angle angle of attack. [8]
28
(7)
(6)
(8)
(9)

With the effective angle of attack at each airfoil station, sectional lift and drag values arecomputed from airfoil properties provided by data tables. The expressions for sectional lift anddrag are expressed in Equations 10 and 11, respectively, where U_t is the tangential velocityfrom rotation and U_p is the inflow velocity.
From the section lift and drag expressions, sectional expressions for thrust, axial forceand power are derived in Equations 12, 13, and 14, respectively. [8]
5.2 BLADE ELEMENT MOMENTUM (BEM) THEORY
Although more physically accurate than momentum theory and appropriate for detailedfixed-wing analysis, blade element theory has drawbacks when applied to helicopter rotors.Blade element theory does not account for tip losses, swirl wake losses, and assumes that theinflow velocity to the rotor is uniform, leading to an underestimate of power required. The BEMmethod incorporates the same numerical procedure as the blade element theory but also includesterms for the non-uniform flow. In BEM, the rotor disk is divided into a thin annulus as shown inFigure 31. The area of the annulus, mass flow rate through the annulus, and thrust created by theannulus is calculated in Equations 15, 16, and 17, respectively. [8]
29
(10)
(11)
(14)
(13)
(12)

Figure 31: Elemental annulus in BEM theory. [8]
The differential thrust for the annulus incorporating sectional airfoil geometry isexpressed in Equation 19, where a is the lift slope, b is the number of blades and c is the bladechord.
5.3 BEM ROTOR ANALYSIS
A MATLAB routine [10] performs the BEM numerical procedure based on the airfoilsections lift slope, coefficient of drag, rotor size, and angular velocity. The BEM MATLABroutine was carried out for a completely flat plate rotor, a rotor consisting completely of a NACA2412 airfoil, three hybrid rotors where the transition point from flat plate to 2412 varies radially.The rotor diameter used is 16.8” (calculated from prior momentum theory) and a median pitch of4.7 degrees. Figure 32 shows the resulting output for rotor thrust as a function of increasingRPM.
30
(15)
(16)
(17)
(18)

Figure 32: Thrust vs. RPM for flat plate and NACA 2412 from BEM.
Figure 33 represents the power required to maintain a constant rotational velocity and theresulting thrust produced by the flat plate and NACA 2412 rotors.
Figure 33: Power vs. RPM for flat plate and NACA 2412 from BEM.
Figure 34 shows the resulting thrust and power required for the hybrid rotor as the location oftransition from flat plate to NACA 2412 airfoil is moved radially towards the rotor tip.
31

Figure 34: Thrust vs. radial location of geometric transition.
From these results from the BEM analysis, it could be concluded that:
Below 2000 RPM where according to Figure 2 the blades Reynolds number is mostly below 50000, the flat plate rotor produces slightly more thrust than the 2412 airfoil rotor.
Given that the total estimated weight of the aircraft is 14.5 N and the thrust results are pereach of the four rotors, the angular velocity needed to hover need not exceed 3500 RPM
At angular velocities above 5000 RPM, the flat plate rotor consumes significantly more power than the 2412 rotor
At 1500 RPM (low Re), it is advantageous to move the transition point outboard towards the rotor tip.
6.0 ROTOR CFD ANALYSIS
32

Computational Fluid Dynamics (CFD) was utilized to further investigate the performanceof the rotors at low Reynolds numbers at a higher level of fidelity. CFD allows the effects ofviscosity and separation to be accounted for in estimating the performance of the rotor bladedesign. Two different rotor blades are considered: one “standard” blade consisting of a NACA2412 streamlined airfoil throughout the span, and a “hybrid” blade with a Goe 417a camberedplate airfoil from the hub to 40% of the span and a NACA 2412 throughout the remainingoutboard section. Both blades are do not incorporate taper or twist, and are set at a constant 4.7degrees pitch throughout the span.
6.1 APPROACH
To best resolve the low Reynolds number conditions, the pressure-based CFD-ACE+ code was used in conjunction with the low-Re Two-Layer k-ε Chien turbulence model in steady state. This turbulence model provides a more accurate representation of low Reynolds number physics near the wall than does the standard k-ε module and wall functions. Another benefit to the low-Re Chien model is that is does not require extremely fine grid resolution at the wall, which alleviatessome of the computational expense. In this model, the cell zone near the wall is divided into two sublayers. The sublayer directly adjacent to the wall where viscosity is dominant uses a one-equation model where the ε variable is replaced by an algebraic relation. The sublayer away fromthe wall is resolved with the standard k-ε model commonly used at higher Reynolds numbers. Turbulent viscosity and damping function for the model are calculated by Equations 19 and 20, respectively. [9]
Length scales for the turbulence variable are defined by Equations 21 and 22 and localturbulence Reynolds number expressed by Equation 23. [9]
33
(20)
(19)
(21)

The constants for the model are a=50.5, b=5.3, and C_l = kC_μ^(-3/4). The location ofthe sublayer interface is where the damping function is equal to 1. Below this value, thedissipation rate is calculated by Equation 24. [9]
A three dimensional C-type fully structured grid was created for a single blade for each ofthe two geometries. The grid resolution was 75x150x75 grid points and is shown in Figures 35-37.
34
(22)
(23)
(24)
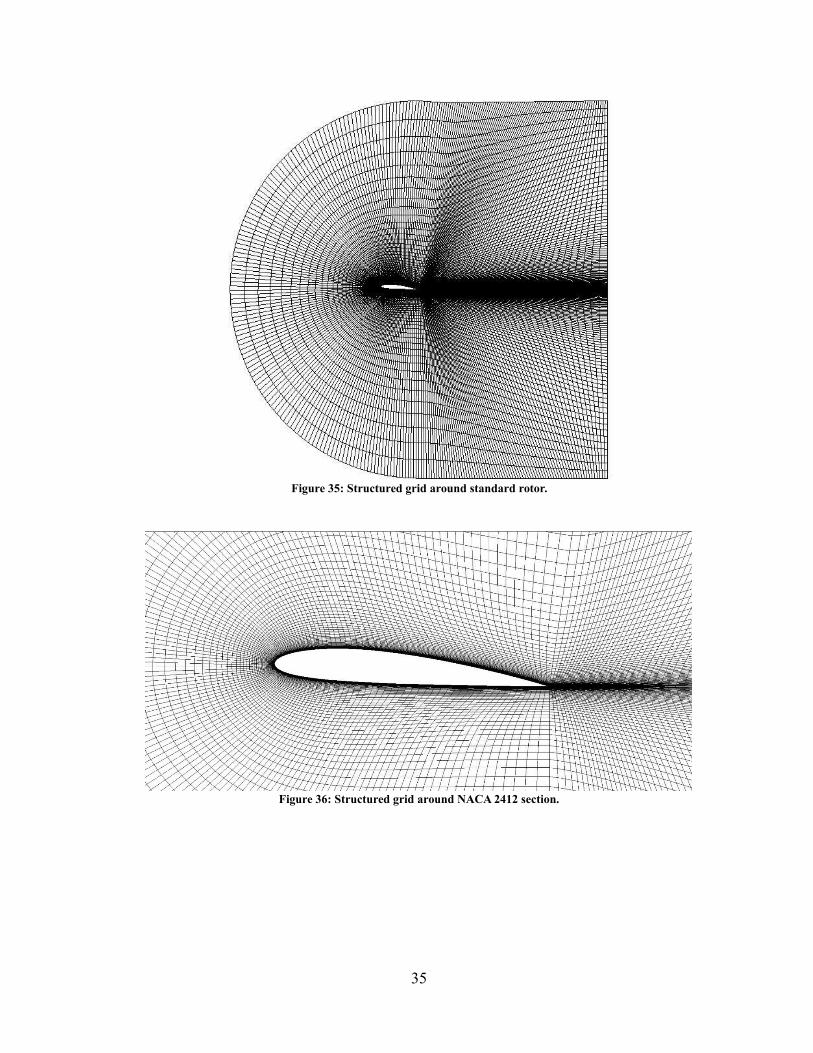
Figure 35: Structured grid around standard rotor.
Figure 36: Structured grid around NACA 2412 section.
35

Figure 37: Structured grid around Goe 417a section.
An interpolative loft between the Go 417a and NACA 2412 at 40% span was created andis shown in Figure 38.
Figure 38: Interpolated grid section between NACA 2412 and Go 417a.
To accommodate the turbulence model, the y+ values at the rotor surfaces for both gridswere below 1. Figure 39 displays the y+ on the upper surface of the standard rotor at 1000 RPM.
36

Figure 39: Y+ values on the upper surface of standard blade at 1000 RPM.
A rotating wall boundary condition was applied to the rotor walls about the hub. Thisallows for the effect of Ωr without the need for computationally expensive time-accuratesimulations and rotating grids. To further simplify the simulations, the hub and blade tips werenot discretized as the purpose of this analysis was to quantity the performance of the sectionalblade geometries. Both rotors were run at 1000, 3000, and 5000 RPM to examine the affects of alarge range of Reynolds numbers. Albeit high-fidelity simulations for the rotor blade surfaces,these simulations do incorporate the following assumptions:
The rotor hub does not affect comparative results between the two blades and are notsimulated for simplicity.
Tip losses do not affect comparative results between the two blade geometries. Thevolume beyond the rotor tip was not discreteized due to limited computational power. Itis expected that any results will be an overestimate due to this.
Wake is not considered or resolved for. This would require ultra-high fidelity grids andtime accurate simulations.
Inflow does not affect comparative results between the two blade geometries. Theboundary conditions for vertical velocity were set to 0.
6.2 CFD RESULTS
Pressure contours on the upper surfaces of both geometries for all 1000, 3000, and 5000RPM are shown in Figures 40, 41, and 42, respectively.
37

Figure 40: Pressure contours on upper surfaces of standard (left) and hybrid (right) rotors at 1000 RPM.
Figure 41: Pressure contours on upper surfaces of standard (left) and hybrid (right) rotors at 3000 RPM.
38
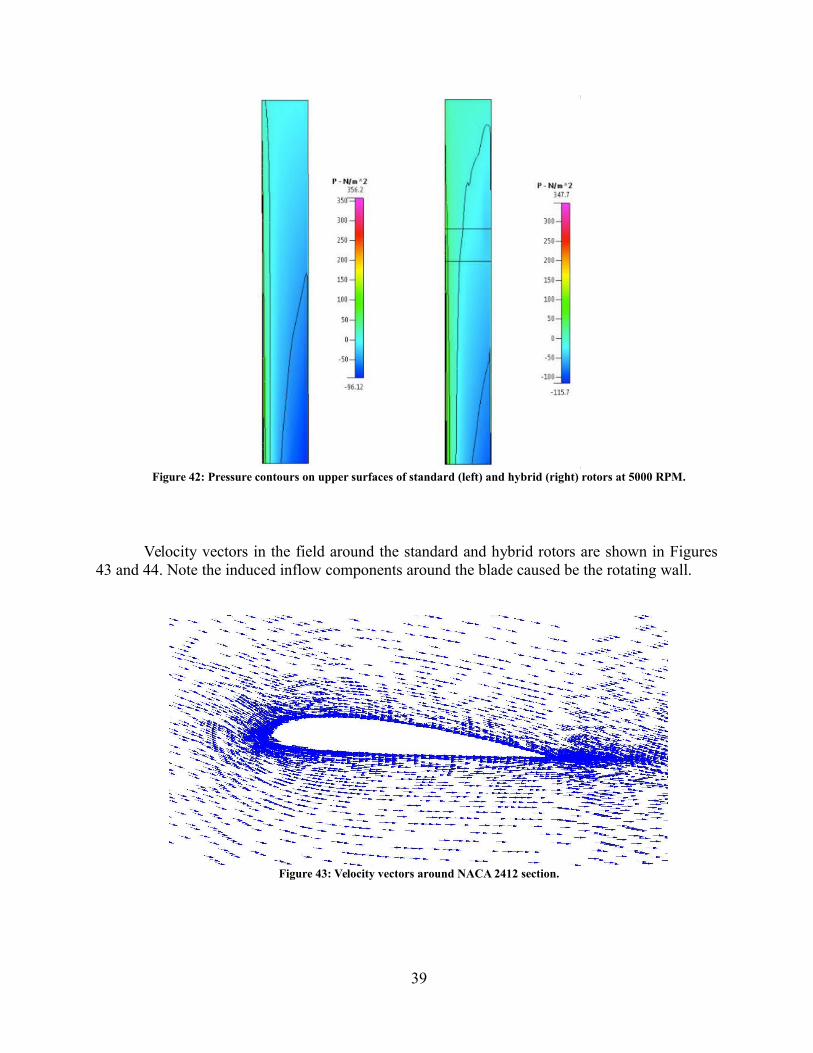
Figure 42: Pressure contours on upper surfaces of standard (left) and hybrid (right) rotors at 5000 RPM.
Velocity vectors in the field around the standard and hybrid rotors are shown in Figures43 and 44. Note the induced inflow components around the blade caused be the rotating wall.
Figure 43: Velocity vectors around NACA 2412 section.
39

Figure 44: Velocity vectors around Goe 417a section.
For each simulation, the integrated pressure and viscous forces acting on the bladesurface were combined to yield the linear vertical force and moment around the center ofrotation. These two values were doubled to represent the net thrust and moment for the entiretwo-bladed rotor. The net moment acting against rotation was used to calculate the mechanicalpower required to maintain constant rotation. Equation 25 expresses mechanical power as afunction of moment (τ) and rotational velocity (Ω).
P=τ ×2 π×Ω
60
Figure 45 shows the thrust produced by the two rotors as RPM is increases. Figure 46 expresses the thrust as a function of the mechanical power required.
40
(25)
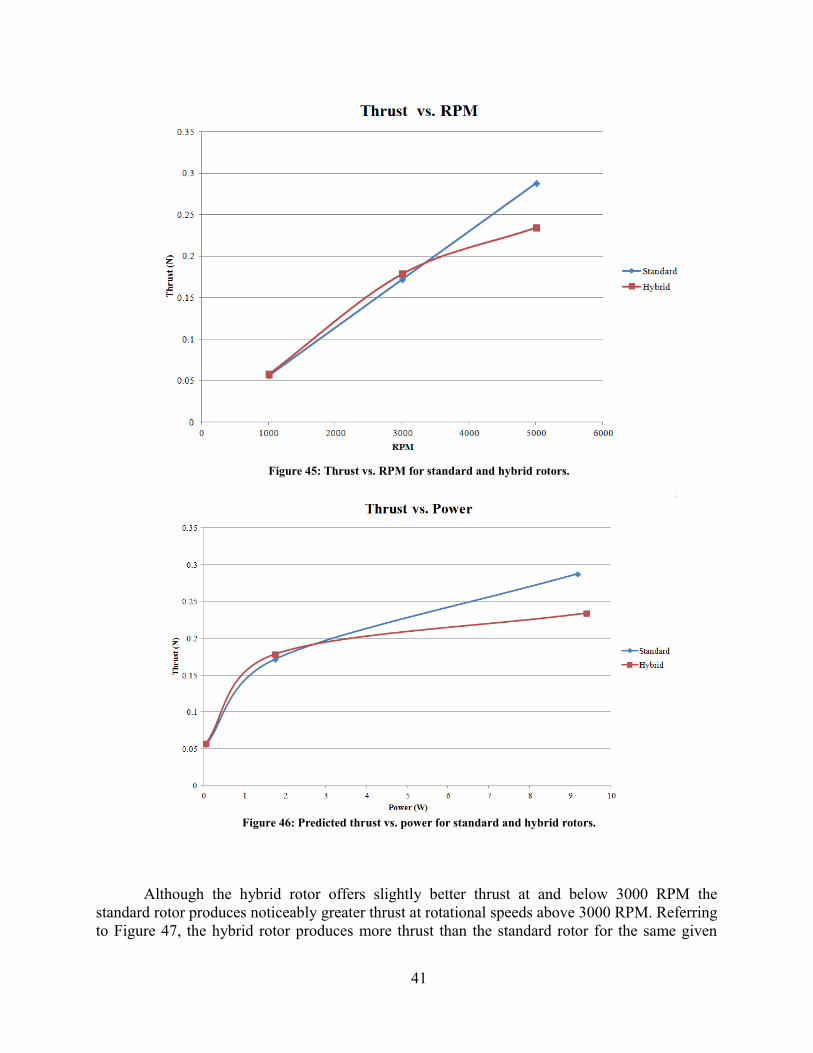
Figure 45: Thrust vs. RPM for standard and hybrid rotors.
Figure 46: Predicted thrust vs. power for standard and hybrid rotors.
Although the hybrid rotor offers slightly better thrust at and below 3000 RPM thestandard rotor produces noticeably greater thrust at rotational speeds above 3000 RPM. Referringto Figure 47, the hybrid rotor produces more thrust than the standard rotor for the same given
41

power at lower RPMs. At higher RPMs (and accordingly higher power required), the standardrotor provides superior performance. Figure 48 shows the Reynolds number the (applicable toboth 1" chord standard and hybrid rotors) experienced at increasing radial stations at 3000 RPM.
Figure 47: Reynolds number as a function of radial location for the 16.8" at 3000 RPM.
At 3000 RPM, the hybrid rotor slightly outperforms the standard rotor. Referring toFigure 48, only the outermost portion of the rotor is operating at Reynolds numbers greater than100000. The remaining inboard portion, including the inner 40% span comprised of the Goe417a section, is operating well below the Reynolds number limit of 100000. This data, alongwith the research in Section 4.4 that indicates improved aerodynamic performance of cambered-plate airfoils over traditional streamlined airfoils at Reynolds numbers below 100000, supportsthe resulting performance advantage the hybrid rotor offers at 3000 RPM.
7.0 EXPERIMENTAL ROTOR TESTING
Physical models of the 16.8" diameter rotors simulated in Section 6.2 were 3D printedand tested. With the exception of the rotor hub, the geometry of the standard and hybrid rotorswere consistent to best experimentally validate the CFD results. A COTS 4.7° pitch rotor wasadditionally tested as a performance benchmark. These three rotors are described in Table 2 andshown in Image 4. A 880Kv motor as described in Section 2 was used to rotate the rotors atdesired speeds. A digital scale was used to measure the torque produced by the rotor. A variableDC power supply provided the requisite voltage to the motor controller. Current to the motorcontroller was measured by the power supply and verified by a multimeter in series between thepower supply and motor controller. The motor/rotor assembly was mounted to one end of asimple lever such that its upwards thrust is converted into a downwards force on the digital scale.
42

A free body diagram of this setup is illustrated in Figure 48. This actual apparatus is shown inImage 5.
Figure 48: Free body diagram of lever apparatus to measure thrust. All rotors tested were 12" above the surface.
Table 2: Summary of rotor characteristics.
Rotor Diameter (in)Hub Diameter
(in) Chord (in) Solidity Collective (deg)Benchmark 11 0.5 Variable 0.114 4.8°/inch twist
Standard 16.8 1 1 0.0758 4.7Hybrid 16.8 1 1 0.0758 4.7
Image 4: Top to bottom: benchmark rotor, hybrid rotor, and standard rotor.
43

Image 5: Lever apparatus to measure thrust. The upwards thrust from the motor/rotor on the right side is convertedinto a downwards force to the digital scale on the left side.
7.1 EXPERIMENTAL RESULTS
The throttle setting on an RC transmitter was steadily increased to correspondinglyincrease the rotor RPM at a constant input voltage of 16.8V. The measured instantaneous currentwas used to obtain power consumed. A continuous loss of 0.03A due to the motor controller,receiver, and connections was factored into the calculations. Figure 49 shows the measured thrustfor the three rotors as power is increases. It should be noted that value of power measured in thisexperiment is electrical power, not mechanical power as in the previous sections. Although thecurrent loss of 0.03A was taken into account, the values for measured electrical power will differfrom those estimated by BEM and CFD.
44

Figure 49: Measured thrust for increasing input power for the benchmark, standard, and hybrid rotors.
To account for the different diameters between the benchmark rotor and the standard andhybrid rotors, disk loading was also plotted over power and is shown in Figure 50.
Figure 50: Disk loading on tested rotors for increasing values of electrical power.
45
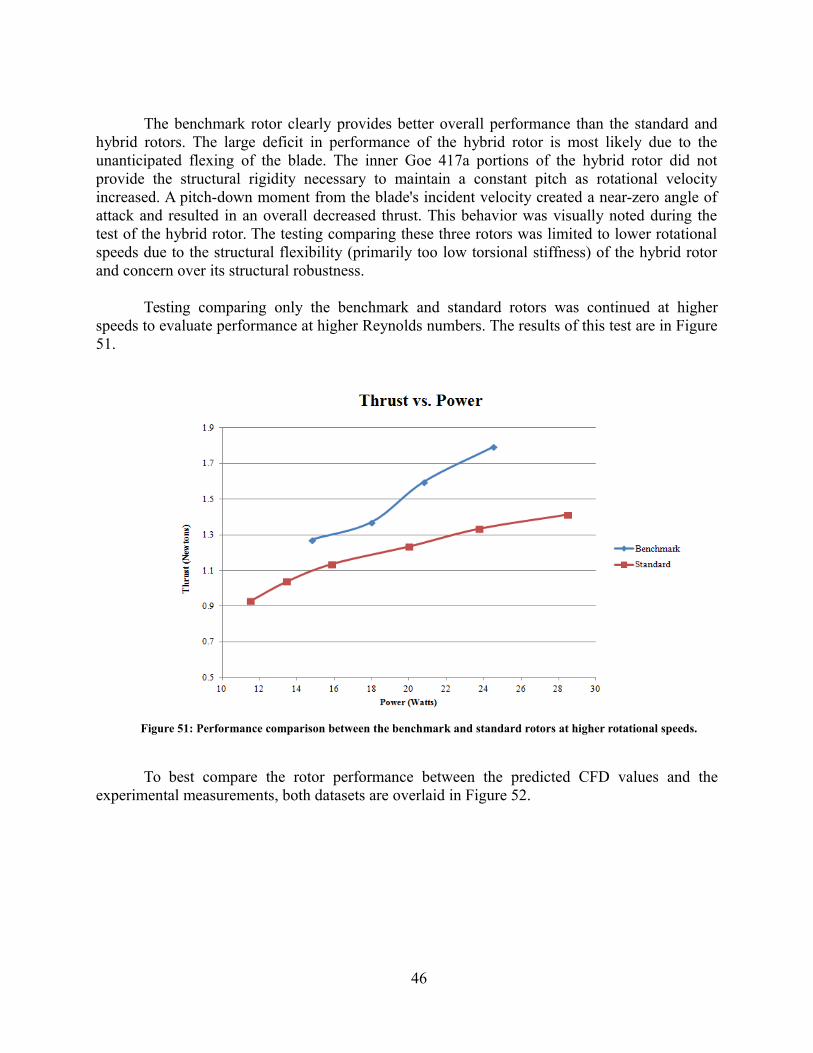
The benchmark rotor clearly provides better overall performance than the standard andhybrid rotors. The large deficit in performance of the hybrid rotor is most likely due to theunanticipated flexing of the blade. The inner Goe 417a portions of the hybrid rotor did notprovide the structural rigidity necessary to maintain a constant pitch as rotational velocityincreased. A pitch-down moment from the blade's incident velocity created a near-zero angle ofattack and resulted in an overall decreased thrust. This behavior was visually noted during thetest of the hybrid rotor. The testing comparing these three rotors was limited to lower rotationalspeeds due to the structural flexibility (primarily too low torsional stiffness) of the hybrid rotorand concern over its structural robustness.
Testing comparing only the benchmark and standard rotors was continued at higherspeeds to evaluate performance at higher Reynolds numbers. The results of this test are in Figure51.
Figure 51: Performance comparison between the benchmark and standard rotors at higher rotational speeds.
To best compare the rotor performance between the predicted CFD values and theexperimental measurements, both datasets are overlaid in Figure 52.
46

Figure 52: Thrust vs. power required plot comparing CFD and experimental results.
Referring to Figure 51, there is a consistent ~10% performance advantage of the heavierdisk loaded benchmark rotor over the standard rotor. Unlike the standard rotor, the benchmarkrotor incorporates factors of twist and taper in its design, furthering its potential for greateraerodynamic efficiency. The benchmark rotor's blades are also comprised entirely of camberedplate airfoils with sharp leading edges.
The experimental results for the standard rotor in Figure 52 shows an under prediction ofthrust by CFD when compared to the experimental values. As noted earlier, there is an expecteddiscrepancy between the estimated mechanical power and the measured electrical power requiredto maintain the rotor at a constant rotational velocity. There are several factors that possiblycontribute to this discrepancy between the predicted and experimental results:
The rotors in experimental testing may benefit from ground effect. Given that the rotors tested range from 11" to 16.8" in diameter and the motors were housed 12" above the testing surface, the impact of ground effect is entirely plausible.
Because of the relatively large diameter, constant pitch (collective), and being constructed of a marginally rigid material, there was a small but observable coning behavior to the standard rotor as rotational velocities increased.
A tachometer was not available to directly measure rotational velocity during the experimental testing. Thus, a precise comparison between CFD and experimental results at specified RPMs cannot be realized. Accordingly, the discrepancy in power definition and lack of measured RPM may elude to the experimental curvesbeing "shifted" either left or right in Figure 52. The absence of rotational velocity also inhibits the calculation of Reynolds number.
47

The CFD simulations were comprised of one turbulence model and one grid per geometry. Further turbulence, separation, and grid dependence studies may have produced different results.
8.0 CONCLUSIONS
This study tackled several different aspects of small rotorcraft design and development.First, a novel field telecom relay mission was outlined. Second, the preliminary design of anelectric quadrotor to perform this mission was defined. Third, theoretical, numerical, andexperimental investigations into the vehicle's rotor aerodynamics were performed.
The integration of more aerodynamically efficient rotors could extend hoveringendurance. The experimental and computational research focused on the vehicle rotorsconducted in this paper suggests a small potential performance gain when flat/cambered-plate areused for inboard blade rotor sections when operating at lower RPMs/Reynolds numbers.Implementing a transition model in the CFD simulations would have further increased physicalfidelity and shown any affects of separation at the lower Reynolds portions of the blade. Becauseof the flexing behavior of the hybrid rotor, a true comparison between it and the standard rotor isstill lacking. Both the standard and hybrid rotor were designed strictly for a performancecomparison between the two and the influence of an integrated cambered plate region. Thus,these blades were not designed to maximize individual performance at their respective diskloading the comparison between them and the benchmark rotor is for qualitative value. The useof a stiffer material in the construction of the hybrid rotor may have experimentally validated itssmall gain. It is also worth noting that while the scope of the work in this paper focused onincreasing hover endurance, there is a potential penalty for maneuverability its implications onthe optimal objectives when flying rotors of low disk loading.
Further development of the proof-of-concept model was not continued due to timeconstraints. The hardware and framework is in hand for potential development in the future.
TO CONCLUDE
A man-portable, rapidly-deployable, and cost-effective platform to carry the TCCR orcomparable communication relay will be propitious in LOS denied situations. A quadrotor is themost robust platform and will fit the required dimensional constraints of a backpack. Thetheoretical design and POC will utilized proven and cost-effective off-the-shelf propulsioncomponents. The required endurance will come from the larger than average rotor diameter andcustom designed blades rather than increased battery capacity. The endurance estimates inSection 2.5 neglect time to ascend to altitude which requires significant power, leaving thevalues an overestimate. For a set rotor geometry and propulsion, increasing battery count hasdiminishing returns for prolonging endurance. BEM showed a possibility for increasedperformance at lower RPMs using flat plate rotors near the hub. CFD simulations similarlyverified that cambered plate sections near the hub provides performance benefits. Experimental
48

testing yielded superior performance of the off-the-shelf flat-plate rotor over the larger diameterstandard and hybrid rotors. Structural limitations inhibited direct comparisons between thestandard and hybrid rotors.
REFERENCES
1. Bohorquez, F., Samuel, P., Sirohi, J., Pines, D., & Rudd, L. (n.d.). Design, analysis and performance of a rotary wing mav. Informally published manuscript, Smart Structures Laboratory, Alfred Gessow Rotorcraft Center Department of Aerospace Engineering, University of Maryland, Johns Hopkins University/Applied Physics Laboratory.
2. Duranti, S., Conte, G., Lundstrom, D., Rudol, P., Wzorek, M., & Doherty, P. (n.d.). Linkmav, a protoype rotary wing micro aerial vehicle. (Master's thesis, Link¨oping University, SE-58183 Link “oping”, Sweden).
3. Mueller, T. J. (n.d.). Aerodynamic measurements at low Reynolds numbers for fixed wing micro-air vehicles. Informally published manuscript, Department of Aerospace and Mechanical Engineering, University of Notre Dame Notre Dame, IN 46556 USA.
4. Young, L. A., Johnson, J. L., Demblewski, R., Andrews, J., & Klem, J. (n.d.). New concepts and perspectives on micro-rotorcraft and small autonomous rotary-wing vehicles. 20th AIAA Applied Aerodynamics Conference, St. Louis, MO, June 24-27, 2002.
5. US NAVY. (n.d.). lieutenant michael p. murphy united states navy (seal) may 7, 1976 - june 28, 2005. Retrieved from http://www.navy.mil/moh/mpmurphy/bio.html
6. Monico, G. (2012). Tactical compact communications relay (TCCR). Boeing Electronic & Mission Systems.
7. Bohorquez, F. (2007). Rotor hover performance and system design of an efficient coaxialrotary wing micro air vehicle. (Unpublished doctoral dissertation).
49

8. Sankar, Lakshmi. "Rotorcraft Aerodynamics." Rotorcraft Aerodynamics. N.p., n.d. Web. 08 Feb. 2013.
9. ESI CFD Inc. (2009). Cfd-Ace modules manual. Huntsville, AL:
10. Bell, S. (2008). Analysis of a rotor blade system using blade element momentum theory. In Function to calculate the Power, Thrust and Figure of Merit of a rotor system. [MATLAB]Retrieved from http://www.mathworks.com/matlabcentral/fileexchange/21994-analysis-of-a-rotor-blade-system-using-blade-element-momentum-theory
11. 3DRobotics. (2012, 11 8). The apm 2 board. Retrieved from https://code.google.com/p/ardupilot-mega/wiki/APM2board
12. Arledge, S. (Photographer). (2012, 12 4 ). Scan Eagle UAV [Web Photo]. Retrieved from http://commons.wikimedia.org/wiki/File:Scan_Eagle_UAV.jpg
13. Kabel, M. (Photographer). (2010, 6 12 ). Schiebel Camcopter S-100 [Web Photo]. Retrieved from http://commons.wikimedia.org/wiki/File:Schiebel_Camcopter_S-100_at_ILA_2010.jpg
14. Yarbrough, B. (Photographer). (2013, 3 4). :RQ20A-130304-M-DE426-001 crop [Print Photo]. Retrieved from http://commons.wikimedia.org/wiki/File:RQ20A-130304-M-DE426-001_crop.jpg
15. Hoffmann, G. (Photographer). (2007, 1 15). Schematic of reaction torques on each motor of a quadrotor aircraft, due to spinning rotors [Print Photo]. Retrieved from http://commons.wikimedia.org/wiki/File:Quadrotor_yaw_torque.png
50