
Ultra high-resolution seismic imaging of · PDF fileUltra high-resolution seismic and GPR...
10
Ultra high-resolution seismic and GPR imaging of permafrost. Devon Island, Nunavut Carlos E. Nieto* and Robert R. Stewart CREWES. The University of Calgary, 2500 University Dr., N.W., Calgary, AB, T2N 1N4 [email protected] ABSTRACT In July-August, 2002, several shallow multicomponent seismic surveys and ground-penetrating radar (GPR) traverses were conducted near the NASA Haughton-Mars Project camp on Devon Island, Nunavut. Geophones and hammer impacts in three different orientations (vertical, horizontal inline, and horizontal transverse) with receivers at 10 cm to 2 m spacing were acquired successfully. Two different locations were selected to conduct seismic and radar surveying, the Von Braun Valley and the Gemini Hills in the Haughton crater. Analysis of the ultra-high resolution seismic and GPR lines allowed description of the silty soil (top layer) and underlying permafrost. Shallow excavations at the site indicate that the permafrost layer is at depths of 45 cm – 65 cm. PP and PS seismic reflections from the top of the permafrost layer are difficult to identify as they are embedded in the source-generated noise. However, direct arrival analysis gave seismic velocities for the silt layer (top) as 260 m/s (compressional) and 168 m/s (shear). For the permafrost layer, a compressional-wave velocity of 3100 m/s and a shear-wave velocity of 2030 m/s were obtained. We also conducted reflection lines with a 250 MHz GPR system. The permafrost is nicely imaged and its time and depth assessed by burying a length of rebar on top of it and resurveying. The radar velocity of the overlying silt is about 0.11 m/ns. Introduction The Haughton structure on Devon Island, Nunavut at 75°22’N longitude and 89°41’W latitude, is a 24 km diameter, 23 Ma old impact crater in the high Canadian Arctic (Osinski et al., 2001). Host rocks are gently dipping (to the west) Ordovician and Silurian carbonate sediments mostly of the Allen Bay formation (Scott and Hajnal, 1988). The northwest corner of the outer middle rim hosts the base camp for the Haughton Mars Project (Long, 1999; Lee, 2002). Surveying conditions can be severe due to the high winds of the polar area (up to 70 km/hr during this field survey), low summer temperatures (5°C to +5°C), sleet, rain, and snow– even though this is characterized as a desert (Cockell et al. 2001), and significant ultraviolet radiation (Cockell et al., 2002).
Transcript of Ultra high-resolution seismic imaging of · PDF fileUltra high-resolution seismic and GPR...
Ultra high-resolution seismic and GPR imaging of permafrost. Devon Island, Nunavut
Carlos E. Nieto* and Robert R. Stewart CREWES. The University of Calgary,
2500 University Dr., N.W., Calgary, AB, T2N 1N4 [email protected]
ABSTRACT In July-August, 2002, several shallow multicomponent seismic surveys and ground-penetrating radar (GPR) traverses were conducted near the NASA Haughton-Mars Project camp on Devon Island, Nunavut. Geophones and hammer impacts in three different orientations (vertical, horizontal inline, and horizontal transverse) with receivers at 10 cm to 2 m spacing were acquired successfully. Two different locations were selected to conduct seismic and radar surveying, the Von Braun Valley and the Gemini Hills in the Haughton crater. Analysis of the ultra-high resolution seismic and GPR lines allowed description of the silty soil (top layer) and underlying permafrost. Shallow excavations at the site indicate that the permafrost layer is at depths of 45 cm – 65 cm. PP and PS seismic reflections from the top of the permafrost layer are difficult to identify as they are embedded in the source-generated noise. However, direct arrival analysis gave seismic velocities for the silt layer (top) as 260 m/s (compressional) and 168 m/s (shear). For the permafrost layer, a compressional-wave velocity of 3100 m/s and a shear-wave velocity of 2030 m/s were obtained. We also conducted reflection lines with a 250 MHz GPR system. The permafrost is nicely imaged and its time and depth assessed by burying a length of rebar on top of it and resurveying. The radar velocity of the overlying silt is about 0.11 m/ns. Introduction The Haughton structure on Devon Island, Nunavut at 75°22’N longitude and 89°41’W latitude, is a 24 km diameter, 23 Ma old impact crater in the high Canadian Arctic (Osinski et al., 2001). Host rocks are gently dipping (to the west) Ordovician and Silurian carbonate sediments mostly of the Allen Bay formation (Scott and Hajnal, 1988). The northwest corner of the outer middle rim hosts the base camp for the Haughton Mars Project (Long, 1999; Lee, 2002). Surveying conditions can be severe due to the high winds of the polar area (up to 70 km/hr during this field survey), low summer temperatures (5°C to +5°C), sleet, rain, and snow– even though this is characterized as a desert (Cockell et al. 2001), and significant ultraviolet radiation (Cockell et al., 2002).

We dug several test pits near the base camp to investigate the composition of the near surface. We found a tan-coloured, saturated clay with small clasts down to depths of about 45 – 65 cm. We then encountered solid and uniform permafrost with the appearance of frozen silt. We note that the soil smelled strongly of hydrocarbons. We used an EG&G Startview 60-channel seismic recorder with omni-geophones (used in a vertical and horizontal configuration). A small sledgehammer was employed as a source. We employed receiver intervals of 10 cm and 1 m at the “Von Braun Valley” near the base camp and 2 m in the “Gemini Hills” several kilometers from the base camp toward the crater centre. We also conducted ground – penetrating radar (GPR) surveys at both sites. Seismic Surveying A number of seismic experiments were recorded at two different locations on Devon Island. We describe the acquisition of all lines, but only the small spread in the Von Braun Valley will be analyzed (Fig. 1). Table 1 summarizes the seismic tests on Devon Island.
Fig 1. Vertical receivers deployed in the “Von Braun Valley”, near the HMP base camp with student R. Birch checking the seismic recorder.
We excavated several pits near the camp and on the seismic lines. We found that the contact between the permafrost and the saturated clay layer is at about 60 cm deep (Fig. 2).

Fig 2. Depth to the permafrost layer is approximately 60 cm in the Von Braun Valley. The soil is mainly composed of silts with the presence of some clasts. Permafrost can be observed in the bottom of the hole.
Table 1. Survey description. A total of 9 different lines were recorded, obtaining a full set of orientations for both receivers and sources.
Location Line name
Receiver direction Hammer impact direction
Time sample rate
(usec)
Receiver spacing
(cm)
Source spacing
(cm) Von Braun
Valley VVS1 Vertical Vertical 31.25 10 10
Von Braun Valley VVS2 Transverse (1) Transverse hit away from camp
(2) Transverse hit towards camp 31.25 10 10
Von Braun Valley VVS3 Inline Vertical 31.25 10 10
Von Braun Valley VVS4 Inline (1) hit towards increasing channel number
(2) hit towards decreasing channel number 31.25 10 10
Von Braun Valley VVL1 Vertical Vertical (hard impact) 250.00 100 100
Von Braun Valley VVL2 Inline (1) Vertical hit
(2) Inline hit towards increasing channel number 250.00 100 100
Von Braun Valley VVL3 Vertical Vertical (source test) 250.00 100 100
Von Braun Valley VVL4 Vertical Vertical (soft impact) 250.00 100 100
Gemini Hills GG1 Vertical Vertical 500.00 100 100
Gemini Hills GG2 Transverse (1) Transverse hit towards east (2) Transverse hit away towards west 500.00 100 100

Von Braun Valley Seismic Source Tests The hammer source was tested using the long spread – receiver and source spacing of 100 cm. The experiment consisted in recording data with different intensity (amount of energy introduced by the hammer impact), different depth of impact (on top of the silt and later on the permafrost), and different devices (metal plate, rod) as outlined in Table 2. These tests were all recorded at the same location, shot point station 999.5 approximately. Table 2. Hammer impact tests description at SP 999.5 of the VVL3 seismic line. Vertical receivers and a vertical impact were used for this case.
Test # Depth of impact Vertical impact description
7001 Test pit Hammer impact
7003 Test pit Coring tool wacker into trigger geophone
7004 Test pit 6'' lift a wacker weight drop
7005 Test pit Hammer tap (on permafrost)
7006 Test pit On round plate (in pit)
7007 Test pit On toothed plate (in pit)
7008 Surface Wacker on surface (drop by itself)
7009 Surface Forceful wack into wacker
7010 Surface Round base plate
7011 Surface Toothed base plate
7012 Surface Hammer on hammer
7013 Surface Hammer on inverted hammer
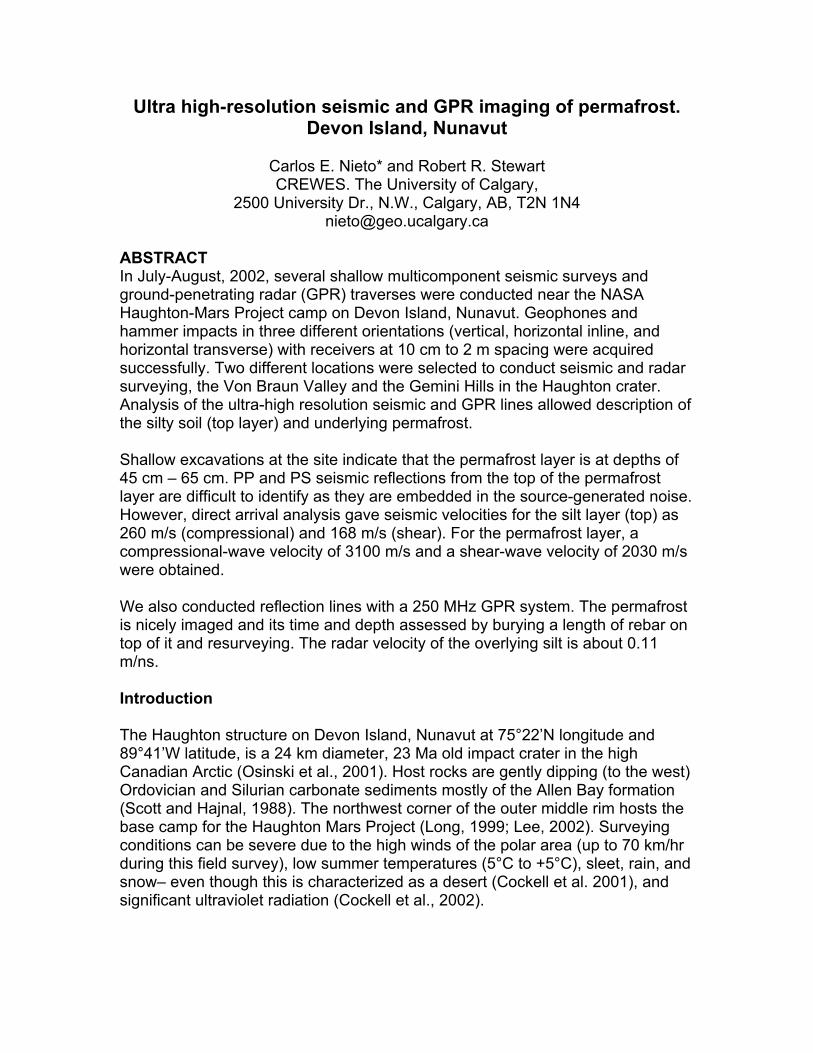
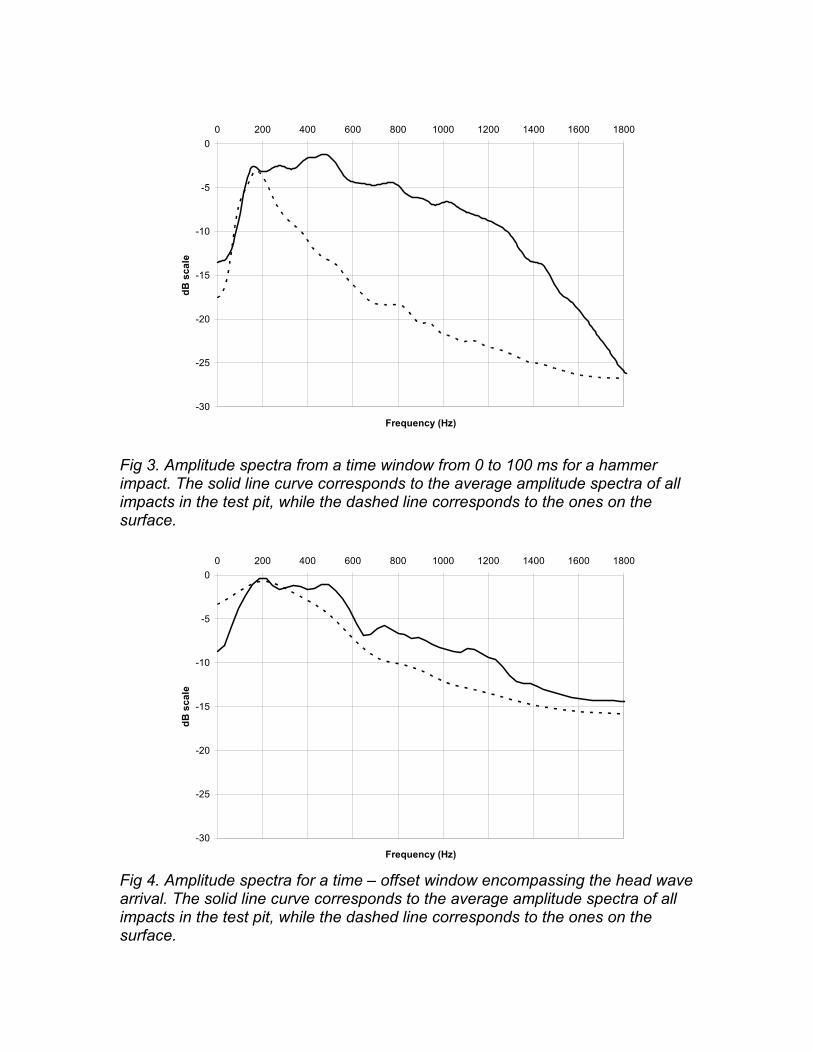
The presence of the unconsolidated top weathered layer introduces a number of unwanted seismic events like surface waves and guided waves. An additional related problem is the attenuation of high frequency components of the wavefield (Fig. 3). Amplitude spectra were calculated in two different windows on the shot gathers (Figs. 3 and 4). The first window includes all traces on the shot gather, from time 0 to 100 ms, (Fig. 3). The second window comprises the refracted events (Fig. 4). The amplitude spectrum on the first window gives a general description of the average frequency content since it includes all sorts of events: trapped modes, surface waves, head waves. In general, it shows that when the impact is directly in the permafrost more high frequency content is achieved than when the impact was on the surface (Fig. 3). The amplitude spectrum was also calculated in the first arrival (head wave) window (Fig. 4). There is some attenuation of the high frequency components of the head wave in the records.
-30
-25
-20
-15
-10
-5
00 200 400 600 800 1000 1200 1400 1600 1800
Frequency (Hz)
dB s
cale
Fig 3. Amplitude spectra from a time window from 0 to 100 ms for a hammer impact. The solid line curve corresponds to the average amplitude spectra of all impacts in the test pit, while the dashed line corresponds to the ones on the surface.
-30
-25
-20
-15
-10
-5
00 200 400 600 800 1000 1200 1400 1600 1800
Frequency (Hz)
dB s
cale
Fig 4. Amplitude spectra for a time – offset window encompassing the head wave arrival. The solid line curve corresponds to the average amplitude spectra of all impacts in the test pit, while the dashed line corresponds to the ones on the surface.
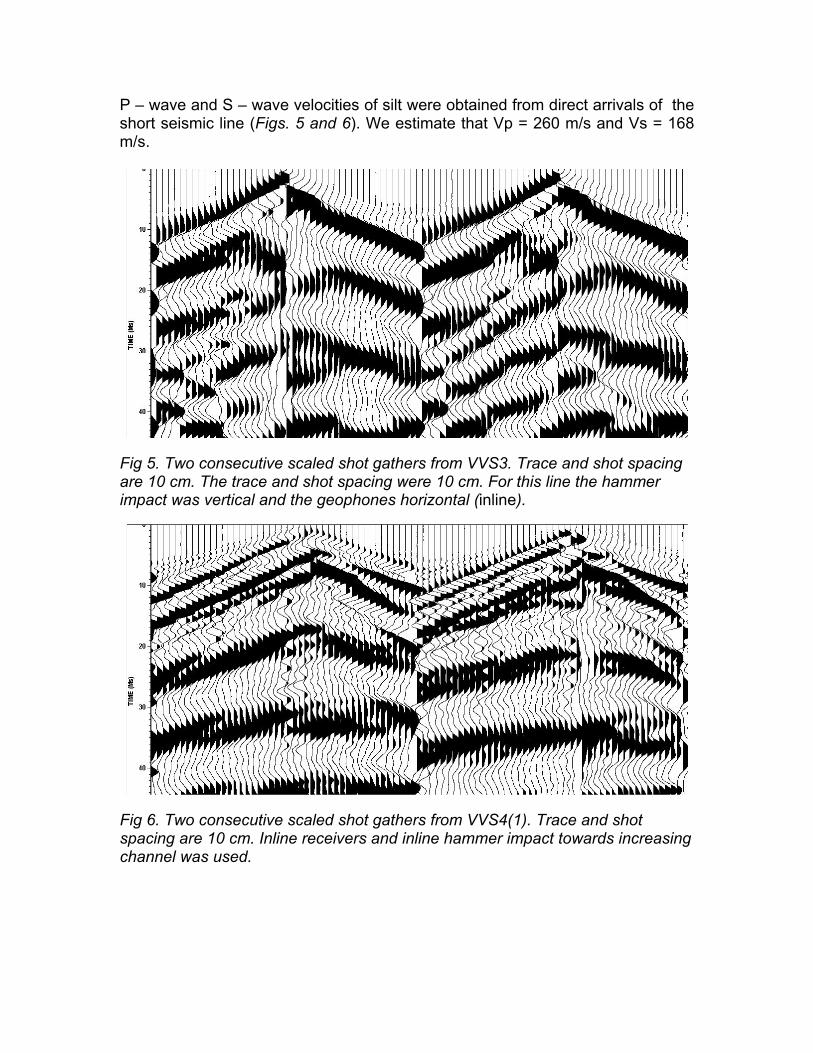
P – wave and S – wave velocities of silt were obtained from direct arrivals of the short seismic line (Figs. 5 and 6). We estimate that Vp = 260 m/s and Vs = 168 m/s.
Fig 5. Two consecutive scaled shot gathers from VVS3. Trace and shot spacing are 10 cm. The trace and shot spacing were 10 cm. For this line the hammer impact was vertical and the geophones horizontal (inline).
Fig 6. Two consecutive scaled shot gathers from VVS4(1). Trace and shot spacing are 10 cm. Inline receivers and inline hammer impact towards increasing channel was used.

Permafrost Seismic Imaging The main difficulty, with respect to imaging, observed in this dataset was the strong presence of low frequency (up to 200 Hz) surface waves. These waves were partially removed by means of a low – cut frequency filter. This type of filter was used also by Bachrach et al. (1998) where they managed to obtain reflections less than 1 m deep in unconsolidated sediments. Pullan et al. (1990) found success with shear wave reflection in the areas where the ground roll energy was quickly attenuated and did not interfere with reflection events. The method is optimal when the top layer is unconsolidated. The proximity of the high – velocity permafrost to the surface causes the offset for which the angle of incidence becomes critical to be very small – less than 5 cm (Fig. 7). At greater offsets, the reflected energy hyperbola becomes asymptotic to the direct arrival. At approximately the same velocity and offsets the presence of trapped modes masks the reflection from the permafrost. Another factor that has to be taken into account is that the very – near offset traces may be in the near field and non – elastic regime. These two factors, among others, make it difficult to observe the reflected arrival. Since the reflection is not easily observed, the refracted arrival is used to define the seismic image of the subsurface. The processing sequence was essentially the same for both lines: (1) geometry and edits, (2) gain, (3) deconvolution, (4) radial trace filter, (5) stacking. The velocity used to correct the linear moveout was: 3100 m/s for the P wave and 2030 m/s for the S wave. The resultant sections are shown in Fig. 8.
0.00
2.00
4.00
6.00
-5.00 -4.00 -3.00 -2.00 -1.00 0.00 1.00 2.00 3.00 4.00 5.00
Horizontal distance (m)
Tim
e (m
s)
Fig. 7. Theoretical arrival times for direct, refracted and reflected events from silt and permafrost respectively. The parameters of the model are: silt P wave velocity 260 m/s, silt S wave velocity 168 m/s, permafrost P wave velocity 3100 m/s, silt thickness 60 cm.
0 0
PP 10
PS
T 10
T i
i m
m e
e
20
20
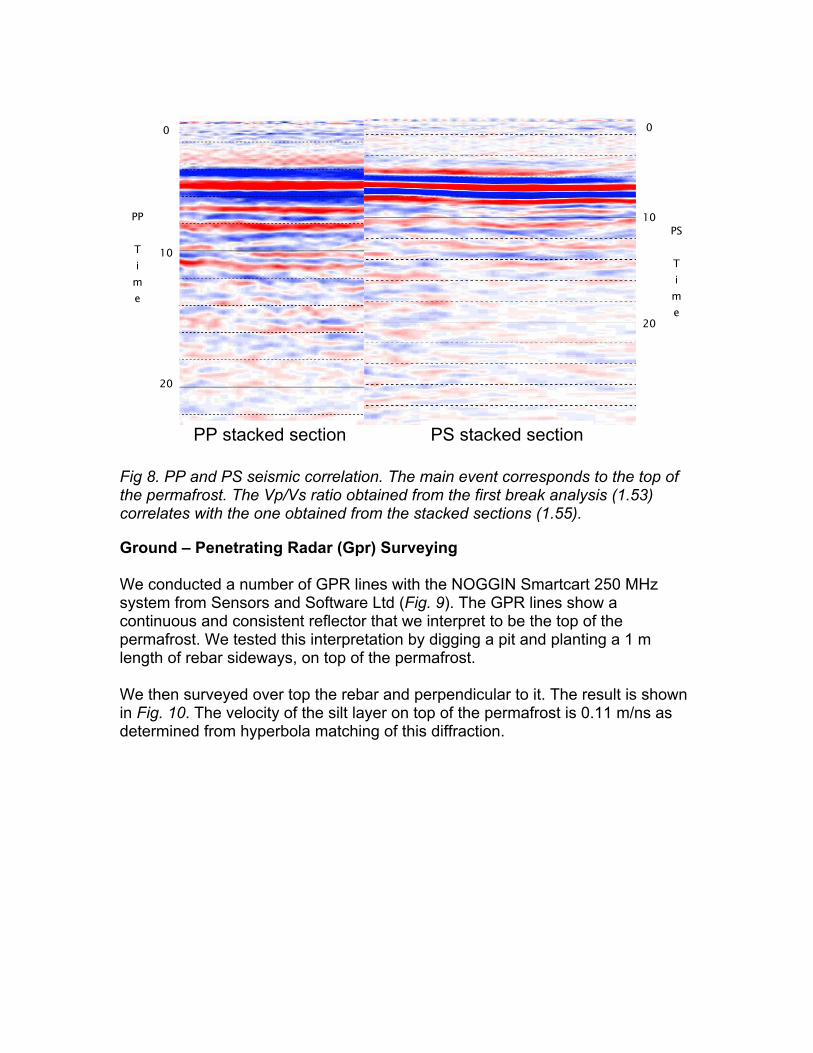
PP stacked section PS stacked section Fig 8. PP and PS seismic correlation. The main event corresponds to the top of the permafrost. The Vp/Vs ratio obtained from the first break analysis (1.53) correlates with the one obtained from the stacked sections (1.55).
Ground – Penetrating Radar (Gpr) Surveying We conducted a number of GPR lines with the NOGGIN Smartcart 250 MHz system from Sensors and Software Ltd (Fig. 9). The GPR lines show a continuous and consistent reflector that we interpret to be the top of the permafrost. We tested this interpretation by digging a pit and planting a 1 m length of rebar sideways, on top of the permafrost. We then surveyed over top the rebar and perpendicular to it. The result is shown in Fig. 10. The velocity of the silt layer on top of the permafrost is 0.11 m/ns as determined from hyperbola matching of this diffraction.

Fig 9. GPR system NOGGIN 250 MHz System being used at the Von Braun Valley site. R. Birch is shown testing a prototype space suit.
Rebar Top of
permafrost
Fig 10. GPR line from the NOGGIN 250 MHz System in the Von Braun Valley. The line transverses a 1 m section of rebar emplaced on the top of the permafrost.

Conclusions A preliminary display of seismic lines recorded in the Von Braun Valley, Devon Island, Nunavut, is shown. Both compressional and pure shear motion direct arrivals are identified on their respective lines.
Compressional – wave motion gives a velocity of 260 m/s in the silty overburden layer. Shear – wave motion indicates a slower velocity of 168 m/s in the same layer. A velocity of 3100 m/s for the permafrost was obtained for a pure compressional head wave. An average velocity of 2030 m/s was obtained for a pure shear head wave.
Much higher frequencies were recorded when the hammer source tapped the permafrost directly. Stacking the linear moveout refracted events from the top of the permafrost allowed the definition of PP and PS seismic sections.
GPR surveys provide a clear indication of the top of the permafrost. The silt layer had a velocity of 0.11 m/ns. Both seismic and radar methods are useful in imaging the permafrost.
Acknowledgements We express our appreciation to NASA Haughton-Mars Project in particular its manager Dr. Pascal Lee. Many thanks to Robert Birch who ably assisted with the field work, and Eric Gallant and Henry Bland of the CREWES Project at the University of Calgary who provided logistical support. Thanks to Dr. Krebes and Dr. Henley at the University of Calgary for the discussions on the ultra-high resolution survey analysis. References Bachrach, R., Dvorkin, J. and Nur, A., 1998, High-resolution shallow-seismic experiments in sand, Part II: Velocities in shallow unconsolidated sand: Geophysics, Soc. of Expl. Geophys., 63, 1234-1240. Pullan, S. E., Hunter, J. A. and Neave, K. G., 1990, Shallow shear wave reflection tests, 60th Ann. Internat. Mtg: Soc. of Expl. Geophys., 380-382.


