ULTRA-HIGH PERFORMANCE CONCRETE (UHPC) COLUMNS
119
STRUCTURAL RESPONSE AND BUCKLING BEHAVIOR OF SLENDER ULTRA-HIGH PERFORMANCE CONCRETE (UHPC) COLUMNS Final report submitted to: ACI Foundation Concrete Research Council (CRC) by: Mahmoud Aboukifa Mohamed A. Moustafa University of Nevada, Reno Department of Civil and Environmental Engineering May 2021
Transcript of ULTRA-HIGH PERFORMANCE CONCRETE (UHPC) COLUMNS
STRUCTURAL RESPONSE AND BUCKLING BEHAVIOR OF SLENDER
ULTRA-HIGH PERFORMANCE CONCRETE (UHPC) COLUMNS
Final report submitted to:
ACI Foundation Concrete Research Council (CRC)
by:
Mahmoud Aboukifa
Mohamed A. Moustafa
University of Nevada, Reno
Department of Civil and Environmental Engineering
May 2021
i
ABSTRACT
Ultra-high performance concrete (UHPC) is considered to be a relatively new generation of
cementitious materials with multiple times higher strength and durability than conventional
concretes. The global market size of UHPC is increasing exponentially and is expected to reach
USD 1.9 billion by 2025 due to the increasing demand from the construction industry. The use of
UHPC is currently expanding worldwide from bridge deck joints and connections to full
components and larger applications. With the superior mechanical properties and durability of
UHPC, one potential application is the use of UHPC columns in buildings and bridges to reduce
the members’ cross-sections and footprint or increase resiliency against extreme events. Thus, the
main goal of this research study is to provide experimental demonstration and reliable datasets of
UHPC columns to validate current ACI 318 analysis and design procedures and inform future
designs. This was achieved through a large experimental testing campaign of nine full-scale UHPC
columns. In fact, this study provides results from the largest axially tested UHPC columns to-date
anywhere in the world, where a 4000-kip testing machine at the University of California Berkeley
was used.
Due to the UHPC high compressive strength, more slender columns are expected for same
applications relative to conventional reinforced concrete (~40% decrease in cross-sections can be
achieved based on previous research by the authors). Thus, the first objective of this study is
concerned with exploring the experimental behavior of slender UHPC columns under concentric
axial loading and evaluate current ACI procedure for including slenderness effects and applying
the moment magnification method used to quantify the 2nd order moments resulting from column
buckling. The second objective of this study is to analyze the experimental behavior of slender
UHPC columns of minimal or negligible slenderness effects but with varying reinforcement details
(i.e. different longitudinal, transverse, and fiber reinforcement ratios) under concentric axial
loading, and to inspect the validity of the ACI 318 equations for estimating the UHPC columns
axial strength. According to the conducted assessment and evaluation, the study provides design
guidance and recommendations for the UHPC columns to be incorporated into future design codes.
For an overview of the key findings of this study, the results indicated that using the actual
material properties of UHPC and longitudinal bars for ACI 318 equations will overestimate the
axial load capacity of columns with different reinforcement details by approximately 13% on

ii
average. However, using nominal values will still lead to a factor of safety of about 2.1. The study
also recommended a slenderness lower limit to include 2nd order effects of 23.5 or 32 for braced
UHPC columns based on the ACI 318 criteria of 5% reduction in column axial strength or the
Eurocode 2 criteria of 10% reduction in column axial strength, respectively. Furthermore, a new
strength reduction factor of 0.75 is suggested (instead of 0.85) for estimating axial capacity of
UHPC columns with slenderness limit less than 30.
iii
ACKNOWLEDGEMENT
This report presents the research activities and results sponsored by the Concrete Research Council
(CRC) of the American Concrete Institute (ACI) Foundation through a 2019 research grant. The
donation of the ultra-high performance concrete (UHPC) used in this study by LafargeHolcim
(Ductal) is greatly appreciated. The authors thank ACI Committee 239 on UHPC for the feedback
throughout the course of this study. The conclusions presented herein are those of the writers and
do not necessarily represent the views of the sponsor or ACI 239.
iv
TABLE OF CONTENTS
Abstract ............................................................................................................................................ i
Acknowledgement ......................................................................................................................... iii
Table of Contents ........................................................................................................................... iv
List of Tables ................................................................................................................................. vi
List of Figures ............................................................................................................................... vii
Introduction ............................................................................................................................. 1
1.1 Overview .......................................................................................................................... 1
1.2 Literature Review ............................................................................................................. 5
Short UHPC columns ................................................................................................ 5
Slender UHPC columns ............................................................................................ 7
1.3 Objectives ......................................................................................................................... 9
1.4 Report Outline ................................................................................................................ 10
Experimental Program Development .................................................................................... 11
2.1 Introduction .................................................................................................................... 11
2.2 Specimens Design and construction ............................................................................... 11
2.3 Material Properties ......................................................................................................... 16
Ultra-High Performance Concrete .......................................................................... 17
Reinforcing steel bars ............................................................................................. 20
2.4 Test Setup and Loading Protocol ................................................................................... 21
2.5 Instrumentation Plan ...................................................................................................... 24
Evaluation of experimental results ........................................................................................ 26
3.1 Introduction .................................................................................................................... 26
3.2 Damage Patterns ............................................................................................................. 26
3.3 Axial Load-strain Relationship ...................................................................................... 33
General .................................................................................................................... 33
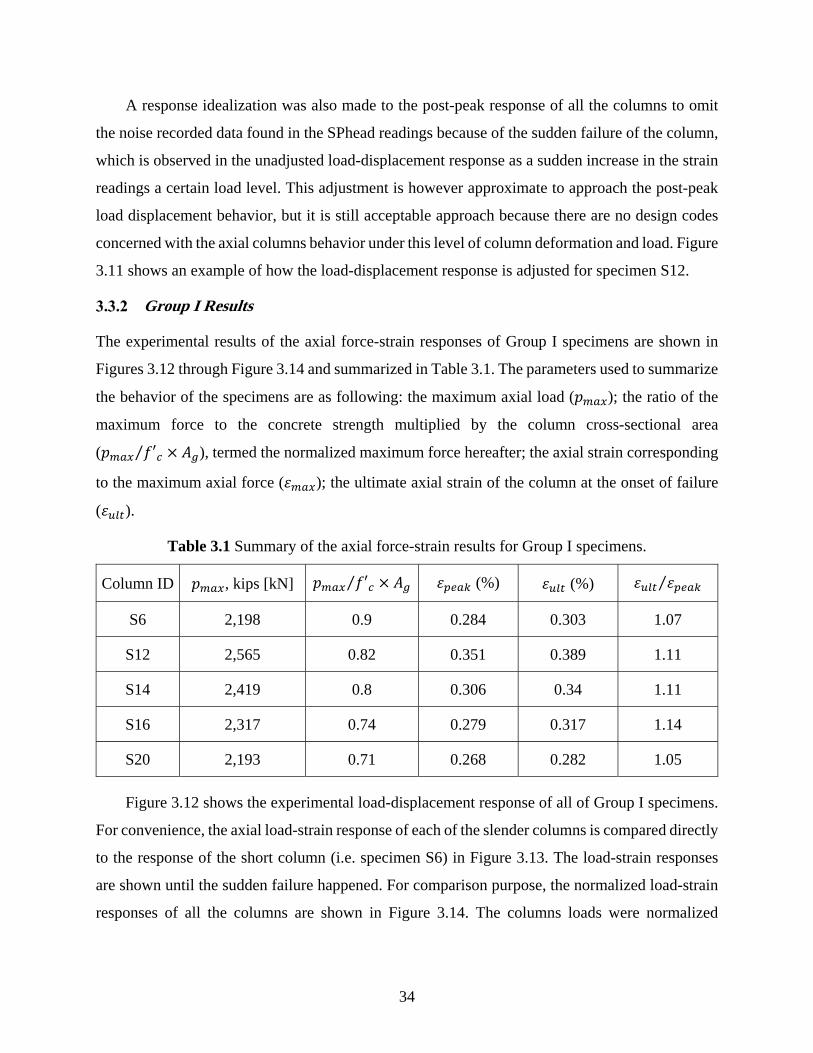
Group I Results ....................................................................................................... 34
Group II Results ...................................................................................................... 38
3.4 Axial Stiffness and Modulus of Elasticity ...................................................................... 42
3.5 Lateral-displacement and 2nd-order Bending Moment ................................................... 45
3.6 Steel Reinforcement Strains ........................................................................................... 52
Group I Results ....................................................................................................... 52

v
Group II Results ...................................................................................................... 57
Relevant ACI procedure assessment ..................................................................................... 62
4.1 Introduction .................................................................................................................... 62
4.2 ACI 318 Assessment for Group I Columns ................................................................... 62
Columns Effective Length Factor ........................................................................... 62
Proposed Effective Flexural Stiffness ..................................................................... 66
Interaction (P-M) Diagrams .................................................................................... 68
Evaluation of Moment Magnification Method ....................................................... 72
Proposed Slenderness Lower Limit ........................................................................ 74
4.3 ACI 318 Assessment for Group II Columns .................................................................. 75
Summary and Conclusions ................................................................................................... 77
5.1 Summary ........................................................................................................................ 77
5.2 Conclusions .................................................................................................................... 77
5.3 Recommendations for Design Codes ............................................................................. 79
References ..................................................................................................................................... 80
Appendix A: Construction bidding document and drawings ........................................................ 83
Appendix B: Construction Photos and test setup .......................................................................... 92
Appendix C: Additional Photos for tested columns ................................................................... 100
vi
LIST OF TABLES
Table 2.1 UHPC columns Group I test matrix. ............................................................................. 13
Table 2.2 UHPC columns Group II test matrix. ........................................................................... 13
Table 2.3 UHPC mixture by Ductal® (based on number of premix bags). .................................. 17
Table 2.4 UHPC mixture by Ductal®. .......................................................................................... 17
Table 2.5 Measured UHPC compressive strength of Group I columns. ....................................... 19
Table 2.6 Measured UHPC compressive strength of Group II columns. ..................................... 19
Table 2.7 Measured Mechanical Properties for Longitudinal Reinforcing bars. .......................... 20
Table 3.1 Summary of the axial force-strain results for Group I specimens. ............................... 34
Table 3.2 Summary of the axial force-strain results for Group II specimens. .............................. 41
Table 3.3 Axial stiffness and modulus of elasticity results for Group I columns. ........................ 44
Table 3.4 Axial stiffness and modulus of elasticity results for Group II columns. ...................... 44
Table 3.5 Summary of the peak and ultimate lateral displacements for Group I columns. .......... 48
Table 3.6 Summary of the peak and ultimate lateral displacements for Group II columns. ........ 51
Table 3.7 Summary of longitudinal reinforcement strains for Group I columns. ......................... 56
Table 3.8 Summary of transverse reinforcement strains for Group I columns. ............................ 56
Table 3.9 Summary of longitudinal reinforcement strains for Group II columns. ....................... 59
Table 3.10 Summary of transverse reinforcement strains for Group II columns. ........................ 60
Table 4.1 Summary of the k factor results of Specimens S14 and S20. ....................................... 65
Table 4.2 Group I slenderness ratio calculations and relation to ACI limit. ................................ 65
Table 4.3 Comparison of the effective flexural stiffness (EI)eff values. ........................................ 68
Table 4.4 Summary of axial load strength determined at the maximum 2nd order moment demand
from different P-M cases. ............................................................................................................. 70
Table 4.5 Summary of the maximum axial load strength determined at zero 2nd order moment
demand from different P-M cases. ................................................................................................ 70
Table 4.6 Comparison between the moment magnification method results and the test results. . 73
Table 4.7 Comparison of the axial strength test results to the calculated ACI axial strength. ..... 76
Table 4.8 Comparison of the axial strength test results to ACI axial strength after adjustment. . 76
vii
LIST OF FIGURES
Figure 1.1 UHPC prestressed I-girder bridge in Wapello county, Iowa. Source: FHWA. ............. 2
Figure 1.2 Longitudinal field-cast UPC connections between deck-bulb-tee-girders on the Route
31 Bridge in Lyons, NY. Source: New York State Department of Transportation. ....................... 2
Figure 1.3 Placement of UHPC overlay on the Laporte Road bridge over Mud Creek in Brandon,
IA. (Source: Haber et al. 2017). ...................................................................................................... 3
Figure 2.1 Reinforcement details of a typical UHPC column [dimensions in mm]. .................... 14
Figure 2.2 Formwork for nine columns at UNR construction yard . ............................................ 14
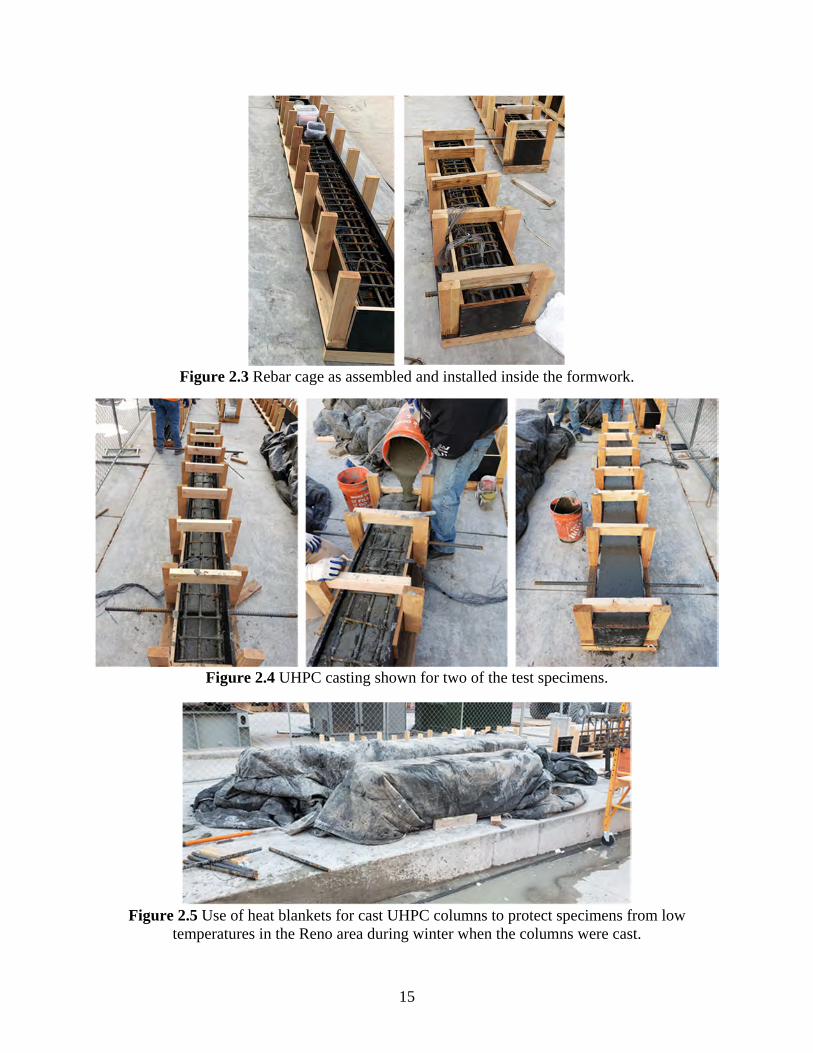
Figure 2.3 Rebar cage as assembled and installed inside the formwork. ..................................... 15
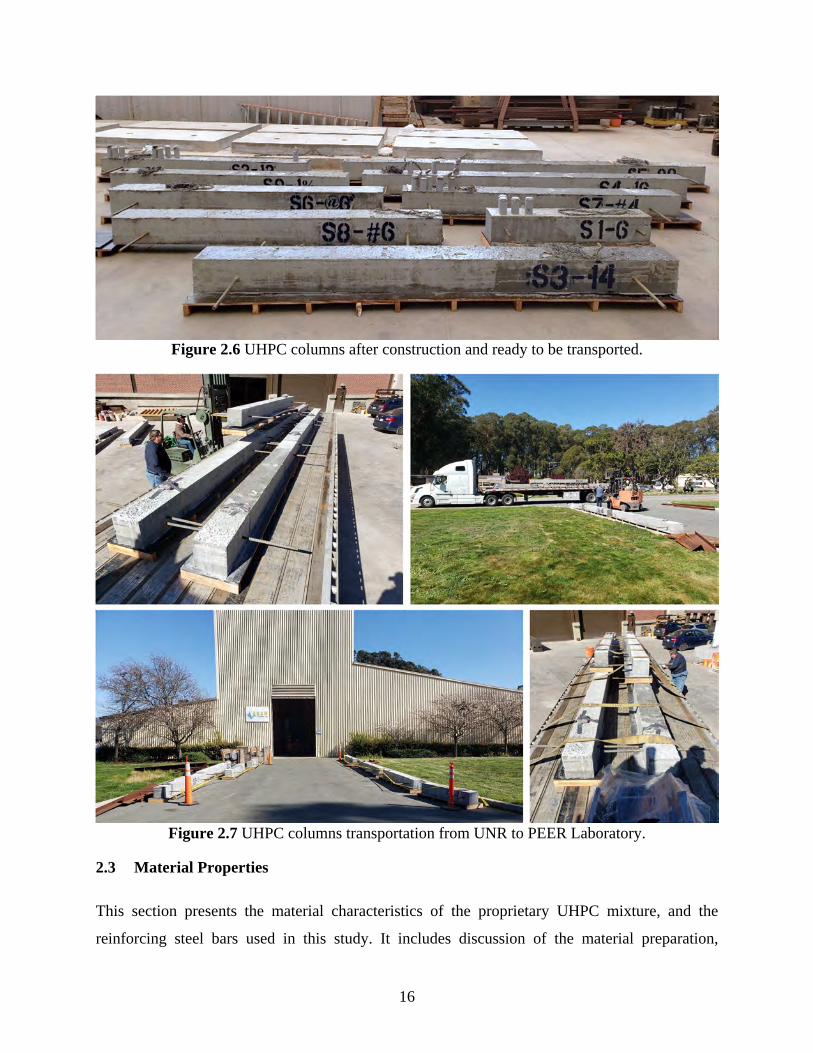
Figure 2.4 UHPC casting shown for two of the test specimens.................................................... 15
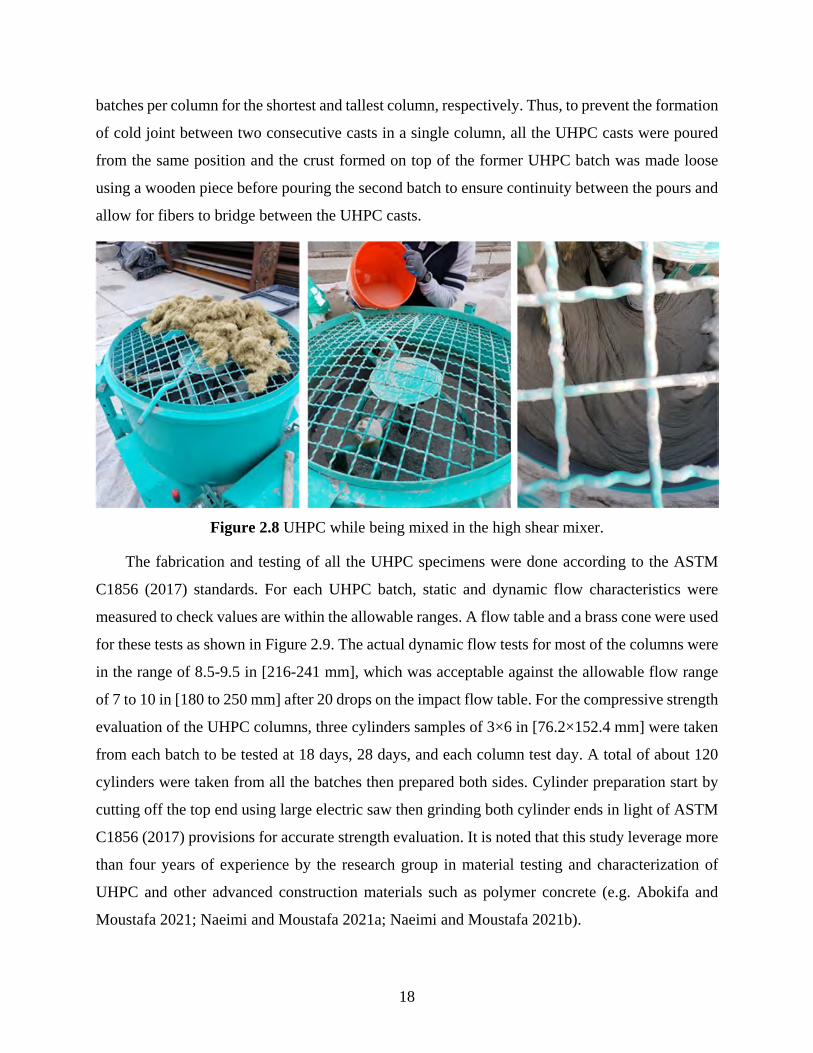
Figure 2.5 Use of heat blankets for cast UHPC columns to protect specimens from low
temperatures in the Reno area during winter when the columns were cast. ................................. 15
Figure 2.6 UHPC columns after construction and ready to be transported. ................................. 16
Figure 2.7 UHPC columns transportation from UNR to PEER Laboratory. ................................ 16
Figure 2.8 UHPC while being mixed in the high shear mixer. ..................................................... 18
Figure 2.9 UHPC flow testing. ..................................................................................................... 19
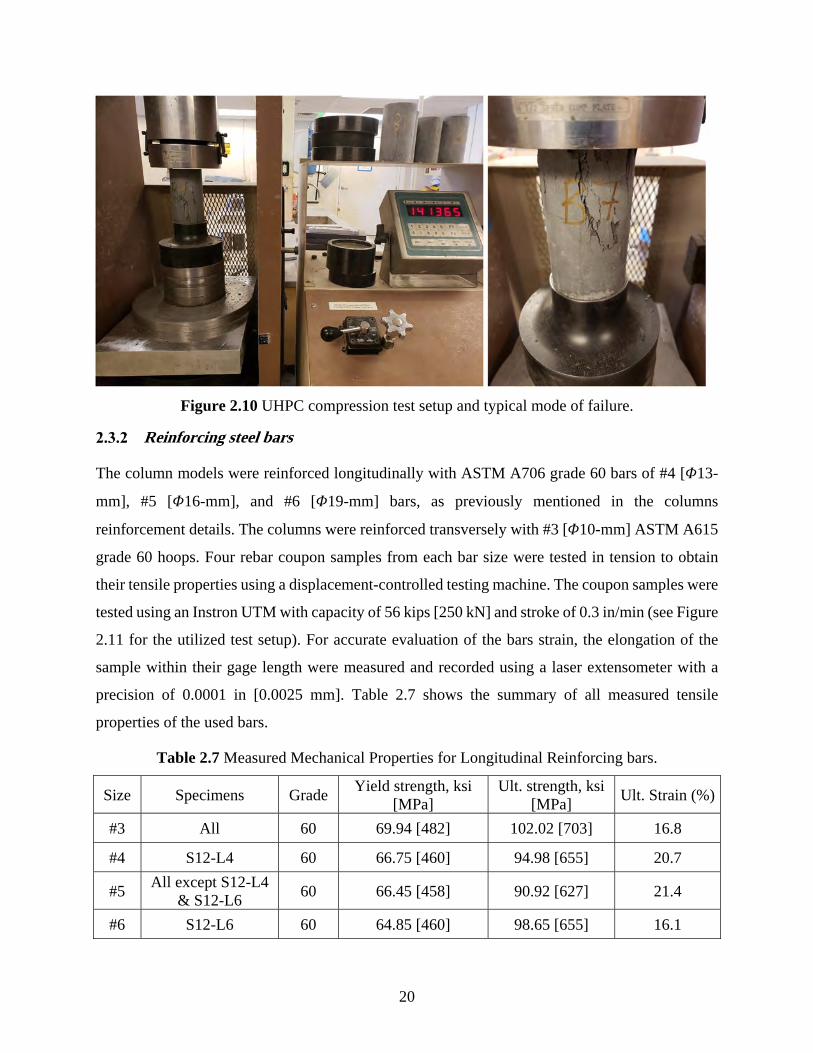
Figure 2.10 UHPC compression test setup and typical mode of failure. ...................................... 20
Figure 2.11 Direct tension test setup for rebar samples. ............................................................... 21
Figure 2.12 Typical full-scale UHPC column test setup at PEER Laboratory. ............................ 22
Figure 2.13 The 4,000 kip [17,793 kN] loading frame at UC Berkeley PEER Laboratory. ........ 22
Figure 2.14 Test setup column head steel fixture used at both column ends. ............................... 23
Figure 2.15 Typical column displacement instrumentation setup. ............................................... 24
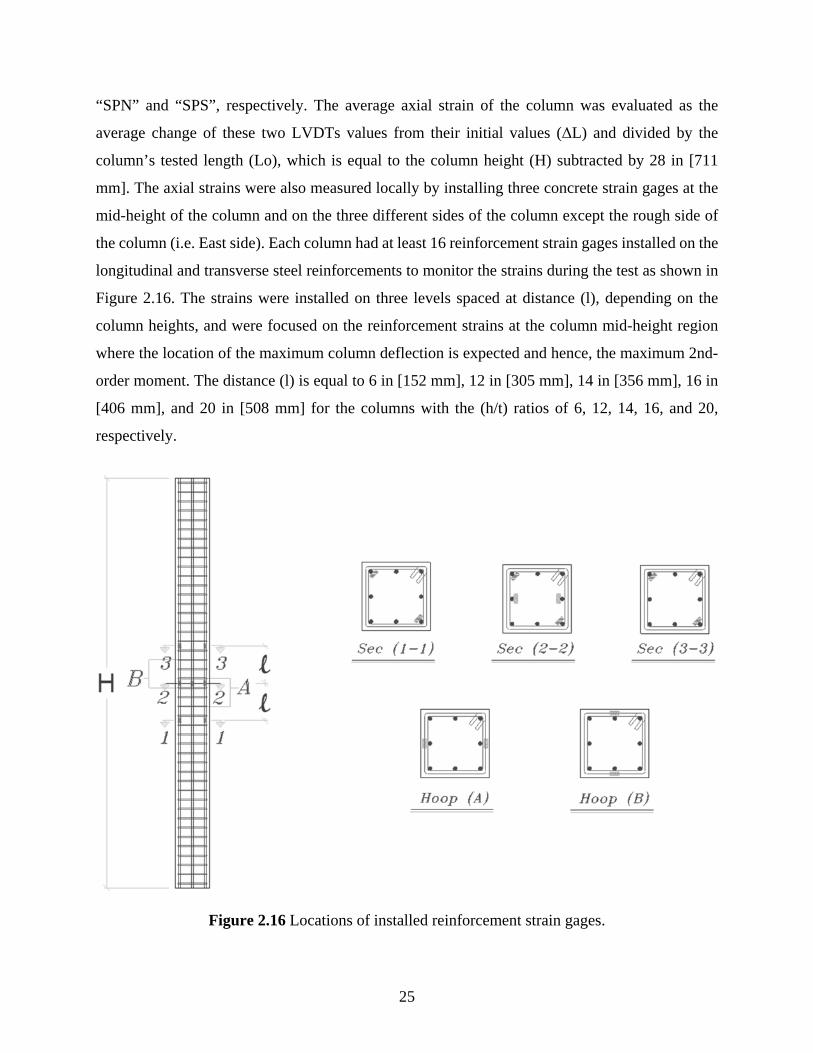
Figure 2.16 Locations of installed reinforcement strain gages. .................................................... 25
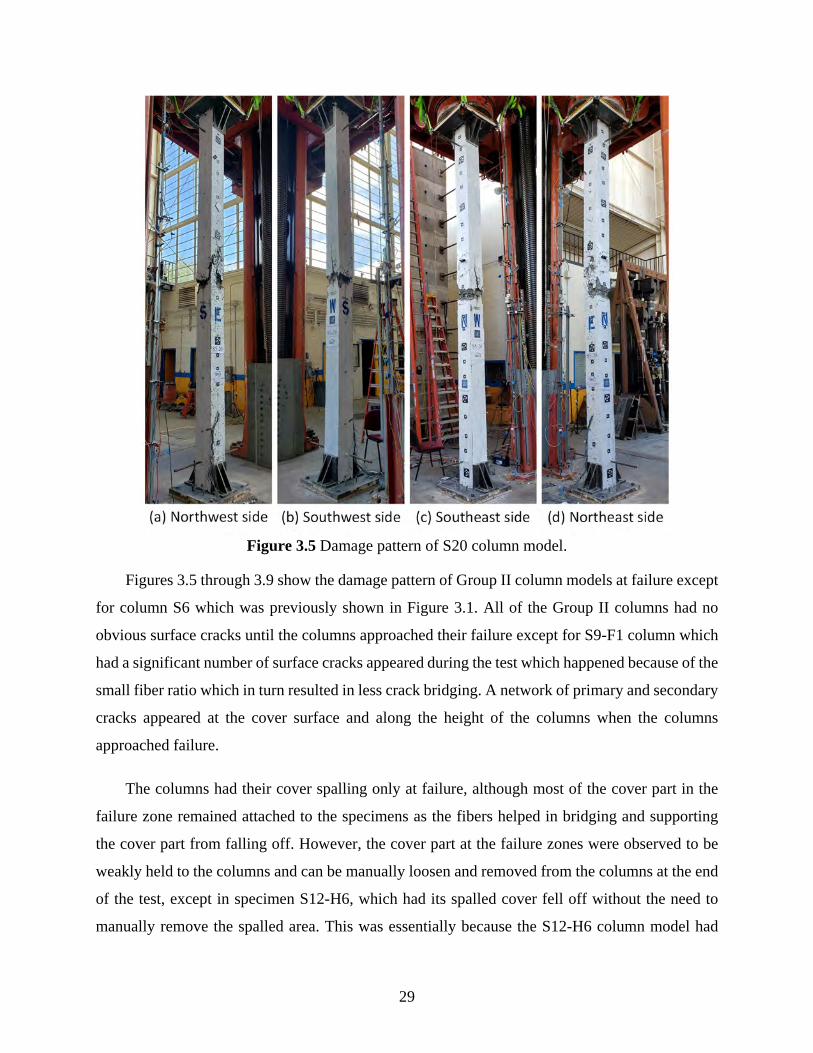
Figure 3.1 Damage pattern of S6 column model. ......................................................................... 27
Figure 3.2 Damage pattern of S12 column model. ....................................................................... 27
Figure 3.3 Damage pattern of S14 column model. ....................................................................... 28
Figure 3.4 Damage pattern of S16 column model. ....................................................................... 28
Figure 3.5 Damage pattern of S20 column model. ....................................................................... 29
viii
Figure 3.6 Damage pattern of S12-H6 column model. ................................................................. 30
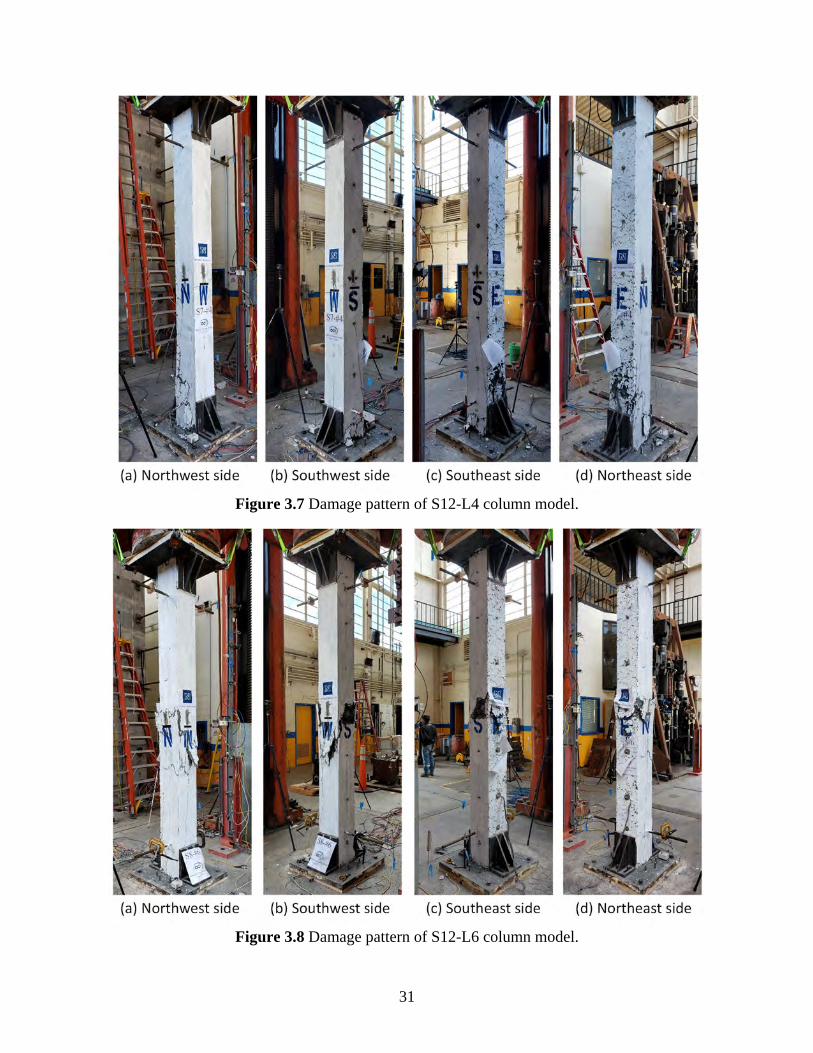
Figure 3.7 Damage pattern of S12-L4 column model. ................................................................. 31
Figure 3.8 Damage pattern of S12-L6 column model. ................................................................. 31
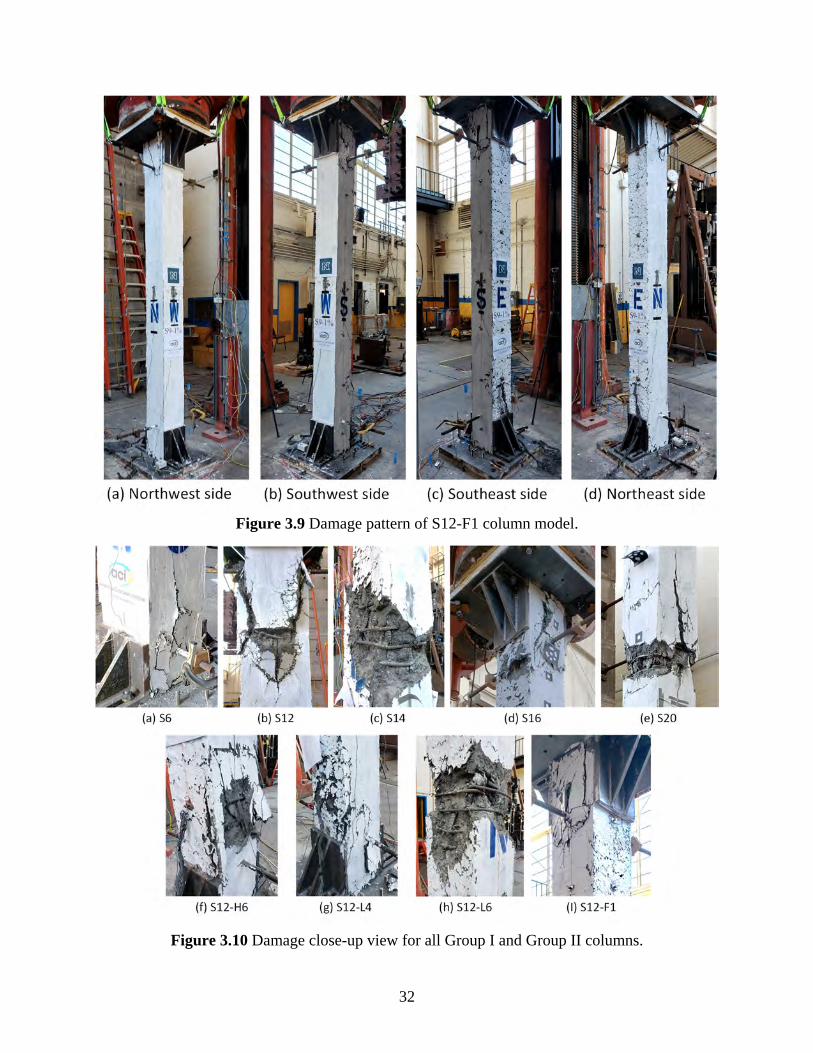
Figure 3.9 Damage pattern of S12-F1 column model. .................................................................. 32
Figure 3.10 Damage close-up view for all Group I and Group II columns. ................................. 32
Figure 3.11 Example for axial force-displacement measured response adjustment and
idealization (based on specimen S12). .......................................................................................... 33
Figure 3.12 Axial force-displacement responses for Group I columns. ....................................... 35
Figure 3.13 Axial force-strain responses for Group I slender columns S12, S14, S16, and S20 as
compared to that of S6 for reference. ............................................................................................ 36
Figure 3.14 Normalized axial force-strain responses for Group I columns. ................................. 36
Figure 3.15 Axial force-displacement responses for Group II columns. ...................................... 39
Figure 3.16 Axial force-strain responses for Group II columns with varying reinforcement details
as compared to control specimen S12. .......................................................................................... 40
Figure 3.17 Normalized axial force-strain responses for Group II columns. ............................... 40
Figure 3.18 In-plane buckling profiles for Group I columns. ....................................................... 46
Figure 3.19 Out-of-plane buckling profiles for Group I columns. ............................................... 47
Figure 3.20 Axial load versus maximum lateral displacement for Group I columns. .................. 48
Figure 3.21 Comparison of the lateral displacements for Group I columns. ................................ 48
Figure 3.22 Dominant buckling profiles for Group II columns. ................................................... 51
Figure 3.23 Comparison of the lateral displacements for Group II columns. ............................... 52
Figure 3.24 Measured reinforcement strains for specimen S6. .................................................... 53
Figure 3.25 Measured reinforcement strains for specimen S12. .................................................. 53
Figure 3.26 Measured reinforcement strains for specimen S14. .................................................. 54
Figure 3.27 Measured reinforcement strains for specimen S16. .................................................. 54
Figure 3.28 Measured reinforcement strains for specimen S20. .................................................. 55
Figure 3.29 Comparison of longitudinal reinforcement strains for Group I. ................................ 55
Figure 3.30 Measured reinforcement strains for specimen S12-H6. ............................................ 57

ix
Figure 3.31 Measured reinforcement strains for specimen S12-L4. ............................................. 58
Figure 3.32 Measured reinforcement strains for specimen S12-L6. ............................................. 58
Figure 3.33 Measured reinforcement strains for specimen S12-F1. ............................................. 59
Figure 3.34 Comparison of longitudinal reinforcement strains for Group II. .............................. 59
Figure 4.1 Sinusoidal curve fitting for lateral deflection test data of Specimen S14 ................... 64
Figure 4.2 Sinusoidal curve fitting for lateral deflection test data of Specimen S20. .................. 65
Figure 4.3 P-M diagrams of Group I columns. ............................................................................. 69
Figure 4.4 Effect of slenderness ratio on the ACI code estimation of the axial load strength
determined at the maximum 2nd order moment demand. .............................................................. 70
Figure 4.5 Effect of slenderness ratio on the ACI code estimation of the maximum axial load
strength determined at zero 2nd order moment demand. ............................................................... 71
Figure 4.6 Effect of slenderness ratio on the axial strength of UHPC columns. .......................... 74
Figure 4.7 Comparison of the axial strength test results to the calculated ACI axial strength. .... 76
Figure B.1 Strain gaging of the reinforcement. ............................................................................ 92
Figure B.2 Formwork for nine columns at UNR Structures Laboratory construction yard ......... 92
Figure B.3 Columns reinforcement cages placed in the formwork. ............................................. 92
Figure B.4 Components of UHPC mix; (a) Premix dry constituents bag, (b) Superplasticizers,
and (c) Steel fibers. ....................................................................................................................... 93
Figure B.5 UHPC while being mixed in the high shear mixer. .................................................... 93
Figure B.6 UHPC flow testing. .................................................................................................... 93
Figure B.7 Casting of the UHPC into the forms. .......................................................................... 94
Figure B.8 Use of heat blankets for cast UHPC columns to protect specimens from low
temperatures in the Reno area. ...................................................................................................... 94
Figure B.9 UHPC columns after construction and ready to be transported................................. 94
Figure B.10 UHPC columns transportation from UC Berkeley Richmond Field Station Lab. .... 95
Figure B.11 PEER UC Berkeley 4000-kip loading machine. ....................................................... 95
Figure B.12 PEER UC Berkeley 4000-kip control room. ............................................................ 96
Figure B.13 Placing of the lower plate and hydro-stoning underneath it for leveling. ................. 96
x
Figure B.14 (a) Aligning the upper and lower plates together, (b) holding the upper plate in place
while lowering the machine head, (c) hydro-stoning above the upper plate it for leveling, (d)
holding the upper plate to the loading machine with straps. ......................................................... 97
Figure B.15 Grinding of the extra parts at the column ends to make the columns stand leveled. 98
Figure B.16 Putting a roller underneath the column and driving it inside the lab. ....................... 98
Figure B.17 (a) holding the column in a vertical direction using the crane, (b) driving the column
underneath the machine using a forklift, (c) attaching the two end fixtures and tightening them.99
Figure B.18 Final test setup of the column. .................................................................................. 99
Figure C.1 Final damage state of column S6. ............................................................................. 100
Figure C.2 Final damage state of column S12. ........................................................................... 101
Figure C.3 Final damage state of column S14. ........................................................................... 102
Figure C.4 Final damage state of column S16. ........................................................................... 103
Figure C.5 Final damage state of column S20. ........................................................................... 104
Figure C.6 Final damage state of column S12-H6. ..................................................................... 105
Figure C.7 Final damage state of column S12-L4. ..................................................................... 106
Figure C.8 Final damage state of column S12-L6. ..................................................................... 107
Figure C.9 Final damage state of column S12-F1. ..................................................................... 108
1
INTRODUCTION
1.1 Overview
The need for durable, robust, lightweight and long-lasting structures that may last functionally for
more than 100 years have motivated research in academia to find new innovative materials with
enhanced mechanical and durability properties. Many research efforts have been done towards the
advancement of the cementitious materials over the past two decades which have led to
development of a new class of market-ready materials with multiple times higher strength and
durability than conventional concretes. This widely emerging technology, known as ultra-high
performance concrete (UHPC), is a relatively new generation of cementitious composite materials
that consists of optimized gradation of granular constituents, low water/cement ratio less than 0.25,
and a high percentage of discontinuous internal fiber reinforcement (typically 2% by volume). The
unique mix contributes to the advanced material and mechanical characteristics. UHPC is a robust,
ductile and durable building material that exhibits superior mechanical properties such as
compressive strength greater than 22 ksi (i.e. up to six times or so of conventional concrete) and a
sustained post-cracking tensile strength greater than 0.7 ksi (i.e. up to at least three times that of
conventional concrete). All of these superior features of UHPC have made it a desirable candidate
in the construction industry despite of its high initial material costs. The reader is referred to several
previous studies for more details on various UHPC mechanical properties (e.g. Graybeal 2006;
Graybeal 2007; Graybeal and Tanesi 2007; Burkart and Muller 2008; Graybeal and Baby 2013,
among others)
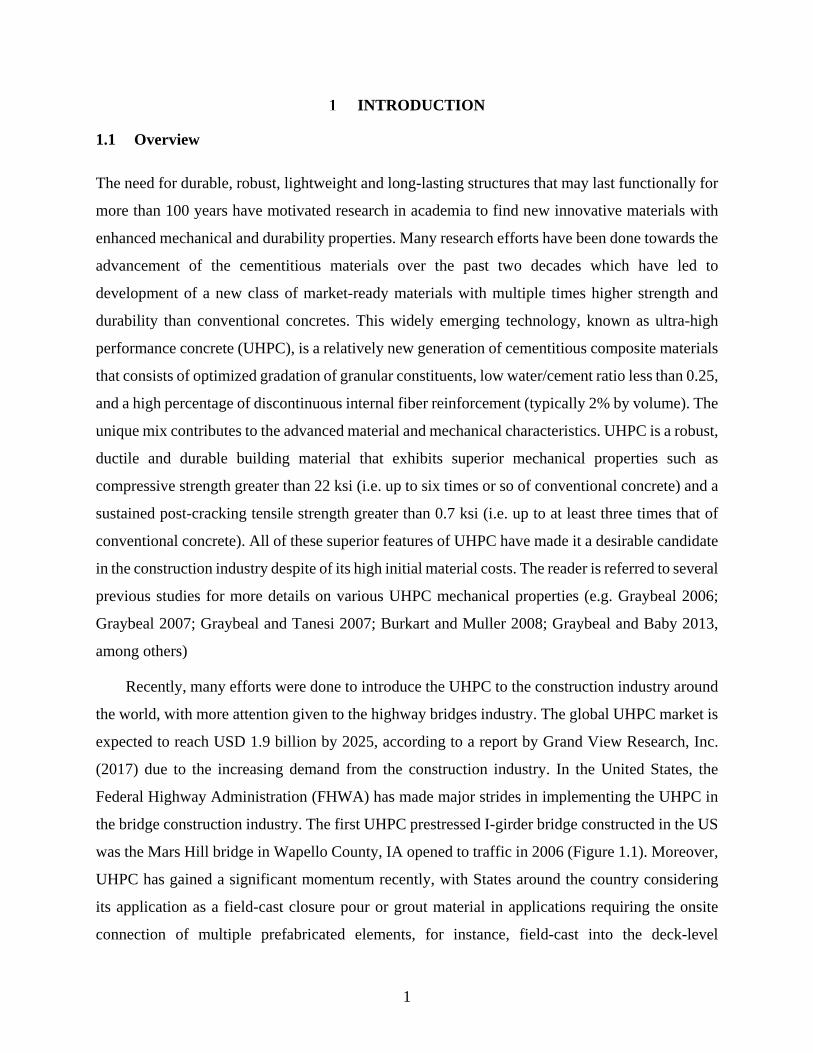
Recently, many efforts were done to introduce the UHPC to the construction industry around
the world, with more attention given to the highway bridges industry. The global UHPC market is
expected to reach USD 1.9 billion by 2025, according to a report by Grand View Research, Inc.
(2017) due to the increasing demand from the construction industry. In the United States, the
Federal Highway Administration (FHWA) has made major strides in implementing the UHPC in
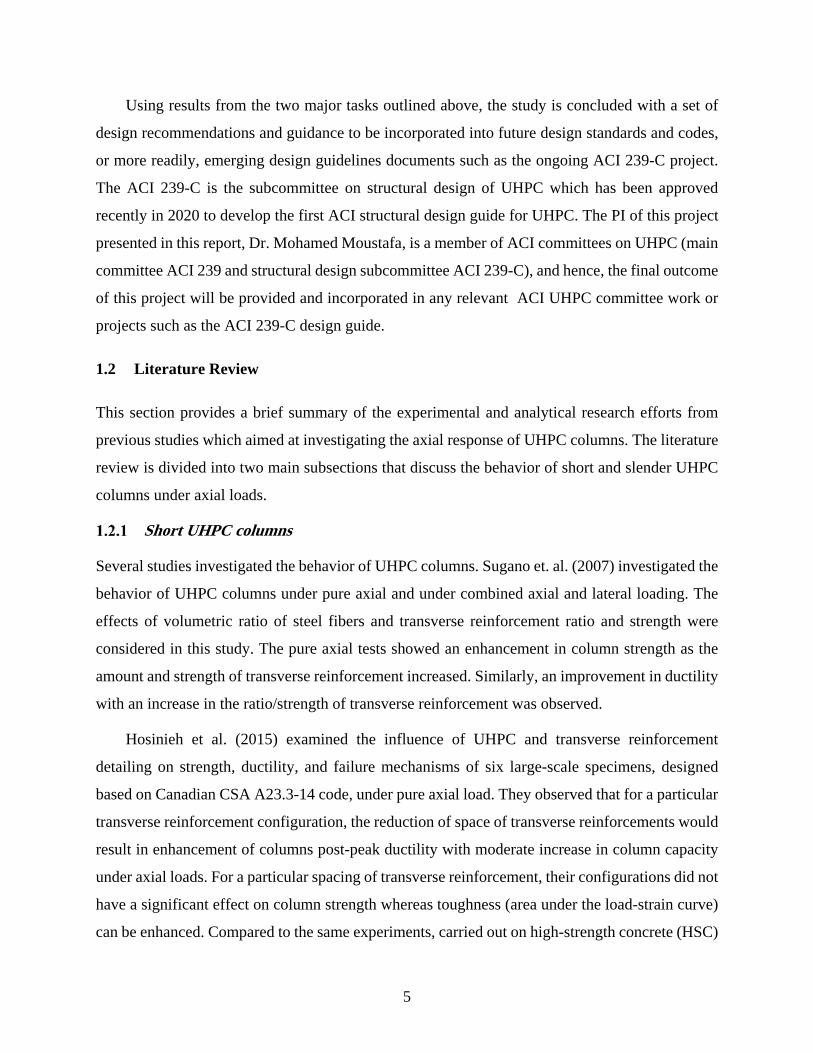
the bridge construction industry. The first UHPC prestressed I-girder bridge constructed in the US
was the Mars Hill bridge in Wapello County, IA opened to traffic in 2006 (Figure 1.1). Moreover,
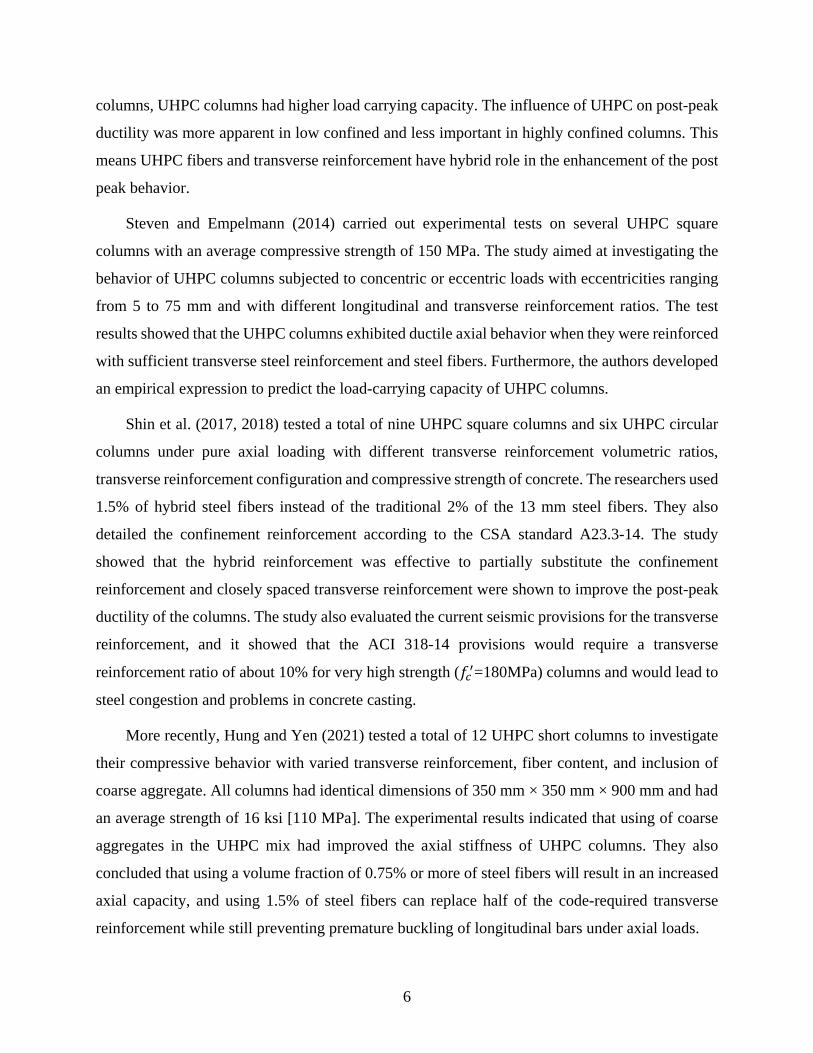
UHPC has gained a significant momentum recently, with States around the country considering
its application as a field-cast closure pour or grout material in applications requiring the onsite
connection of multiple prefabricated elements, for instance, field-cast into the deck-level

2
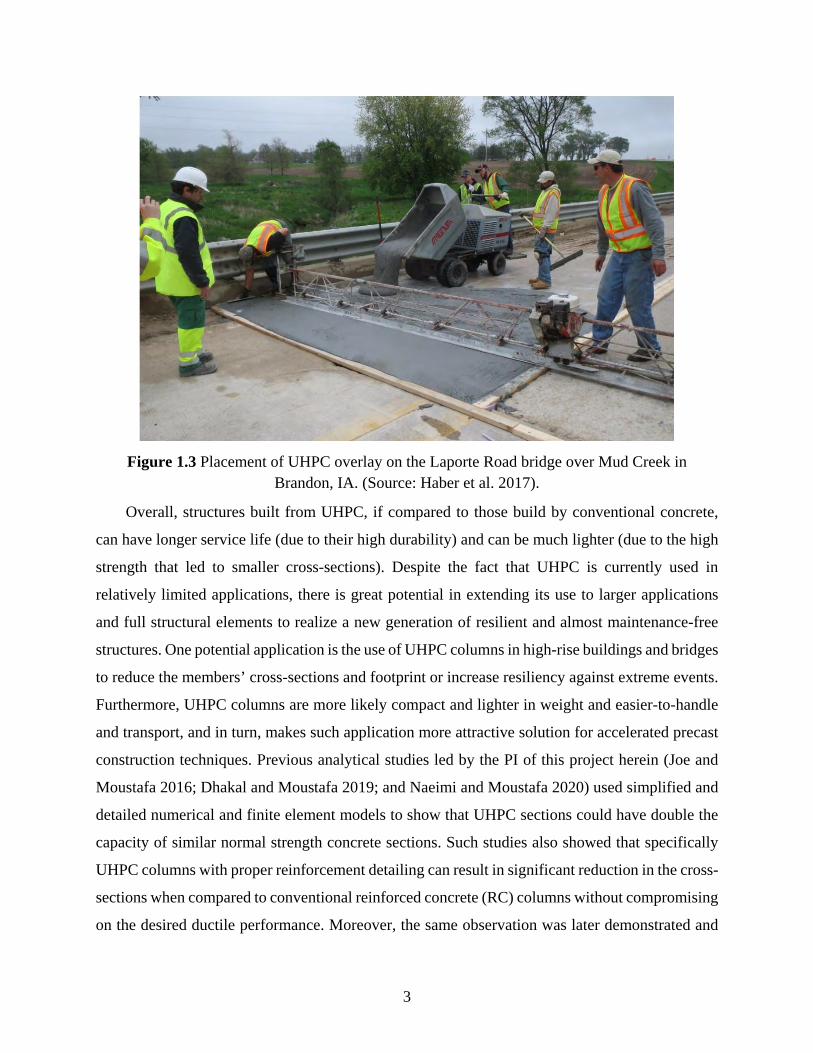
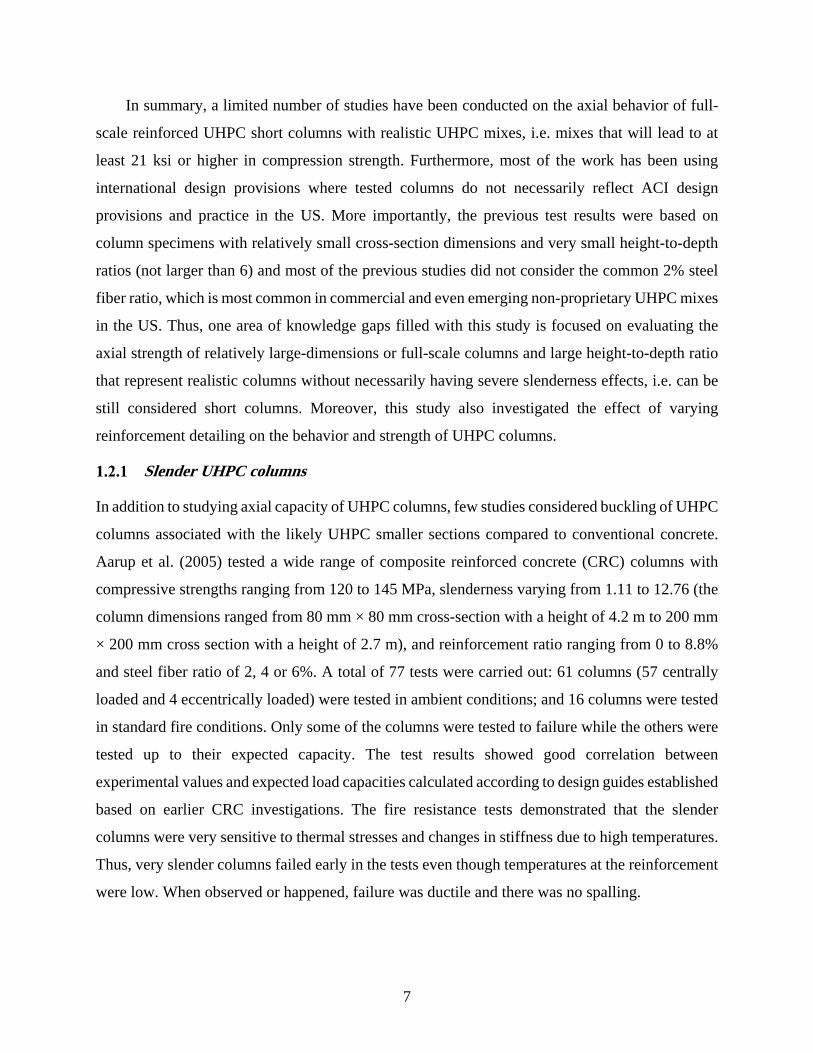
connections (Figure 1.2). Furthermore, the UHPC is being used in thin-bonded overlays on
deteriorated bridge decks as shown in Figure 1.3.
Figure 1.1 UHPC prestressed I-girder bridge in Wapello county, Iowa. Source: FHWA.
Figure 1.2 Longitudinal field-cast UPC connections between deck-bulb-tee-girders on the Route
31 Bridge in Lyons, NY. Source: New York State Department of Transportation.
3
Figure 1.3 Placement of UHPC overlay on the Laporte Road bridge over Mud Creek in Brandon, IA. (Source: Haber et al. 2017).
Overall, structures built from UHPC, if compared to those build by conventional concrete,
can have longer service life (due to their high durability) and can be much lighter (due to the high
strength that led to smaller cross-sections). Despite the fact that UHPC is currently used in
relatively limited applications, there is great potential in extending its use to larger applications
and full structural elements to realize a new generation of resilient and almost maintenance-free
structures. One potential application is the use of UHPC columns in high-rise buildings and bridges
to reduce the members’ cross-sections and footprint or increase resiliency against extreme events.
Furthermore, UHPC columns are more likely compact and lighter in weight and easier-to-handle
and transport, and in turn, makes such application more attractive solution for accelerated precast
construction techniques. Previous analytical studies led by the PI of this project herein (Joe and
Moustafa 2016; Dhakal and Moustafa 2019; and Naeimi and Moustafa 2020) used simplified and
detailed numerical and finite element models to show that UHPC sections could have double the
capacity of similar normal strength concrete sections. Such studies also showed that specifically
UHPC columns with proper reinforcement detailing can result in significant reduction in the cross-
sections when compared to conventional reinforced concrete (RC) columns without compromising
on the desired ductile performance. Moreover, the same observation was later demonstrated and
4
confirmed by experimental study conducted by Aboukifa et al. (2019a; 2019b; 2020) on UHPC
bridge columns. In that study, the authors showed that at least 40% reduction in the cross-section
could be achieved only if UHPC replaces conventional concrete while still using the same
longitudinal and transverse reinforcement ratios. Accordingly, future UHPC columns are expected
to have smaller cross-sections relative to typical construction heights they are used for, i.e. more
slender columns will be expected should UHPC is used. Thus, it is important and necessary to
investigate the stability of slender UHPC columns and assess existing design codes such as ACI
318 to find whether adjusting the existing design provisions is needed for UHPC columns.
This main goal of this research study is to provide experimental demonstration and reliable
datasets of UHPC columns to validate current analytical procedures and inform future designs.
This is achieved through two main tasks with two different objectives. The first task of this study
is concerned with exploring the experimental behavior of slender UHPC columns under concentric
axial loading. The experimental data is then used to evaluate the ACI procedure used for including
the slenderness effects and applying the moment magnification method for quantifying the 2nd
order moments resulting from the columns buckling. A comprehensive experimental testing matrix
was designed specifically for this purpose that included five full-scale UHPC columns. The
considered columns in this study are the largest axially tested UHPC columns to-date anywhere
around the world, which was possible to test using the 4000-kip testing machine at the University
of California Berkeley PEER laboratory. The columns height-to-depth or height-to-thickness (h/t)
ratios varied from 6 to 20 to cover a wide range of slenderness ratios for the purpose of capturing
the specific slenderness ratio at which slenderness effects are significant to be accounted for.
The second task of this study focused on analyzing the experimental behavior of slender
UHPC columns, with varying reinforcement detailing but minimal or negligible slenderness
effects, under concentric axial loading and inspect the validity of the ACI 318 equations for
estimating the UHPC columns axial strength. For this purpose, five full-scale UHPC columns were
tested (including one column from previous group needed to fulfil the first task) under concentric
axial loading also at PEER. The test matrix included varying the confinement reinforcement, the
longitudinal reinforcement ratio, and the steel fiber reinforcement ratio in the UHPC mix. The
varied parameters aimed at evaluating the effects on the damage behavior, the strength, and the
ductility of the UHPC columns.
5
Using results from the two major tasks outlined above, the study is concluded with a set of
design recommendations and guidance to be incorporated into future design standards and codes,
or more readily, emerging design guidelines documents such as the ongoing ACI 239-C project.
The ACI 239-C is the subcommittee on structural design of UHPC which has been approved
recently in 2020 to develop the first ACI structural design guide for UHPC. The PI of this project
presented in this report, Dr. Mohamed Moustafa, is a member of ACI committees on UHPC (main
committee ACI 239 and structural design subcommittee ACI 239-C), and hence, the final outcome
of this project will be provided and incorporated in any relevant ACI UHPC committee work or
projects such as the ACI 239-C design guide.
1.2 Literature Review
This section provides a brief summary of the experimental and analytical research efforts from
previous studies which aimed at investigating the axial response of UHPC columns. The literature
review is divided into two main subsections that discuss the behavior of short and slender UHPC
columns under axial loads.
Short UHPC columns
Several studies investigated the behavior of UHPC columns. Sugano et. al. (2007) investigated the
behavior of UHPC columns under pure axial and under combined axial and lateral loading. The
effects of volumetric ratio of steel fibers and transverse reinforcement ratio and strength were
considered in this study. The pure axial tests showed an enhancement in column strength as the
amount and strength of transverse reinforcement increased. Similarly, an improvement in ductility
with an increase in the ratio/strength of transverse reinforcement was observed.
Hosinieh et al. (2015) examined the influence of UHPC and transverse reinforcement
detailing on strength, ductility, and failure mechanisms of six large-scale specimens, designed
based on Canadian CSA A23.3-14 code, under pure axial load. They observed that for a particular
transverse reinforcement configuration, the reduction of space of transverse reinforcements would
result in enhancement of columns post-peak ductility with moderate increase in column capacity
under axial loads. For a particular spacing of transverse reinforcement, their configurations did not
have a significant effect on column strength whereas toughness (area under the load-strain curve)
can be enhanced. Compared to the same experiments, carried out on high-strength concrete (HSC)
6
columns, UHPC columns had higher load carrying capacity. The influence of UHPC on post-peak
ductility was more apparent in low confined and less important in highly confined columns. This
means UHPC fibers and transverse reinforcement have hybrid role in the enhancement of the post
peak behavior.
Steven and Empelmann (2014) carried out experimental tests on several UHPC square
columns with an average compressive strength of 150 MPa. The study aimed at investigating the
behavior of UHPC columns subjected to concentric or eccentric loads with eccentricities ranging
from 5 to 75 mm and with different longitudinal and transverse reinforcement ratios. The test
results showed that the UHPC columns exhibited ductile axial behavior when they were reinforced
with sufficient transverse steel reinforcement and steel fibers. Furthermore, the authors developed
an empirical expression to predict the load-carrying capacity of UHPC columns.
Shin et al. (2017, 2018) tested a total of nine UHPC square columns and six UHPC circular
columns under pure axial loading with different transverse reinforcement volumetric ratios,
transverse reinforcement configuration and compressive strength of concrete. The researchers used
1.5% of hybrid steel fibers instead of the traditional 2% of the 13 mm steel fibers. They also
detailed the confinement reinforcement according to the CSA standard A23.3-14. The study
showed that the hybrid reinforcement was effective to partially substitute the confinement
reinforcement and closely spaced transverse reinforcement were shown to improve the post-peak
ductility of the columns. The study also evaluated the current seismic provisions for the transverse
reinforcement, and it showed that the ACI 318-14 provisions would require a transverse
reinforcement ratio of about 10% for very high strength (𝑓 =180MPa) columns and would lead to
steel congestion and problems in concrete casting.
More recently, Hung and Yen (2021) tested a total of 12 UHPC short columns to investigate
their compressive behavior with varied transverse reinforcement, fiber content, and inclusion of
coarse aggregate. All columns had identical dimensions of 350 mm × 350 mm × 900 mm and had
an average strength of 16 ksi [110 MPa]. The experimental results indicated that using of coarse
aggregates in the UHPC mix had improved the axial stiffness of UHPC columns. They also
concluded that using a volume fraction of 0.75% or more of steel fibers will result in an increased
axial capacity, and using 1.5% of steel fibers can replace half of the code-required transverse
reinforcement while still preventing premature buckling of longitudinal bars under axial loads.
7
In summary, a limited number of studies have been conducted on the axial behavior of full-
scale reinforced UHPC short columns with realistic UHPC mixes, i.e. mixes that will lead to at
least 21 ksi or higher in compression strength. Furthermore, most of the work has been using
international design provisions where tested columns do not necessarily reflect ACI design
provisions and practice in the US. More importantly, the previous test results were based on
column specimens with relatively small cross-section dimensions and very small height-to-depth
ratios (not larger than 6) and most of the previous studies did not consider the common 2% steel
fiber ratio, which is most common in commercial and even emerging non-proprietary UHPC mixes
in the US. Thus, one area of knowledge gaps filled with this study is focused on evaluating the
axial strength of relatively large-dimensions or full-scale columns and large height-to-depth ratio
that represent realistic columns without necessarily having severe slenderness effects, i.e. can be
still considered short columns. Moreover, this study also investigated the effect of varying
reinforcement detailing on the behavior and strength of UHPC columns.
Slender UHPC columns
In addition to studying axial capacity of UHPC columns, few studies considered buckling of UHPC
columns associated with the likely UHPC smaller sections compared to conventional concrete.
Aarup et al. (2005) tested a wide range of composite reinforced concrete (CRC) columns with
compressive strengths ranging from 120 to 145 MPa, slenderness varying from 1.11 to 12.76 (the
column dimensions ranged from 80 mm × 80 mm cross-section with a height of 4.2 m to 200 mm
× 200 mm cross section with a height of 2.7 m), and reinforcement ratio ranging from 0 to 8.8%
and steel fiber ratio of 2, 4 or 6%. A total of 77 tests were carried out: 61 columns (57 centrally
loaded and 4 eccentrically loaded) were tested in ambient conditions; and 16 columns were tested
in standard fire conditions. Only some of the columns were tested to failure while the others were
tested up to their expected capacity. The test results showed good correlation between
experimental values and expected load capacities calculated according to design guides established
based on earlier CRC investigations. The fire resistance tests demonstrated that the slender
columns were very sensitive to thermal stresses and changes in stiffness due to high temperatures.
Thus, very slender columns failed early in the tests even though temperatures at the reinforcement
were low. When observed or happened, failure was ductile and there was no spalling.

8
Redaelli et al. (2017) experimentally evaluated the contribution of fibers to the structural
response of the columns under bending with normal force. They assessed to which extent fibers
could replace longitudinal or transversal reinforcement. Two preliminary test series on large-scale
columns with or without ordinary reinforcement were carried out. The first test series
experimentally investigated the behavior of nine UHPC columns (slenderness ratio = 42) without
transverse reinforcement under axial load and imposed end rotation. The experimented variables
were three different longitudinal reinforcement configurations, i.e. unreinforced, reinforced, and
prestressed, with three different applied axial load ratios, i.e. 30%, 50% and 70%. The second test
series experimentally investigated the behavior of nine more slender columns (slenderness ratio =
83) with circular cross-section made of HSC columns and reinforced alternatively with: only
fibers; only ordinary longitudinal and transversal reinforcement; both fibers and reinforcement.
The columns were tested under an eccentrically applied compressive force, and the experimented
variables were concrete type (high-strength fiber-reinforced concrete (HSFRC) with 2% fibers
versus HSC); the initial eccentricity (30 to 60 mm); the presence of longitudinal and transversal
reinforcement; and steel grade (ordinary or high strength steel). The authors concluded that despite
the relatively ductile behavior in compression of HSFRC, columns without ordinary reinforcement
subjected to high compressive forces fail in an extremely brittle way. Columns with longitudinal
reinforcement and without any transversal reinforcement exhibited longitudinal cracking which
cannot be controlled by fibers alone, thus leading to early spalling of concrete cover and a
reduction of column strength. When fibers were added (> 2.0% in volume) to columns with
longitudinal and transversal reinforcement, cover spalling was prevented.
Schmidt and Curbach (2017) experimentally and analytically addressed the design
optimization of UHPC columns to increase buckling stability by changing the cross section and
shape of the column in both longitudinal and transverse directions by using the same amount of
material used in their corresponding rectangular shaped columns. The experimental program
consisted of two groups of 14 columns without longitudinal or transverse reinforcement and with
compressive strength ranging from 120-160 MPa. The first group consisted of four square columns
and four triangular columns with the same amount of materials, 130-135 slenderness ratio, and
hinged-hinged end conditions to investigate the effect of changing the cross-section on increasing
the buckling stability. The second group consisted of three rectangular columns and three
optimized rectangular columns of equally UHPC volumes with smaller cross-sections at the points
9
of inflection of the column buckling profile and bigger cross-sections elsewhere along the column.
The columns were of 99-100 slenderness ratio and had fixed-fixed end conditions. The authors
concluded that the variation of the geometry and the shape of the column has a large potential to
increase the stability.
Another study was conducted by Hung and Hu (2018) and Hung et al. (2018) to
experimentally investigate the behavior of 10 slender HSC of 100 MPa compressive strength and
steel fiber contents ranging from 0% to 1.5% under concentric axial loads. They found that
inclusion of 1.5% fibers enhanced the post-peak behavior as it became more ductile and it
controlled the cover spalling preventing the longitudinal rebars from buckling. They also compared
the capacities of the tested columns to the ACI 318 equations. The experimented variables were:
(1) the stirrup spacing (h/2 and h/4); (2) the cross ties (presence or absence); and (3) the amount
of steel fibers (0%, 0.75%, and 1.5%). The columns dimensions were 200 × 200 × 1200 mm
(buckling ratio = 20, according to ACI 318). It was found that all of the transversely reinforced
columns without fibers exhibited a brittle post-peak behavior with an abrupt loss in their strength
after reaching peak strength because of large region of concrete spalling and crushing. Inclusion
of 1.5% fibers enhanced the post-peak behavior as it became more ductile and it controlled the
cover spalling preventing the longitudinal rebars from buckling. The ACI 318 equations
overestimated the strength of HSC slender columns with about 6% to 12%. Finally, the ACI-318
magnified Moment approach generated acceptable estimations for the total moment demand of the
tested slender UHPC columns with accuracy ratios between 0.94 and 1.04 but slightly
underestimated the actual total moment demand of the columns with fibers and overestimation of
the columns without fibers.
1.3 Objectives
The overarching goal of this research study is to provide a better understanding of the structural
response and buckling behavior of slender UHPC columns. To achieve this goal, several specific
research objectives are defined as follows:
1. Conduct experimental testing for nine full-scale UHPC columns;
2. Investigate the effect of increasing the UHPC column slenderness ratio on the columns stability
and strength;
10
3. Determine the sensitivity of highly axially-loaded UHPC columns to varying transverse,
longitudinal, and fiber reinforcement ratios for the purpose of optimizing their design;
4. Evaluate the existing relevant ACI 318 code provisions for estimating UHPC columns axial
strength;
5. Inspect the validity of ACI 318 procedure for slender UHPC columns and second-order
moment analysis;
6. Contribute to the development of future UHPC-sensible design codes by providing design
guidance based on the experimental observation and analysis conducted herein.
1.4 Report Outline
This report is organized into five chapters. Chapter 1 provides an overview of the research topic
and problem statement along with an overview of the relevant literature and the specific objectives
of the research study. The experimental program is discussed in Chapter 2 with respect to the
design procedure and construction, materials strength, testing setup and loading protocol, and
finally the instrumentation plan. Chapter 3 presents the results of each individual column and
provides a comprehensive discussion of the UHPC columns behavior under concentric axial loads.
Chapter 4 presents the assessment of the current ACI 318-19 procedure to estimate the axial load
strength of UHPC columns whether they are short or slender columns. Chapter 5 presents an
overall summary and final concluding remarks in addition to design recommendations and
guidance for future implementation in design codes.
11
EXPERIMENTAL PROGRAM DEVELOPMENT
2.1 Introduction
This chapter presents the experimental testing program of the slender UHPC columns subjected to
concentrically monotonic axial loading. The experimental program consisted of nine full-scale
UHPC columns. With column height up to ~18.5 ft (5.6 m), this project provides the largest axially
tested UHPC columns anywhere in the world to date. All columns were tested at one of the largest
testing facilities in the US; 4000-kip [17,793 kN] testing machine at the University of California,
Berkeley Pacific Earthquake Engineering Research center (PEER) Laboratory. The experimental
program presented herein is discussed in terms of the specimens’ design and their construction,
the properties of the materials used to construct the specimens, the test setup and loading protocol
used in the test, and the instrumentation plan used to quantify the column deformations and the
bars strains.
2.2 Specimens Design and construction
Nine UHPC column members were fabricated at the construction yard associated with the
Earthquake Engineering Laboratory (EEL) at the University of Nevada, Reno (UNR) and then
transported to be tested at PEER Laboratory in Richmond, CA. A comprehensive test matrix
consisting of two groups of five specimens each (with one common specimen in the two groups)
was designed, as outlined in Tables 2.1 and 2.2, to include different testing variables affecting the
behavior and strength of slender UHPC columns. Group I specimens focused on the effect of the
column slenderness on the axial capacity of the UHPC columns. Group II specimens focused on
various reinforcement detailing. The experimental variables of Group II column members were:
(1) transverse reinforcement ratio, (2) longitudinal reinforcement ratio, and (3) UHPC mix steel
fiber reinforcement ratio.
The cross-sectional dimensions of all the columns were identical and their measure was 11 ×
11 in2 [280 × 280 mm2] while the column heights varied from 66 in [~1.67 m] to 220 in [~5.56 m]
to represent different height-to-depth (h/t) ratios of 6, 12, 14, 16 and 20. The column with h/t ratio
of six represents a short column while the column with a h/t ratio of 20 is a very slender column.
The columns in between these two limits were intended to help identify the slenderness ratio at
which the UHPC columns start to have significant p-𝛿 effects. Note that these are all full-scale
12
columns where the clear heights along with the average axial capacity of the tested columns make
them suitable candidates to use in lower floors of mid-rise buildings or even intermediate and
upper floors in high-rise buildings.
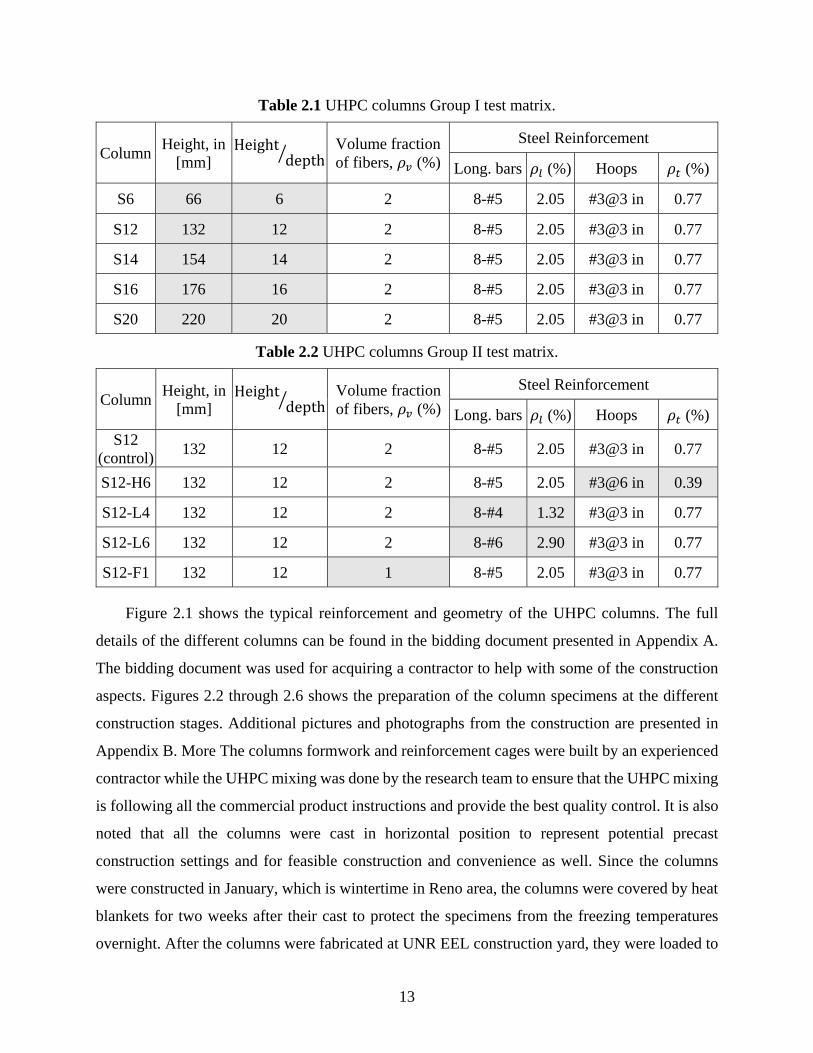
The columns were reinforced and detailed according to the ACI 318-19 standard to meet the
requirement of a ductile column in a special moment frame. However, the transverse reinforcement
was determined as if the columns were made of normal strength concrete (NSC). This is mainly
because the ACI 318 standard equations for the minimum amount of transverse reinforcement are
highly dependable on the strength of concrete, i.e. function of f’c, which accordingly will lead to
as much as 4 or 5 times the value required for the NSC which is overly conservative and impractical
especially for UHPC. The transverse reinforcement used in all the columns was #3 [𝛷10 mm]
hoops at 3 in [76.2 mm] spacing except in one of the columns was 6 in [152.4 mm]. These values
corresponded to transverse reinforcement ratios of 0.77% and 0.39%. All the columns were
reinforced longitudinally with eight #5 [𝛷16 mm] Gr 60 [fy = 420 MPa] reinforcing bars except in
two of the columns that were reinforced with eight #4 [d = 12.7 mm] and eight #6 [d = 19.05 mm]
bars. Such reinforcement corresponded to longitudinal reinforcement ratios of 2.05%, 1.32% and
2.9%, respectively. All the columns were constructed of the Ductal® commercial proprietary
UHPC mix from LafargeHolcim with 2% volumetric ratio of steel fibers, except for one of the
columns which had less steel fiber ratio of 1%.
As mentioned before, the notations and reinforcement details of each column member are
shown in Tables 2.1 and 2.2. In Group I specimens, the letter “S” refers to the column slenderness
and the numbers following “S” is the height to depth ratio of the column. In Group II specimens,
the control column is “S12” which refers to the UHPC column with slenderness ratio of 12 and
reinforced longitudinally with 8 #5 [𝛷16 mm] bars and transversely with #3 [𝛷10 mm] hoops
every 3 in. The other columns in Group II had the same slenderness ratio of 12 but with a varied
parameter than “S12”, thus the varied parameter is added after the hyphen symbol “-”, such that
the number following the letter “H” denotes the hoops spacing, the number following the letter
“L” denotes the longitudinal reinforcement bar number (bar diameter), and the number following
the letter “F” denotes the steel fibers volumetric ratio. For example, “S12-L4” denotes the column
with height/depth ratio of 12 and the varied parameter than specimen “S12” is the longitudinal
reinforcement of 8-#4 [𝛷13 mm] bars instead of 8-#5 [𝛷16 mm] bars.
13
Table 2.1 UHPC columns Group I test matrix.
Column Height, in
[mm] Height
depth Volume fraction of fibers, 𝜌 (%)
Steel Reinforcement
Long. bars 𝜌 (%) Hoops 𝜌 (%)
S6 66 6 2 8-#5 2.05 #3@3 in 0.77
S12 132 12 2 8-#5 2.05 #3@3 in 0.77
S14 154 14 2 8-#5 2.05 #3@3 in 0.77
S16 176 16 2 8-#5 2.05 #3@3 in 0.77
S20 220 20 2 8-#5 2.05 #3@3 in 0.77
Table 2.2 UHPC columns Group II test matrix.
Column Height, in
[mm] Height
depth Volume fraction of fibers, 𝜌 (%)
Steel Reinforcement
Long. bars 𝜌 (%) Hoops 𝜌 (%)
S12 (control)
132 12 2 8-#5 2.05 #3@3 in 0.77
S12-H6 132 12 2 8-#5 2.05 #3@6 in 0.39
S12-L4 132 12 2 8-#4 1.32 #3@3 in 0.77
S12-L6 132 12 2 8-#6 2.90 #3@3 in 0.77
S12-F1 132 12 1 8-#5 2.05 #3@3 in 0.77
Figure 2.1 shows the typical reinforcement and geometry of the UHPC columns. The full
details of the different columns can be found in the bidding document presented in Appendix A.
The bidding document was used for acquiring a contractor to help with some of the construction
aspects. Figures 2.2 through 2.6 shows the preparation of the column specimens at the different
construction stages. Additional pictures and photographs from the construction are presented in
Appendix B. More The columns formwork and reinforcement cages were built by an experienced
contractor while the UHPC mixing was done by the research team to ensure that the UHPC mixing
is following all the commercial product instructions and provide the best quality control. It is also
noted that all the columns were cast in horizontal position to represent potential precast
construction settings and for feasible construction and convenience as well. Since the columns
were constructed in January, which is wintertime in Reno area, the columns were covered by heat
blankets for two weeks after their cast to protect the specimens from the freezing temperatures
overnight. After the columns were fabricated at UNR EEL construction yard, they were loaded to

14
a flat bed and transported to Richmond, CA to be tested at the UC Berkeley PEER Laboratory
(Figure 2.7). The columns lifting and handling points in each of the transportation and test setup
stages were carefully considered to ensure that the columns do not accidentally reach their tensile
cracking strength.
Figure 2.1 Reinforcement details of a typical UHPC column [dimensions in mm].
Figure 2.2 Formwork for nine columns at UNR construction yard .
15
Figure 2.3 Rebar cage as assembled and installed inside the formwork.
Figure 2.4 UHPC casting shown for two of the test specimens.
Figure 2.5 Use of heat blankets for cast UHPC columns to protect specimens from low
temperatures in the Reno area during winter when the columns were cast.
16
Figure 2.6 UHPC columns after construction and ready to be transported.
Figure 2.7 UHPC columns transportation from UNR to PEER Laboratory.
2.3 Material Properties
This section presents the material characteristics of the proprietary UHPC mixture, and the
reinforcing steel bars used in this study. It includes discussion of the material preparation,

17
sampling, and mechanical strength evaluation, i.e. tensile strength for steel bars and compressive
strength for UHPC.
Ultra-High Performance Concrete
The columns were made of a commercial proprietary UHPC mix which was donated by
LafargeHolcim (Ductal® and product name is JS1000). This mix is commonly delivered in three
different parts: (1) premix 50-lb bags containing all the dry constituents which is a proprietary
blend of cement, sand, ground quartz, and silica fume; (2) steel fibers bags; (3) superplasticizers
buckets. The mix ratios and mix components, as instructed by the manufacturer, are shown in
Tables 2.3 and 2.4, respectively. As mentioned earlier, 2% volumetric ratio of steel fibers were
used in eight out of the nine columns while only one column had 1% steel fiber ratio. The used
steel fibers were the OL 13/0.2 Dramix® fibers which are 13 mm in length and 0.2 mm in diameter
with nominal tensile strength of 399 ksi [2750 MPa].
Table 2.3 UHPC mixture by Ductal® (based on number of premix bags).
Number of bags per batch 5 6 7 8 9
Premix (lb) 250 300 350 400 450
Water or ice (lb) 14.37 17.24 20.12 22.99 25.86
Superplasticizer (lb) 3.43 4.11 4.80 5.48 6.17
Steel fiber (lb) 17.77 21.32 24.88 28.43 31.99
Volume / Batch (ft3) 1.82 2.19 2.55 2.92 3.285
Table 2.4 UHPC mixture by Ductal®.
(kg/m3) lb/yd3 Percentage by weight (%)
Premix 2195 3700 87.6
Superplasticizer (Premia 150) 30 50.6 1.2
Steel Fiber (2.0% volume) 156 263 6.2
Water (or ice) 130 219.1 5
A high shear mixer that is available at UNR: Imer 750 was used for all the UHPC mixes. The
UHPC mix nominal 28-day compressive strength was 20 ksi [140 MPa]. Approximately 100 ft3
[2.83 m3] of UHPC were mixed to construct the columns. This was achieved through a total of 34
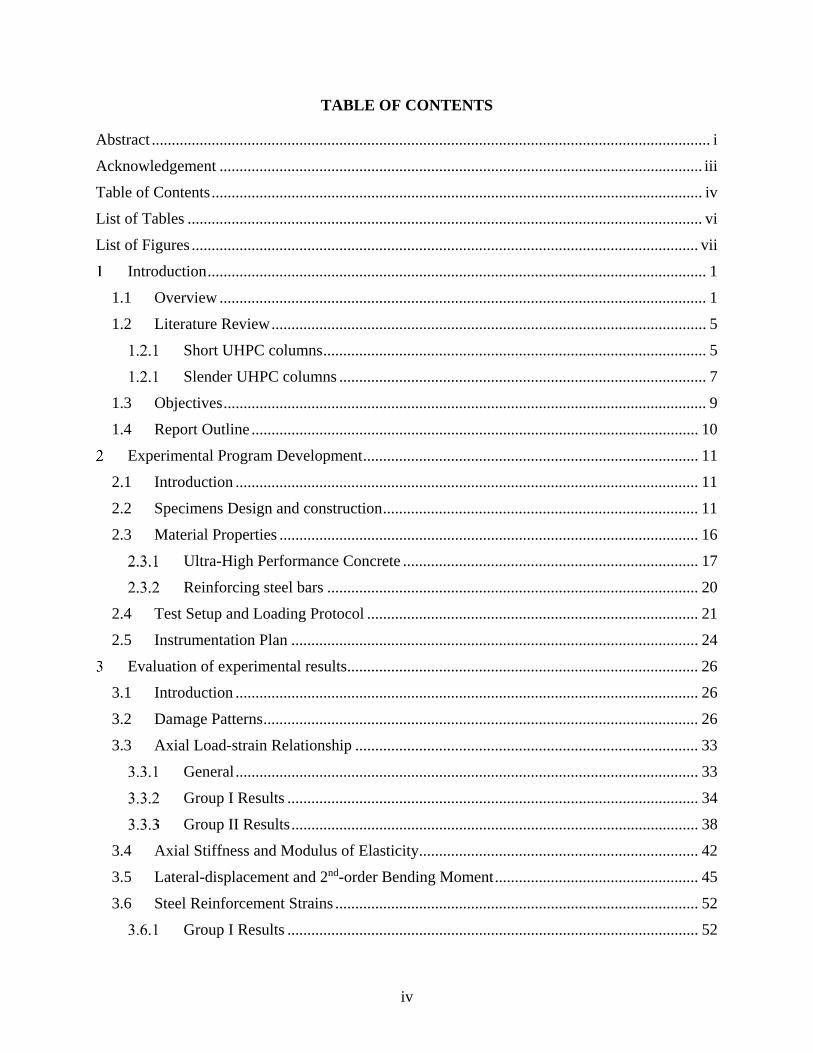
batches of UHPC of 3 ft3/batch. Figure 2.8 shows the UHPC while being mixed in the high shear
mixer. The number of UHPC batches for each column ranged from two batches per column to six
18
batches per column for the shortest and tallest column, respectively. Thus, to prevent the formation
of cold joint between two consecutive casts in a single column, all the UHPC casts were poured
from the same position and the crust formed on top of the former UHPC batch was made loose
using a wooden piece before pouring the second batch to ensure continuity between the pours and
allow for fibers to bridge between the UHPC casts.
Figure 2.8 UHPC while being mixed in the high shear mixer.
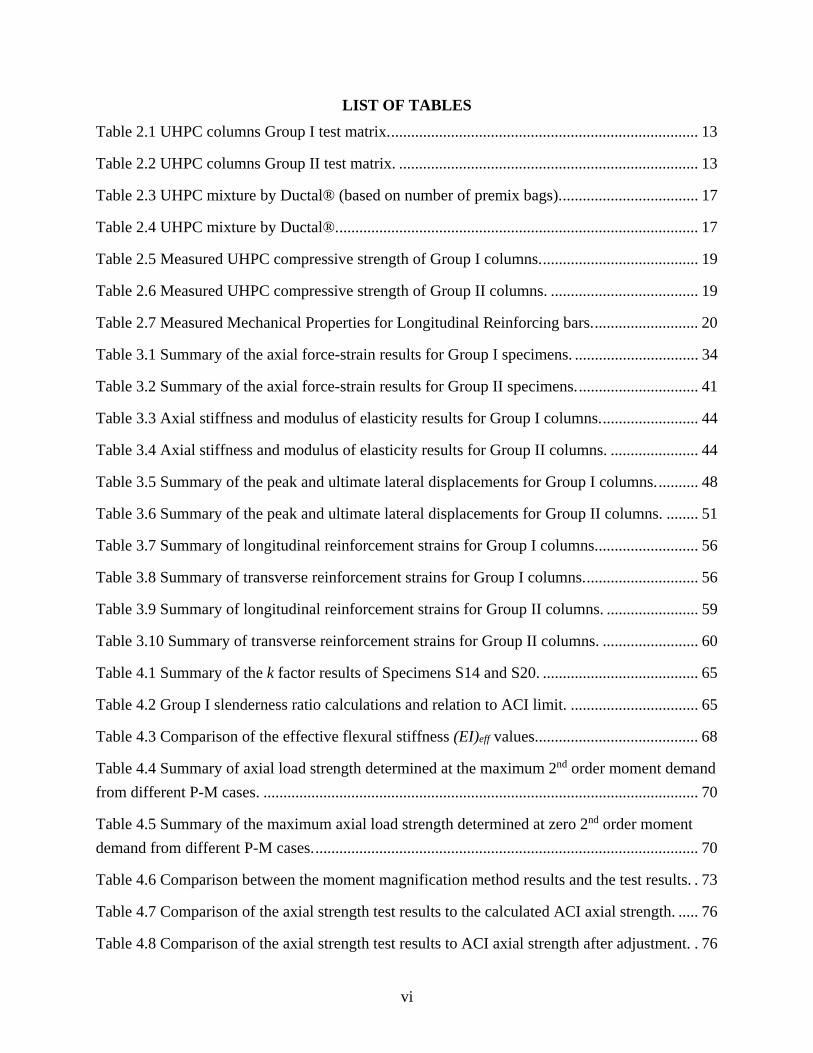
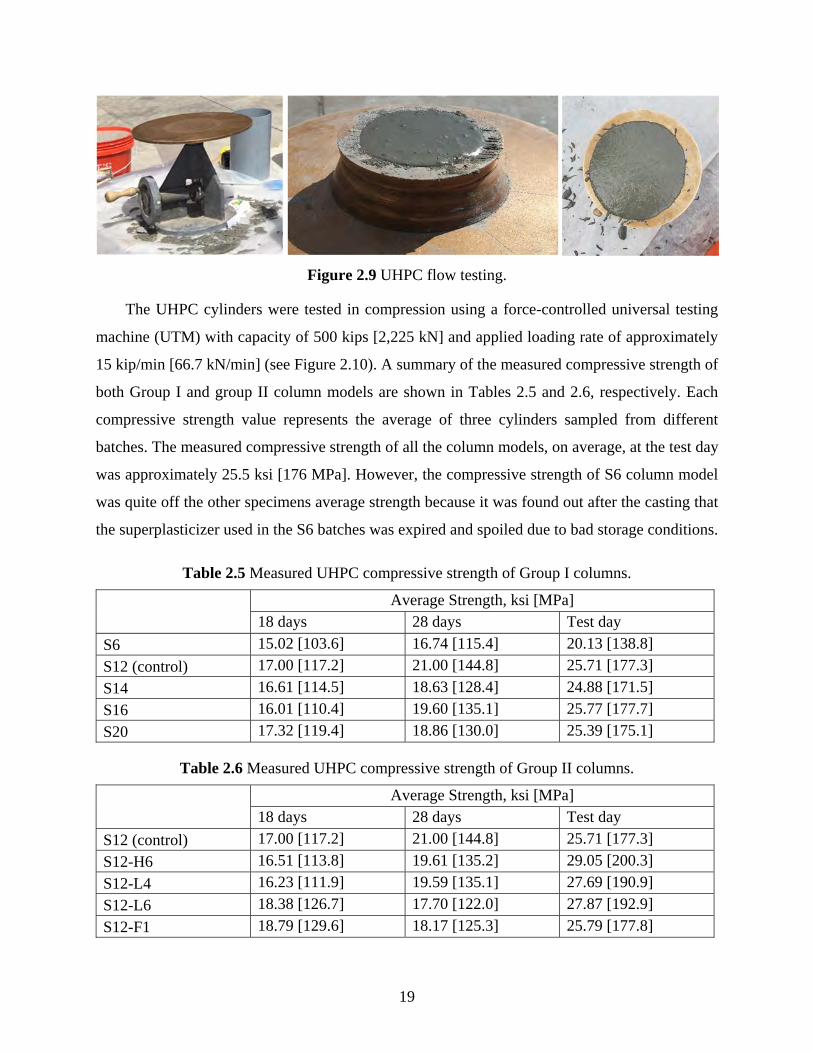
The fabrication and testing of all the UHPC specimens were done according to the ASTM
C1856 (2017) standards. For each UHPC batch, static and dynamic flow characteristics were
measured to check values are within the allowable ranges. A flow table and a brass cone were used
for these tests as shown in Figure 2.9. The actual dynamic flow tests for most of the columns were
in the range of 8.5-9.5 in [216-241 mm], which was acceptable against the allowable flow range
of 7 to 10 in [180 to 250 mm] after 20 drops on the impact flow table. For the compressive strength
evaluation of the UHPC columns, three cylinders samples of 3×6 in [76.2×152.4 mm] were taken
from each batch to be tested at 18 days, 28 days, and each column test day. A total of about 120
cylinders were taken from all the batches then prepared both sides. Cylinder preparation start by
cutting off the top end using large electric saw then grinding both cylinder ends in light of ASTM
C1856 (2017) provisions for accurate strength evaluation. It is noted that this study leverage more
than four years of experience by the research group in material testing and characterization of
UHPC and other advanced construction materials such as polymer concrete (e.g. Abokifa and
Moustafa 2021; Naeimi and Moustafa 2021a; Naeimi and Moustafa 2021b).
19
Figure 2.9 UHPC flow testing.
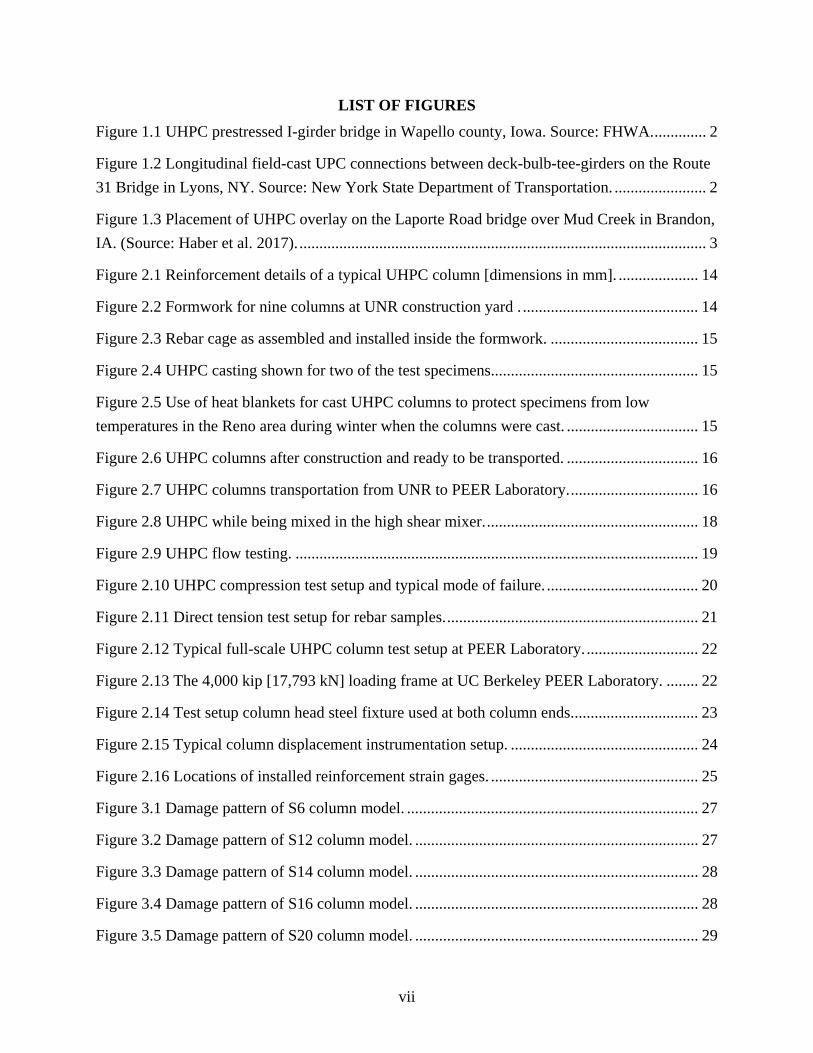
The UHPC cylinders were tested in compression using a force-controlled universal testing
machine (UTM) with capacity of 500 kips [2,225 kN] and applied loading rate of approximately
15 kip/min [66.7 kN/min] (see Figure 2.10). A summary of the measured compressive strength of
both Group I and group II column models are shown in Tables 2.5 and 2.6, respectively. Each
compressive strength value represents the average of three cylinders sampled from different
batches. The measured compressive strength of all the column models, on average, at the test day
was approximately 25.5 ksi [176 MPa]. However, the compressive strength of S6 column model
was quite off the other specimens average strength because it was found out after the casting that
the superplasticizer used in the S6 batches was expired and spoiled due to bad storage conditions.
Table 2.5 Measured UHPC compressive strength of Group I columns.
Average Strength, ksi [MPa] 18 days 28 days Test day
S6 15.02 [103.6] 16.74 [115.4] 20.13 [138.8]
S12 (control) 17.00 [117.2] 21.00 [144.8] 25.71 [177.3]
S14 16.61 [114.5] 18.63 [128.4] 24.88 [171.5]
S16 16.01 [110.4] 19.60 [135.1] 25.77 [177.7]
S20 17.32 [119.4] 18.86 [130.0] 25.39 [175.1]
Table 2.6 Measured UHPC compressive strength of Group II columns.
Average Strength, ksi [MPa] 18 days 28 days Test day
S12 (control) 17.00 [117.2] 21.00 [144.8] 25.71 [177.3]
S12-H6 16.51 [113.8] 19.61 [135.2] 29.05 [200.3]
S12-L4 16.23 [111.9] 19.59 [135.1] 27.69 [190.9]
S12-L6 18.38 [126.7] 17.70 [122.0] 27.87 [192.9]
S12-F1 18.79 [129.6] 18.17 [125.3] 25.79 [177.8]
20
Figure 2.10 UHPC compression test setup and typical mode of failure.
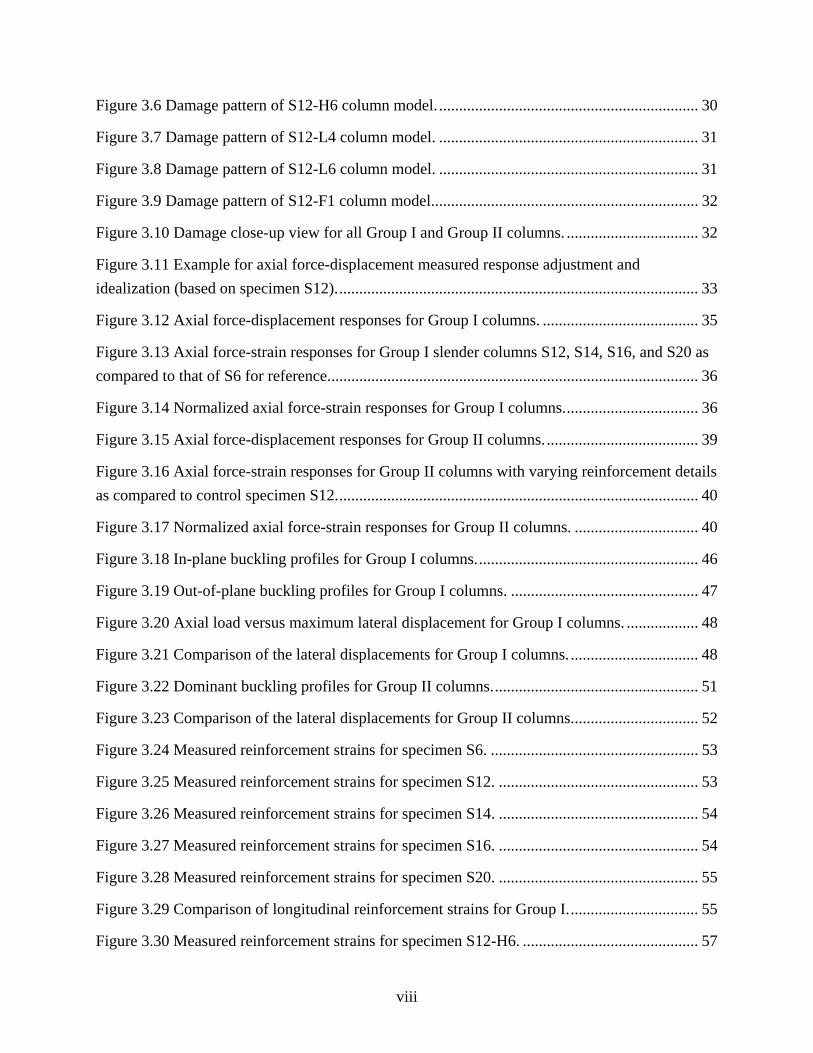
Reinforcing steel bars
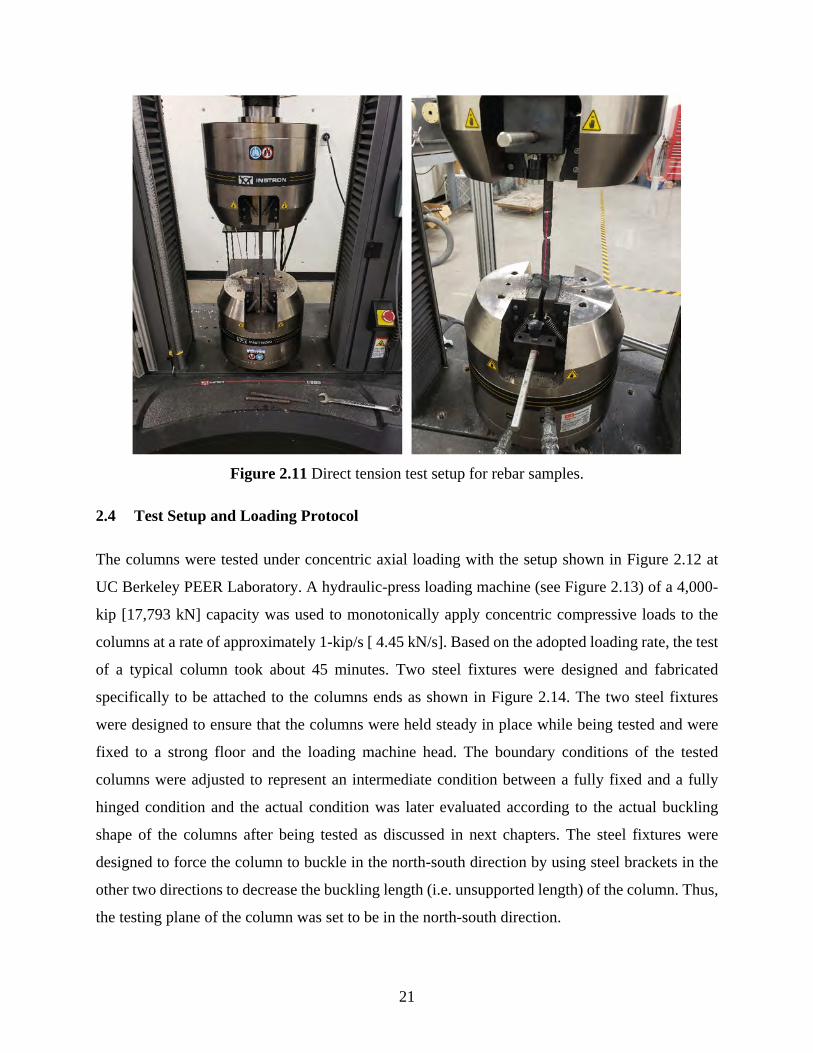
The column models were reinforced longitudinally with ASTM A706 grade 60 bars of #4 [𝛷13-
mm], #5 [𝛷16-mm], and #6 [𝛷19-mm] bars, as previously mentioned in the columns
reinforcement details. The columns were reinforced transversely with #3 [𝛷10-mm] ASTM A615
grade 60 hoops. Four rebar coupon samples from each bar size were tested in tension to obtain
their tensile properties using a displacement-controlled testing machine. The coupon samples were
tested using an Instron UTM with capacity of 56 kips [250 kN] and stroke of 0.3 in/min (see Figure
2.11 for the utilized test setup). For accurate evaluation of the bars strain, the elongation of the
sample within their gage length were measured and recorded using a laser extensometer with a
precision of 0.0001 in [0.0025 mm]. Table 2.7 shows the summary of all measured tensile
properties of the used bars.
Table 2.7 Measured Mechanical Properties for Longitudinal Reinforcing bars.
Size Specimens Grade Yield strength, ksi
[MPa] Ult. strength, ksi
[MPa] Ult. Strain (%)
#3 All 60 69.94 [482] 102.02 [703] 16.8
#4 S12-L4 60 66.75 [460] 94.98 [655] 20.7
#5 All except S12-L4
& S12-L6 60 66.45 [458] 90.92 [627] 21.4
#6 S12-L6 60 64.85 [460] 98.65 [655] 16.1
21
Figure 2.11 Direct tension test setup for rebar samples.
2.4 Test Setup and Loading Protocol
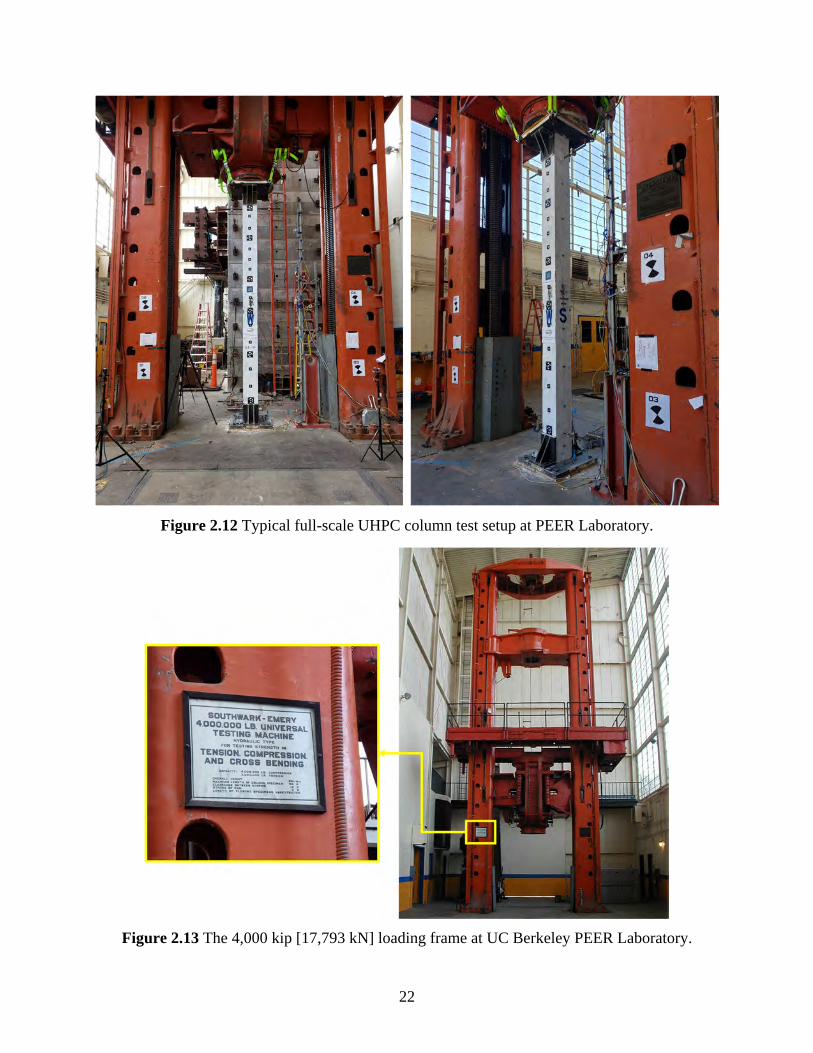
The columns were tested under concentric axial loading with the setup shown in Figure 2.12 at
UC Berkeley PEER Laboratory. A hydraulic-press loading machine (see Figure 2.13) of a 4,000-
kip [17,793 kN] capacity was used to monotonically apply concentric compressive loads to the
columns at a rate of approximately 1-kip/s [ 4.45 kN/s]. Based on the adopted loading rate, the test
of a typical column took about 45 minutes. Two steel fixtures were designed and fabricated
specifically to be attached to the columns ends as shown in Figure 2.14. The two steel fixtures
were designed to ensure that the columns were held steady in place while being tested and were
fixed to a strong floor and the loading machine head. The boundary conditions of the tested
columns were adjusted to represent an intermediate condition between a fully fixed and a fully
hinged condition and the actual condition was later evaluated according to the actual buckling
shape of the columns after being tested as discussed in next chapters. The steel fixtures were
designed to force the column to buckle in the north-south direction by using steel brackets in the
other two directions to decrease the buckling length (i.e. unsupported length) of the column. Thus,
the testing plane of the column was set to be in the north-south direction.
22
Figure 2.12 Typical full-scale UHPC column test setup at PEER Laboratory.
Figure 2.13 The 4,000 kip [17,793 kN] loading frame at UC Berkeley PEER Laboratory.

23
Figure 2.14 Test setup column head steel fixture used at both column ends.
It is noted that the column rough face, which had the concrete cast from, was intentionally put
in the out of plane test direction and was facing the east direction. This was mainly because the
column rough surface was slightly irregular and may result in slightly different column dimensions
with dimensions tolerance of 11 ± ⅛ in [280 ± 3 mm] which may affect the buckling behavior of
the column. According to the ACI 318, the column is categorized as a slender column when the
slenderness ratio of 34, for non-sway frames and no end column moments. This is
corresponding to height/depth ratio of 12, considering a 𝑘-factor (i.e. effective length factor) of
0.85 as a first estimate. For further clarification, the 𝑘-factor is assumed to be 0.5 when the two
column ends are fully fixed and assumed to be 1 when the two column ends are fully hinged, and
the connection is allowed free rotation in the test plane of the column. Accurate 𝑘-factor based on
the actual test setup was determined carefully as explained later in Chapter 4.
24
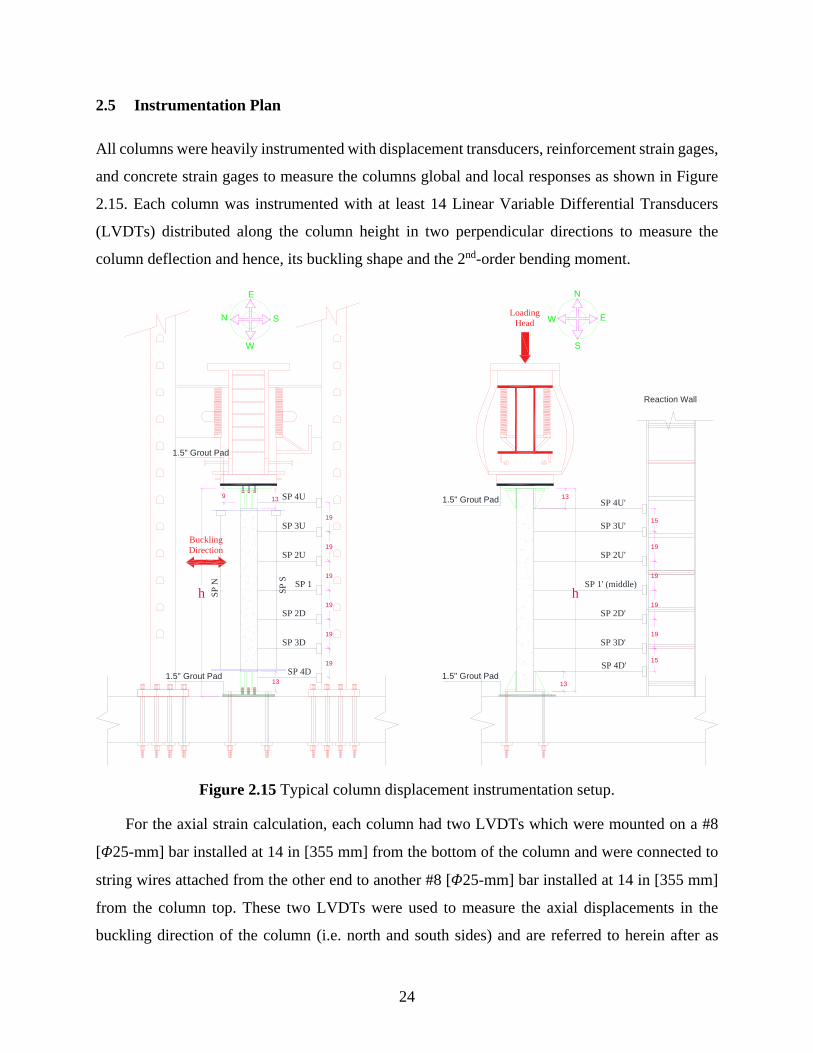
2.5 Instrumentation Plan
All columns were heavily instrumented with displacement transducers, reinforcement strain gages,
and concrete strain gages to measure the columns global and local responses as shown in Figure
2.15. Each column was instrumented with at least 14 Linear Variable Differential Transducers
(LVDTs) distributed along the column height in two perpendicular directions to measure the
column deflection and hence, its buckling shape and the 2nd-order bending moment.
Figure 2.15 Typical column displacement instrumentation setup.
For the axial strain calculation, each column had two LVDTs which were mounted on a #8
[𝛷25-mm] bar installed at 14 in [355 mm] from the bottom of the column and were connected to
string wires attached from the other end to another #8 [𝛷25-mm] bar installed at 14 in [355 mm]
from the column top. These two LVDTs were used to measure the axial displacements in the
buckling direction of the column (i.e. north and south sides) and are referred to herein after as
LoadingHead
13
13 13
1.5" Grout Pad
1.5" Grout Pad
131.5" Grout Pad
1.5" Grout Pad
hh
BucklingDirection
SP 1
SP 2U
SP 2D
SP 3D
SP 3U
SP 4D
SP 4U9
19
19
19
19
19
19
Reaction Wall
SP 1' (middle)
SP 2U'
SP 2D'
SP 3D'
SP 3U'
SP 4D'
SP 4U'
15
19
19
19
19
15
SP
N
SP
S
N
E
S
W
N
E
S
W
25
“SPN” and “SPS”, respectively. The average axial strain of the column was evaluated as the
average change of these two LVDTs values from their initial values (ΔL) and divided by the
column’s tested length (Lo), which is equal to the column height (H) subtracted by 28 in [711
mm]. The axial strains were also measured locally by installing three concrete strain gages at the
mid-height of the column and on the three different sides of the column except the rough side of
the column (i.e. East side). Each column had at least 16 reinforcement strain gages installed on the
longitudinal and transverse steel reinforcements to monitor the strains during the test as shown in
Figure 2.16. The strains were installed on three levels spaced at distance (l), depending on the
column heights, and were focused on the reinforcement strains at the column mid-height region
where the location of the maximum column deflection is expected and hence, the maximum 2nd-
order moment. The distance (l) is equal to 6 in [152 mm], 12 in [305 mm], 14 in [356 mm], 16 in
[406 mm], and 20 in [508 mm] for the columns with the (h/t) ratios of 6, 12, 14, 16, and 20,
respectively.
Figure 2.16 Locations of installed reinforcement strain gages.
26
EVALUATION OF EXPERIMENTAL RESULTS
3.1 Introduction
This chapter presents the experimental test results of all the tested UHPC columns subjected to
concentrically monotonic axial loading. The experimental results are discussed according to the
columns global and local responses. The global behavior is discussed with respect to the columns
damage pattern, load-displacement response, and the lateral displacements or buckling profiles.
Furthermore, the columns local responses are discussed with respect to their steel reinforcement
strains.
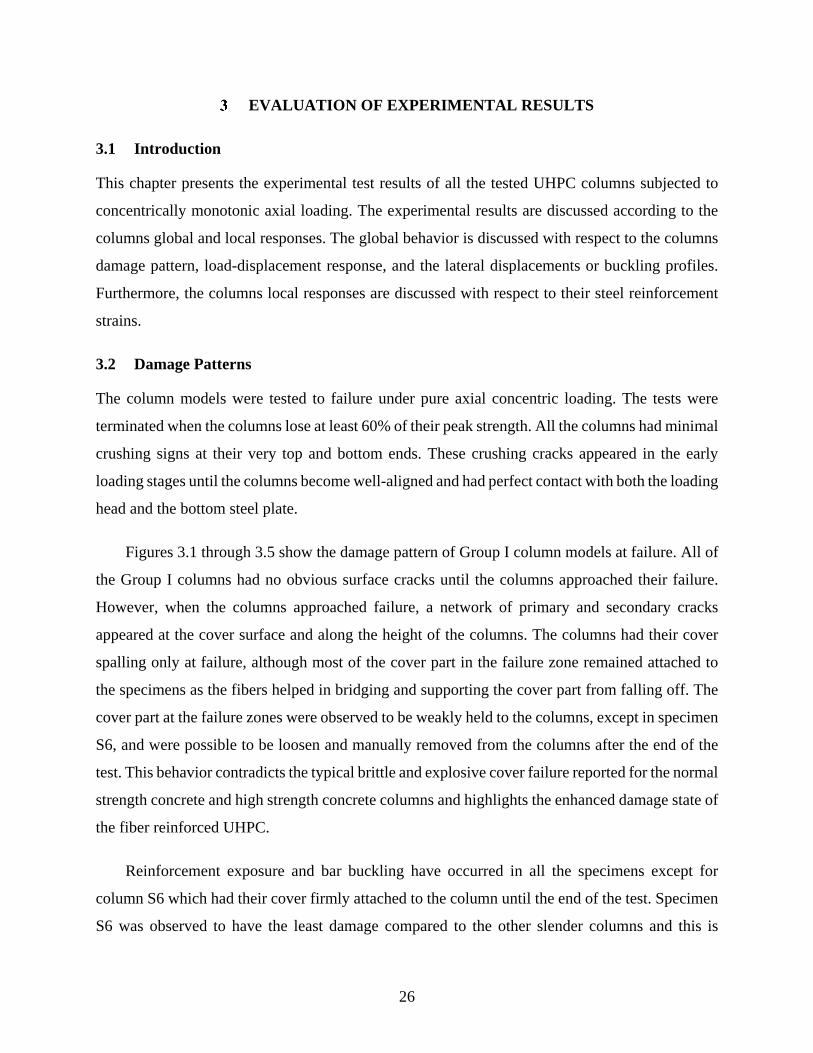
3.2 Damage Patterns
The column models were tested to failure under pure axial concentric loading. The tests were
terminated when the columns lose at least 60% of their peak strength. All the columns had minimal
crushing signs at their very top and bottom ends. These crushing cracks appeared in the early
loading stages until the columns become well-aligned and had perfect contact with both the loading
head and the bottom steel plate.
Figures 3.1 through 3.5 show the damage pattern of Group I column models at failure. All of
the Group I columns had no obvious surface cracks until the columns approached their failure.
However, when the columns approached failure, a network of primary and secondary cracks
appeared at the cover surface and along the height of the columns. The columns had their cover
spalling only at failure, although most of the cover part in the failure zone remained attached to
the specimens as the fibers helped in bridging and supporting the cover part from falling off. The
cover part at the failure zones were observed to be weakly held to the columns, except in specimen
S6, and were possible to be loosen and manually removed from the columns after the end of the
test. This behavior contradicts the typical brittle and explosive cover failure reported for the normal
strength concrete and high strength concrete columns and highlights the enhanced damage state of
the fiber reinforced UHPC.
Reinforcement exposure and bar buckling have occurred in all the specimens except for
column S6 which had their cover firmly attached to the column until the end of the test. Specimen
S6 was observed to have the least damage compared to the other slender columns and this is
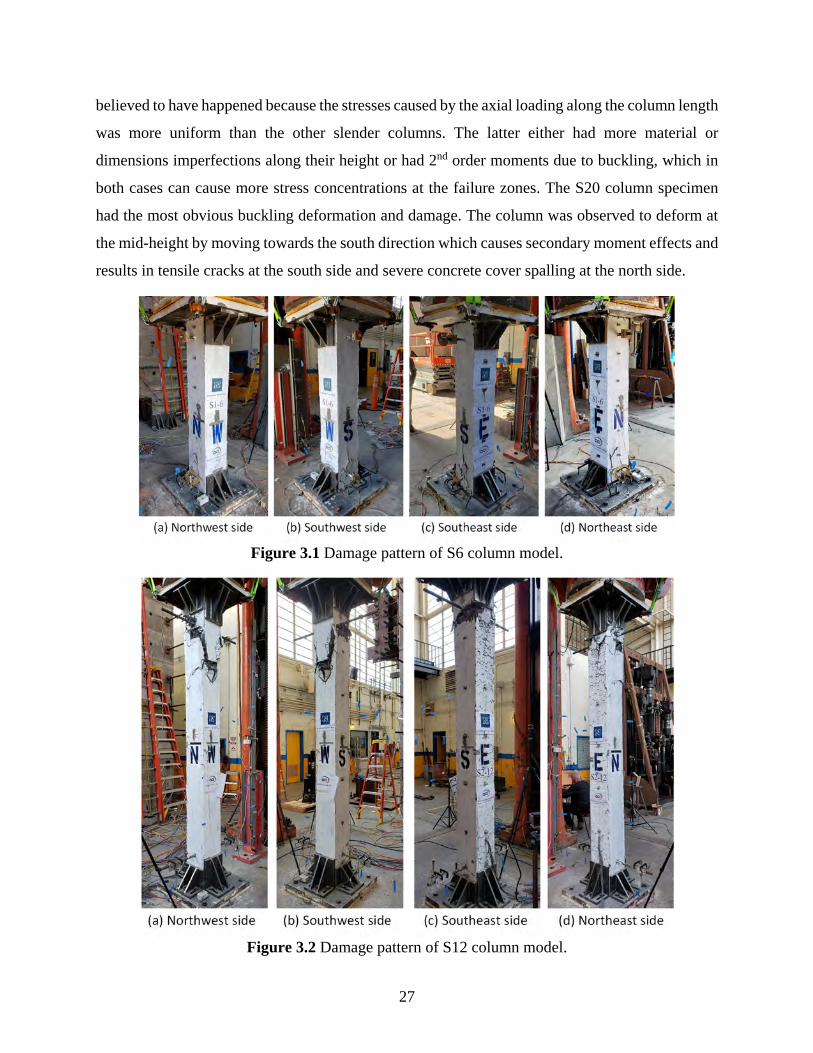
27
believed to have happened because the stresses caused by the axial loading along the column length
was more uniform than the other slender columns. The latter either had more material or
dimensions imperfections along their height or had 2nd order moments due to buckling, which in
both cases can cause more stress concentrations at the failure zones. The S20 column specimen
had the most obvious buckling deformation and damage. The column was observed to deform at
the mid-height by moving towards the south direction which causes secondary moment effects and
results in tensile cracks at the south side and severe concrete cover spalling at the north side.
Figure 3.1 Damage pattern of S6 column model.
Figure 3.2 Damage pattern of S12 column model.
28
Figure 3.3 Damage pattern of S14 column model.
Figure 3.4 Damage pattern of S16 column model.
29
Figure 3.5 Damage pattern of S20 column model.
Figures 3.5 through 3.9 show the damage pattern of Group II column models at failure except
for column S6 which was previously shown in Figure 3.1. All of the Group II columns had no
obvious surface cracks until the columns approached their failure except for S9-F1 column which
had a significant number of surface cracks appeared during the test which happened because of the
small fiber ratio which in turn resulted in less crack bridging. A network of primary and secondary
cracks appeared at the cover surface and along the height of the columns when the columns
approached failure.
The columns had their cover spalling only at failure, although most of the cover part in the
failure zone remained attached to the specimens as the fibers helped in bridging and supporting
the cover part from falling off. However, the cover part at the failure zones were observed to be
weakly held to the columns and can be manually loosen and removed from the columns at the end
of the test, except in specimen S12-H6, which had its spalled cover fell off without the need to
manually remove the spalled area. This was essentially because the S12-H6 column model had
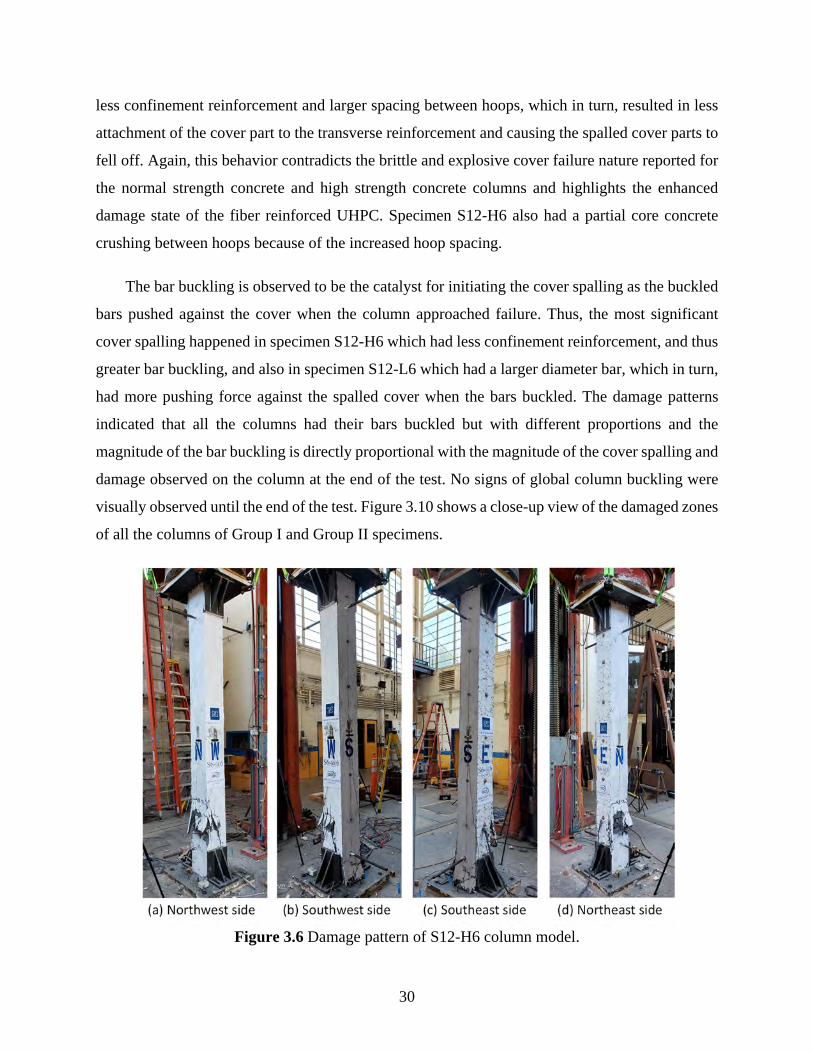
30
less confinement reinforcement and larger spacing between hoops, which in turn, resulted in less
attachment of the cover part to the transverse reinforcement and causing the spalled cover parts to
fell off. Again, this behavior contradicts the brittle and explosive cover failure nature reported for
the normal strength concrete and high strength concrete columns and highlights the enhanced
damage state of the fiber reinforced UHPC. Specimen S12-H6 also had a partial core concrete
crushing between hoops because of the increased hoop spacing.
The bar buckling is observed to be the catalyst for initiating the cover spalling as the buckled
bars pushed against the cover when the column approached failure. Thus, the most significant
cover spalling happened in specimen S12-H6 which had less confinement reinforcement, and thus
greater bar buckling, and also in specimen S12-L6 which had a larger diameter bar, which in turn,
had more pushing force against the spalled cover when the bars buckled. The damage patterns
indicated that all the columns had their bars buckled but with different proportions and the
magnitude of the bar buckling is directly proportional with the magnitude of the cover spalling and
damage observed on the column at the end of the test. No signs of global column buckling were
visually observed until the end of the test. Figure 3.10 shows a close-up view of the damaged zones
of all the columns of Group I and Group II specimens.
Figure 3.6 Damage pattern of S12-H6 column model.
31
Figure 3.7 Damage pattern of S12-L4 column model.
Figure 3.8 Damage pattern of S12-L6 column model.
32
Figure 3.9 Damage pattern of S12-F1 column model.
Figure 3.10 Damage close-up view for all Group I and Group II columns.
33
3.3 Axial Load-strain Relationship
General
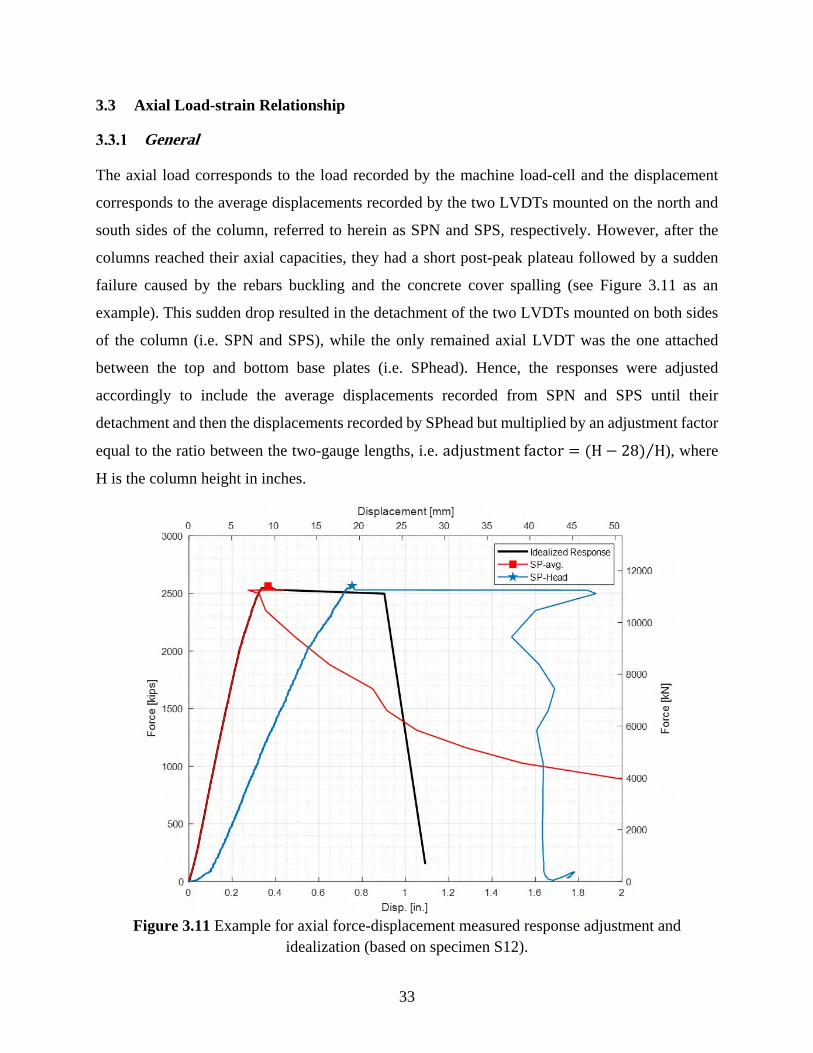
The axial load corresponds to the load recorded by the machine load-cell and the displacement
corresponds to the average displacements recorded by the two LVDTs mounted on the north and
south sides of the column, referred to herein as SPN and SPS, respectively. However, after the
columns reached their axial capacities, they had a short post-peak plateau followed by a sudden
failure caused by the rebars buckling and the concrete cover spalling (see Figure 3.11 as an
example). This sudden drop resulted in the detachment of the two LVDTs mounted on both sides
of the column (i.e. SPN and SPS), while the only remained axial LVDT was the one attached
between the top and bottom base plates (i.e. SPhead). Hence, the responses were adjusted
accordingly to include the average displacements recorded from SPN and SPS until their
detachment and then the displacements recorded by SPhead but multiplied by an adjustment factor
equal to the ratio between the two-gauge lengths, i.e. adjustment factor H 28 H⁄ ), where
H is the column height in inches.
Figure 3.11 Example for axial force-displacement measured response adjustment and
idealization (based on specimen S12).
34
A response idealization was also made to the post-peak response of all the columns to omit
the noise recorded data found in the SPhead readings because of the sudden failure of the column,
which is observed in the unadjusted load-displacement response as a sudden increase in the strain
readings a certain load level. This adjustment is however approximate to approach the post-peak
load displacement behavior, but it is still acceptable approach because there are no design codes
concerned with the axial columns behavior under this level of column deformation and load. Figure
3.11 shows an example of how the load-displacement response is adjusted for specimen S12.
Group I Results
The experimental results of the axial force-strain responses of Group I specimens are shown in
Figures 3.12 through Figure 3.14 and summarized in Table 3.1. The parameters used to summarize
the behavior of the specimens are as following: the maximum axial load (𝑝 ); the ratio of the
maximum force to the concrete strength multiplied by the column cross-sectional area
(𝑝 𝑓′ 𝐴⁄ ), termed the normalized maximum force hereafter; the axial strain corresponding
to the maximum axial force (𝜀 ); the ultimate axial strain of the column at the onset of failure
(𝜀 ).
Table 3.1 Summary of the axial force-strain results for Group I specimens.
Column ID 𝑝 , kips [kN] 𝑝 𝑓′ 𝐴⁄ 𝜀 (%) 𝜀 (%) 𝜀 𝜀⁄
S6 2,198 0.9 0.284 0.303 1.07
S12 2,565 0.82 0.351 0.389 1.11
S14 2,419 0.8 0.306 0.34 1.11
S16 2,317 0.74 0.279 0.317 1.14
S20 2,193 0.71 0.268 0.282 1.05
Figure 3.12 shows the experimental load-displacement response of all of Group I specimens.
For convenience, the axial load-strain response of each of the slender columns is compared directly
to the response of the short column (i.e. specimen S6) in Figure 3.13. The load-strain responses
are shown until the sudden failure happened. For comparison purpose, the normalized load-strain
responses of all the columns are shown in Figure 3.14. The columns loads were normalized

35
according to their corresponding UHPC compressive strength multiplied by the cross-sectional
area of the column to eliminate the effect of the concrete strength variations between the columns.
Figure 3.12 Axial force-displacement responses for Group I columns.
0 0.5 1 1.5
Disp. [in.]
0
500
1000
1500
2000
2500
3000
For
ce [k
ips]
S6
0 5 10 15 20 25 30 35
Displacement [mm]
0
2000
4000
6000
8000
10000
12000
For
ce [k
N]
0 0.5 1 1.5
Disp. [in.]
0
500
1000
1500
2000
2500
3000
Fo
rce
[kip
s]
S12
0 5 10 15 20 25 30 35
Displacement [mm]
0
2000
4000
6000
8000
10000
12000
For
ce [
kN]
0 0.5 1 1.5
Disp. [in.]
0
500
1000
1500
2000
2500
3000
For
ce [k
ips]
S14
0 5 10 15 20 25 30 35
Displacement [mm]
0
2000
4000
6000
8000
10000
12000
For
ce [k
N]
0 0.5 1 1.5
Disp. [in.]
0
500
1000
1500
2000
2500
3000
For
ce [k
ips]
S16
0 5 10 15 20 25 30 35
Displacement [mm]
0
2000
4000
6000
8000
10000
12000
Fo
rce
[kN
]
0 0.5 1 1.5
Disp. [in.]
0
500
1000
1500
2000
2500
3000
For
ce [k
ips]
S20
0 5 10 15 20 25 30 35
Displacement [mm]
0
2000
4000
6000
8000
10000
12000
For
ce [k
N]
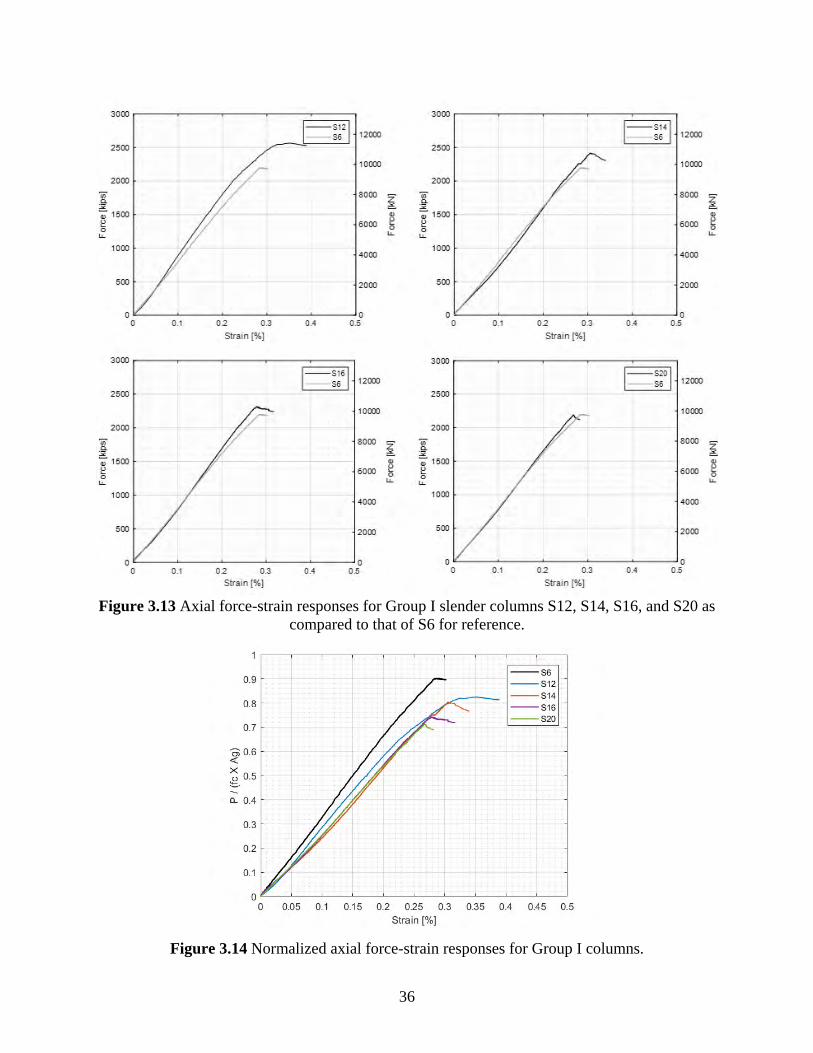
36
Figure 3.13 Axial force-strain responses for Group I slender columns S12, S14, S16, and S20 as
compared to that of S6 for reference.
Figure 3.14 Normalized axial force-strain responses for Group I columns.
37
Based on the axial force-displacement experimental responses obtained for Group I columns
which are summarized in the previous Figures 3.12 through 3.14 and Table 3.1, some observations
were obtained as discussed in the following paragraphs to investigate the slenderness effect on the
behavior of the UHPC columns. The column slenderness ratio was found to have a great effect on
the axial load strength of the UHPC columns as observed from Table 3.1. The normalized axial
strength of specimen S6 (i.e. the column with h/t ratio of 6) is 0.9. However, it decreased to 0.71
(i.e. 21% reduction from S6) when the slenderness ratio increased in specimen S20 (i.e. the column
with h/t ratio of 20). It is observed that all the columns with the different slenderness ratios between
6 and 20 have followed the same trend. Although no buckling effects were observed in the columns
with height to depth ratios of 12 and 14 (i.e. specimens S12 and S14), their normalized axial
strengths were still less than S6, i.e. 0.82 and 0.80, which are about 9% and 11% less than that of
the short column S6, respectively. Thus, it can be concluded that in UHPC columns, no matter
whether severe or obvious buckling has occurred or not, the columns axial capacities will decrease
with the increase of their slenderness ratio.
Comparing the ultimate and peak strains of Group I columns, it is observed that by increasing
the slenderness ratio of the UHPC columns, whether they buckled or not, their ultimate and peak
strains will decrease. For example, specimen S12 (i.e., h/t ratio of 12) had an ultimate and peak
strains of 0.351 and 0.389, respectively, while specimen S20 (i.e., h/t ratio of 20) had an ultimate
and peak strains of 0.268 and 0.282 which are less than those of specimen S12 by about 24% and
28%, respectively. This observation was not only applicable to specimen S6 because it had the
least UHPC compressive strength which in turn corresponded to lower strain values.
The UHPC columns of Group I were observed to have a post-peak plateau after reaching their
axial capacities and before having their sudden failure. On the post-peak plateau, the columns were
observed to keep at least 95% of their axial capacities until having their sudden failure and losing
almost all of their capacities. The post-peak plateau of the UHPC columns can be judged by the
calculated ratio of the ultimate strain to the peak strain. This ratio was almost constant for
specimens S12, S14, and S16 which had no observed or minimal buckling and was found to be
equal to 1.12, on average. This means that the columns with no observed buckling can keep at least
95% of their axial capacities for about 12% of their peak strain after reaching their axial capacities.
Although specimen S6 had no observed buckling, its ratio of the ultimate strain to the peak strain
38
was 1.07, which is a little less than that in the other columns. This is mainly because specimen S6
had the lowest UHPC strength among all the specimens which reflects lower strain values and
least UHPC quality among all mixed batches as explained before. The only column with observed
buckling (i.e. S20 which was the column with the highest slenderness ratio) was found to have the
least ultimate to peak strain ratio of 1.05, which means that the buckling played an important role
in decreasing the post-peak plateau of the UHPC columns and resulted in a less ductile behavior.
Comparing the ratio of the ultimate strain to the peak strain, it is observed that the post-peak plateau
is independent of the columns slenderness ratio as long as the columns did not buckle.
As shown in Figure 3.14, the normalized force-strain response of Group I columns were
compared together independent from the variation in the UHPC compressive strength due to the
suggested normalization. It is observed that the response of specimen S6 was much stiffer than the
other slender columns. However, the stiffness of S14, S16 and S20 specimens, were very close to
each other and were a little less than that of specimen S12. This concludes that by increasing the
column slenderness ratio, the axial stiffness of the column decreases. Nevertheless, once the height
to depth ratio of the UHPC column is equal to or greater than 14, the column axial stiffness seems
to remain unaffected.
Group II Results
Figure 3.15 shows the experimental load-displacement response of all of Group II specimens. For
convenience, the axial load-strain responses of the different columns in this group are shown along
with the response of the control column (i.e. specimen S12) until the sudden failure happen in
Figure 3.16. For comparison purpose, the normalized load-strain responses of all the columns are
shown in Figure 3.17. The columns maximum loads were normalized according to their
corresponding UHPC compressive strength multiplied by the cross-sectional area of the column
to eliminate the effect of the concrete strength variations between the columns. The experimental
results of the axial force-strain responses of Group II specimens are summarized in Table 3.2. The
parameters used to summarize the behavior of the specimens are as following: the maximum axial
load (𝑝 ); the ratio of the maximum force to the concrete strength multiplied by the column
cross-sectional area (𝑝 𝑓′ 𝐴⁄ ), termed the normalized maximum force hereafter; the axial
strain corresponding to the maximum axial force (𝜀 ); the ultimate axial strain of the column at
the onset of failure (𝜀 ).

39
Figure 3.15 Axial force-displacement responses for Group II columns.
0 0.5 1 1.5
Disp. [in.]
0
500
1000
1500
2000
2500
3000
For
ce [k
ips]
S12
0 5 10 15 20 25 30 35
Displacement [mm]
0
2000
4000
6000
8000
10000
12000
For
ce [k
N]
For
ce [k
ips]
For
ce [
kN]
For
ce [k
ips]
For
ce [k
N]
For
ce [k
ips]
For
ce [k
N]
For
ce [k
ips]
For
ce [k
N]

40
Figure 3.16 Axial force-strain responses for Group II columns with varying reinforcement
details as compared to control specimen S12.
Figure 3.17 Normalized axial force-strain responses for Group II columns.
For
ce [k
ips]
For
ce [k
N]
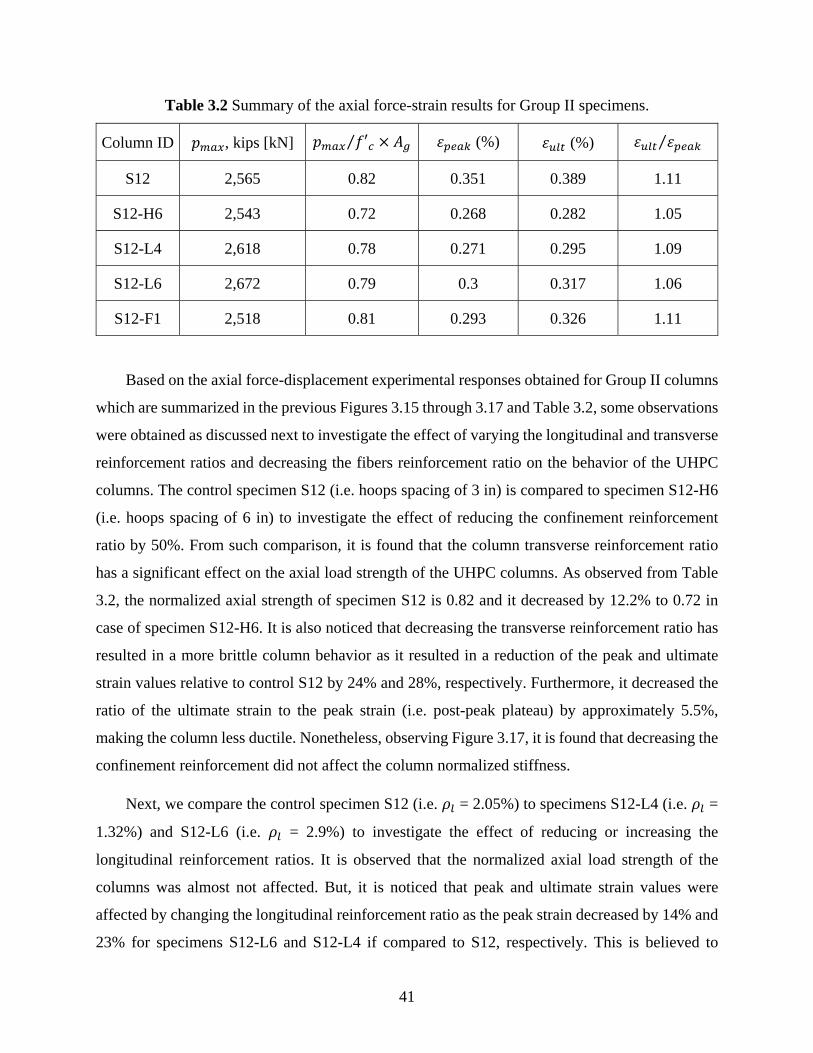
41
Table 3.2 Summary of the axial force-strain results for Group II specimens.
Column ID 𝑝 , kips [kN] 𝑝 𝑓′ 𝐴⁄ 𝜀 (%) 𝜀 (%) 𝜀 𝜀⁄
S12 2,565 0.82 0.351 0.389 1.11
S12-H6 2,543 0.72 0.268 0.282 1.05
S12-L4 2,618 0.78 0.271 0.295 1.09
S12-L6 2,672 0.79 0.3 0.317 1.06
S12-F1 2,518 0.81 0.293 0.326 1.11
Based on the axial force-displacement experimental responses obtained for Group II columns
which are summarized in the previous Figures 3.15 through 3.17 and Table 3.2, some observations
were obtained as discussed next to investigate the effect of varying the longitudinal and transverse
reinforcement ratios and decreasing the fibers reinforcement ratio on the behavior of the UHPC
columns. The control specimen S12 (i.e. hoops spacing of 3 in) is compared to specimen S12-H6
(i.e. hoops spacing of 6 in) to investigate the effect of reducing the confinement reinforcement
ratio by 50%. From such comparison, it is found that the column transverse reinforcement ratio
has a significant effect on the axial load strength of the UHPC columns. As observed from Table
3.2, the normalized axial strength of specimen S12 is 0.82 and it decreased by 12.2% to 0.72 in
case of specimen S12-H6. It is also noticed that decreasing the transverse reinforcement ratio has
resulted in a more brittle column behavior as it resulted in a reduction of the peak and ultimate
strain values relative to control S12 by 24% and 28%, respectively. Furthermore, it decreased the
ratio of the ultimate strain to the peak strain (i.e. post-peak plateau) by approximately 5.5%,
making the column less ductile. Nonetheless, observing Figure 3.17, it is found that decreasing the
confinement reinforcement did not affect the column normalized stiffness.
Next, we compare the control specimen S12 (i.e. 𝜌 = 2.05%) to specimens S12-L4 (i.e. 𝜌 =
1.32%) and S12-L6 (i.e. 𝜌 = 2.9%) to investigate the effect of reducing or increasing the
longitudinal reinforcement ratios. It is observed that the normalized axial load strength of the
columns was almost not affected. But, it is noticed that peak and ultimate strain values were
affected by changing the longitudinal reinforcement ratio as the peak strain decreased by 14% and
23% for specimens S12-L6 and S12-L4 if compared to S12, respectively. This is believed to

42
happen because the UHPC test-day strength of specimens S12-L6 and S12-L4 were greater than
that of S12 as they were tested approximately 4 months after S12 (a COVID-19 impact). Thus, a
higher UHPC strength leads to a higher column stiffness which in turn, leads to less peak and
ultimate strain values for similar column size. The ratio of the ultimate strain to the peak strain
(i.e. post-peak plateau) remained approximately unaffected by comparing specimen S12 and
specimen S12-L4, but it decreased in specimen S12-L6 by 4.5%. This is again can be attributed to
the larger bar diameter that leads to a more aggressive bar buckling in initiating and aggravating
the columns concrete cover spalling. Nonetheless, observing Figure 3.17, it is found that
decreasing or increasing the columns longitudinal reinforcement ratio did not affect the column
normalized stiffness.
Comparing the control specimen S12 (i.e., 𝜌 = 2%) to specimen S12-F1 (i.e., 𝜌 = 1%) to
investigate the effect of reducing the fiber reinforcement ratio, it is observed that the normalized
axial load strength of the column was not affected. However, it is noticed that peak and ultimate
strain values were affected as their values, if compared to S12, decreased by approximately 16%.
Considering that both columns had almost the same UHPC strength, this drop in the strain values
are observed because of the reduction in fiber reinforcement ratio, which in turn, resulted in less
confinement and less crack bridging effect and accordingly less peak strain value. Furthermore,
the ratio of the ultimate strain to the peak strain (i.e. post-peak plateau) remained unaffected by
comparing specimen S12 and specimen S12-F1. But again, looking at Figure 3.17, it is found that
decreasing fiber reinforcement ratio did not affect the column normalized stiffness.
3.4 Axial Stiffness and Modulus of Elasticity
The axial stiffness of the column can be determined from the experimental results of the force-
displacement responses of the columns as shown in Figures 3.12 and 3.15 for Group I and Group
II columns, respectively. The columns axial stiffness is basically the initial slope of the force-
displacement responses of the columns. The axial stiffness can be determined using two methods.
The first method defines the axial stiffness as the slope of the best-fit linear approximation of the
load-displacement response to the peak strength, namely the secant modulus and referred to as 𝐾
hereafter. The second method defines the axial stiffness as the slope of the best-fit linear
approximation of the load-displacement response from 10 to 30 percent of the axial load capacity
of each individual column, namely the tangent modulus and referred to as 𝐾 hereafter. The latter
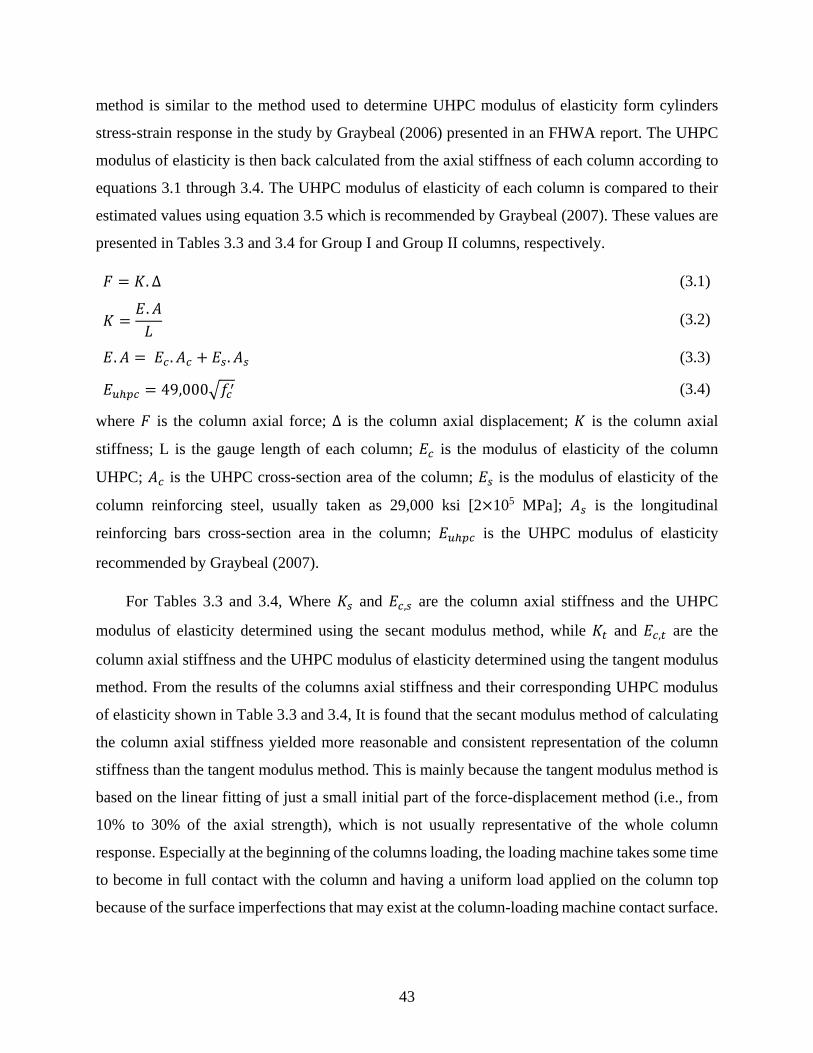
43
method is similar to the method used to determine UHPC modulus of elasticity form cylinders
stress-strain response in the study by Graybeal (2006) presented in an FHWA report. The UHPC
modulus of elasticity is then back calculated from the axial stiffness of each column according to
equations 3.1 through 3.4. The UHPC modulus of elasticity of each column is compared to their
estimated values using equation 3.5 which is recommended by Graybeal (2007). These values are
presented in Tables 3.3 and 3.4 for Group I and Group II columns, respectively.
𝐹 𝐾.∆ (3.1)
𝐾𝐸.𝐴𝐿
(3.2)
𝐸.𝐴 𝐸 .𝐴 𝐸 .𝐴 (3.3)
𝐸 49,000 𝑓 (3.4)
where 𝐹 is the column axial force; ∆ is the column axial displacement; 𝐾 is the column axial
stiffness; L is the gauge length of each column; 𝐸 is the modulus of elasticity of the column
UHPC; 𝐴 is the UHPC cross-section area of the column; 𝐸 is the modulus of elasticity of the
column reinforcing steel, usually taken as 29,000 ksi [2 105 MPa]; 𝐴 is the longitudinal
reinforcing bars cross-section area in the column; 𝐸 is the UHPC modulus of elasticity
recommended by Graybeal (2007).
For Tables 3.3 and 3.4, Where 𝐾 and 𝐸 , are the column axial stiffness and the UHPC
modulus of elasticity determined using the secant modulus method, while 𝐾 and 𝐸 , are the
column axial stiffness and the UHPC modulus of elasticity determined using the tangent modulus
method. From the results of the columns axial stiffness and their corresponding UHPC modulus
of elasticity shown in Table 3.3 and 3.4, It is found that the secant modulus method of calculating
the column axial stiffness yielded more reasonable and consistent representation of the column
stiffness than the tangent modulus method. This is mainly because the tangent modulus method is
based on the linear fitting of just a small initial part of the force-displacement method (i.e., from
10% to 30% of the axial strength), which is not usually representative of the whole column
response. Especially at the beginning of the columns loading, the loading machine takes some time
to become in full contact with the column and having a uniform load applied on the column top
because of the surface imperfections that may exist at the column-loading machine contact surface.
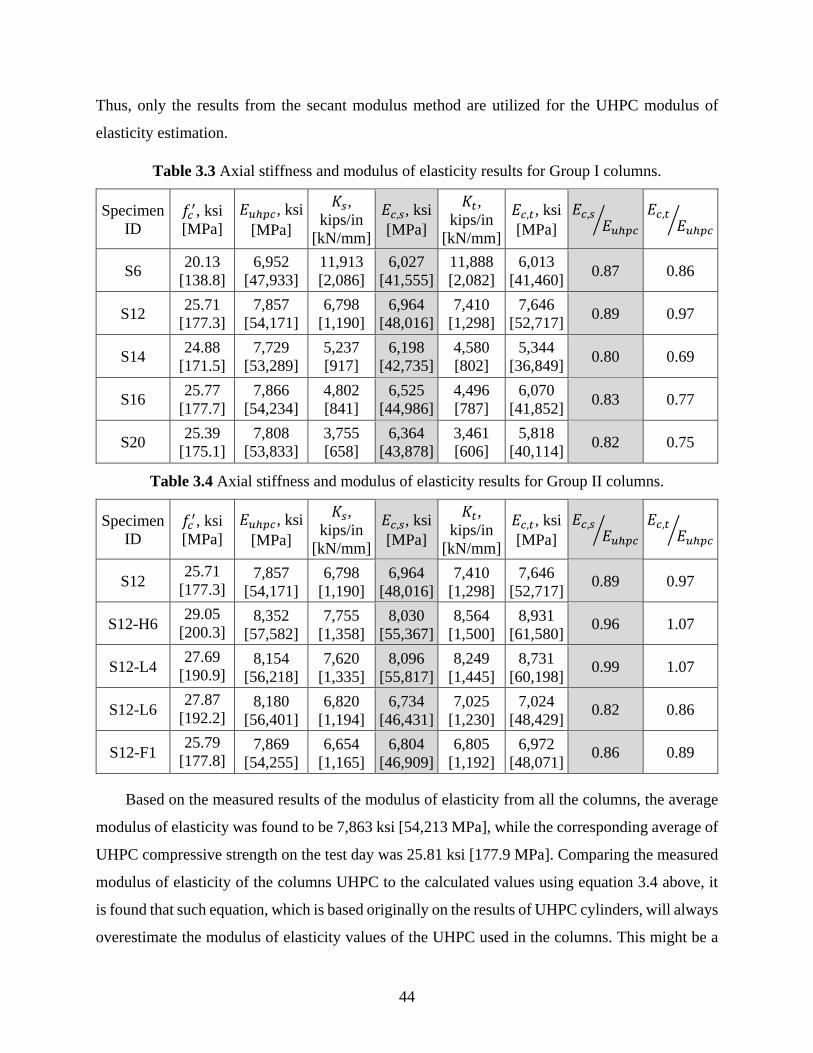
44
Thus, only the results from the secant modulus method are utilized for the UHPC modulus of
elasticity estimation.
Table 3.3 Axial stiffness and modulus of elasticity results for Group I columns.
Specimen ID
𝑓 , ksi [MPa]
𝐸 , ksi [MPa]
𝐾 , kips/in
[kN/mm]
𝐸 , , ksi [MPa]
𝐾 , kips/in
[kN/mm]
𝐸 , , ksi [MPa]
𝐸 ,𝐸
𝐸 ,𝐸
S6 20.13
[138.8] 6,952
[47,933] 11,913 [2,086]
6,027 [41,555]
11,888 [2,082]
6,013 [41,460]
0.87 0.86
S12 25.71
[177.3] 7,857
[54,171] 6,798
[1,190] 6,964
[48,016] 7,410
[1,298] 7,646
[52,717] 0.89 0.97
S14 24.88
[171.5] 7,729
[53,289] 5,237 [917]
6,198 [42,735]
4,580 [802]
5,344 [36,849]
0.80 0.69
S16 25.77
[177.7] 7,866
[54,234] 4,802 [841]
6,525 [44,986]
4,496 [787]
6,070 [41,852]
0.83 0.77
S20 25.39
[175.1] 7,808
[53,833] 3,755 [658]
6,364 [43,878]
3,461 [606]
5,818 [40,114]
0.82 0.75
Table 3.4 Axial stiffness and modulus of elasticity results for Group II columns.
Specimen ID
𝑓 , ksi [MPa]
𝐸 , ksi [MPa]
𝐾 , kips/in
[kN/mm]
𝐸 , , ksi [MPa]
𝐾 , kips/in
[kN/mm]
𝐸 , , ksi [MPa]
𝐸 ,𝐸
𝐸 ,𝐸
S12 25.71
[177.3] 7,857
[54,171] 6,798
[1,190] 6,964
[48,016] 7,410
[1,298] 7,646
[52,717] 0.89 0.97
S12-H6 29.05
[200.3] 8,352
[57,582] 7,755
[1,358] 8,030
[55,367] 8,564
[1,500] 8,931
[61,580] 0.96 1.07
S12-L4 27.69
[190.9] 8,154
[56,218] 7,620
[1,335] 8,096
[55,817] 8,249
[1,445] 8,731
[60,198] 0.99 1.07
S12-L6 27.87
[192.2] 8,180
[56,401] 6,820
[1,194] 6,734
[46,431] 7,025
[1,230] 7,024
[48,429] 0.82 0.86
S12-F1 25.79
[177.8] 7,869
[54,255] 6,654
[1,165] 6,804
[46,909] 6,805
[1,192] 6,972
[48,071] 0.86 0.89
Based on the measured results of the modulus of elasticity from all the columns, the average
modulus of elasticity was found to be 7,863 ksi [54,213 MPa], while the corresponding average of
UHPC compressive strength on the test day was 25.81 ksi [177.9 MPa]. Comparing the measured
modulus of elasticity of the columns UHPC to the calculated values using equation 3.4 above, it
is found that such equation, which is based originally on the results of UHPC cylinders, will always
overestimate the modulus of elasticity values of the UHPC used in the columns. This might be a
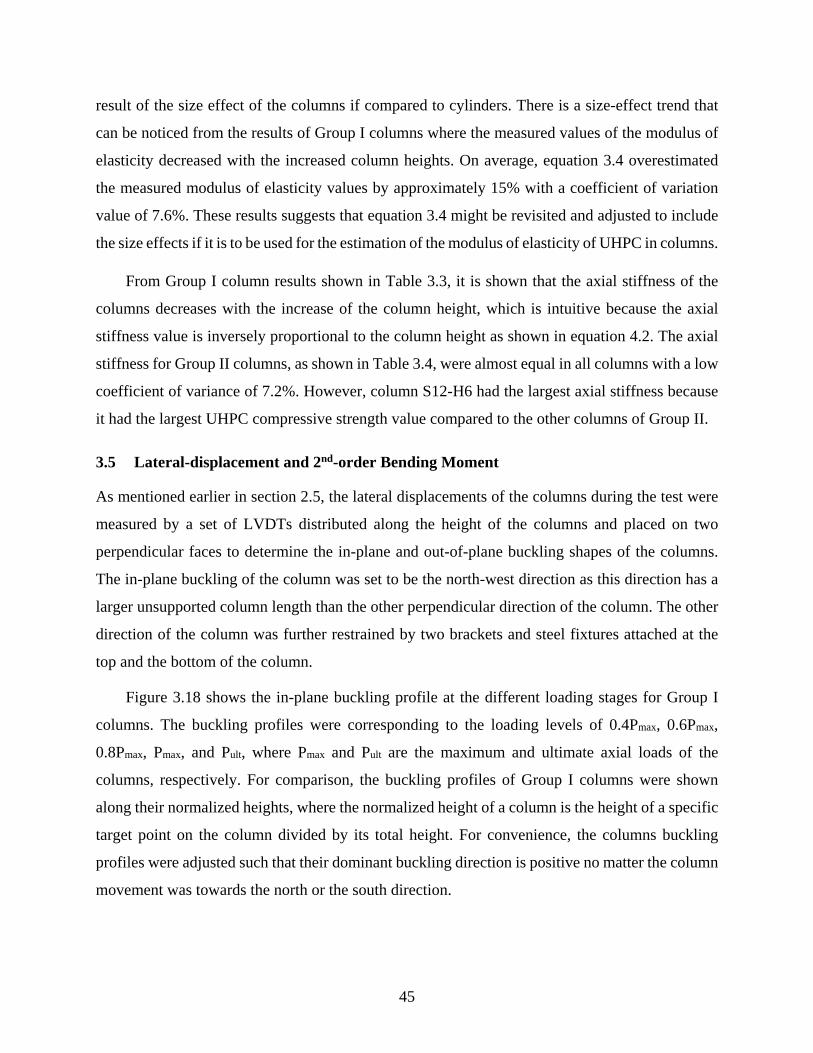
45
result of the size effect of the columns if compared to cylinders. There is a size-effect trend that
can be noticed from the results of Group I columns where the measured values of the modulus of
elasticity decreased with the increased column heights. On average, equation 3.4 overestimated
the measured modulus of elasticity values by approximately 15% with a coefficient of variation
value of 7.6%. These results suggests that equation 3.4 might be revisited and adjusted to include
the size effects if it is to be used for the estimation of the modulus of elasticity of UHPC in columns.
From Group I column results shown in Table 3.3, it is shown that the axial stiffness of the
columns decreases with the increase of the column height, which is intuitive because the axial
stiffness value is inversely proportional to the column height as shown in equation 4.2. The axial
stiffness for Group II columns, as shown in Table 3.4, were almost equal in all columns with a low
coefficient of variance of 7.2%. However, column S12-H6 had the largest axial stiffness because
it had the largest UHPC compressive strength value compared to the other columns of Group II.
3.5 Lateral-displacement and 2nd-order Bending Moment
As mentioned earlier in section 2.5, the lateral displacements of the columns during the test were
measured by a set of LVDTs distributed along the height of the columns and placed on two
perpendicular faces to determine the in-plane and out-of-plane buckling shapes of the columns.
The in-plane buckling of the column was set to be the north-west direction as this direction has a
larger unsupported column length than the other perpendicular direction of the column. The other
direction of the column was further restrained by two brackets and steel fixtures attached at the
top and the bottom of the column.
Figure 3.18 shows the in-plane buckling profile at the different loading stages for Group I
columns. The buckling profiles were corresponding to the loading levels of 0.4Pmax, 0.6Pmax,
0.8Pmax, Pmax, and Pult, where Pmax and Pult are the maximum and ultimate axial loads of the
columns, respectively. For comparison, the buckling profiles of Group I columns were shown
along their normalized heights, where the normalized height of a column is the height of a specific
target point on the column divided by its total height. For convenience, the columns buckling
profiles were adjusted such that their dominant buckling direction is positive no matter the column
movement was towards the north or the south direction.
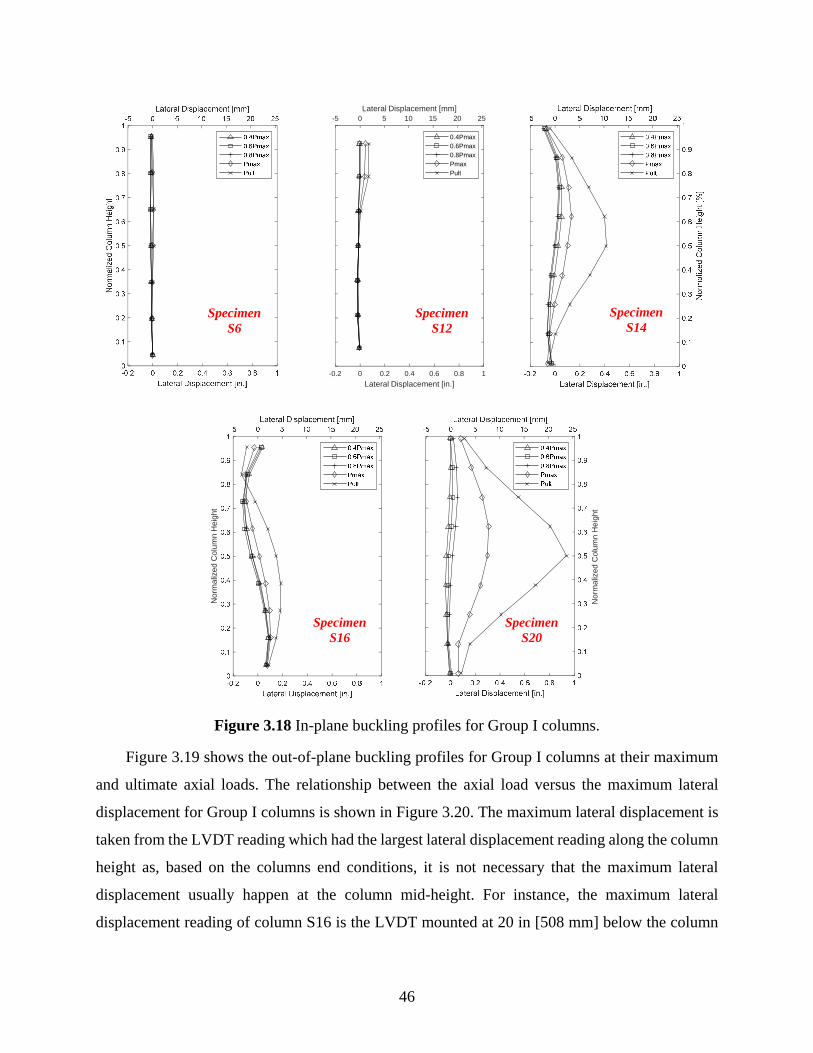
46
Figure 3.18 In-plane buckling profiles for Group I columns.
Figure 3.19 shows the out-of-plane buckling profiles for Group I columns at their maximum
and ultimate axial loads. The relationship between the axial load versus the maximum lateral
displacement for Group I columns is shown in Figure 3.20. The maximum lateral displacement is
taken from the LVDT reading which had the largest lateral displacement reading along the column
height as, based on the columns end conditions, it is not necessary that the maximum lateral
displacement usually happen at the column mid-height. For instance, the maximum lateral
displacement reading of column S16 is the LVDT mounted at 20 in [508 mm] below the column
-0.2 0 0.2 0.4 0.6 0.8 1
Lateral Displacement [in.]
0.4Pmax0.6Pmax0.8PmaxPmaxPult
-5 0 5 10 15 20 25Lateral Displacement [mm]
No
rma
lize
d C
olu
mn
He
igh
t
No
rmal
ized
Col
um
n H
eigh
t
Specimen S6
Specimen S12
Specimen S14
Specimen S16
Specimen S20
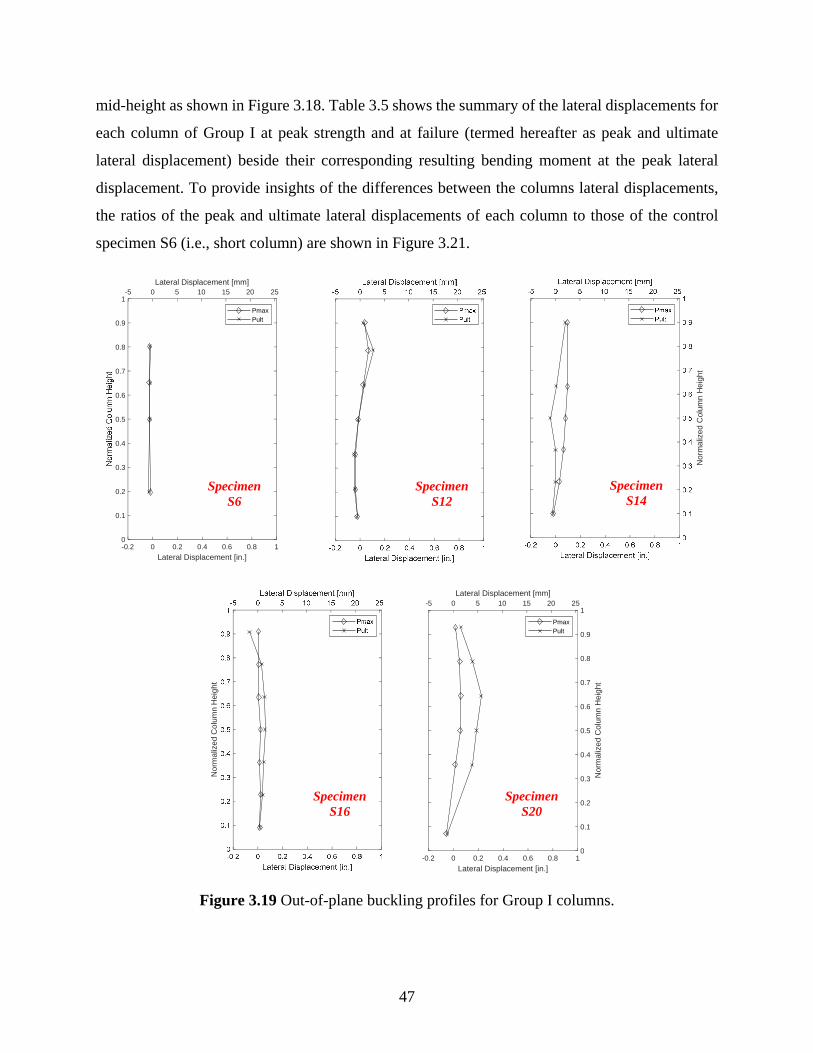
47
mid-height as shown in Figure 3.18. Table 3.5 shows the summary of the lateral displacements for
each column of Group I at peak strength and at failure (termed hereafter as peak and ultimate
lateral displacement) beside their corresponding resulting bending moment at the peak lateral
displacement. To provide insights of the differences between the columns lateral displacements,
the ratios of the peak and ultimate lateral displacements of each column to those of the control
specimen S6 (i.e., short column) are shown in Figure 3.21.
Figure 3.19 Out-of-plane buckling profiles for Group I columns.
-0.2 0 0.2 0.4 0.6 0.8 1
Lateral Displacement [in.]
0
0.1
0.2
0.3
0.4
0.5
0.6
0.7
0.8
0.9
1
PmaxPult
-5 0 5 10 15 20 25Lateral Displacement [mm]
Nor
mal
ized
Col
umn
He
igh
t
No
rma
lize
d C
olu
mn
He
igh
t
-0.2 0 0.2 0.4 0.6 0.8 1
Lateral Displacement [in.]
PmaxPult
-5 0 5 10 15 20 25Lateral Displacement [mm]
0
0.1
0.2
0.3
0.4
0.5
0.6
0.7
0.8
0.9
1
No
rma
lized
Co
lum
n H
eig
ht
Specimen S6
Specimen S12
Specimen S14
Specimen S16
Specimen S20
48
Figure 3.20 Axial load versus maximum lateral displacement for Group I columns.
Figure 3.21 Comparison of the lateral displacements for Group I columns.
Table 3.5 Summary of the peak and ultimate lateral displacements for Group I columns.
Specimen ID
𝑝 , kips [kN]
𝑀 , kips-in [kN-m]
𝛿 , in [mm] 𝛿 , in [mm]
S6 2,198 [9,777] 15.4 [1.7] 0.007 [0.18] 0.014 [0.36]
S12 2,565 [11,410] 61.6 [7.0] 0.024 [0.61] 0.029 [0.74]
S14 2,419 [10,760] 316.9 [25.8] 0.131 [3.33] 0.413 [10.5]
S16 2,317 [10,307] 245.6 [27.7] 0.106 [2.69] 0.186 [4.72]
S20 2,193 [9,755] 660.1 [74.5] 0.301 [7.64] 0.937 [23.8]
For
ce [
kips
]
For
ce [
kN]
13.4
18.715.1
43
S6 S12 S14 S16 S200
10
20
30
40
50
60
70
1 2.1
29.5
13.3
66.9
S6 S12 S14 S16 S200
10
20
30
40
50
60
70
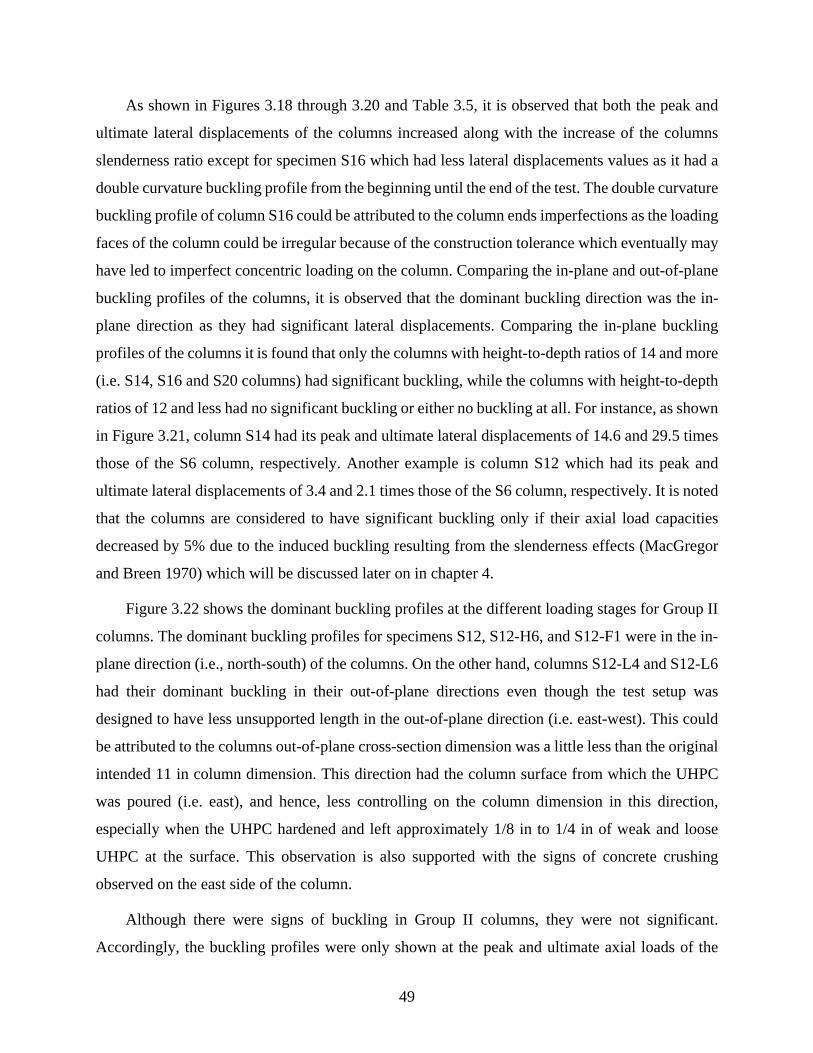
49
As shown in Figures 3.18 through 3.20 and Table 3.5, it is observed that both the peak and
ultimate lateral displacements of the columns increased along with the increase of the columns
slenderness ratio except for specimen S16 which had less lateral displacements values as it had a
double curvature buckling profile from the beginning until the end of the test. The double curvature
buckling profile of column S16 could be attributed to the column ends imperfections as the loading
faces of the column could be irregular because of the construction tolerance which eventually may
have led to imperfect concentric loading on the column. Comparing the in-plane and out-of-plane
buckling profiles of the columns, it is observed that the dominant buckling direction was the in-
plane direction as they had significant lateral displacements. Comparing the in-plane buckling
profiles of the columns it is found that only the columns with height-to-depth ratios of 14 and more
(i.e. S14, S16 and S20 columns) had significant buckling, while the columns with height-to-depth
ratios of 12 and less had no significant buckling or either no buckling at all. For instance, as shown
in Figure 3.21, column S14 had its peak and ultimate lateral displacements of 14.6 and 29.5 times
those of the S6 column, respectively. Another example is column S12 which had its peak and
ultimate lateral displacements of 3.4 and 2.1 times those of the S6 column, respectively. It is noted
that the columns are considered to have significant buckling only if their axial load capacities
decreased by 5% due to the induced buckling resulting from the slenderness effects (MacGregor
and Breen 1970) which will be discussed later on in chapter 4.
Figure 3.22 shows the dominant buckling profiles at the different loading stages for Group II
columns. The dominant buckling profiles for specimens S12, S12-H6, and S12-F1 were in the in-
plane direction (i.e., north-south) of the columns. On the other hand, columns S12-L4 and S12-L6
had their dominant buckling in their out-of-plane directions even though the test setup was
designed to have less unsupported length in the out-of-plane direction (i.e. east-west). This could
be attributed to the columns out-of-plane cross-section dimension was a little less than the original
intended 11 in column dimension. This direction had the column surface from which the UHPC
was poured (i.e. east), and hence, less controlling on the column dimension in this direction,
especially when the UHPC hardened and left approximately 1/8 in to 1/4 in of weak and loose
UHPC at the surface. This observation is also supported with the signs of concrete crushing
observed on the east side of the column.
Although there were signs of buckling in Group II columns, they were not significant.
Accordingly, the buckling profiles were only shown at the peak and ultimate axial loads of the
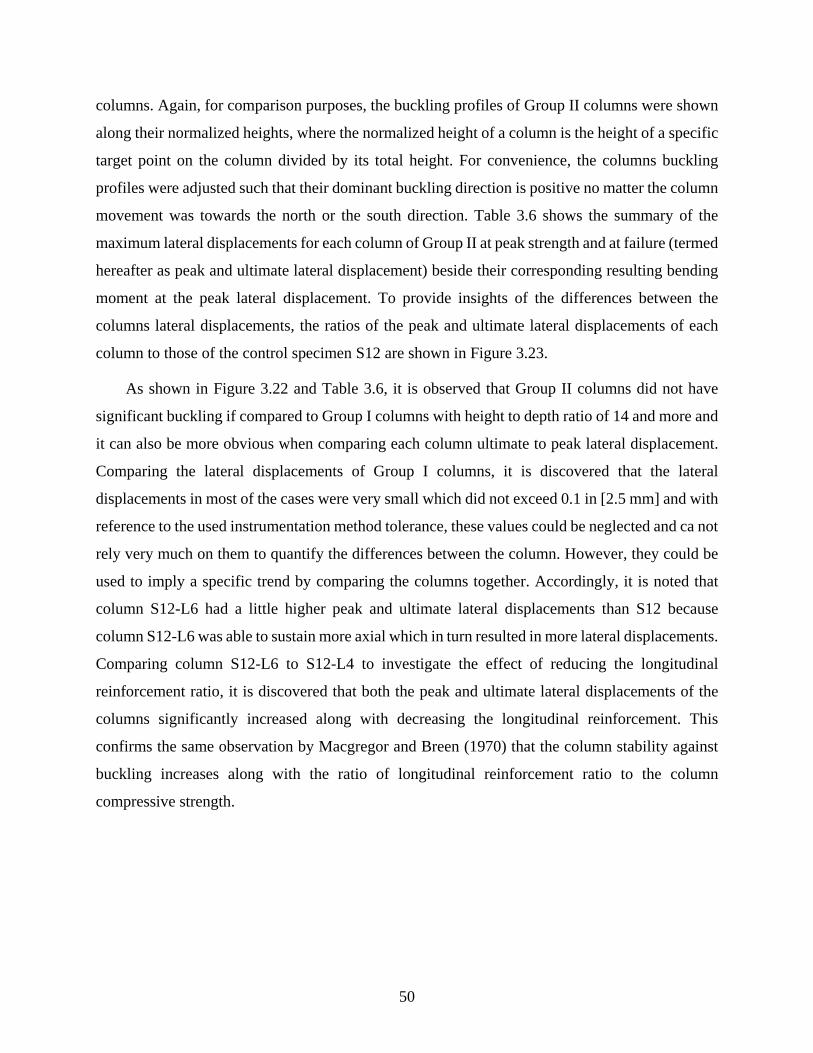
50
columns. Again, for comparison purposes, the buckling profiles of Group II columns were shown
along their normalized heights, where the normalized height of a column is the height of a specific
target point on the column divided by its total height. For convenience, the columns buckling
profiles were adjusted such that their dominant buckling direction is positive no matter the column
movement was towards the north or the south direction. Table 3.6 shows the summary of the
maximum lateral displacements for each column of Group II at peak strength and at failure (termed
hereafter as peak and ultimate lateral displacement) beside their corresponding resulting bending
moment at the peak lateral displacement. To provide insights of the differences between the
columns lateral displacements, the ratios of the peak and ultimate lateral displacements of each
column to those of the control specimen S12 are shown in Figure 3.23.
As shown in Figure 3.22 and Table 3.6, it is observed that Group II columns did not have
significant buckling if compared to Group I columns with height to depth ratio of 14 and more and
it can also be more obvious when comparing each column ultimate to peak lateral displacement.
Comparing the lateral displacements of Group I columns, it is discovered that the lateral
displacements in most of the cases were very small which did not exceed 0.1 in [2.5 mm] and with
reference to the used instrumentation method tolerance, these values could be neglected and ca not
rely very much on them to quantify the differences between the column. However, they could be
used to imply a specific trend by comparing the columns together. Accordingly, it is noted that
column S12-L6 had a little higher peak and ultimate lateral displacements than S12 because
column S12-L6 was able to sustain more axial which in turn resulted in more lateral displacements.
Comparing column S12-L6 to S12-L4 to investigate the effect of reducing the longitudinal
reinforcement ratio, it is discovered that both the peak and ultimate lateral displacements of the
columns significantly increased along with decreasing the longitudinal reinforcement. This
confirms the same observation by Macgregor and Breen (1970) that the column stability against
buckling increases along with the ratio of longitudinal reinforcement ratio to the column
compressive strength.
51
Figure 3.22 Dominant buckling profiles for Group II columns.
Table 3.6 Summary of the peak and ultimate lateral displacements for Group II columns.
Specimen ID
𝑝 , kips [kN]
𝑀 , kips-in [kN-m]
𝛿 , in [mm] 𝛿 , in [mm]
S12 2,565 [11,410] 61.6 [7.0] 0.024 [0.61] 0.029 [0.74]
S12-H6 2,543 [11,312] 335.7 [37.9] 0.132 [3.35] 0.166 [4.22]
S12-L4 2,618 [11,645] 460.8 [52.1] 0.176 [4.47] 0.233 [5.92]
S12-L6 2,672 [11,886] 176.4 [19.9] 0.066 [1.68] 0.089 [2.26]
S12-F1 2,518 [11,201] 209.0 [23.6] 0.083 [2.11] 0.107 [2.72]
No
rma
lize
d C
olu
mn
He
igh
t
-0.2 0 0.2 0.4 0.6 0.8 1
Lateral Displacement [in.]
PmaxPult
-5 0 5 10 15 20 25Lateral Displacement [mm]
No
rmal
ize
d C
olum
n H
eig
ht
No
rma
lize
d C
olu
mn
He
igh
t
-0.2 0 0.2 0.4 0.6 0.8 1
Lateral Displacement [in.]
PmaxPult
-5 0 5 10 15 20 25Lateral Displacement [mm]
0
0.1
0.2
0.3
0.4
0.5
0.6
0.7
0.8
0.9
1
Specimen S12
Specimen S12-H6
Specimen S12-L4
Specimen S12-L6
Specimen S12-F1
52
Figure 3.23 Comparison of the lateral displacements for Group II columns.
The decreasing of the confinement reinforcement resulted in significantly increased lateral
displacements because of the less confining on the concrete core which in turn caused less column
stability against buckling. In the same manner of the influence of the transverse reinforcement
ratio, the decreasing of the fibers ratio resulted in less confining to the column core and cover and
hence, less column stability and more peak and ultimate lateral displacements. However, the effect
of decreasing the confinement reinforcement was very significant on increasing the lateral
displacements if compared to decreasing the fiber reinforcement ratio.
3.6 Steel Reinforcement Strains
Group I Results
Figures 3.24 through 3.28 show the axial load versus the measured longitudinal and transverse
reinforcement strains at the mid-height of the column for Group I columns. The locations of the
reinforcement strains inside the columns were previously shown in Section 2.5. For comparison
purposes, results from the strain gages where the largest longitudinal reinforcement strain was
captured for all the Group I columns are plotted together in Figure 3.29. Furthermore, a summary
of the longitudinal and transverse reinforcement strain peak values is shown in Tables 3.7 and 3.8,
respectively. It is worth noting that the strain gages of the longitudinal bars of column S12 were
mistakenly set in the data acquisition system to a maximum value of 33,000 microstrain (i.e.
Nor
mal
ized
Pea
k La
tera
l Dis
plac
emen
t
Nor
mal
ized
ulti
mat
e La
tera
l Dis
plac
emen
t
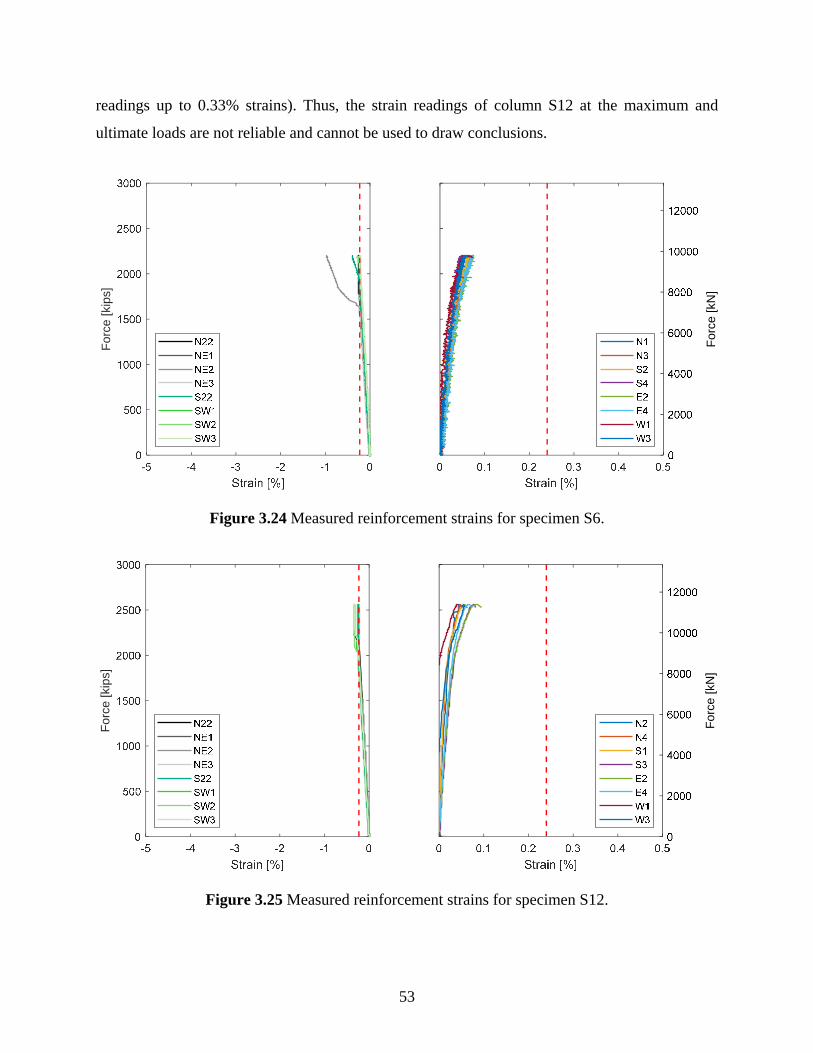
53
readings up to 0.33% strains). Thus, the strain readings of column S12 at the maximum and
ultimate loads are not reliable and cannot be used to draw conclusions.
Figure 3.24 Measured reinforcement strains for specimen S6.
Figure 3.25 Measured reinforcement strains for specimen S12.
For
ce [k
ips]
For
ce [k
N]
For
ce [k
ips]
For
ce [
kN]
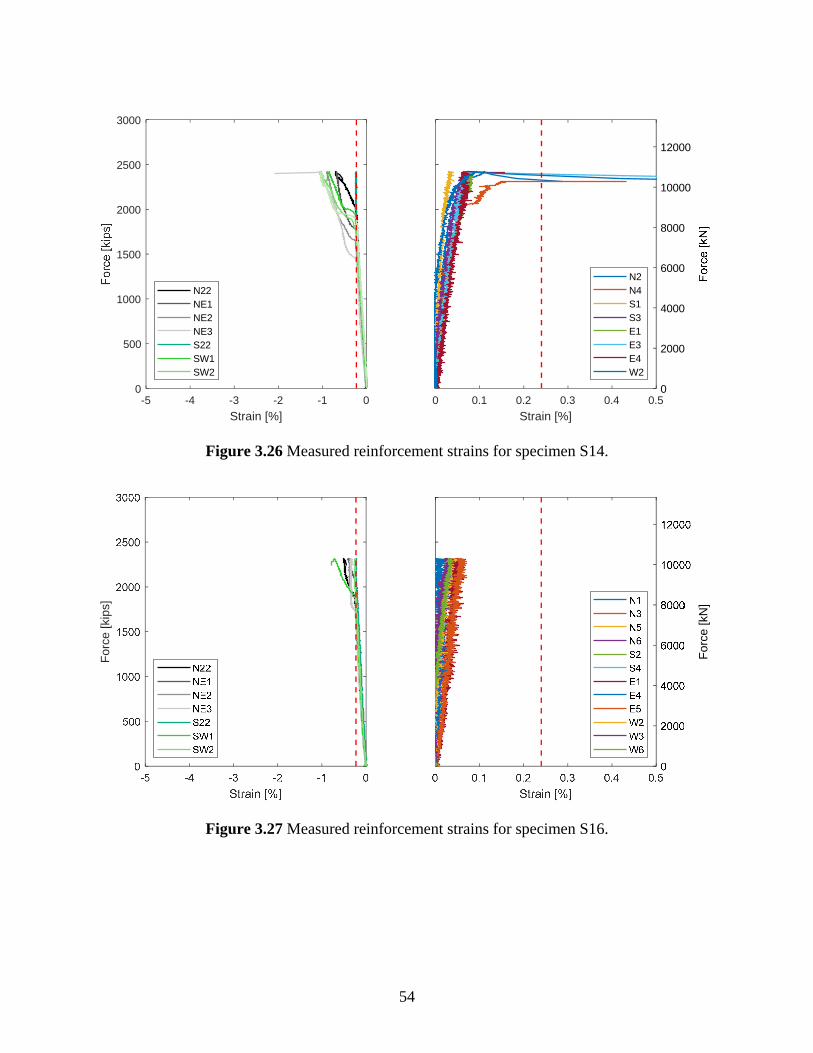
54
Figure 3.26 Measured reinforcement strains for specimen S14.
Figure 3.27 Measured reinforcement strains for specimen S16.
-5 -4 -3 -2 -1 0
Strain [%]
0
500
1000
1500
2000
2500
3000
N22NE1NE2NE3S22SW1SW2
0 0.1 0.2 0.3 0.4 0.5
Strain [%]
0
2000
4000
6000
8000
10000
12000
N2N4S1S3E1E3E4W2
For
ce [k
ips]
For
ce [k
N]
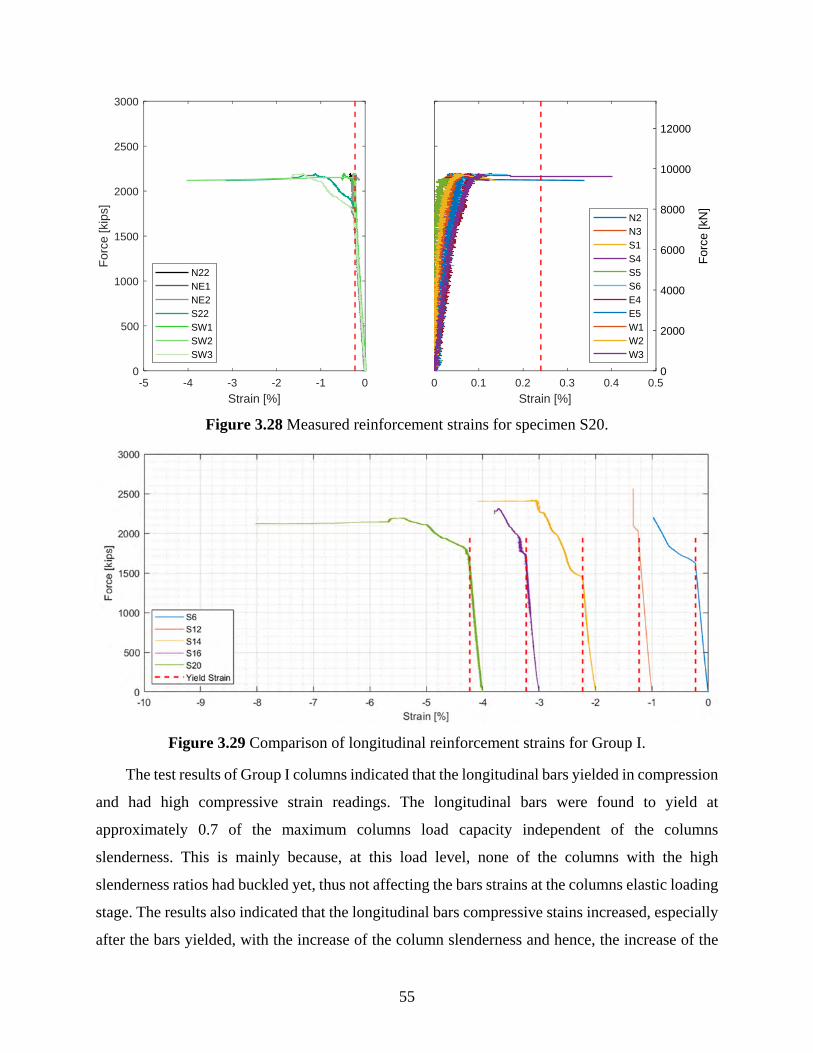
55
Figure 3.28 Measured reinforcement strains for specimen S20.
Figure 3.29 Comparison of longitudinal reinforcement strains for Group I.
The test results of Group I columns indicated that the longitudinal bars yielded in compression
and had high compressive strain readings. The longitudinal bars were found to yield at
approximately 0.7 of the maximum columns load capacity independent of the columns
slenderness. This is mainly because, at this load level, none of the columns with the high
slenderness ratios had buckled yet, thus not affecting the bars strains at the columns elastic loading
stage. The results also indicated that the longitudinal bars compressive stains increased, especially
after the bars yielded, with the increase of the column slenderness and hence, the increase of the
-5 -4 -3 -2 -1 0
Strain [%]
0
500
1000
1500
2000
2500
3000F
orce
[kip
s]
N22NE1NE2S22SW1SW2SW3
0 0.1 0.2 0.3 0.4 0.5
Strain [%]
0
2000
4000
6000
8000
10000
12000
For
ce [k
N]
N2N3S1S4S5S6E4E5W1W2W3
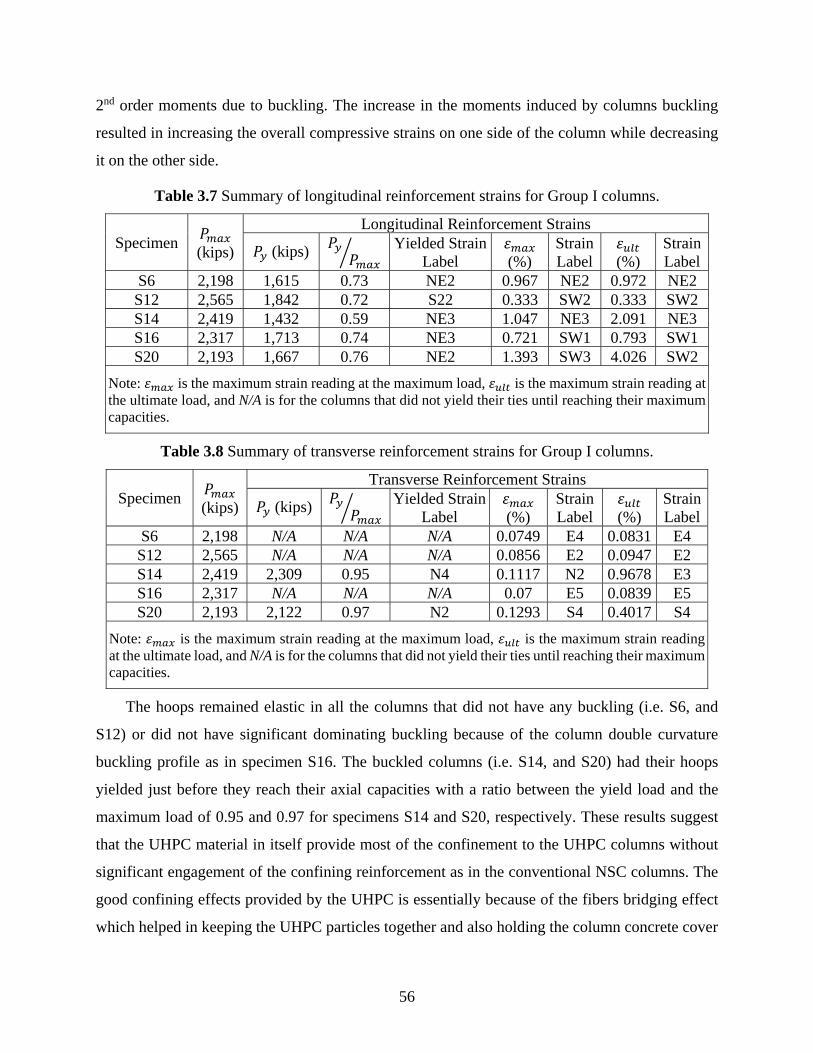
56
2nd order moments due to buckling. The increase in the moments induced by columns buckling
resulted in increasing the overall compressive strains on one side of the column while decreasing
it on the other side.
Table 3.7 Summary of longitudinal reinforcement strains for Group I columns.
Specimen 𝑃 (kips)
Longitudinal Reinforcement Strains
𝑃 (kips) 𝑃𝑃
Yielded Strain Label
𝜀 (%)
Strain Label
𝜀 (%)
Strain Label
S6 2,198 1,615 0.73 NE2 0.967 NE2 0.972 NE2 S12 2,565 1,842 0.72 S22 0.333 SW2 0.333 SW2 S14 2,419 1,432 0.59 NE3 1.047 NE3 2.091 NE3 S16 2,317 1,713 0.74 NE3 0.721 SW1 0.793 SW1 S20 2,193 1,667 0.76 NE2 1.393 SW3 4.026 SW2
Note: 𝜀 is the maximum strain reading at the maximum load, 𝜀 is the maximum strain reading at the ultimate load, and N/A is for the columns that did not yield their ties until reaching their maximum capacities.
Table 3.8 Summary of transverse reinforcement strains for Group I columns.
Specimen 𝑃 (kips)
Transverse Reinforcement Strains
𝑃 (kips) 𝑃𝑃
Yielded Strain Label
𝜀 (%)
Strain Label
𝜀 (%)
Strain Label
S6 2,198 N/A N/A N/A 0.0749 E4 0.0831 E4 S12 2,565 N/A N/A N/A 0.0856 E2 0.0947 E2 S14 2,419 2,309 0.95 N4 0.1117 N2 0.9678 E3 S16 2,317 N/A N/A N/A 0.07 E5 0.0839 E5 S20 2,193 2,122 0.97 N2 0.1293 S4 0.4017 S4
Note: 𝜀 is the maximum strain reading at the maximum load, 𝜀 is the maximum strain reading at the ultimate load, and N/A is for the columns that did not yield their ties until reaching their maximum capacities.
The hoops remained elastic in all the columns that did not have any buckling (i.e. S6, and
S12) or did not have significant dominating buckling because of the column double curvature
buckling profile as in specimen S16. The buckled columns (i.e. S14, and S20) had their hoops
yielded just before they reach their axial capacities with a ratio between the yield load and the
maximum load of 0.95 and 0.97 for specimens S14 and S20, respectively. These results suggest
that the UHPC material in itself provide most of the confinement to the UHPC columns without
significant engagement of the confining reinforcement as in the conventional NSC columns. The
good confining effects provided by the UHPC is essentially because of the fibers bridging effect
which helped in keeping the UHPC particles together and also holding the column concrete cover
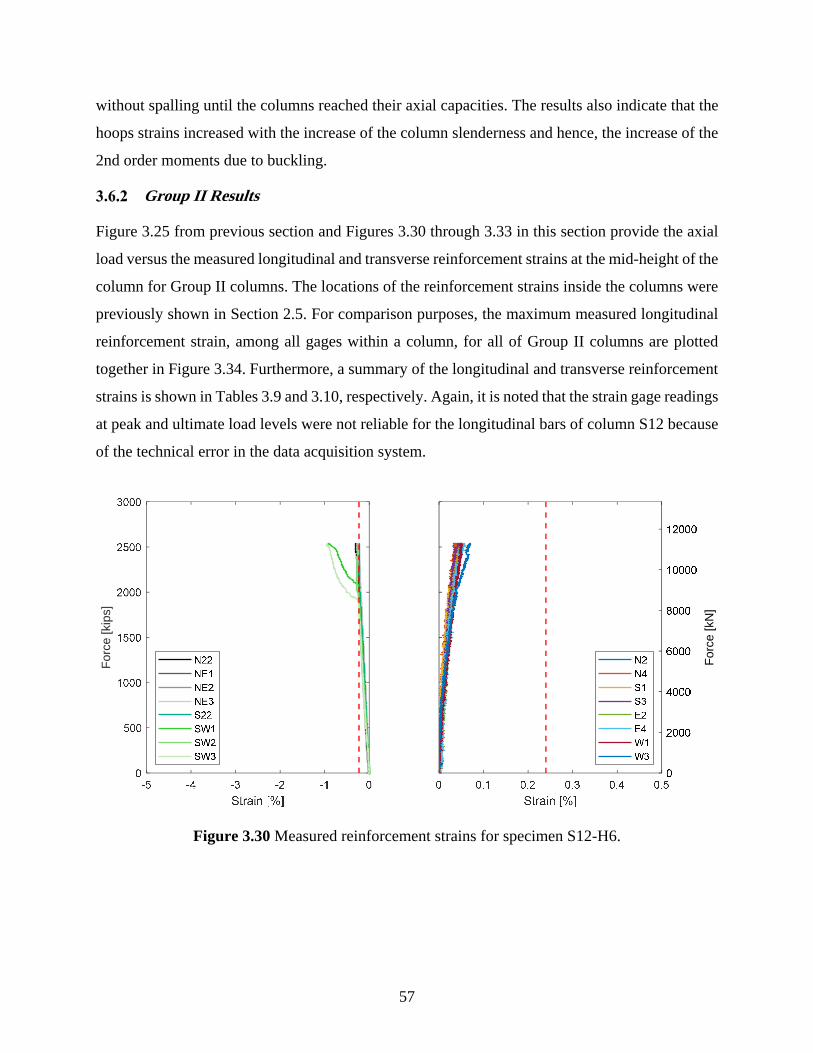
57
without spalling until the columns reached their axial capacities. The results also indicate that the
hoops strains increased with the increase of the column slenderness and hence, the increase of the
2nd order moments due to buckling.
Group II Results
Figure 3.25 from previous section and Figures 3.30 through 3.33 in this section provide the axial
load versus the measured longitudinal and transverse reinforcement strains at the mid-height of the
column for Group II columns. The locations of the reinforcement strains inside the columns were
previously shown in Section 2.5. For comparison purposes, the maximum measured longitudinal
reinforcement strain, among all gages within a column, for all of Group II columns are plotted
together in Figure 3.34. Furthermore, a summary of the longitudinal and transverse reinforcement
strains is shown in Tables 3.9 and 3.10, respectively. Again, it is noted that the strain gage readings
at peak and ultimate load levels were not reliable for the longitudinal bars of column S12 because
of the technical error in the data acquisition system.
Figure 3.30 Measured reinforcement strains for specimen S12-H6.
For
ce [k
ips]
For
ce [k
N]

58
Figure 3.31 Measured reinforcement strains for specimen S12-L4.
Figure 3.32 Measured reinforcement strains for specimen S12-L6.
For
ce [k
ips]
For
ce [k
N]
For
ce [k
ips]
For
ce [k
N]
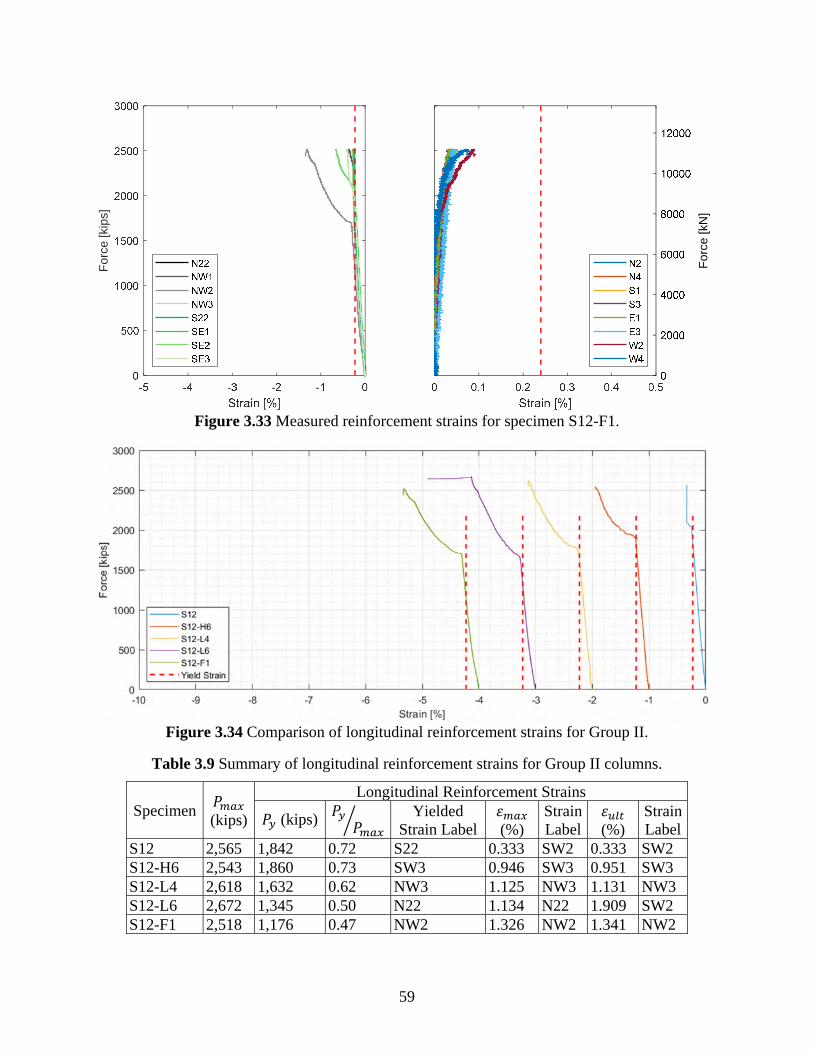
59
Figure 3.33 Measured reinforcement strains for specimen S12-F1.
Figure 3.34 Comparison of longitudinal reinforcement strains for Group II.
Table 3.9 Summary of longitudinal reinforcement strains for Group II columns.
Specimen 𝑃 (kips)
Longitudinal Reinforcement Strains
𝑃 (kips) 𝑃𝑃
Yielded Strain Label
𝜀 (%)
Strain Label
𝜀 (%)
Strain Label
S12 2,565 1,842 0.72 S22 0.333 SW2 0.333 SW2 S12-H6 2,543 1,860 0.73 SW3 0.946 SW3 0.951 SW3 S12-L4 2,618 1,632 0.62 NW3 1.125 NW3 1.131 NW3 S12-L6 2,672 1,345 0.50 N22 1.134 N22 1.909 SW2 S12-F1 2,518 1,176 0.47 NW2 1.326 NW2 1.341 NW2
For
ce [k
ips]
For
ce [k
N]
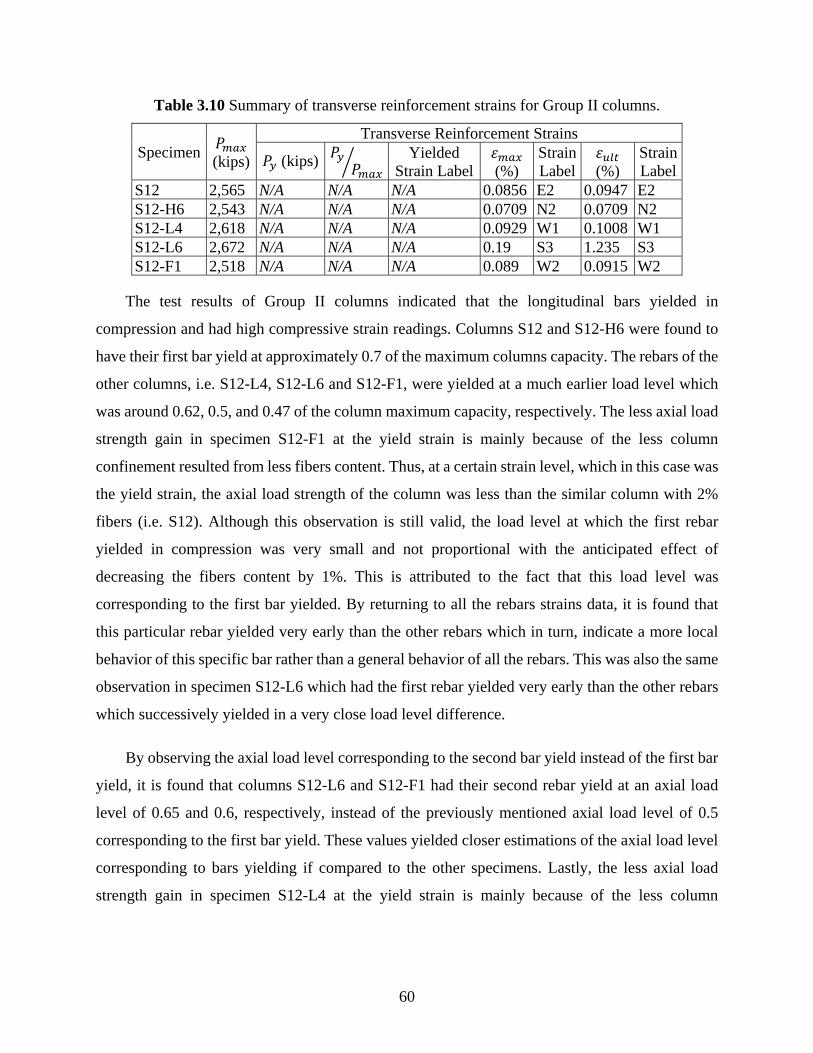
60
Table 3.10 Summary of transverse reinforcement strains for Group II columns.
Specimen 𝑃 (kips)
Transverse Reinforcement Strains
𝑃 (kips) 𝑃 𝑃 Yielded
Strain Label 𝜀 (%)
Strain Label
𝜀 (%)
Strain Label
S12 2,565 N/A N/A N/A 0.0856 E2 0.0947 E2 S12-H6 2,543 N/A N/A N/A 0.0709 N2 0.0709 N2 S12-L4 2,618 N/A N/A N/A 0.0929 W1 0.1008 W1 S12-L6 2,672 N/A N/A N/A 0.19 S3 1.235 S3 S12-F1 2,518 N/A N/A N/A 0.089 W2 0.0915 W2
The test results of Group II columns indicated that the longitudinal bars yielded in
compression and had high compressive strain readings. Columns S12 and S12-H6 were found to
have their first bar yield at approximately 0.7 of the maximum columns capacity. The rebars of the
other columns, i.e. S12-L4, S12-L6 and S12-F1, were yielded at a much earlier load level which
was around 0.62, 0.5, and 0.47 of the column maximum capacity, respectively. The less axial load
strength gain in specimen S12-F1 at the yield strain is mainly because of the less column
confinement resulted from less fibers content. Thus, at a certain strain level, which in this case was
the yield strain, the axial load strength of the column was less than the similar column with 2%
fibers (i.e. S12). Although this observation is still valid, the load level at which the first rebar
yielded in compression was very small and not proportional with the anticipated effect of
decreasing the fibers content by 1%. This is attributed to the fact that this load level was
corresponding to the first bar yielded. By returning to all the rebars strains data, it is found that
this particular rebar yielded very early than the other rebars which in turn, indicate a more local
behavior of this specific bar rather than a general behavior of all the rebars. This was also the same
observation in specimen S12-L6 which had the first rebar yielded very early than the other rebars
which successively yielded in a very close load level difference.
By observing the axial load level corresponding to the second bar yield instead of the first bar
yield, it is found that columns S12-L6 and S12-F1 had their second rebar yield at an axial load
level of 0.65 and 0.6, respectively, instead of the previously mentioned axial load level of 0.5
corresponding to the first bar yield. These values yielded closer estimations of the axial load level
corresponding to bars yielding if compared to the other specimens. Lastly, the less axial load
strength gain in specimen S12-L4 at the yield strain is mainly because of the less column
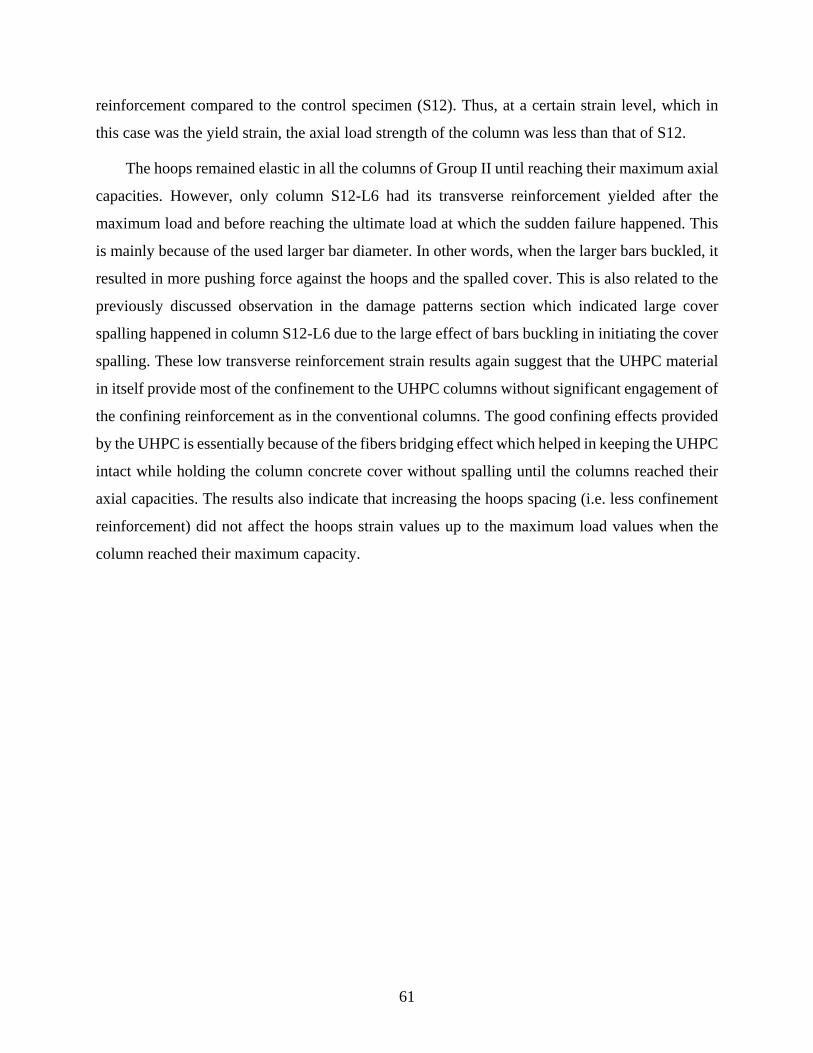
61
reinforcement compared to the control specimen (S12). Thus, at a certain strain level, which in
this case was the yield strain, the axial load strength of the column was less than that of S12.
The hoops remained elastic in all the columns of Group II until reaching their maximum axial
capacities. However, only column S12-L6 had its transverse reinforcement yielded after the
maximum load and before reaching the ultimate load at which the sudden failure happened. This
is mainly because of the used larger bar diameter. In other words, when the larger bars buckled, it
resulted in more pushing force against the hoops and the spalled cover. This is also related to the
previously discussed observation in the damage patterns section which indicated large cover
spalling happened in column S12-L6 due to the large effect of bars buckling in initiating the cover
spalling. These low transverse reinforcement strain results again suggest that the UHPC material
in itself provide most of the confinement to the UHPC columns without significant engagement of
the confining reinforcement as in the conventional columns. The good confining effects provided
by the UHPC is essentially because of the fibers bridging effect which helped in keeping the UHPC
intact while holding the column concrete cover without spalling until the columns reached their
axial capacities. The results also indicate that increasing the hoops spacing (i.e. less confinement
reinforcement) did not affect the hoops strain values up to the maximum load values when the
column reached their maximum capacity.
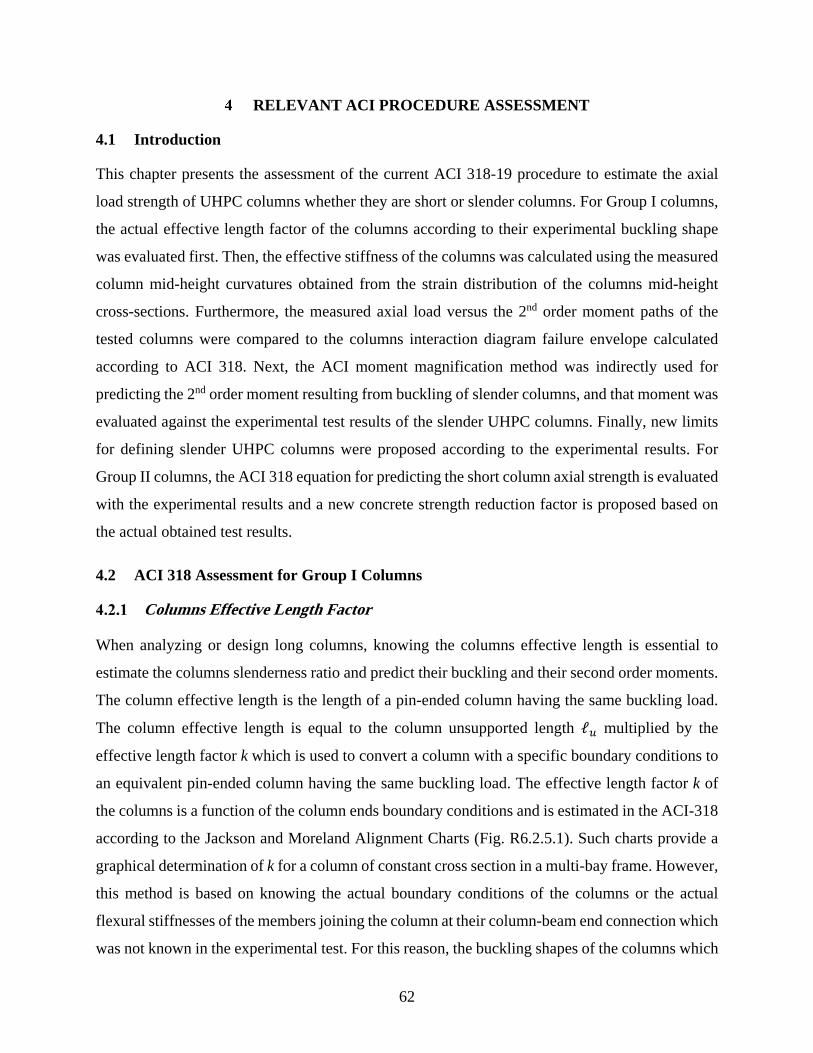
62
RELEVANT ACI PROCEDURE ASSESSMENT
4.1 Introduction
This chapter presents the assessment of the current ACI 318-19 procedure to estimate the axial
load strength of UHPC columns whether they are short or slender columns. For Group I columns,
the actual effective length factor of the columns according to their experimental buckling shape
was evaluated first. Then, the effective stiffness of the columns was calculated using the measured
column mid-height curvatures obtained from the strain distribution of the columns mid-height
cross-sections. Furthermore, the measured axial load versus the 2nd order moment paths of the
tested columns were compared to the columns interaction diagram failure envelope calculated
according to ACI 318. Next, the ACI moment magnification method was indirectly used for
predicting the 2nd order moment resulting from buckling of slender columns, and that moment was
evaluated against the experimental test results of the slender UHPC columns. Finally, new limits
for defining slender UHPC columns were proposed according to the experimental results. For
Group II columns, the ACI 318 equation for predicting the short column axial strength is evaluated
with the experimental results and a new concrete strength reduction factor is proposed based on
the actual obtained test results.
4.2 ACI 318 Assessment for Group I Columns
Columns Effective Length Factor
When analyzing or design long columns, knowing the columns effective length is essential to
estimate the columns slenderness ratio and predict their buckling and their second order moments.
The column effective length is the length of a pin-ended column having the same buckling load.
The column effective length is equal to the column unsupported length ℓ multiplied by the
effective length factor k which is used to convert a column with a specific boundary conditions to
an equivalent pin-ended column having the same buckling load. The effective length factor k of
the columns is a function of the column ends boundary conditions and is estimated in the ACI-318
according to the Jackson and Moreland Alignment Charts (Fig. R6.2.5.1). Such charts provide a
graphical determination of k for a column of constant cross section in a multi-bay frame. However,
this method is based on knowing the actual boundary conditions of the columns or the actual
flexural stiffnesses of the members joining the column at their column-beam end connection which
was not known in the experimental test. For this reason, the buckling shapes of the columns which
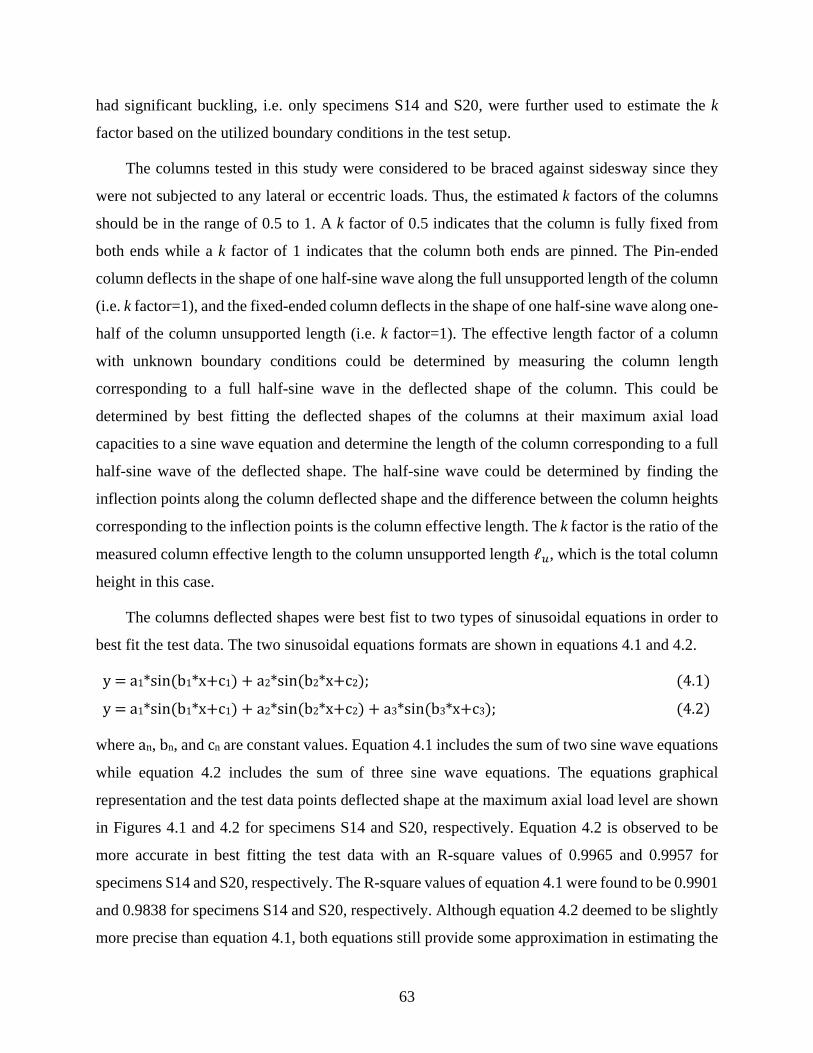
63
had significant buckling, i.e. only specimens S14 and S20, were further used to estimate the k
factor based on the utilized boundary conditions in the test setup.
The columns tested in this study were considered to be braced against sidesway since they
were not subjected to any lateral or eccentric loads. Thus, the estimated k factors of the columns
should be in the range of 0.5 to 1. A k factor of 0.5 indicates that the column is fully fixed from
both ends while a k factor of 1 indicates that the column both ends are pinned. The Pin-ended
column deflects in the shape of one half-sine wave along the full unsupported length of the column
(i.e. k factor=1), and the fixed-ended column deflects in the shape of one half-sine wave along one-
half of the column unsupported length (i.e. k factor=1). The effective length factor of a column
with unknown boundary conditions could be determined by measuring the column length
corresponding to a full half-sine wave in the deflected shape of the column. This could be
determined by best fitting the deflected shapes of the columns at their maximum axial load
capacities to a sine wave equation and determine the length of the column corresponding to a full
half-sine wave of the deflected shape. The half-sine wave could be determined by finding the
inflection points along the column deflected shape and the difference between the column heights
corresponding to the inflection points is the column effective length. The k factor is the ratio of the
measured column effective length to the column unsupported length ℓ , which is the total column
height in this case.
The columns deflected shapes were best fist to two types of sinusoidal equations in order to
best fit the test data. The two sinusoidal equations formats are shown in equations 4.1 and 4.2.
y a1*sin b1*x c1 a2*sin b2*x c2 ; 4.1
y a1*sin b1*x c1 a2*sin b2*x c2 a3*sin b3*x c3 ; 4.2
where an, bn, and cn are constant values. Equation 4.1 includes the sum of two sine wave equations
while equation 4.2 includes the sum of three sine wave equations. The equations graphical
representation and the test data points deflected shape at the maximum axial load level are shown
in Figures 4.1 and 4.2 for specimens S14 and S20, respectively. Equation 4.2 is observed to be
more accurate in best fitting the test data with an R-square values of 0.9965 and 0.9957 for
specimens S14 and S20, respectively. The R-square values of equation 4.1 were found to be 0.9901
and 0.9838 for specimens S14 and S20, respectively. Although equation 4.2 deemed to be slightly
more precise than equation 4.1, both equations still provide some approximation in estimating the
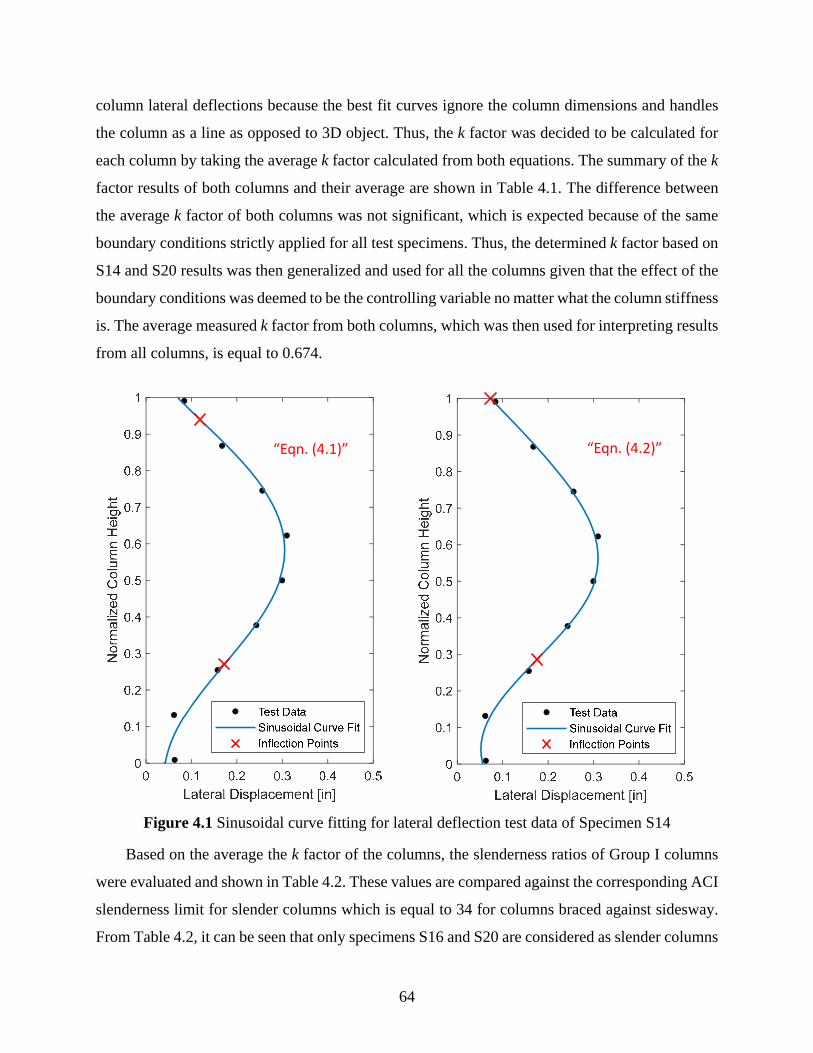
64
column lateral deflections because the best fit curves ignore the column dimensions and handles
the column as a line as opposed to 3D object. Thus, the k factor was decided to be calculated for
each column by taking the average k factor calculated from both equations. The summary of the k
factor results of both columns and their average are shown in Table 4.1. The difference between
the average k factor of both columns was not significant, which is expected because of the same
boundary conditions strictly applied for all test specimens. Thus, the determined k factor based on
S14 and S20 results was then generalized and used for all the columns given that the effect of the
boundary conditions was deemed to be the controlling variable no matter what the column stiffness
is. The average measured k factor from both columns, which was then used for interpreting results
from all columns, is equal to 0.674.
Figure 4.1 Sinusoidal curve fitting for lateral deflection test data of Specimen S14
Based on the average the k factor of the columns, the slenderness ratios of Group I columns
were evaluated and shown in Table 4.2. These values are compared against the corresponding ACI
slenderness limit for slender columns which is equal to 34 for columns braced against sidesway.
From Table 4.2, it can be seen that only specimens S16 and S20 are considered as slender columns
“Eqn. (4.1)” “Eqn. (4.2)”
65
according to the ACI-318 definition. This observation triggered the need to revisit such ACI limits
because specimen S14 had experienced a significant buckling and yet is not considered slender
based on ACI definition. Thus, it was decided to revisit the ACI code limits for slender columns
as discussed in this section because it overestimates the slenderness ratio at which the UHPC
columns should be treated as slender columns.
Figure 4.2 Sinusoidal curve fitting for lateral deflection test data of Specimen S20.
Table 4.1 Summary of the k factor results of Specimens S14 and S20.
k-factor (Eqn. 4.1) k-factor (Eqn. 4.2) Average k-factor
Specimen “S14” 0.6317 0.6807 0.6562 0.674
Specimen “S20” 0.6685 0.7144 0.6915
Table 4.2 Group I slenderness ratio calculations and relation to ACI limit.
Specimen ID S6 S12 S14 S16 S20
ℓ𝑡 6 12 14 16 20
𝜆 𝑘ℓ𝑟 13.5 27 31.5 35.9 44.9
𝜆𝜆 0.4 0.79 0.93 1.06 1.32
“Eqn. (4.1)” “Eqn. (4.2)”
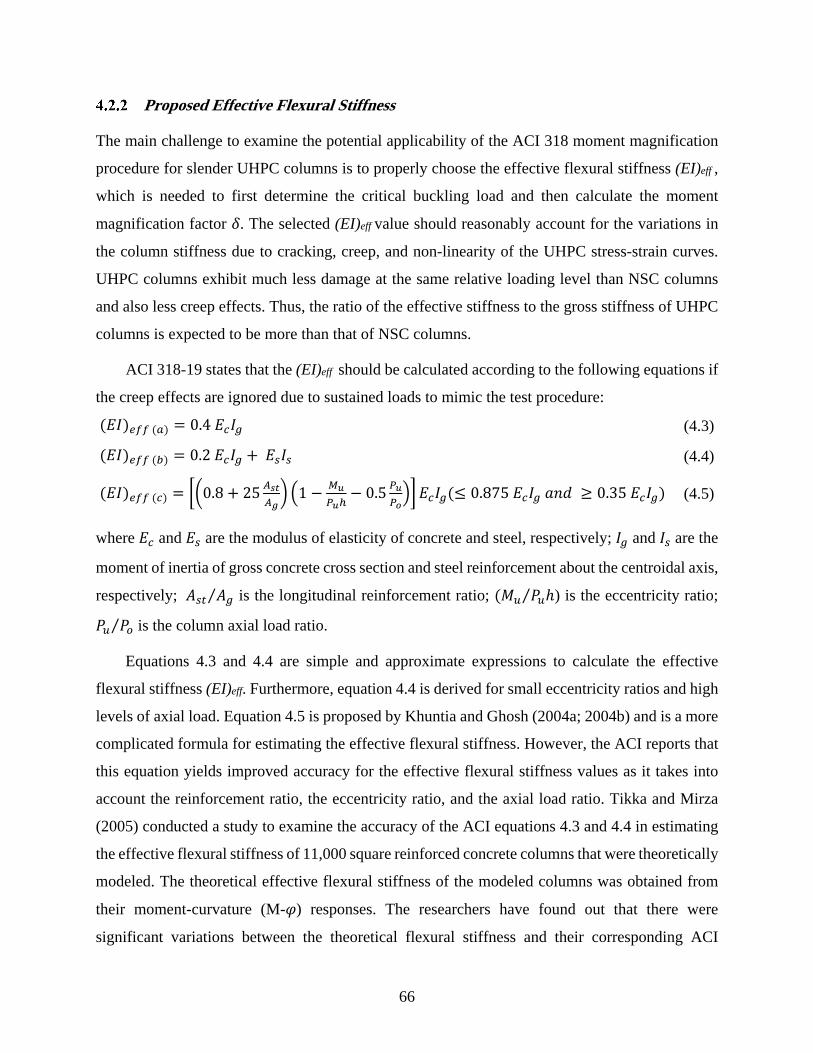
66
Proposed Effective Flexural Stiffness
The main challenge to examine the potential applicability of the ACI 318 moment magnification
procedure for slender UHPC columns is to properly choose the effective flexural stiffness (EI)eff ,
which is needed to first determine the critical buckling load and then calculate the moment
magnification factor 𝛿. The selected (EI)eff value should reasonably account for the variations in
the column stiffness due to cracking, creep, and non-linearity of the UHPC stress-strain curves.
UHPC columns exhibit much less damage at the same relative loading level than NSC columns
and also less creep effects. Thus, the ratio of the effective stiffness to the gross stiffness of UHPC
columns is expected to be more than that of NSC columns.
ACI 318-19 states that the (EI)eff should be calculated according to the following equations if
the creep effects are ignored due to sustained loads to mimic the test procedure:
𝐸𝐼 0.4 𝐸 𝐼 (4.3)
𝐸𝐼 0.2 𝐸 𝐼 𝐸 𝐼 (4.4)
𝐸𝐼 0.8 25 1 0.5 𝐸 𝐼 0.875 𝐸 𝐼 𝑎𝑛𝑑 0.35 𝐸 𝐼 (4.5)
where 𝐸 and 𝐸 are the modulus of elasticity of concrete and steel, respectively; 𝐼 and 𝐼 are the
moment of inertia of gross concrete cross section and steel reinforcement about the centroidal axis,
respectively; 𝐴 𝐴⁄ is the longitudinal reinforcement ratio; 𝑀 𝑃 ℎ⁄ ) is the eccentricity ratio;
𝑃 𝑃⁄ is the column axial load ratio.
Equations 4.3 and 4.4 are simple and approximate expressions to calculate the effective
flexural stiffness (EI)eff. Furthermore, equation 4.4 is derived for small eccentricity ratios and high
levels of axial load. Equation 4.5 is proposed by Khuntia and Ghosh (2004a; 2004b) and is a more
complicated formula for estimating the effective flexural stiffness. However, the ACI reports that
this equation yields improved accuracy for the effective flexural stiffness values as it takes into
account the reinforcement ratio, the eccentricity ratio, and the axial load ratio. Tikka and Mirza
(2005) conducted a study to examine the accuracy of the ACI equations 4.3 and 4.4 in estimating
the effective flexural stiffness of 11,000 square reinforced concrete columns that were theoretically
modeled. The theoretical effective flexural stiffness of the modeled columns was obtained from
their moment-curvature (M-𝜑) responses. The researchers have found out that there were
significant variations between the theoretical flexural stiffness and their corresponding ACI

67
estimations. These significant variations were related to the constant coefficient values of 0.2 and
0.4 used to estimate the contribution of concrete stiffness in the ACI stiffness equations 4.3 and
4.4. Tikka and Mirza (2005) proposed another more precise and complicated equation to estimate
the short-term (EI)eff (see equation 4.6) and consider the contribution of the reinforcement flexural
stiffness to the overall flexural stiffness.
𝐸𝐼 0.47 3.5⁄
0.003 𝐸 𝐼 0.8 𝐸 𝐼 (4.6)
where 𝛽=0.7 for ρ ≤ 2% and 𝛽=8 for ρ > 2%.
The above equations, i.e. equations 4.3 through 4.6, were derived based on NSC columns.
Thus, they are considered conservative in estimating the effective flexural stiffness of the UHPC
columns as the UHPC columns in general have less damage than the NSC columns due to the
bridging effect of the fibers and the higher compressive and tensile ductility. There are few studies
which focused on evaluating the effective flexural stiffness of UHPC columns. Aboukifa et al.
(2020a, b) and Aboukifa and Moustafa (2021) estimated the effective stiffness of UHPC columns
as 0.7𝐸 𝐼 at an eccentricity ratio (e/h) equal to 0.2. However, the columns of this study were only
subjected to concentric loads. Accordingly, and to be on the conservative side, the (EI)eff of Group
I columns is proposed to be equal to 0.7𝐸 𝐼 . To have a little insight of the suitability of the ACI
equations in estimating the effective flexural stiffness of the UHPC columns and based on the
previously listed equations 4.3 through 4.6, the effective flexural stiffnesses of the UHPC columns
of Group I were calculated and shown in Table 4.3. Furthermore, the ratio of the average estimated
effective flexural stiffness EIth values to the proposed value EIproposed according to Aboukifa et al.
(2020) are shown in Table 4.3
Based on the results shown in Table 4.3, all the equations of the ACI underestimated the
effective flexural stiffness of the concentrically axially loaded UHPC columns as follows:
(1) equation 4.3 underestimated the proposed (EI)eff by 43%
(2) equation 4.4 underestimated the proposed (EI)eff by 55%
(3) equation 4.5 underestimated the proposed (EI)eff by 13%
(4) equation 4.6 underestimated the proposed (EI)eff by 16%
Thus, equations 4.5 and 4.6 were found to have the closest estimations of the UHPC columns
effective flexural stiffness and yielded acceptable values.
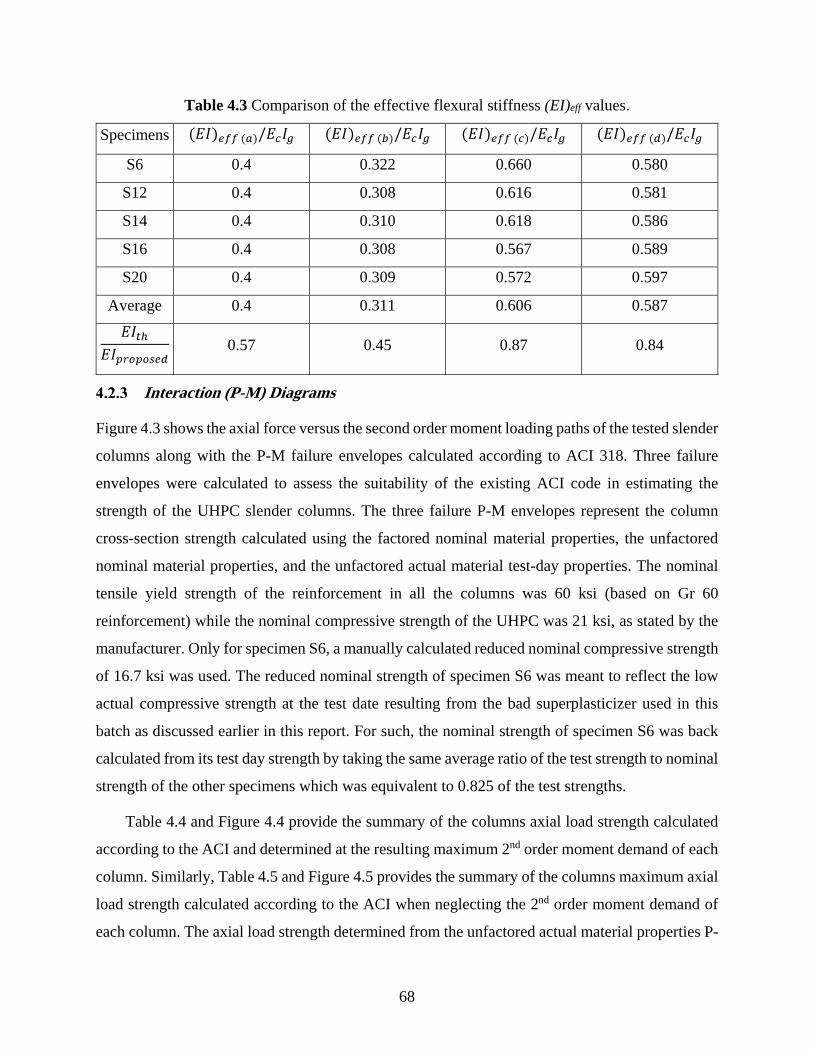
68
Table 4.3 Comparison of the effective flexural stiffness (EI)eff values.
Specimens 𝐸𝐼 /𝐸 𝐼 𝐸𝐼 /𝐸 𝐼 𝐸𝐼 /𝐸 𝐼 𝐸𝐼 /𝐸 𝐼
S6 0.4 0.322 0.660 0.580
S12 0.4 0.308 0.616 0.581
S14 0.4 0.310 0.618 0.586
S16 0.4 0.308 0.567 0.589
S20 0.4 0.309 0.572 0.597
Average 0.4 0.311 0.606 0.587
𝐸𝐼𝐸𝐼
0.57 0.45 0.87 0.84
Interaction (P-M) Diagrams
Figure 4.3 shows the axial force versus the second order moment loading paths of the tested slender
columns along with the P-M failure envelopes calculated according to ACI 318. Three failure
envelopes were calculated to assess the suitability of the existing ACI code in estimating the
strength of the UHPC slender columns. The three failure P-M envelopes represent the column
cross-section strength calculated using the factored nominal material properties, the unfactored
nominal material properties, and the unfactored actual material test-day properties. The nominal
tensile yield strength of the reinforcement in all the columns was 60 ksi (based on Gr 60
reinforcement) while the nominal compressive strength of the UHPC was 21 ksi, as stated by the
manufacturer. Only for specimen S6, a manually calculated reduced nominal compressive strength
of 16.7 ksi was used. The reduced nominal strength of specimen S6 was meant to reflect the low
actual compressive strength at the test date resulting from the bad superplasticizer used in this
batch as discussed earlier in this report. For such, the nominal strength of specimen S6 was back
calculated from its test day strength by taking the same average ratio of the test strength to nominal
strength of the other specimens which was equivalent to 0.825 of the test strengths.
Table 4.4 and Figure 4.4 provide the summary of the columns axial load strength calculated
according to the ACI and determined at the resulting maximum 2nd order moment demand of each
column. Similarly, Table 4.5 and Figure 4.5 provides the summary of the columns maximum axial
load strength calculated according to the ACI when neglecting the 2nd order moment demand of
each column. The axial load strength determined from the unfactored actual material properties P-
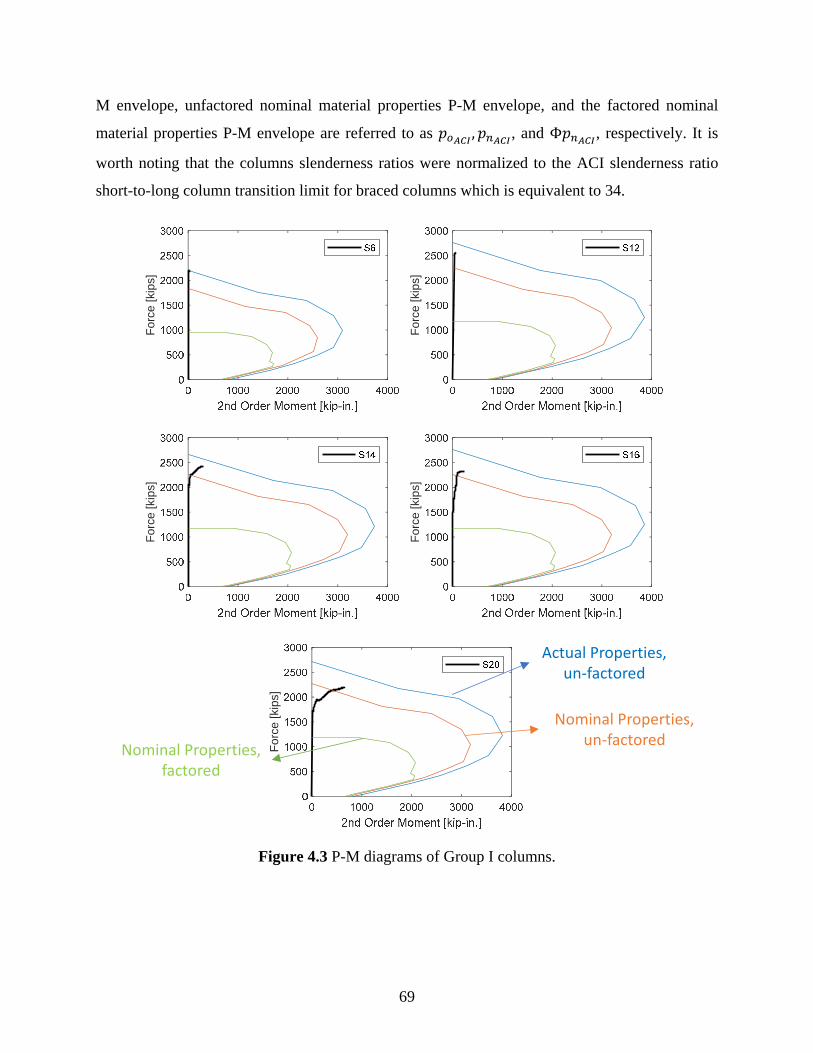
69
M envelope, unfactored nominal material properties P-M envelope, and the factored nominal
material properties P-M envelope are referred to as 𝑝 ,𝑝 , and Φ𝑝 , respectively. It is
worth noting that the columns slenderness ratios were normalized to the ACI slenderness ratio
short-to-long column transition limit for braced columns which is equivalent to 34.
Figure 4.3 P-M diagrams of Group I columns.
For
ce [k
ips]
For
ce [k
ips]
For
ce [k
ips]
For
ce [k
ips]
For
ce [k
ips]
Actual Properties, un‐factored
Nominal Properties, un‐factored
Nominal Properties, factored
70
Table 4.4 Summary of axial load strength determined at the maximum 2nd order moment demand from different P-M cases.
Specimen ID
𝑝 , kips
𝑝 ,
kips
𝑝
𝑝
𝑝 ,
kips
𝑝
𝑝
Φ𝑝 ,
kipsΦ𝑝𝑝
S6 2,198 2,188 1.00 1,830 0.83 954 0.43 S12 2,565 2,736 1.07 2,245 0.88 1,177 0.46 S14 2,419 2,572 1.06 2,164 0.89 1,177 0.49 S16 2,317 2,685 1.16 2,186 0.94 1,177 0.51 S20 2,193 2,516 1.15 2,054 0.94 1,177 0.54
Average 1.09 0.90 0.48
Table 4.5 Summary of the maximum axial load strength determined at zero 2nd order moment demand from different P-M cases.
Specimen ID
𝑝 , kips
𝑝 , ,
kips
𝑝 ,
𝑝 𝑝 , ,
kips
𝑝 ,
𝑝 Φ𝑝 , ,
kipsΦ𝑝 ,
𝑝
S6 2,198 2,193 1.00 1,468 0.67 954 0.43 S12 2,565 2,755 1.07 1,812 0.71 1,177 0.46 S14 2,419 2,671 1.10 1,812 0.75 1,177 0.49 S16 2,317 2,761 1.19 1,812 0.78 1,177 0.51 S20 2,193 2,723 1.24 1,812 0.83 1,177 0.54
Average 1.12 0.75 0.48
Figure 4.4 Effect of slenderness ratio on the ACI code estimation of the axial load strength determined at the maximum 2nd order moment demand.

71
Figure 4.5 Effect of slenderness ratio on the ACI code estimation of the maximum axial load strength determined at zero 2nd order moment demand.
Based on the results shown in Table 4.4 and Figure 4.4, the following observations can be
drawn based on the estimated axial load strength according to the ACI:
The average determined axial load strength from the unfactored actual material properties
𝑝 was on average greater than the columns axial load strengths by 9%. The ACI
overestimation of the strength capacity (i.e. percent of error) increases with the increase of the
columns slenderness ratios.
The average determined axial load strength from the unfactored nominal material properties
𝑝 was on average less than the columns axial load strengths by 10%. The ACI
underestimation of the strength capacity (i.e. factor of safety) decreases with the increase of
the columns slenderness ratios.
The average determined axial load strength from the factored nominal material properties
Φ𝑝 was on average less than the columns axial load strengths by 52% (i.e. factor of safety
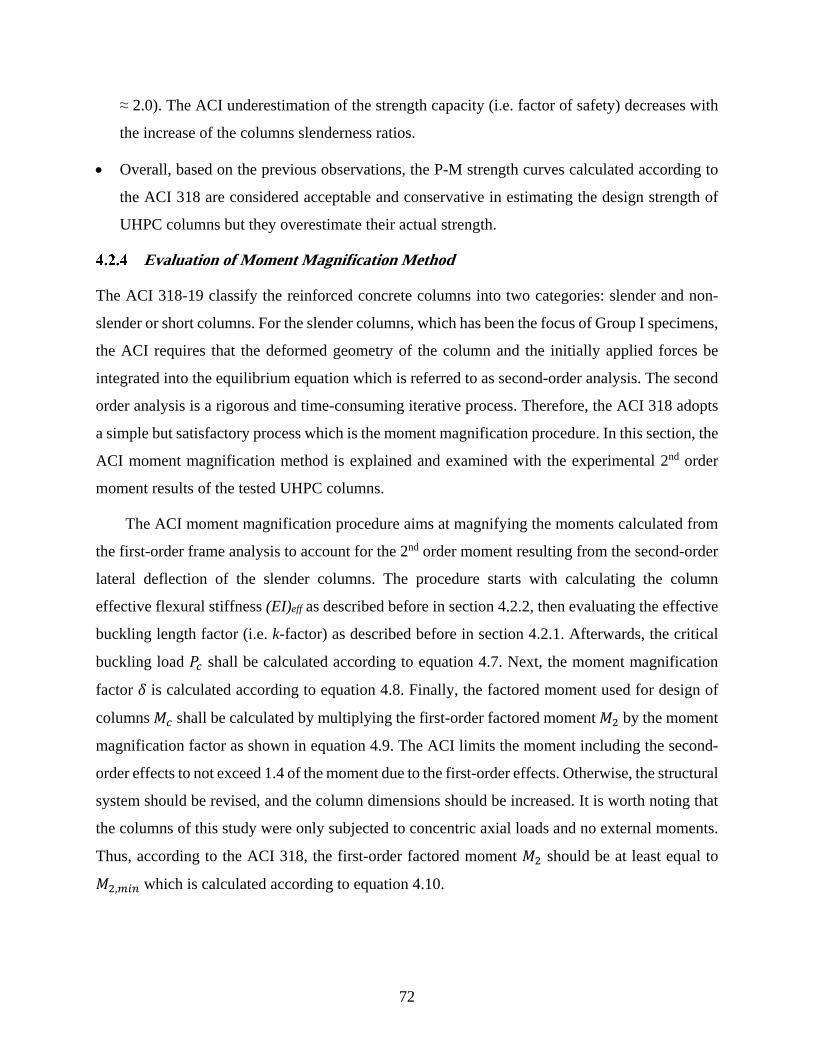
72
≈ 2.0). The ACI underestimation of the strength capacity (i.e. factor of safety) decreases with
the increase of the columns slenderness ratios.
Overall, based on the previous observations, the P-M strength curves calculated according to
the ACI 318 are considered acceptable and conservative in estimating the design strength of
UHPC columns but they overestimate their actual strength.
Evaluation of Moment Magnification Method
The ACI 318-19 classify the reinforced concrete columns into two categories: slender and non-
slender or short columns. For the slender columns, which has been the focus of Group I specimens,
the ACI requires that the deformed geometry of the column and the initially applied forces be
integrated into the equilibrium equation which is referred to as second-order analysis. The second
order analysis is a rigorous and time-consuming iterative process. Therefore, the ACI 318 adopts
a simple but satisfactory process which is the moment magnification procedure. In this section, the
ACI moment magnification method is explained and examined with the experimental 2nd order
moment results of the tested UHPC columns.
The ACI moment magnification procedure aims at magnifying the moments calculated from
the first-order frame analysis to account for the 2nd order moment resulting from the second-order
lateral deflection of the slender columns. The procedure starts with calculating the column
effective flexural stiffness (EI)eff as described before in section 4.2.2, then evaluating the effective
buckling length factor (i.e. k-factor) as described before in section 4.2.1. Afterwards, the critical
buckling load 𝑃 shall be calculated according to equation 4.7. Next, the moment magnification
factor 𝛿 is calculated according to equation 4.8. Finally, the factored moment used for design of
columns 𝑀 shall be calculated by multiplying the first-order factored moment 𝑀 by the moment
magnification factor as shown in equation 4.9. The ACI limits the moment including the second-
order effects to not exceed 1.4 of the moment due to the first-order effects. Otherwise, the structural
system should be revised, and the column dimensions should be increased. It is worth noting that
the columns of this study were only subjected to concentric axial loads and no external moments.
Thus, according to the ACI 318, the first-order factored moment 𝑀 should be at least equal to
𝑀 , which is calculated according to equation 4.10.
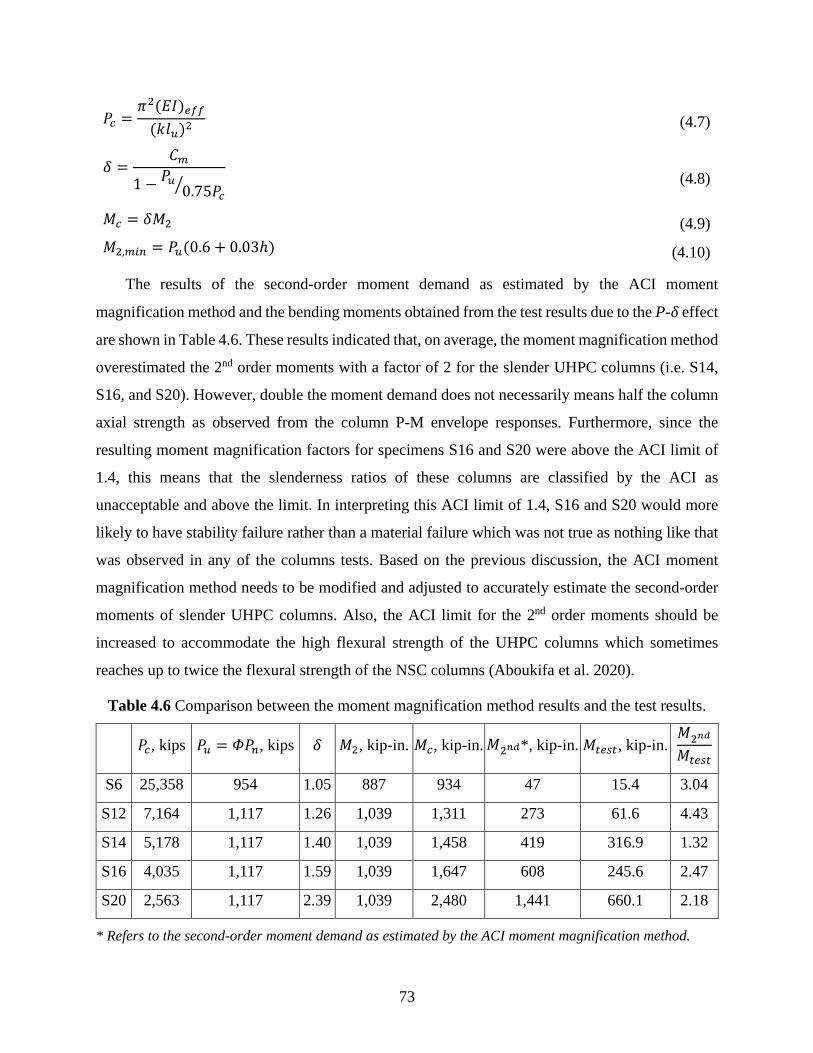
73
𝑃𝜋 𝐸𝐼𝑘𝑙
(4.7)
𝛿𝐶
1 𝑃0.75𝑃
(4.8)
𝑀 𝛿𝑀 (4.9)
𝑀 , 𝑃 0.6 0.03ℎ (4.10)
The results of the second-order moment demand as estimated by the ACI moment
magnification method and the bending moments obtained from the test results due to the P-𝛿 effect
are shown in Table 4.6. These results indicated that, on average, the moment magnification method
overestimated the 2nd order moments with a factor of 2 for the slender UHPC columns (i.e. S14,
S16, and S20). However, double the moment demand does not necessarily means half the column
axial strength as observed from the column P-M envelope responses. Furthermore, since the
resulting moment magnification factors for specimens S16 and S20 were above the ACI limit of
1.4, this means that the slenderness ratios of these columns are classified by the ACI as
unacceptable and above the limit. In interpreting this ACI limit of 1.4, S16 and S20 would more
likely to have stability failure rather than a material failure which was not true as nothing like that
was observed in any of the columns tests. Based on the previous discussion, the ACI moment
magnification method needs to be modified and adjusted to accurately estimate the second-order
moments of slender UHPC columns. Also, the ACI limit for the 2nd order moments should be
increased to accommodate the high flexural strength of the UHPC columns which sometimes
reaches up to twice the flexural strength of the NSC columns (Aboukifa et al. 2020).
Table 4.6 Comparison between the moment magnification method results and the test results.
𝑃 , kips 𝑃 𝛷𝑃 , kips 𝛿 𝑀 , kip-in. 𝑀 , kip-in. 𝑀 *, kip-in. 𝑀 , kip-in. 𝑀𝑀
S6 25,358 954 1.05 887 934 47 15.4 3.04
S12 7,164 1,117 1.26 1,039 1,311 273 61.6 4.43
S14 5,178 1,117 1.40 1,039 1,458 419 316.9 1.32
S16 4,035 1,117 1.59 1,039 1,647 608 245.6 2.47
S20 2,563 1,117 2.39 1,039 2,480 1,441 660.1 2.18
* Refers to the second-order moment demand as estimated by the ACI moment magnification method.
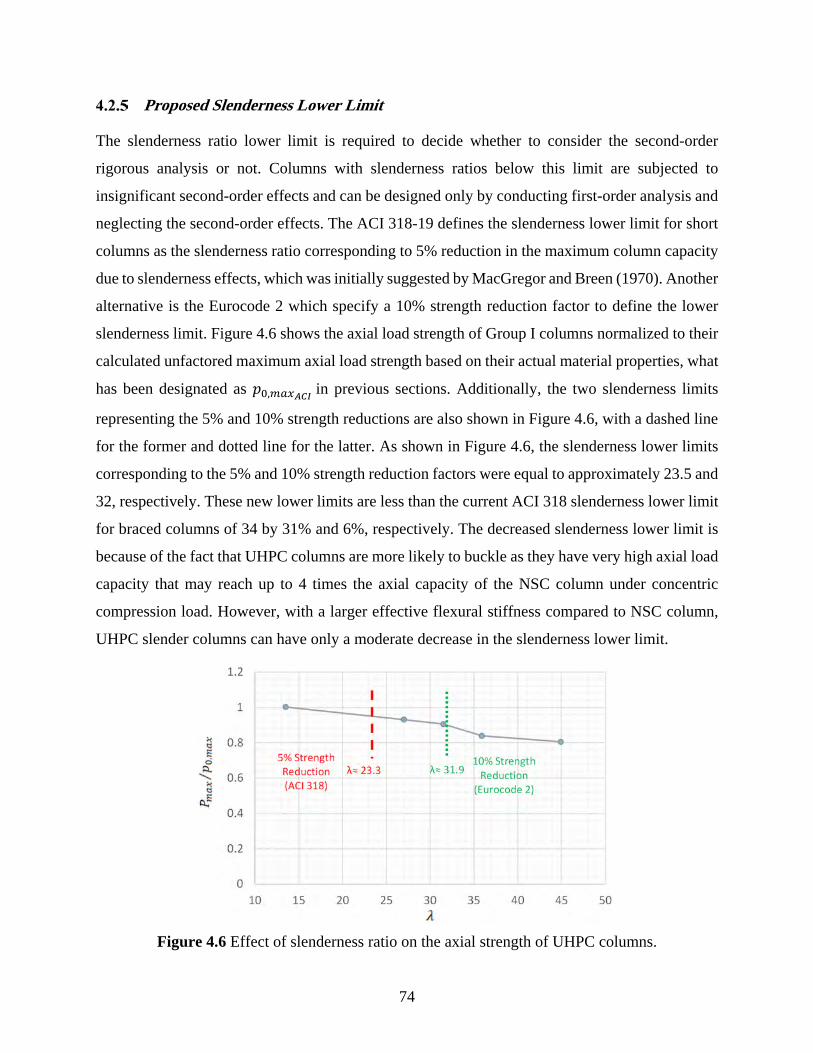
74
Proposed Slenderness Lower Limit
The slenderness ratio lower limit is required to decide whether to consider the second-order
rigorous analysis or not. Columns with slenderness ratios below this limit are subjected to
insignificant second-order effects and can be designed only by conducting first-order analysis and
neglecting the second-order effects. The ACI 318-19 defines the slenderness lower limit for short
columns as the slenderness ratio corresponding to 5% reduction in the maximum column capacity
due to slenderness effects, which was initially suggested by MacGregor and Breen (1970). Another
alternative is the Eurocode 2 which specify a 10% strength reduction factor to define the lower
slenderness limit. Figure 4.6 shows the axial load strength of Group I columns normalized to their
calculated unfactored maximum axial load strength based on their actual material properties, what
has been designated as 𝑝 , in previous sections. Additionally, the two slenderness limits
representing the 5% and 10% strength reductions are also shown in Figure 4.6, with a dashed line
for the former and dotted line for the latter. As shown in Figure 4.6, the slenderness lower limits
corresponding to the 5% and 10% strength reduction factors were equal to approximately 23.5 and
32, respectively. These new lower limits are less than the current ACI 318 slenderness lower limit
for braced columns of 34 by 31% and 6%, respectively. The decreased slenderness lower limit is
because of the fact that UHPC columns are more likely to buckle as they have very high axial load
capacity that may reach up to 4 times the axial capacity of the NSC column under concentric
compression load. However, with a larger effective flexural stiffness compared to NSC column,
UHPC slender columns can have only a moderate decrease in the slenderness lower limit.
Figure 4.6 Effect of slenderness ratio on the axial strength of UHPC columns.

75
4.3 ACI 318 Assessment for Group II Columns
This section presents the assessment of the current ACI 318-19 procedure to estimate the axial
load strength of UHPC short columns assuming it works for Group II columns. The ACI equation
for estimating the column axial compressive strength is used to estimate the strength of the UHPC
columns at three different conditions as follows: (1) unfactored actual material test-day properties,
referred to as 𝑝 , (equation 4.11); (2) unfactored nominal material properties, referred to as
𝑝 , (equation 4.12); and (3) factored nominal properties, referred to as Φ𝑝 , (equation
4.13).
Table 4.7 shows the strength estimate results using the three equations along with their
corresponding actual test strength for Group II columns. Figure 4.7 also shows the ratios of the
ACI strength estimates to their corresponding actual test strength for Group II columns. From the
results, it can be shown that, on average, equation 4.11 overestimated the UHPC column strength
by 13%, equation 4.12 underestimated the strength by 12%, and equation 4.13 underestimated the
strength by 54% which is almost equivalent to a factor of safety of 2.
Although, on the design level, the ACI equation is deemed satisfactory, it overestimates the
actual strength of the UHPC columns if their actual properties are plugged in the equation. This
returns to the fact that ACI employ a high concrete reduction factor of 0.85 that is unrepresentative
of the UHPC columns. The concrete strength reduction factor is commonly employed by the design
codes to account for the lower compressive strength of the in-place concrete of the actual columns
resulting from the differences in size, shape, and concrete casting practices between actual columns
and standard cylinder specimens. The ACI 318-19 determines the in-place concrete compressive
strength as 0.85𝑓 . However, this reduction factor seems to need adjustment to use for UHPC
columns. For this purpose, a new reduction factor of 0.75 is suggested for the in-place UHPC
strength which is equivalent to the ACI reduction factor of 0.85 reduced by the average error
percentage of 13% observed from the experimental results. The column strength equations
discussed earlier in equations 4.11 through 4.13 are adjusted to include the new in-place concrete
𝑃 , 0.85𝑓 , 𝐴 𝐴 𝑓 , 𝐴 (4.11)
𝑃 , 0.85𝑓 𝐴 𝐴 𝑓 𝐴 (4.12)
𝛷𝑃 , 0.65 0.8 0.85𝑓 𝐴 𝐴 𝑓 𝐴 (4.13)
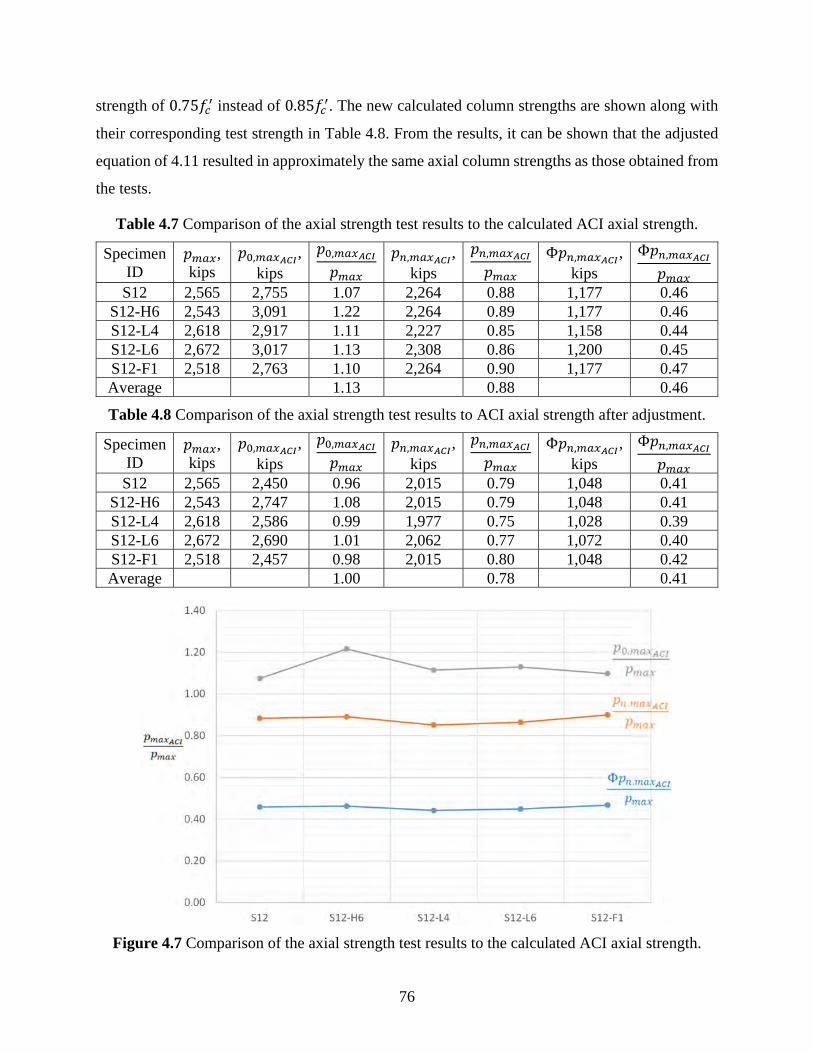
76
strength of 0.75𝑓 instead of 0.85𝑓 . The new calculated column strengths are shown along with
their corresponding test strength in Table 4.8. From the results, it can be shown that the adjusted
equation of 4.11 resulted in approximately the same axial column strengths as those obtained from
the tests.
Table 4.7 Comparison of the axial strength test results to the calculated ACI axial strength.
Specimen ID
𝑝 , kips
𝑝 , , kips
𝑝 ,
𝑝 𝑝 , ,
kips
𝑝 ,
𝑝 Φ𝑝 , ,
kipsΦ𝑝 ,
𝑝
S12 2,565 2,755 1.07 2,264 0.88 1,177 0.46 S12-H6 2,543 3,091 1.22 2,264 0.89 1,177 0.46 S12-L4 2,618 2,917 1.11 2,227 0.85 1,158 0.44 S12-L6 2,672 3,017 1.13 2,308 0.86 1,200 0.45 S12-F1 2,518 2,763 1.10 2,264 0.90 1,177 0.47 Average 1.13 0.88 0.46
Table 4.8 Comparison of the axial strength test results to ACI axial strength after adjustment.
Specimen ID
𝑝 , kips
𝑝 , , kips
𝑝 ,
𝑝 𝑝 , ,
kips
𝑝 ,
𝑝 Φ𝑝 , ,
kipsΦ𝑝 ,
𝑝
S12 2,565 2,450 0.96 2,015 0.79 1,048 0.41 S12-H6 2,543 2,747 1.08 2,015 0.79 1,048 0.41 S12-L4 2,618 2,586 0.99 1,977 0.75 1,028 0.39 S12-L6 2,672 2,690 1.01 2,062 0.77 1,072 0.40 S12-F1 2,518 2,457 0.98 2,015 0.80 1,048 0.42 Average 1.00 0.78 0.41
Figure 4.7 Comparison of the axial strength test results to the calculated ACI axial strength.
77
SUMMARY AND CONCLUSIONS
5.1 Summary
This study aimed at investigating the experimental behavior and strength of UHPC columns
subjected to concentrically monotonic axial loading. The experimental program consisted of nine
full-scale UHPC columns, which were the largest axially tested UHPC columns to date. The nine
UHPC column members were fabricated at the construction yard at the University of Nevada,
Reno then transported and tested at UC Berkeley PEER Laboratory at the 4000-kip [17,793 kN]
testing machine. The study considered a comprehensive test matrix consisting of two groups of
five specimens each with one specimen in common between the two groups. The two groups aimed
at investigating the effect of two main design parameters on the behavior and strength of UHPC
columns. Group I specimens focused on varying the column slenderness while Group II focused
on varying the ratios of the different types of reinforcement, i.e. longitudinal and transverse mild
reinforcement as well as steel fiber reinforcement for the UHPC mix. Using the experimental
results, this study presented a full assessment of the relevant ACI equations for estimating the
UHPC columns axial strength and the procedures used for including the slenderness effects (i.e.
applying the moment magnification method to quantify the 2nd order moments resulting from the
columns buckling). Several conclusions and design guidance and recommendations for the UHPC
columns can be drawn from the experimental results as outlined in the next two sections.
5.2 Conclusions
The findings from the experimental study and the ACI 318 assessment study performed on the
UHPC columns led to the following conclusions:
UHPC columns tested under concentric compressive axial load have a sudden compression
failure with rebars buckling followed by successive hoops rupture and/or concrete cover
spalling. Nonetheless, UHPC columns had less visual damage extent and distribution relative
to NSC columns. Moreover, spalling happens only close to or at the maximum axial load
capacity in case of UHPC.
Independent of buckling severity, increasing UHPC columns slenderness ratio will lead to a
noticeable decrease in their axial load strength, and even a larger reduction in the peak and
ultimate axial strain capacity.
78
Decreasing the confinement reinforcement of UHPC columns by 50% could lead to 12%
decrease in the axial capacity, and 24% and 28% decrease in the peak and ultimate strain,
respectively.
Decreasing the fiber reinforcement in the UHPC mix in full UHPC columns by 50% (i.e. using
1% by volume instead of 2%) does not affect the column axial capacity. However, it will
decrease the peak and ultimate strain by approximately 16%.
Increasing the UHPC columns slenderness ratio to more than 31.5 will lead to a noticeable
increase in the lateral displacements at the peak and ultimate loads.
All longitudinal reinforcing bars in the UHPC columns would yield in compression at around
70% of the respective axial load capacity of the columns.
Among the tested UHPC columns, no transverse reinforcement yielded expect for the two
slender columns that experienced excessive buckling and lateral deformations. For such cases,
the transverse reinforcement was observed to yield around the peak load. This confirms that
steel fibers play an important role in UHPC columns where it provides most of internal
confinement without significant engagement of transverse mild reinforcement as in the case of
NSC in conventional RC columns.
Using actual material properties of UHPC and longitudinal reinforcing bars, the ACI 318
equation for axial load capacity will overestimate the capacity by approximately 13%. This
value is based on the results from at least the five UHPC columns with different reinforcement
details and same slenderness ratios of 27. However, using nominal values in estimating axial
load capacity of UHPC columns based on reinforcement grade and UHPC provider will lead
to a factor of safety of at least 2.
When the ACI 318 moment magnification method is applied to slender UHPC columns, it
overestimates the 2nd order moments resulting from buckling effects, and in turn,
underestimates the UHPC columns axial load capacity by up to 25%.
79
5.3 Recommendations for Design Codes
Based on the findings from this study and after evaluating the relevant provisions from the current
ACI 318 design code, the following design recommendations are proposed to include for future
UHPC structural design guides or standards:
UHPC modulus of elasticity is recommended to be estimated as 42,000 𝑓 when used to
calculate UHPC column axial stiffness.
The effective flexural stiffness for concentrically loaded UHPC columns should be at least
equal to 0.7 of the gross stiffness of the column section when 2nd order moments are considered
for the design.
The ACI limit for allowable 2nd order moments, dictated by the upper limit value of 1.4 for the
magnification factor, should be increased in case of UHPC. This is to accommodate the high
flexural strength of the UHPC columns which sometimes reaches up to twice the flexural
strength of the NSC columns of similar size.
Based on ACI 318 criteria for determining the slenderness lower limit to include 2nd order
effects based on a 5% reduction in column axial strength, it is recommended to consider a
value of 23.5 for braced UHPC columns instead of the current value of 34. However, a more
reasonable slenderness lower limit can be taken as 32 if the 10% axial strength reduction is
adopted as per the Eurocode 2 provisions.
It is recommended to use a strength reduction factor of 0.75, instead of 0.85, for estimating the
axial capacity of UHPC columns with slenderness ratio less than 30.
80
REFERENCES
1. Aarup, B., Jensen, L. R., & Ellegaard, P. (2005). Slender CRC columns. In Nordic Concrete
Research (pp. 80-97). Nordic Concrete Federation.
2. Abokifa, M., & Moustafa, M. A. (2021). Experimental behavior of poly methyl methacrylate
polymer concrete for bridge deck bulb tee girders longitudinal field joints. Construction and
Building Materials, 270, 121840.
3. Aboukifa, M., Moustafa, M., & Itani, A. (2019a). Behavior of UHPC Column Subjected to
Combined Axial and Lateral Loading. In International Interactive Symposium on Ultra-High
Performance Concrete (Vol. 2, No. 1). Iowa State University Digital Press.
4. Aboukifa, M., Moustafa, M. A., Itani, A. M., & Naeimi, N. (2019b). Durable UHPC Columns
with High-Strength Steel (No. ABC-UTC-2013-C3-UNR02-Final). Accelerated Bridge
Construction University Transportation Center (ABC-UTC).
5. Aboukifa, M., Moustafa, M. A., & Itani, A. (2020). Comparative structural response of UHPC
and normal strength concrete columns under combined axial and lateral cyclic loading. Special
Publication, 341, 71-96.
6. Aboukifa, M., & Moustafa, M. A. (2021). Experimental seismic behavior of ultra-high
performance concrete columns with high strength steel reinforcement. Engineering
Structures, 232, 111885.
7. ACI Committee 318. (2019). Building code requirements for structural concrete: (ACI 318-
19); and commentary (ACI 318R-19). Farmington Hills, MI: American Concrete Institute.
8. ASTM C39/C39M-12. (2012). “Standard Test Method for Compressive Strength of
Cylindrical Concrete Specimens,” West Conshohocken, PA, 7 pp.
9. ASTM C1856 / C1856M-17 (2017). “Standard Practice for Fabricating and Testing Specimens
of Ultra-High Performance Concrete,” ASTM International, West Conshohocken, PA,
2017, www.astm.org
10. ASTM A706 / A706M-16, Standard Specification for Deformed and Plain Low-Alloy Steel
Bars for Concrete Reinforcement, ASTM International, West Conshohocken, PA,
2016, www.astm.org
11. ASTM A615 / A615M-20, Standard Specification for Deformed and Plain Carbon-Steel Bars
for Concrete Reinforcement, ASTM International, West Conshohocken, PA,
2020, www.astm.org

81
12. Burkart, I., & Müller, H. S. (2008). Creep and shrinkage characteristics of ultra high strength
concrete (UHPC). In Proceedings of the Second International Symposium on Ultra High
Performance Concrete (pp. 469-476).
13. Dhakal, S., & Moustafa, M. A. (2019). MC-BAM: Moment–curvature analysis for beams with
advanced materials. SoftwareX, 9, 175-182.
14. Graybeal, B. A. (2006). Material property characterization of ultra-high performance
concrete (No. FHWA-HRT-06-103). United States. Federal Highway Administration. Office
of Infrastructure Research and Development.
15. Graybeal, B. A. (2007). Compressive behavior of ultra-high-performance fiber-reinforced
concrete. ACI materials journal, 104(2), 146.
16. Graybeal, B. A., & Baby, F. (2013). Development of Direct Tension Test Method for Ultra-
High-Performance Fiber-Reinforced Concrete. ACI Materials Journal, 110(2).
17. Graybeal, B., & Tanesi, J. (2007). Durability of an ultrahigh-performance concrete. Journal of
materials in civil engineering, 19(10), 848-854.
18. Haber, Z. B., Munoz, J. F., & Graybeal, B. A. (2017). Field testing of an ultra-high
performance concrete overlay (No. FHWA-HRT-17-096). United States. Federal Highway
Administration. Office of Infrastructure Research and Development.
19. Hosinieh, M. M., Aoude, H., Cook, W. D., & Mitchell, D. (2015). Behavior of ultra-high
performance fiber reinforced concrete columns under pure axial loading. Engineering
Structures, 99, 388-401.
20. Hung, C. C., & Hu, F. Y. (2018). Behavior of high-strength concrete slender columns
strengthened with steel fibers under concentric axial loading. Construction and Building
Materials, 175, 422-433.
21. Hung, C. C., Hu, F. Y., & Yen, C. H. (2018). Behavior of slender UHPC columns under
eccentric loading. Engineering Structures, 174, 701-711.
22. Hung, C. C., & Yen, C. H. (2021). Compressive behavior and strength model of reinforced
UHPC short columns. Journal of Building Engineering, 35, 102103.
23. Joe CD, Moustafa MA. Cost and ecological feasibility of using UHPC in bridge piers. In first
international interactive symposium on UHPC; 2016. p. 18-20.
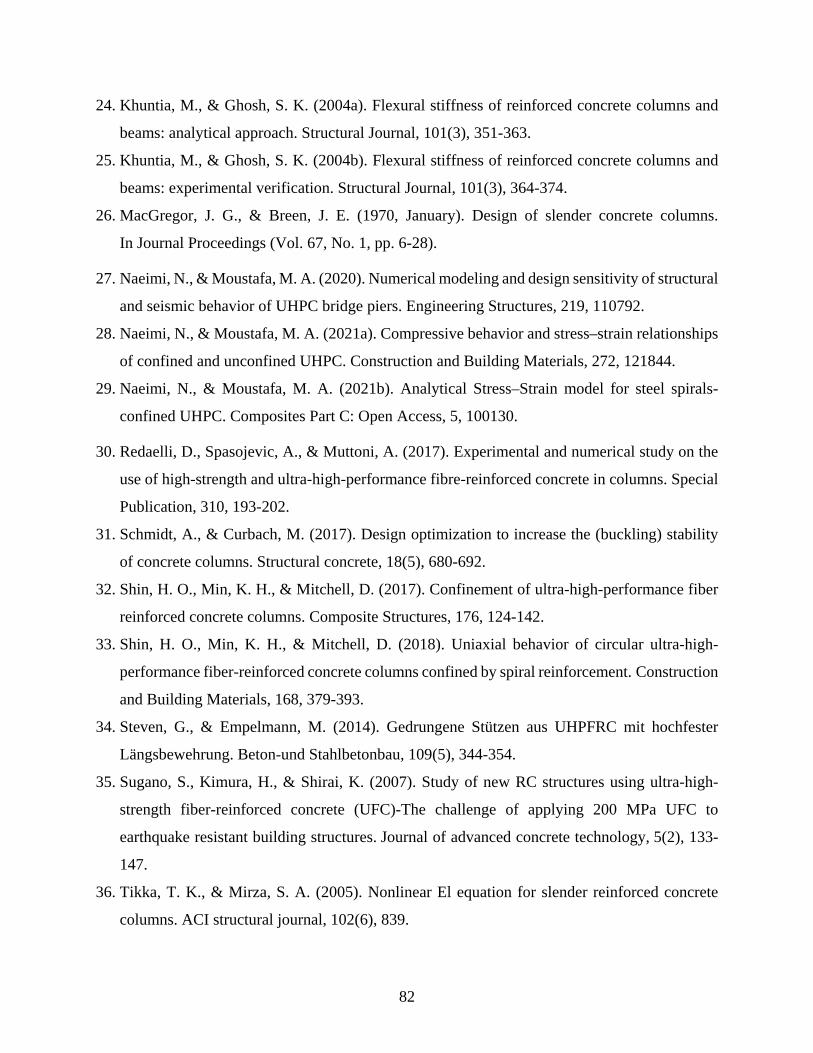
82
24. Khuntia, M., & Ghosh, S. K. (2004a). Flexural stiffness of reinforced concrete columns and
beams: analytical approach. Structural Journal, 101(3), 351-363.
25. Khuntia, M., & Ghosh, S. K. (2004b). Flexural stiffness of reinforced concrete columns and
beams: experimental verification. Structural Journal, 101(3), 364-374.
26. MacGregor, J. G., & Breen, J. E. (1970, January). Design of slender concrete columns.
In Journal Proceedings (Vol. 67, No. 1, pp. 6-28).
27. Naeimi, N., & Moustafa, M. A. (2020). Numerical modeling and design sensitivity of structural
and seismic behavior of UHPC bridge piers. Engineering Structures, 219, 110792.
28. Naeimi, N., & Moustafa, M. A. (2021a). Compressive behavior and stress–strain relationships
of confined and unconfined UHPC. Construction and Building Materials, 272, 121844.
29. Naeimi, N., & Moustafa, M. A. (2021b). Analytical Stress–Strain model for steel spirals-
confined UHPC. Composites Part C: Open Access, 5, 100130.
30. Redaelli, D., Spasojevic, A., & Muttoni, A. (2017). Experimental and numerical study on the
use of high-strength and ultra-high-performance fibre-reinforced concrete in columns. Special
Publication, 310, 193-202.
31. Schmidt, A., & Curbach, M. (2017). Design optimization to increase the (buckling) stability
of concrete columns. Structural concrete, 18(5), 680-692.
32. Shin, H. O., Min, K. H., & Mitchell, D. (2017). Confinement of ultra-high-performance fiber
reinforced concrete columns. Composite Structures, 176, 124-142.
33. Shin, H. O., Min, K. H., & Mitchell, D. (2018). Uniaxial behavior of circular ultra-high-
performance fiber-reinforced concrete columns confined by spiral reinforcement. Construction
and Building Materials, 168, 379-393.
34. Steven, G., & Empelmann, M. (2014). Gedrungene Stützen aus UHPFRC mit hochfester
Längsbewehrung. Beton‐und Stahlbetonbau, 109(5), 344-354.
35. Sugano, S., Kimura, H., & Shirai, K. (2007). Study of new RC structures using ultra-high-
strength fiber-reinforced concrete (UFC)-The challenge of applying 200 MPa UFC to
earthquake resistant building structures. Journal of advanced concrete technology, 5(2), 133-
147.
36. Tikka, T. K., & Mirza, S. A. (2005). Nonlinear El equation for slender reinforced concrete
columns. ACI structural journal, 102(6), 839.

83
APPENDIX A: CONSTRUCTION BIDDING DOCUMENT AND DRAWINGS
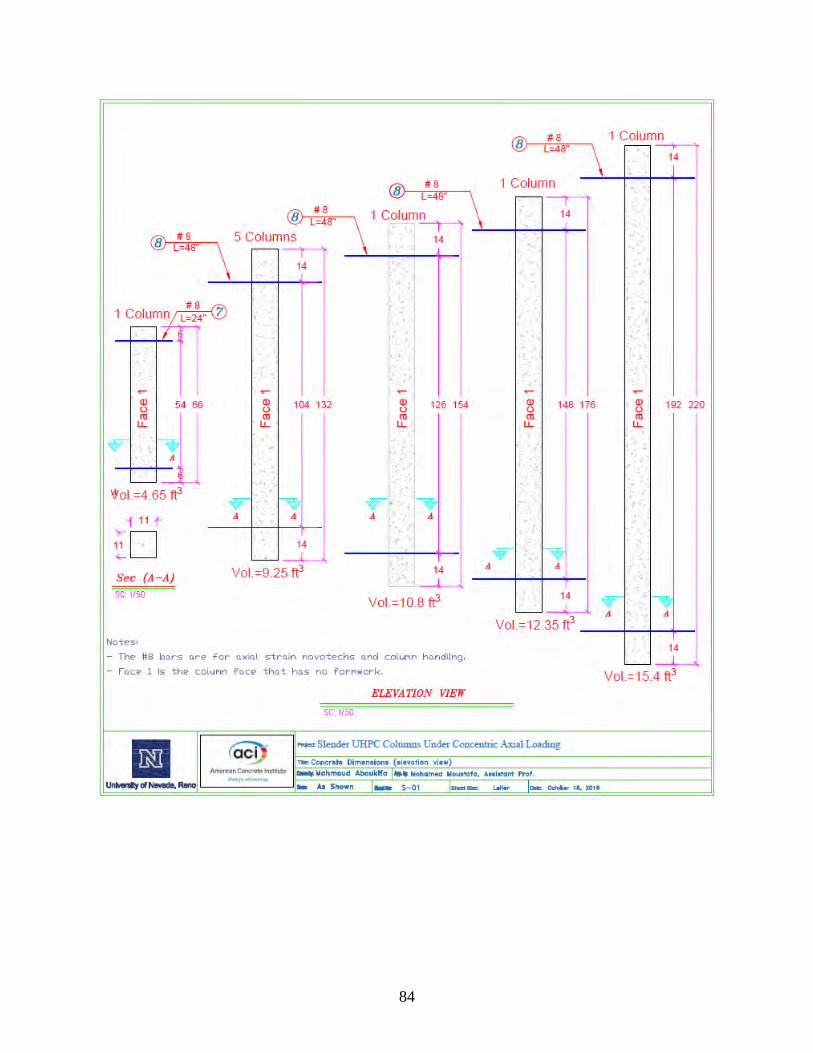
84

85
86

87
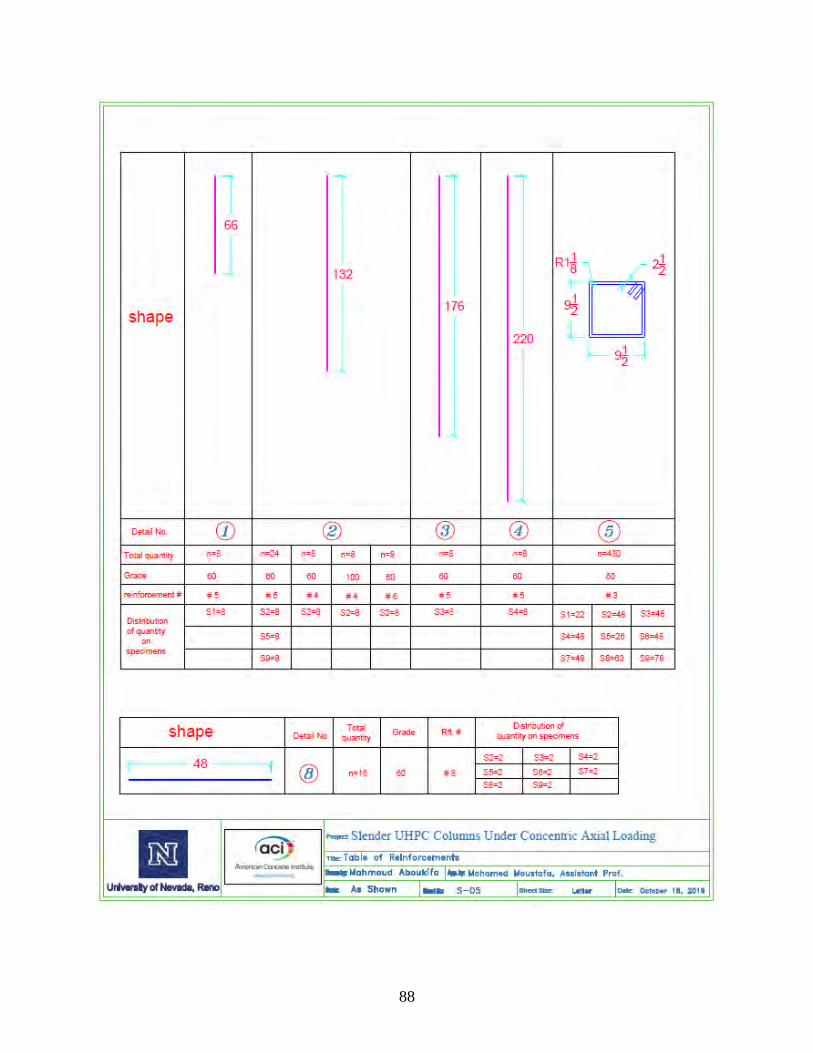
88
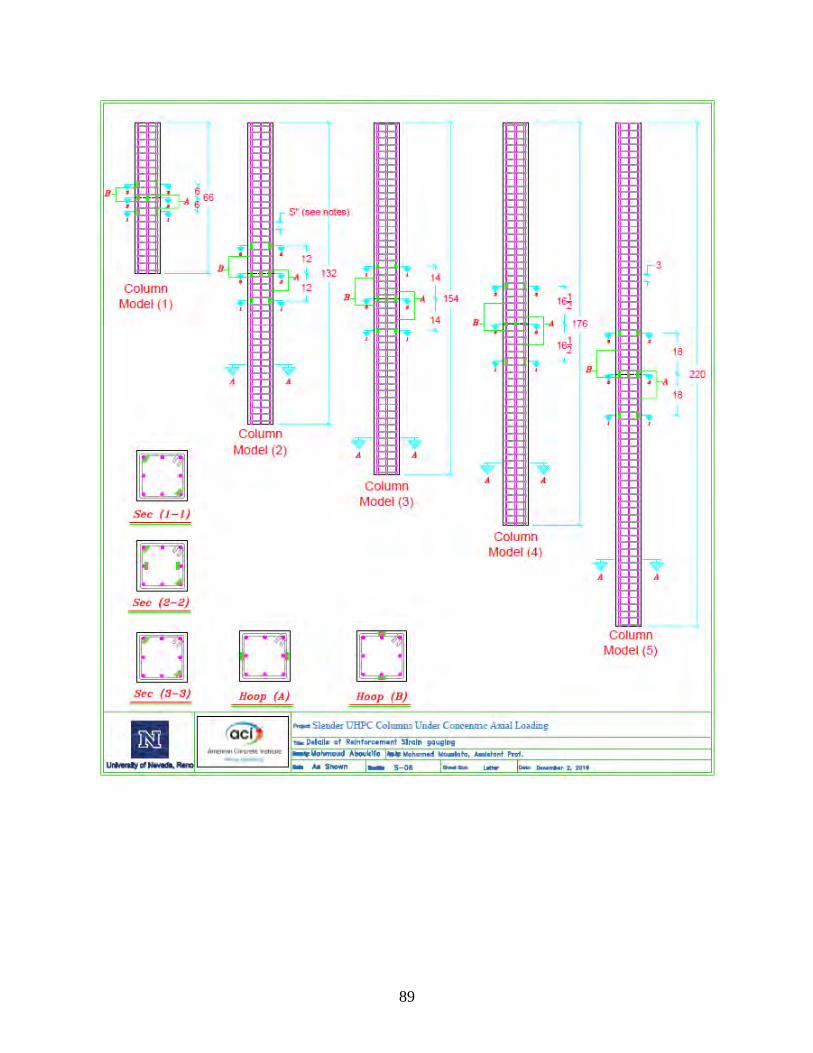
89
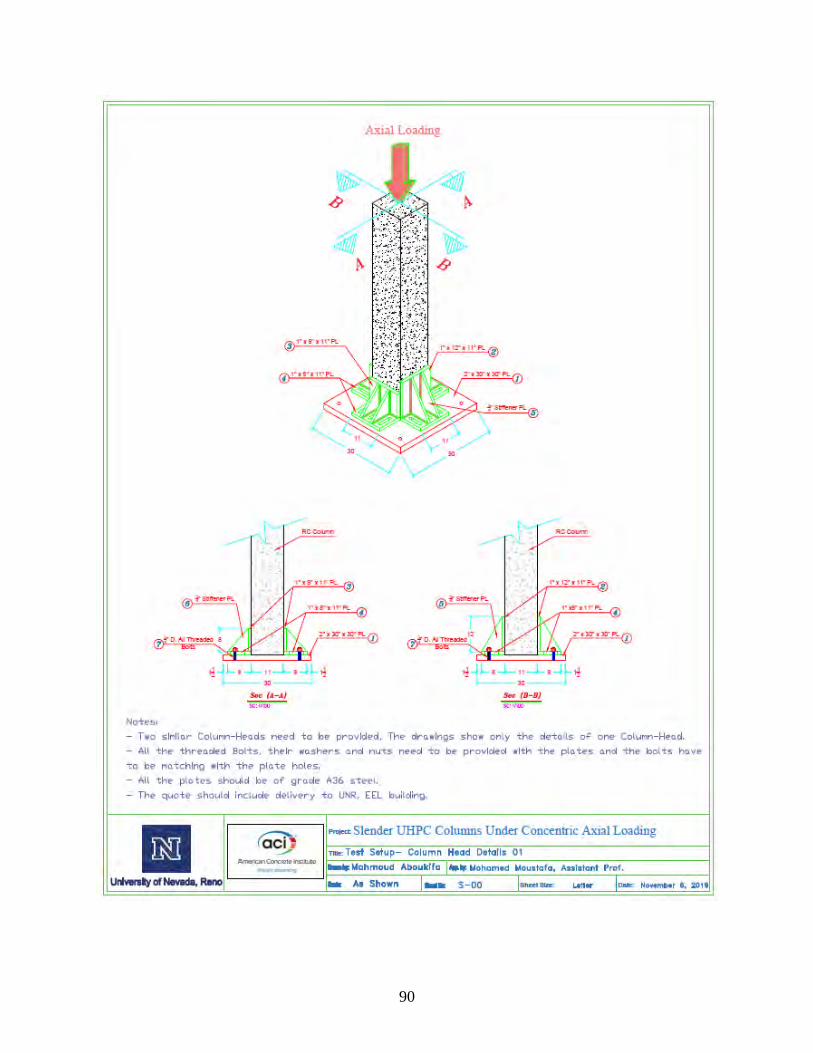
90

91
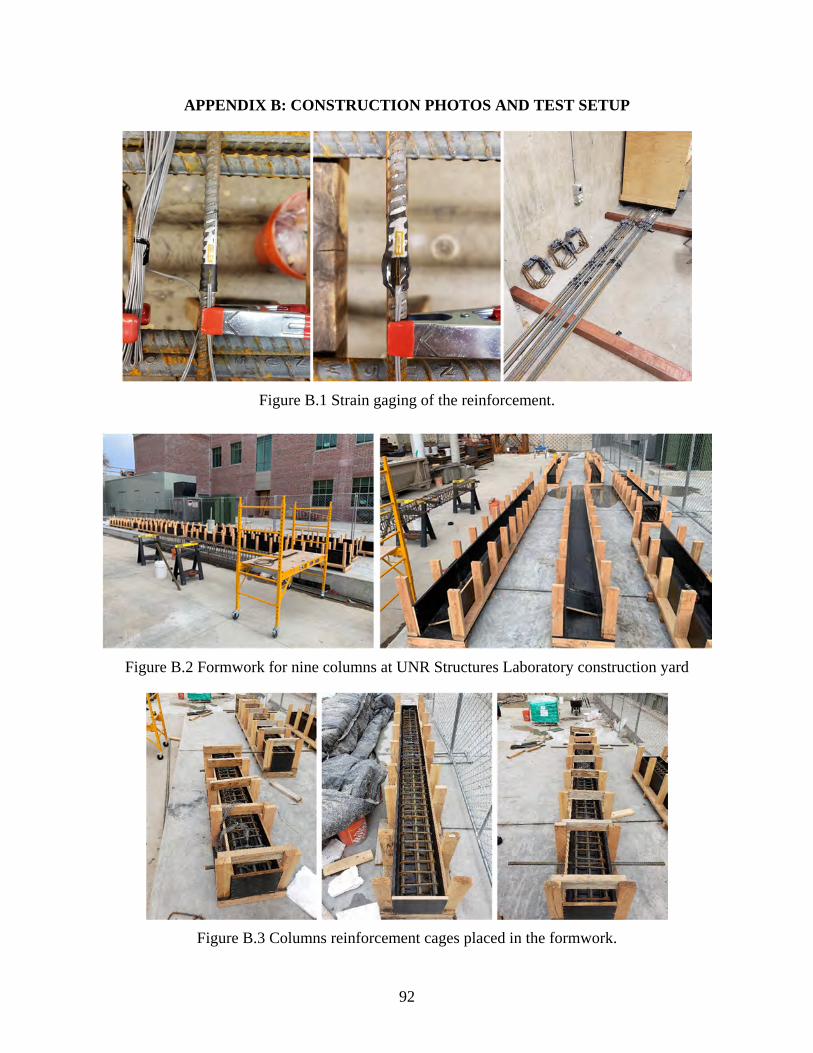
92
APPENDIX B: CONSTRUCTION PHOTOS AND TEST SETUP
Figure B.1 Strain gaging of the reinforcement.
Figure B.2 Formwork for nine columns at UNR Structures Laboratory construction yard
Figure B.3 Columns reinforcement cages placed in the formwork.
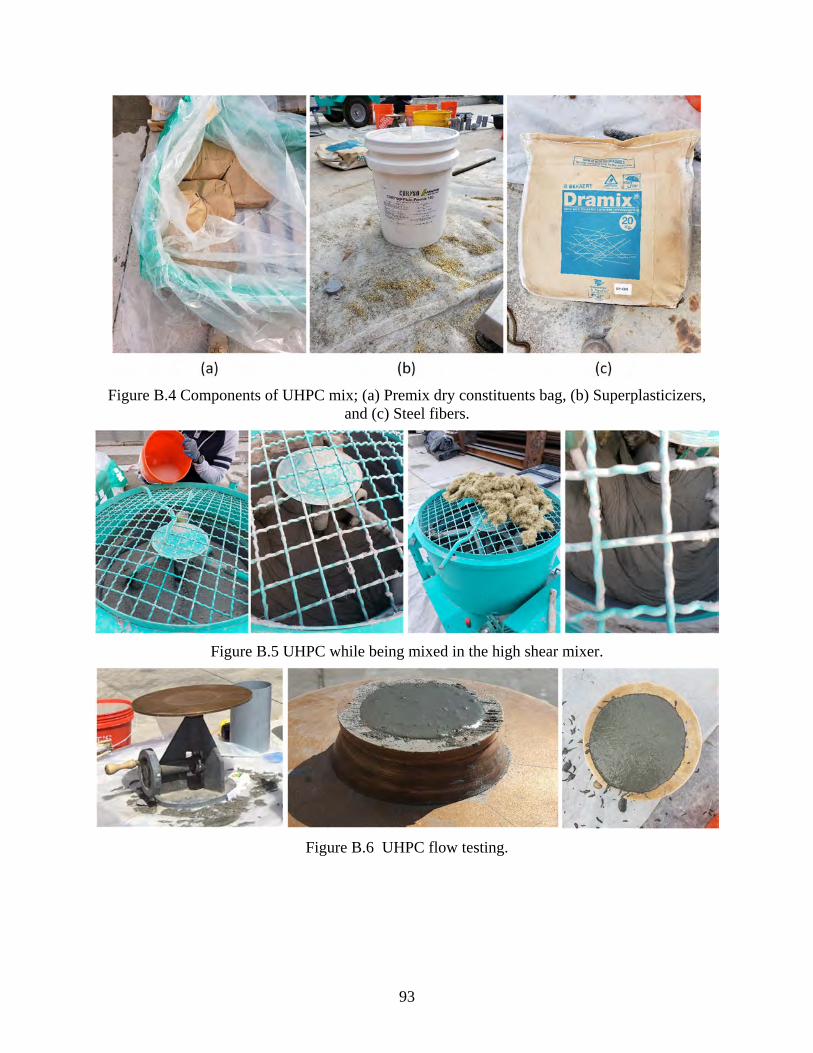
93
Figure B.4 Components of UHPC mix; (a) Premix dry constituents bag, (b) Superplasticizers, and (c) Steel fibers.
Figure B.5 UHPC while being mixed in the high shear mixer.
Figure B.6 UHPC flow testing.
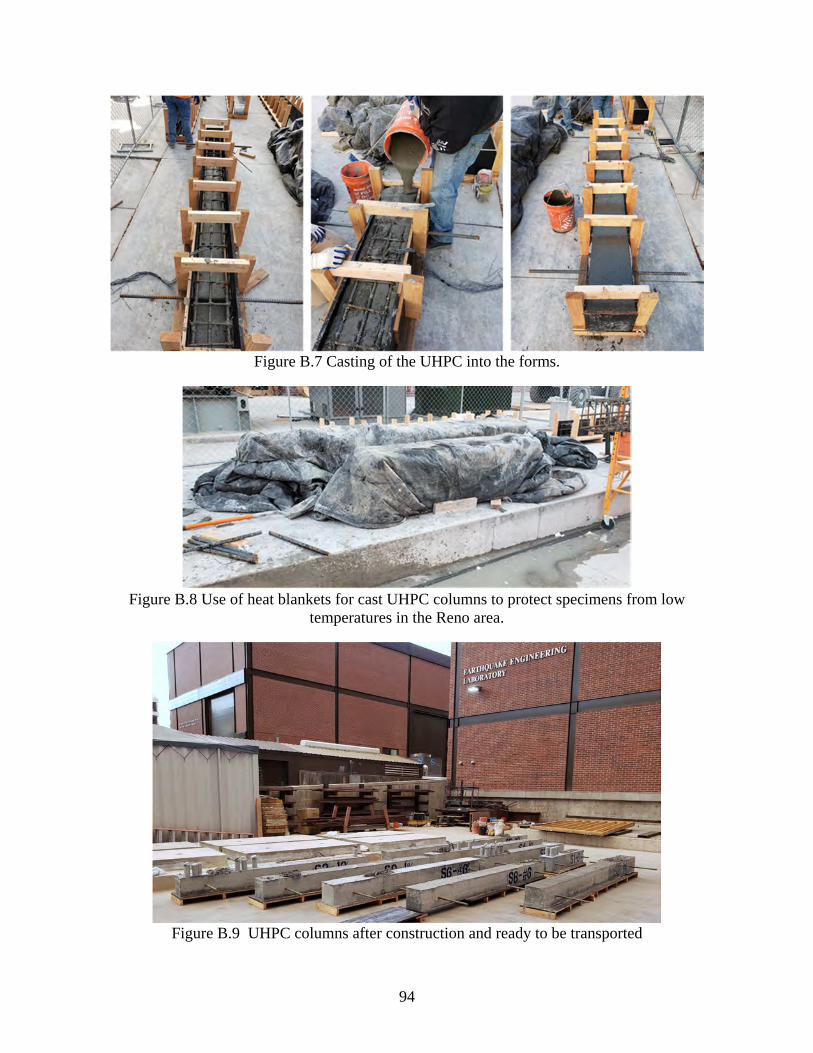
94
Figure B.7 Casting of the UHPC into the forms.
Figure B.8 Use of heat blankets for cast UHPC columns to protect specimens from low
temperatures in the Reno area.
Figure B.9 UHPC columns after construction and ready to be transported
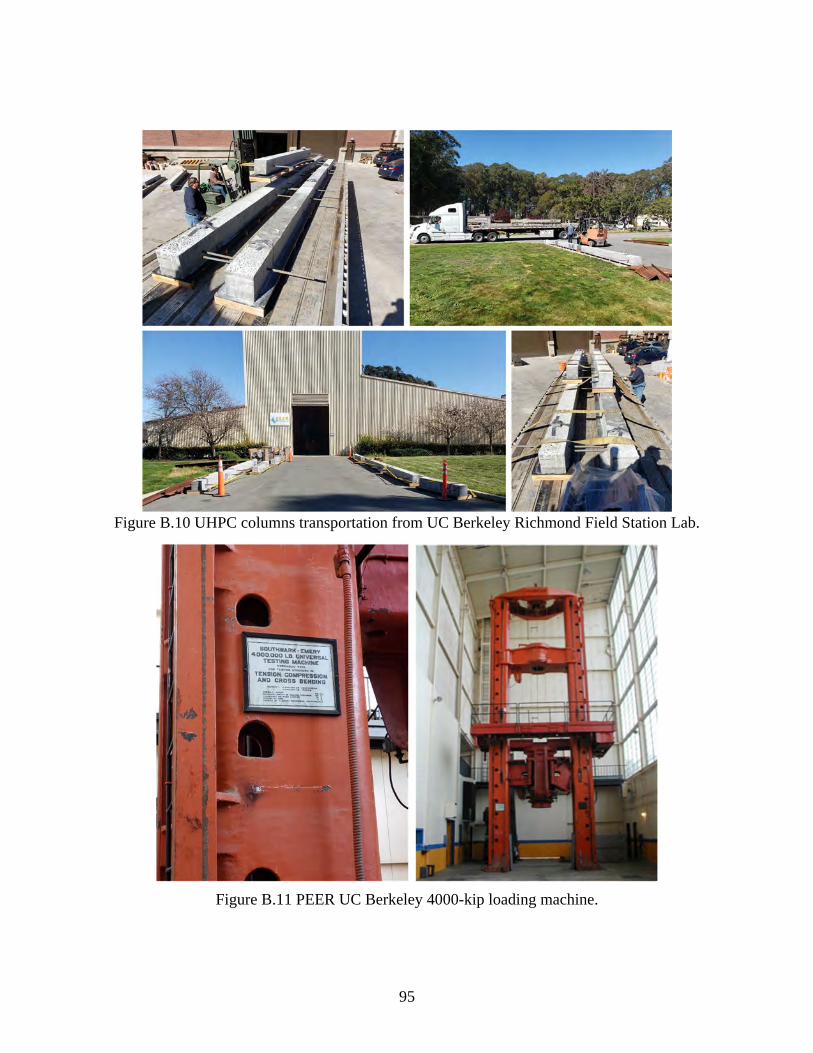
95
Figure B.10 UHPC columns transportation from UC Berkeley Richmond Field Station Lab.
Figure B.11 PEER UC Berkeley 4000-kip loading machine.
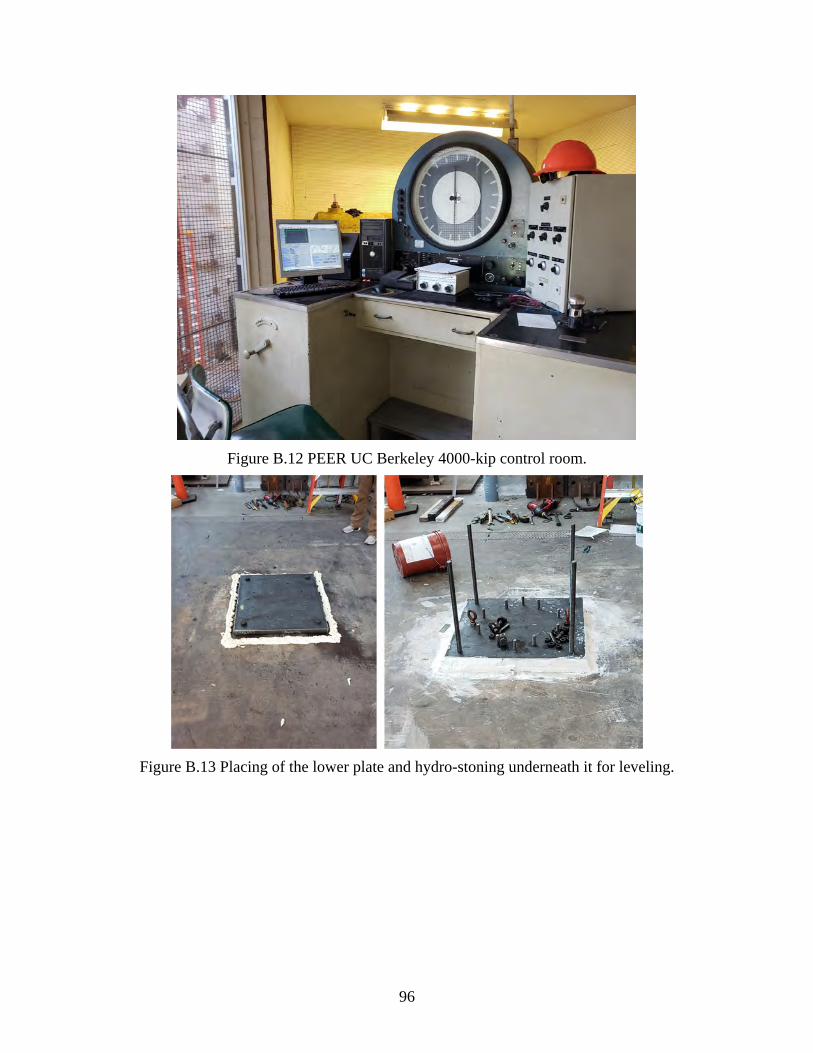
96
Figure B.12 PEER UC Berkeley 4000-kip control room.
Figure B.13 Placing of the lower plate and hydro-stoning underneath it for leveling.
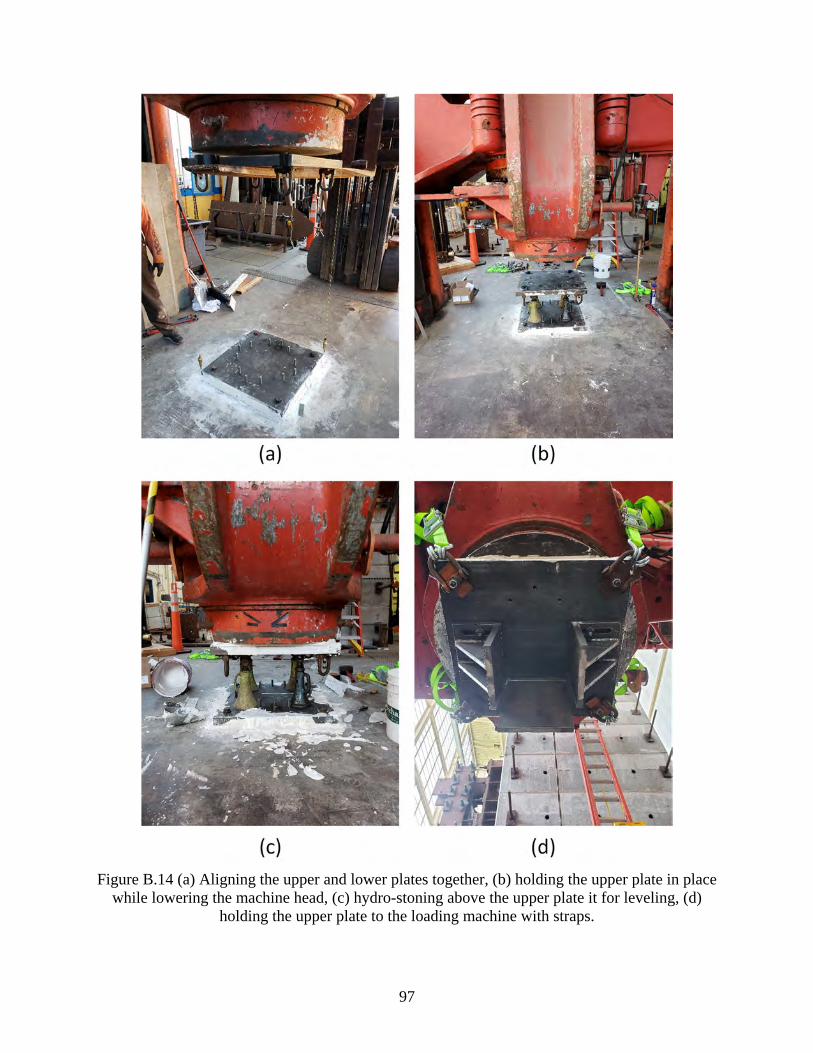
97
Figure B.14 (a) Aligning the upper and lower plates together, (b) holding the upper plate in place while lowering the machine head, (c) hydro-stoning above the upper plate it for leveling, (d)
holding the upper plate to the loading machine with straps.

98
Figure B.15 Grinding of the extra parts at the column ends to make the columns stand leveled.
Figure B.16 Putting a roller underneath the column and driving it inside the lab.
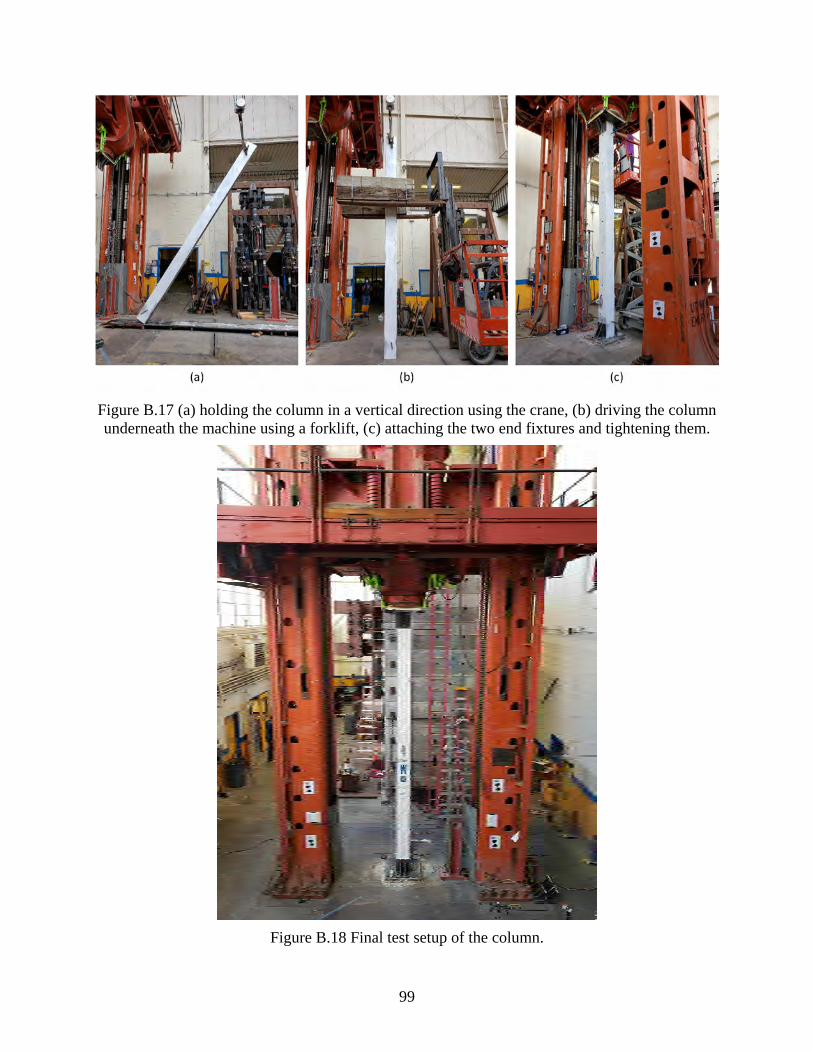
99
Figure B.17 (a) holding the column in a vertical direction using the crane, (b) driving the column underneath the machine using a forklift, (c) attaching the two end fixtures and tightening them.
Figure B.18 Final test setup of the column.
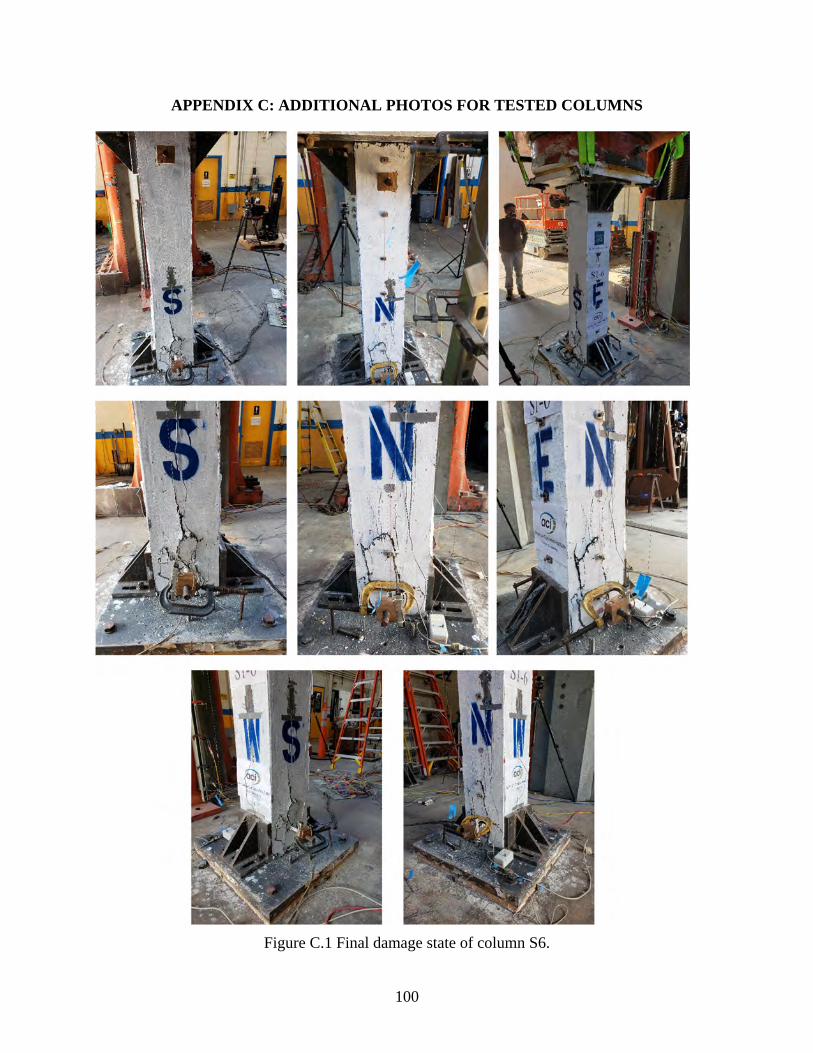
100
APPENDIX C: ADDITIONAL PHOTOS FOR TESTED COLUMNS
Figure C.1 Final damage state of column S6.
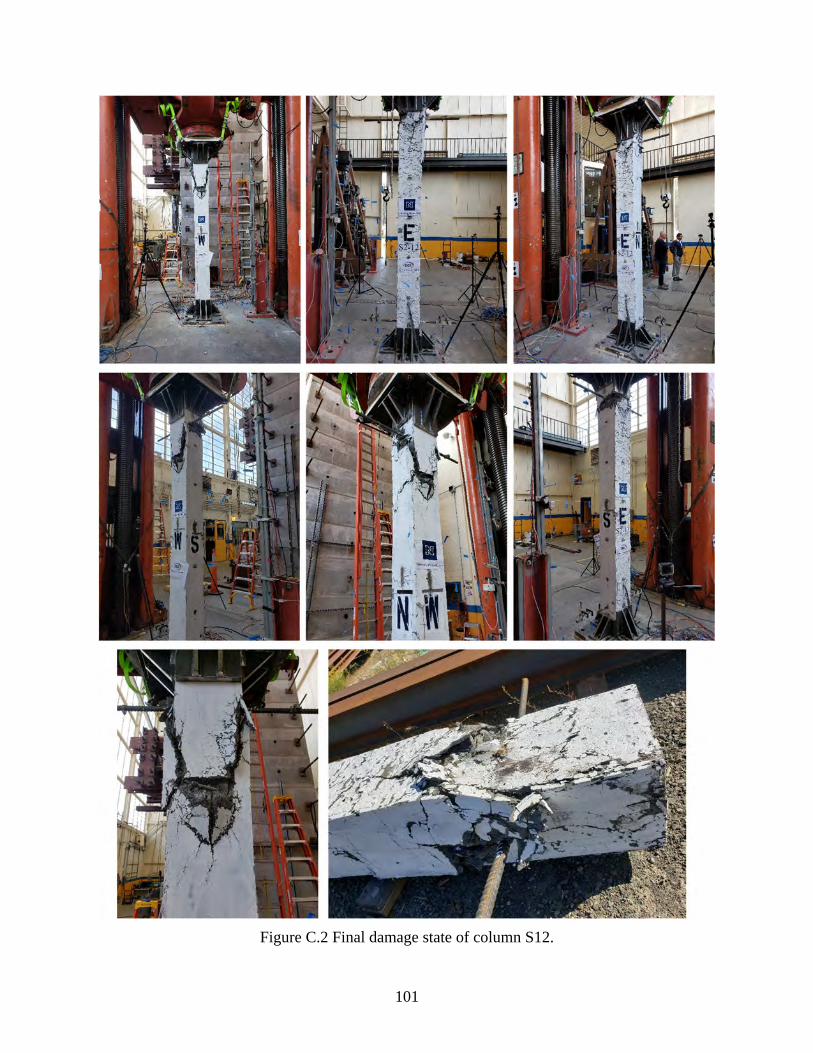
101
Figure C.2 Final damage state of column S12.

102
Figure C.3 Final damage state of column S14.
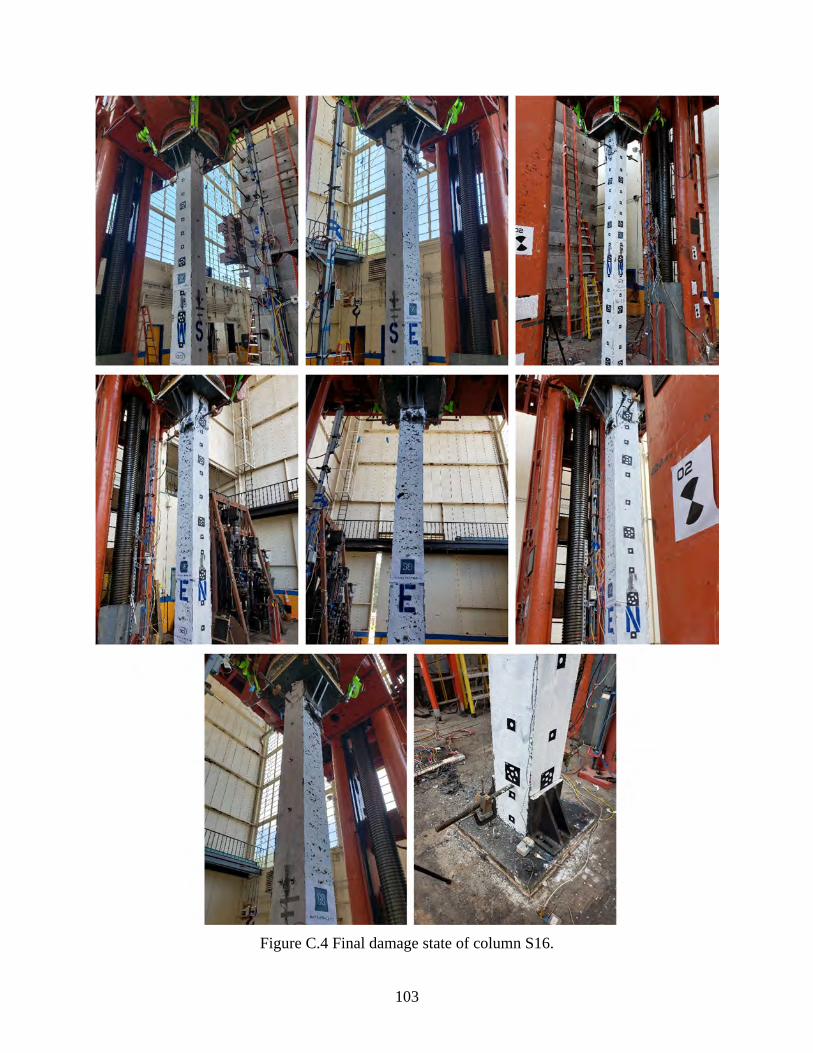
103
Figure C.4 Final damage state of column S16.

104
Figure C.5 Final damage state of column S20.
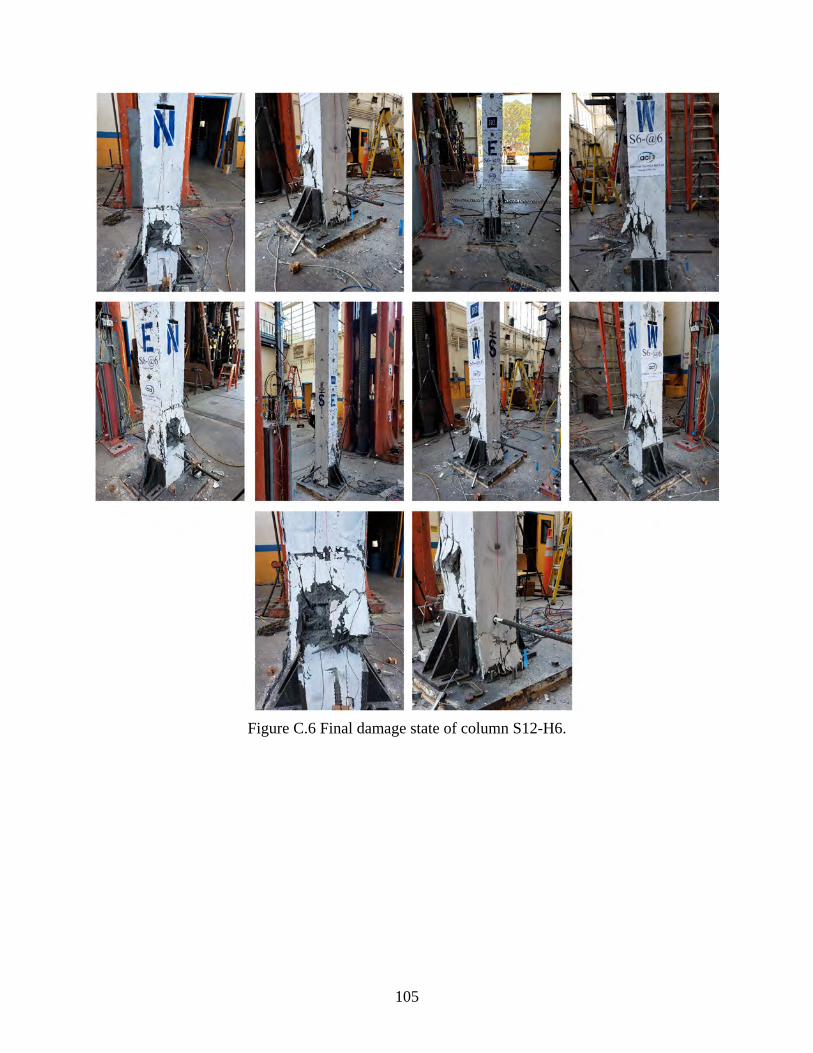
105
Figure C.6 Final damage state of column S12-H6.

106
Figure C.7 Final damage state of column S12-L4.

107
Figure C.8 Final damage state of column S12-L6.
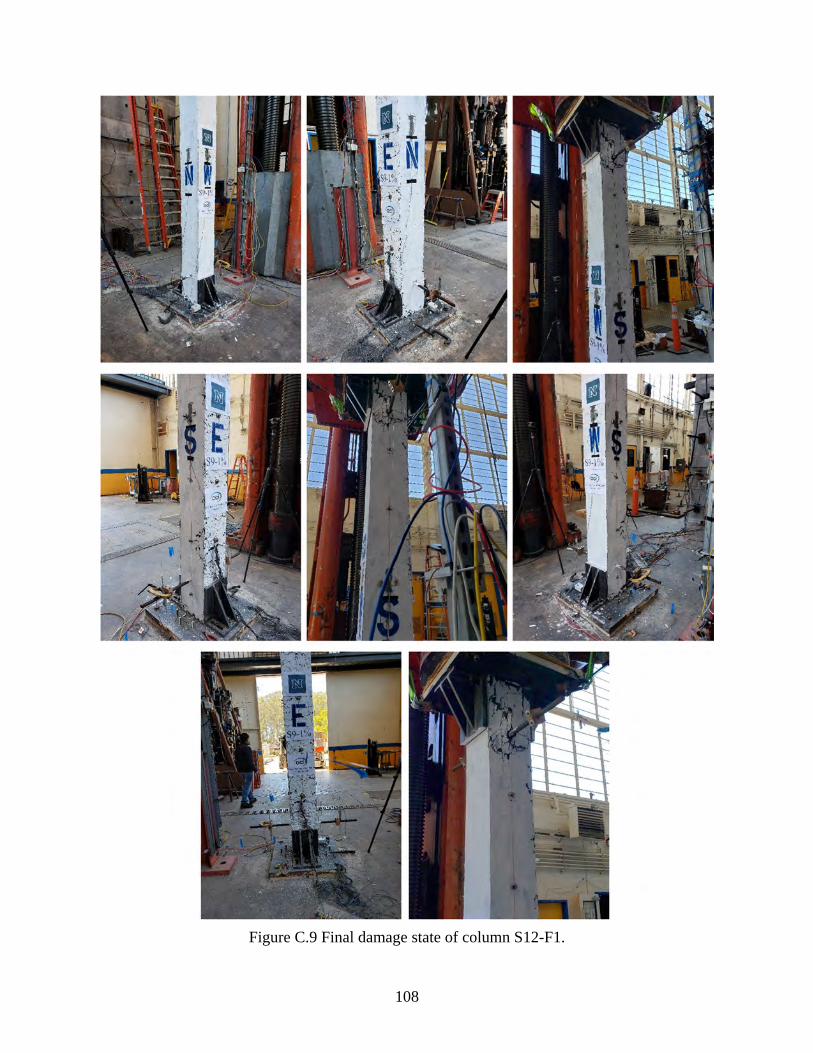
108
Figure C.9 Final damage state of column S12-F1.