Ultimate Collapse Strength Assessment of Damaged Steel ... · 1 Ultimate Collapse Strength...
41
1 Ultimate Collapse Strength Assessment of Damaged Steel Plated Grillages Underwood James M a, *, Sobey Adam J a , Blake James I R a , Shenoi R. Ajit a a Fluid Structure Interactions Group, University of Southampton, United Kingdom *Corresponding Address: Fluid Structure Interactions Group, University of Southampton, Building 176/3031, University Road, Southampton, SO16 7QF, United Kingdom. Tel: +44 2380 597773 Fax: +44 2380 597744 email: j [email protected] Abstract Across many industries damage events leading to a breach in structural integrity continue to occur. An area where this can lead to particularly unsafe conditions is in the maritime environment, where it may be difficult to rescue crew and cargo. In order to improve structural safety through design for the survivability or to assess the residual strength of a damaged vessel in an emergency response or salvage scenario, it is critical to understand the influence of the damage. This paper investigates the use of FEA on ultimate collapse strength of damaged steel grillages and the influence of the damage aperture on the developing failure modes within the structure. The study finds that the presence of damage, in the form of a hole, can lead to the failure mode changing as damage aperture size is increased leading to significant changes to the ultimate collapse strength of the structure. It concludes that to assess the damaged strength of steel plated structures, it is critical that modelling methods are able to capture and account for such mode changes in order to accurately assess the true residual strength of the structure. Keywords Ultimate Collapse Strength, Steel-Plated Grillages, Damaged Strength, Residual Strength, FEA, Progressive Collapse.
Transcript of Ultimate Collapse Strength Assessment of Damaged Steel ... · 1 Ultimate Collapse Strength...

1
Ultimate Collapse Strength Assessment of Damaged Steel Plated
Grillages
Underwood James M a,*, Sobey Adam J
a, Blake James I R
a, Shenoi R. Ajit
a
a Fluid Structure Interactions Group, University of Southampton, United Kingdom
*Corresponding Address: Fluid Structure Interactions Group, University of Southampton, Building
176/3031, University Road, Southampton, SO16 7QF, United Kingdom.
Tel: +44 2380 597773
Fax: +44 2380 597744
email: j [email protected]
Abstract
Across many industries damage events leading to a breach in structural integrity continue to occur.
An area where this can lead to particularly unsafe conditions is in the maritime environment, where it
may be difficult to rescue crew and cargo. In order to improve structural safety through design for the
survivability or to assess the residual strength of a damaged vessel in an emergency response or
salvage scenario, it is critical to understand the influence of the damage. This paper investigates the
use of FEA on ultimate collapse strength of damaged steel grillages and the influence of the damage
aperture on the developing failure modes within the structure. The study finds that the presence of
damage, in the form of a hole, can lead to the failure mode changing as damage aperture size is
increased leading to significant changes to the ultimate collapse strength of the structure. It concludes
that to assess the damaged strength of steel plated structures, it is critical that modelling methods are
able to capture and account for such mode changes in order to accurately assess the true residual
strength of the structure.
Keywords
Ultimate Collapse Strength, Steel-Plated Grillages, Damaged Strength, Residual Strength, FEA,
Progressive Collapse.
2
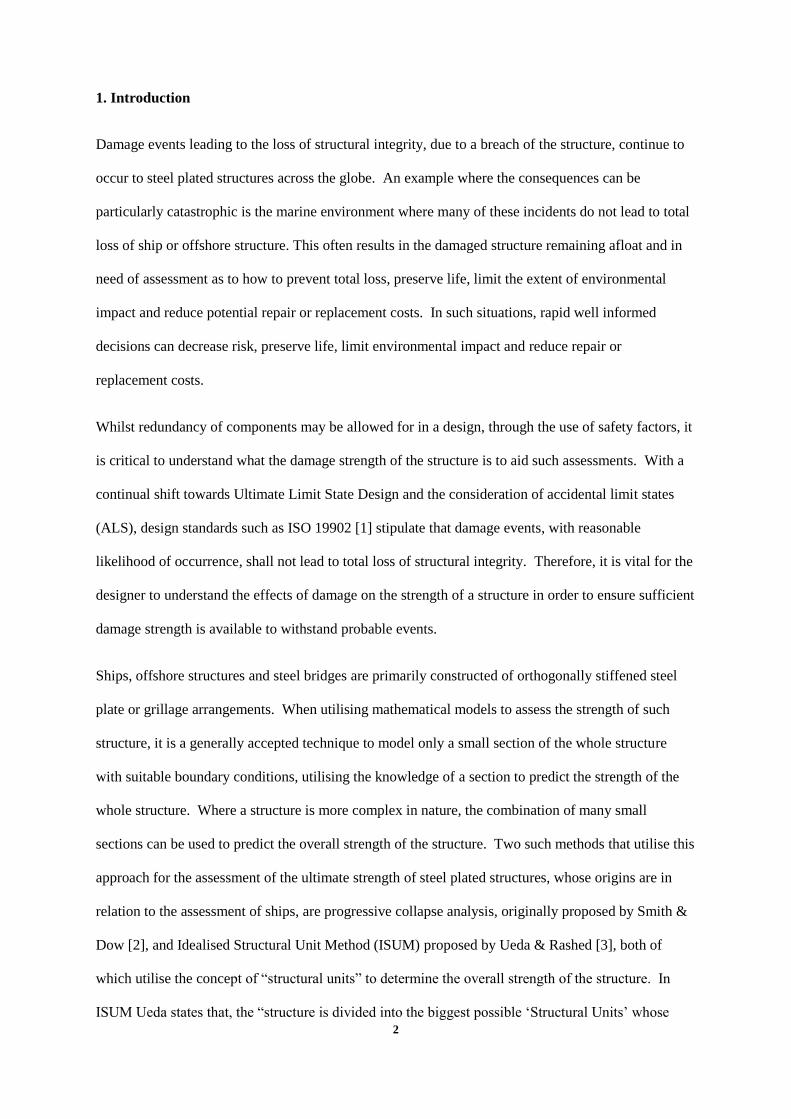
1. Introduction
Damage events leading to the loss of structural integrity, due to a breach of the structure, continue to
occur to steel plated structures across the globe. An example where the consequences can be
particularly catastrophic is the marine environment where many of these incidents do not lead to total
loss of ship or offshore structure. This often results in the damaged structure remaining afloat and in
need of assessment as to how to prevent total loss, preserve life, limit the extent of environmental
impact and reduce potential repair or replacement costs. In such situations, rapid well informed
decisions can decrease risk, preserve life, limit environmental impact and reduce repair or
replacement costs.
Whilst redundancy of components may be allowed for in a design, through the use of safety factors, it
is critical to understand what the damage strength of the structure is to aid such assessments. With a
continual shift towards Ultimate Limit State Design and the consideration of accidental limit states
(ALS), design standards such as ISO 19902 [1] stipulate that damage events, with reasonable
likelihood of occurrence, shall not lead to total loss of structural integrity. Therefore, it is vital for the
designer to understand the effects of damage on the strength of a structure in order to ensure sufficient
damage strength is available to withstand probable events.
Ships, offshore structures and steel bridges are primarily constructed of orthogonally stiffened steel
plate or grillage arrangements. When utilising mathematical models to assess the strength of such
structure, it is a generally accepted technique to model only a small section of the whole structure
with suitable boundary conditions, utilising the knowledge of a section to predict the strength of the
whole structure. Where a structure is more complex in nature, the combination of many small
sections can be used to predict the overall strength of the structure. Two such methods that utilise this
approach for the assessment of the ultimate strength of steel plated structures, whose origins are in
relation to the assessment of ships, are progressive collapse analysis, originally proposed by Smith &
Dow [2], and Idealised Structural Unit Method (ISUM) proposed by Ueda & Rashed [3], both of
which utilise the concept of “structural units” to determine the overall strength of the structure. In
ISUM Ueda states that, the “structure is divided into the biggest possible ‘Structural Units’ whose
3
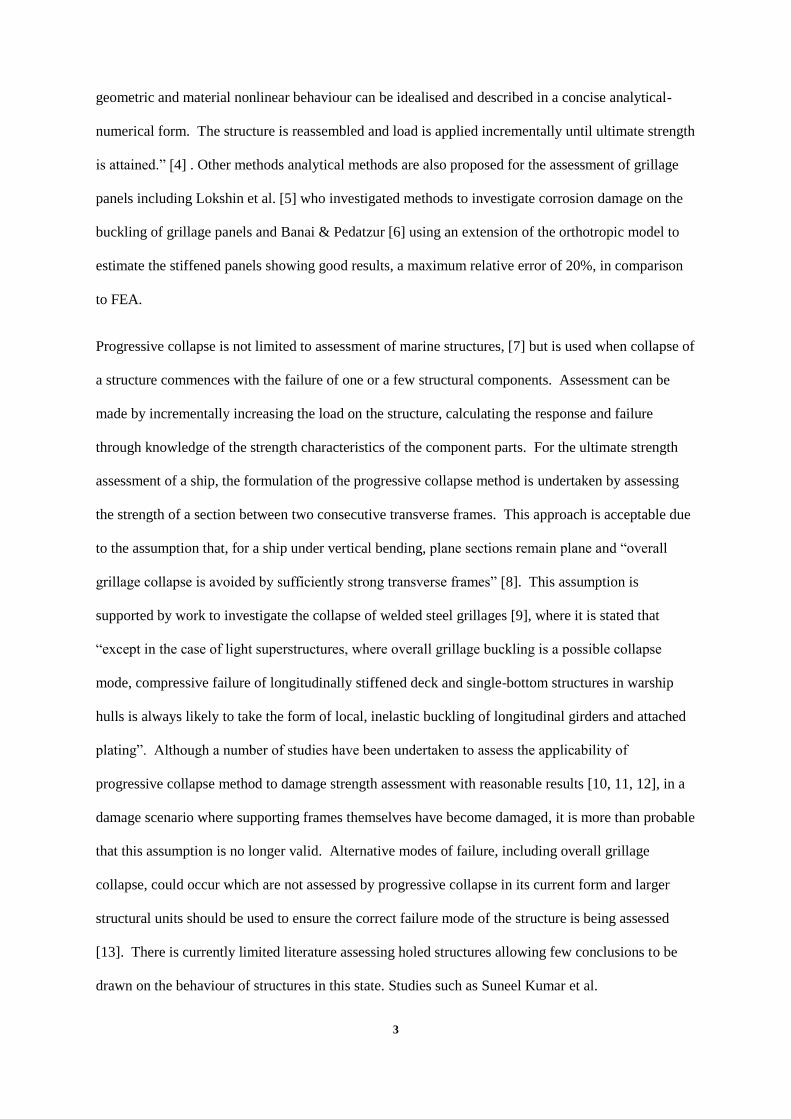
geometric and material nonlinear behaviour can be idealised and described in a concise analytical-
numerical form. The structure is reassembled and load is applied incrementally until ultimate strength
is attained.” [4] . Other methods analytical methods are also proposed for the assessment of grillage
panels including Lokshin et al. [5] who investigated methods to investigate corrosion damage on the
buckling of grillage panels and Banai & Pedatzur [6] using an extension of the orthotropic model to
estimate the stiffened panels showing good results, a maximum relative error of 20%, in comparison
to FEA.
Progressive collapse is not limited to assessment of marine structures, [7] but is used when collapse of
a structure commences with the failure of one or a few structural components. Assessment can be
made by incrementally increasing the load on the structure, calculating the response and failure
through knowledge of the strength characteristics of the component parts. For the ultimate strength
assessment of a ship, the formulation of the progressive collapse method is undertaken by assessing
the strength of a section between two consecutive transverse frames. This approach is acceptable due
to the assumption that, for a ship under vertical bending, plane sections remain plane and “overall
grillage collapse is avoided by sufficiently strong transverse frames” [8]. This assumption is
supported by work to investigate the collapse of welded steel grillages [9], where it is stated that
“except in the case of light superstructures, where overall grillage buckling is a possible collapse
mode, compressive failure of longitudinally stiffened deck and single-bottom structures in warship
hulls is always likely to take the form of local, inelastic buckling of longitudinal girders and attached
plating”. Although a number of studies have been undertaken to assess the applicability of
progressive collapse method to damage strength assessment with reasonable results [10, 11, 12], in a
damage scenario where supporting frames themselves have become damaged, it is more than probable
that this assumption is no longer valid. Alternative modes of failure, including overall grillage
collapse, could occur which are not assessed by progressive collapse in its current form and larger
structural units should be used to ensure the correct failure mode of the structure is being assessed
[13]. There is currently limited literature assessing holed structures allowing few conclusions to be
drawn on the behaviour of structures in this state. Studies such as Suneel Kumar et al.
4
[14],Alagusundaramoorthy et al. [15] and Saad-Elden et al. [16] have shown the behaviour of holed
stiffened structures by finite element analysis (FEA) on single stiffened panels but larger structures
must be assessed to determine structural behaviour after damage.
Previous work by the authors [17, 18, 19] has shown how damage can affect the collapse modes that
form in the surrounding undamaged plating for scenarios where a stiffened panel, under axially
compressive load along its longitudinal stiffeners, has sustained damage in the form of a hole. In these
cases the supporting transverse frames are not damaged. It is predicted that such changes in mode
shapes could lead to overall grillage collapse modes occurring in the structure which would not be
calculated when modelling small sections of the structure. It is therefore important to assess damage
scenarios utilising FEA to determine the accuracy of currently used computational techniques and
assess the boundaries within which these models can be applied.
This paper presents the assessment of a number of grillage arrangements that may typically be found
within ship and offshore structures. The arrangements feature damage in the form of a diamond
shaped hole of varying size and location to assess its influence on the overall collapse strength of the
structure, showing that the mode of failure is affected by the damage size and that level of structural
idealisation currently used in structural assessment tools can lead to inaccuracies in assessing these
affects.
2. Structural Modelling
2.1 Overview
Analysis of the collapse strength of grillage structures is a complex problem. Whilst previous
analysis has been undertaken on intact structures both analytically and experimentally [9, 20, 21, 22],
little previous work has been undertaken to investigate the strength of damaged or holed grillage
structures nor how such damage would affect the mode of failure encountered.
Most steel plated structures are made up of orthogonally stiffened plates or grillage arrangements.
Structures representative of those found predominantly in marine application have been used in the
5
analysis presented in this paper, for example deck or keel structure of a ship with in-plane axial
loading applied by global bending loads.
Hughes [23] states that three failure modes exist that must be considered, assuming failure of the
structure is by interframe collapse, that is the failure of the structure due to collapse between adjacent
transverse frames: failure of stiffener, failure of plate and failure of both stiffener and plate
combination. However, as noted by Paik et al. [24], when considering the failure of a grillage
arrangement a total of six possible failure modes may exist, whereby the “real ultimate strength is the
minimum value of ultimate strengths obtained from the six solutions.” [25].
• Mode I: overall collapse mode;
• Mode II: collapse of plating between stiffeners without failure of stiffeners;
• Mode III: beam-column type collapse of stiffeners with attached plating;
• Mode IV: local buckling of stiffener web after collapse of plating;
• Mode V: lateral-torsional buckling of stiffeners after collapse of plating;
• Mode VI: gross yielding of entire panel.
In order to tackle the problem as accurately and practically as possible, the required analysis has been
undertaken using finite element method (FEM).
FEM was applied to four different grillage arrangements to determine the effect that the damage
aperture can have on the failure mode of a grillage arrangement, changing the mode of failure away
from the currently assumed interframe collapse. Within each arrangement a damage aperture was
gradually increased in size and the effect on the overall collapse load and failure modes developed as
a result of in-plane axial compressive loading has been studied.
2.2 Structural Modelling by FEM
2.2.1 Overall Geometry Definition
In all cases, the completed analysis is of grillage arrangements featuring four regularly spaced
identical longitudinal stiffeners and five deeper orthogonally connected equally spaced transverse
stiffeners. The grillage is assumed to be bounded at its transverse ends by deep frames or bulkheads

6
which are assumed to remain plane and along its longitudinal edges by further grillage structure. The
loading condition for the grillage is an in-plane compressive load along the length of the longitudinal
stiffeners until the panel is unable to support any further load, at which point the ultimate compressive
strength can be calculated. The load has been applied to the grillage in the form of a stepped
displacement of the loaded edge.
Zhang et al. [26] present data relating to the plate slenderness ratio (β), Eq.1, and column slenderness
ratio (λ), Eq. 2, for structure within the midship region for a total of 22 oil tankers and bulk carriers.
This shows that the slenderness ratio encountered within these arrangements is between 1.0 and 2.5
and column slenderness of 0.2 to 1.0. Although these values push the boundaries of likely structure to
be found within commercial ship and offshore structures, analysis has been undertaken of four
grillage arrangements of plate slenderness ratios 1, 2, 3 & 4 to account for arrangements that may be
used in other applications. This is achieved by varying the longitudinal stiffener spacing whilst
maintaining a constant plate thickness. In all cases the Indian Standard Angle stiffener profile
ISA70456 was used for all longitudinal stiffeners and all transverse stiffeners used Admiralty T-bar
Type 2, 4.5”, whose dimensions are shown in Table 1, with attached plate of constant thickness of
6mm. This leads to column slenderness ratios of 0.61, 0.66, 0.67, 0.68 for each arrangement
respectively, maintaining a transverse stiffener spacing of 1500mm in all cases.
Et
b y
(1)
yL
r E
(2)
In the above relationships, ‘σy’ is the Yield Stress of the material, ‘E’ is the Young’s Modulus, ‘b’ is
the panel breadth or longitudinal stiffener spacing ,‘t’ is the plate thickness, ‘L’ is the panel length or
transverse stiffener spacing and ‘r’ is the radius of gyration based on the effective width of attached
plate.
7
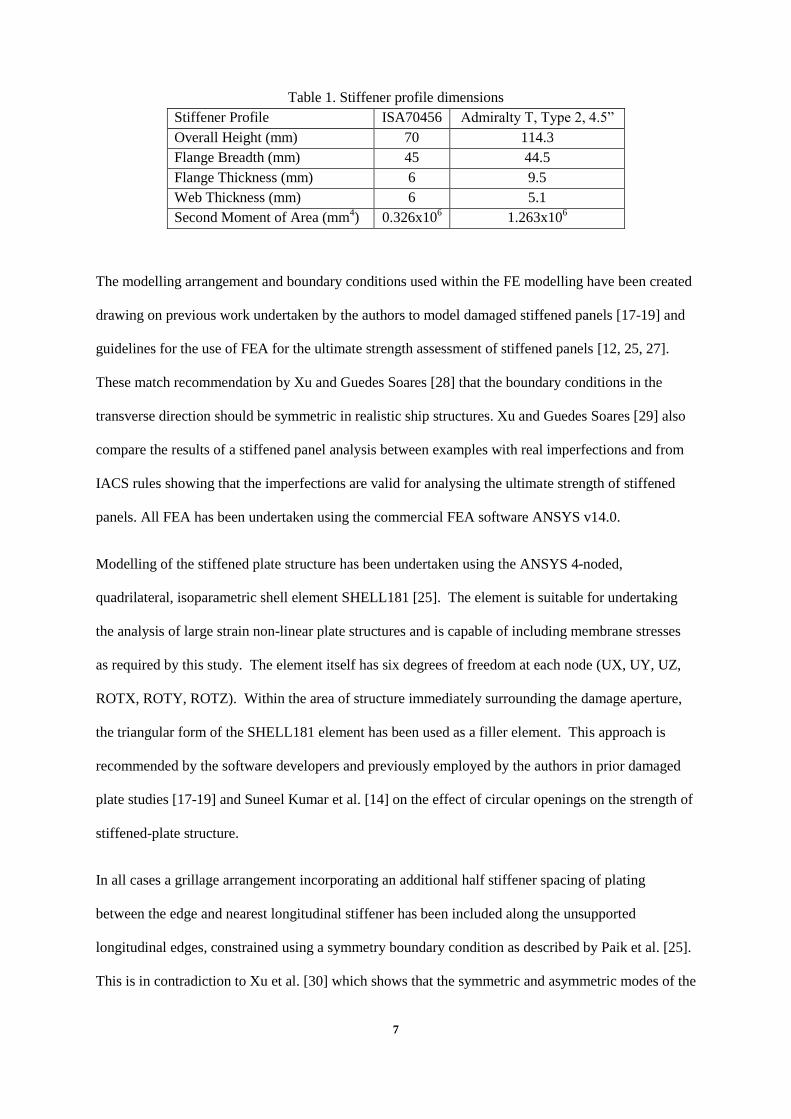
Table 1. Stiffener profile dimensions
Stiffener Profile ISA70456 Admiralty T, Type 2, 4.5”
Overall Height (mm) 70 114.3
Flange Breadth (mm) 45 44.5
Flange Thickness (mm) 6 9.5
Web Thickness (mm) 6 5.1
Second Moment of Area (mm4) 0.326x10
6 1.263x10
6
The modelling arrangement and boundary conditions used within the FE modelling have been created
drawing on previous work undertaken by the authors to model damaged stiffened panels [17-19] and
guidelines for the use of FEA for the ultimate strength assessment of stiffened panels [12, 25, 27].
These match recommendation by Xu and Guedes Soares [28] that the boundary conditions in the
transverse direction should be symmetric in realistic ship structures. Xu and Guedes Soares [29] also
compare the results of a stiffened panel analysis between examples with real imperfections and from
IACS rules showing that the imperfections are valid for analysing the ultimate strength of stiffened
panels. All FEA has been undertaken using the commercial FEA software ANSYS v14.0.
Modelling of the stiffened plate structure has been undertaken using the ANSYS 4-noded,
quadrilateral, isoparametric shell element SHELL181 [25]. The element is suitable for undertaking
the analysis of large strain non-linear plate structures and is capable of including membrane stresses
as required by this study. The element itself has six degrees of freedom at each node (UX, UY, UZ,
ROTX, ROTY, ROTZ). Within the area of structure immediately surrounding the damage aperture,
the triangular form of the SHELL181 element has been used as a filler element. This approach is
recommended by the software developers and previously employed by the authors in prior damaged
plate studies [17-19] and Suneel Kumar et al. [14] on the effect of circular openings on the strength of
stiffened-plate structure.
In all cases a grillage arrangement incorporating an additional half stiffener spacing of plating
between the edge and nearest longitudinal stiffener has been included along the unsupported
longitudinal edges, constrained using a symmetry boundary condition as described by Paik et al. [25].
This is in contradiction to Xu et al. [30] which shows that the symmetric and asymmetric modes of the
8
initial plate deflection should be included to allow all failure modes to develop automatically which is
supported by Xu et al. [31] which recommends restrained boundary conditions in the longitudinal
directions for FEA and experiments; however, Xu et al. [30] goes on to show that for biaxially
loaded plates this change to the boundary conditions made only a small difference to the collapse
strength. Along the loaded ends, a full stiffener spacing has been included between the edge and
nearest transverse stiffener and a clamped boundary condition applied to simulate connection of the
grillage to stiffer structure, for example bulkhead or deep frames, at each end. On the loaded edge, an
additional coupled constraint equation is applied to ensure the load is applied uniformly across the
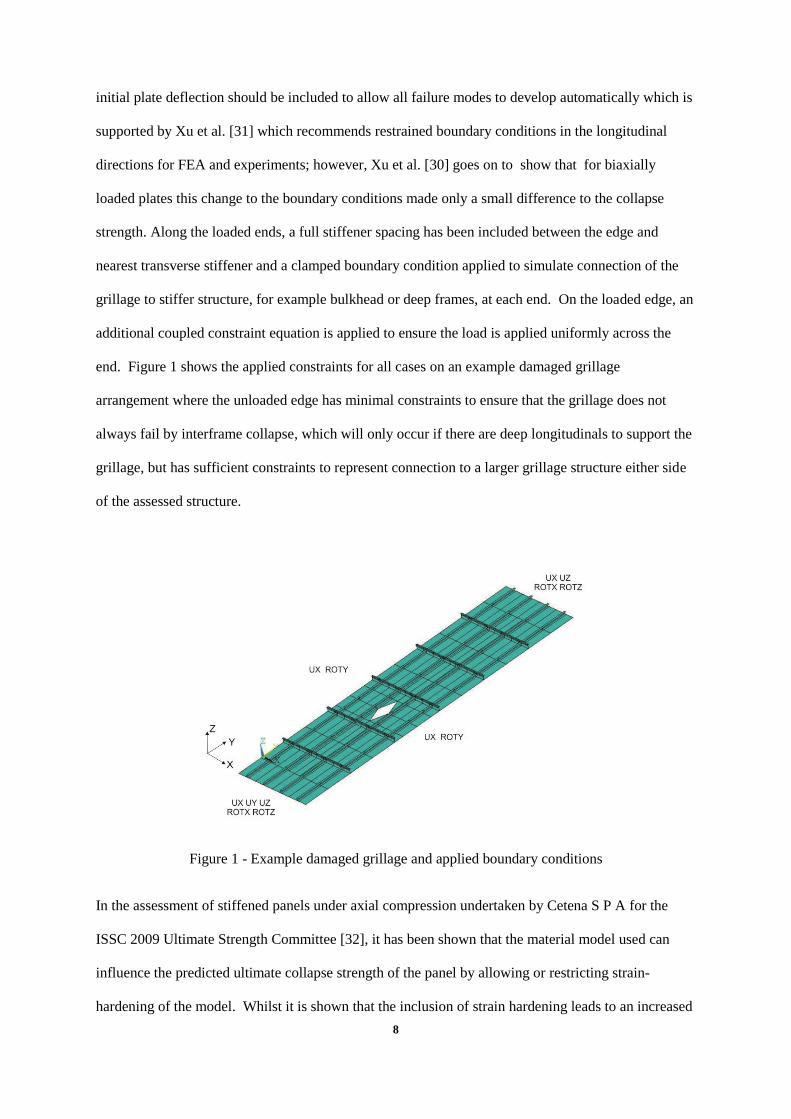
end. Figure 1 shows the applied constraints for all cases on an example damaged grillage
arrangement where the unloaded edge has minimal constraints to ensure that the grillage does not
always fail by interframe collapse, which will only occur if there are deep longitudinals to support the
grillage, but has sufficient constraints to represent connection to a larger grillage structure either side
of the assessed structure.
Figure 1 - Example damaged grillage and applied boundary conditions
In the assessment of stiffened panels under axial compression undertaken by Cetena S P A for the
ISSC 2009 Ultimate Strength Committee [32], it has been shown that the material model used can
influence the predicted ultimate collapse strength of the panel by allowing or restricting strain-
hardening of the model. Whilst it is shown that the inclusion of strain hardening leads to an increased
9
ultimate collapse strength of the panel due to increased stiffness, the modes of failure do not change.
Therefore, throughout this study, no strain hardening has been included in the applied material model
through utilisation of an elasto-perfectly plastic stress-strain relationship, so as to provide a
conservative prediction of the ultimate collapse strength. A Young’s Modulus of 200GPa, Poisson’s
Ratio of 0.3 and Yield Stress of the material of 250MPa are used throughout the study. Assessment of
crack propagation within the structure has not been included in the analysis, though it is appreciated to
be a potential cause of failure in damaged structures.
2.2.2 Initial Imperfection Definition
Initial imperfections in steel grillages are predominantly due to the welding process during
fabrication, where weld induced residual stresses are introduced due to the heat generated from the
process leading to deformation of the panel which does not reduce once cooled [33, 34]. Initial
imperfections are noted to be a significant parameter in the design and modelling of stiffened panels
[32] and are believed to be a similarly influential parameter for the modelling of orthogonally
stiffened panels. Within this study, the sensitivity of the failure load due to initial deflection size has
not been investigated. However, to avoid the failure of the panel resulting from pure compression of
the material due to geometrical ideology, and to allow the model to assume its appropriate natural
failure mode during FE analysis, initial imperfections in the plate and longitudinal stiffeners have
been introduced into the grillage prior to application of the in-plane axial compressive load. No
residual stresses have been included in the model, which is assumed to be in an unstressed state prior
to application of the compressive axial load. Whilst residual stresses will affect the failure of the
structure these stresses are difficult to predict, particularly for a damaged arrangement, and the
unstressed state will allow trends and guidance to be generated. Whilst it is accepted that the
exclusion of residual stresses may affect strain level at which the ultimate strength occurs, it is not
believed that the exclusion will affect the mode of failure that occurs within the grillage.
In total, three initial imperfections have been included in the grillage model, plate vertical
imperfection (wopl), stiffener column-type vertical imperfection (woc) and stiffener sideways
imperfection (wos). All three imperfections have been applied through the use of Fourier series
10
(Equations 3-5) based on a specified maximum initial imperfection for each type for an average
imperfection type (Table 2), for which the Smith [35] average imperfection relationship has been used
for plate and stiffener column imperfection and ISSC 2009 [32] for stiffener sideways imperfection.
𝑤𝑜𝑝𝑙 = [∑ 𝐴𝑜𝑚sin(𝑚𝜋𝑥
𝑎) 𝑠𝑖𝑛 (
𝜋𝑦
𝑏)𝑚
𝑖=1 ]𝑤𝑜𝑝𝑙𝑚 (3)
𝑤𝑜𝑐 = [∑ 𝐴𝑜𝑖sin(𝑖𝜋𝑈
𝑎)𝑛
𝑖=1 ]𝑤𝑜𝑐𝑚 (4)
𝑤𝑜𝑠 = [𝑊
ℎ𝑤∑ 𝐴𝑜𝑖sin(
𝑖𝜋𝑈
𝑎)𝑛
𝑖=1 ]𝑤𝑜𝑠𝑚 (5)
where Ao is the coefficient of the initial deflection shape, m and i are the mode shape numbers, a and
b are the plate or stiffener length and plate breadth respectively, x and y are the location along the
length and across the breadth of the plate respectively, U is the position along the length of the
stiffener and woplm, wocm, and wosm are the maximum imperfection values for each imperfection type.
Table 2: Maximum initial imperfection definitions for stiffened steel panels
Smith [35] ISSC [32]
Slight Average Severe
woplm 0.025β2t 0.1β2
t 0.3β2t b/200
wocm (λ>0.2)
(λ>0.4)
(λ>0.6)
0.00025a
0.0008a
0.0012a
0.0015a
0.002a
0.0038a
0.0046a
0.0015a
wosm - - - 0.0015a
When considering the initial imperfection shape of the plating of a stiffened steel plated structure, it is
often considered more realistic to model the imperfection shape as a single displacement direction in a
“hungry” or “thin-horse” mode [35,36,37], whereby the deflection direction between stiffeners is the
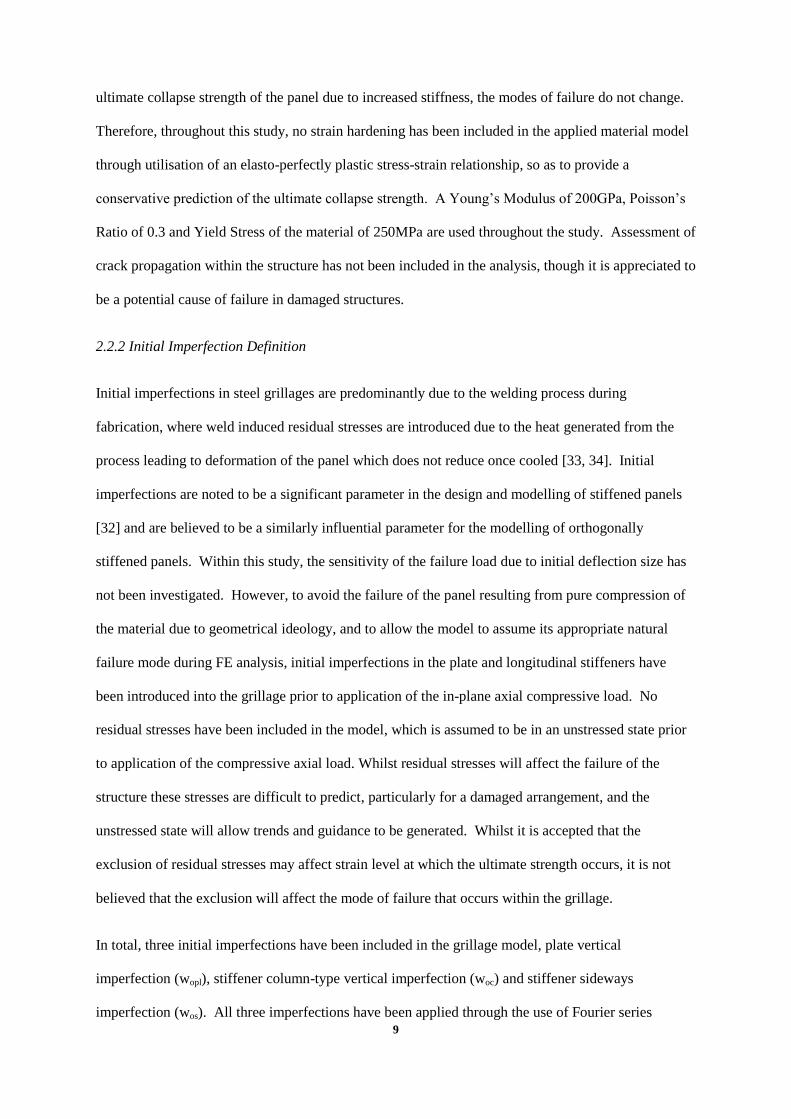
same across the panel and not alternating as would be the case for a standard sine wave form. Along
the length of the plate, the dominant form of weld induced imperfections is of a “barrelled” shape
(Figure 2) [33, 38]. Configuration of this form has been achieved through the summation of the single
half sine wave mode having coefficient Ao of 0.8, with the lowest elastic buckling mode plus one
((a/b)+1), together having coefficient 0.2. To prevent the developed shape being perfectly
11
symmetrical, which can lead to solution convergence issues within the FEA as the whole panel begins
to collapse simultaneously, the second mode above the lowest elastic buckling mode is also included
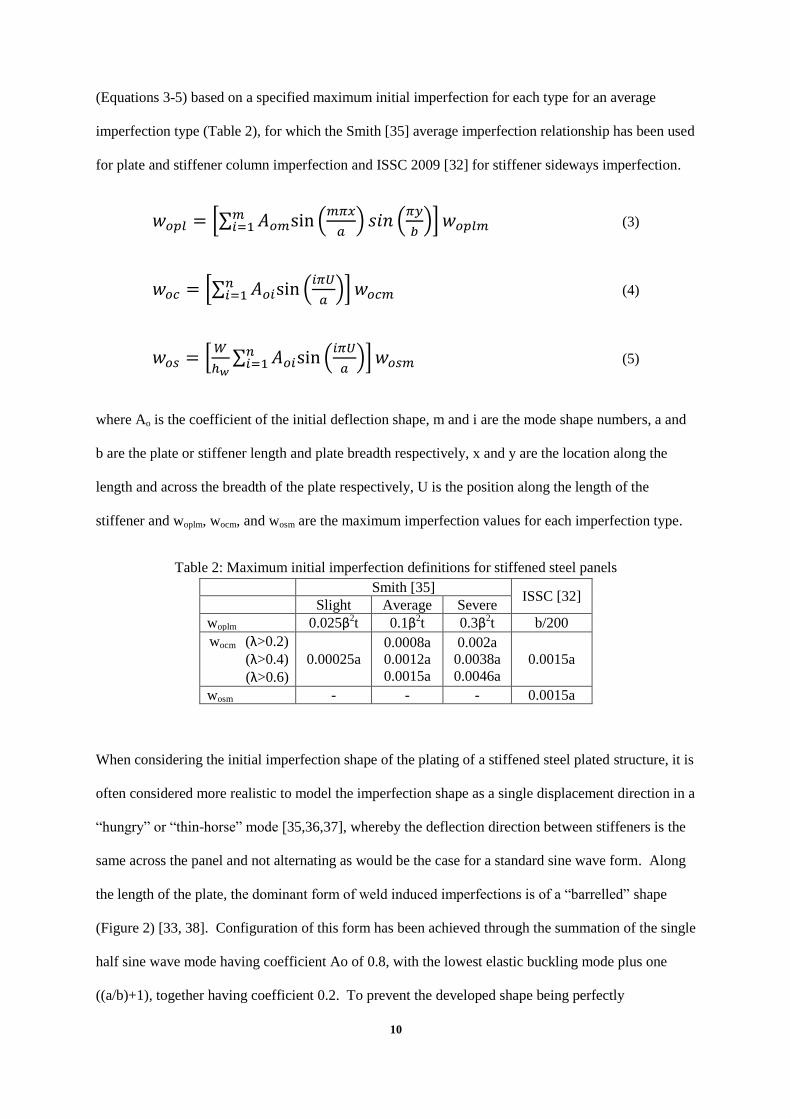
in the Fourier series summation (Equation 3) coefficient of 0.01 [34,39]. A single half sine wave
form is utilised across the breadth between longitudinal stiffeners (Figure 3).
Figure 2: Example plate imperfection shape along length between transverse stiffeners at b/2
Figure 3: Example plate imperfection shape across breadth between longitudinal stiffeners at a/2
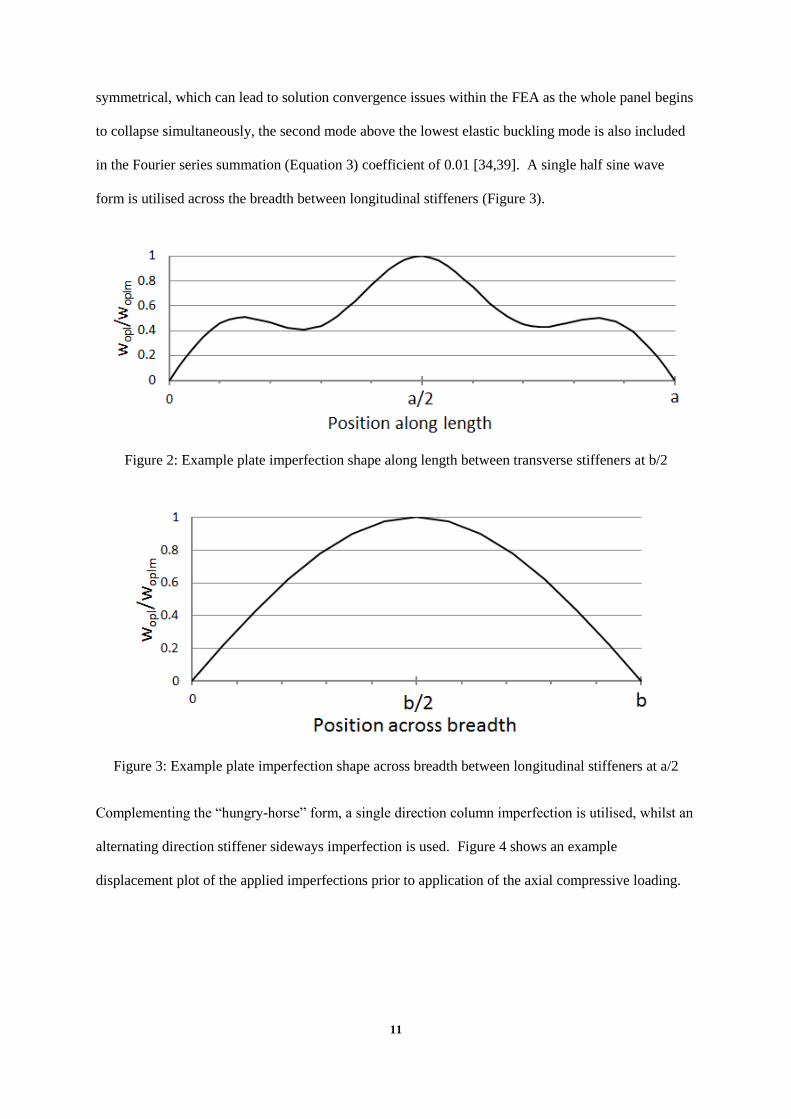
Complementing the “hungry-horse” form, a single direction column imperfection is utilised, whilst an
alternating direction stiffener sideways imperfection is used. Figure 4 shows an example
displacement plot of the applied imperfections prior to application of the axial compressive loading.
12
Figure 4: Example displacement plot of applied imperfections
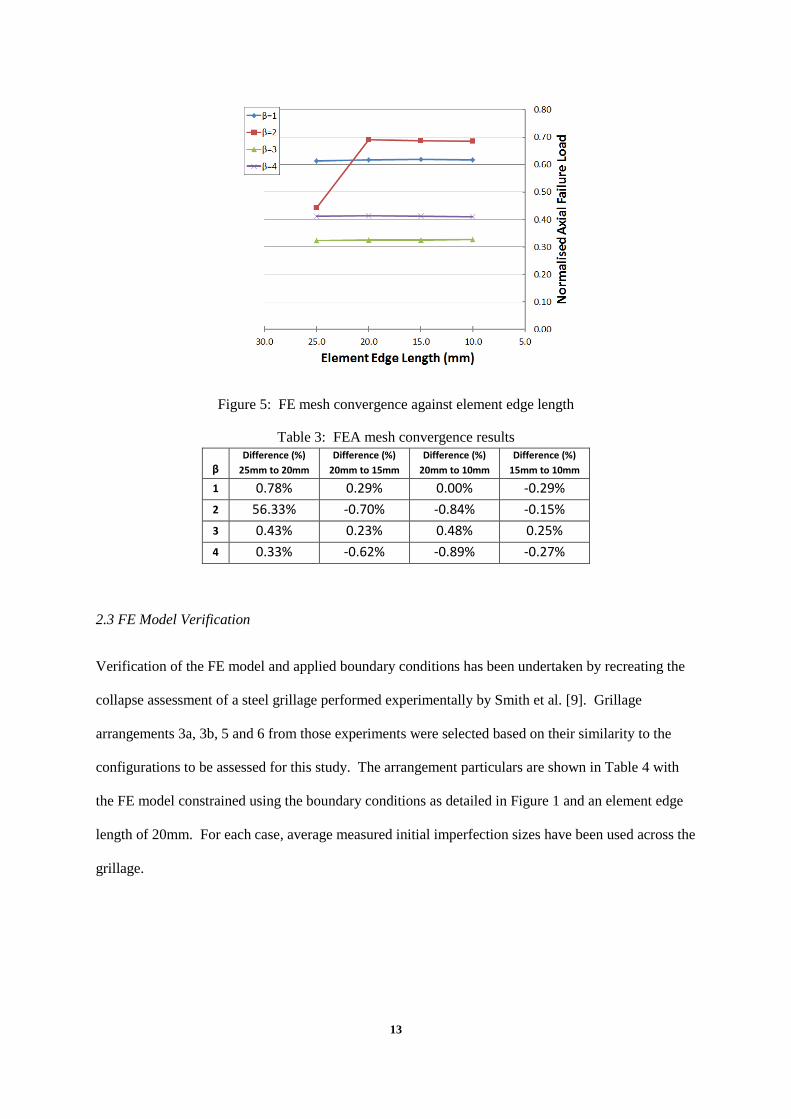
2.2.3 FE Model Mesh Convergence Study
A convergence study of the mesh density of the FE model was undertaken. Figure 5and Table 3 show
the results of the study, plotting normalised axial failure load (Pu0/Psq) against element edge length,
where Pu0 is the ultimate collapse load as calculated by the FE model, and Psq is the squash load
defined in Equation (6) as the total cross-sectional area multiplied by the yield stress of the material.
𝑃𝑠𝑞 = (𝜎𝑦𝑝𝐴𝑝) + (𝜎𝑦𝑠𝐴𝑠) (6)
where σyp and σys are the yield strength of the plate and stiffener material respectively and Ap and As
are the cross-sectional area of the plate and stiffeners respectively.
The results have shown good convergence of the mesh for element edge length 20mm and below. For
speed of processing it was decided that 20mm element edge length would be utilised for all models
within this study.
13
Figure 5: FE mesh convergence against element edge length
Table 3: FEA mesh convergence results
β Difference (%)
25mm to 20mm
Difference (%)
20mm to 15mm
Difference (%)
20mm to 10mm
Difference (%)
15mm to 10mm
1 0.78% 0.29% 0.00% -0.29%
2 56.33% -0.70% -0.84% -0.15%
3 0.43% 0.23% 0.48% 0.25%
4 0.33% -0.62% -0.89% -0.27%
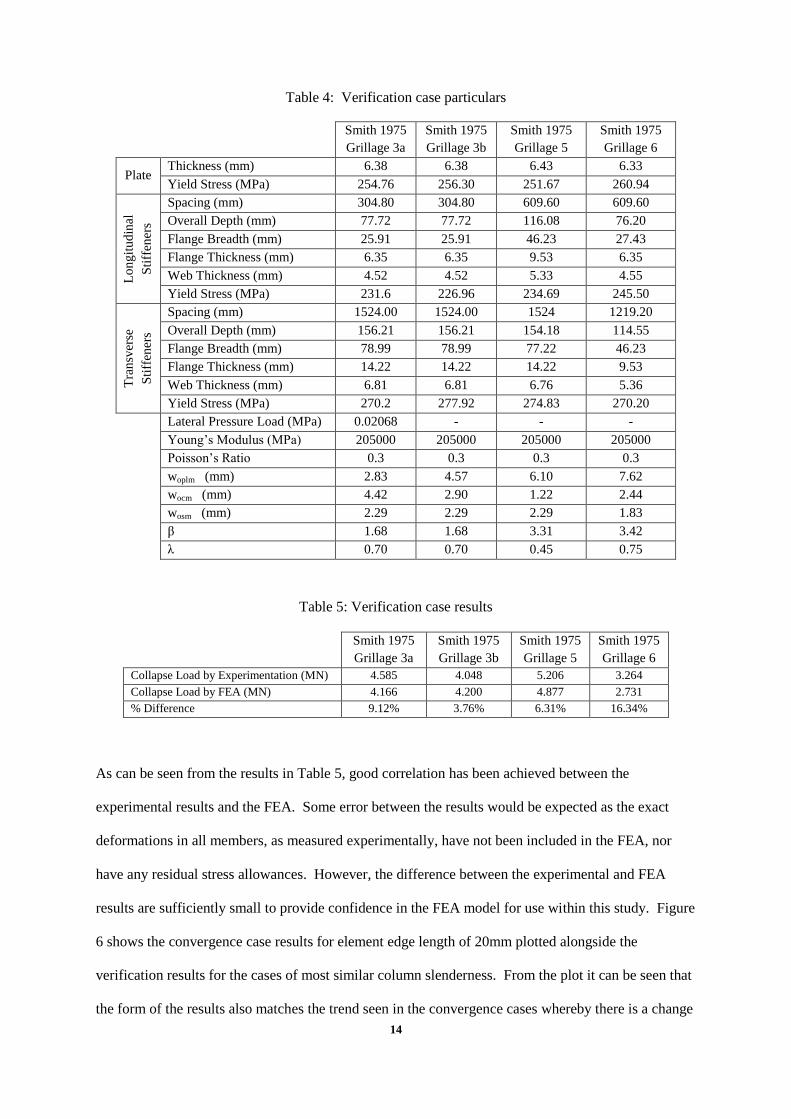
2.3 FE Model Verification
Verification of the FE model and applied boundary conditions has been undertaken by recreating the
collapse assessment of a steel grillage performed experimentally by Smith et al. [9]. Grillage
arrangements 3a, 3b, 5 and 6 from those experiments were selected based on their similarity to the
configurations to be assessed for this study. The arrangement particulars are shown in Table 4 with
the FE model constrained using the boundary conditions as detailed in Figure 1 and an element edge
length of 20mm. For each case, average measured initial imperfection sizes have been used across the
grillage.
14
Table 4: Verification case particulars
Smith 1975
Grillage 3a
Smith 1975
Grillage 3b
Smith 1975
Grillage 5
Smith 1975
Grillage 6
Plate Thickness (mm) 6.38 6.38 6.43 6.33
Yield Stress (MPa) 254.76 256.30 251.67 260.94
Lo
ng
itu
din
al
Sti
ffen
ers
Spacing (mm) 304.80 304.80 609.60 609.60
Overall Depth (mm) 77.72 77.72 116.08 76.20
Flange Breadth (mm) 25.91 25.91 46.23 27.43
Flange Thickness (mm) 6.35 6.35 9.53 6.35
Web Thickness (mm) 4.52 4.52 5.33 4.55
Yield Stress (MPa) 231.6 226.96 234.69 245.50
Tra
nsv
erse
Sti
ffen
ers
Spacing (mm) 1524.00 1524.00 1524 1219.20
Overall Depth (mm) 156.21 156.21 154.18 114.55
Flange Breadth (mm) 78.99 78.99 77.22 46.23
Flange Thickness (mm) 14.22 14.22 14.22 9.53
Web Thickness (mm) 6.81 6.81 6.76 5.36
Yield Stress (MPa) 270.2 277.92 274.83 270.20
Lateral Pressure Load (MPa) 0.02068 - - -
Young’s Modulus (MPa) 205000 205000 205000 205000
Poisson’s Ratio 0.3 0.3 0.3 0.3
woplm (mm) 2.83 4.57 6.10 7.62
wocm (mm) 4.42 2.90 1.22 2.44
wosm (mm) 2.29 2.29 2.29 1.83
β 1.68 1.68 3.31 3.42
λ 0.70 0.70 0.45 0.75
Table 5: Verification case results
Smith 1975
Grillage 3a
Smith 1975
Grillage 3b
Smith 1975
Grillage 5
Smith 1975
Grillage 6
Collapse Load by Experimentation (MN) 4.585 4.048 5.206 3.264
Collapse Load by FEA (MN) 4.166 4.200 4.877 2.731
% Difference 9.12% 3.76% 6.31% 16.34%
As can be seen from the results in Table 5, good correlation has been achieved between the
experimental results and the FEA. Some error between the results would be expected as the exact
deformations in all members, as measured experimentally, have not been included in the FEA, nor
have any residual stress allowances. However, the difference between the experimental and FEA
results are sufficiently small to provide confidence in the FEA model for use within this study. Figure
6 shows the convergence case results for element edge length of 20mm plotted alongside the
verification results for the cases of most similar column slenderness. From the plot it can be seen that
the form of the results also matches the trend seen in the convergence cases whereby there is a change
15
in failure mode between plate slenderness ratio 2 and 3 from interframe to overall collapse. It is
interesting to note that these curves do not match those found in Smith [35] which are constrained by
interframe collapse.
Figure 6: Verification case results plotted with convergence case results.
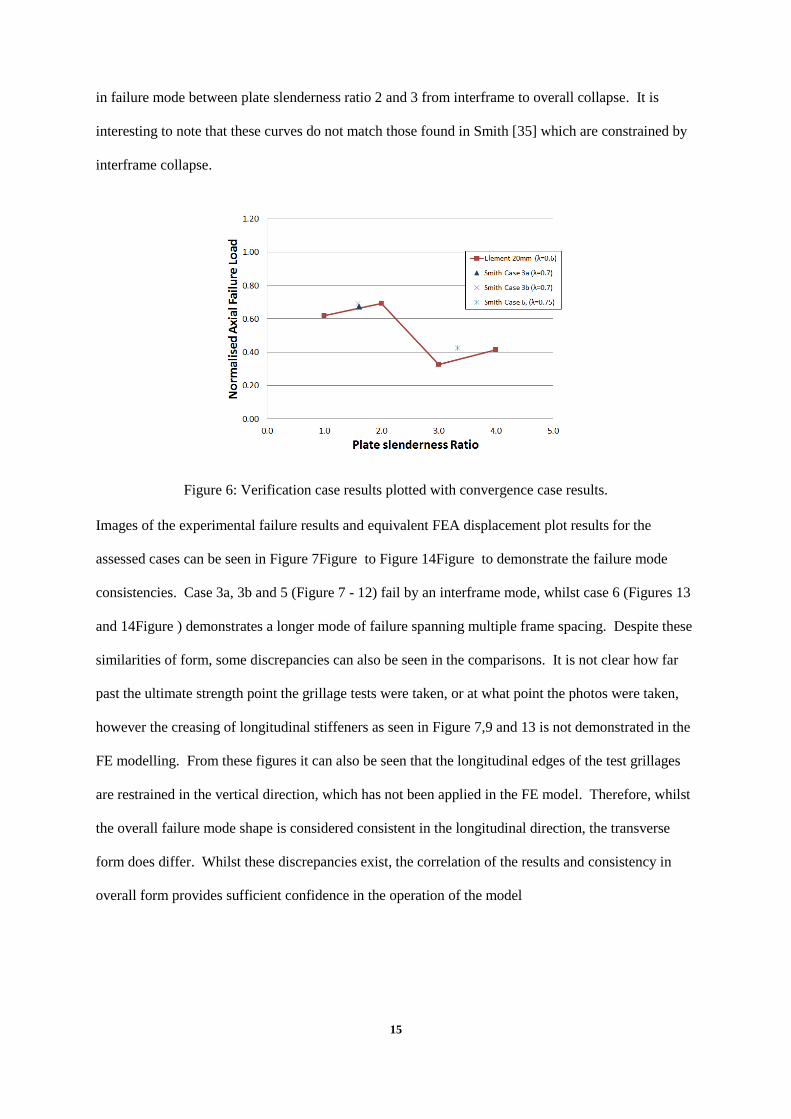
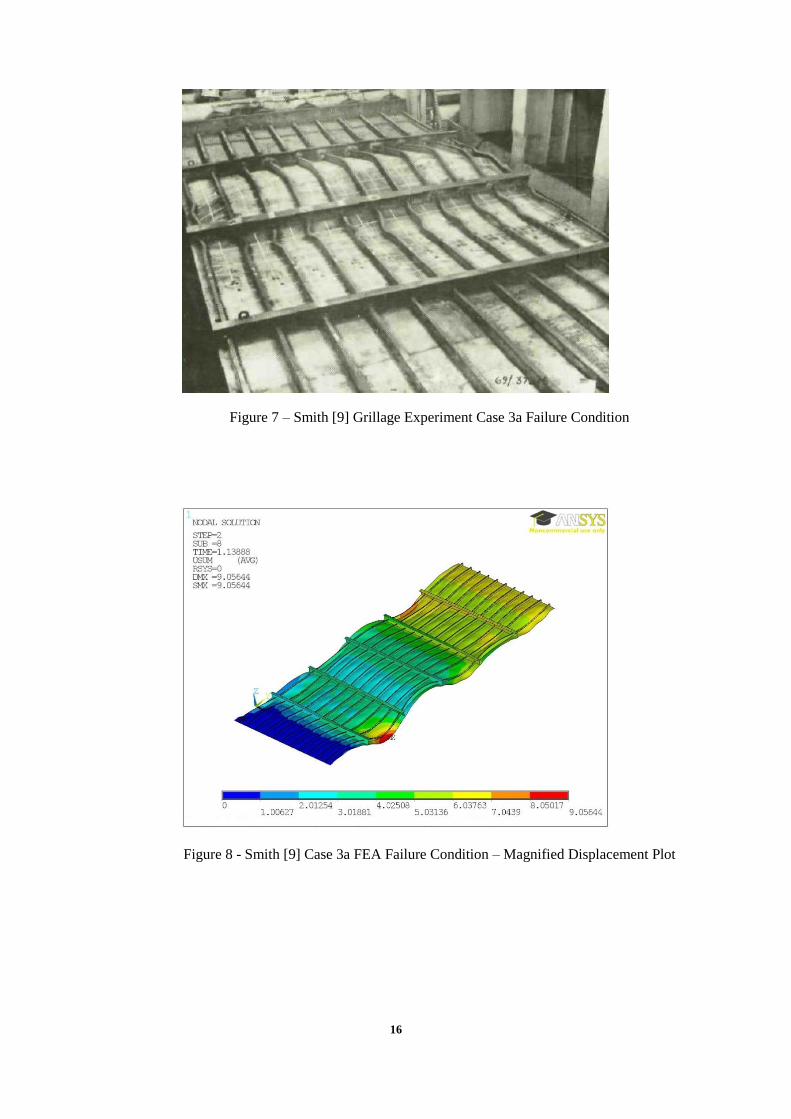
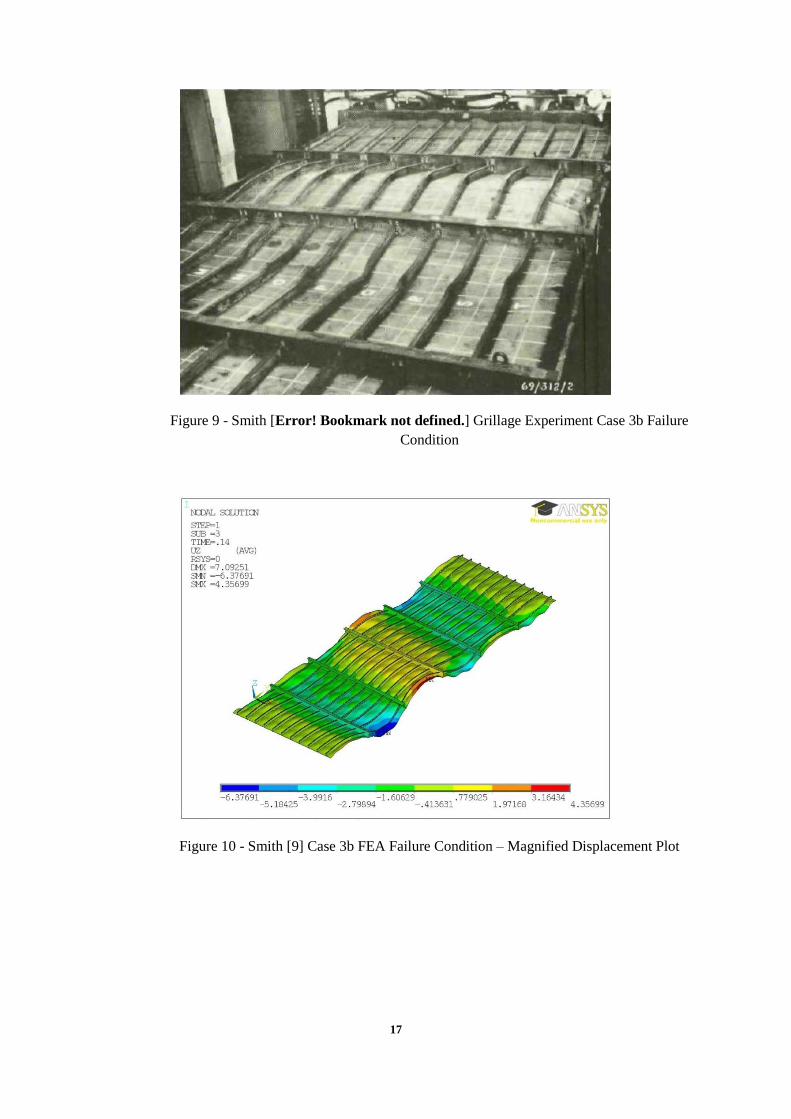
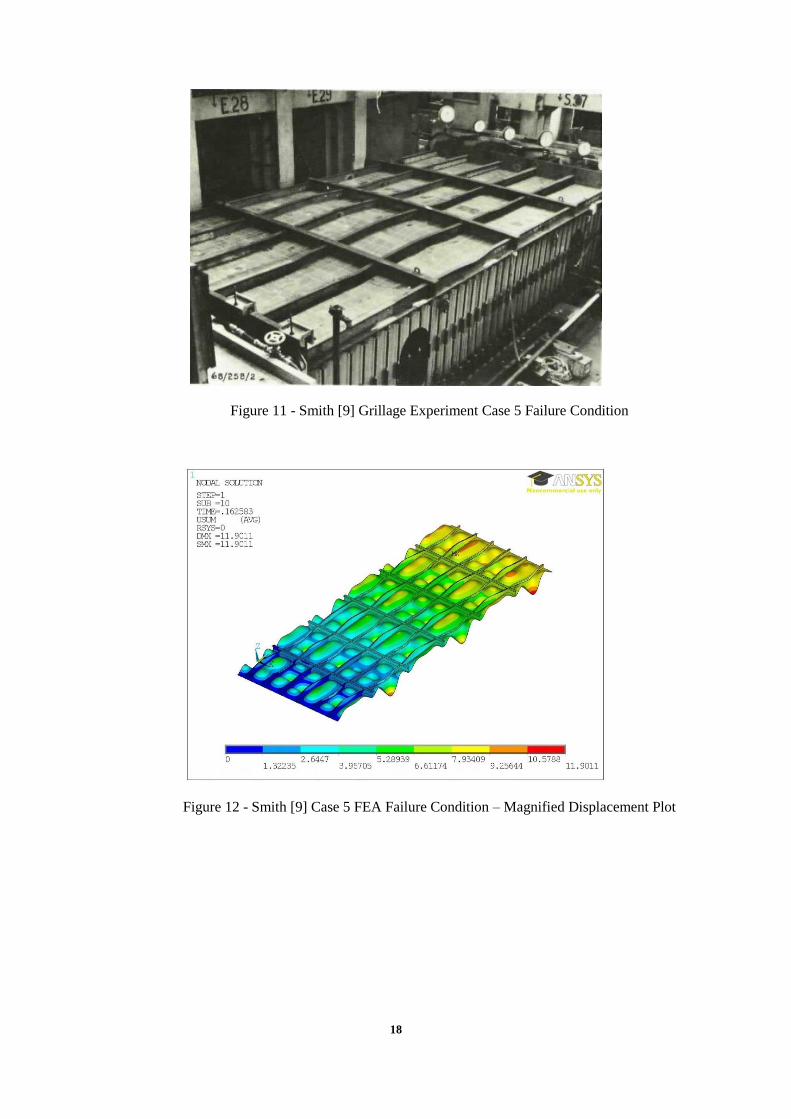
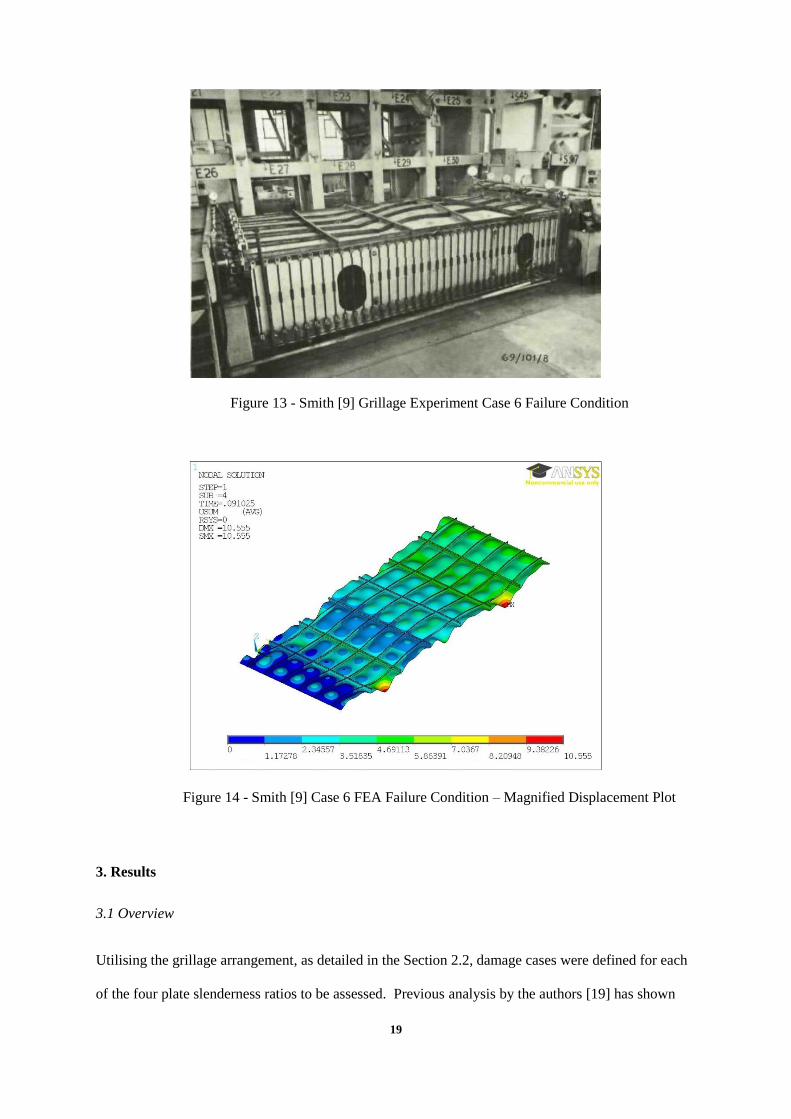
Images of the experimental failure results and equivalent FEA displacement plot results for the
assessed cases can be seen in Figure 7Figure to Figure 14Figure to demonstrate the failure mode
consistencies. Case 3a, 3b and 5 (Figure 7 - 12) fail by an interframe mode, whilst case 6 (Figures 13
and 14Figure ) demonstrates a longer mode of failure spanning multiple frame spacing. Despite these
similarities of form, some discrepancies can also be seen in the comparisons. It is not clear how far
past the ultimate strength point the grillage tests were taken, or at what point the photos were taken,
however the creasing of longitudinal stiffeners as seen in Figure 7,9 and 13 is not demonstrated in the
FE modelling. From these figures it can also be seen that the longitudinal edges of the test grillages
are restrained in the vertical direction, which has not been applied in the FE model. Therefore, whilst
the overall failure mode shape is considered consistent in the longitudinal direction, the transverse
form does differ. Whilst these discrepancies exist, the correlation of the results and consistency in
overall form provides sufficient confidence in the operation of the model
16
Figure 7 – Smith [9] Grillage Experiment Case 3a Failure Condition
Figure 8 - Smith [9] Case 3a FEA Failure Condition – Magnified Displacement Plot
17
Figure 9 - Smith [Error! Bookmark not defined.] Grillage Experiment Case 3b Failure
Condition
Figure 10 - Smith [9] Case 3b FEA Failure Condition – Magnified Displacement Plot
18
Figure 11 - Smith [9] Grillage Experiment Case 5 Failure Condition
Figure 12 - Smith [9] Case 5 FEA Failure Condition – Magnified Displacement Plot
19
Figure 13 - Smith [9] Grillage Experiment Case 6 Failure Condition
Figure 14 - Smith [9] Case 6 FEA Failure Condition – Magnified Displacement Plot
3. Results
3.1 Overview
Utilising the grillage arrangement, as detailed in the Section 2.2, damage cases were defined for each
of the four plate slenderness ratios to be assessed. Previous analysis by the authors [19] has shown
20
that the damage aperture shape has minimal effect on the overall collapse strength of stiffened panels.
Therefore, a single damage aperture, diamond, was chosen for this study as the previous study showed
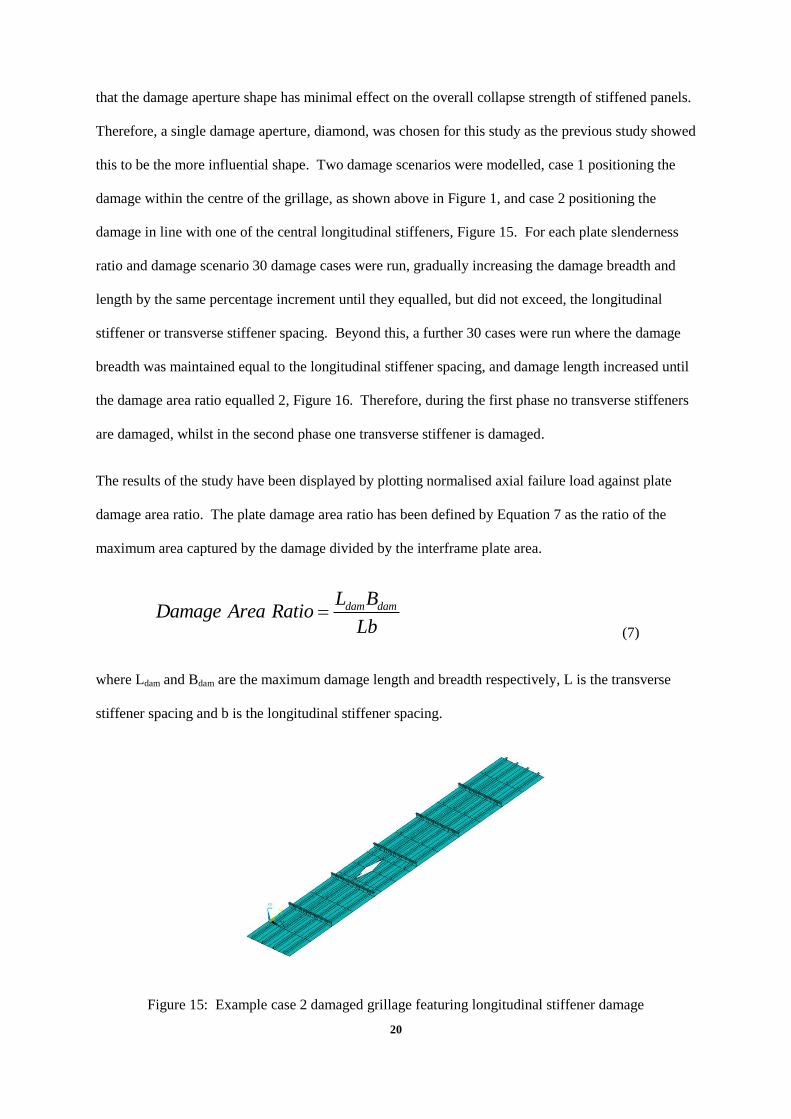
this to be the more influential shape. Two damage scenarios were modelled, case 1 positioning the
damage within the centre of the grillage, as shown above in Figure 1, and case 2 positioning the
damage in line with one of the central longitudinal stiffeners, Figure 15. For each plate slenderness
ratio and damage scenario 30 damage cases were run, gradually increasing the damage breadth and
length by the same percentage increment until they equalled, but did not exceed, the longitudinal
stiffener or transverse stiffener spacing. Beyond this, a further 30 cases were run where the damage
breadth was maintained equal to the longitudinal stiffener spacing, and damage length increased until
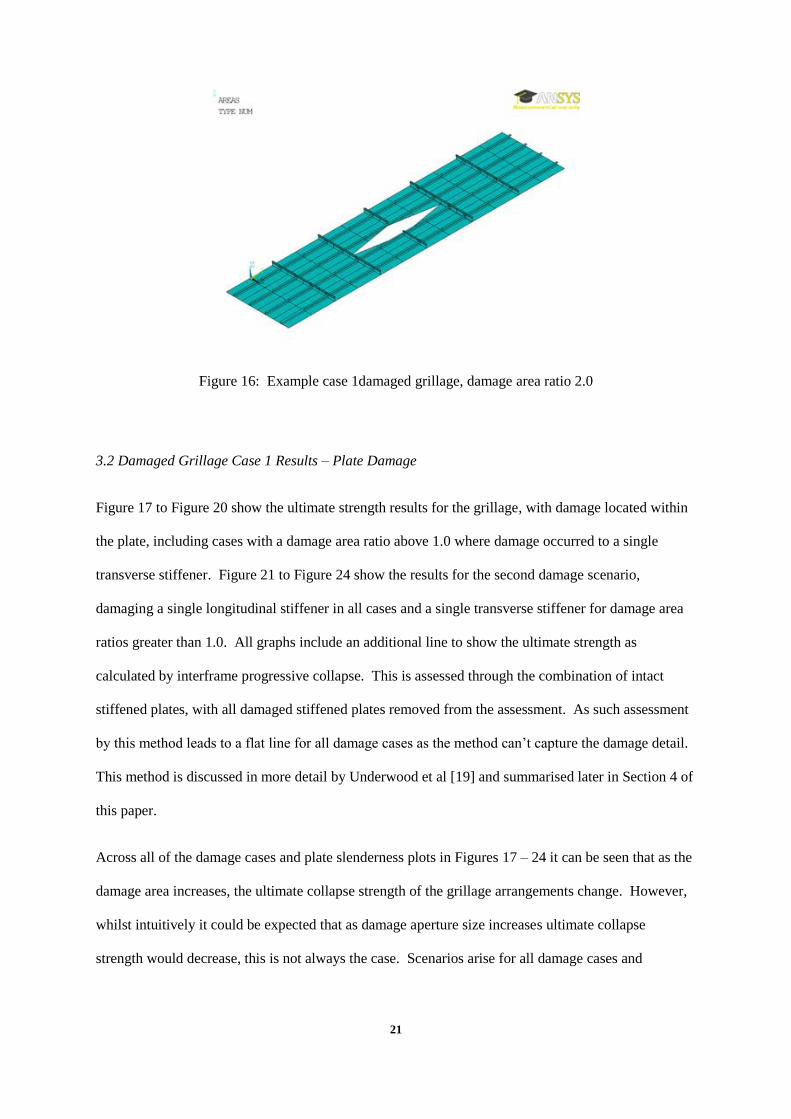
the damage area ratio equalled 2, Figure 16. Therefore, during the first phase no transverse stiffeners
are damaged, whilst in the second phase one transverse stiffener is damaged.
The results of the study have been displayed by plotting normalised axial failure load against plate
damage area ratio. The plate damage area ratio has been defined by Equation 7 as the ratio of the
maximum area captured by the damage divided by the interframe plate area.
dam damL BDamage Area Ratio
Lb
(7)
where Ldam and Bdam are the maximum damage length and breadth respectively, L is the transverse
stiffener spacing and b is the longitudinal stiffener spacing.
Figure 15: Example case 2 damaged grillage featuring longitudinal stiffener damage
21
Figure 16: Example case 1damaged grillage, damage area ratio 2.0
3.2 Damaged Grillage Case 1 Results – Plate Damage
Figure 17 to Figure 20 show the ultimate strength results for the grillage, with damage located within
the plate, including cases with a damage area ratio above 1.0 where damage occurred to a single
transverse stiffener. Figure 21 to Figure 24 show the results for the second damage scenario,
damaging a single longitudinal stiffener in all cases and a single transverse stiffener for damage area
ratios greater than 1.0. All graphs include an additional line to show the ultimate strength as
calculated by interframe progressive collapse. This is assessed through the combination of intact
stiffened plates, with all damaged stiffened plates removed from the assessment. As such assessment
by this method leads to a flat line for all damage cases as the method can’t capture the damage detail.
This method is discussed in more detail by Underwood et al [19] and summarised later in Section 4 of
this paper.
Across all of the damage cases and plate slenderness plots in Figures 17 – 24 it can be seen that as the
damage area increases, the ultimate collapse strength of the grillage arrangements change. However,
whilst intuitively it could be expected that as damage aperture size increases ultimate collapse
strength would decrease, this is not always the case. Scenarios arise for all damage cases and
22
slenderness ratios whereby increasing the damage size leads to an increase in the ultimate collapse
strength of the grillage arrangements at some point.
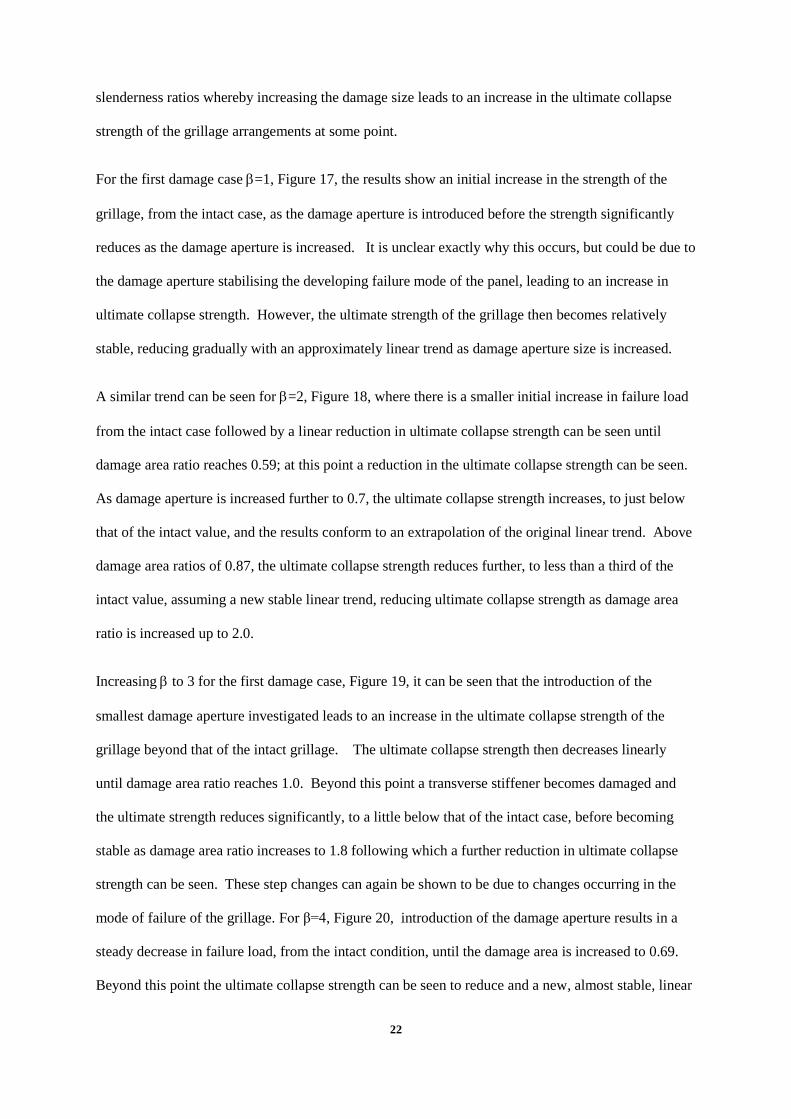
For the first damage case =1, Figure 17, the results show an initial increase in the strength of the
grillage, from the intact case, as the damage aperture is introduced before the strength significantly
reduces as the damage aperture is increased. It is unclear exactly why this occurs, but could be due to
the damage aperture stabilising the developing failure mode of the panel, leading to an increase in
ultimate collapse strength. However, the ultimate strength of the grillage then becomes relatively
stable, reducing gradually with an approximately linear trend as damage aperture size is increased.
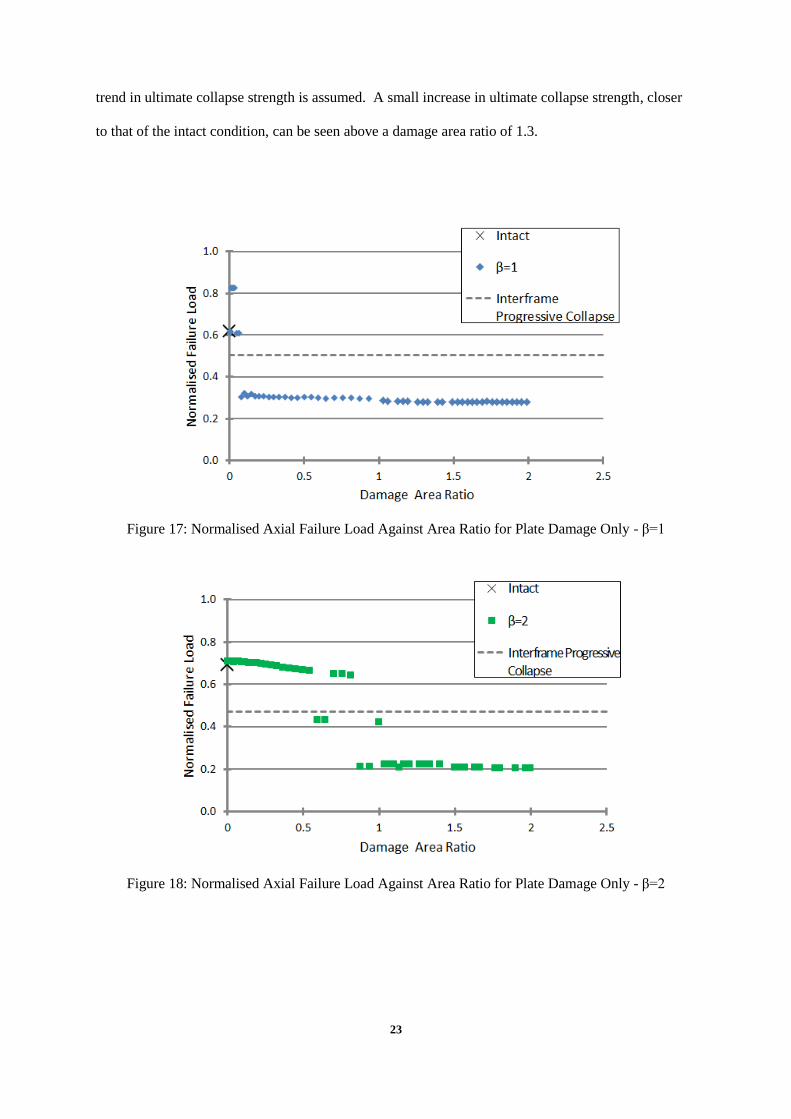
A similar trend can be seen for =2, Figure 18, where there is a smaller initial increase in failure load
from the intact case followed by a linear reduction in ultimate collapse strength can be seen until
damage area ratio reaches 0.59; at this point a reduction in the ultimate collapse strength can be seen.
As damage aperture is increased further to 0.7, the ultimate collapse strength increases, to just below
that of the intact value, and the results conform to an extrapolation of the original linear trend. Above
damage area ratios of 0.87, the ultimate collapse strength reduces further, to less than a third of the
intact value, assuming a new stable linear trend, reducing ultimate collapse strength as damage area
ratio is increased up to 2.0.
Increasing to 3 for the first damage case, Figure 19, it can be seen that the introduction of the
smallest damage aperture investigated leads to an increase in the ultimate collapse strength of the
grillage beyond that of the intact grillage. The ultimate collapse strength then decreases linearly
until damage area ratio reaches 1.0. Beyond this point a transverse stiffener becomes damaged and
the ultimate strength reduces significantly, to a little below that of the intact case, before becoming
stable as damage area ratio increases to 1.8 following which a further reduction in ultimate collapse
strength can be seen. These step changes can again be shown to be due to changes occurring in the
mode of failure of the grillage. For β=4, Figure 20, introduction of the damage aperture results in a
steady decrease in failure load, from the intact condition, until the damage area is increased to 0.69.
Beyond this point the ultimate collapse strength can be seen to reduce and a new, almost stable, linear
23
trend in ultimate collapse strength is assumed. A small increase in ultimate collapse strength, closer
to that of the intact condition, can be seen above a damage area ratio of 1.3.
Figure 17: Normalised Axial Failure Load Against Area Ratio for Plate Damage Only - β=1
Figure 18: Normalised Axial Failure Load Against Area Ratio for Plate Damage Only - β=2

24
Figure 19: Normalised Axial Failure Load Against Area Ratio for Plate Damage Only - β=3
Figure 20: Normalised Axial Failure Load Against Area Ratio for Plate Damage Only - β=4
3.3 Damaged Grillage Case 2 Results – Plate and Stiffener Damage
In the presented results for damage case 2, Figure 21 to Figure 24, there is predominantly an initial
reduction in ultimate collapse strength from the intact condition as the longitudinal stiffener the
damage is aligned with is breached. However, beyond this point different trends can be seen for the
different plate slenderness ratios assessed. The initial trend of decreasing strength as the stiffener is
25
breached is consistent with the results presented in previous work by the authors [19] investigating the
influence of damage aperture size and shape on the ultimate collapse strength of stiffened steel panels.
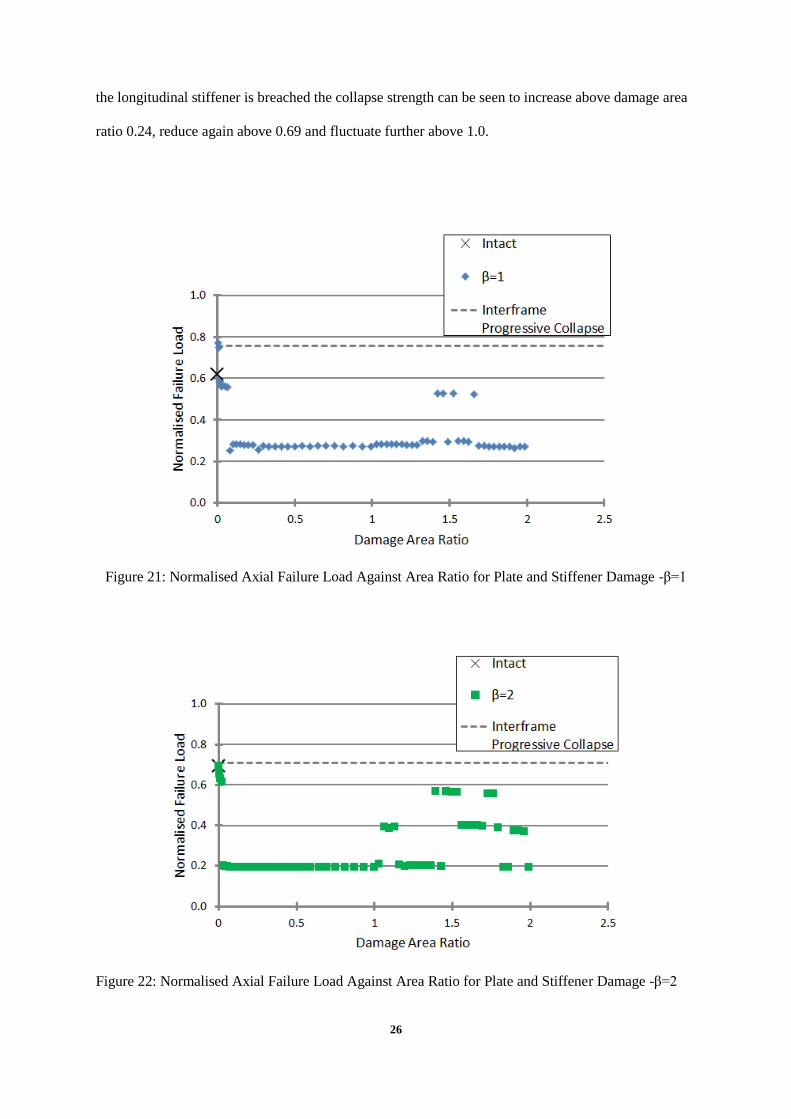
For the second damage scenario when β=1, Figure 21, there is an initial increase in ultimate collapse
strength, consistent with the results for the first damage scenario at this plate slenderness ratio, before
the sudden reduction in ultimate collapse strength as the longitudinal stiffener is breached. Beyond
this point the ultimate collapse strength remains linear and stable, at about half of the intact structure,
as damage area ratio is increased to 2.0. In the region of damage area ratio 1.4 – 1.65 some
fluctuation in the trend can be seen as the failure mode shape changes in this region returning to a
value closer to the intact case, though this effect appears to be localised as the linear trend returns
beyond this point as the damage aperture size is increased.
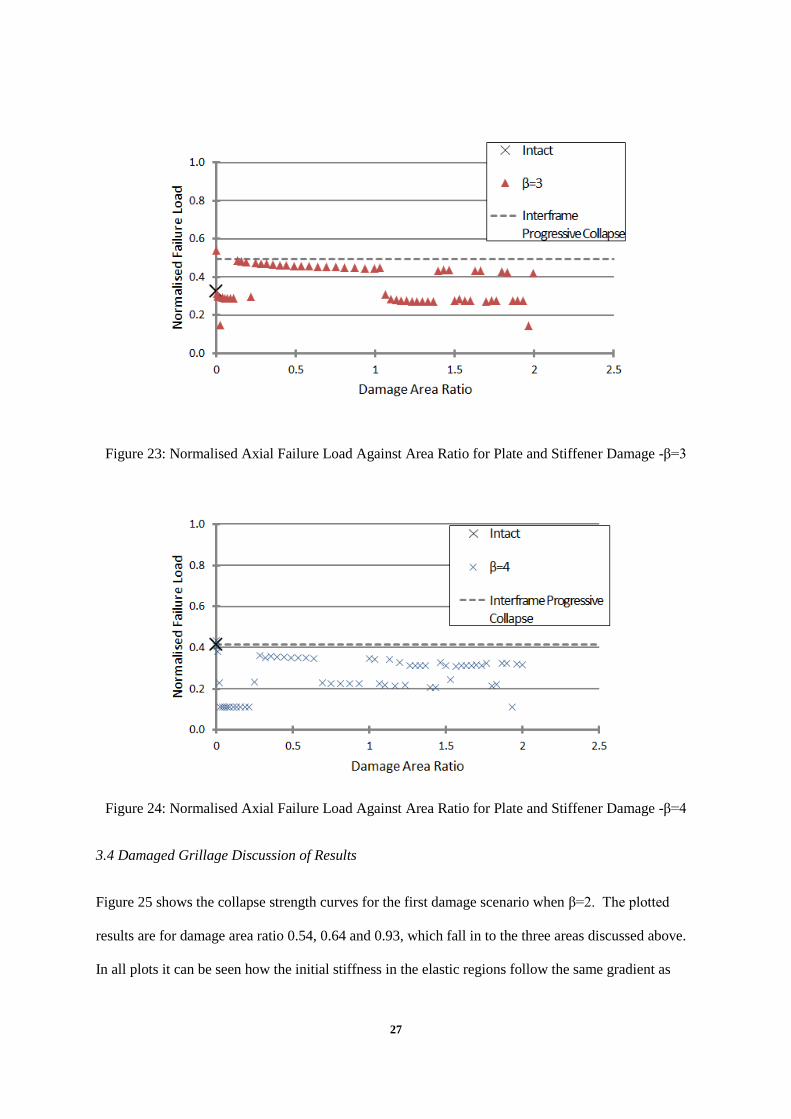
At β=2 for the second damage case, Figure 22, the results show an initial reduction in ultimate
collapse strength as the longitudinal stiffener is breached and a stable linear trend forms until the
damage area ratio increases to 1.0. Beyond this point a single transverse stiffener is also breached
after which fluctuations in the ultimate collapse strength can be seen. From the results it can be seen
that in the region of damage area ratio 1.0 - 2.0, increasing the damage size allows fluctuation
between three different failure loads, all lower than the intact value.
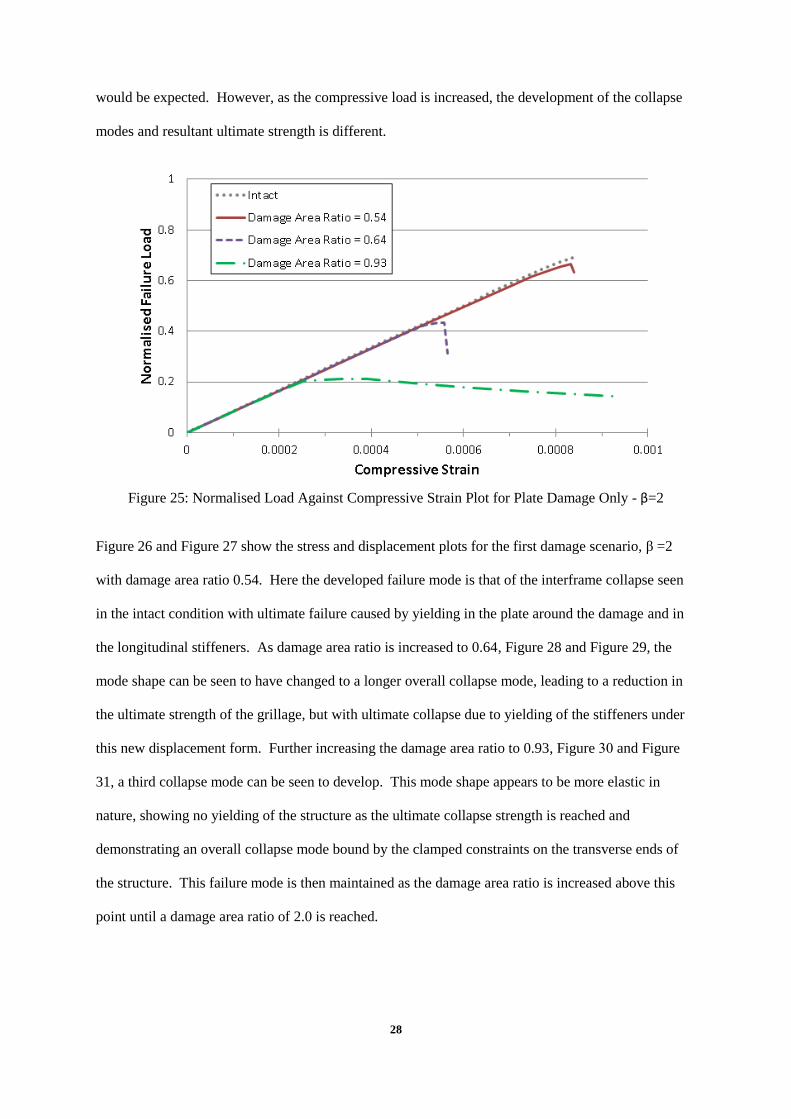
The results in Figure 23 for the second damage case when β=3 show an initial decrease in ultimate
collapse strength as the longitudinal stiffener is damaged followed by an increase in the ultimate
collapse strength of the grillage to above that of the intact grillage. As the damage area ratio is
increased from 0.13 – 1.0, the ultimate collapse strength can be seen to reduce gradually in an almost
linear manner at a strength that is greater than for the intact condition. This is consistent with the
results for the first damage case at this plate slenderness ratio, Figure 19. As the transverse stiffener is
breached above damage area ratio 1.0, there is a reduction in the ultimate collapse strength to slightly
below that of the intact case which then shows fluctuations for damage area ratios above 1.33.
Figure 24 for the second damage case at β=4 shows a large number of fluctuations in the ultimate
collapse strength, all of which remain below the intact case. After an initial decrease in strength as
26
the longitudinal stiffener is breached the collapse strength can be seen to increase above damage area
ratio 0.24, reduce again above 0.69 and fluctuate further above 1.0.
Figure 21: Normalised Axial Failure Load Against Area Ratio for Plate and Stiffener Damage -β=1
Figure 22: Normalised Axial Failure Load Against Area Ratio for Plate and Stiffener Damage -β=2
27
Figure 23: Normalised Axial Failure Load Against Area Ratio for Plate and Stiffener Damage -β=3
Figure 24: Normalised Axial Failure Load Against Area Ratio for Plate and Stiffener Damage -β=4
3.4 Damaged Grillage Discussion of Results
Figure 25 shows the collapse strength curves for the first damage scenario when β=2. The plotted
results are for damage area ratio 0.54, 0.64 and 0.93, which fall in to the three areas discussed above.
In all plots it can be seen how the initial stiffness in the elastic regions follow the same gradient as
28
would be expected. However, as the compressive load is increased, the development of the collapse
modes and resultant ultimate strength is different.
Figure 25: Normalised Load Against Compressive Strain Plot for Plate Damage Only - β=2
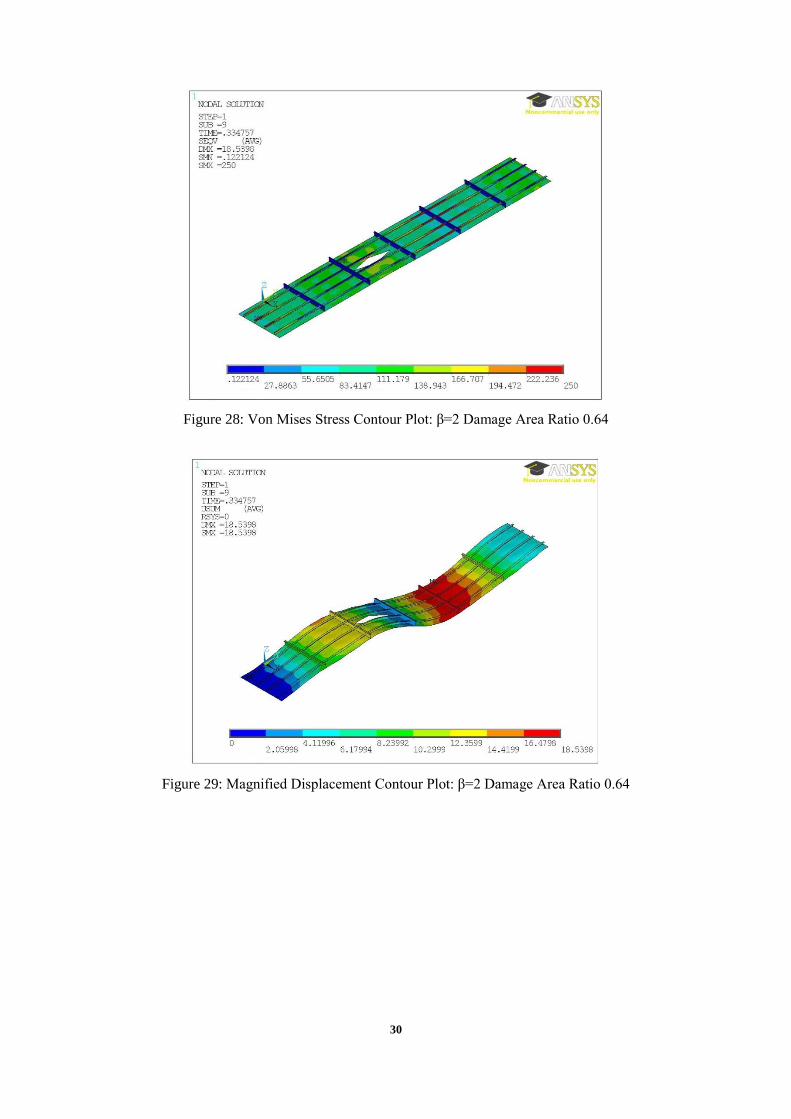
Figure 26 and Figure 27 show the stress and displacement plots for the first damage scenario, β =2
with damage area ratio 0.54. Here the developed failure mode is that of the interframe collapse seen
in the intact condition with ultimate failure caused by yielding in the plate around the damage and in
the longitudinal stiffeners. As damage area ratio is increased to 0.64, Figure 28 and Figure 29, the
mode shape can be seen to have changed to a longer overall collapse mode, leading to a reduction in
the ultimate strength of the grillage, but with ultimate collapse due to yielding of the stiffeners under
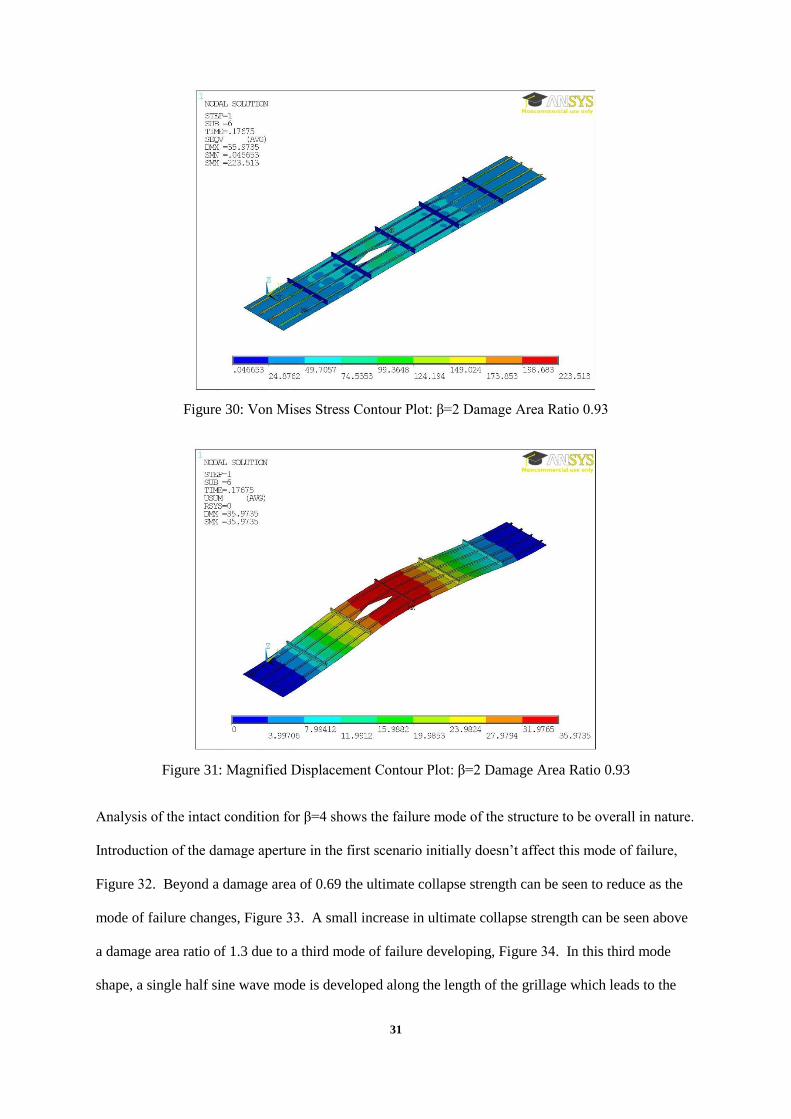
this new displacement form. Further increasing the damage area ratio to 0.93, Figure 30 and Figure
31, a third collapse mode can be seen to develop. This mode shape appears to be more elastic in
nature, showing no yielding of the structure as the ultimate collapse strength is reached and
demonstrating an overall collapse mode bound by the clamped constraints on the transverse ends of
the structure. This failure mode is then maintained as the damage area ratio is increased above this
point until a damage area ratio of 2.0 is reached.

29
Figure 26: Von Mises Stress Contour Plot: β=2 Damage Area Ratio 0.54
Figure 27: Magnified Displacement Contour Plot: β=2 Damage Area Ratio 0.54
30
Figure 28: Von Mises Stress Contour Plot: β=2 Damage Area Ratio 0.64
Figure 29: Magnified Displacement Contour Plot: β=2 Damage Area Ratio 0.64
31
Figure 30: Von Mises Stress Contour Plot: β=2 Damage Area Ratio 0.93
Figure 31: Magnified Displacement Contour Plot: β=2 Damage Area Ratio 0.93
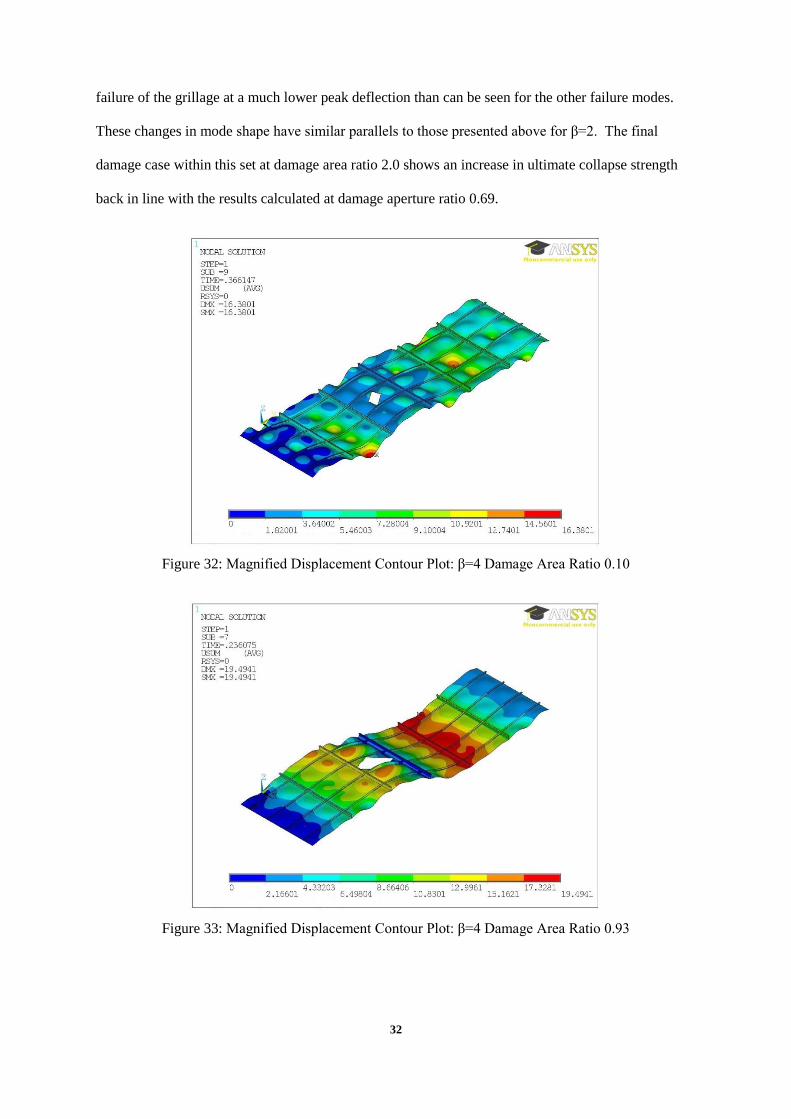
Analysis of the intact condition for β=4 shows the failure mode of the structure to be overall in nature.
Introduction of the damage aperture in the first scenario initially doesn’t affect this mode of failure,
Figure 32. Beyond a damage area of 0.69 the ultimate collapse strength can be seen to reduce as the
mode of failure changes, Figure 33. A small increase in ultimate collapse strength can be seen above
a damage area ratio of 1.3 due to a third mode of failure developing, Figure 34. In this third mode
shape, a single half sine wave mode is developed along the length of the grillage which leads to the
32
failure of the grillage at a much lower peak deflection than can be seen for the other failure modes.
These changes in mode shape have similar parallels to those presented above for β=2. The final
damage case within this set at damage area ratio 2.0 shows an increase in ultimate collapse strength
back in line with the results calculated at damage aperture ratio 0.69.
Figure 32: Magnified Displacement Contour Plot: β=4 Damage Area Ratio 0.10
Figure 33: Magnified Displacement Contour Plot: β=4 Damage Area Ratio 0.93

33
Figure 34: Magnified Displacement Contour Plot: β=4 Damage Area Ratio 1.5
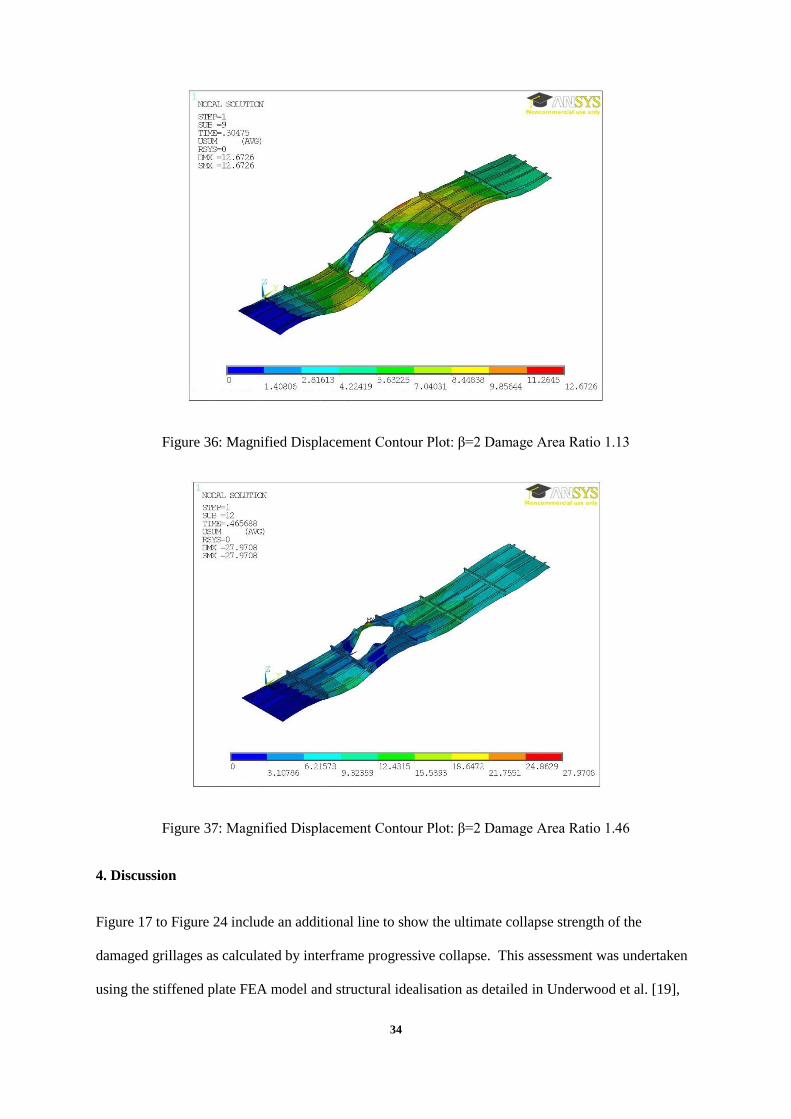
At β=2 for the second damage case, Figure 22, a stable linear trend forms as the failure mode assumes
an overall collapse mode, Figure 35. In the region of damage area ratio 1.0 - 2.0, increasing the
damage size increases the collapse strength of the panel. This can again be shown to be due to the
different failure modes developing in the panel as it reaches its ultimate collapse strength, as shown in
Figure 36 and Figure 37.
Figure 35: Magnified Displacement Contour Plot: β=2 Damage Area Ratio 0.93
34
Figure 36: Magnified Displacement Contour Plot: β=2 Damage Area Ratio 1.13
Figure 37: Magnified Displacement Contour Plot: β=2 Damage Area Ratio 1.46
4. Discussion
Figure 17 to Figure 24 include an additional line to show the ultimate collapse strength of the
damaged grillages as calculated by interframe progressive collapse. This assessment was undertaken
using the stiffened plate FEA model and structural idealisation as detailed in Underwood et al. [19],

35
for which the damage idealisation into stiffened-plate elements can be seen in Figure 38. In all cases
it can be seen that the ultimate collapse strength of the damaged grillages by this method is a flat line.
This is because the assumption is applied that all damaged or partially damaged structure is removed
from the analysis; therefore, there is no change to the damaged structural idealisation as the damage
aperture is increased.
Figure 38: Grillage structural idealisation for progressive collapse analysis – cross-section
For damage case 1, Figure 17 to Figure 20, it can be seen that for small damage apertures where the
mode of failure predominantly remains in the interframe collapse form, the interframe progressive
collapse method provides a conservative assessment of the ultimate collapse strength. However, as
the damage is increased and the failure mode changes, it can be seen that the interframe progressive
collapse method provides an over prediction compared to the full grillage FEA results. In contrast to
the results for damage case 1, the results for damage case 2, Figure 21 to Figure 24, show that the
interframe progressive collapse method over predicts the ultimate collapse strength when compared to
the full grillage FEA for all damage sizes. This may have serious implications for the strength
prediction and resulting safety of a damaged vessel should these effects not be accounted for.
The results presented for the strength of damaged grillages show trends consistent with Underwood et
al. [19] investigating the strength of damaged stiffened panels. In both cases the presence of damage
(a) Intact Grillage stiffened-plate Idealisation
(b) Grillage Idealisation Case 1 damage, dashed panels removed due to damage at
marked location.
(c) Grillage Idealisation Case 2, dashed panel removed due to damage at marked
location.
36
has been shown to influence the developing failure modes within the structure which will affect the
ultimate collapse strength. However, for the analysis of damaged stiffened panels, the final failure
mode remains interframe in nature due to the model extents being of an interframe section. The
results presented for the ultimate collapse strength of damaged grillages has shown how the influence
of a damage aperture can affect the interframe collapse modes but also change them to overall
collapse modes that can significantly reduce the ultimate collapse strength. Therefore, in the
assessment of damaged stiffened steel structures it is critical to assess the structure using a method
that can account for these potential changes in failure modes and calculate the ultimate strength
correctly.
It has been noted that intuitively it might be expected that increasing the damage aperture size the
ultimate collapse strength of the structure would decrease. However, due to the influence of the
damage aperture on the developing failure modes, the presented results regularly show scenarios
where increasing the damage aperture size leads to an increase in the ultimate collapse strength.
Some of the results presented in Underwood et al. [19] regarding the strength of damaged stiffened
panels showed similar scenarios. However, as the overall failure mode was constrained to be
interframe due to the model size, the resulting change in ultimate collapse strength is less significant
than has been shown for the assessment of damaged grillages. It is believed that some of the
reasoning behind the changes in mode shape can be laid to the stabilising or destabilising influence of
the damage aperture. Physically it can be appreciated that a change in failure mode shape will lead to
a change in the calculated collapse strength. Section 2.2.2 discusses the initial imperfection shapes
that can be expected to be present in a fabricated stiffened steel panel or grillage as well as the
expected collapse modes that would be likely to develop under compressive loading. It is believed
that the presence of the damage aperture in many instances actually leads to stabilisation of the
developing failure or can change them to higher or lower modes. This influence leads to variations in
the ultimate collapse strength that go against the natural intuition of the scenario. This type of
stabilisation of failure modes appears consistent with the results presented by Nikolov et al. [40] in
their research on the strength of steel plating with initial imperfections, where they state that the initial
37
dishing imperfection can lead to a stabilisation of the collapse mode leading to an increase in strength.
This is similar to the results found in this paper whereby the presence of the damage aperture has led
to a change in failure mode rather than as a result of a change in the initial imperfection shape,
increasing confidence in the potential for this phenomenon to occur. Buckling theory states that the
failure mode with the lowest energy will occur. This buckling mode develops due to the relation
between the membrane and bending stiffnesses. Through changes to the plate and possible intrusion
into the effective width of the stiffener, the authors propose that a change in membrane stiffness elicits
a change by which the least energy is spent through a change in buckling mode. At this stage the
authors would hesitate to determine whether this change is physical or a failure by FEA to resolve the
stiffness matrix. However, changes to boundary conditions, method of application of the initial
imperfection shape and using different structural units, Underwood et al. [19], have not led to firm
conclusions as the phenomenon continues to occur.
5. Conclusions
Research into the ultimate collapse strength of damaged steel grillages has shown how the presence of
a damage aperture can lead to a change in the developing failure mode of the structure. This is often
counterintuitive, whereby an increase in damage aperture size can lead to an increase in the ultimate
collapse strength of the structure. The results are consistent with those presented in Underwood et al.
[19] researching the strength of damage stiffened panels. However, where the stiffened panel model
is only able to fail by interframe collapse, the influence of the damage within a grillage arrangement
can change the failure mode to be overall in nature; this can significantly change the ultimate collapse
strength of the grillage which may increase or decrease as the damage aperture is increased.
The presented results have also been compared against ultimate collapse strength calculations made
by implementing the interframe progressive collapse method. These results have shown the method
to be conservative in cases where only the plating between stiffeners is damaged and the grillage
continues to fail be interframe collapse, over predicting the ultimate collapse strength if this mode
changes. However, it has been shown that the interframe collapse method over predicts the ultimate
38
collapse strength in cases where a single longitudinal stiffener is damaged regardless of the failure
mode that subsequently develops.
This study has shown how, for the ultimate strength assessment of damage stiffened steel structures,
all potential failure modes of the structure must be able to be accounted for as the failure mode of the
structure in the damaged condition cannot be assumed to be the same as for the intact condition.
Failure to account for such mode changes could lead to incorrect assessment of the residual strength
of a damaged structure and the safety of personnel on-board.
6. Acknowledgements
The authors would like to thank the UK Ministry of Defence and Lloyd’s Register EMEA for their
support and without whom this research would not have been possible.
The authors would also like to acknowledge the use of the IRIDIS 3 High Performance Computing
Facility, and associated support services at the University of Southampton, in the completion of this
work.
6. References
[1] ISO19902:2007 (2007). Fixed steel offshore structures. First edition 01/12/2007.
[2] Dow R S, Hugill R C, Clark J D, Smith C S (1981). Evaluation of ultimate ship hull
strength. Extreme Loads Response Symposium, 1981; pp133-148.
[3] Ueda Y, Rashed S M H (1974). An ultimate transverse strength analysis of ship
structures. Journal of the society of Naval Architects of Japan; 136; pp309 - 324.
[4] Ueda Y, Rashed S M H (1984). The idealised structural unit method and its application to
deep girder structures. Computers & Structures Vol.18, No.2; pp277-293.
[5] Lokshin A Z, Ivanov L D and Mishkevich V (2013). Deterministic and probabilistic
assessment of the critical buckling strength of ships' grillages (gross panels), Vol.8, Issue
5, 2013, pp.536-564.
[6] Banai L and Pedatzur O (2006). Computer implementation of an orthotropic plate model
for quick estimation of the maximum deflection of stiffened panels, Ships and Offshore
Structures, Vol.1, Issue 4, 2006, pp.323-333.
[7] Starossek U (2009). Progressive collapse of structures. Thomas Telford Limited.
39
[8] Gordo J M, Guedes Soares C, Faulkner D (1996). Approximate assessment of the ultimate
longitudinal strength of the hull girder. Journal of Ship Research, Vol. 40, No.1; pp60-69.
[9] Smith C S, (1975). Compressive strength of welded steel ship grillages. Transactions of
The Royal Institution of Naval Architects, 1975; pp325 - 347.
[10] Guedes Soares C, Luis R M, Nikolov P, Downes J, Taczala M, Modiga M, Quesnel T,
Toderan C, Samuelides M (2008). Benchmark study on the use of simplified structural
codes to predict the ultimate strength of a damaged ship hull. International Shipbuilding
Progress 55; pp87-107.
[11] Gordo J M, Guedes Soares C (2000) Residual strength of damaged ship hulls.
International Maritime Association of Mediterranean Congress (IMAM 2000); pp79-86.
[12] ISSC 2009 Committee v.1. Damage assessment after accidental events. 17th
International Ship and Offshore Structures Congress (2009).
[13] Underwood J M, Sobey A J, Blake J I R, Shenoi R A (2013). Strength assessment of
damaged steel ships during emergency response. The Royal Institution of Naval Architects
(RINA) Damaged Ship II Conference; pp84-91.
[14] Suneel Kumar M., Alagusundaramoorthy P., Sundaravadivelu R. (2009). Interaction
curves for stiffened panel with circular opening under axial loads. Ships and Offshore
Structures Vol.4 pp133-143.
[15] Alagusundaramoorthy P, Sundaravadivelu R, Ganapathy G (1999). Experimental Study
on collapse load of stiffened panels with cutouts. Journal of Constructional Steel
Research 52; pp235-251.
[16] Saad-Eldeen S, Garbatov Y, Guedes Soares C. Ultimate strength assessment of steel plates
with a large opening. In: Guedes Soares C, Peña L, editors. Developments in Maritime
Transportation and Exploitation of Sea Resources: Taylor & Francis Group, London, UK;
2014. p. 373-80.
[17] Underwood J M, Sobey A J, Blake J I R, Shenoi R A (2010). Local stress sensitivity
analysis of damaged steel ship hulls. Practical Design of Ships and Other Floating
Structures (PRADS 2010); pp1006-1014.
[18] Underwood J M, Sobey A J, Blake J I R, Shenoi R A, Cuckson B R (2011).
Determination of critical factors for the strength assessment of damaged steel ship
structures. 30th International Conference on Ocean, Offshore and Arctic Engineering
(OMAE 2011); digital proceedings.
[19] Underwood J M, Sobey A J, Blake J I R, Shenoi R A (2012). Ultimate collapse strength
assessment of damaged steel-plated structures. Engineering Structures 38; pp1-10.
[20] Faulkner D, Adamchak J C, Snyder G J, Vetter M F (1973). Synthesis of welded grillages
to withstand compression and normal loads. Computers & Structures, Vol 3; pp221-246.
40
[21] Smith C S (1968). Elastic buckling and beam-column behaviour of ship grillages.
Transactions of the Royal Institution of Naval Architects, 1968; pp127-144.
[22] Daley C, Hermanski G, Pavic M, Hussein A (2007). Ultimate strength of frames and
grillages subject to lateral loads - an experimental study. 10th International Symposium on
Practical Design of ships and Other Floating Structures (PRADS 2007); pp1016-1024.
[23] Hughes, O F, (1983). Ship structural design: a rationally-based-computer-aided
optimization approach. John Wiley & Sons, New York.
[24] Paik J K, Thayamballi A K (2003). Ultimate Limit State Design of Steel-Plated Structure.
Chichester, UK: Wiley, 2003.
[25] Paik J K, Seo J K, (2008). Methods for ultimate limit state assessment of ships and ship-
shaped offshore structures: Part II stiffened panels. Ocean Engineering 35; pp271-280.
[26] Zhang S, Khan I (2009). Buckling and ultimate capability of plates and stiffened panels in
axial compression. Marine Structures 22; pp791-808.
[27] Paik J K, Seo J K (2009). Nonlinear finite element models for ultimate strength analysis
of steel stiffened-plate structures under combined biaxial compression and lateral pressure
actions - Part II: Stiffened panels. Thin-Walled Structures 47, 2009; pp998 - 1007.
[28] Xu, M. C. and Guedes Soares, C. Numerical assessment of experiments on the ultimate
strength of stiffened panels. Engineering Structures. 2012; 45:460-471.
[29] Xu, M. C. and Guedes Soares, C. Assessment of the ultimate strength of narrow stiffened
panel test specimens. Thin-Walled Structures. 2012; 55:11-21.
[30] Xu, M. C.; Yanagihara, D.; Fujikubo, M., and Guedes Soares, C. Influence of boundary
condition on the collapse behaviour of stiffened panels under combined loads. Marine
Structures. 2013; 34:205-225.
[31] Xu, M. C. and Guedes Soares, C. Comparisons of calculations with experiments on the
ultimate strength of wide stiffened panels. Marine Structures. 2013; 31:82-101.
[32] ISSC 2009 Committee III.1. Ultimate Strength. 17th International Ship and Offshore
Structures Congress (ISSC 2009).
[33] Dow R S, Smith C S (1984). Effects of localized imperfections on compressive strength
of long rectangular plates. Journal of Constructional Steel Research 4; pp51-76.
[34] Ueda Y, Yao T (1985). The influence of complex initial deflection modes on the
behaviour and ultimate strength of rectangular plates in compression. Journal of
Constructional Steel Research 5; pp265-302.
[35] Smith C S, Anderson N, Chapman J C, Davidson P C, Dowling P J, (1992). Strength of
stiffened plating under combined compression and lateral pressure. Transactions of the
Royal Institution of Naval Architects, 1991: pp131-147.
41
[36] Faulkner D, (1975). A Review of Effective Plating for use in the Analysis of Stiffened
Plating in Bending and Compression. Journal of Ship Research, 1975. 19(1): p. 1-17.
[37] ISSC 2012 Committee III.1. Ultimate Strength. 18th International Ship and Offshore
Structures Congress (ISSC 2012).
[38] Paik J K, Thayamballi A K, Lee J M (2004). Effect of initial deflection shape on the
ultimate strength behaviour of welded steel plates under biaxial compressive loads.
Journal of Ship Research, Vol 48 No.1; pp45-60.
[39] Benson S (2011). Progressive Collapse Assessment of Lightweight Ship Structures. PhD
Thesis.
[40] Nikolov P I (2008). Collapse strength of damaged plating. Proceedings of the ASME 27th
International Conference on Offshore Mechanics and Arctic Engineering, OMAE2008;
digital proceedings.