UKTAG LAKE ASSESSMENT METHOD - wfd uk of... · Health and safety statement ... This assessment...
29
UKTAG River Assessment Method Macrophytes and Phytobenthos Macrophytes (River LEAFPACS2) by Water Framework Directive – United Kingdom Technical Advisory Group (WFD-UKTAG)
Transcript of UKTAG LAKE ASSESSMENT METHOD - wfd uk of... · Health and safety statement ... This assessment...

UKTAG River Assessment Method
Macrophytes and Phytobenthos
Macrophytes (River LEAFPACS2)
by
Water Framework Directive – United Kingdom Technical Advisory Group
(WFD-UKTAG)

Publisher: Water Framework Directive – United Kingdom Advisory Group (WFD-UKTAG)
c/o SEPA Strathallan House
Castle Business Park Stirling FK9 4TZ Scotland
www.wfduk.org
July 2014
ISBN: 978-1-906934-44-6
Copyright © 2014 WFD-UKTAG All rights reserved. WFD-UKTAG members, servants or agents accept no liability whatsoever for any loss or damage arising from the interpretation or use of the information, or reliance upon views contained herein. Health and safety statement WARNING. Working in or around water is inherently dangerous; persons using this standard should be familiar with normal laboratory and field practice. This published monitoring system does not purport to address all of the safety problems, if any, associated with its use. It is the responsibility of the user to establish appropriate health and safety practices and to ensure compliance with any national regulatory guidelines. It is also the responsibility of the user if seeking to practise the method outlined here, to gain appropriate permissions for access to water courses and their biological sampling.
UKTAG Guide to River LEAFPACS2
1
UKTAG Guide to Macrophytes in Rivers
River LEAFPACS2
1 Introduction
This classification method enables the assessment of macrophytes in rivers according to the
requirements of the Water Framework Directive (WFD). Macrophytes are larger plants of
fresh water which are easily seen with the naked eye, including all vascular plants,
bryophytes, stoneworts (Characeae) and macro-algal growths. River LEAFPACS2 uses a
species nutrient index together with measures of diversity and abundance. This method
replaces the classification tool River LEAFPACS used in the first river basin planning cycle in
the UK.
River LEAFPACS2 has been developed from the same underlying principles used for River
LEAFPACS (Willby et al, 2012), but has been improved as a result of analysis of new data
and participation in the EU intercalibration process. During the intercalibration exercise,
several small revisions were made to the existing method in terms of the metrics included
and the weight assigned to them in deriving the overall ecological quality ratio (EQR) for a
site:
(a) The River Macrophyte Hydraulic Index (RMHI), which is based on substrate, depth and
stream energy, was dropped from the suite of metrics used. This improved the relationship
with diatom classifications by focusing the macrophyte method on eutrophication impacts.
(b) The weight given to two measures of diversity (NTAXA and NFG) that consider the
number of scoring aquatic plant species and functional groups, respectively, was reduced,
making them less sensitive to survey effort, and the criteria under which these metrics will
contribute to the final EQR was adjusted.
Following these revisions, the method was intercalibrated successfully.
Macrophytes form one part of the WFD biological quality element “macrophytes and
phytobenthos” according to the normative definitions in the WFD, Annex V. For reporting
purposes, outputs from River LEAFPACS2 will be combined with those from the
phytobenthos classification tool DARLEQ2 (available on the UKTAG website) if both are
available, with the final class of the combined element being the worst of either of the sub-
elements.
1.1 Metrics
The method assesses the condition of the quality element by combining information on the
four metrics listed below. The metrics are calculated using information on macrophyte
species and groups of such species derived from field survey data. The results for each
metric are then used to produce an EQR for the combined metrics. The output of the
combined metrics is referred to as River LEAFPACS2.
River macrophyte nutrient index (RMNI) – derived from the RMNI scores of the taxa
recorded in the field survey. Taxon scores were derived for the earlier version of
LEAFPACs as described in Willby et al (2012), and remain unchanged in this version.

UKTAG Guide to River LEAFPACS2
2
Number of macrophyte taxa (NTAXA) - a diversity metric, the number of scoring taxa
recorded in the field survey, in this case only taxa which are considered truly aquatic, i.e.
hydrophytes* are included
Number of functional groups (NFG) – a diversity metric, individual taxa which are truly
aquatic (i.e. hydrophytes) are allocated to 24 “functional groups”**,
Cover of green filamentous algae (ALG) – this is the percentage cover of green
filamentous algae over the whole of the surveyed section of river.
EQRs are derived for each of the metrics, based on observed data and predicted reference
values. The values are then normalised so they fit the same scale, and finally combined by
a set of rules described below to provide an overall EQR representing an ecological status
class as defined by the WFD (High, Good, Moderate, Poor or Bad).
* “Hydrophyte” is a plant with exclusively or predominantly submerged or floating leaved foliage under normal flow conditions. **“Functional group" is a group of organisms which exploit a resource in a similar way.
1.2 Environmental pressures to which the method is sensitive
The method has been designed to reflect the impact on the quality element of nutrient
enrichment. It may also be sensitive to some other anthropogenic pressures, including
alterations to river flows and modifications to morphological conditions which may act alone
or in combination to affect the macrophyte community.
1.3 Geographic application
This assessment method is appropriate for all rivers in the UK and which are assessed in
accordance with the Water Framework Directive. It may be less applicable in heavily
modified water bodies, and should not be used to assess canals, marsh ditch systems or
strongly seasonal watercourses.
1.4 Intercalibration
This is a process whereby all European Member States are required to compare WFD class
boundary values for each biological quality element, to ensure similar levels are set across
all countries. The process involved some adjustments of class boundary values for many of
the classification tools in use, and this process has influenced some of the calculations used
in the LEAFPACS method. Once a classification method has been intercalibrated, the
method must be adhered to by Member States for the purposes of WFD assessment and
reporting.
Intercalibration focused on the EQRs which define the class boundaries between High and
Good, or Good and Moderate status (the H/G and G/M class boundaries respectively). For
this reason the method tends to refer to class boundary values rather than EQRs which
define a particular class.

UKTAG Guide to River LEAFPACS2
3
2 Data collection
2.1 River macrophyte survey
The survey method used should conform to CEN 14184 : 2003 Water quality – Guidance
standard for the surveying of aquatic macrophytes in running waters.
In order to obtain the data with which to calculate the observed values for each of the
parameters, 100 metre stretches of the river should normally be sampled between 1st June
and 30th September. Sampling should not be undertaken during or immediately after periods
of high flow. Where cold weather or spring floods may have delayed the growth of
macrophyte taxa, sampling should commence after 30th June.
Location of the survey stretches should be selected to be representative of the water body
as a whole. The number of 100m stretches required to adequately characterise a water body
will vary depending on the water body size (length) and heterogeneity of habitat. Previous
work to assess variability in river macrophytes (Willby et al 2012) indicated that in most
water bodies three 100m stretches would be adequate to produce a classification with 95%
confidence, and in some very small or very uniform water bodies it may be possible to
reduce this number.
Surveying should establish the presence, and percentage of the river channel (up to the
height of bank that would typically be submerged for >50% of the year) covered by, any of
the macrophyte taxa listed in Appendix A (Table 1). Where it is not possible to identify a
macrophyte present in the river to species level, it should be recorded under its genus or
other aggregate taxon level if such is listed in Table 1. If there is no genus/aggregate taxon
level indicated it is assumed the taxon will be identified to species in all cases.
Each taxon present in the river and listed in Table 1 should be assigned the appropriate
taxon cover value in Table 2, according to a visual estimate of its percentage cover in the
river channel.
2.2 Other data requirements
Information in addition to the field survey data is required to enable the LEAFPACS
classification to be applied. These data and measurements enable the prediction of
reference conditions, which are needed to calculate the EQRs. These data are referred to
as predictor variables.
Alkalinity
The mean measured alkalinity (as mg/l CaCO3) from at least 12, and preferably more
samples should be used. Samples should be taken at evenly spaced intervals over a whole
year or years. Alkalinity should be determined for a location representative of the water
body, as close as possible to the location of the macrophyte surveys. Care should be taken
in selecting sampling locations to avoid the influence of discharges, e.g. from sewage
treatment works, which can affect the baseline alkalinity of the river.
Altitude of source
Altitude of highest point, in metres above mean sea level, of the furthest upstream point of
any tributary of the river shown on a 1:50,000 scale map

UKTAG Guide to River LEAFPACS2
4
Distance from source
The distance, in kilometres, from the upstream end of the sampled stretch of river to the
source (located as for altitude of source), measured along the line of the channel.
Slope
Measured in metres per kilometre, is calculated from the change in altitude between the
upstream and downstream ends of the 100m stretch of river that was sampled.

UKTAG Guide to River LEAFPACS2
5
3 Procedures for calculating metrics and EQRs
The following sections outline how the macrophyte metrics and EQRs are calculated. Each
section comprises a step by step process allowing the calculation of observed values,
reference values, calculation of the EQR then adjustment of the EQRs and subsequent
combination to produce the final class.
EQRs are a ratio of observed and expected values. Observed values are taken from survey
data collected in the field and expected values (also referred to as reference values) are
calculated from the predictor variables described above. Thus River LEAFPACS2 produces
a site specific reference value for each survey location.
The EQR scale for each metric was influenced by the data used in its development and is
not the same in each case. To enable the metrics to be combined their values need to be
“normalised” to the same scale. The normalised EQRs enable the combination of metrics to
produce the overall River LEAFPACS EQR and the assessment of macrophyte status. It is
recommended that the results from individual metrics are not be used in isolation.
The class boundaries for River LEAFPACS2 are:
Status class boundary EQR
High/Good 0.8
Good/Moderate 0.6
Moderate/Poor 0.4
Poor/Bad 0.2
Once the final EQR has been calculated, an assessment of the statistical confidence of
these values can be made. This is referred to as Confidence of Class - the procedure allows
the calculation of statistical confidence of a given EQR falling into any of the five status
classes. The Confidence of Class reflects the position of a given EQR value relative to the
range of EQR values appropriate to a given class and takes account of the variability
between sites in a water body and the variability between surveyors in collecting data. It
does not measure the confidence with which an impact is detected.
3.1 River LEAFPACS2 calculator spreadsheets
The procedures for calculating the macrophyte metric EQRs, the overall EQR and the
Confidence of Class can be carried out manually using a calculator and spreadsheet such as
MS Excel. However, the task can be made simpler by using a spreadsheet calculator. An
MS Excel spreadsheet has been produced with a series of worksheets for data input and
calculation of all components of the classification, including Confidence of Class.
Instructions for use are provided within the spreadsheet calculator. The most recent version
of the spreadsheet calculator can be found on the UKTAG website.
UKTAG Guide to River LEAFPACS2
6
NB As revisions are likely to be made and the calculator updated over time, it is important to
check that the most recent version is being used.
Calculator spreadsheets provided on the UKTAG website are:
River LEAFPACS2 metric calculator, which enables the calculation of metrics from
raw survey data
River LEAFPACS2 EQR calculator which enables the calculation of EQRs and
Confidence of Class
3.2 Calculating EQR for the metrics
A worked example of the following calculations is provided in Appendix B.
Calculation of the observed value for each parameter
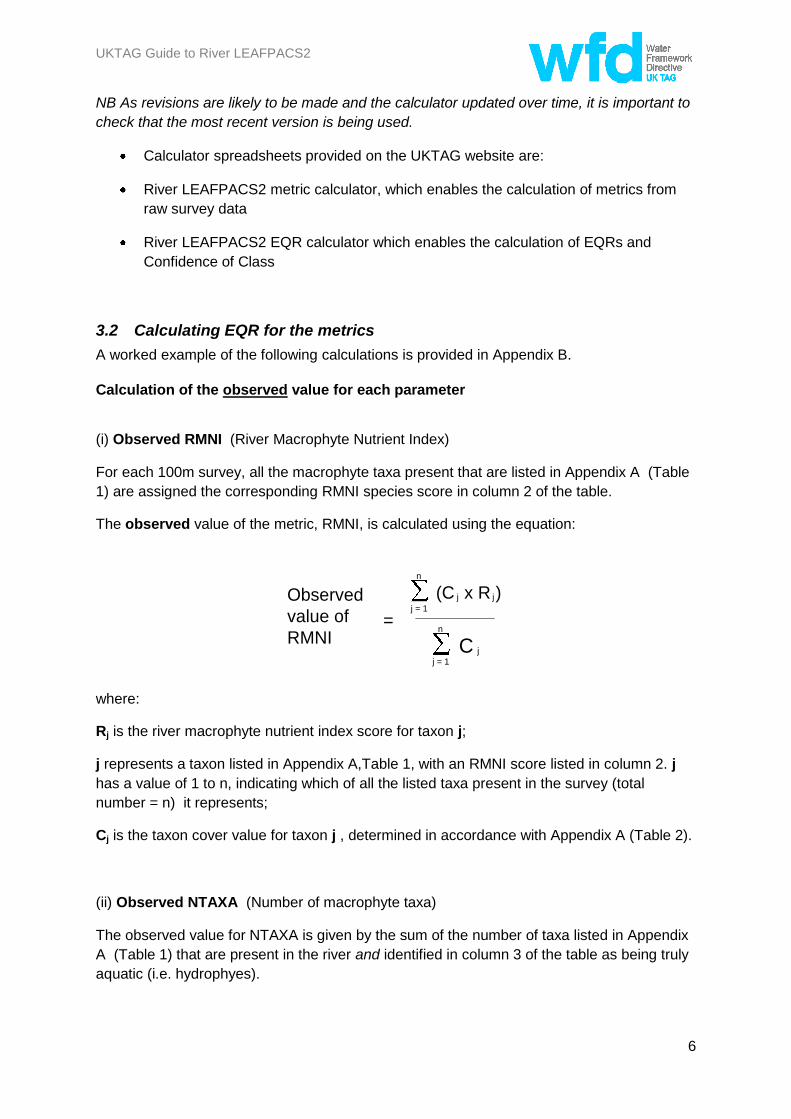
(i) Observed RMNI (River Macrophyte Nutrient Index)
For each 100m survey, all the macrophyte taxa present that are listed in Appendix A (Table
1) are assigned the corresponding RMNI species score in column 2 of the table.
The observed value of the metric, RMNI, is calculated using the equation:
Observed
value of
RMNI=
(C x R )j = 1
n
Cj = 1
n
j j
j
where:
Rj is the river macrophyte nutrient index score for taxon j;
j represents a taxon listed in Appendix A,Table 1, with an RMNI score listed in column 2. j
has a value of 1 to n, indicating which of all the listed taxa present in the survey (total
number = n) it represents;
Cj is the taxon cover value for taxon j , determined in accordance with Appendix A (Table 2).
(ii) Observed NTAXA (Number of macrophyte taxa)
The observed value for NTAXA is given by the sum of the number of taxa listed in Appendix
A (Table 1) that are present in the river and identified in column 3 of the table as being truly
aquatic (i.e. hydrophyes).
UKTAG Guide to River LEAFPACS2
7
Note that when there are several morphologically distinct taxa present belonging to a single
aggregate (e.g. Ranunculus section Batrachian), no members of which can be identified to
species level, these should be recorded as separate species for the purposes of calculating
this metric.
(iii) Observed NFG (Number of functional groups)
To determine the observed value for NFG, each taxon included in the observed NTAXA
metric (i.e. listed in Appendix A, Table 1, and identified in Column 3 of that Table as aquatic),
is assigned to the corresponding macrophyte functional group number in Column 4 of Table
1.
The observed value for NFG is given by the sum of the number of different functional groups
of taxa present in the survey.
(iv) Observed ALG (Percentage cover of green filamentous algae)
To calculate the observed value of ALG:
a) use the mid-point of the percentage cover range associated with the cover score, for each
recorded algal taxon, as indicated in Appendix A (Table 2).
b) add up the individual percentage cover values of all taxa in Appendix A (Table 1) which
are identified as filamentous algae in column 5.
A direct visual assessment of the overall percentage cover of green filamentous algae at the
site is an acceptable alternative, but note that this cannot then be entered against the taxa in
the metric calculator spreadsheet.
The observed value for the metric ALG represents the total coverage of the stream bed by
green filamentous algae, and will range from 0-100.
Calculation of the reference value for each metric
The reference values described below were derived using a combination of (a) information
from a network of river sites identified as being subject to no or very minor alterations likely
to affect their macrophyte communities and (b) modelling.
Reference values are site specific and should, if possible, be calculated for each surveyed
stretch in a water body, using the following equations. It is essential that the predictor
variables are expressed in the same units as defined in Section 2.2.
(i) Reference RMNI (River Macrophyte Nutrient Index )
Reference RMNI = 5.239 + [1.384 x Log10(Alk + 1)] + [-0.68 x Log10(S+1)] +
[0.711x Log10(D + 1)] + [-1.074 x Log10(HSo + 1)]
UKTAG Guide to River LEAFPACS2
8
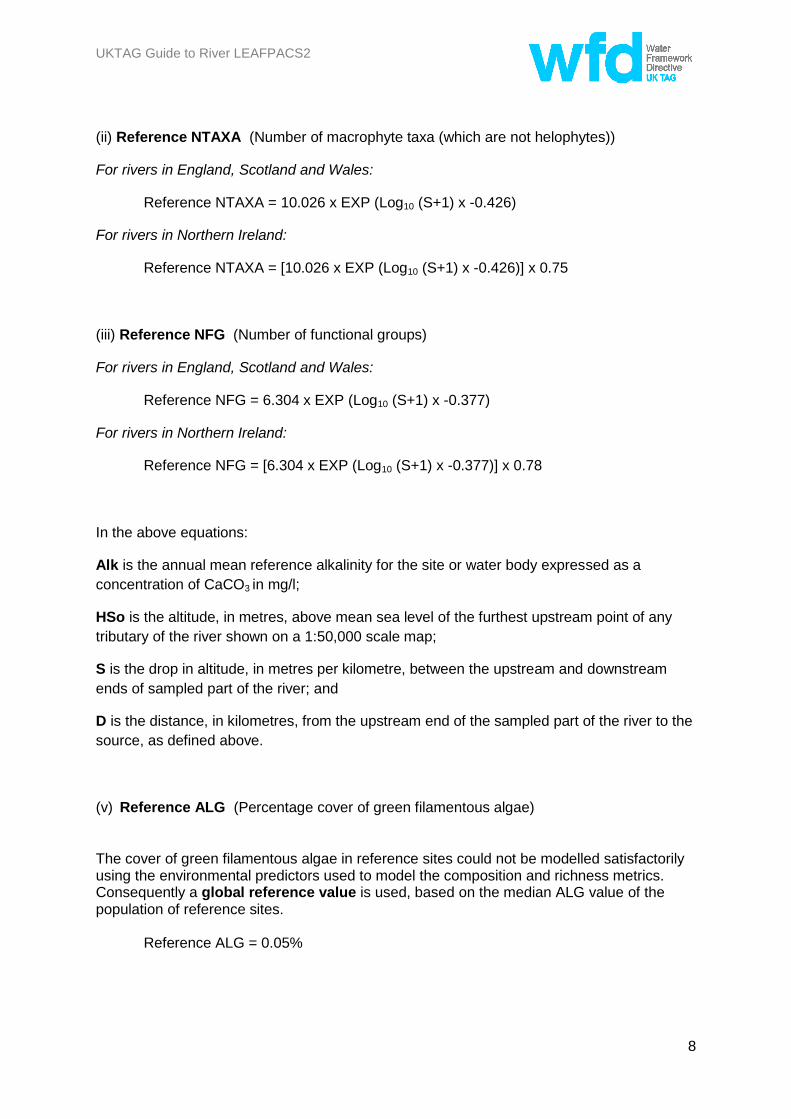
(ii) Reference NTAXA (Number of macrophyte taxa (which are not helophytes))
For rivers in England, Scotland and Wales:
Reference NTAXA = 10.026 x EXP (Log10 (S+1) x -0.426)
For rivers in Northern Ireland:
Reference NTAXA = [10.026 x EXP (Log10 (S+1) x -0.426)] x 0.75
(iii) Reference NFG (Number of functional groups)
For rivers in England, Scotland and Wales:
Reference NFG = 6.304 x EXP (Log10 (S+1) x -0.377)
For rivers in Northern Ireland:
Reference NFG = [6.304 x EXP (Log10 (S+1) x -0.377)] x 0.78
In the above equations:
Alk is the annual mean reference alkalinity for the site or water body expressed as a
concentration of CaCO3 in mg/l;
HSo is the altitude, in metres, above mean sea level of the furthest upstream point of any
tributary of the river shown on a 1:50,000 scale map;
S is the drop in altitude, in metres per kilometre, between the upstream and downstream
ends of sampled part of the river; and
D is the distance, in kilometres, from the upstream end of the sampled part of the river to the
source, as defined above.
(v) Reference ALG (Percentage cover of green filamentous algae)
The cover of green filamentous algae in reference sites could not be modelled satisfactorily using the environmental predictors used to model the composition and richness metrics. Consequently a global reference value is used, based on the median ALG value of the population of reference sites.
Reference ALG = 0.05%

UKTAG Guide to River LEAFPACS2
9
3.3 Calculation of the ecological quality ratio (EQR) for each metric
The “raw” EQRs for the individual metrics are calculated using the following equations:
(i) RMNI EQR
EQRRMNI = (observed value of RMNI – 10) ÷ (reference value for RMNI – 10)
(Where 10 is the worst possible RMNI value) (ii) NTAXA EQR
EQRNTAXA = observed value of NTAXA ÷ reference value for NTAXA
(iii) NFG EQR
EQRNFG = observed value of NFG ÷ reference value for NFG.
(iv) ALG EQR
EQRALG = (observed value of ALG – 100) ÷ (reference value for ALG (i.e.0.05) – 100) (Where 100 represents the worst possible value of ALG, and global reference value of 0.05 is used)
3.4 Adjustment of the ecological quality ratios
The ”raw” EQR values of different metrics are not directly aligned with each other because
these metrics are measured and modelled with different levels of precision. Therefore the
”raw” EQR values obtained from the equations above must be standardised before the
combined LEAFPACS EQR can be calculated. The EQR for each metric is adjusted
according to its value, as shown in the tables below:

UKTAG Guide to River LEAFPACS2
10
i) RMNI EQR adjustment
EQRRMNI Adjusted EQR (AEQRRMNI)
>1.00 1.00
≥0.85 and <1.00 ((EQRRMNI-0.85)/(1-0.85))*0.2+0.8
≥ 0.70 and <0.85 ((EQRRMNI-0.7)/(0.85-0.7))*0.2+0.6
≥ 0.52 and <0.70 ((EQRRMNI-0.52)/(0.7-0.52))*0.2+0.4
≥ 0.34 and < 0.52 ((EQRRMNI-0.34)/(0.52-0.34))*0.2+0.2
≥ 0.16 and < 0.34 ((EQRRMNI-0.16)/(0.34-0.16))*0.2
< 0.16 0.00
(ii) Diversity metrics EQR adjustment Take the lowest of EQRNTAXA and EQRNFG. This value is then standardised according to the equations below, where ‘EQR’ represents the lower of the two diversity EQRs:
Lowest of EQRNTAXA and EQRNFG
Adjusted diversity EQR (AEQRD)
≥ 0.83 ((EQR-0.83)/(1-0.83))*0.2+0.8
≥ 0.66 and < 0.83 ((EQR-0.66)/(0.83-0.66))*0.2+0.6
≥ 0.49 and <0.66 ((EQR-0.49)/(0.66-0.49))*0.2+0.4,
≥ 0.32 and <0.49 ((EQR-0.32)/(0.49-0.32))*0.2+0.2,
< 0.32 and > 0.15 ((EQR-0.15)/(0.32-0.15))*0.2
(iii) ALG EQR adjustment
EQRALG
Adjusted EQR (AEQRALG)
> 0.975 (( EQRALG - 0.975) ÷(1 - 0.975)) x 0.2 + 0.8
≥ 0.925 and ≤ 0.975 (( EQRALG - 0.925) ÷ (0.975-0.925)) x 0.2 + 0.6
≥ 0.825 and ≤ 0.925 (( EQRALG -0.825) ÷ (0.925-0.825)) x 0.2 + 0.4
≥ 0.625 and ≤ 0.825 (( EQRALG - 0.625) ÷ (0.825 - 0.625)) x 0.2 + 0.2
< 0.625 (EQRALG ÷ 0.625) x 0.2

UKTAG Guide to River LEAFPACS2
11
3.5 Combining the ecological quality ratios for the different metrics
The EQR for the combined metrics (EQRLEAFPACS) is determined as follows:
Step 1: Combine composition (RMNI) and diversity metrics
a) If AEQRD < AEQRRMNI, then combined ecological quality ratio for the composition and
diversity parameters (EQRC&D) is calculated from:
EQRC&D = ((0.5 x [AEQRD])+ AEQRRMNI )) ÷ 1.5
b) If AEQRD > AEQRRMNI, then
EQRC&D = AEQRRMNI
Step 2: Determine EQRLEAFPACS
a) If EQRC&D < AEQRALG then:
EQRLEAFPACS = EQRC&D
b) If EQRC&D > AEQRALG, then:
EQRLEAFPACS = (Z x AEQRALG + EQRC&D) ÷ (Z + 1)
where: Z = 2 x (1 ÷ (Exp (Ln (2600000000) + reference RMNI x Ln (0.0166)) + 1 ÷ 0.5) Exp is the mathematical exponential function (ex); and Ln is the logarithm to the base of e.
UKTAG Guide to River LEAFPACS2
12
4 Application of the method for the purposes of classification
When using the method for the purposes of classifying the ecological status of a water body,
the mean value for the ecological quality ratio (EQRLEAFPACS) measured across multiple sites
within a single survey season, or a single site in multiple years should be used.
4.1 Confidence of Classification
To determine the confidence of the classification the uncertainty of the EQR is determined.
This uncertainty arises from a combination of within-water body spatial and temporal
variability in the biological community and variation between surveyors in assessing this
community in the field. For the purpose of classification too few replicate surveys are
available to measure this directly. Thus the method estimates the uncertainty using data
from other water bodies, using an approach described by Ellis & Adriaenssens (2006). The
spatio-temporal variability (the standard deviation) of the survey EQR is estimated as a
function of the mean Survey EQR in a water body.
To estimate uncertainty it is assumed that after a logit transformation the EQR uncertainty is
normally distributed around the true EQR value, with the predicted standard deviation. Then
the confidence of class is computed using the Standard Normal Distribution.
4.2 Combination of macrophytes and phytobenthos for classification
Annex V of the WFD refers to macrophytes and phytobenthos as a single biological quality
element. Where both sub-elements are classified independently using LEAFPACS2 and
DARLEQ2, they are combined for reporting purposes by taking the worst of either as the
combined result.
It is however recognised that there will be situations where macrophyte surveys are either
not possible or are compromised, and possibly also situations where diatom assessments
are inherently unreliable.
Analysis carried out for the UKTAG (UKTAG 2013) has confirmed that a DARLEQ2 based
assessment alone would generally give a reliable classification if alkalinity is < 75 mg L-1
CaCO3 (because the diatom-based status is consistently lower than the macrophyte-based
status over this range of alkalinity and will thus define the overall classification), whilst a
LEAFPACS2 based assessment alone is adequate at >200 mg L-1 CaCO3 (because the
macrophyte-based status is then consistently lower than the diatom-based status). In the
middle range, both components are necessary (because neither one is consistently lower
than the other) although, on average, an assessment based on DARLEQ2 alone will be a
more reliable guide than LEAFPACS2 alone at alkalinities up to ~120 mg L-1 CaCO3 ,
whereas LEAFPACS2 alone will be a more reliable guide at alkalinities above this.

UKTAG Guide to River LEAFPACS2
13
5 References Ellis, J., and V. Adriaenssens.(2006) Uncertainty estimation for monitoring results by the WFD biological classification tools. Environment Agency, Bristol. Willby, N.J., Pitt, J-A., & Phillips, G.L. (2012). The ecological classification of UK rivers using aquatic macrophytes. Science Report SC01008O/R1. Environment Agency, Bristol. UKTAG( 2013) Final recommendations on new and updated biological standards. September 2013. http://www.wfduk.org/sites/default/files/Media/UKTAG%20Final%20recommendations%20on%20biological%20stds_20131030.PDF

UKTAG Guide to River LEAFPACS2
14
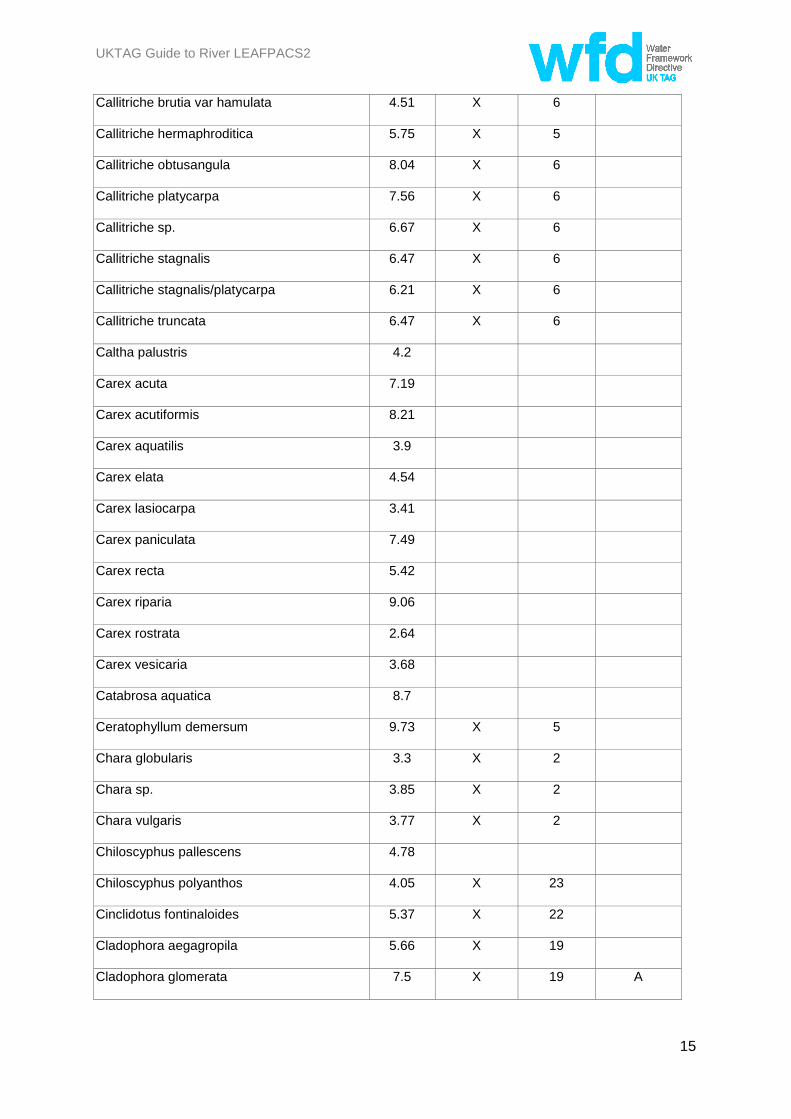
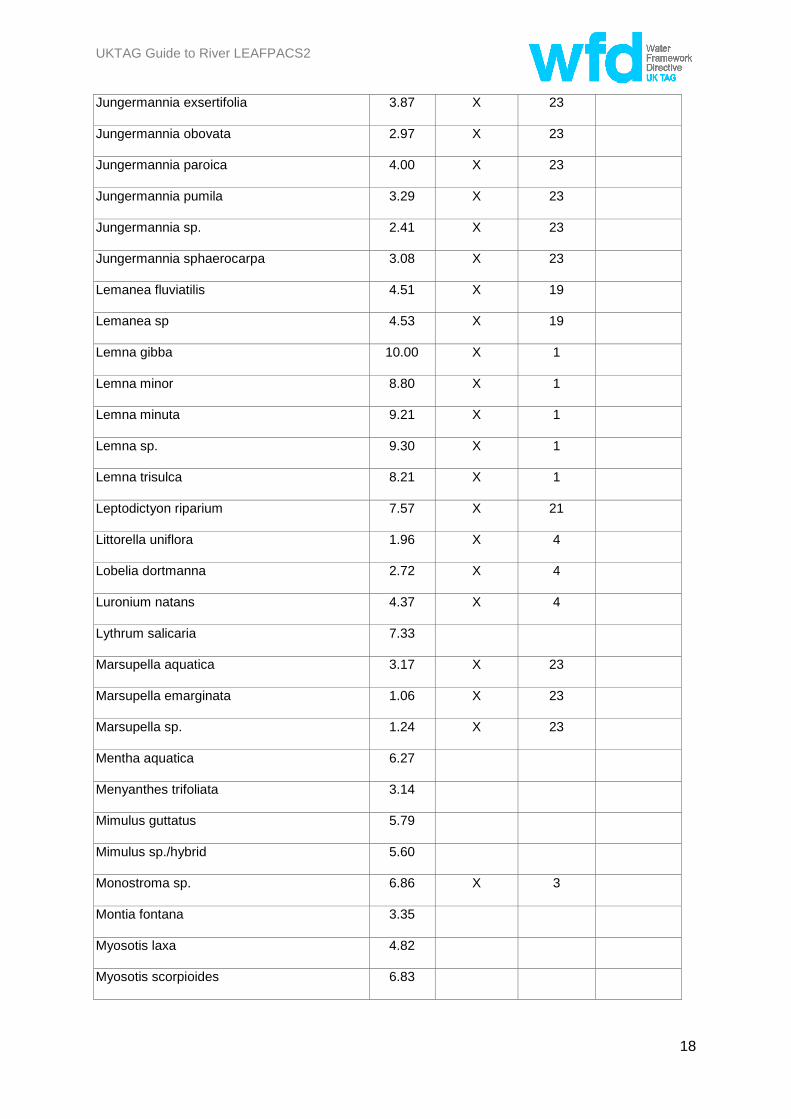
APPENDIX A
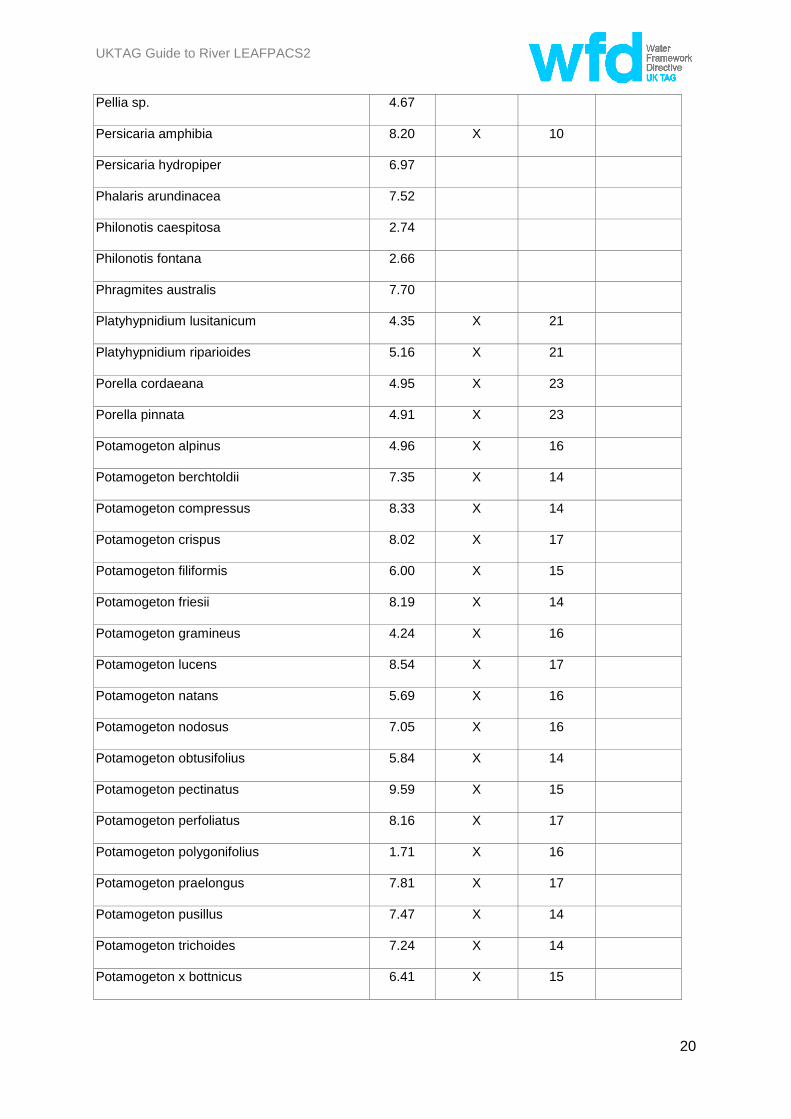
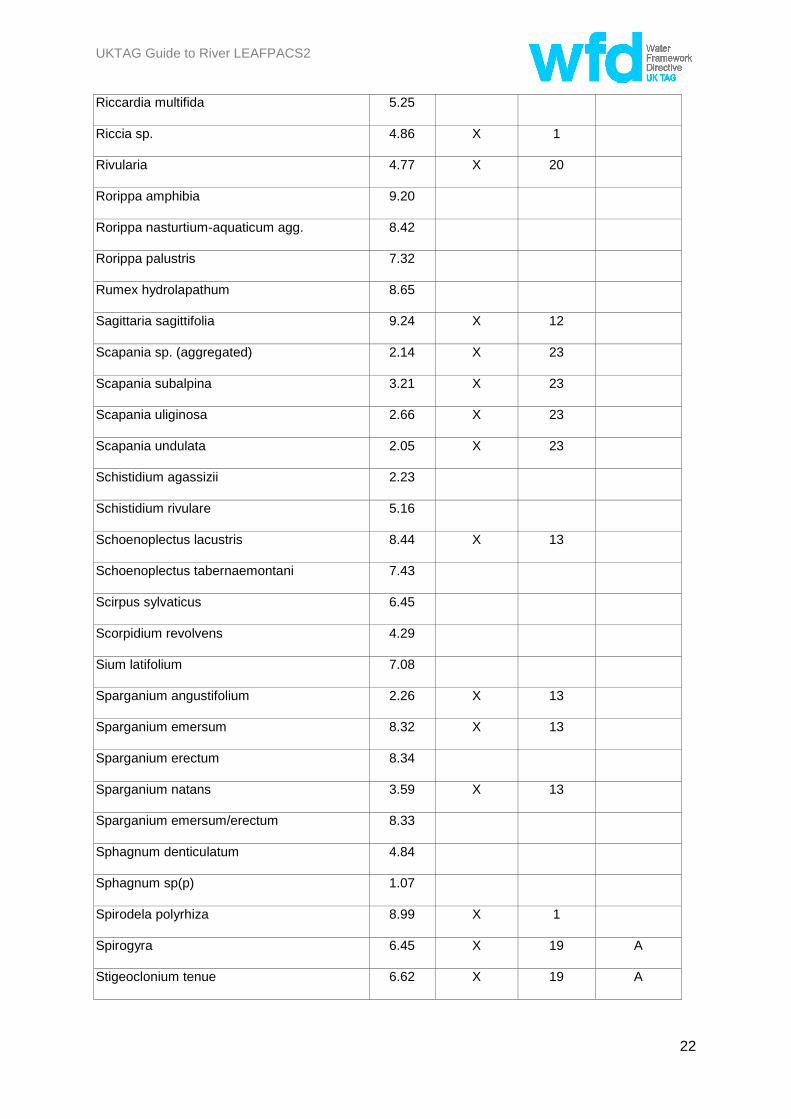
Table 1: River LEAFPACS taxon list and associated values/characteristics for metric
calculations
Taxon
RMNI Aquatic
taxa
(hydrophyte)
for NTAXA
& NFG
Functional
Group
Filamentous
alga for ALG
metric
Acorus calamus 9.49
Alisma lanceolatum 8.47
Alisma plantago-aquatica 7.82
Anthelia julacea 2.7
Apium inundatum 4.34 X 8
Apium nodiflorum 8.64 X 8
Azolla filiculoides 9.71 X 1
Baldellia ranunculoides 4.34 X 4
Batrachospermum sp. 5.46 X 19
Berula erecta 8.24 X 8
Bidens cernua 8.13
Bidens tripartita 8.39
Blindia acuta 1.09 X 22
Blue-green algal scum/pelts 5.1 X 3
Bolboschoenus maritimus 7.65
Brachythecium plumosum 2.92 X 21
Brachythecium rivulare 3.56 X 21
Bryum alpinum 3.83
Bryum dixonii 5.22
Bryum pseudotriquetrum 2.71
Butomus umbellatus 8.89 X 13
Calliergon cuspidatum 3.49
UKTAG Guide to River LEAFPACS2
15
Callitriche brutia var hamulata 4.51 X 6
Callitriche hermaphroditica 5.75 X 5
Callitriche obtusangula 8.04 X 6
Callitriche platycarpa 7.56 X 6
Callitriche sp. 6.67 X 6
Callitriche stagnalis 6.47 X 6
Callitriche stagnalis/platycarpa 6.21 X 6
Callitriche truncata 6.47 X 6
Caltha palustris 4.2
Carex acuta 7.19
Carex acutiformis 8.21
Carex aquatilis 3.9
Carex elata 4.54
Carex lasiocarpa 3.41
Carex paniculata 7.49
Carex recta 5.42
Carex riparia 9.06
Carex rostrata 2.64
Carex vesicaria 3.68
Catabrosa aquatica 8.7
Ceratophyllum demersum 9.73 X 5
Chara globularis 3.3 X 2
Chara sp. 3.85 X 2
Chara vulgaris 3.77 X 2
Chiloscyphus pallescens 4.78
Chiloscyphus polyanthos 4.05 X 23
Cinclidotus fontinaloides 5.37 X 22
Cladophora aegagropila 5.66 X 19
Cladophora glomerata 7.5 X 19 A

UKTAG Guide to River LEAFPACS2
16
Cladophora glomerata/Rhizoclonium
hieroglyphicum 8.66 X 19
A
Collema dichotomum 4.42 X 3
Cratoneuron filicinum 5.02
Dermatocarpon sp. 3.51
Dichodontium flavescens 2.94
Dichodontium palustris 1.68
Dichodontium pellucidum 3.07
Dichodontium flavescens/pellucidum 3.00
Draparnaldia 3.04 X 19
Drepanocladus fluitans 3.73
Elatine hexandra 4.17 X 11
Eleocharis acicularis 5.35 X 4
Eleocharis palustris 4.54
Eleogiton fluitans 2.06 X 15
Elodea canadensis 7.65 X 5
Elodea nuttallii 9.44 X 5
Equisetum fluviatile 3.92
Filamentous green algae 7.61 X 19 A
Fissidens polyphyllus 3.84 X 22
Fissidens crassipes 6.2 X 22
Fissidens curnovii 3.94 X 22
Fissidens osmundoides 3.06 X 22
Fissidens rivularis 5.95 X 22
Fissidens rufulus 4.7 X 22
Fissidens serrulatus 5.27 X 22
Fissidens sp. 5.8 X 22
Fissidens viridulus 4.66 X 22
Fontinalis antipyretica 5.4 X 21
Fontinalis squamosa 3.66 X 21

UKTAG Guide to River LEAFPACS2
17
Glyceria declinata 6.66
Glyceria fluitans 5.25
Glyceria fluitans agg 5.81
Glyceria maxima 9.64
Glyceria notata 8.28
Glyceria x pedicillata 7.12
Gongrosira incrustans 7.46 X 20
Groenlandia densa 7.96 X 5
Heribaudiella fluviatilis 5.49 X 20
Hildenbrandia rivularis 6.03 X 20
Hippuris vulgaris 5.94
Hottonia palustris 6.93 X 7
Hydrocharis morsus-ranae 8.77 X 1
Hydrodictyon reticulatum 8.79 X 19 A
Hygroamblystegium fluviatile 5.41 X 21
Hygroamblystegium sp. 6.55 X 21
Hygroamblystegium tenax 5.27 X 21
Hygrobiella laxifolia 2.76 X 23
Hygrohypnum duriusculum 3.33 X 21
Hygrohypnum eugyrium 4.28 X 21
Hygrohypnum luridum 2.80 X 21
Hygrohypnum ochraceum 2.96 X 21
Hyocomium armoricum 1.96
Hypericum elodes 2.66
Iris pseudacorus 6.92
Isoetes lacustris 3.02 X 4
Juncus articulatus 3.10
Juncus bulbosus 1.89 X 4
Jungermannia atrovirens 2.28 X 23
UKTAG Guide to River LEAFPACS2
18
Jungermannia exsertifolia 3.87 X 23
Jungermannia obovata 2.97 X 23
Jungermannia paroica 4.00 X 23
Jungermannia pumila 3.29 X 23
Jungermannia sp. 2.41 X 23
Jungermannia sphaerocarpa 3.08 X 23
Lemanea fluviatilis 4.51 X 19
Lemanea sp 4.53 X 19
Lemna gibba 10.00 X 1
Lemna minor 8.80 X 1
Lemna minuta 9.21 X 1
Lemna sp. 9.30 X 1
Lemna trisulca 8.21 X 1
Leptodictyon riparium 7.57 X 21
Littorella uniflora 1.96 X 4
Lobelia dortmanna 2.72 X 4
Luronium natans 4.37 X 4
Lythrum salicaria 7.33
Marsupella aquatica 3.17 X 23
Marsupella emarginata 1.06 X 23
Marsupella sp. 1.24 X 23
Mentha aquatica 6.27
Menyanthes trifoliata 3.14
Mimulus guttatus 5.79
Mimulus sp./hybrid 5.60
Monostroma sp. 6.86 X 3
Montia fontana 3.35
Myosotis laxa 4.82
Myosotis scorpioides 6.83

UKTAG Guide to River LEAFPACS2
19
Myosotis secunda 4.74
Myosotis sp(p). 7.00
Myriophyllum alterniflorum 3.44 X 7
Myriophyllum spicatum 8.26 X 7
Myriophyllum spp indet 5.89 X 7
Myriophyllum verticillatum 7.53 X 7
Nardia compressa 1.05 X 23
Nardia scalaris 2.73 X 23
Nardia sp. 1.40 X 23
Nitella flexilis (agg.) 4.39 X 2
Nitella opaca 4.31 X 2
Nitella sp. 4.59 X 2
Nitella translucens 4.17 X 2
Nostoc commune 5.14 X 3
Nostoc parmelioides 4.12 X 3
Nostoc sp. 4.66 X 3
Nostoc verrucosum 4.71 X 3
Nuphar lutea 8.42 X 12
Nymphaea alba 5.69 X 12
Nymphoides peltata 9.37 X 10
Octodiceras fontanum 6.54 X 22
Oenanthe aquatica 6.06 X 8
Oenanthe crocata 6.22 X 8
Oenanthe fistulosa 8.27
Oenanthe fluviatilis 8.57 X 8
Orthotrichum rivulare 4.71
Palustriella commutata 4.61
Pellia endiviifolia 6.50
Pellia epiphylla 3.34
UKTAG Guide to River LEAFPACS2
20
Pellia sp. 4.67
Persicaria amphibia 8.20 X 10
Persicaria hydropiper 6.97
Phalaris arundinacea 7.52
Philonotis caespitosa 2.74
Philonotis fontana 2.66
Phragmites australis 7.70
Platyhypnidium lusitanicum 4.35 X 21
Platyhypnidium riparioides 5.16 X 21
Porella cordaeana 4.95 X 23
Porella pinnata 4.91 X 23
Potamogeton alpinus 4.96 X 16
Potamogeton berchtoldii 7.35 X 14
Potamogeton compressus 8.33 X 14
Potamogeton crispus 8.02 X 17
Potamogeton filiformis 6.00 X 15
Potamogeton friesii 8.19 X 14
Potamogeton gramineus 4.24 X 16
Potamogeton lucens 8.54 X 17
Potamogeton natans 5.69 X 16
Potamogeton nodosus 7.05 X 16
Potamogeton obtusifolius 5.84 X 14
Potamogeton pectinatus 9.59 X 15
Potamogeton perfoliatus 8.16 X 17
Potamogeton polygonifolius 1.71 X 16
Potamogeton praelongus 7.81 X 17
Potamogeton pusillus 7.47 X 14
Potamogeton trichoides 7.24 X 14
Potamogeton x bottnicus 6.41 X 15

UKTAG Guide to River LEAFPACS2
21
Potamogeton x cooperi 6.07 X 17
Potamogeton x fluitans 6.51 X 16
Potamogeton x gessnacensis 3.88 16
Potamogeton x lanceolatus 4.24 X 17
Potamogeton x nitens 6.17 X 17
Potamogeton x olivaceus 5.44 X 17
Potamogeton x salicifolius 6.36 X 17
Potamogeton x sparganifolius 3.87 X 16
Potamogeton x suecicus 6.02 X 15
Potamogeton x zizzii 4.19 X 16
Potentilla palustris 2.88
Racomitrium aciculare 1.89 X 22
Ranunculus (sect Batrachian) sp. or hybrid
indet 7.33 X 18
Ranunculus aquatilis var aquatilis 5.67 X 18
Ranunculus aquatilis var diffusus 7.65 X 18
Ranunculus circinatus 9.42 X 5
Ranunculus flammula 2.56
Ranunculus fluitans 7.97 X 18
Ranunculus hederaceus 5.47
Ranunculus omiophyllus 3.43 X 11
Ranunculus peltatus var baudotii 9.06 X 18
Ranunculus peltatus var peltatus 6.22 X 18
Ranunculus penicillatus ssp. penicillatus 6.29 X 18
Ranunculus penicillatus ssp. pseudofluitans 7.92 X 18
Ranunculus penicillatus ssp. pseudofluitans
var vertumnus 5.87 X 18
Ranunculus sceleratus 9.86
Rhodochorton violaceum 4.14
Riccardia chamaedryfolia 4.91
UKTAG Guide to River LEAFPACS2
22
Riccardia multifida 5.25
Riccia sp. 4.86 X 1
Rivularia 4.77 X 20
Rorippa amphibia 9.20
Rorippa nasturtium-aquaticum agg. 8.42
Rorippa palustris 7.32
Rumex hydrolapathum 8.65
Sagittaria sagittifolia 9.24 X 12
Scapania sp. (aggregated) 2.14 X 23
Scapania subalpina 3.21 X 23
Scapania uliginosa 2.66 X 23
Scapania undulata 2.05 X 23
Schistidium agassizii 2.23
Schistidium rivulare 5.16
Schoenoplectus lacustris 8.44 X 13
Schoenoplectus tabernaemontani 7.43
Scirpus sylvaticus 6.45
Scorpidium revolvens 4.29
Sium latifolium 7.08
Sparganium angustifolium 2.26 X 13
Sparganium emersum 8.32 X 13
Sparganium erectum 8.34
Sparganium natans 3.59 X 13
Sparganium emersum/erectum 8.33
Sphagnum denticulatum 4.84
Sphagnum sp(p) 1.07
Spirodela polyrhiza 8.99 X 1
Spirogyra 6.45 X 19 A
Stigeoclonium tenue 6.62 X 19 A

UKTAG Guide to River LEAFPACS2
23
Stigonema sp. 4.32 X 19
Tetraspora lubrica/gelatinosa 6.72 X 3
Thamnobryum alopecurum 4.22 X 21
Tolypothrix penicillata 2.96 X 3
Triglochin palustris 4.07
Typha angustifolia 7.57
Typha latifolia 8.87
Ulva flexuosa 9.52 X 19 A
Utricularia intermedia 2.74 X 9
Utricularia minor 3.77 X 9
Utricularia sp. 3.23 X 9
Utricularia vulgaris s.l. 3.72 X 9
Vaucheria sp(p) 8.41 X 19 A
Veronica anagallis-aquatica 8.45
Veronica beccabunga 7.31
Veronica catenata 9.32
Veronica catenata x anagallis-aquatica 8.34
Veronica scutellata 2.35
Zannichellia palustris 9.01 X 15
Zygnematalean alga 6.45 X 19 A

UKTAG Guide to River LEAFPACS2
24
Table 2: River LEAFPACS cover values for macrophyte taxa
Column 1 Column 2 Column 3
Percentage cover range
(% of channel area)
Taxon cover value Mid-point percentage
< 0.1 1 0.05
0.1 < 1 2 0.5
1 < 2.5 3 1.7
2.5 < 5 4 3.8
5 < 10 5 7.5
10 < 25 6 17.5
25 < 50 7 37.5
50 < 75 8 62.5
≥ 75 9 87.5
UKTAG Guide to River LEAFPACS2
25
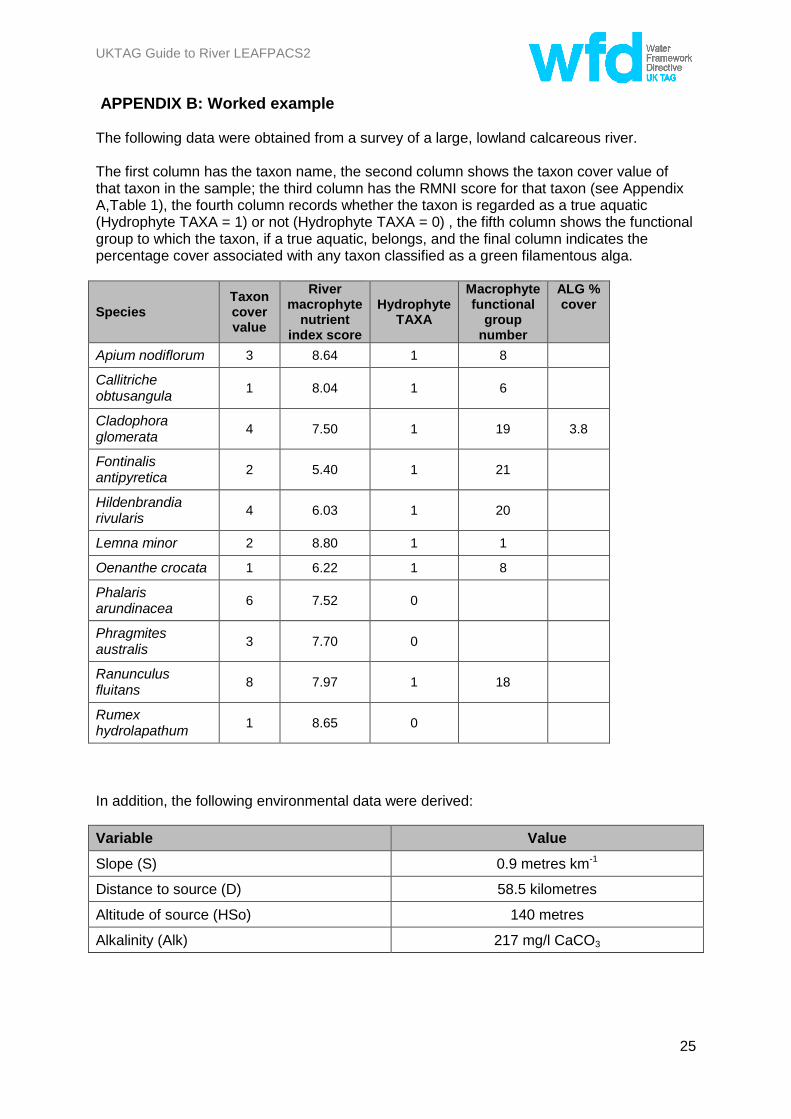
APPENDIX B: Worked example The following data were obtained from a survey of a large, lowland calcareous river. The first column has the taxon name, the second column shows the taxon cover value of that taxon in the sample; the third column has the RMNI score for that taxon (see Appendix A,Table 1), the fourth column records whether the taxon is regarded as a true aquatic (Hydrophyte TAXA = 1) or not (Hydrophyte TAXA = 0) , the fifth column shows the functional group to which the taxon, if a true aquatic, belongs, and the final column indicates the percentage cover associated with any taxon classified as a green filamentous alga.
Species Taxon cover value
River macrophyte
nutrient index score
Hydrophyte TAXA
Macrophyte functional
group number
ALG % cover
Apium nodiflorum 3 8.64 1 8
Callitriche obtusangula
1 8.04 1 6
Cladophora glomerata
4 7.50 1 19 3.8
Fontinalis antipyretica
2 5.40 1 21
Hildenbrandia rivularis
4 6.03 1 20
Lemna minor 2 8.80 1 1
Oenanthe crocata 1 6.22 1 8
Phalaris arundinacea
6 7.52 0
Phragmites australis
3 7.70 0
Ranunculus fluitans
8 7.97 1 18
Rumex hydrolapathum
1 8.65 0
In addition, the following environmental data were derived:
Variable Value
Slope (S) 0.9 metres km-1
Distance to source (D) 58.5 kilometres
Altitude of source (HSo) 140 metres
Alkalinity (Alk) 217 mg/l CaCO3

UKTAG Guide to River LEAFPACS2
26
RMNI
The observed RMNI is calculated as follows:
1. Calculate taxon cover value river macrophyte nutrient index score for all relevant taxa present in the sample
2. Sum the results of step 1, above = 263.28
3. Sum the taxon cover values for all relevant taxa present in the sample = 35
4. Calculate the observed value of RMNI as 263.28 ÷ 35 = 7.52
The reference value is calculated using the applicable equation in section 3.2. This results in a reference value of 7.24.
EQRRMNI = (7.52 – 10) / (7.24 – 10) = 0.90.
EQRRMNI is adjusted using the applicable equation in section 3.4, to give AEQRRMNI = 0.86
Number of taxa
The observed number of aquatic plant taxa (NTAXA) is 8 (as only hydrophytes are included).
The reference value for NTAXA is calculated using the applicable equation in section 3.2. This results in a reference value of 8.9.
EQRNTAXA = observed value of NTAXA ÷ reference value for NTAXA = 0.90
Functional group diversity
The observed number of functional groups (NFG) for this river is 7. There are 8 aquatic plant taxa (hydrophytes) because the helophytes Phalaris arundinacea, Phragmites australis and Rumex hydrolapathum are excluded. The remaining species belong to different functional groups, except Oenanthe crocata and Apium nodiflorum which share the same functional group. Consequently, there are seven functional groups.
The reference value for NFG is calculated using the applicable equation in section 3.2. This results in a reference value of 5.68.
EQRNFG = observed value of NFG / reference value for NFG = 1.23
Since EQRNTAXA < EQRNFG the former is adjusted using the applicable equation in section
3.4, to give AEQRD = 0.88
EQRNFG plays no further role in classification.

UKTAG Guide to River LEAFPACS2
27
Algal cover
The observed cover of green filamentous algae (ALG) is 3.8%
The reference value for ALG is fixed at 0.05.
EQRALG = (observed value of ALG -100) ÷ (reference value for ALG - 100) = 0.962
EQRALG is adjusted using the applicable equation in section 3.4, to give AEQRALG = 0.75.
The complete results for this river are, therefore, as follows:
Parameter Observed
value Reference
value EQR AEQR
RMNI 7.52 7.24 0.90 0.86
NTAXA 8.00 8.9 0.90 0.88
NFG 7.00 5.68 1.23
ALG 3.8 0.05 0.96 0.75
Calculating the EQR for the combined LEAFPACS parameter
Step 1: The value of AEQRRMNI is 0.86. AEQRD has a value of 0.88. The ecological quality ratio for the combined composition and diversity parameters (EQRC&D) is calculated using the applicable equation in section 3.5.
Since AEQRRMNI< AEQRD EQRC&D = AEQRRMNI = 0.86
Step 2: The value EQRC&D is compared with AEQRALG. Since the value of EQRC&D is > AEQRALG further adjustment of EQRC&D is required. Thus
EQRLEAFPACS = (Z x AEQRALG + EQRC&D) ÷ (Z + 1)
where:
Z = 2 x (1 ÷ (Exp (Ln (2600000000) + reference RMNI x Ln (0.0166)) + 1 ÷ 0.5) = 1.0
Therefore:
EQRLEAFPACS = (1 x 0.75 + 0.86) ÷ (1 + 1) = 0.81
The face value classification of this site would be High, although with an EQR of 0.81 it effectively lies on the High/Good boundary. EQRLEAFPACS for the waterbody would be reported as the mean of EQRLEAFPACS values for each individual site surveyed.