UK updated assessment and Good Environmental …...8 1) Does the UK Marine Strategy Part One provide...
100
Marine strategy part one: UK updated assessment and Good Environmental Status Consultation document May 2019
Transcript of UK updated assessment and Good Environmental …...8 1) Does the UK Marine Strategy Part One provide...
Marine strategy part one:
UK updated assessment and Good
Environmental Status
Consultation document
May 2019

2
© Crown copyright 2019
You may re-use this information (excluding logos) free of charge in any format or medium,
under the terms of the Open Government Licence v.3. To view this licence visit
www.nationalarchives.gov.uk/doc/open-government-licence/version/3/ or email
This publication is available at www.gov.uk/government/publications
Any enquiries regarding this publication should be sent to us at
www.gov.uk/defra

3
Contents
Advice for readers ................................................................................................................ 5
Questions ............................................................................................................................. 7
Introduction .......................................................................................................................... 8
Executive summary ............................................................................................................. 8
Section 1: Context ............................................................................................................. 15
1.1 The UK marine strategy ........................................................................................... 15
1.2 Good Environmental Status (GES) ......................................................................... 16
1.3 How we assessed progress towards the achievement of GES ................................ 17
1.4 Implementing the UK marine strategy ................................................................... 18
Section 2: our shared seas ................................................................................................ 20
2.1 Geographic and administrative scope ...................................................................... 20
2.2 Characterisation of our seas .................................................................................... 22
2.3 Progress with developing the UK MPA network ....................................................... 25
2.4 What our seas provide for the UK ......................................................................... 26
2.5 Uses of the marine environment............................................................................. 27
2.6 Predominant pressures affecting the marine environment ..................................... 34
2.7 Status of physical and chemical features ................................................................. 42
Section 3: Current environmental status, new objectives for GES and new targets .......... 46
D1, D4 Cetaceans .......................................................................................................... 48
D1, D4 Seals .................................................................................................................. 50
D1, D4 Birds ................................................................................................................... 52
D1, D4 Fish .................................................................................................................... 55
D1, D4 Pelagic habitats .................................................................................................. 57
D1, D6 Benthic habitats .................................................................................................. 59

4
D2, Non-indigenous species (NIS) ................................................................................. 61
D3 Commercial fish ........................................................................................................ 63
D4 Food webs ................................................................................................................ 66
D5 Eutrophication ........................................................................................................... 69
D7 Hydrographical conditions ........................................................................................ 71
D8 Contaminants ........................................................................................................... 73
D9 Contaminants in seafood .......................................................................................... 76
D10 Marine litter ............................................................................................................. 77
D11 Underwater noise .................................................................................................... 81
Annex 1: Threshold values or reference levels for the various indicators which the UK
plans to use for the 2018-2024 cycle of the UK Marine Strategy to assess whether the
associated targets will be met. ........................................................................................... 84

5
Advice for readers
Topic of this
consultation
The UK Marine Strategy Regulations 2010, which implement the EU Marine
Strategy Framework Directive (MSFD), requires the UK to take the necessary
measures to achieve or maintain Good Environmental Status (GES) by 2020
through the development of a UK Marine Strategy. This consultation sets out our
proposals for updating the UK Marine Strategy Part 1, published in 2012. It
includes an assessment of progress towards the achievement of GES for UK
seas and sets out revised targets and indicators that we will use over the next 6
years.
Scope of this
consultation
This consultation covers the updated UK Marine Strategy Part 1 only, not Parts
2 or 3.
Geographical scope The proposals apply to the marine waters over which the UK claims jurisdiction,
including territorial waters in Scotland, Wales and Northern Ireland. An updated
assessment for British Gibraltar Territorial Waters1 is being prepared separately.
To This consultation has particular relevance to:
groups or individuals who use the sea for whatever purpose, or
have an interest in it;
business users of the sea and those businesses that have an
impact on the sea;
national and local interest groups such as environmental and
recreational non-governmental organisations and industry
federations; and
the OSPAR Commission and its contracting parties.
Body responsible
for the consultation
This consultation is being carried out by the Marine Strategy Regulations
Implementation team in Defra’s Marine and Fisheries Directorate on behalf of
the UK government and the devolved administrations.
Duration The Consultation runs for 6 weeks:
Starts 9 May 2019 and ends on 20 June 2019.
1 Consultation expected in May/June 2019

6
Enquiries During the consultation, if you have any enquiries or wish to receive hard copies
of the documents, please contact:
Further information on the implementation of the Marine Strategy Regulations
can be found in the UK Marine Strategies Part 1, Part 2 and Part 3 which are all
published on Gov.uk
https://www.gov.uk/government/publications/marine-strategy-part-one-uk-initial-
assessment-and-good-environmental-status
We are not seeking comments on the monitoring programmes or programme of
measures set out in the UK’s Marine Strategy Parts Two and Three.
Consultation
questions
Particular questions which we invite those responding to the Consultation to
address are set out below.
How to respond Written responses can be submitted online via Defra's citizen space consultation
hub: https://consult.defra.gov.uk/marine/updated-uk-marine-strategy-part-one/
Or sent to
Email: [email protected]
Post: Marine Strategy Implementation team
1st floor Seacole block
2 Marsham St,
Westminster,
London SW1P 4DF
Responses must be submitted by 20 June 2019.
After the
consultation
At the end of the consultation period we will summarise the responses and place
this summary on gov.uk.
Copies of responses will be made available to the public on request. If you do
not want your response – including your name, contact details and any other
personal information – to be publicly available, please say so clearly in writing
when you send your response to the consultation. Please note, if your computer
automatically includes a confidentiality disclaimer, this will not count as a
confidentiality request.

7
Compliance with
Consultation
Principles
This consultation is in line with the government’s Consultation Principles. This
can be found at www.gov.uk/government/publications/consultation-principles-
guidance.
If you have any comments or complaints about the consultation process, please address them to: Consultation Coordinator
Area 1C, 1st
Floor Nobel House 17 Smith Square, London, SW1P 3JR.
Or email: [email protected]
Data protection and
confidentiality
Representative groups are asked to give a summary of the people and
organisations they represent and where relevant who else they have consulted
in reaching their conclusions when they respond.
Information provided in response to this consultation, including personal data,
may be published or disclosed in accordance with the access to information
regimes these are primarily the Environmental Information Regulations 2004
(EIRs), the Freedom of Information Act 2000 (FOIA) and the Data Protection Act
2018 (DPA). We have obligations, mainly under the EIRs, FOIA and DPA, to
disclose information to particular recipients or to the public in certain
circumstances.
If you want the information that you provide to be treated as confidential, please
be aware that, as a public authority, the Department is bound by the Freedom of
Information Act and may therefore be obliged to disclose all or some of the
information you provide. In view of this it would be helpful if you could explain to
us why you regard the information you have provided as confidential. If we
receive a request for disclosure of the information we will take full account of
your explanation, but we cannot give an assurance that confidentiality can be
maintained in all circumstances. An automatic confidentiality disclaimer
generated by your IT system will not, of itself, be regarded as binding on the
Department.
Questions
This consultation seeks views on the updated UK Marine Strategy and whether it
provides an appropriate stepping stone to achieving Good Environmental Status
(GES). Set out below are four questions on the updated UK Marine Strategy.

8
1) Does the UK Marine Strategy Part One provide an accurate reflection of the
state of UK marine waters and the economic and social uses of those waters?
2) To what extent are the proposed new criteria and associated targets sufficient
to guide progress towards achievement of GES?
3) To what extent are the proposed operational targets sufficient to achieve
GES?
4) Where gaps have been identified do you have suggestions on how these
could be filled?
Introduction
Publication of the UK Marine Strategy Parts 1-3 (the Strategy) between December
2012 and December 2015 marked a significant step forward in the protection and
management of the waters around our coasts. For the first time the Strategy set out
a comprehensive framework for assessing, monitoring and taking action across our
seas to achieve the UK’s shared vision for clean, healthy, safe, productive and
biologically diverse seas.
This report marks the beginning of the second implementation cycle of the Strategy.
It shows the progress made towards our shared vision and what further action is
necessary. We will continue to be a strong and influential partner on the international
stage and through OSPAR will work to further protect and conserve the marine
environment of the North-East Atlantic. This approach is enshrined in legislation that
will continue when we leave the EU and demonstrates the combined commitments of
the four UK Administrations to work together to protect what are some of the most
biologically diverse and productive seas in Europe.
Executive summary
Overall conclusions on the achievement of Good Environmental Status
We have made good progress towards achieving Good Environmental Status (GES).
The findings of the 60 indicator assessments covering marine species and habitats
and the key pressures affecting them have enabled us to assess the extent to which
GES has been achieved, helped to identify gaps in our knowledge and identify next
steps. These indicator assessments show that:
9
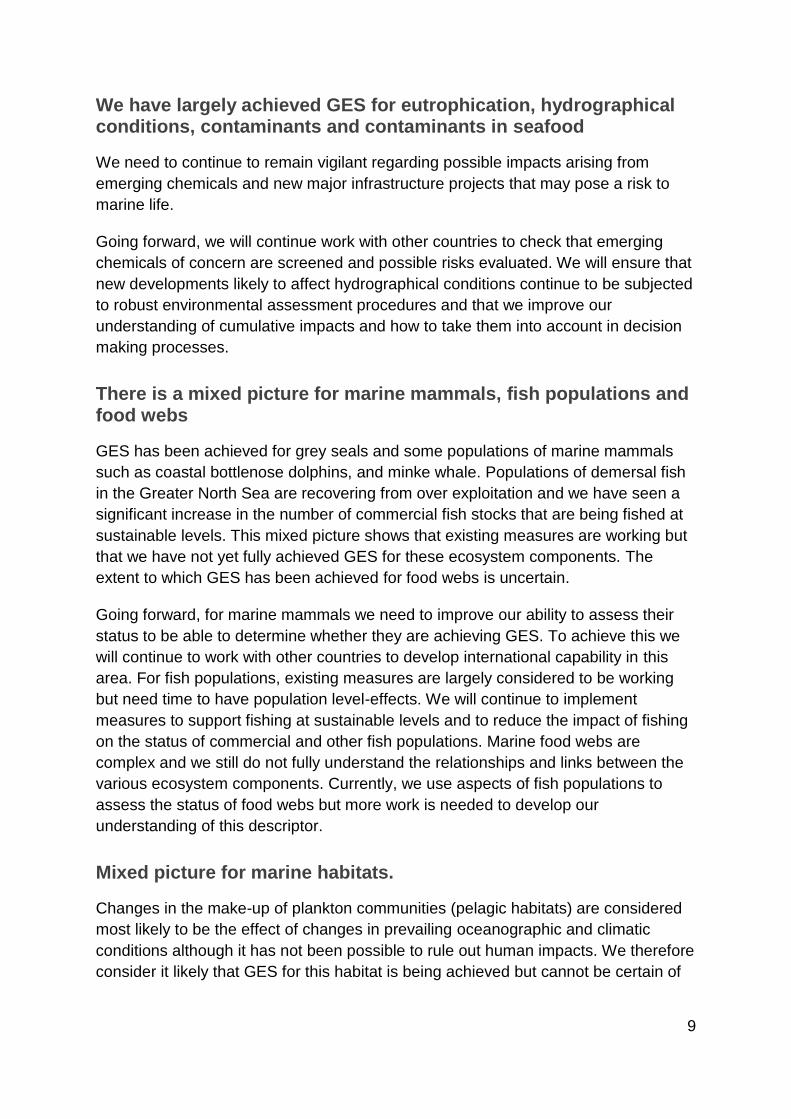
We have largely achieved GES for eutrophication, hydrographical conditions, contaminants and contaminants in seafood
We need to continue to remain vigilant regarding possible impacts arising from
emerging chemicals and new major infrastructure projects that may pose a risk to
marine life.
Going forward, we will continue work with other countries to check that emerging
chemicals of concern are screened and possible risks evaluated. We will ensure that
new developments likely to affect hydrographical conditions continue to be subjected
to robust environmental assessment procedures and that we improve our
understanding of cumulative impacts and how to take them into account in decision
making processes.
There is a mixed picture for marine mammals, fish populations and food webs
GES has been achieved for grey seals and some populations of marine mammals
such as coastal bottlenose dolphins, and minke whale. Populations of demersal fish
in the Greater North Sea are recovering from over exploitation and we have seen a
significant increase in the number of commercial fish stocks that are being fished at
sustainable levels. This mixed picture shows that existing measures are working but
that we have not yet fully achieved GES for these ecosystem components. The
extent to which GES has been achieved for food webs is uncertain.
Going forward, for marine mammals we need to improve our ability to assess their
status to be able to determine whether they are achieving GES. To achieve this we
will continue to work with other countries to develop international capability in this
area. For fish populations, existing measures are largely considered to be working
but need time to have population level-effects. We will continue to implement
measures to support fishing at sustainable levels and to reduce the impact of fishing
on the status of commercial and other fish populations. Marine food webs are
complex and we still do not fully understand the relationships and links between the
various ecosystem components. Currently, we use aspects of fish populations to
assess the status of food webs but more work is needed to develop our
understanding of this descriptor.
Mixed picture for marine habitats.
Changes in the make-up of plankton communities (pelagic habitats) are considered
most likely to be the effect of changes in prevailing oceanographic and climatic
conditions although it has not been possible to rule out human impacts. We therefore
consider it likely that GES for this habitat is being achieved but cannot be certain of
10
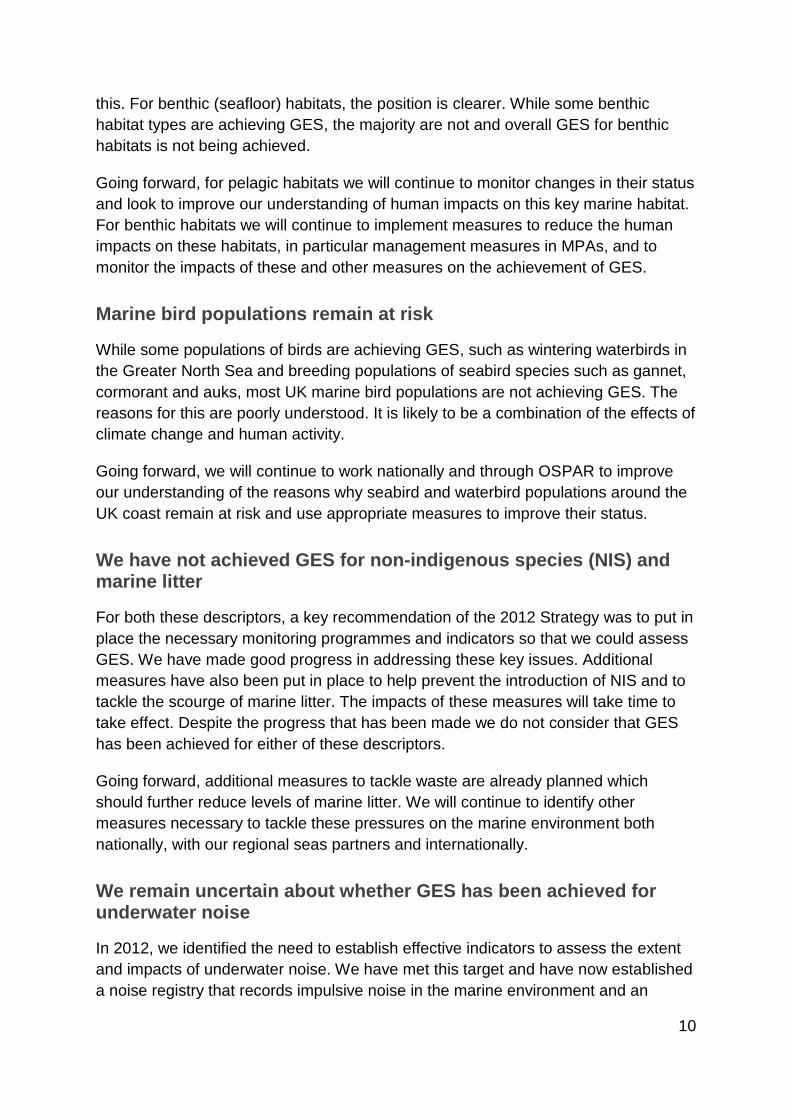
this. For benthic (seafloor) habitats, the position is clearer. While some benthic
habitat types are achieving GES, the majority are not and overall GES for benthic
habitats is not being achieved.
Going forward, for pelagic habitats we will continue to monitor changes in their status
and look to improve our understanding of human impacts on this key marine habitat.
For benthic habitats we will continue to implement measures to reduce the human
impacts on these habitats, in particular management measures in MPAs, and to
monitor the impacts of these and other measures on the achievement of GES.
Marine bird populations remain at risk
While some populations of birds are achieving GES, such as wintering waterbirds in
the Greater North Sea and breeding populations of seabird species such as gannet,
cormorant and auks, most UK marine bird populations are not achieving GES. The
reasons for this are poorly understood. It is likely to be a combination of the effects of
climate change and human activity.
Going forward, we will continue to work nationally and through OSPAR to improve
our understanding of the reasons why seabird and waterbird populations around the
UK coast remain at risk and use appropriate measures to improve their status.
We have not achieved GES for non-indigenous species (NIS) and marine litter
For both these descriptors, a key recommendation of the 2012 Strategy was to put in
place the necessary monitoring programmes and indicators so that we could assess
GES. We have made good progress in addressing these key issues. Additional
measures have also been put in place to help prevent the introduction of NIS and to
tackle the scourge of marine litter. The impacts of these measures will take time to
take effect. Despite the progress that has been made we do not consider that GES
has been achieved for either of these descriptors.
Going forward, additional measures to tackle waste are already planned which
should further reduce levels of marine litter. We will continue to identify other
measures necessary to tackle these pressures on the marine environment both
nationally, with our regional seas partners and internationally.
We remain uncertain about whether GES has been achieved for underwater noise
In 2012, we identified the need to establish effective indicators to assess the extent
and impacts of underwater noise. We have met this target and have now established
a noise registry that records impulsive noise in the marine environment and an

11
ambient noise monitoring programme. These will allow us to better understand the
extent, scale and impacts of underwater noise.
Going forward, we will use the information gathered from our monitoring
programmes and the noise registry to establish appropriate targets so that we are
able to define more clearly our GES objectives for underwater noise.
We have a better understanding of the main pressures preventing the achievement of GES
The assessments have clearly flagged up that the predominant human pressures
preventing GES being achieved include commercial fishing and the introduction of
marine litter. Other factors that are affecting the achievement of GES include natural
phenomena such as species competition and predation and the impact of changes to
the marine environment due to climate change. The risk from NIS also remains high.
A common theme that applies to these pressures is that they can only be effectively
addressed by working at an international level.
Going forward, as well as taking action at home, we will press for action to be taken
internationally to tackle these pressures.
Summary of progress towards achieving GES
The main findings of the assessment of GES flagged up in the conclusions above
are set out set out in detail in section 3. The results are summarized in Table 1
below.
Table 1. Updated Assessment 2018 – Current Environmental Status
D1 & D4
CETACEANS
The extent to which GES has been achieved for cetaceans
remains uncertain. The status of coastal bottlenose dolphin
and minke whale is consistent with the achievement of
GES in the Greater North Sea, but unknown/uncertain
elsewhere. It is unknown if GES has been achieved for
other species.
D1 & D4 SEALS
The UK has achieved its aim of GES for grey seals in the
Greater North Sea and Celtic Seas. There was a significant
increase in the abundance of harbour seals in West
Scotland where the majority of harbour seals are located,
but their status in other parts of the Celtic Seas is

12
uncertain. Harbour seals in the Greater North Sea have not
yet achieved GES.
D1 & D4 BIRDS
The UK has achieved its aim of GES for non-breeding
waterbirds in the Greater North Sea but not in the Celtic
Seas. Breeding seabirds have not achieved GES.
D1 & D4 FISH
Demersal fish communities are recovering from over-
exploitation in the past, but GES has not yet been achieved
in either the Greater North Sea or the Celtic Seas. A partial
assessment of pelagic shelf fish did not provide a clear
result.
D1, D4 PELAGIC
HABITATS
Prevailing environmental conditions are likely to be driving
the observed changes in plankton communities but human
activities cannot be ruled out and it is uncertain whether
GES has been achieved.
D1 & D6 BENTHIC
HABITATS
The achievement of GES is uncertain for intertidal and soft
sediment habitats. The levels of physical damage to soft
sediment habitats are considered to be consistent with the
achievement of GES in UK waters to the west of the Celtic
Seas, but not in the Celtic Seas or in the Greater North
Sea. For sublittoral rock and biogenic habitats GES has not
yet been achieved.
D2-NON-
INDIGENOUS
SPECIES (NIS)
The UK has not yet achieved its aim of GES for NIS. Our
ability to detect new NIS has improved but there has been
no significant change in the number of new records of NIS
made between 2003 and 2014.
D3 COMMERCIAL
FISH
The UK has achieved its aim of GES for some
commercially exploited fish. In 2015, 53% of marine fish
(quota) stocks were fished below maximum sustainable
yield (MSY). Most national shellfish stocks have either not
yet achieved GES or their status is uncertain. The
percentage of quota stocks fished below MSY and the
proportion of marine fish spawning stock biomasses
capable of producing MSY have increased significantly
since 1990.
D4 FOOD WEBS The extent to which GES has been achieved is uncertain:
plankton communities are changing; some fish
communities are recovering, but others are not; breeding
seabird populations are in decline; grey seal numbers are
increasing and trends in cetacean populations are unclear.

13
It is known that components of the marine food web are
changing, but it is not clear how they are affecting each
other.
D5
EUTROPHICATION
The UK has largely achieved its aim of GES for
eutrophication. A small number of eutrophication problems
remain in coastal and estuarine waters, representing 0.03%
of the total UK Exclusive Economic Zone, and 0.41% of
estuarine and coastal waters.
D7
HYDROGRAPHICAL
CONDITIONS
The UK continues to achieve its aim of GES for
hydrographical conditions.
D8
CONTAMINANTS
The UK has largely achieved its aim of GES for
contaminants. Concentration of hazardous substances and
their biological effects are generally meeting agreed target
thresholds. Highly persistent legacy chemicals are the
cause of the few failures, mainly in coastal waters close to
polluted sources.
D9
CONTAMINANTS IN
SEAFOOD
The UK has achieved its aim of GES for contaminants in
seafood. There is a high level of compliance with agreed
safety levels.
D10 MARINE
LITTER
The UK has not yet achieved its aim of GES for litter.
Beach litter levels in the Celtic Seas have remained largely
stable since the assessment in 2012, whilst beach litter
levels in the Greater North Sea have slightly increased.
D11 UNDERWATER
NOISE
The achievement of GES for underwater noise in the UK is
uncertain. Research and monitoring programmes
established since 2012 have provided an improved
understanding of the impacts of sound on marine
ecosystems.

14
Key :
GES Achieved GES Partially
achieved GES not achieved
Improving situation* Stable or mixed
situation* Declining situation*
*These arrows provide our best judgement of whether there has been progress towards achieving Good
Environmental Status (GES) for the descriptor or ecosystem component concerned. In some cases they
reflect a situation where several indicator results reveal a mixed picture, with some showing an improving
situation, some being stable and some showing a decline. In these cases the arrow indicates our estimate of
the combined position. Full details can be found in the individual indicator assessments.
Progress in working with other countries
Working with other countries is essential for the achievement of GES. Over the last 6
years the UK has played a leading role in OSPAR in developing common
approaches to monitoring, assessment and measures. This has improved, in a cost
effective way, our ability to assess the state of our seas and to identify the actions
needed to achieve GES.
Going forward, we will continue to work in OSPAR and other relevant international
fora to ensure that the key pressures affecting our seas are addressed in the most
effective and efficient way possible.
Data transparency
We have made the results and methodologies for the 60 individual indicators used to
assess GES digitally available through a Marine On-line Assessment Tool (MOAT)2.
What the Updated UK Marine Strategy Part 1 covers
Section 1 sets out the context.
Section 2 covers the geographic scope and characterization of UK seas with an
economic and social analysis of the uses of the marine environment and the social
2 https://moat.cefas.co.uk/

15
value and benefits which it provides. It sets out an overview of the pressures and
activities affecting UK seas and an assessment of ocean processes such as sea
surface temperature and acidification and their relationship to climate change.
Section 3 includes updated objectives and targets which we will use to define and
determine progress towards GES over the next 6 years. These build on those set in
2012 and take account of scientific developments since then. The aim is to ensure
that we coordinate our approach with other countries sharing our seas. This is
consistent with our wider approach which is to deal with marine environment issues
on a transboundary basis working through OSPAR. It will allow us to develop
common assessment values and new indicators which will lead to a more effective
and efficient approach to the evaluation of the extent that GES has been achieved in
2024.
Section 1: Context
1.1 The UK marine strategy
The Marine Strategy Regulations (2010) require us to take action to achieve or
maintain GES in our seas by 2020. The Regulations transpose the EU Marine
Strategy Framework Directive (MSFD) into UK law and require the production of a
“Marine Strategy” for all UK waters and that the approach is coordinated across all
four UK Administrations. It also requires that we cooperate with other countries
sharing our seas. The objective of the UK Marine Strategy reflects the UK’s vision for
‘clean, healthy, safe, productive and biologically diverse oceans and seas’, it helps to
deliver key international obligations and commitments to protect and preserve the
marine environment under the UN Convention on the Law of the Sea (UNCLOS), the
UN Sustainable Development Goal 14 (to conserve and sustainably use the oceans,
seas and marine resources for sustainable development), the OSPAR North-East
Atlantic Environment Strategy and the Convention on Biological Diversity.
It applies an ecosystem based approach to the management of human activities. In
doing so, the Strategy seeks to keep the collective pressure of human activities
within levels compatible with the achievement of GES. Achieving GES will maintain
the capacity of marine ecosystems to respond to human-induced changes and
enable the sustainable use of marine goods and services by present and future
generations.
The strategy has three components:

16
a. UK Marine Strategy Part 13: an assessment of marine waters,
objectives for GES and targets and indicators to measure progress
towards GES (published December 2012);
b. UK Marine Strategy Part 24: sets out the monitoring programmes to
monitor progress against the targets and indicators (published August
2014); and
c. UK Marine Strategy Part 35: sets out a programme of measures for
achieving GES (published December 2015).
This updated Marine Strategy Part 1 provides: An updated assessment of the state
of UK seas and the progress made since 2012 towards achieving GES; revised
objectives for GES and targets for the next cycle (2018 – 2024); and next steps.
1.2 Good Environmental Status (GES)
GES is defined as the environmental status of marine waters where these provide
ecologically diverse and dynamic oceans and seas which are clean, healthy and
productive within their intrinsic conditions, and the use of the marine environment is
at a level that is sustainable, thus safeguarding the potential for uses and activities
by current and future generations.
To help assess progress against GES it is broken down into 11 qualitative
descriptors. These are listed below:
D1 – Biological diversity (cetaceans, seals, birds, fish, pelagic habitats
and benthic habitats)
D2 - Non-indigenous species
D3 - Commercially-exploited fish and shellfish
D4 - Food webs (cetaceans, seals, birds, fish and pelagic habitats)
D5 - Eutrophication
3https://assets.publishing.service.gov.uk/government/uploads/system/uploads/attachment_data/file/69
632/pb13860-marine-strategy-part1-20121220.pdf
4https://assets.publishing.service.gov.uk/government/uploads/system/uploads/attachment_data/file/34
1146/msfd-part-2-final.pdf
5https://assets.publishing.service.gov.uk/government/uploads/system/uploads/attachment_data/file/48
6623/marine-strategy-part3-programme-of-measures.pdf

17
D6 - Sea-floor integrity (pelagic habitats and benthic habitats)
D7 - Hydrographical conditions
D8 - Contaminants
D9 - Contaminants in fish and other seafood for human consumption
D10 - Litter
D11 - Introduction of energy, including underwater noise
1.3 How we assessed progress towards the achievement of GES
In the Marine Strategy Part 1 in 2012, we set out high level GES objectives (also
known as “characteristics”) to show what GES looks like for each of the 11
Descriptors. For each descriptor we then set out a series of specific targets to enable
us to assess the extent that the GES objectives had been achieved. In the Marine
Strategy Part 2, we set out the specific monitoring programmes and associated
indicators for each descriptor and ecosystem component which we would use to
assess achievement of GES.
The monitoring and assessment work for the various indicators needed to assess progress towards achieving the GES targets were carried out by experts and scientists working in the UK Marine Monitoring and Assessment Strategy (UKMMAS) Evidence Groups which were coordinated and guided by the UK Monitoring and Assessment Reporting Group (MARG). The monitoring programmes are largely funded by Defra and the Devolved Administrations.
Wherever possible, we developed the indicators and carried out our monitoring
programmes together with OSPAR countries through the Joint Assessment and
Monitoring Programme (JAMP), using agreed methods and assessment criteria. In
2017, OSPAR published its Intermediate Assessment6 (IA 2017), which
demonstrated progress towards realising the OSPAR vision of a clean, healthy and
biologically diverse North-East Atlantic, used sustainably.
6 https://oap.ospar.org/en/ospar-assessments/intermediate-assessment-2017/
18
A consequence of using the OSPAR common indicator assessments is that some of
the resulting conclusions are based on data and information from 20157. Where this
is the case, it is flagged in the detailed assessments on the MOAT.
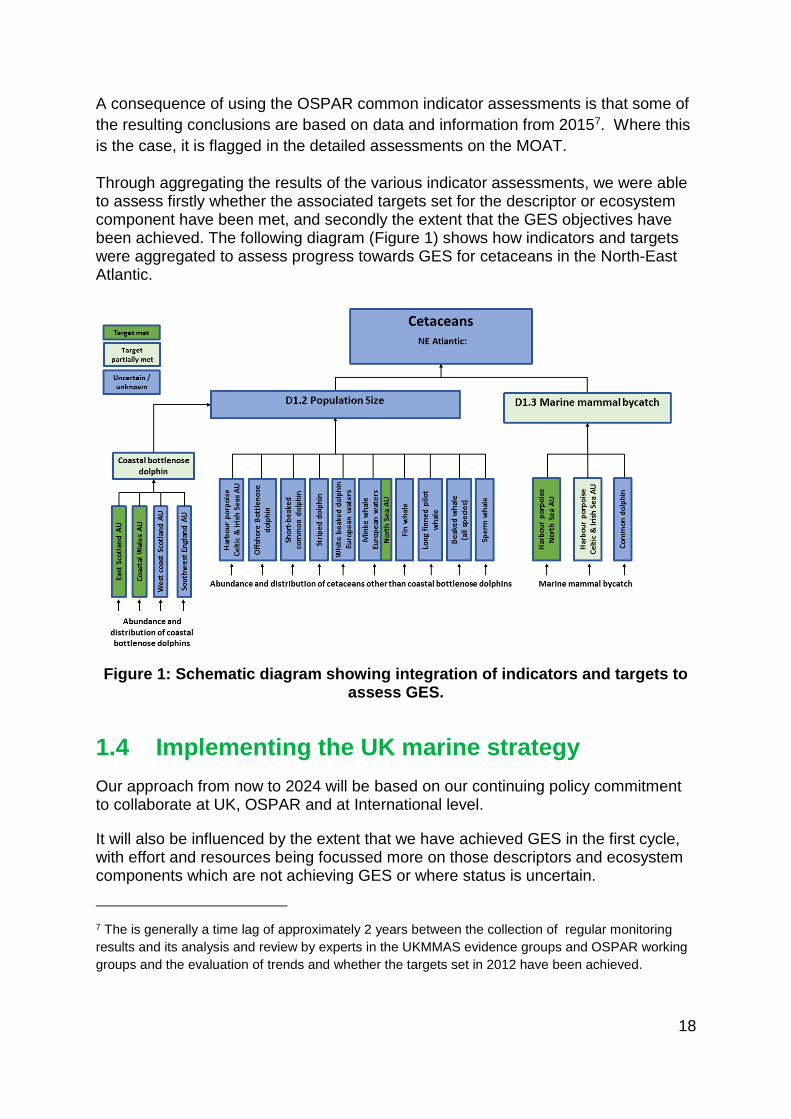
Through aggregating the results of the various indicator assessments, we were able to assess firstly whether the associated targets set for the descriptor or ecosystem component have been met, and secondly the extent that the GES objectives have been achieved. The following diagram (Figure 1) shows how indicators and targets were aggregated to assess progress towards GES for cetaceans in the North-East Atlantic.
Figure 1: Schematic diagram showing integration of indicators and targets to assess GES.
1.4 Implementing the UK marine strategy
Our approach from now to 2024 will be based on our continuing policy commitment to collaborate at UK, OSPAR and at International level.
It will also be influenced by the extent that we have achieved GES in the first cycle, with effort and resources being focussed more on those descriptors and ecosystem components which are not achieving GES or where status is uncertain.
7 The is generally a time lag of approximately 2 years between the collection of regular monitoring
results and its analysis and review by experts in the UKMMAS evidence groups and OSPAR working
groups and the evaluation of trends and whether the targets set in 2012 have been achieved.
19
The revised objectives and targets take account of the new criteria and thresholds published by the EU in 20178. We have also set operational targets which cover particular actions that will help us achieve GES. We have, where appropriate, taken a similar approach to other countries sharing our seas.
In developing this new approach we also took account of the recommendations in the European Commission’s evaluation of UK Marine Strategy Part 1 in 20149.
As part of this review, we have tried to simplify the language so the objectives and targets are understandable to all. The updated objectives, targets and operational targets are described in Section 3 for each descriptor and ecosystem component.
Effective assessment and management of the marine environment needs to be carried out at the appropriate geographical scale, which frequently covers the whole of UK marine waters and beyond. A key aim for the UK Marine Strategy is to coordinate our actions with other countries, particularly for OSPAR Region II (the Greater North Sea) and OSPAR Region III (the Celtic Seas). We will continue to do this through the OSPAR Convention.
8 Set out in Commission Decision 2017/848 which will become part of retained EU law post EU exit.
9 http://ec.europa.eu/environment/marine/eu-coast-and-marine-policy/implementation/reports_en.htm
20
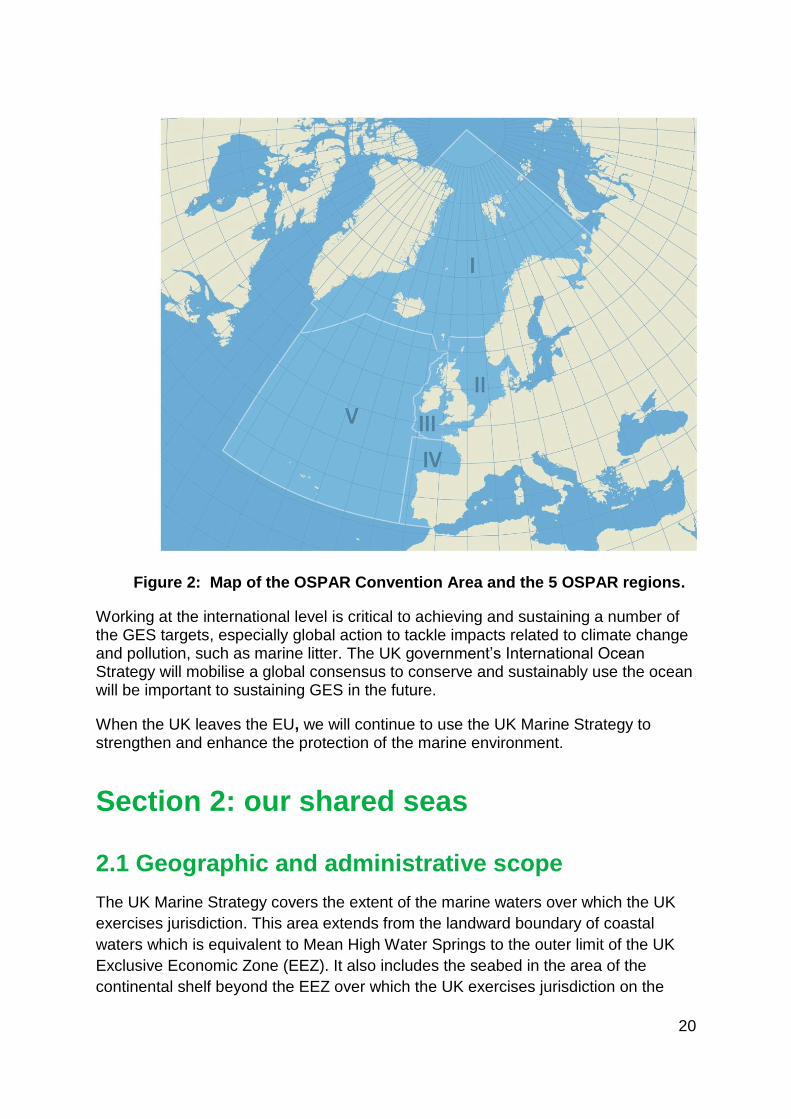
Figure 2: Map of the OSPAR Convention Area and the 5 OSPAR regions.
Working at the international level is critical to achieving and sustaining a number of the GES targets, especially global action to tackle impacts related to climate change and pollution, such as marine litter. The UK government’s International Ocean Strategy will mobilise a global consensus to conserve and sustainably use the ocean will be important to sustaining GES in the future.
When the UK leaves the EU, we will continue to use the UK Marine Strategy to strengthen and enhance the protection of the marine environment.
Section 2: our shared seas
2.1 Geographic and administrative scope
The UK Marine Strategy covers the extent of the marine waters over which the UK
exercises jurisdiction. This area extends from the landward boundary of coastal
waters which is equivalent to Mean High Water Springs to the outer limit of the UK
Exclusive Economic Zone (EEZ). It also includes the seabed in the area of the
continental shelf beyond the EEZ over which the UK exercises jurisdiction on the

21
basis of a submission to the Commission on the limits of the continental shelf10. The
area of UK waters over which the UK Marine Strategy applies is shown below in
Figure 3, which also shows the Celtic Seas (pale blue colour) and the Greater North
Sea (dark blue colour) sub-regions on which many of our assessments are based.
Figure 3: Area of UK marine waters over which the MSFD applies.
The MSFD also applies to Gibraltar where there is a separate implementation
process for British Gibraltar Territorial Waters.
The UK’s marine waters are in the North-East Atlantic Ocean marine region, with
waters to the west of the UK comprising part of the Celtic Seas Sub-region, and
waters to the east of the UK, including the Channel, forming part of the Greater North
Sea Sub-region. The UK shares the Celtic Seas Sub-region with Ireland and France,
and the Greater North Sea Sub-region with France, Belgium, the Netherlands,
Germany, Denmark, Sweden and Norway.
10 This area is defined by the Continental Shelf Act 1964. In this area the requirements of the Directive (including the requirement to put in place measures to achieve GES) applies only to the seabed and subsoil and not to the water column.

22
The ecosystems of the Greater North Sea and the Celtic Seas and their various uses
are not necessarily contained within the boundaries of the UK. None of the countries
sharing these regions can resolve all of the environmental problems unilaterally, and
for some activities such as fishing and shipping, do not have the full and exclusive
jurisdiction to do so. For this reason, and because the North Sea countries are not all
EU Member States, the UK coordinates its approach with OSPAR countries.
The updated UK Marine Strategy Part 1 covers the whole of our marine waters. The
updated UK Assessment, objectives and determinations for GES and associated
targets and indicators have been developed at this scale. However, where there are
significant biogeographical differences between the Greater North Sea and the Celtic
Seas Sub-regions these have been taken into account. Assessments are undertaken
at the scale most relevant to the particular descriptor or ecosystem component. This
can be at sub-regional scale or smaller where appropriate.
There are strong links between the UK Marine Strategy and the Water Framework
Directive (WFD). The WFD addresses the improvement and protection of the
chemical and ecological status of surface waters over the whole river basin ranging
from rivers, lakes and groundwaters through to estuaries and coastal waters out to 1
nautical mile at sea (3 nautical miles in Scotland and out to 12 nautical miles for
chemical status) and overlap with the MSFD in coastal waters.
In order to improve consistency between the approaches for coastal waters and
offshore waters, the GES indicators and associated thresholds in this updated
Marine Strategy Part 1 have been aligned with those used for coastal waters under
the WFD where this is appropriate.
2.2 Characterisation of our seas
UK seas extend to over 880,000 square kilometres, which is more than three and a
half times the UK land area. These seas stretch from the coastal seas and estuaries,
through the shelf seas and down to the deep sea beyond the continental slope,
which can be thousands of metres deep. The UK has over 30,000 kilometres of
coastline, including a myriad of offshore islands. This extensive seascape
encompasses a huge variety of physical and chemical conditions, which form the
transition between sub-polar waters and the temperate waters found along most of
the coasts of Western Europe.
A characteristic feature of the UK waters is the large influence of the major UK rivers
ranging from the Dee in Scotland to the Severn in the English and Welsh borders,
and supplemented by several hundred smaller rivers. These contain a large quantity
of sediment, organic matter and nutrients which through their input to our seas
intensifies seabed dynamics and causes natural turbidity. These are essential for the

23
growth of plankton, which forms the basis of the marine food chain. Consequently,
by their nature, UK waters are highly productive.
We have an exceptional variety of benthic and pelagic habitats, ranging from highly
diverse rocky shores to littoral sediment habitats such as salt marsh, sea grass and
mud flats to phytoplankton and zooplankton communities. Our deep sea habitats are
also diverse and support features of biological and conservation importance,
including deep-sea sponge aggregations, corals and large-scale features such as
seamounts and carbonate mounds.
Benthic habit – copyright National Oceanography Centre
These habitats support a huge variety of marine species, with around 330 different
types of fish, 29 species of whales, dolphins and porpoises (cetaceans) and around
100 species of seabirds, waders and wildfowl. Deep-sea species of shark are known
to exist within Scottish waters. Our seas form an important link in the international
network of migration routes for cetaceans and provide breeding and foraging areas
for birds. Many species of turtle have also been observed in our waters, especially in
Wales.
Cetaceans (Whales, dolphins and porpoises). The diversity of marine habitats in UK
waters, cater to the different feeding strategies and lifestyles of a wide range of
whale and dolphin species. There are deep diving species like the sperm whale,
which use the deep waters to the west and north of Scotland and south-west of
England. There are also species that prefer shallower water, such as the harbour
porpoise and coastal bottlenose dolphin, which are sometimes spotted from the
coast. Eleven species of cetacean are considered resident in UK waters. A further 18
species occasionally visit our waters, including the worlds’ largest animal, the blue
whale.
24
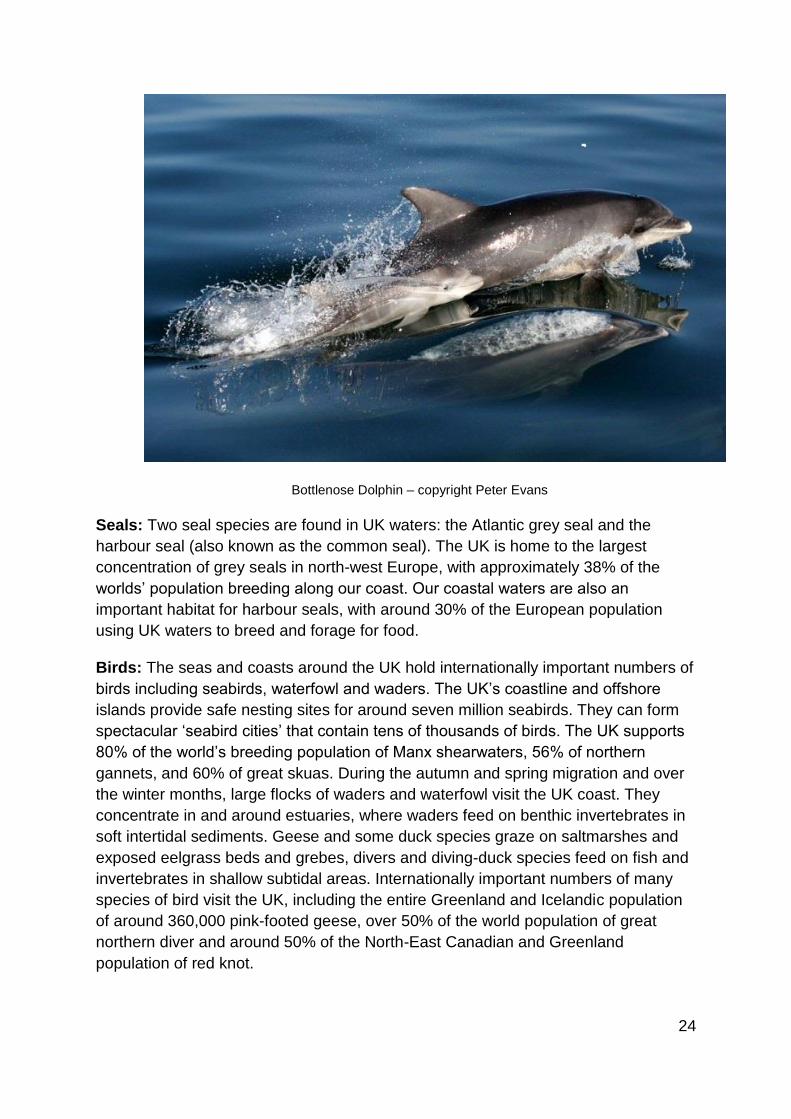
Bottlenose Dolphin – copyright Peter Evans
Seals: Two seal species are found in UK waters: the Atlantic grey seal and the
harbour seal (also known as the common seal). The UK is home to the largest
concentration of grey seals in north-west Europe, with approximately 38% of the
worlds’ population breeding along our coast. Our coastal waters are also an
important habitat for harbour seals, with around 30% of the European population
using UK waters to breed and forage for food.
Birds: The seas and coasts around the UK hold internationally important numbers of
birds including seabirds, waterfowl and waders. The UK’s coastline and offshore
islands provide safe nesting sites for around seven million seabirds. They can form
spectacular ‘seabird cities’ that contain tens of thousands of birds. The UK supports
80% of the world’s breeding population of Manx shearwaters, 56% of northern
gannets, and 60% of great skuas. During the autumn and spring migration and over
the winter months, large flocks of waders and waterfowl visit the UK coast. They
concentrate in and around estuaries, where waders feed on benthic invertebrates in
soft intertidal sediments. Geese and some duck species graze on saltmarshes and
exposed eelgrass beds and grebes, divers and diving-duck species feed on fish and
invertebrates in shallow subtidal areas. Internationally important numbers of many
species of bird visit the UK, including the entire Greenland and Icelandic population
of around 360,000 pink-footed geese, over 50% of the world population of great
northern diver and around 50% of the North-East Canadian and Greenland
population of red knot.

25
Fish. UK support a large range of fish species ranging from the basking shark which
is the largest fish species in the North-East Atlantic, through to sunfish, eels, skates
and rays. Our waters are home to commercially important fish such as cod, plaice,
haddock and mackerel and shellfish species such as mussels, oysters, scallops and
Nephrops (also called Norway lobster or langoustine).
Atlantic Wolffish - copyright Jim Ellis
2.3 Progress with developing the UK MPA network
The UK Marine Protected Area (MPA) network has progressed substantially over the
last six years. We currently have 314 designated MPAs protecting 24% of UK waters
compared to 217 sites covering 8% of UK waters in 2012. The UK’s network of
MPAs will play a significant role in supporting the achievement of GES for a number
of descriptors, in particular descriptor 1 on biodiversity and descriptor 6 on seafloor
integrity.
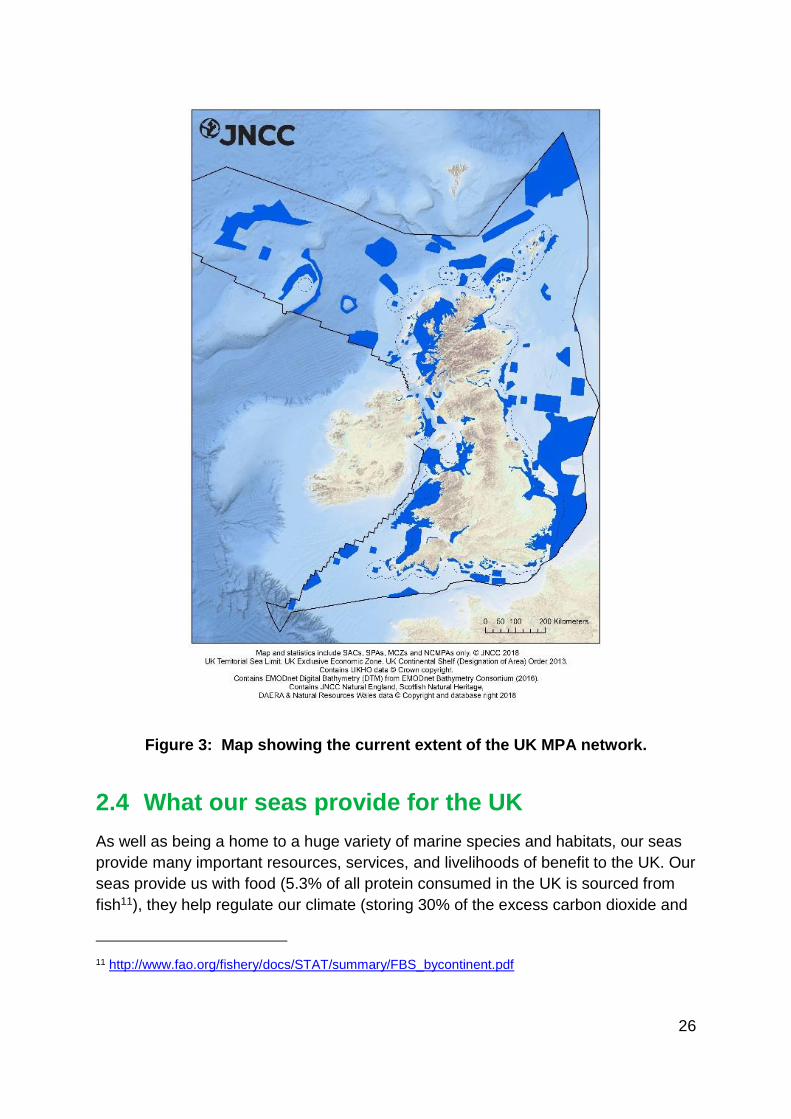
26
Figure 3: Map showing the current extent of the UK MPA network.
2.4 What our seas provide for the UK
As well as being a home to a huge variety of marine species and habitats, our seas
provide many important resources, services, and livelihoods of benefit to the UK. Our
seas provide us with food (5.3% of all protein consumed in the UK is sourced from
fish11), they help regulate our climate (storing 30% of the excess carbon dioxide and
11 http://www.fao.org/fishery/docs/STAT/summary/FBS_bycontinent.pdf
27
90% of the excess heat created by human activities12) and they provide much of the
oxygen we breathe (over 50% produced by phytoplankton). Our seas also provide a
place to live (over half of the UK population lives within 15km of the sea13) and many
people enjoy recreational opportunities associated with the marine environment (in
2016, over 14 million UK adults participated in water sports and other water-based
leisure activities14). Our seas also provide an important contribution to the UK
economy through providing oil and gas, maritime transport, and renewable energy
(see section 2.5 for further detail).
2.5 Uses of the marine environment
This section provides an economic and social analysis of the use of UK waters,
highlighting how the economic contribution made by the various marine industries
and the numbers of people they employ has changed since the Initial Assessment in
2012. It also provides an analysis of how the main marine activities engage with
labour markets, an indicative cost of degradation, and an overview of research on
public perceptions towards the UK marine environment.
2.5.1 Goods and services provided by the marine economy
The marine economy for this analysis is defined by the industries covered in Table 2
below. The total Gross Value Added (GVA)15 of the marine economy was estimated
as £27 billion in 2015. This represents roughly 2% of the combined GVA of the UK
economy in 201516. The main activities are: the offshore oil and gas industry,
excluding the services sector; maritime transport; telecommunications: leisure and
recreation; and marine renewable energy. Table 2 also shows the GVA of these
industries. The other 11 marine activities that were considered had a total combined
GVA of £2.2 billion. The estimated GVA of the marine economy in 2008 was £51
billion, which means there has been a significant reduction (£24 billion) in
12 Fifth Assessment Report of the Intergovernmental Panel on Climate Change.
13 https://ec.europa.eu/eurostat/statistics-explained/index.php/Archive:Coastal_regions_-
_population_statistics
14 Watersports Participation Survey, Royal Yacht Association, 2016,
http://www.rya.org.uk/SiteCollectionDocuments/sportsdevelopment/Watersports_Survey_2016%20-
%20Summary.pdf
15 The Gross Value Added (GVA), is a measure of the value of goods and services produced by the
sector to the economy.
16 https://www.ons.gov.uk/economy/grossvalueaddedgva/timeseries/abml/pn2
28
contribution since then. This arises from a reduction in GVA of £25.5 billion for the
offshore oil and gas industry which was due primarily to a reduction in output of
North Sea oil and gas.
2.5.2 Predicted changes to GVA in the coming decade.
Two recent horizon-scanning projects (the UK government Office for Science “Future
of the Seas” Foresight project and the OECD “The Ocean Economy in 2030”
report17) predict a very large rise in the GVA of the offshore wind sector in the
coming decades. These reports also predict strong growth in seaborne trade and
marine aquaculture industries, and the emergence of a marine autonomous vehicles
sector. Revenue from marine biotechnology is also predicted to grow significantly,
with a number of applications already in early development which could impact
across a range of high profile and important areas such as energy, human health,
and food production.
2.5.3 Employment of people in the marine economy
The total number of people employed by the marine economy was estimated at
341,000 full time equivalent (FTE) employees in 2015. This represents roughly 1% of
the total number of people employed in the UK in 201518. The sectors with the
highest employment were: maritime transport; leisure and recreation; defence; oil
and gas; and telecommunications (see Table 2). Other marine activities had a
combined FTE of 18,000.
Table 2 shows the key economic indicators of GVA, the number of people employed
(full time equivalent), and productivity trends for 16 major marine
activities19.Comparisons with 2008 are limited to broad trends due to changes in the
way that statistics have been collected for several industries. Where no firm data
was available, estimates are used.
17http://www.keepeek.com/Digital-Asset-Management/oecd/economics/the-ocean-economy-in-
2030_9789264251724-en#.WjfOEVVl-Uk#page34
18https://www.ons.gov.uk/employmentandlabourmarket/peopleinwork/employmentandemployeetypes/t
imeseries/mgrz/lms
19 Table 2 was compiled by marine consultants ABPmer and has been reviewed by the joint industry -
government “Productive Seas Evidence Group” of the Marine Science Coordination Committee. An
extended version of the table, which sets out further information on how figures have been derived,
and a number of uncertainties in the calculations can be found in the on-line tool socio-economic
section.

29
Table 2: Principal human activities in UK seas and the Gross Value Added and
productivity change.
Activity Gross
Value
Added
(GVA), £m
Numbers
employed
(FTE)
Productivity
change over
recent years20
GVA -
Reference
year
Oil and Gas 11,500 38,200 Significant
decrease
2015
Maritime Transport 7,868 130,900 No significant
change
2015
Telecommunications 3,003 26,750 Increase 2015
Leisure & recreation 1435 86,400 No significant
change
2015
Defence - Military 521 42.670 Decrease 2015/16
Fisheries 356 8,135 Increase 2015
Aquaculture 409 3,231 No significant
change
2015
Water abstraction 167 No data No significant
change
2015
Mineral extraction 60 408 No significant
change
2015
20 The base year varies from 2008 to 2012. See full table on MOAT for details

30
Activity Gross
Value
Added
(GVA), £m
Numbers
employed
(FTE)
Productivity
change over
recent years20
GVA -
Reference
year
Renewable energy 1,124 4,766 Significant
increase
2015
Coastal defence 405 No data Increase 2015/16
Waste disposal 10 No data Increase 2015
Education 102 No data No significant
change
2015
R&D 163 No data No significant
change
N/a
Power transmission No data No data No significant
change
N/a
Storage of gases No data No data No significant
change
N/a
Total 27123 341460
2.5.4 Analysis of marine activities on labour markets
We also carried out an analysis of the impact of marine activities on the local labour
market across a number of UK regions. This examined where key marine activities
create employment, and their effects on local labour utilisation (skills, job growth, and
unemployment), local labour productivity (wages, new businesses, investment) and if
the activity is likely to impact deprivation levels in the local area. This showed that
different activities have differing effects on the local labour market, depending on
each industry’s particular characteristics. Some industries (such as the energy
industry) tend to create jobs that are higher skilled in nature, while other industries
(such as the tourism industry) tend to create jobs that are lower skilled in nature and
may be part time.
There is also a variation in the effect that marine activities have on wage levels in the
local labour market. Industries which draw heavily on local labour resources (such as

31
the marine transport industry) can have a strong positive effect on local wages, while
other industries (such as telecommunications and cabling) have a smaller impact
from a highly skilled workforce. The impact that marine activities have on deprivation
levels in the local area is connected to the effect of marine activities on local labour
utilisation and productivity.
The detailed results of this analysis are shown in the “social and economic analysis”
tile of the MOAT.
2.5.5 Analysis of the indicative costs of degradation
The cost of degradation compares the ‘Business as Usual’ scenario (BAU) with the
“GES scenario”. The BAU scenario is the expected state of the marine environment
without any additional targets or programmes of measures. The “GES scenario” is
the expected state of the environment in 2020 if the goals of the UK Marine Strategy
are met and GES is achieved across all descriptors. The gap between GES and
BAU scenarios is the “cost of degradation” and is estimated by valuing the difference
in societal benefits between the two scenarios. This model is illustrated in Figure 4
below. Due to uncertainties associated with how the current measures will meet the
GES targets the costs of degradation is presented only indicatively.
Figure 4: Model demonstrating the relationship between GES and BAU.
The programme of measures set out in the UK Marine Strategy Part 3 in 2015 has
resulted in some descriptors broadly reaching GES. Where this is the case, there is
no cost of degradation.

32
Based on assumptions around current uncertainties and future progress, it is
assessed that this is the case for some elements of the ecosystem components in
descriptors D1 and D4, and for descriptors D5, D7, and D9.
For some descriptors, GES is not currently on course to be achieved by 2020, or
there is uncertainty about whether GES will be achieved by 2020. Where this is the
case, we have sought to identify additional targets, monitoring and research to
address uncertainties or to put in place additional measures as soon as possible,
and particularly in the next cycle from 2018 to 2024. This applies to several
ecosystem components in Descriptor 1, and 4 and to Descriptors 2, 6, 10 and 11.
More details can be found in the sections on the individual descriptors and
ecosystem components in Section III.
The analysis also revealed that there are a number of difficulties associated with
estimating the costs of degradation for this updated initial assessment compared
with the situation in 2012. In some cases, GES will not be achieved due partially to
natural or climate-related pressures acting on ecosystems which at the moment are
difficult to factor into the analysis. Furthermore, in the case of Descriptor 3 on
commercial fish, and Descriptor 8 on contaminants, the UK applied for an exception
from achieving GES by 2020 in its Marine Strategy Part 3 on programmes of
measures, because we have evidence that it will not be possible for GES to be
achieved by 2020 for reasons beyond our control. The European Commission
assessed the exception for D3 as being grounded, and the application for D8 as
being partially grounded. There will be a ‘cost of degradation’ for both these
descriptors, but due to the uncertainties about when GES will be achieved, it is not
possible to provide a quantitative estimate of the cost of degradation for these
descriptors.
2.5.6 Social value and benefits of the marine environment
In addition to providing economic value, the marine environment provides
considerable social and cultural value including recreation, heritage and identity,
beauty and inspiration, sense of place, health and well-being. Evidence on the size,
characterisation and importance of these services is limited, but there is growing
interest and research in this area.
In 2017, 222 million leisure trips (3+ hours) were made to the seaside/coast in Great
Britain (170 million in England, 18 million in Scotland and 21 million in Wales)21.
Expenditure on these trips totalled £6,084 million and activities included: visiting a
21 Kantar TNS (2018) Great Britain Day Visitor 2017 Annual Report.
https://www.visitbritain.org/sites/default/files/vb-corporate/Documents-Library/documents/England-
documents/260139488_-_kantar_tns_-_gbdvs_2017_annual_report_v5r.pdf

33
beach (46 million trips); walking (54 million trips), sunbathing (9 million trips),
swimming (6 million trips), fishing (4 million trips) and boating/sailing/water sports on
or by the sea (3 million trips). Whilst there is no direct comparison in Northern
Ireland, 26% of the 2.2 million overnight trips taken by Northern Ireland residents
were to beaches or the coast22. There is some evidence that coastal activities are
undertaken by a wide range of individuals and that, compared to green spaces, they
are likely to be visited by both high and low socio-economic groups.
The weather, climate and scenery are perceived as important services derived from
the ocean however the marine environment has also be associated with multiple
cultural and well-being benefits. This includes the importance of the marine
environment to UK traditions (such as visits to the seaside), our sense of place,
social bonding and therapeutic and spiritual value. Evidence also suggests that living
closer to the coast is associated with good physical and mental health.
Further detail on the evidence base for the social and cultural value of the marine
environment, including references, can be found on the “evaluating public
perceptions” tile of the MOAT.
2.5.7 Public perceptions towards the UK marine environment
As well as understanding and recognising the value the marine environment brings
to individuals and society, we also need to understand individual/societal perceptions
towards the marine environment. A greater understanding of what people think and
why will help us improve our engagement with the public and stakeholder as well as
design and deliver effective policy. This should recognise the diversity of perceptions
which exist within the UK population, recognising that the public is not one
homogenous group.
In recent years we have seen a significant increase in the media and public
engagement with marine issues. In terms of UK public attitudes, studies have shown
considerable levels of public pessimism about the biodiversity and health of UK
seas, with pollution and specifically marine plastics being key areas of public
concern.
There is strong support for UK marine conservation with personal experience of
marine environments being important for developing interest and supporting
conservation. Whilst MPAs is seen to have multiple benefits local acceptance can
vary. The involvement of communities in marine conservation and planning and its
22 NISRA, 2018. Northern Ireland Annual Tourism Statistics 2017.
https://www.nisra.gov.uk/sites/nisra.gov.uk/files/publications/Annual-Tourism-Statistics-Publication-
2017%20.pdf

34
local benefits is important, and this is currently being investigated through the MMO
led Marine Pioneer demonstration projects and others.
Public perceptions of the impacts of climate change show low awareness of ocean
acidification, a public disconnect with sea level change and the view that mitigation
should be prioritised over adaptation. Research into the marine renewable sector
has found that attitudes are influenced by local variables and the type of technology
installed with particular concerns around wildlife impacts and public engagement.
Further detail on the evidence base for public perceptions towards the UK marine
environment, including references, can be found on the “evaluating public
perceptions” tile of the MOAT.
2.5.8 Future of marine social science: evidence gaps and priorities
Marine social sciences can provide us with rich and valuable insights into the
complexities and diversities of societal relationships with the sea. In doing so, it plays
an important role in delivering sustainable management and decision making for our
seas. The field of marine social science is diverse and continues to draw on
innovations and techniques from the broader field of social science. As marine social
science continues to grow in capacity, we need to work with the research community
and institutions to develop a UK wide, longitudinal research programme. The Marine
Science Coordination Committee’s Social Science Task group has identified some of
the key evidence gaps and priorities for marine social science. Further work will be
carried out to develop this into a short, medium and long term strategy which it is
hoped will provide a starting point for discussion on how to build and strengthen
Marine Social Science evidence in the UK.
2.6 Predominant pressures affecting the marine environment
This chapter provides an overview of the pressures and activities affecting UK seas,
and identifies which pressures have prevented or are likely to delay the achievement
of GES by 2020.
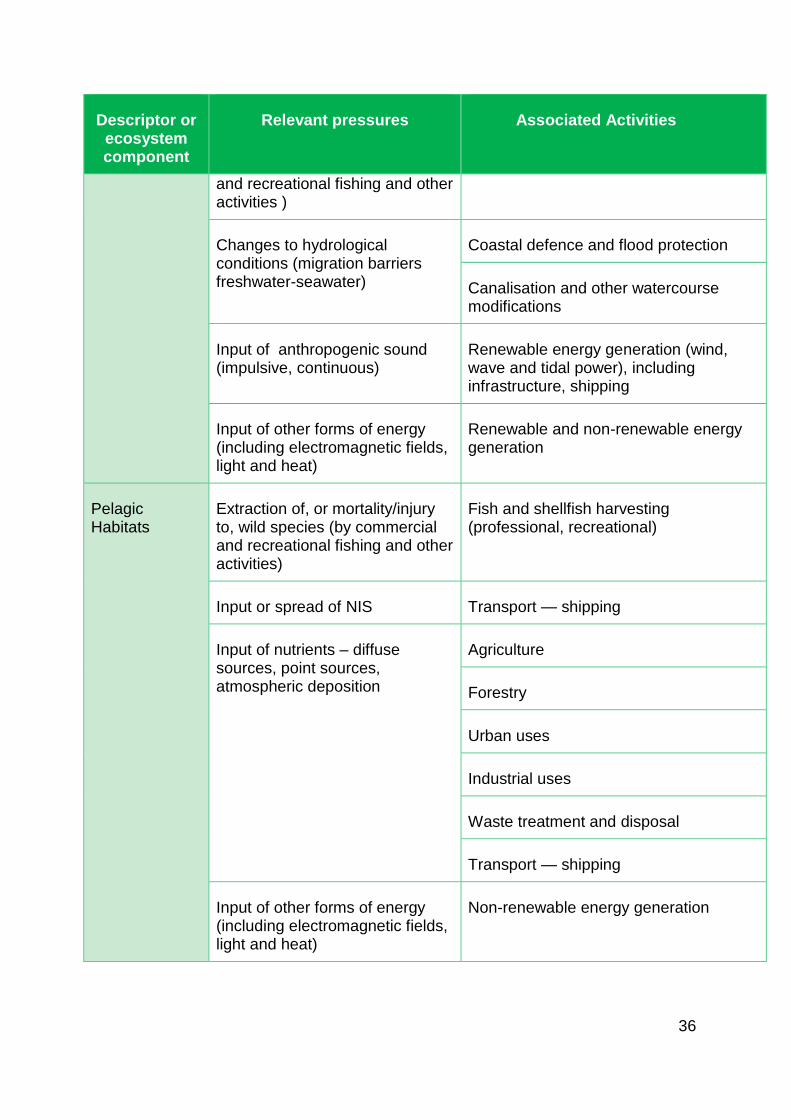
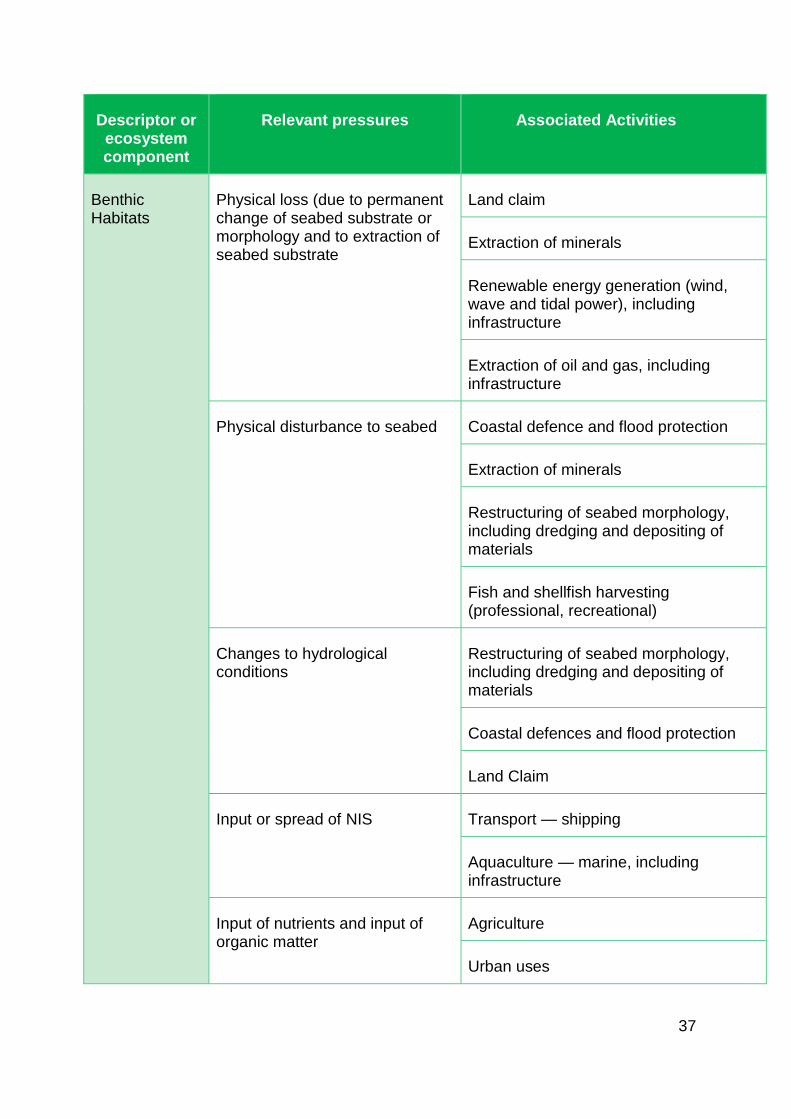
2.6.1 Pressures and associated activities in UK seas
Table 3 provides a summary of the main anthropogenic pressures and activities per
ecosystem component and descriptor considered by the UK in the development of
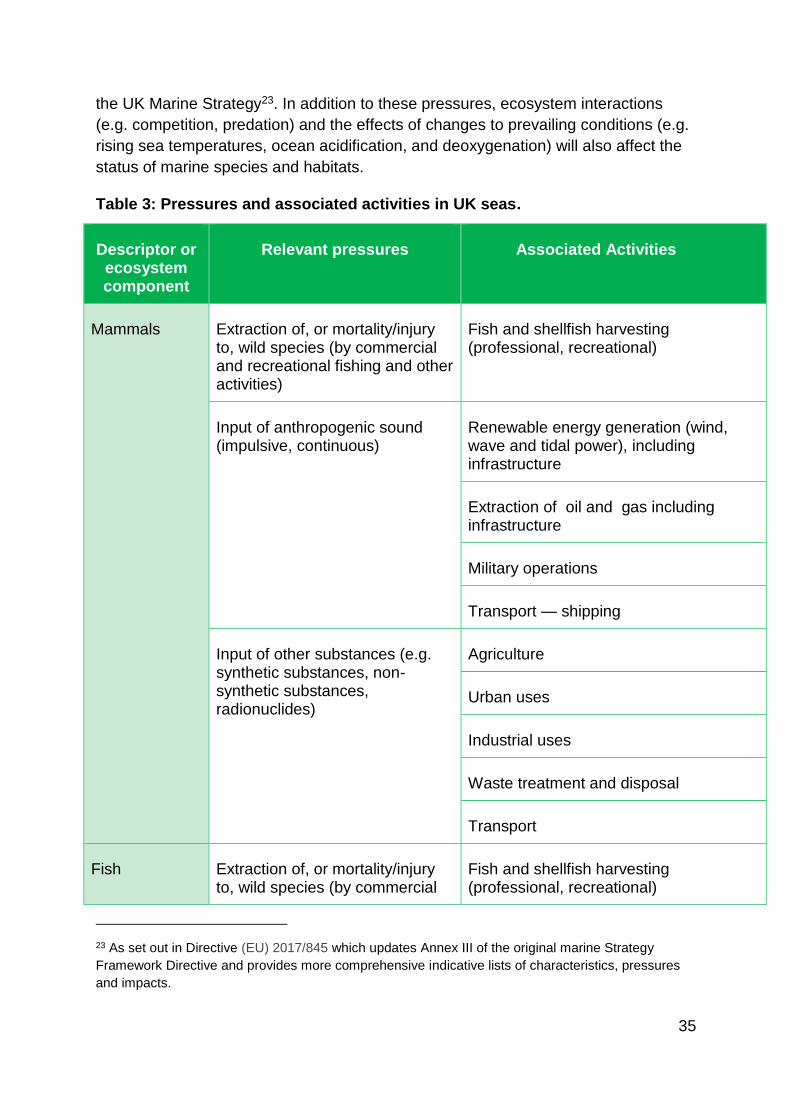
35
the UK Marine Strategy23. In addition to these pressures, ecosystem interactions
(e.g. competition, predation) and the effects of changes to prevailing conditions (e.g.
rising sea temperatures, ocean acidification, and deoxygenation) will also affect the
status of marine species and habitats.
Table 3: Pressures and associated activities in UK seas.
Descriptor or ecosystem component
Relevant pressures Associated Activities
Mammals Extraction of, or mortality/injury to, wild species (by commercial and recreational fishing and other activities)
Fish and shellfish harvesting (professional, recreational)
Input of anthropogenic sound (impulsive, continuous)
Renewable energy generation (wind, wave and tidal power), including infrastructure
Extraction of oil and gas including infrastructure
Military operations
Transport — shipping
Input of other substances (e.g. synthetic substances, non-synthetic substances, radionuclides)
Agriculture
Urban uses
Industrial uses
Waste treatment and disposal
Transport
Fish Extraction of, or mortality/injury to, wild species (by commercial
Fish and shellfish harvesting (professional, recreational)
23 As set out in Directive (EU) 2017/845 which updates Annex III of the original marine Strategy
Framework Directive and provides more comprehensive indicative lists of characteristics, pressures
and impacts.
36
Descriptor or ecosystem component
Relevant pressures Associated Activities
and recreational fishing and other activities )
Changes to hydrological conditions (migration barriers freshwater-seawater)
Coastal defence and flood protection
Canalisation and other watercourse modifications
Input of anthropogenic sound (impulsive, continuous)
Renewable energy generation (wind, wave and tidal power), including infrastructure, shipping
Input of other forms of energy (including electromagnetic fields, light and heat)
Renewable and non-renewable energy generation
Pelagic Habitats
Extraction of, or mortality/injury to, wild species (by commercial and recreational fishing and other activities)
Fish and shellfish harvesting (professional, recreational)
Input or spread of NIS Transport — shipping
Input of nutrients – diffuse sources, point sources, atmospheric deposition
Agriculture
Forestry
Urban uses
Industrial uses
Waste treatment and disposal
Transport — shipping
Input of other forms of energy (including electromagnetic fields, light and heat)
Non-renewable energy generation
37
Descriptor or ecosystem component
Relevant pressures Associated Activities
Benthic Habitats
Physical loss (due to permanent change of seabed substrate or morphology and to extraction of seabed substrate
Land claim
Extraction of minerals
Renewable energy generation (wind, wave and tidal power), including infrastructure
Extraction of oil and gas, including infrastructure
Physical disturbance to seabed Coastal defence and flood protection
Extraction of minerals
Restructuring of seabed morphology, including dredging and depositing of materials
Fish and shellfish harvesting (professional, recreational)
Changes to hydrological conditions
Restructuring of seabed morphology, including dredging and depositing of materials
Coastal defences and flood protection
Land Claim
Input or spread of NIS Transport — shipping
Aquaculture — marine, including infrastructure
Input of nutrients and input of organic matter
Agriculture
Urban uses

38
Descriptor or ecosystem component
Relevant pressures Associated Activities
Industrial uses
Transport — shipping
Input of other forms of energy (including electromagnetic fields, light and heat)
Non-renewable energy generation
NIS Input or spread of NIS Transport — shipping
Tourism and leisure activities
Aquaculture — marine, including infrastructure
Commercial Fish
Extraction of, or mortality/injury to, wild species (by commercial and recreational fishing and other activities)
Fish and shellfish harvesting (professional, recreational)
Eutrophication Input of nutrients and input of organic material
Agriculture
Urban uses
Industrial uses
Waste water treatment and disposal
Transport — shipping
Aquaculture
Hydrographical conditions
Changes to hydrological conditions
Offshore structures
Coastal defences and flood protection

39
Descriptor or ecosystem component
Relevant pressures Associated Activities
Restructuring of seabed morphology, including dredging and depositing of materials
Transport infrastructure
Input of other forms of energy (including electromagnetic fields, light and heat
Renewable energy generation (wind, wave and tidal power), including infrastructure
Contaminants Input of other substances (e.g. synthetic substances, non-synthetic substances, radionuclides) – diffuse sources, point sources, atmospheric deposition, acute events.
Agriculture
Urban uses
Industrial uses
Waste water treatment and disposal
Restructuring of seabed morphology, including dredging and depositing of materials
Transport — shipping
Extraction of oil and gas, including infrastructure
Contaminants in seafood
Input of other substances Agriculture
Urban uses
Industrial uses
Waste water treatment and disposal
Restructuring of seabed morphology, including dredging and depositing of materials

40
Descriptor or ecosystem component
Relevant pressures Associated Activities
Transport — shipping
Extraction of oil and gas, including infrastructure
Marine Litter Input of litter (solid waste matter, including micro-sized litter)
Land claim
Urban uses
Industrial uses
Tourism and leisure activities
Transport – land
Aquaculture – marine
Fish and shellfish harvesting (professional, recreational)
Transport –shipping
Input of Anthropogenic Sound
Input of anthropogenic sound (impulsive, continuous)
Renewable energy generation (wind, wave and tidal power) including infrastructure
Extraction of oil and gas, including infrastructure
Military operations
Transport — shipping
We have also prepared a detailed analysis of the 20 main activities affecting UK
seas, their spatial extent and intensity, the associated measures to control them, and
an outlook on how these activities will change over the next 10 years. This can be
found in the “predominant pressures exerted by human activities” tile of the MOAT.

41
The pressures identified from Table 3 are managed through the programme of
measures in the Marine Strategy Part 3 to reduce their impact on the marine
environment, and thus enable GES to be achieved. Table 4 highlights the main
predominant pressures and activities identified in this updated Marine Strategy Part
1 which are preventing or likely to delay the achievement of GES by 2020. There are
also some pressures where the impacts are uncertain, so it is not clear whether GES
will be compromised or not. For example, it is not yet clear whether continuous noise
from shipping affects various marine species at a population level.
The assessments have also reported that natural ecosystem interactions, such as
competition and predation are probably affecting species such as marine mammals
and birds, and that changing temperatures are affecting pelagic and benthic habitats
that are leading to changes in the distribution, growth and reproduction of some
populations of fish, marine mammals, birds and NIS. Prevailing conditions are
described in detail in section 2.7.
Table 4: Pressures and activities which are likely to delay the achievement of
GES by 2020.
Pressure preventing or
delaying the
achievement of GES
Main associated
activities or
implications
Context
Commercial and
recreational fishing for
D1, D3, D4 and D6
Fish and shellfish
harvesting. Use of certain
types of trawling gear
Fishing and use of gear
are controlled by the EU
Common Fisheries policy.
For D1 and D3, UK has
an Article 14 exception
from achieving GES by
2020 because it will take
time for the measures to
actually reduce
exploitation rates, and
allow for fish and shellfish
to recover and achieve
the desired length and
biomass.
Input or spread of NIS for
D2
Transport — shipping
(ballast water, hull
fouling).
Ballast Water Convention
is now in force but needs
ratification by more
significant flag states, and

42
Natural or climate-related
spread of NIS to warming
UK seas following their
introduction into the wider
region
climate related spread of
species is very difficult to
control.
2.6.2 Cumulative effects of human activities
The UK Marine Strategy Part 1 in 2012 noted that improving the evaluation of the
cumulative effects of human activities on marine ecosystems was an important
priority to ensure that the best possible evidence supports management decisions.
The UK has subsequently done a significant amount of work in this area both
nationally, and through leading the OSPAR Working Group on Cumulative Effects
which is looking at this from the perspective of the North-East Atlantic.
The Centre for Environment Fisheries and Aquaculture Science (Cefas) has been
commissioned to develop a cumulative effects assessment approach.
Further information on the cumulative effects assessment methodology can be found
on the “cumulative effects of human activities” tile on the MOAT.
2.7 Status of physical and chemical features
The prevailing physical and chemical characteristics of UK seas help to determine
the structure and function of our marine ecosystems; they can affect the potential for
ecosystems to meet GES. In the UK Marine Strategy Part 1, we reported on the
spatial and temporal variation of sea surface temperature, salinity, wave height,
turbidity, and pH that together have major effects on our seas. Global climate change
is experienced by marine habitats and ecosystems in our waters through change in
these local marine climate characteristics. An updated assessment has been carried
out to determine whether any trends observed in UK Marine Strategy Part 1 have
continued, and to provide context for observed changes in the ecosystem indicators.
The findings of these assessments are summarised in the “assessment summary”
column of Table 5, where we have also provided an associated projection on how
these variables are likely to be affected by climate change and the associated
impacts on marine ecosystems.
Further details of the associated assessments are found in the “ocean processes
and climate” tile of the MOAT.

43
Conditions in UK seas reflect the state of the North-East Atlantic for which the UK led
the assessment of marine climate as part of the OSPAR Intermediate Assessment
201724.
Table 4: Assessment summary of ocean processes variables and associated
climate change projections and impacts.
Ocean process Assessment
Summary
Climate Change
projection
Climate Change
impacts
Sea surface
temperature
Between 2011 and
2015, the trend in
sea surface
temperature in UK
waters reflects the
warming observed in
the Initial
Assessment. A
series of cold winters
(2011 – 2013)
resulted in a slight
decrease to this
trend, but since 2014
seas have been
warmer again.
Rising sea surface
temperatures will
continue through the
21st Century, with
increases of 2°C -
3°C expected for UK
waters.
Sea temperature is a
major driver of marine
ecosystems and one of
the key factors affecting
the distribution,
physiology and ecology of
marine species. Changes
in sea temperature also
produce changes in the
density of seawater,
affecting circulation,
stratification and mixing.
24 https://oap.ospar.org/en/ospar-assessments/intermediate-assessment-2017/climate-and-ocean-
acidification/

44
Ocean process Assessment
Summary
Climate Change
projection
Climate Change
impacts
Ocean acidification Between 2010 and
2015, the evidence of
ocean acidification
for UK waters is
consistent with the
global trend, which
shows the pH of
seawater is
decreasing. There is
strong seasonal,
interannual, depth
and spatial variability
in pH across UK
waters.
The pH of seawater
will continue to
decrease as
anthropogenic
emissions of CO2
increase.
Consequently, the
carbonate saturation
state will decrease
making it harder for
marine calcifiers,
such as reef-forming
corals, molluscs and
some species of
phytoplankton, to
build their skeletons
and shells.
The overall effect of
ocean acidification on
marine ecosystems will
be deleterious
particularly, for organisms
that secrete calcium
carbonate (e.g. in forming
shells). For example,
there is a risk of
reductions in shellfish
growth (and harvest),
although some algae and
seagrasses may benefit
from increased availability
of CO2.
Interactions with other
stressors (e.g.
temperature, toxic metals,
oxygen & food supply)
and species-specific
responses need to be
considered to better
understand impacts on
ecosystems.
Sea surface
suspended
sediments
Satellite observations
over 1998-2015
show significant
increases in annual
average surface
suspended
particulate matter in
5 out of 10 UK
marine regions.
There are no specific
projections of turbidity
or suspended
particulate matter in
UK Seas. Future
climate driven
changes will likely
depend on changes in
waves, storms, and
river flow.
Changes in suspended
particulate matter can
influence primary
production; air-sea heat
transfer; sedimentation
rates and biogeochemical
transfers from the water
column to seabed;
productivity of the
benthos; and oxygen
levels in bottom waters.
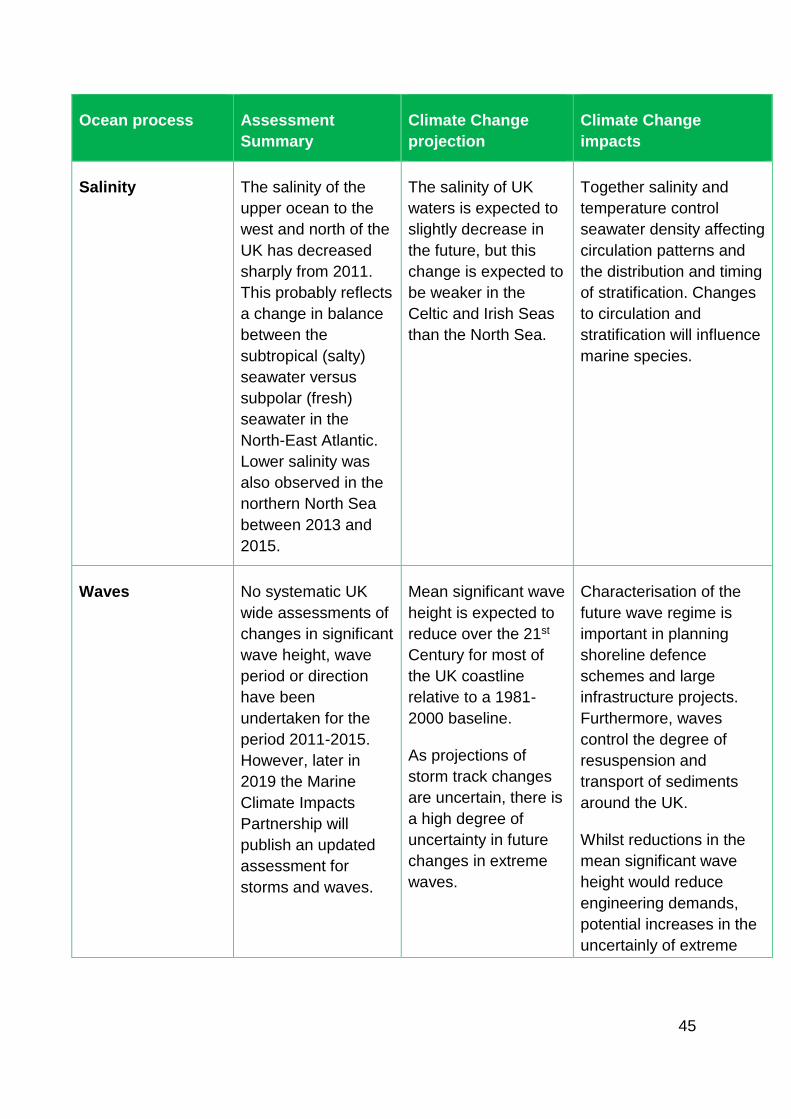
45
Ocean process Assessment
Summary
Climate Change
projection
Climate Change
impacts
Salinity The salinity of the
upper ocean to the
west and north of the
UK has decreased
sharply from 2011.
This probably reflects
a change in balance
between the
subtropical (salty)
seawater versus
subpolar (fresh)
seawater in the
North-East Atlantic.
Lower salinity was
also observed in the
northern North Sea
between 2013 and
2015.
The salinity of UK
waters is expected to
slightly decrease in
the future, but this
change is expected to
be weaker in the
Celtic and Irish Seas
than the North Sea.
Together salinity and
temperature control
seawater density affecting
circulation patterns and
the distribution and timing
of stratification. Changes
to circulation and
stratification will influence
marine species.
Waves No systematic UK
wide assessments of
changes in significant
wave height, wave
period or direction
have been
undertaken for the
period 2011-2015.
However, later in
2019 the Marine
Climate Impacts
Partnership will
publish an updated
assessment for
storms and waves.
Mean significant wave
height is expected to
reduce over the 21st
Century for most of
the UK coastline
relative to a 1981-
2000 baseline.
As projections of
storm track changes
are uncertain, there is
a high degree of
uncertainty in future
changes in extreme
waves.
Characterisation of the
future wave regime is
important in planning
shoreline defence
schemes and large
infrastructure projects.
Furthermore, waves
control the degree of
resuspension and
transport of sediments
around the UK.
Whilst reductions in the
mean significant wave
height would reduce
engineering demands,
potential increases in the
uncertainly of extreme
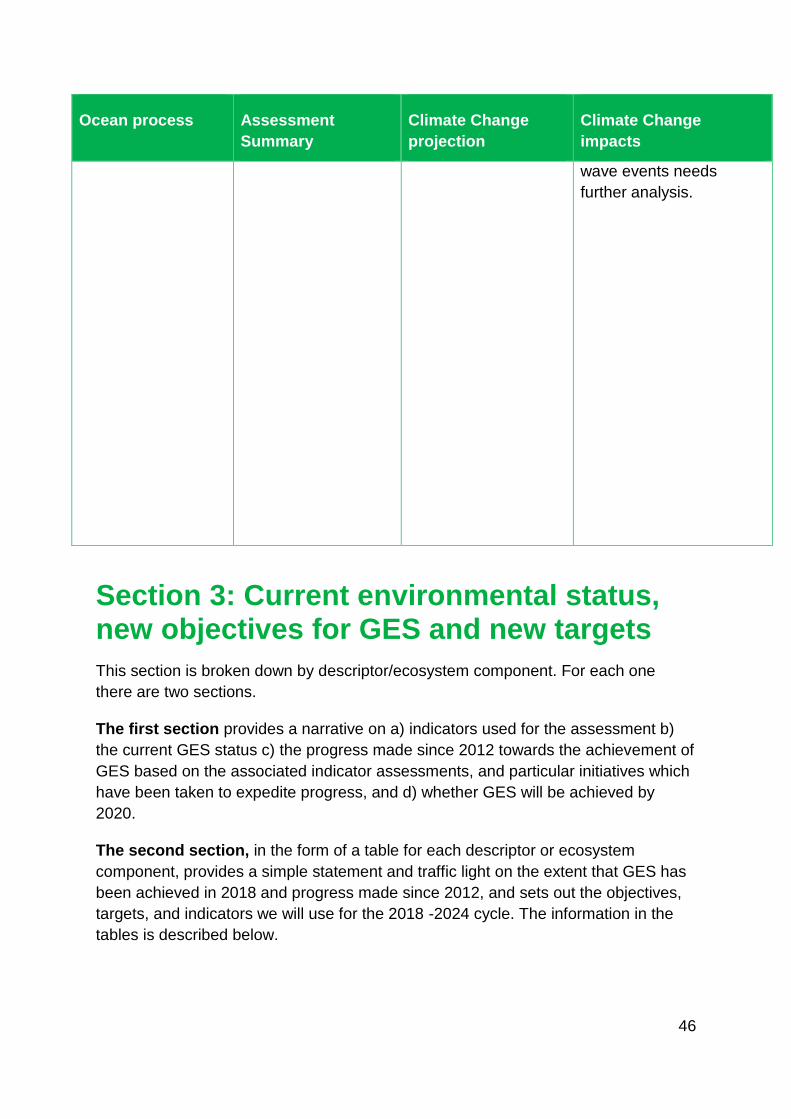
46
Ocean process Assessment
Summary
Climate Change
projection
Climate Change
impacts
wave events needs
further analysis.
Section 3: Current environmental status, new objectives for GES and new targets
This section is broken down by descriptor/ecosystem component. For each one
there are two sections.
The first section provides a narrative on a) indicators used for the assessment b)
the current GES status c) the progress made since 2012 towards the achievement of
GES based on the associated indicator assessments, and particular initiatives which
have been taken to expedite progress, and d) whether GES will be achieved by
2020.
The second section, in the form of a table for each descriptor or ecosystem
component, provides a simple statement and traffic light on the extent that GES has
been achieved in 2018 and progress made since 2012, and sets out the objectives,
targets, and indicators we will use for the 2018 -2024 cycle. The information in the
tables is described below.

47
Current Environmental Status in 2018 Summary of the assessment findings
for the descriptor or ecosystem
component, and the trend towards
achieving GES if available.
High level objective for GES This sets out the updated high level
objective for achieving GES.
Criteria and targets for measuring
progress towards GES in future
This sets out the relevant criteria which
will be used to assess GES for the
descriptor or ecosystem component,
and the associated targets that we will
use to judge whether the criteria have
been met.
Operational targets The operational targets cover particular
management actions identified by the
assessments that are needed to move
towards GES and work we need to do
with other countries, particularly to
develop indicators and associated
threshold values needed to assess
progress in the coming cycle.
Indicators This section describes the indicators
that we are intending to use or hope to
develop for the next cycle. This will
depend on the extent that they can be
taken forward at OSPAR level.
Going forward This section flags up particular issues
which we will focus on in the next cycle
Detailed information about the indicator assessments used to underpin the current
assessment of GES can be found in the “pressures from human activities” and
“biodiversity, food webs” tiles on the MOAT. Detailed information about the
predominant pressures affecting the descriptors and ecosystem components can be
found in Section 2.6 of this report.

48
We have also provided details in Annex 1 about the threshold values or reference
levels for the various indicators which will be used in the 2018-2024 cycle of the UK
Marine Strategy to assess whether their associated targets will be met.
D1, D4 Cetaceans
Indicators - The assessment of cetaceans was based on three indicators: the
abundance and distribution of coastal bottlenose dolphins; the abundance and
distribution of other cetaceans; and harbour porpoise bycatch. The assessments
below contribute to both Descriptor 1 (Biological Diversity) and Descriptor 4 (Food
webs).
Current GES Status - Uncertain. The status of coastal bottlenose dolphin and
minke whale are consistent with the achievement of GES in the Greater North Sea.
The West Wales population of coastal bottlenose dolphins remains, but status is
unknown/uncertain elsewhere. It is unknown if GES has been achieved for other
species of cetacean.
Progress and Action since 2012 - Bycatch in fisheries is an ongoing pressure. The
target for cetacean bycatch has been met in the North Sea, but in the Celtic Seas it
is likely to have exceeded the precautionary threshold. There is low confidence in the
cetacean bycatch assessments due to incomplete bycatch monitoring at the North-
East Atlantic scale.
Since 2012 population estimates have been updated by an international survey. It
has been determined that the minke whale population has remained stable in the
Greater North Sea over the last 20 years. For most other species the new population
estimates of abundance were similar to or larger than previous ones. However,
uncertainty in the data means that we cannot draw firm conclusions about any
changes in abundance.
With the exception of discrete groups of coastal bottlenose dolphin, the cetaceans
found in UK waters are part of much larger North-East Atlantic populations.
Therefore the appropriate scale for the assessment of GES for cetaceans is the
North-East Atlantic. However, there is insufficient monitoring data to assess the
status of cetacean populations at this scale.
In OSPAR, the UK worked with other countries to develop the common indicators on
harbour porpoise bycatch and abundance and distribution of cetaceans. UK
information was used in the assessments published in the OSPAR Intermediate
Assessment 2017.

49
Achievement of GES by 2020 - The assessments in 2012 and 2018, show that
numbers of minke whale are consistent with the achievement of GES in the Greater
North Sea, but for other species there is insufficient information available to make a
robust judgement on their status. Therefore it is uncertain if GES will be achieved at
the North-East Atlantic scale by 2020.
CETACEANS: Perspective for 2018 to 2024
Current Environmental
Status in 2018
The extent to which GES has been
achieved for cetaceans remains
uncertain. The status of coastal
bottlenose dolphin and minke whale is
consistent with the achievement of GES
in the Greater North Sea, but
unknown/uncertain elsewhere. It is
unknown if GES has been achieved for
other species.
High level objective for GES The population abundance of cetaceans indicates healthy
populations that are not significantly impacted by human
activities.
Criteria and targets for
measuring progress
towards GES in future
Bycatch mortality The long-term viability of cetacean
populations is not threatened by incidental
bycatch.
Population
abundance
There should be no significant decrease
in abundance caused by human activities.
Population
Distribution
Population range are not significantly
lower than favourable reference values for
the species.
Operational targets We will continue existing monitoring of cetacean bycatch in
fisheries and continue the use of mitigation measures, for
example acoustic deterrents (‘pingers’) to reduce bycatch and
support further work into novel approaches.
We will continue initiatives such as the survey of Small
Cetaceans in European Atlantic waters and the North Sea
(SCANS) and the Collaborative Oceanography and
Monitoring for Protected Species (COMPASS) to help build a
picture of how cetaceans use an area of sea. This will assist
our understanding of how they may be impacted by or

50
respond to pressure from human activities, such as
underwater noise emissions.
Indicators to be used to
assess the status
- Abundance and distribution of coastal bottlenose dolphins -
OSPAR
- Abundance and distribution of cetaceans other than coastal
bottlenose dolphins - OSPAR
- Cetacean bycatch - OSPAR
Going forward We will aim to determine trends in abundance of cetacean
species and the impact of human pressures, such as bycatch
and noise disturbance, at a North-East Atlantic scale to better
assess progress against the UK targets.
We will consider increasing the frequency of our SCANS
surveys to improve our confidence in our abundance
assessments for more species and make better use of citizen
science observations.
We will develop a UK cetacean bycatch strategy.
D1, D4 Seals
Indicators - The assessment of seals is based on indicators covering population
size and condition of grey and harbour seals. The assessments below contribute to
both Descriptor 1 (Biological Diversity) and Descriptor 4 (Food webs).
Current GES status - Uncertain for harbour seals. Achieved for grey seals.
In the Celtic Seas, there has been a significant increase in the abundance of harbour
seals on the west coast Scotland and inconclusive evidence of declines elsewhere.
In the Greater North Sea, abundance is stable or increasing along the English coast
but has declined along the Scottish coast. The cause of this decline is unclear
although a number of potential factors (e.g. fisheries bycatch) have been ruled out.
The status of grey seals in both the Celtic Seas and the Greater North Sea is
consistent with GES. Both targets for population size and population condition (i.e.
pup productivity) have been met. Abundance and productivity of grey seals have
both increased significantly since the initial assessment in 2012 and also over the
longer-term, since the early 1990s. This improvement in UK waters is mirrored in the
wider grey seal population of the North-East Atlantic.

51
Progress and actions since 2012 - Determining the impact of human pressure is
key to assessing progress against the UK target and to undertaking appropriate
management, if the target is not met. Research is ongoing in Scotland to investigate
potential causes of the harbour seal declines. While several factors have been ruled
out as primary causes, investigations are ongoing into the remaining potential
causes such as interactions with grey seals (competition and predation) and
exposure to toxins from harmful algae. In addition, research will continue to
investigate the life history parameters (e.g. survival and birth rates) and population
dynamics of seals in areas of contrasting population trajectories, through focused
photo-identification studies and necropsies of stranded dead seals to improve our
understanding of what is happening within these populations.
In OSPAR, the UK played a leading role to develop the common indicators for seals
and UK information was used in the assessments on seal abundance and
distribution and grey seal pup production published in the OSPAR Intermediate
Assessment 2017.
Achievement of GES by 2020 - It is evident that GES has been achieved for grey
seals. The lack of certainty about the causes of declines of harbour seals means that
it is unlikely that GES will be achieved by 2020. However, the research underway in
Scotland referred to above may provide an answer and provide the certainty we
need to make a robust judgement.
SEALS: Perspective for 2018 to 2024
Current Environmental
Status in 2018
The UK has achieved its aim of GES for
grey seals in the Greater North Sea and
Celtic Seas. There was a significant
increase in the abundance of harbour
seals in West Scotland where the majority
of harbour seals are located, but their
status in other parts of the Celtic Seas is
uncertain. Harbour seals in the Greater
North Sea have not yet achieved GES.
High level objective for GES The population abundance and demography of seals indicate
healthy populations that are not significantly impacted by
human activities.
Bycatch mortality The long-term viability of seal populations
is not threatened by incidental bycatch.

52
Criteria and targets for
measuring progress
towards GES in future
Population
Abundance and
Distribution
Population abundance and distribution
are consistent with favourable
conservation status.
Grey seal pup
production
Grey seal pup production does not
decline substantially in the short or long-
term.
Operational targets We will conduct research to:
a) investigate potential causes of the harbour seal declines in
Scotland, focusing on interactions with grey seals
(competition and predation) and on exposure to toxins from
harmful algae.
b) investigate the life history parameters (e.g. survival and
birth rates) and population dynamics of seals to improve our
understanding of what is happening within these populations.
Indicators to be used to
assess the status
- Abundance and distribution of seals - OSPAR
- Grey seal pup production - OSPAR
Going forward Determining the impact of human pressure is key to
assessing progress against the UK target. Regular surveys
will continue around the UK coast to monitor population
abundance and trends. In addition, regions of decline will
continue to be surveyed more frequently to establish
population trends and abundance. A seals bycatch indicator
will be developed.
D1, D4 Birds
Indicators - The assessment of breeding seabirds and non-breeding waterbirds was
based on four indicators covering population size and population condition. Two
were developed in cooperation with OSPAR. The assessments below contribute to
both Descriptor 1(Biological Diversity) and Descriptor 4 (Food webs).
Current GES Status - Not achieved for seabirds. Mixed picture for waterbirds.
In the Greater North Sea the status of non-breeding waterbirds is consistent with the
achievement of GES. The status of breeding seabirds is not consistent with the
achievement of GES. In the Celtic Seas, the status of non-breeding waterbirds and

53
breeding seabirds were not considered to be consistent with the achievement of
GES.
Progress and actions since 2012 - The indicators used were unable to distinguish
human impacts from the effects of prevailing environmental conditions. The
assessments mention that milder winters have affected where waterbirds forage and
the lower availability of small fish has affected breeding seabirds. Both impacts are
partly driven by climate change, and are likely to be affecting population size and
condition. However, the impacts from human activities could not be ruled out.
In OSPAR, the UK played a leading role to develop several of the common indicators
for birds and UK information was used in the assessments published in the OSPAR
Intermediate Assessment 2017.
New measures put in place since the UK programme of measures was published in
2015 include designation of Special Protection Areas and black guillemot MPAs in
Scotland.
Achievement of GES by 2020 - The assessments in 2012 and 2018, show that
seabirds will not achieve GES by 2020. For waterbird species it is uncertain if GES
will be achieved by 2020.
BIRDS: Perspective for 2018 to 2024
Current Environmental
Status in 2018
The UK has achieved its aim of GES for
non-breeding waterbirds in the Greater
North Sea but not in the Celtic Seas.
Breeding seabirds have not achieved
GES.
High level objective for GES The abundance and demography of marine bird species
indicate healthy populations that are not significantly impacted
by human activities.
Criteria and targets for
measuring progress
towards GES in future
Bycatch mortality The long-term viability of marine bird
populations is not threatened by deaths
caused by incidental bycatch in mobile
and static fishing gear.
Population
Abundance
The population size of marine bird
species has not declined substantially
since 1992 as a result of human activities.
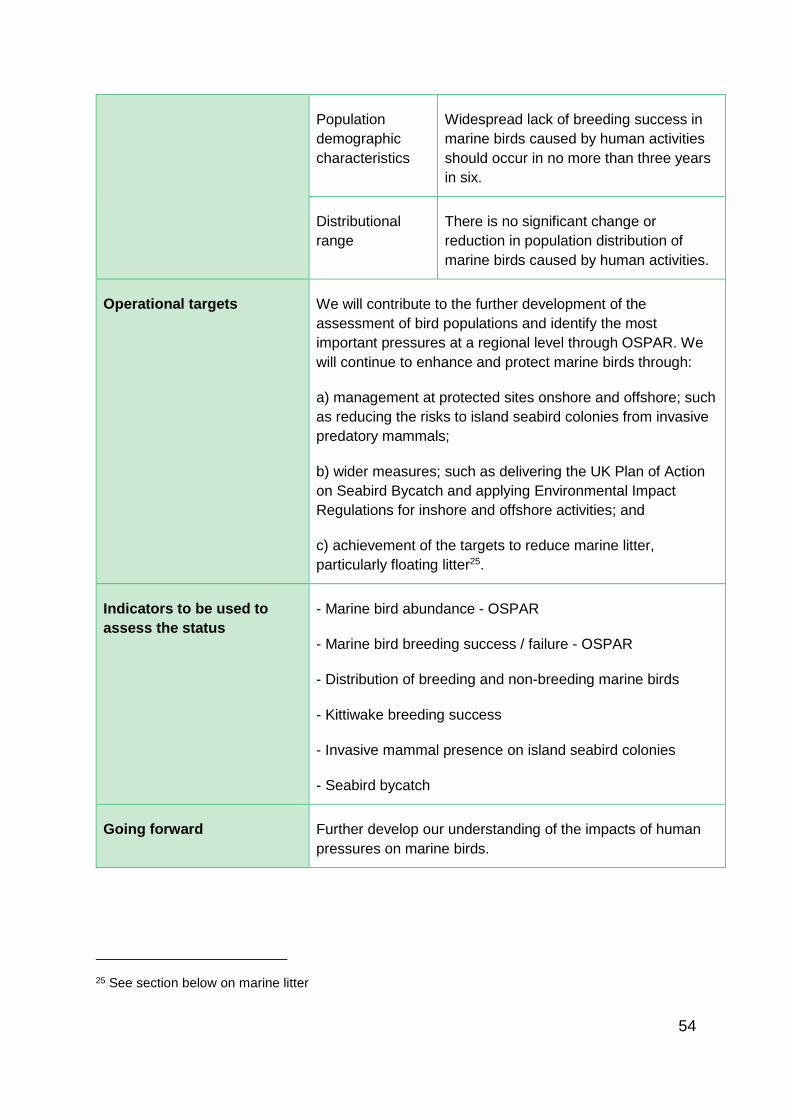
54
Population
demographic
characteristics
Widespread lack of breeding success in
marine birds caused by human activities
should occur in no more than three years
in six.
Distributional
range
There is no significant change or
reduction in population distribution of
marine birds caused by human activities.
Operational targets We will contribute to the further development of the
assessment of bird populations and identify the most
important pressures at a regional level through OSPAR. We
will continue to enhance and protect marine birds through:
a) management at protected sites onshore and offshore; such
as reducing the risks to island seabird colonies from invasive
predatory mammals;
b) wider measures; such as delivering the UK Plan of Action
on Seabird Bycatch and applying Environmental Impact
Regulations for inshore and offshore activities; and
c) achievement of the targets to reduce marine litter,
particularly floating litter25.
Indicators to be used to
assess the status
- Marine bird abundance - OSPAR
- Marine bird breeding success / failure - OSPAR
- Distribution of breeding and non-breeding marine birds
- Kittiwake breeding success
- Invasive mammal presence on island seabird colonies
- Seabird bycatch
Going forward Further develop our understanding of the impacts of human
pressures on marine birds.
25 See section below on marine litter

55
D1, D4 Fish
Indicators - The assessment of fish (including some commercial fish species) is
based on four indicators developed by OSPAR covering: aspects of population
abundance; size-structure; and species composition against targets based on
population size and ecosystem structure. The assessments contribute to both
Descriptor 1 (Biological Diversity) and Descriptor 4 (Food webs).
Current status - GES not achieved.
Demersal fish communities are recovering from over-exploitation in the past. In the
Greater North Sea, recovery is underway in terms of abundance and in both species-
composition and size-structure. In the Celtic Seas the abundance of sensitive
species and size structure are also recovering. Current fisheries management
measures are delivering improvements and GES is likely to be achieved in future if
these measures are continued.
Only a partial assessment of pelagic shelf fish was possible and the assessment
results do not yet provide a clear indication of progress towards the achievement of
GES.
Progress and actions since 2012 - The Initial Assessment 2012 of fish
communities was based mainly on the Large Fish Index (LFI). Since 2012, the LFI
has indicated that targets for the proportion of large fish could be achieved in
Northern parts of the Celtic Seas by 2022, but could take significantly longer for the
entire ecoregion, if current levels of pressure persist. In the Greater North Sea the
LFI has shown recovery in the proportion of large fish and assessment thresholds
are close to being achieved.
Since 2012, the UK has worked in OSPAR to develop new OSPAR-wide indicators
for fish communities covering population abundance of sensitive fish species, size
structure in fish communities and the mean maximum length of large fish. UK data
was included in the associated assessments which were published in the OSPAR
Intermediate Assessment 2017.
Achievement of GES by 2020 - Compared to the assessments carried out in 2012,
the assessments reported in 2018 show that that whilst there have been significant
improvements, GES will not be achieved for fish communities by 2020. Several of
the indicator targets may not be achieved for many years, unless there are further
improvements to fisheries management measures. Stock assessments also need to
be improved to enable effective assessment of the indicators.
The UK applied for an exception from achieving GES by 2020 in its Marine Strategy
Part 3 report to the EU in 2015. The grounds were that it would take several years or
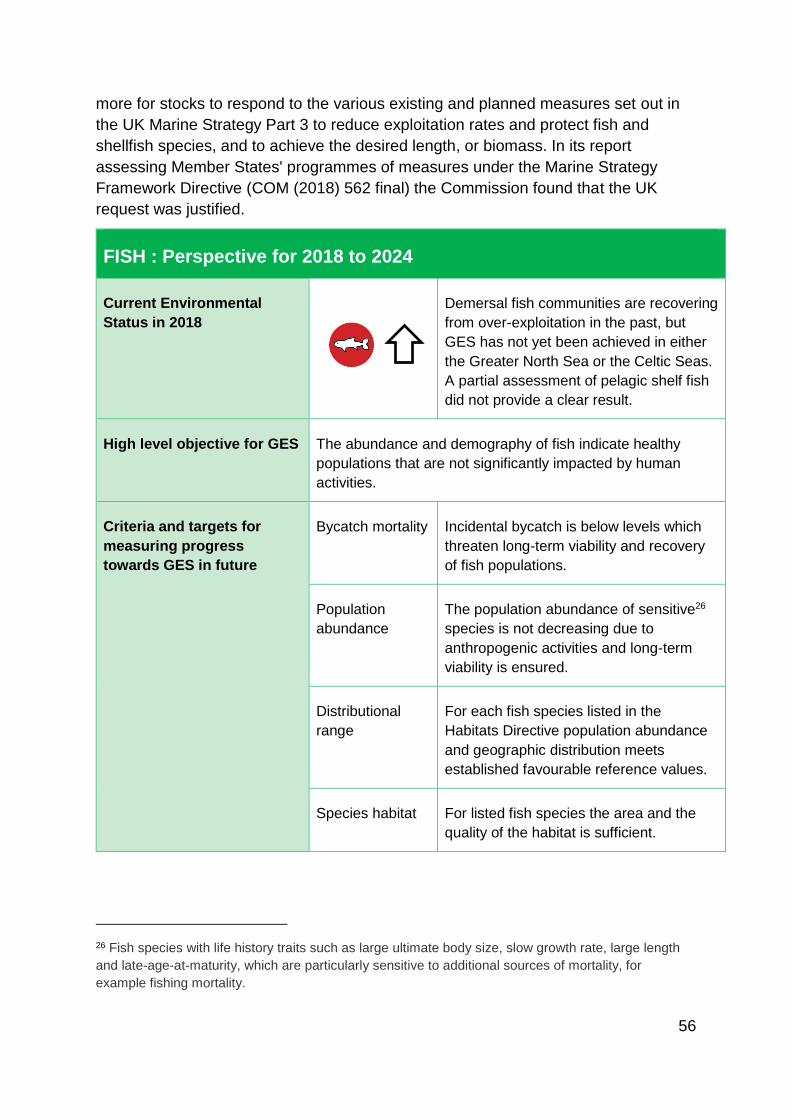
56
more for stocks to respond to the various existing and planned measures set out in
the UK Marine Strategy Part 3 to reduce exploitation rates and protect fish and
shellfish species, and to achieve the desired length, or biomass. In its report
assessing Member States' programmes of measures under the Marine Strategy
Framework Directive (COM (2018) 562 final) the Commission found that the UK
request was justified.
FISH : Perspective for 2018 to 2024
Current Environmental
Status in 2018
Demersal fish communities are recovering
from over-exploitation in the past, but
GES has not yet been achieved in either
the Greater North Sea or the Celtic Seas.
A partial assessment of pelagic shelf fish
did not provide a clear result.
High level objective for GES The abundance and demography of fish indicate healthy
populations that are not significantly impacted by human
activities.
Criteria and targets for
measuring progress
towards GES in future
Bycatch mortality Incidental bycatch is below levels which
threaten long-term viability and recovery
of fish populations.
Population
abundance
The population abundance of sensitive26
species is not decreasing due to
anthropogenic activities and long-term
viability is ensured.
Distributional
range
For each fish species listed in the
Habitats Directive population abundance
and geographic distribution meets
established favourable reference values.
Species habitat For listed fish species the area and the
quality of the habitat is sufficient.
26 Fish species with life history traits such as large ultimate body size, slow growth rate, large length
and late-age-at-maturity, which are particularly sensitive to additional sources of mortality, for
example fishing mortality.

57
Operational targets We will work together with other countries in OSPAR to
establish appropriate threshold values where this is feasible.
Indicators to be used to
assess the status
- Recovery in the population abundance of sensitive fish
species – OSPAR (to be adapted)
- Assessments for listed fish species
Going forward Improve future assessments by investigating the impacts of
all pressures on the indicators and the effects of warming
seas, which will help establish appropriate baselines and
thresholds for all indicators. Procedures on how to integrate
results from this new suite of indicators will enable targets to
be assessed more quantitatively. We will improve stock
assessments and develop an indicator for fish bycatch.
D1, D4 Pelagic habitats
Indicators - The assessment of pelagic habitats is based on indicators covering
changes in plankton communities and changes in plankton biomass against targets
covering habitat condition and habitat distribution. The assessments below
contribute to Descriptor 1 (Biological Diversity) and Descriptor 4 (Food webs).
Current Status - Uncertain. Plankton communities in the Greater North Sea and
Celtic Seas are experiencing changes in biomass, abundance, and community
structure of plankton that may have consequences on the functioning, dynamics and
structure of the whole marine ecosystem. Prevailing oceanographic and climatic
conditions are likely to be driving these changes, but the extent of pressure from
direct human activities is unclear.
Progress and actions since 2012 - New indicators of zooplankton and
phytoplankton community structure and biomass have been developed; these are
the first plankton biodiversity indicators operational in the North-East Atlantic.
In OSPAR, the UK led the development of the common indicator on changes in
phytoplankton lifeforms and UK information was used in the first assessment of
plankton and pelagic habitats at the sub-regional scale in the North-East Atlantic
assessment published in the OSPAR Intermediate Assessment 2017.
Several knowledge and data gaps have been identified in the individual indicator
assessments that will need to be addressed. Filling these gaps will increase the
confidence of the assessments.

58
Achievement of GES by 2020 - The assessment in 2012 concluded that although
there was clear evidence of regional-scale change in the composition and
abundance of plankton communities linked to rising sea temperatures, plankton as a
whole were considered healthy and subject to few direct anthropogenic pressures.
The more detailed assessment in 2018 largely confirms these findings, but work is
underway to improve our understanding of the extent that natural variability, climate
change, ocean acidification and cascading effects from anthropogenic activities such
as fishing may be contributing to change. Therefore, whilst it is likely that GES will be
achieved by 2020, the uncertainty of not knowing the effect of human activities
means that we remain uncertain.
PELAGIC HABITATS: Perspective for 2018 to 2024
Current Environmental
Status in 2018
Prevailing environmental conditions are
likely to be driving the observed changes
in plankton communities but human
activities cannot be ruled out and it is
uncertain whether GES has been
achieved.
High level objective for GES Pelagic habitats are not significantly adversely affected by
human activities.
Criteria and targets for
measuring progress
towards GES in future
Habitat
distribution and
condition
The structure, function, composition and
abundance of the plankton community is
not significantly adversely influenced by
anthropogenic drivers.
Operational targets We will work with other countries in OSPAR to:
a) understand and quantify the effects of the key
anthropogenic and natural pressures on pelagic habitats; and
b) further develop and test regional assessment methods that
can be used in the future for assessing the status of pelagic
habitats.
Indicators to be used to
assess the status
- Changes in plankton communities - OSPAR
- Changes in plankton biomass and abundance - OSPAR
Going forward The methods developed so far mean we can continue to
monitor changes in the plankton community. The assessment
of GES in pelagic habitats would be improved by research

59
into the effects of the key anthropogenic pressures and
climatic drivers on this component of the ecosystem.
D1, D6 Benthic habitats
Indicators - The assessment of benthic habitats is based on indicators covering rock
and biogenic habitats, predominant sediment habitats and intertidal habitats against
targets covering habitat extent, habitat and community condition and physical
damage. The assessments below contribute to both Descriptor 1 (Biological
Diversity) and Descriptor 6 (Seafloor Integrity).
Current Status - GES has not yet been achieved for rock and biogenic habitats in
either Greater North Sea or the Celtic Seas. In UK waters west of the Celtic Seas
levels of physical damage are considered to be consistent with the achievement of
GES. The extent of physical loss of biogenic habitats and levels of physical damage
on rock habitats is currently not consistent with GES. The extent to which GES has
been achieved for predominant sediment habitats remains uncertain. The extent to
which GES has been achieved in intertidal habitats is uncertain. Macroalgae and
seagrass communities status appears to be consistent with GES, but saltmarsh
habitats are not consistent with GES in some areas. Climate change is making some
rocky shore communities in the UK less resilient to the impacts of direct
anthropogenic pressures.
Progress and actions since 2012 - In 2012, the consensus amongst experts was
that the spatial extent of damage to the seabed from fishing gear was greater than
any damage caused by other activities. This current assessment uses new
indicators, developed since 2012, to assess the damage caused by fishing to
sediments, biogenic and rocky habitats. No intertidal indicators were used in 2012
assessments. Since then, new indicators have been developed based on existing
tools and data from the long-term monitoring programme MarClim27.
Due to the limited data and scientific evidence it was not possible to undertake a fully
integrated assessment of benthic habitats at this stage.
In OSPAR, the UK played a leading role in developing a concept for a common
approach for evaluating the condition of benthic habitats and their communities in
order to assess the impact of each human pressure on the condition of each benthic
habitat type, along a pressure-impact gradient. This is at an early stage of
27The MarClim project assesses and predicts the influence of climatic change using intertidal rocky
shore biota.
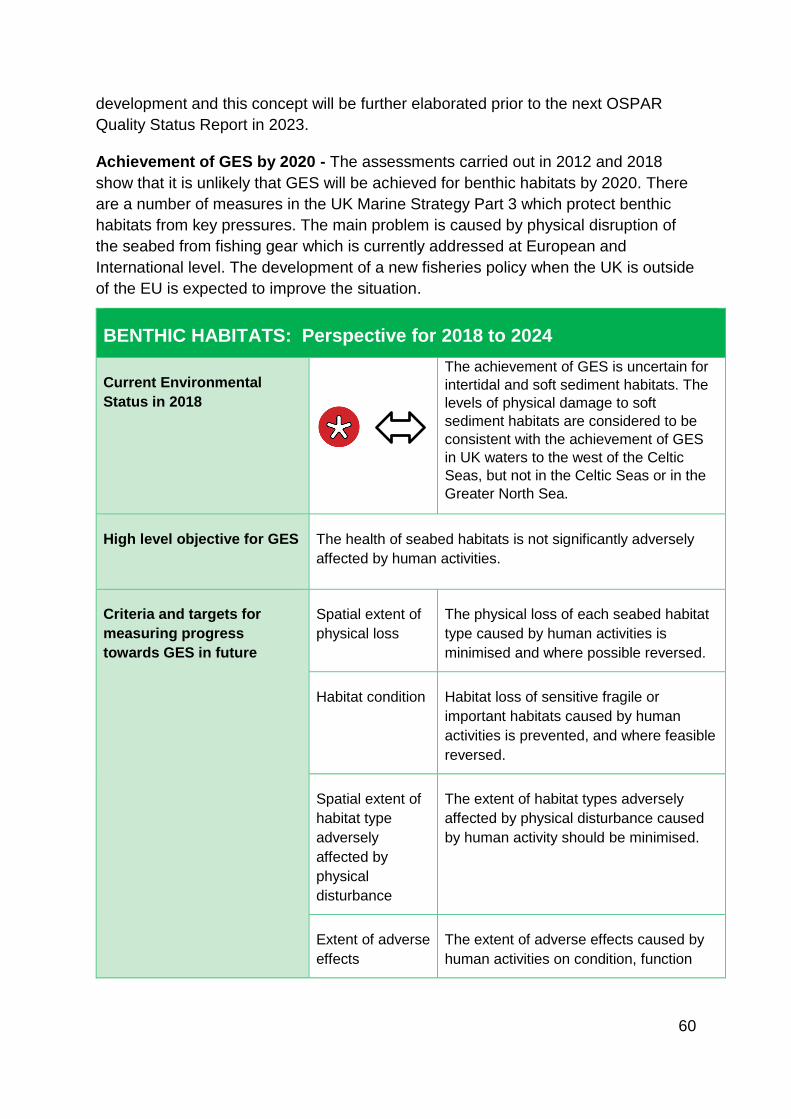
60
development and this concept will be further elaborated prior to the next OSPAR
Quality Status Report in 2023.
Achievement of GES by 2020 - The assessments carried out in 2012 and 2018
show that it is unlikely that GES will be achieved for benthic habitats by 2020. There
are a number of measures in the UK Marine Strategy Part 3 which protect benthic
habitats from key pressures. The main problem is caused by physical disruption of
the seabed from fishing gear which is currently addressed at European and
International level. The development of a new fisheries policy when the UK is outside
of the EU is expected to improve the situation.
BENTHIC HABITATS: Perspective for 2018 to 2024
Current Environmental
Status in 2018
The achievement of GES is uncertain for
intertidal and soft sediment habitats. The
levels of physical damage to soft
sediment habitats are considered to be
consistent with the achievement of GES
in UK waters to the west of the Celtic
Seas, but not in the Celtic Seas or in the
Greater North Sea.
High level objective for GES The health of seabed habitats is not significantly adversely
affected by human activities.
Criteria and targets for
measuring progress
towards GES in future
Spatial extent of
physical loss
The physical loss of each seabed habitat
type caused by human activities is
minimised and where possible reversed.
Habitat condition
Habitat loss of sensitive fragile or
important habitats caused by human
activities is prevented, and where feasible
reversed.
Spatial extent of
habitat type
adversely
affected by
physical
disturbance
The extent of habitat types adversely
affected by physical disturbance caused
by human activity should be minimised.
Extent of adverse
effects
The extent of adverse effects caused by
human activities on condition, function

61
and ecosystem processes of habitats is
minimised.
Operational targets We will work with other countries in OSPAR to establish
criteria and thresholds for the extent of habitat loss and the
extent of anthropogenic activities where feasible.
We will complete a well-managed ecologically coherent MPA
network.
Indicators to be used to
assess the status
- Physical loss of predicted habitat
- Extent of Physical damage indicator to predominant and
special habitat - OSPAR
- Benthic communities indicator - OSPAR
- Aggregated Rocky Shore Macroalgal Index
- Aggregated Infaunal Quality Index
- Aggregated Saltmarsh Tool
- Aggregated Intertidal Seagrass Tool
- Intertidal rock community change indicator (MarClim)
Going forward Additional data from existing Marine Protected Areas will be
included in future assessments. We will develop assessment
methods further in order to integrate assessment results, and
help to evaluate the effects of human activities in relation to
climate change. We will develop indicators to assess the
status of sublittoral rock, biogenic reefs and typical species.
D2, Non-indigenous species (NIS)
Indicators - This first UK-wide assessment of the status of NIS is based on trends of
new introductions of NIS into the Greater North Sea or the Celtic Seas over time.
Current Status - GES not achieved. The results suggest, with low confidence, that
there was no significant difference in the number of new records of NIS detected
between the two six-year periods (2003 to 2008 and 2009 to 2014) used in the
assessment. This indicates that no significant reduction in the risk of introduction of
NIS over this time period has been achieved in either the Greater North Sea or the
Celtic Seas.
62
Progress and actions since 2012 - Insufficient information was available to enable
an assessment in 2012. Since then, a limited assessment of the impact of NIS in the
UK has been made and used for this assessment. NIS monitoring has started to be
integrated into biodiversity monitoring since 2016, including the development of a
target species list and baseline dataset.
Species Action Plans for key NIS, which should aid in implementing controls to
reduce the risk of spread and impacts in UK waters, are currently being developed
by the UK working non-native group, with the invasive colonial sea squirt Didemnum
vexillum, being the first species with an Action Plan in development. The Action
Plans are being developed in-line with those already produced for other (freshwater
and terrestrial) species by the GB Non-Native Species Secretariat.
In OSPAR, the UK led the development of the common indicators on NIS and UK
information was used in the assessment published in the OSPAR Intermediate
Assessment 2017.
A number of knowledge gaps were also identified in the individual indicator
assessments that will need to be addressed in both in the UK and OSPAR. There is
also a need to improve data flow and management in relation to NIS detection. In
addition, ensuring that all biodiversity monitoring programmes include the detection
of NIS where ever possible will be essential to the continued robustness of this
approach to monitoring for NIS both now and in the future.
Achievement of GES by 2020 - The conclusion that there was no significant
change of new introductions of NIS between 2009 and 2014, is of low confidence,
due largely to lack of consistent monitoring effort and/or reporting. However, on a
precautionary basis we estimate that GES will not be achieved in UK seas by 2020.
NIS can enter UK waters from ballast water and the accumulation of organisms on
ships’ hulls. Due to the large volume of international shipping in UK seas, the
achievement of GES will be to some extent be dependent on all flag states adopting
international controls that prevent the introduction of NIS such as the and
international ballast water control standards of the Ballast Water Convention.

63
NON-INDIGENOUS SPECIES (NIS) D2: Perspective for 2018 to 2024
Current Environmental
Status in 2018
The UK has not yet achieved its aim of
GES for NIS. Our ability to detect new
NIS has improved but there has been no
significant change in the number of new
records of NIS made between 2003 and
2014.
High level objective for GES The rate of introduction of NIS, spread and impact of invasive
NIS caused by human activities is not adversely altering
ecosystems.
Criteria and targets for
measuring progress
towards GES in future
NIS introductions The number of newly introduced NIS is
minimised and where possible reduced to
zero.
NIS distribution The rate of spread of invasive NIS, as a
result of human activities is minimised
and reduced where possible.
Operational targets We will develop and implement Pathway Action Plans to
reduce the risk of introduction and spread of NIS.
We will improve monitoring and surveillance to detect new
NIS introductions, particularly at high risk locations.
Indicators to be used to
assess the status
- The number of new NIS introduced
- The number of new populations of established invasive NIS
Going forward Further development of indicators in OSPAR and associated
monitoring and surveillance in key areas of risk are needed.
This will increase our understanding of how the pressures
resulting from NIS introduction and spread can best be
minimised.
D3 Commercial fish
Indicators - The assessment of commercial fish is based on two indicators which
measure, for commercially exploited stocks of UK interest which have MSY
assessments, commercial fishing pressure and reproductive capacity.

64
Current Status - GES has been achieved for some commercially exploited fish, but
for most shellfish stocks GES has not yet been achieved or their status is uncertain.
The assessments showed that, for stocks with MSY assessments, fishing pressure
has been reduced on marine fish (quota) stocks (including Nephrops) and that the
percentage of these stocks fished within maximum sustainable yield (MSY) limits has
increased from 12% in 1990 to 53% in 2015.
During this period, improvements have also been observed in the reproductive
capacity of these stocks, with the proportion of marine fish spawning stock
biomasses capable of producing MSY increasing from 28% in 1990 to 56% in 2016.
As of 2015, we know that at least 37% of national shellfish stocks were exploited
beyond maximum sustainable yield and that no assessment was possible in relation
to their reproductive capacity relative to the level capable of producing MSY.
Assessments for 61% of shellfish stocks were not carried out and their status is not
known.
Progress and actions since 2012 - The revised Common Fisheries Policy of 2013
included a new commitment to achieve the maximum sustainable yield exploitation
rate. Since 2012 there has been a further increase in the number of fish stocks that
are harvested sustainably. There is also more consistent data for shellfish species.
However, whilst these results show further progress towards achieving all
populations of commercial fish are within safe biological limits and fished
sustainably, our aim for GES has not yet been achieved.
Measures taken include:
The North Sea Multi-Annual Plan (MAP) which was initiated in August 2016
and was published in July 2018.
The Western Waters MAP was initiated in March 2018.
The landing obligation has been phased in on an annual basis since 2015.
Pelagic species were first to be introduced in 2015.
Demersal species were then phased in between 2016 and 2018.
Full implementation of the landing obligation came into force on 1st January
2019. This means all UK vessels will be required to land catches of all species
subject to catch limits, unless specifically exempted.
Exemptions to the landing obligation are set out in delegated acts for both the
North Sea and North Western Waters.

65
Improvements in gear selectivity.
Spatial measures such as seasonal closures and real time closed areas.
Achievement of GES by 2020 - Compared to the assessments carried out in 2012,
the assessments reported in 2018 show that that whilst there have been some
improvements, GES will not be achieved for commercial fish by 2020.
The UK applied for an exception from achieving GES by 2020 in its Marine Strategy
Part 3 report to the EU in 2015. This was on the grounds that it will take several
years or more for stocks to respond to the various existing and planned measures
set out in the UK Marine Strategy Part 3 to reduce exploitation rates and protect fish,
elasmobranch and shellfish species, and to achieve the desired length, or biomass.
In its report assessing Member States' programmes of measures under the Marine
Strategy Framework Directive (COM (2018) 562 final) the Commission found that the
UK request was justified.
COMMERCIAL FISH D3: Perspective for 2018 to 2024
Current Environmental
Status in 2018
The UK has achieved its aim of GES for
some commercially exploited fish. In 2015,
53% of marine fish (quota) stocks were
fished below maximum sustainable yield
(MSY). Most national shellfish stocks have
either not yet achieved GES or their status
is uncertain.
The percentage of quota stocks fished
below MSY and the proportion of marine
fish spawning stock biomasses capable of
producing MSY have increased significantly
since 1990.
High level objective for GES Populations of all commercially-exploited fish and shellfish are
within safe biological limits, exhibiting a population age and
size distribution that is indicative of a healthy stock.
Criteria and targets for
measuring progress
towards GES in future
Fishing mortality The fishing mortality rate of populations of
commercially-exploited species is at or
below levels which can produce the
maximum sustainable yield.
Reproductive
Capacity of the
stock
The Spawning Stock Biomass of
populations of commercially-exploited
species are above biomass levels capable

66
of producing the maximum sustainable
yield.
Operational targets While the UK is a Member State of the EU, or subject to an exit
implementation period, we will continue to support the
European Commission in achieving the CFP’s objectives
including sustainable fishing at levels consistent with MSY. For
the future, the Fisheries Bill provides the framework to enable
us to continue to push towards further stocks being fished at
MSY and delivering our ambition for sustainable fishing. The
Bill sets out clear objectives to ensure that fisheries and
aquaculture activities are environmentally sustainable in the
long-term, and to take an ecosystems-based approach to
fisheries management measures. Policies to deliver against
these objectives, including on MSY, will be set out in the
resulting Fisheries Statements.
Indicators to be used to
assess the status
- D3C1 Commercial fishing pressure for stocks of UK interest.
- D3C2 Reproductive capacity of commercially exploited stocks
of UK interest.
Going forward Indicator targets will be made consistent with multi-annual
plans that are adopted for commercial fish stocks. We will seek
to improve stock assessments for national stocks, where
resources allow, in particular for key commercial shellfish
stocks in English waters such as scallops, crabs and lobsters
and their MSY reference levels. As the science develops we
will work with other countries to establish the feasibility of
setting threshold values to show whether the age and size
distribution of individuals in the populations of commercially-
exploited species is indicative of a healthy population.
D4 Food webs
Indicators - The assessment of the status of food webs is based on indicators and
associated targets covering breeding success, species and size composition,
abundance and population condition for the ecosystem components included under
descriptor 1.
Current Status - Fish communities, which are a key component of the food web are
recovering, but GES status for the whole marine food web is uncertain.
67
The assessments of the status of food webs has been made using the results
described in the sections above on “D1, D4” on fish, birds, seals, cetaceans and
pelagic habitats. In both the Greater North Sea and Celtic Seas, plankton
communities are experiencing changes in biomass, abundance, and community
structure. Deterioration in fish populations has been halted and, in some areas, the
size and species structure of fish communities are recovering. Trends in the
proportion of large fish in the demersal fish community suggest recovery may
continue in most of the areas if current fishing pressures do not increase. However,
breeding seabird populations are not consistent with GES. This may be the result of
lower availability of small fish (e.g. sandeels, sprat and herring). Grey seal numbers
are increasing, while harbour seals are largely stable but declining in some places,
and the trends in most cetacean populations are uncertain.
The components of the food web are clearly changing, but it is unclear how these
changes are affecting each other. Signs of recovery in fish communities should
ultimately lead to improvements in populations of higher predatory species further up
the food chain. Prevailing oceanographic and climatic conditions are likely to be
driving these changes in productivity, particularly at the base of the food web. In
addition, the cumulative effects of pressure from human activities on the food web
are unclear.
Progress and actions since 2012 - In 2012 we did not have sufficient knowledge of
the complex nature of the relationships between our marine species and habitats
and the prevailing conditions and pressures affecting them to be able to carry out a
dedicated assessment of food webs in UK seas. However, various assessments
covering breeding success, species and size composition, abundance and
population condition for cetaceans, seals, birds, fish and pelagic and benthic habitats
and more detailed information on the pressures affecting them have provided
sufficient evidence to produce this first UK assessment in 2018 and to be able to
identify some of the key actions, such as better control of fishing pressures, which
have led to improvements.
Achievement of GES by 2020 - We are not able to assess whether the aim of
Descriptor 4 (that there should be no significant adverse change in the function of
different trophic levels in marine food webs as a result of human activities), will be
achieved by 2020. There are some indications that fish communities, which are a
key component of the food web, are recovering due to fisheries management
measures. It is likely that these changes have contributed to and will continue to
contribute to changes in prey availability for seabirds and marine mammals. It is
unknown what the full extent of these changes in predator-prey interactions will be,
or how climatically-driven changes in the plankton will affect the rest of the food web.
There is still a substantial task to develop suitable indicators with other countries that
provide a robust assessment of food web health.
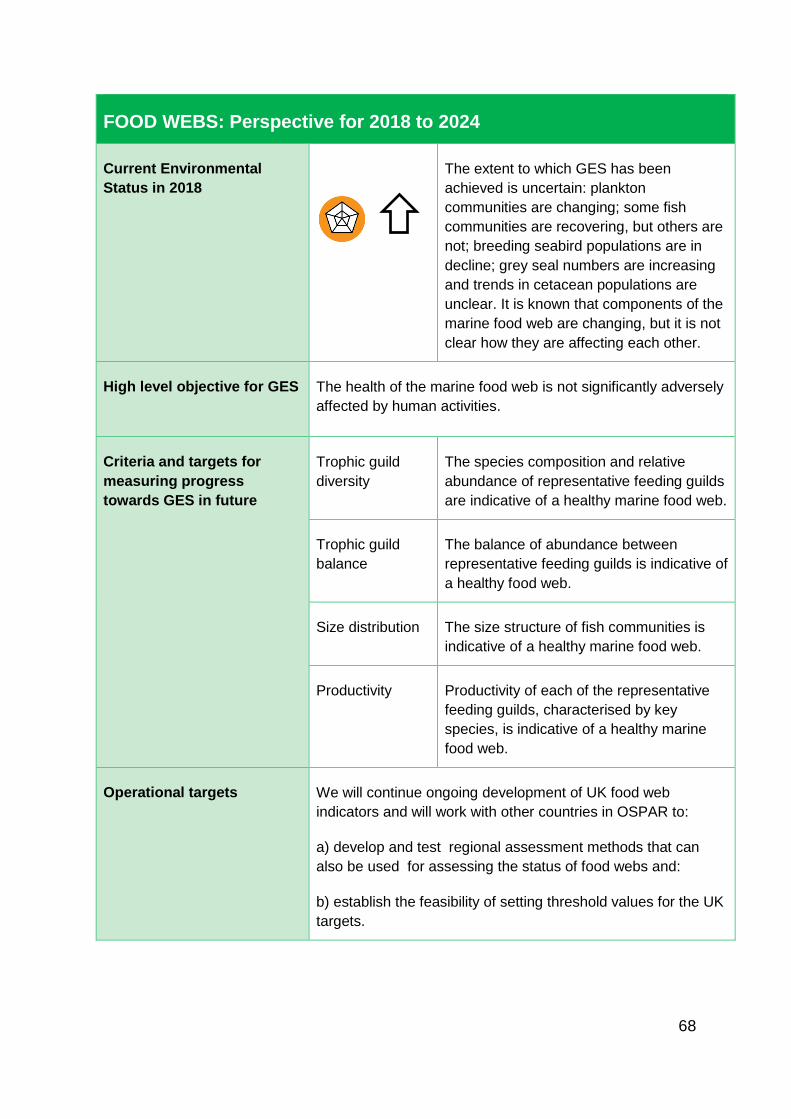
68
FOOD WEBS: Perspective for 2018 to 2024
Current Environmental
Status in 2018
The extent to which GES has been
achieved is uncertain: plankton
communities are changing; some fish
communities are recovering, but others are
not; breeding seabird populations are in
decline; grey seal numbers are increasing
and trends in cetacean populations are
unclear. It is known that components of the
marine food web are changing, but it is not
clear how they are affecting each other.
High level objective for GES The health of the marine food web is not significantly adversely
affected by human activities.
Criteria and targets for
measuring progress
towards GES in future
Trophic guild
diversity
The species composition and relative
abundance of representative feeding guilds
are indicative of a healthy marine food web.
Trophic guild
balance
The balance of abundance between
representative feeding guilds is indicative of
a healthy food web.
Size distribution The size structure of fish communities is
indicative of a healthy marine food web.
Productivity Productivity of each of the representative
feeding guilds, characterised by key
species, is indicative of a healthy marine
food web.
Operational targets We will continue ongoing development of UK food web
indicators and will work with other countries in OSPAR to:
a) develop and test regional assessment methods that can
also be used for assessing the status of food webs and:
b) establish the feasibility of setting threshold values for the UK
targets.
69
Indicators to be used to
assess the status
- fish community size structure: Typical Length and/or Large
Fish Index - OSPAR
- productivity indicators to be developed including adaptation of
existing OSPAR indicators of seabird breeding success, seal
pup production and primary production of phytoplankton; plus
possible indicators of larval abundance of keystone fish
species (e.g. sandeels).
- mean maximum length of fish - OSPAR
Going forward To get a more robust assessment of whether marine food webs
are not adversely affected by human activities, it will be
necessary to address a number of knowledge gaps and to
develop suitable indicators than can provide a more robust
assessment. This includes consideration of representative
species composition indicators including those for bird and
marine mammal species, and biomass of predatory feeding
guilds for fish, birds and marine mammals. As the food web
extends well beyond UK seas, our intention is to do this
through OSPAR and build on the recent research outcomes
from the NERC/Defra funded Marine Ecosystem Research
Programme, which will improve our understanding of the
ecosystem processes that underpin the marine food web, how
they are responding to environmental change and
management scenarios for improving their status.
As our monitoring improves for ecosystem components
including birds and mammals, the relationships between trophic
levels should become clearer. By using refined ecosystem
models we will be able to evaluate food web status under
different environmental and management scenarios.
D5 Eutrophication
Indicators - The assessment of the eutrophication status of UK waters is based on
indicators covering: the inputs of nutrients to the sea; nutrient concentrations;
chlorophyll concentrations; and concentrations of dissolved oxygen in marine waters.
Current Status - GES has been largely achieved. The latest application of the
OSPAR Common Procedure (which is used to assess eutrophication) showed that
since 1990 the introduction of nutrients by rivers into the marine environment has
fallen considerably, and that almost 100% of the marine waters in the Celtic Seas
and the Greater North Sea were classified as eutrophication non-problem areas.

70
However, there are still a number of small estuaries and harbours with limited water
circulation in estuarine and coastal waters which exhibit eutrophication problems (21
problem areas, and 11 potential problem areas). These areas represent a small
proportion of the total area of UK waters (0.03%) and of 0.41% of estuarine and
coastal waters.
Progress and actions since 2012 - The Assessment in 2012 showed a similar
picture, with GES broadly achieved with eutrophication problems areas restricted to
estuarine and coastal waters. There have been some additional small improvements
since then.
Achievement of GES by 2020 - The aim of Descriptor 5 is that human-induced
eutrophication is minimised, and with only 0.03% of UK marine waters being
classified as eutrophication problem areas, we estimate that GES will be achieved by
2020. Nevertheless, our aim is to continue to address the remaining problem areas
with appropriate measures. One of the difficulties, is that these small areas
frequently contain substantial reservoirs of nitrogen and phosphorus locked in
sediments which can take decades to dissipate, long after measures have been put
in place.
EUTROPHICATION D5: Perspective for 2018 to 2024
Current Environmental
Status in 2018
The UK has largely achieved its aim of
GES for eutrophication. A small number
of eutrophication problems remain in
coastal and estuarine waters,
representing 0.03% of the total UK
Exclusive Economic Zone, and 0.41% of
estuarine and coastal waters.
High level objective for GES Human-induced eutrophication is minimised in UK marine
waters.
Criteria and targets for
measuring progress
towards GES in future
Nutrient
concentrations
Nutrient concentrations are below the
levels which could lead to harmful
eutrophication effects.
Chlorophyll a
concentrations
Chlorophyll a concentrations are below
levels which could lead to harmful
eutrophication effects.
71
Dissolved
Oxygen content
Dissolved oxygen content in coastal
waters are below levels which could lead
to harmful eutrophication effects.
Operational targets We will work with other countries to further refine the OSPAR
Common Procedure and develop threshold values which take
account of regional or sub-regional specificities if this proves
to be necessary.
We will work with other countries to develop remote sensing
assessments of chlorophyll to provide a real-time picture of
nutrient enrichment.
Indicators to be used to
assess the status
- inputs of nutrients - OSPAR
- nutrient concentrations of Dissolved Inorganic Nitrogen
Dissolved Inorganic Phosphorus - OSPAR
- chlorophyll concentrations - OSPAR
- concentrations of dissolved oxygen - OSPAR
For offshore waters the indicator results will be integrated
according to the rules set out in OSPAR
Going forward Seeing that eutrophication is only a problem in a few small
areas in coastal waters, we will focus on implementing
management measures to improve these.
D7 Hydrographical conditions
Indicators - A number of indicators, such as sea surface temperature, salinity,
turbidity, species and habitat condition are available to assess the likely impacts of
infrastructure developments.
Current Status - GES continues to be achieved.
The assessment covered the potential hydrographical impacts (including cumulative
and in-combination environmental effects) on the marine ecosystem arising from
large scale infrastructure projects. We undertook a project which assessed a number
of case studies of existing or potential future planning applications and determined
that the current regulatory regime continues to be sufficiently robust to ensure that
any significant long-term impacts are mitigated. The assessment showed that the UK
aim for GES continues to be achieved.

72
Progress and actions since 2012 - The assessment in 2012 showed a similar
picture with GES broadly achieved. Since then there has been a strengthening of the
associated regulatory regimes through the introduction of Marine Plans for a number
of UK areas which, inter alia, help ensure that cumulative effects of different projects
in the same area can be better evaluated.
Achievement of GES by 2020 - We expect that GES will continue to be achieved.
We will work further to develop more robust methodologies for assessing cumulative
effects with OSPAR and continue with long-term monitoring programmes to monitor
hydrographical conditions and help assess the impacts of climate change, such as
sea level rise, sea surface temperature and turbidity.
HYDROGRAPHICAL CONDITIONS D7: Perspective for 2018 to 2024
Current Environmental
Status in 2018
The UK continues to achieve its aim of
GES for hydrographical conditions.
High level objective for GES The nature and scale of any permanent changes to
hydrographical conditions resulting from anthropogenic
activities do not have significant long term impacts on UK
habitats and species.
Criteria and targets for
measuring progress
towards GES in future
Permanent
alteration of
hydrographical
conditions
All significant marine infrastructure
developments must meet licensing
conditions to ensure they do not adversely
affect the marine ecosystem.
Operational targets We will further develop our approach to assessing the
cumulative effects of major developments.
Indicators to be used to
assess the status
No indicators were developed to specifically assess
anthropogenic changes to hydrographical conditions. However,
the UK monitors a number of indicators of prevailing conditions,
such as sea surface temperature, salinity, turbidity which are
relevant to assessing likely hydrographical impacts of
infrastructure developments.
Going forward We will continue to assess significant infrastructure
developments and their potential impacts on hydrographical
conditions. Marine Plans, when in place, will enhance the
regulatory framework for the licensing and consents process.
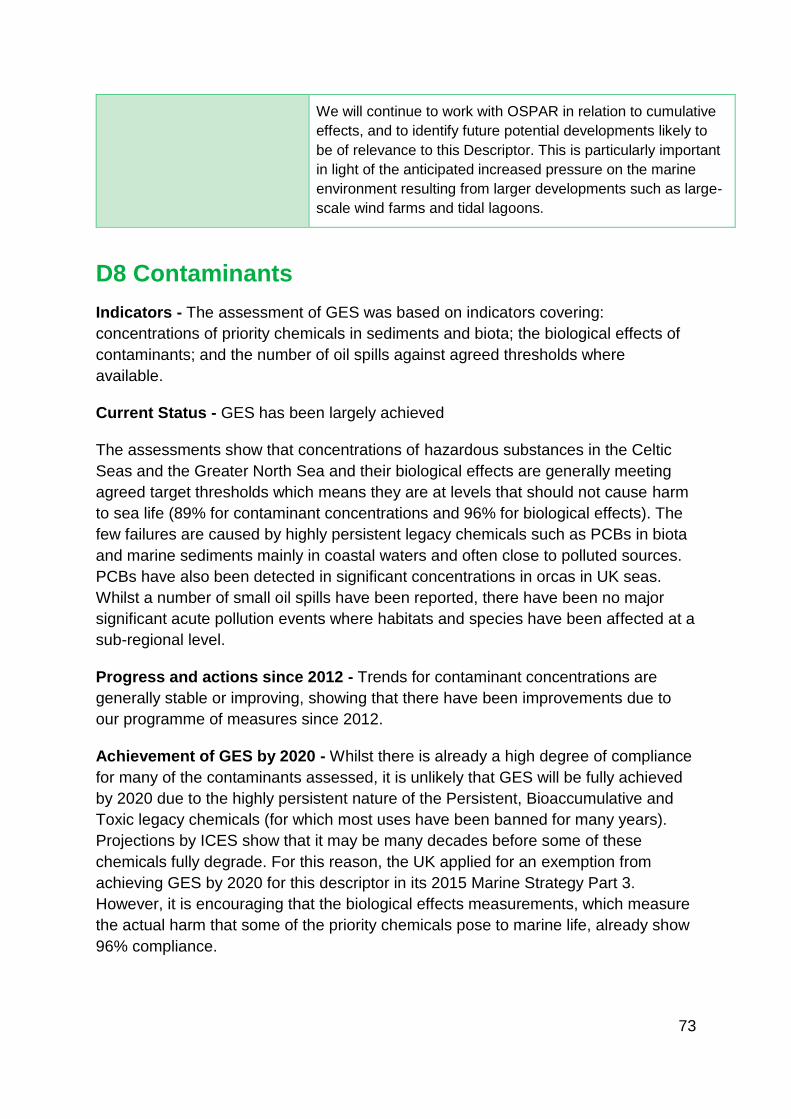
73
We will continue to work with OSPAR in relation to cumulative
effects, and to identify future potential developments likely to
be of relevance to this Descriptor. This is particularly important
in light of the anticipated increased pressure on the marine
environment resulting from larger developments such as large-
scale wind farms and tidal lagoons.
D8 Contaminants
Indicators - The assessment of GES was based on indicators covering:
concentrations of priority chemicals in sediments and biota; the biological effects of
contaminants; and the number of oil spills against agreed thresholds where
available.
Current Status - GES has been largely achieved
The assessments show that concentrations of hazardous substances in the Celtic
Seas and the Greater North Sea and their biological effects are generally meeting
agreed target thresholds which means they are at levels that should not cause harm
to sea life (89% for contaminant concentrations and 96% for biological effects). The
few failures are caused by highly persistent legacy chemicals such as PCBs in biota
and marine sediments mainly in coastal waters and often close to polluted sources.
PCBs have also been detected in significant concentrations in orcas in UK seas.
Whilst a number of small oil spills have been reported, there have been no major
significant acute pollution events where habitats and species have been affected at a
sub-regional level.
Progress and actions since 2012 - Trends for contaminant concentrations are
generally stable or improving, showing that there have been improvements due to
our programme of measures since 2012.
Achievement of GES by 2020 - Whilst there is already a high degree of compliance
for many of the contaminants assessed, it is unlikely that GES will be fully achieved
by 2020 due to the highly persistent nature of the Persistent, Bioaccumulative and
Toxic legacy chemicals (for which most uses have been banned for many years).
Projections by ICES show that it may be many decades before some of these
chemicals fully degrade. For this reason, the UK applied for an exemption from
achieving GES by 2020 for this descriptor in its 2015 Marine Strategy Part 3.
However, it is encouraging that the biological effects measurements, which measure
the actual harm that some of the priority chemicals pose to marine life, already show
96% compliance.

74
CONTAMINANTS D8: Perspective for 2018 to 2024
Current Environmental
Status in 2018
The UK has largely achieved its aim of
GES for contaminants. Concentration of
hazardous substances and their biological
effects are generally meeting agreed target
thresholds. Highly persistent legacy
chemicals are the cause of the few failures,
mainly in coastal waters close to polluted
sources.
High level objective for
GES
Concentrations of contaminants in water, sediment or marine
biota, and their effects, are lower than thresholds that cause
harm to sea life, and are not increasing.
Criteria and targets for
measuring progress
towards GES in future
Concentrations of
contaminants in
coastal and
territorial waters
Concentrations of contaminants measured
in water, sediment or marine biota comply
with appropriate threshold values.
Health of species
and condition of
habitats
Biological or ecological effects on sea life
due to contaminants are below thresholds
agreed by OSPAR.
Occurrence of
significant
pollution events
Occurrence and extent of significant acute
pollution events are minimised.
Impact of
significant acute
pollution events
on species and
habitats
The adverse effects of significant acute
pollution events on the health of species
and on the condition of habitats (such as
their species composition and relative
abundance) are minimised and, where
possible, eliminated.
Operational targets Work with other countries to establish common threshold values
for contaminants and their effects where necessary.
Work nationally and with other countries to identify chemicals of
emerging concern and develop common management actions.
Work with other countries to investigate the cumulative effects
of combinations of contaminants on sea life populations.

75
Refine UK emergency response procedures to ensure that risks
from acute pollution events do not significantly impact marine
biota or habitats.
Indicators to be used to
assess the status
Contaminant concentrations
- Metals in biota - OSPAR
- Metals in sediment - OSPAR
- PCBs in biota - OSPAR
- PCBs in Sediment - OSPAR
- PAH in biota - OSPAR
- PAH in sediment - OSPAR
- PBDEs in biota - OSPAR
- PBDEs in sediment - OSPAR
- Radionuclides - OSPAR
- Metals from water and air - OSPAR
- contaminants in coastal waters
- specific pollutants
Biological effects
- Imposex in dogwhelks - OSPAR
- Micronucleus test - OSPAR
- EROD activity - OSPAR
- Bile metabolite - OSPAR
- Liver neoplasm - OSPAR
- Fish disease - OSPAR
Oil Spills
- Number and size of spills

76
Going forward We will continue to work with other countries to develop and
adopt common targets and threshold values for contaminants of
concern, particularly through the OSPAR Convention.
We will also work both nationally and with other countries to
identify emerging chemicals likely to pose significant risks to
marine life.
We will also continue to refine our monitoring programmes
nationally and in OSPAR to focus on areas where there is the
greatest risk of exceeding threshold values in order to check
whether existing measures are working, and whether new
measures might be needed, and to target emerging
contaminants.
D9 Contaminants in seafood
Indicators - The assessment of GES was based on an indicator covering
concentrations of contaminants in seafood.
Current Status - GES has been achieved.
Surveys carried out since 2012 show that the levels of contaminants in fish and other
seafood for human consumption do not exceed the limits set in Regulation (EC) No
1881/2006, and have generally met the agreed safety levels, indicating that GES has
continued to be achieved.
Progress and actions since 2012 - The assessment in 2012 already showed a high
degree of compliance and that GES was already achieved and this has been
confirmed by recent surveys. Also, the scope of the monitoring surveys has been
expanded to provide better geographical coverage and information regarding the
fishing grounds in UK seas.
Achievement of GES by 2020 - We expect that GES will continue to be achieved.
The UK will work with other countries at regional level to establish whether risks
posed by additional contaminants that are not included in Regulation (EC) No
1881/2006 are sufficient to include them in UK surveys.

77
CONTAMINANTS IN SEAFOOD D9: Perspective for 2018 to 2024
Current Environmental
Status in 2018
The UK has achieved its aim of GES for
contaminants in seafood. There is a high
level of compliance with agreed safety
levels.
High level objective for GES Concentrations of specified contaminants in fish and other
seafood caught or harvested for human consumption in UK
seas do not exceed agreed safety levels set in Regulation
(EC) No 1881/2006.
Criteria and targets for
measuring progress
towards GES in future
Safe levels of
contaminants in
seafood
For contaminants where regulatory levels
have been set, and a risk assessment has
indicated that concentrations in some
commonly eaten seafood may be of
concern to the public if they exceed
current precautionary advice to restrict
consumption of certain higher risk
species, there should be a high rate of
compliance based on relevant surveys
and including samples originating from
commercial fishing grounds in the Greater
North Sea and the Celtic Seas.
Operational targets The UK will work with other countries at regional level to
establish whether risks posed by additional contaminants that
are not included in Regulation (EC) No 1881/2006 are
sufficient to include them in UK surveys.
Indicators to be used to
assess the status
Contaminant concentrations in seafood.
Going forward We will continue to carry out appropriate periodic risk-based
surveys to check that agreed safety levels continue to be met.
D10 Marine litter
Indicators - The assessment of marine litter was based on an indicator covering
beach litter surveys, and surveillance indicators covering floating litter and sea floor
litter.

78
Current Status - GES has not been achieved.
The surveys of UK coastlines showed that trends of beach litter were stable in Celtic
Seas, but slightly increasing in the Greater North Sea. The predominant marine litter
material is plastic.
The surveillance indicators for sea floor litter and floating litter have been developed,
tested and both indicate that litter is present in significant amounts, but we will need
to refine these indicators to give us more accuracy.
Progress and actions since 2012 - The surveillance indicators on sea floor litter
and floating litter are now up and running. We are also working with other countries
to develop an indicator to measure microplastics in marine sediment, and have
conducted research programmes to establish the extent to which microplastic debris
are present and might cause harm to organisms in the marine environment.
Nationally, the “Litter Strategy for England” (2017), the “Towards a litter-free
Scotland: National Litter Strategy ” (2014), the “Marine Litter Strategy for Scotland”
(2014), the Wales Marine Litter Action Plan (2017) and the Northern Ireland Marine
Litter Strategy (2013) will all help to reduce the amount of litter reaching the marine
environment over time. The Resources and Waste strategy for England (2018), the
Northern Ireland Waste Strategy (2012), Scotland’s Zero Waste Plan (2014) and the
Welsh Towards Zero Waste initiative (2017) are all playing a significant role in
reducing litter through reducing, reusing and recycling associated materials. Also, a
minimum 5p plastic bag charge is now in place across the UK and a ban on the sale
of products containing plastic microbeads in personal care products is now in force.
Policies that address marine litter are being included in statutory marine plans.
The UK also encourages Fishing for Litter (FFL), a voluntary, unpaid litter bycatch
removal scheme by commercial fishermen which provides fishing boats with large
bags to collect marine-sourced litter.
On the regional scale, we work with OSPAR to carry out assessments of marine litter
and to implement the OSPAR Regional Action Plan for the Prevention and
Management of Marine Litter in the North-East Atlantic. We will continue research
which aims to improve cross-border capabilities to monitor, prevent and remove
marine litter in the Atlantic area.
On the international scale the UK has joined the UN Clean Seas Campaign and
made voluntary commitments to join the Global Partnership on Marine Litter and the
Global Ghost Gear Initiative. Also, the UK continues to tackle marine plastic pollution
through the Commonwealth, with up to £66 million of UK Aid committed to stop
plastic waste entering the oceans. These programmes aim to transform habits,
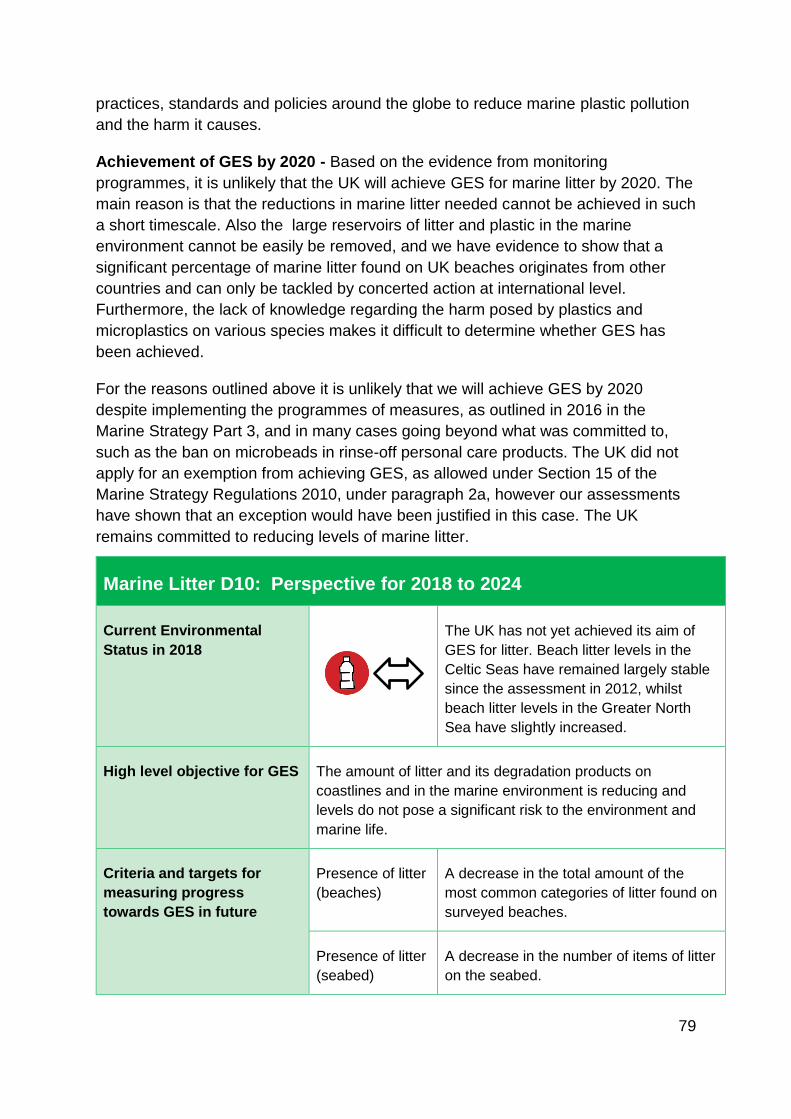
79
practices, standards and policies around the globe to reduce marine plastic pollution
and the harm it causes.
Achievement of GES by 2020 - Based on the evidence from monitoring
programmes, it is unlikely that the UK will achieve GES for marine litter by 2020. The
main reason is that the reductions in marine litter needed cannot be achieved in such
a short timescale. Also the large reservoirs of litter and plastic in the marine
environment cannot be easily be removed, and we have evidence to show that a
significant percentage of marine litter found on UK beaches originates from other
countries and can only be tackled by concerted action at international level.
Furthermore, the lack of knowledge regarding the harm posed by plastics and
microplastics on various species makes it difficult to determine whether GES has
been achieved.
For the reasons outlined above it is unlikely that we will achieve GES by 2020
despite implementing the programmes of measures, as outlined in 2016 in the
Marine Strategy Part 3, and in many cases going beyond what was committed to,
such as the ban on microbeads in rinse-off personal care products. The UK did not
apply for an exemption from achieving GES, as allowed under Section 15 of the
Marine Strategy Regulations 2010, under paragraph 2a, however our assessments
have shown that an exception would have been justified in this case. The UK
remains committed to reducing levels of marine litter.
Marine Litter D10: Perspective for 2018 to 2024
Current Environmental
Status in 2018
The UK has not yet achieved its aim of
GES for litter. Beach litter levels in the
Celtic Seas have remained largely stable
since the assessment in 2012, whilst
beach litter levels in the Greater North
Sea have slightly increased.
High level objective for GES The amount of litter and its degradation products on
coastlines and in the marine environment is reducing and
levels do not pose a significant risk to the environment and
marine life.
Criteria and targets for
measuring progress
towards GES in future
Presence of litter
(beaches)
A decrease in the total amount of the
most common categories of litter found on
surveyed beaches.
Presence of litter
(seabed)
A decrease in the number of items of litter
on the seabed.

80
Presence of
floating litter
A downward trend in the number of
northern fulmars with more than 0.1 g of
plastic particles in their stomach.
Presence of
micro-litter
Develop an appropriate indicator to
measure micro-litter in the marine
environment.
Operational targets We will work nationally and with other countries in OSPAR to:
a) establish the feasibility of setting appropriate reduction
targets and/or threshold values for litter on beaches, on the
sea floor, sea surface, and micro plastics, taking into account
regional or subregional specificities.
b) develop an indicator for micro-litter in sediment.
c) establish, if practicable, whether the amount of litter and
micro-litter ingested by marine animals adversely affects the
health of the species concerned.
d) develop appropriate measures to reduce litter types
harmful to the marine environment.
Indicators to be used to
assess the status
- Beach litter surveys - OSPAR
- Floating litter using plastic in fulmar stomachs - OSPAR
- Seafloor litter surveys - OSPAR
Going forward We will work both nationally and with other countries in
OSPAR to develop a clearer quantitative definitions of GES if
feasible, and continue to develop appropriate measures
building on the OSPAR Litter Action Plan to reduce the input
of different litter types. We will also work internationally with
the relevant organisations (IMO, UNEP, FAO) and
Commonwealth Countries to develop marine litter action
plans and measures worldwide. We will work in OSPAR to
develop an indicator for microplastics in sediment.
81
D11 Underwater noise
Indicators - The assessment of underwater noise was based on developing a noise
registry to record the distribution and timing of man-made impulsive sound sources,
and a surveillance indicator designed to monitor trends in ambient noise the sea.
Current Status - Uncertain.
The noise registry is now in place and has been used to record and log impulsive
sound from various activities in the Greater North Sea and the Celtic Seas. The
surveillance indicator for ambient noise has established recent noise levels at
several sites in the Greater North Sea and Celtic Seas. However we are still
uncertain regarding what levels and frequencies of man-made marine noise lead to
effects at a population and ecosystem level, particularly for vulnerable/threatened
species and key functional groups, and how to quantify the risk of impact at these
scales.
Progress and actions since 2012 - In 2012, the extent to which the impacts of both
impulsive and continuous noise posed a serious problem to marine life was unclear,
and there was also no means of systematically recording this pressure and
assessing its potential cumulative effects.
The establishment of the noise registry and the operationalizing of the ambient noise
surveillance indicator has helped to address the gaps in knowledge regarding the
impacts of underwater noise. The need to take account of noise impacts and
contribute to the registry is being included in marine plan policies. Going forward we
will continue to work with OSPAR to develop an impulsive noise registry for the
North-East Atlantic and a broader ambient noise monitoring programme that enables
us to better address the risks posed by underwater noise at the broader regional sea
scale.
UK participation in several research programmes and initiatives are helping to
provide a more robust picture of the impacts of sound on marine ecosystems and
animals. These include a Defra project to analyse underwater noise data from
subsea sound recorders located around the UK coast, and two European cross-
border cooperation (Interreg) projects. The Joint programme for Ocean Noise in the
Atlantic Seas (JONAS) has set up a joint monitoring programme in the Atlantic area
with aim of using the results to produce tools for management and policy purposes
and the Joint Monitoring Programme for Ambient Noise North Sea (JOMOPANS)
aims to develop a framework for a fully operational joint monitoring programme for
ambient sound in the North Sea. The UK has also supported activities to reduce
noise at the international level, for example at the International Maritime
Organization through its Guidelines for the Reduction of Underwater Noise from
Commercial Shipping.
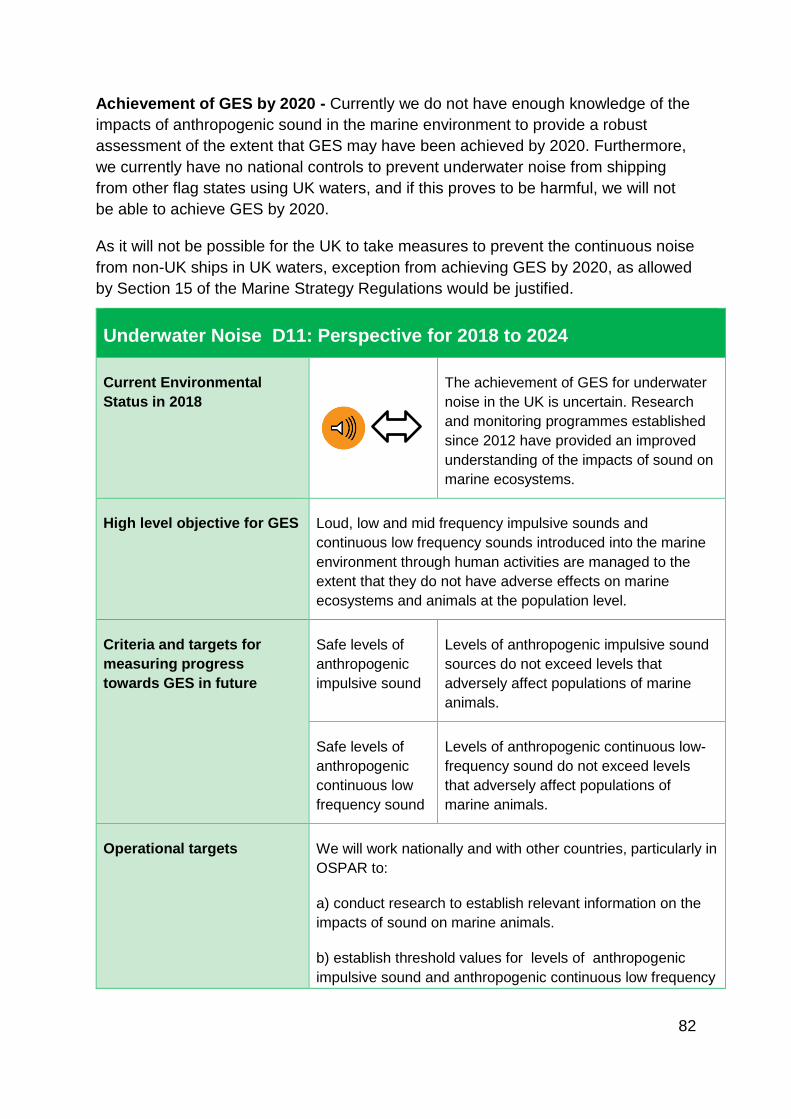
82
Achievement of GES by 2020 - Currently we do not have enough knowledge of the
impacts of anthropogenic sound in the marine environment to provide a robust
assessment of the extent that GES may have been achieved by 2020. Furthermore,
we currently have no national controls to prevent underwater noise from shipping
from other flag states using UK waters, and if this proves to be harmful, we will not
be able to achieve GES by 2020.
As it will not be possible for the UK to take measures to prevent the continuous noise
from non-UK ships in UK waters, exception from achieving GES by 2020, as allowed
by Section 15 of the Marine Strategy Regulations would be justified.
Underwater Noise D11: Perspective for 2018 to 2024
Current Environmental
Status in 2018
The achievement of GES for underwater
noise in the UK is uncertain. Research
and monitoring programmes established
since 2012 have provided an improved
understanding of the impacts of sound on
marine ecosystems.
High level objective for GES Loud, low and mid frequency impulsive sounds and
continuous low frequency sounds introduced into the marine
environment through human activities are managed to the
extent that they do not have adverse effects on marine
ecosystems and animals at the population level.
Criteria and targets for
measuring progress
towards GES in future
Safe levels of
anthropogenic
impulsive sound
Levels of anthropogenic impulsive sound
sources do not exceed levels that
adversely affect populations of marine
animals.
Safe levels of
anthropogenic
continuous low
frequency sound
Levels of anthropogenic continuous low-
frequency sound do not exceed levels
that adversely affect populations of
marine animals.
Operational targets We will work nationally and with other countries, particularly in
OSPAR to:
a) conduct research to establish relevant information on the
impacts of sound on marine animals.
b) establish threshold values for levels of anthropogenic
impulsive sound and anthropogenic continuous low frequency

83
sound taking into account research on impacts and regional
or subregional specificities.
Indicators to be used to
assess the status
- OSPAR Impulsive noise impact indicator (under
development)
- Surveillance indicator for ambient noise
Going forward We will work with other countries sharing our seas to develop
threshold values for levels of impulsive and continuous sound
which are likely to cause harm at population so that common
quantitative targets can be established in the future.
We will work in international forums such as IMO to ensure
that continuous underwater noise from shipping is robustly
controlled at global level.

84
Annex 1: Threshold values or reference levels for the various indicators which the UK plans to use for the 2018-2024 cycle of the UK Marine Strategy to assess whether the associated targets will be met.
Target Associated
Indicator
Threshold value / reference level
Cetaceans
The long-term viability of
cetacean populations is not
threatened by incidental
bycatch.
Marine mammal
bycatch (OSPAR)
Currently, estimates of annual total bycatch are
compared against limits agreed by ASCOBANS:
‘total anthropogenic removal’ of harbour porpoises
(mortality resulting from all pressures caused by
human activities) should not exceed more than 1.7
% of the best available estimate of abundance; and
to achieve this, bycatch should ideally be less than
1% of the best available abundance estimate and
ultimately, be reduced to zero (ASCOBANS
resolution No. 5, 2006).
There should be no
significant decrease in
abundance caused by
human activities.
Abundance and
distribution of
coastal bottlenose
dolphins (OSPAR)
Abundance and
distribution of
cetaceans other
than coastal
bottlenose dolphins
(OSPAR)
The UK target for abundance is considered to be
achieved for each species, if there is no statistically
significant decrease in abundance of 5% or more,
over a 10 year period. This threshold is derived
from the IUCN criterion to detect a 30% decline
over three generations for a species, which
equates to slightly less than 0.5% per year for
odontocetes. This assessment requires at least
three abundance estimates from different years.
Population range is not
significantly lower than the
favourable reference value
for the species.
Abundance and
distribution of
coastal bottlenose
dolphins (OSPAR)
Favourable Reference Values (FRV) for population
range are currently set for 11 species (under
Habitats Directive). The UK target for population
range is met if, for each species, there is no
statistically significant contraction in their
distribution caused by human activities.
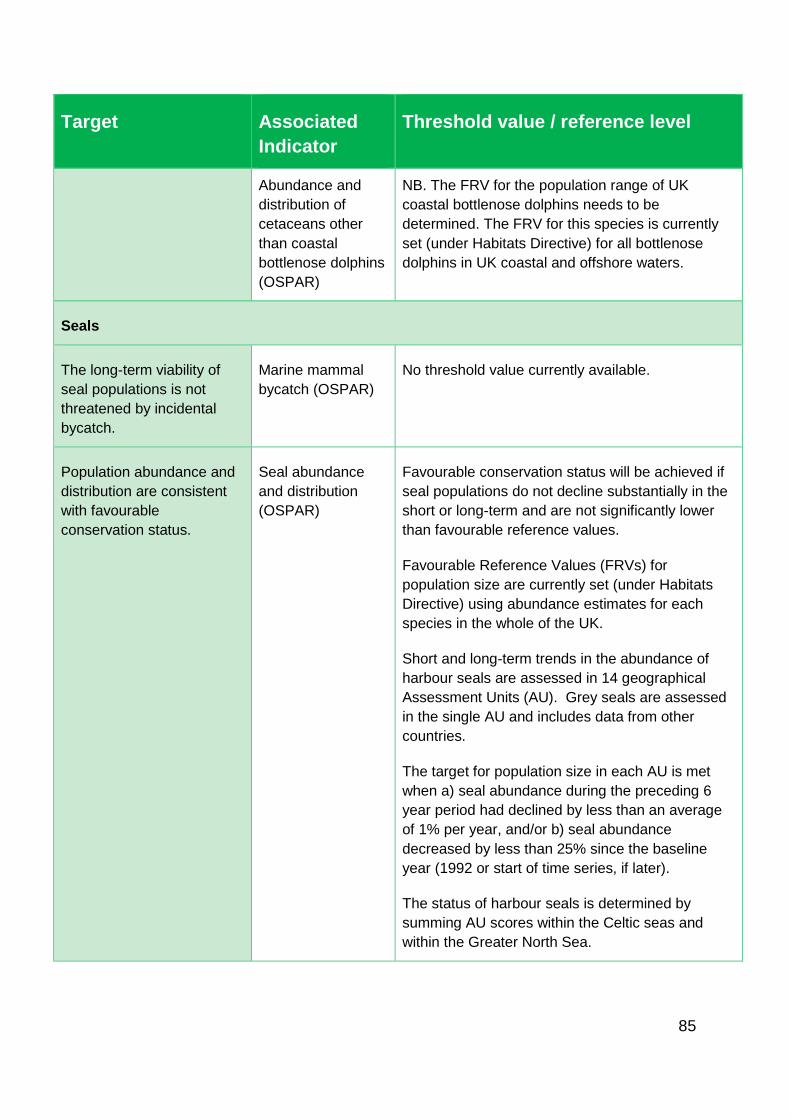
85
Target Associated
Indicator
Threshold value / reference level
Abundance and
distribution of
cetaceans other
than coastal
bottlenose dolphins
(OSPAR)
NB. The FRV for the population range of UK
coastal bottlenose dolphins needs to be
determined. The FRV for this species is currently
set (under Habitats Directive) for all bottlenose
dolphins in UK coastal and offshore waters.
Seals
The long-term viability of
seal populations is not
threatened by incidental
bycatch.
Marine mammal
bycatch (OSPAR)
No threshold value currently available.
Population abundance and
distribution are consistent
with favourable
conservation status.
Seal abundance
and distribution
(OSPAR)
Favourable conservation status will be achieved if
seal populations do not decline substantially in the
short or long-term and are not significantly lower
than favourable reference values.
Favourable Reference Values (FRVs) for
population size are currently set (under Habitats
Directive) using abundance estimates for each
species in the whole of the UK.
Short and long-term trends in the abundance of
harbour seals are assessed in 14 geographical
Assessment Units (AU). Grey seals are assessed
in the single AU and includes data from other
countries.
The target for population size in each AU is met
when a) seal abundance during the preceding 6
year period had declined by less than an average
of 1% per year, and/or b) seal abundance
decreased by less than 25% since the baseline
year (1992 or start of time series, if later).
The status of harbour seals is determined by
summing AU scores within the Celtic seas and
within the Greater North Sea.

86
Target Associated
Indicator
Threshold value / reference level
Metrics to describe seal distribution were included
in the UK 2018 assessment, but thresholds are still
under development.
Grey seal pup production
does not decline
substantially in the short or
long-term.
Grey seal pup
production
(OSPAR)
This indicator uses counts of grey seal pups at
major breeding sites (‘colonies’) to estimate total
pup production at each colony.
The European population of breeding grey seals
has been subdivided into geographical
Assessment Units (AU) of which 14 are in the UK.
The target for pup production in each AU is met if
a) grey seal pup production during the preceding 6
year period has not declined by more than an
average of 1% per year, and/or b) grey seal pup
production has not decreased by more than 25%
since the baseline year (1992 or start of time
series, if later). These thresholds are based on
those used by OSPAR in its Intermediate
Assessment 2017.
The achievement of the target for pup production in
each sub-region is determined by summing AU
scores within the Celtic seas and within the Greater
North Sea.
Birds
The long-term viability of
marine bird populations is
not threatened by deaths
caused by incidental
bycatch catch in mobile and
static fishing gear.
Seabird bycatch No threshold value currently available. Under
development as Part of the UK Plan of Action on
Seabird Bycatch
The population size of
species has not declined
substantially since 1992 as
a result of human activities.
Marine bird
abundance
(OSPAR)
a) For each species, annual abundance is
expressed as ‘relative abundance’, which is
a proportion of baseline abundance.
Relative abundance should be greater than
0.8 for species that lay one egg; or 0.7 for
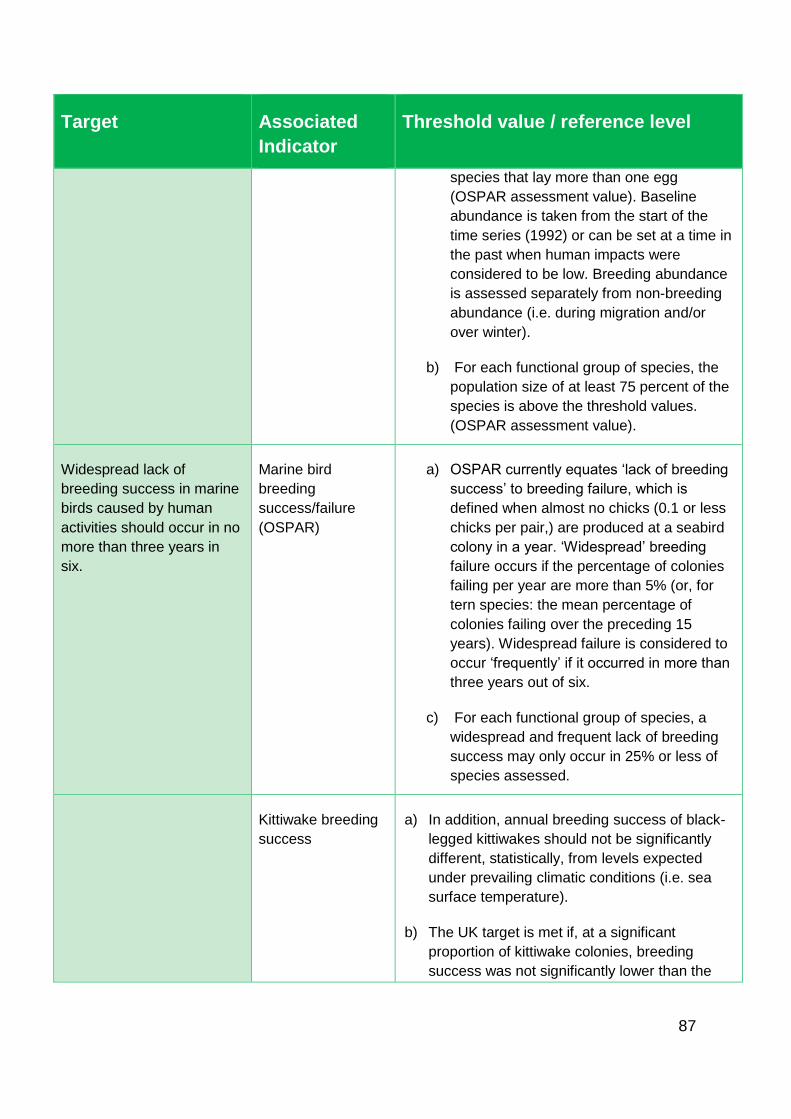
87
Target Associated
Indicator
Threshold value / reference level
species that lay more than one egg
(OSPAR assessment value). Baseline
abundance is taken from the start of the
time series (1992) or can be set at a time in
the past when human impacts were
considered to be low. Breeding abundance
is assessed separately from non-breeding
abundance (i.e. during migration and/or
over winter).
b) For each functional group of species, the
population size of at least 75 percent of the
species is above the threshold values.
(OSPAR assessment value).
Widespread lack of
breeding success in marine
birds caused by human
activities should occur in no
more than three years in
six.
Marine bird
breeding
success/failure
(OSPAR)
a) OSPAR currently equates ‘lack of breeding
success’ to breeding failure, which is
defined when almost no chicks (0.1 or less
chicks per pair,) are produced at a seabird
colony in a year. ‘Widespread’ breeding
failure occurs if the percentage of colonies
failing per year are more than 5% (or, for
tern species: the mean percentage of
colonies failing over the preceding 15
years). Widespread failure is considered to
occur ‘frequently’ if it occurred in more than
three years out of six.
c) For each functional group of species, a
widespread and frequent lack of breeding
success may only occur in 25% or less of
species assessed.
Kittiwake breeding
success
a) In addition, annual breeding success of black-
legged kittiwakes should not be significantly
different, statistically, from levels expected
under prevailing climatic conditions (i.e. sea
surface temperature).
b) The UK target is met if, at a significant
proportion of kittiwake colonies, breeding
success was not significantly lower than the
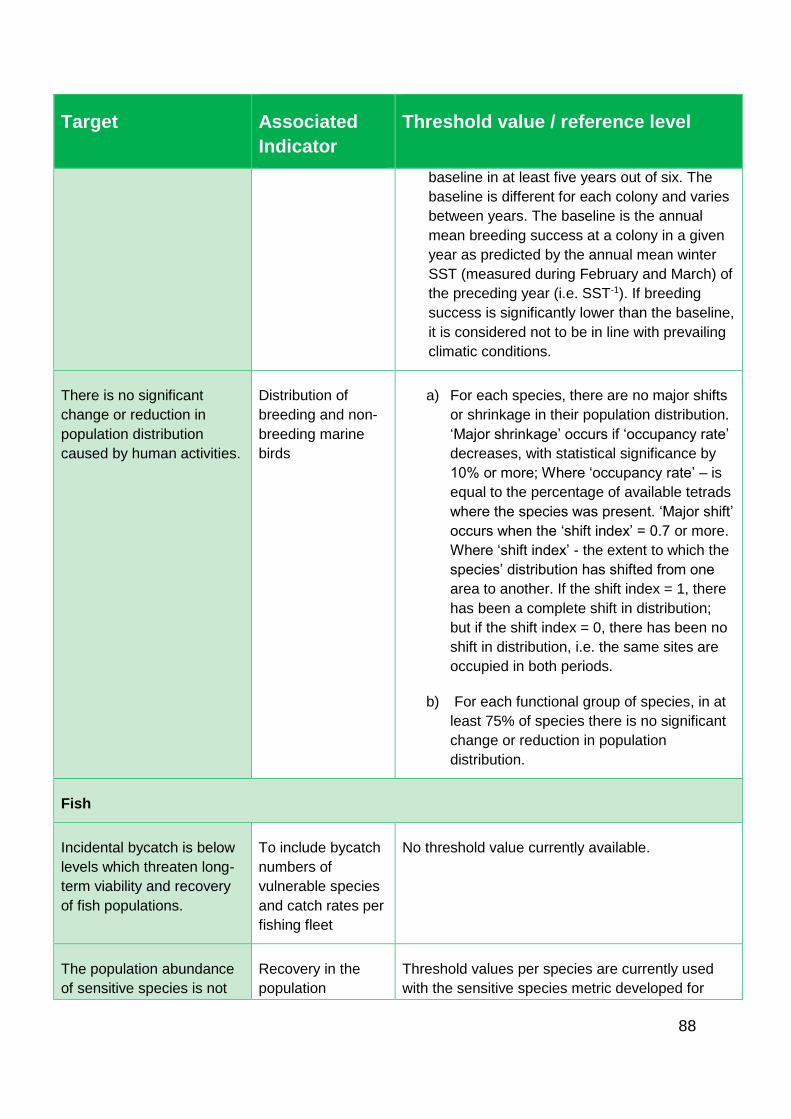
88
Target Associated
Indicator
Threshold value / reference level
baseline in at least five years out of six. The
baseline is different for each colony and varies
between years. The baseline is the annual
mean breeding success at a colony in a given
year as predicted by the annual mean winter
SST (measured during February and March) of
the preceding year (i.e. SST-1). If breeding
success is significantly lower than the baseline,
it is considered not to be in line with prevailing
climatic conditions.
There is no significant
change or reduction in
population distribution
caused by human activities.
Distribution of
breeding and non-
breeding marine
birds
a) For each species, there are no major shifts
or shrinkage in their population distribution.
‘Major shrinkage’ occurs if ‘occupancy rate’
decreases, with statistical significance by
10% or more; Where ‘occupancy rate’ – is
equal to the percentage of available tetrads
where the species was present. ‘Major shift’
occurs when the ‘shift index’ = 0.7 or more.
Where ‘shift index’ - the extent to which the
species’ distribution has shifted from one
area to another. If the shift index = 1, there
has been a complete shift in distribution;
but if the shift index = 0, there has been no
shift in distribution, i.e. the same sites are
occupied in both periods.
b) For each functional group of species, in at
least 75% of species there is no significant
change or reduction in population
distribution.
Fish
Incidental bycatch is below
levels which threaten long-
term viability and recovery
of fish populations.
To include bycatch
numbers of
vulnerable species
and catch rates per
fishing fleet
No threshold value currently available.
The population abundance
of sensitive species is not
Recovery in the
population
Threshold values per species are currently used
with the sensitive species metric developed for
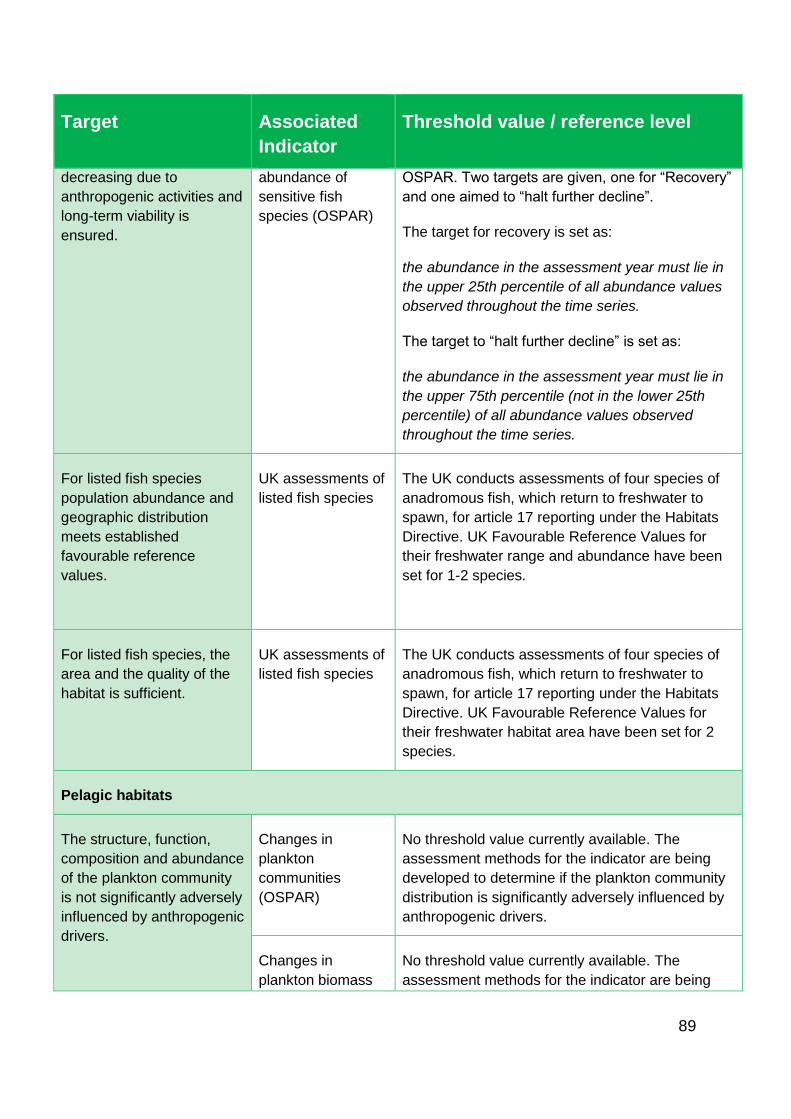
89
Target Associated
Indicator
Threshold value / reference level
decreasing due to
anthropogenic activities and
long-term viability is
ensured.
abundance of
sensitive fish
species (OSPAR)
OSPAR. Two targets are given, one for “Recovery”
and one aimed to “halt further decline”.
The target for recovery is set as:
the abundance in the assessment year must lie in
the upper 25th percentile of all abundance values
observed throughout the time series.
The target to “halt further decline” is set as:
the abundance in the assessment year must lie in
the upper 75th percentile (not in the lower 25th
percentile) of all abundance values observed
throughout the time series.
For listed fish species
population abundance and
geographic distribution
meets established
favourable reference
values.
UK assessments of
listed fish species
The UK conducts assessments of four species of
anadromous fish, which return to freshwater to
spawn, for article 17 reporting under the Habitats
Directive. UK Favourable Reference Values for
their freshwater range and abundance have been
set for 1-2 species.
For listed fish species, the
area and the quality of the
habitat is sufficient.
UK assessments of
listed fish species
The UK conducts assessments of four species of
anadromous fish, which return to freshwater to
spawn, for article 17 reporting under the Habitats
Directive. UK Favourable Reference Values for
their freshwater habitat area have been set for 2
species.
Pelagic habitats
The structure, function,
composition and abundance
of the plankton community
is not significantly adversely
influenced by anthropogenic
drivers.
Changes in
plankton
communities
(OSPAR)
No threshold value currently available. The
assessment methods for the indicator are being
developed to determine if the plankton community
distribution is significantly adversely influenced by
anthropogenic drivers.
Changes in
plankton biomass
No threshold value currently available. The
assessment methods for the indicator are being
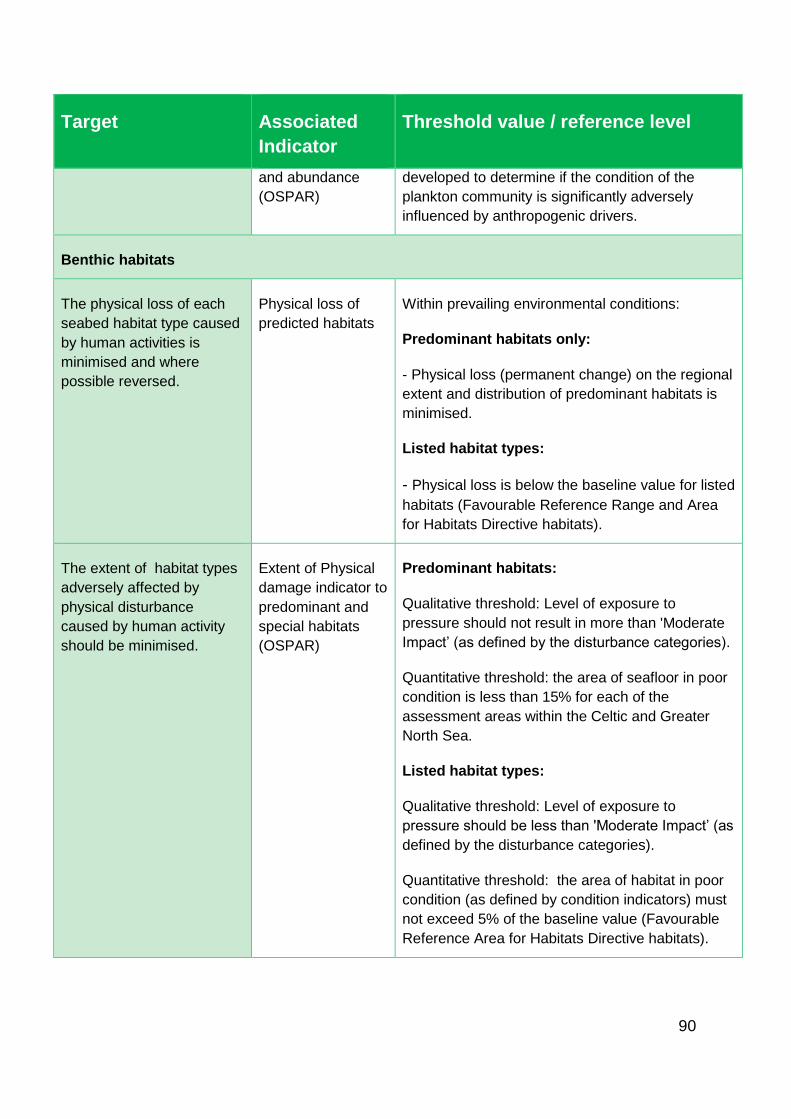
90
Target Associated
Indicator
Threshold value / reference level
and abundance
(OSPAR)
developed to determine if the condition of the
plankton community is significantly adversely
influenced by anthropogenic drivers.
Benthic habitats
The physical loss of each
seabed habitat type caused
by human activities is
minimised and where
possible reversed.
Physical loss of
predicted habitats
Within prevailing environmental conditions:
Predominant habitats only:
- Physical loss (permanent change) on the regional
extent and distribution of predominant habitats is
minimised.
Listed habitat types:
- Physical loss is below the baseline value for listed
habitats (Favourable Reference Range and Area
for Habitats Directive habitats).
The extent of habitat types
adversely affected by
physical disturbance
caused by human activity
should be minimised.
Extent of Physical
damage indicator to
predominant and
special habitats
(OSPAR)
Predominant habitats:
Qualitative threshold: Level of exposure to
pressure should not result in more than 'Moderate
Impact’ (as defined by the disturbance categories).
Quantitative threshold: the area of seafloor in poor
condition is less than 15% for each of the
assessment areas within the Celtic and Greater
North Sea.
Listed habitat types:
Qualitative threshold: Level of exposure to
pressure should be less than 'Moderate Impact’ (as
defined by the disturbance categories).
Quantitative threshold: the area of habitat in poor
condition (as defined by condition indicators) must
not exceed 5% of the baseline value (Favourable
Reference Area for Habitats Directive habitats).

91
Target Associated
Indicator
Threshold value / reference level
Benthic
communities
indicator (OSPAR)
Condition of the benthic community (including
biotic and abiotic structure and functions) at risk
from physical disturbance is stable or recovering.
There should be no adverse impacts through
changes in species composition and their relative
abundance by physical disturbance.
For all predominant habitat types:
The area of habitat in poor condition (as defined by
condition indicators) must not exceed 15% of total
available habitat area.
Habitat loss of sensitive,
fragile or important habitats
caused by human activities
is prevented, and where
feasible reversed.
Physical loss of
predicted habitats
indicator (Extent of
benthic habitat)
Listed habitats:
The extent and distribution of sensitive or
representative seabed habitats, and the associated
species that they support, is stable and/or
increasing, and not smaller than a baseline value
for listed habitats (Favourable Reference Range
and Area for Habitats Directive habitats).
WFD extent targets for saltmarsh and seagrass will
be used within WFD boundaries as appropriate.
Predominant habitats:
The loss of particularly sensitive or fragile species
or habitat providing a key ecosystem function,
caused by physical loss should be prevented and
where feasible such species or habitat should be
restored.
The extent of adverse
effects caused by human
activities on the condition,
function and ecosystem
processes of habitats is
minimised.
Benthic
communities
indicator (OSPAR)
Listed habitats:
The extent of adverse effects from anthropogenic
pressures on the condition of the habitat type,
including alteration to its biotic and abiotic structure
and its functions does not exceed their baseline
value (Favourable Reference Area for Habitats
Directive habitats) and shows sustained reduction. Aggregated
Infaunal Quality
Index

92
Target Associated
Indicator
Threshold value / reference level
And benthic ecosystem functioning and seafloor
integrity are stable or recovering.
WFD Ecological Quality Ratios for saltmarsh and
seagrass will be used within WFD boundaries as
appropriate.
Predominant habitat types:
Damaging human impacts on predominant
sediment habitats (biotic and abiotic components),
individually and cumulative, are reduced: The
extent of adverse effects on the condition of
habitats and associated ecological processes
caused by human activities is reduced and the
precautionary principle is applied to the most
sensitive habitat types and/or those which are most
important for ecosystem functioning, and
ecosystem services.
WFD Ecological Quality Ratios should be used
within WFD boundaries as appropriate.
Aggregated
Saltmarsh Tool
Aggregated Rocky
Shore Macroalgal
Index
Aggregated
Intertidal Seagrass
Tool
Intertidal rock
community change
indicator (MarClim)
D2 NIS
The number of newly
introduced NIS is minimised
and where possible reduced
to zero.
The number of new
NIS introduced.
No threshold value currently available.
The rate of spread of
invasive NIS, as a result of
human activities is
minimised and reduced
where possible.
The number of new
populations of
established
invasive NIS.
No threshold value currently available.
Commercial fish
The Fishing mortality rate of
populations of
commercially-exploited
species is at or below levels
Commercial fishing
pressure for stocks
of UK interest.
The overall proportion of stocks with fishing
mortality rates at or below the level capable of
producing maximum sustainable yield (FMSY or its

93
Target Associated
Indicator
Threshold value / reference level
which can produce the
maximum sustainable yield.
proxies) should be increasing and ultimately all
stocks should be at or below their targets.
The Spawning Stock
Biomass of populations of
commercially-exploited
species are above biomass
levels capable of producing
the maximum sustainable
yield.
Reproductive
capacity of
commercially
exploited stocks of
UK interest.
The overall proportion of stocks with spawning
stock biomass estimates ≥ MSY Btrigger (or proxy
values) should be increasing and ultimately all
stocks should be above their targets.
Food webs
The species composition
and relative abundance of
representative feeding
guilds are indicative of a
healthy marine food web.
Mean maximum
length of fish
(OSPAR).
Other
representative
species
composition
indicators of
seabirds and
marine mammals
could be developed
using current data.
No threshold value currently available.
The balance of abundance
between representative
feeding guilds is indicative
of a healthy marine food
web.
An indicator of
biomass of
predatory feeding
guilds for fish is
currently under
development using
current data. This
could be expanded
to seabirds and
marine mammals.
Development of this indicator is being led by the
UK in OSPAR. The indicator is likely to be used as
a surveillance indicator with a lower limit that could
be used to triggeraction (e.g. management or more
research). It is not appropriate to set thresholds
that are indicative of good status.
The size structure of fish
communities is indicative of
a healthy marine food web.
Fish community
size structure:
Typical Length (TyL
Thresholds identified for LFI Further development
by the UK in OSPAR is required.
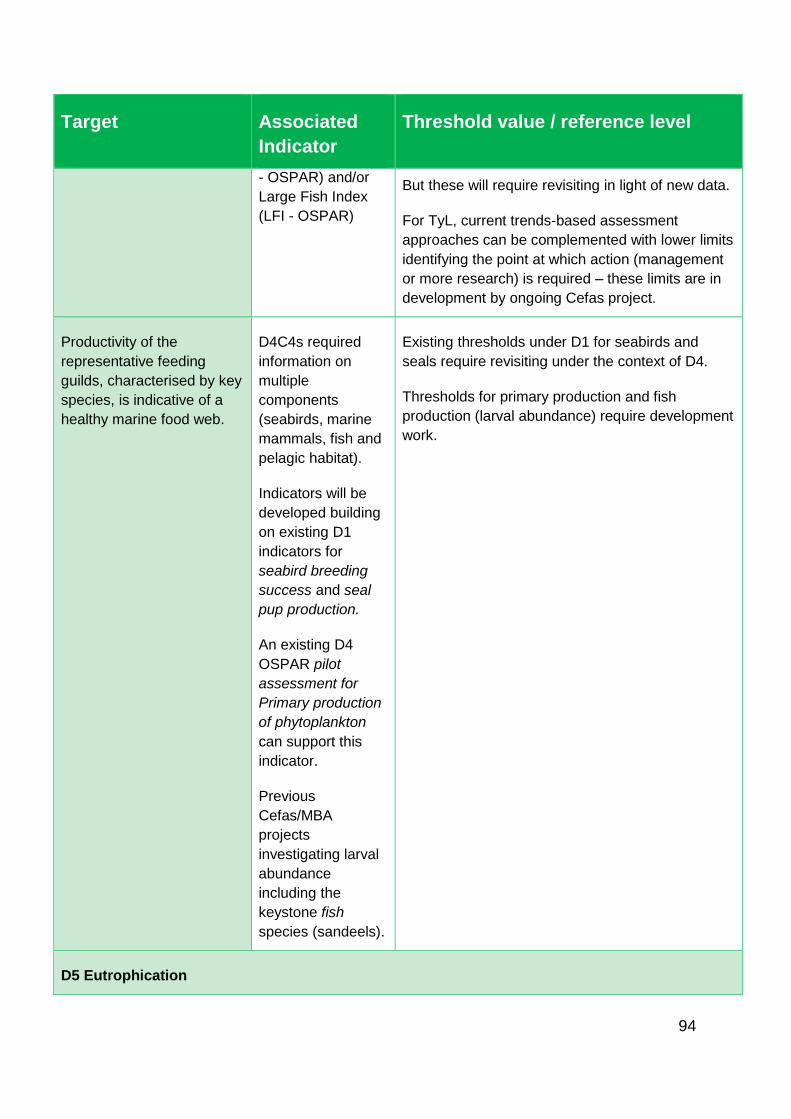
94
Target Associated
Indicator
Threshold value / reference level
- OSPAR) and/or
Large Fish Index
(LFI - OSPAR)
But these will require revisiting in light of new data.
For TyL, current trends-based assessment
approaches can be complemented with lower limits
identifying the point at which action (management
or more research) is required – these limits are in
development by ongoing Cefas project.
Productivity of the
representative feeding
guilds, characterised by key
species, is indicative of a
healthy marine food web.
D4C4s required
information on
multiple
components
(seabirds, marine
mammals, fish and
pelagic habitat).
Indicators will be
developed building
on existing D1
indicators for
seabird breeding
success and seal
pup production.
An existing D4
OSPAR pilot
assessment for
Primary production
of phytoplankton
can support this
indicator.
Previous
Cefas/MBA
projects
investigating larval
abundance
including the
keystone fish
species (sandeels).
Existing thresholds under D1 for seabirds and
seals require revisiting under the context of D4.
Thresholds for primary production and fish
production (larval abundance) require development
work.
D5 Eutrophication

95
Target Associated
Indicator
Threshold value / reference level
Nutrient concentrations are
below the levels which
could lead to harmful
eutrophication effects.
nutrient
concentrations of
DIN and DIP
Eutrophication assessed by combining indicator
results according to OSPAR Common Procedure
Nutrients:
Coastal water: 18uM Nitrogen
Offshore water:15 uM Nitrogen
Chlorophyll a
concentrations are below
levels which could lead to
harmful eutrophication
effects.
Chlorophyll in the
water column
Chlorophyll: 90th percentiles of growing season
(March to October, inclusive) chlorophyll
concentration in the water column. Assessment
thresholds are 15 µg L-1 for coastal waters and 10
µg L-1 for offshore waters.
Dissolved oxygen content in
coastal waters are below
levels which could lead to
harmful eutrophication
effects.
Oxygen saturation
Oxygen: 50-75% oxygen saturation.
D7 Hydrographic conditions
All significant marine
infrastructure developments
must meet licensing
conditions to ensure they do
not adversely affect the
marine ecosystem.
No specific
indicators for D7
D8 Contaminants
Concentrations of
contaminants measured in
the most suitable
compartment (water,
sediment or marine biota)
comply with the appropriate
threshold values which
indicate harm to sea life and
are not increasing.
Metals in biota
The concentrations of cadmium, mercury and lead
in biota are assessed against OSPAR “proxy
Environmental Assessment Criteria” based on the
food standards for humans set out in EC regulation
No 1881/2006.

96
Target Associated
Indicator
Threshold value / reference level
(Environmental Quality
Standards in the WFD,
OSPAR Environmental
Assessment Criteria and
UK values for river basin
specific pollutants).
Concentrations of
contaminants measured in
the most suitable
compartment (water,
sediment or marine biota)
comply with the appropriate
threshold values which
indicate harm to sea life and
are not increasing.
(Environmental Quality
Standards in the WFD,
OSPAR Environmental
Assessment Criteria and
UK values for river basin
specific pollutants).
Metals in sediment Effects Range Low (ERLs) are used as proxy
assessment criteria.
For further details of ERLs seei.
PCBs in biota
PCBs in Sediment
OSPAR Environmental Assessment Criteria (EAC)
For details seeii.
PAH in biota
(shellfish)
OSPAR Environmental Assessment Criteria (EAC).
For further details seeiii.
PAH in sediment
PAH concentrations in sediments were assessed
against the Effects range-Low (ER-L) values which
were developed by the United States National
Oceanic and Atmospheric Administration (NOAA),
for the US Environment Protection Agencyiv.
PBDEs in biota
PBDEs in
sediment
No assessment threshold developed. Trend used.
SEDIMENTS:
Canadian Federal Environmental Quality
Guidelines (FEQGs) were developed under the
Canadian Environmental Protection Act 1999 for
BDE28, BDE47, BDE66, BDE99, BDE100,
BDE153, BDE154, BDE183 and BDE209. OSPAR
are using these on a trial basis.
(http://dome.ices.dk/osparmime2018/help_ac_sedi
ment_organo-bromines.html)
BIOTA:

97
Target Associated
Indicator
Threshold value / reference level
OSPAR Environmental Assessment Criteria
(EACs) have not been developed for PBDEs in
biota, and are unlikely to be developed in the near
future. However, Canadian Federal Environmental
Quality Guidelines (FEQGs) were developed under
the Canadian Environmental Protection Act 1999
for BDE28, BDE47, BDE99, BDE100, BDE153 and
BDE154. OSPAR are using these on a trial basis.
Radionuclides UK regulatory limits of dose based on the
International Commission on Radiological
Protection (ICRP).
For further details seev.
Coastal water
contaminants in
water column
Environmental quality standards set in Directive
2008/105/EC.
Inputs of metals
from air and water
Trend assessment used.
River basin specific
pollutants
Values developed by UK Technical Advisory
Group.
Biological or ecological
effects on sea life due to
contaminants are below
thresholds agreed by
OSPAR as appropriate for
MSFD purposes.
Imposex in
dogwhelks
OSPAR Environmental Assessment Criteria
(EACs) for imposex in dogwhelks
For further details seevi.
Micronucleus in fish OSPAR species-specific background assessment
criteria (BAC) to assess genetic damage in fish
blood cells using the micronucleus assay.
For further details see end notevii.
EROD activity OSPAR species-specific Background Assessment
Concentrations (BACs) to assess the activity of
EROD in fish liver.
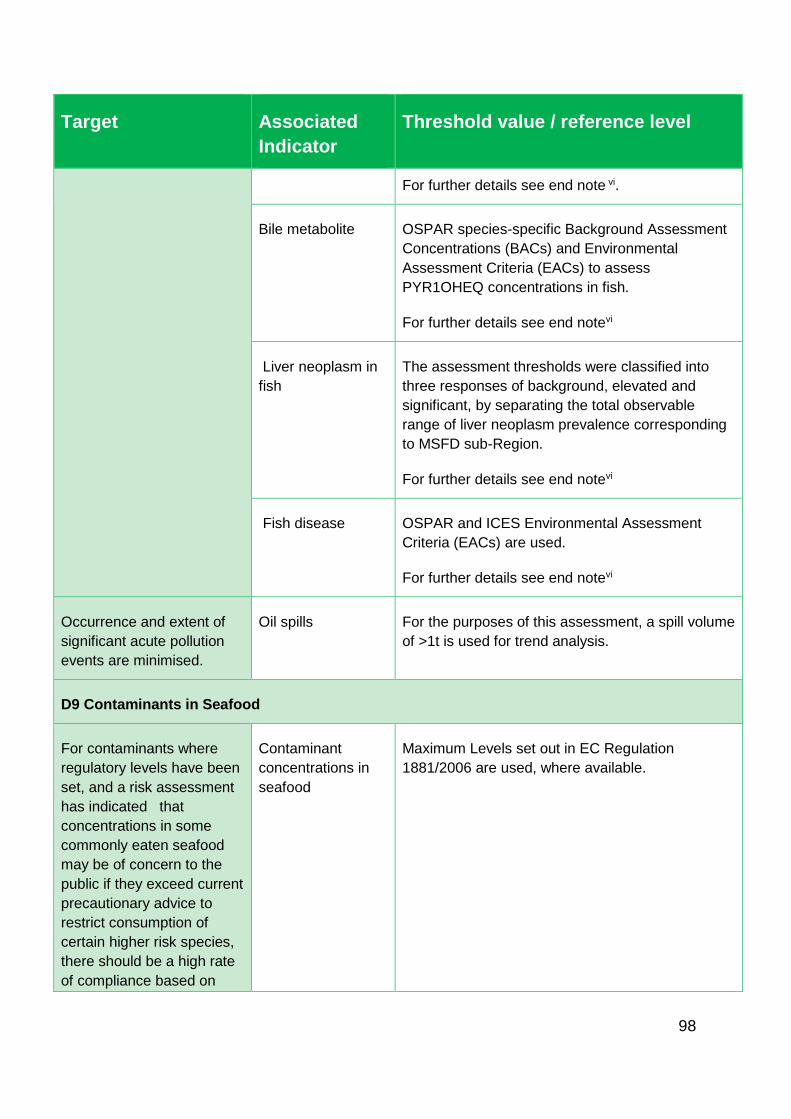
98
Target Associated
Indicator
Threshold value / reference level
For further details see end note vi.
Bile metabolite OSPAR species-specific Background Assessment
Concentrations (BACs) and Environmental
Assessment Criteria (EACs) to assess
PYR1OHEQ concentrations in fish.
For further details see end notevi
Liver neoplasm in
fish
The assessment thresholds were classified into
three responses of background, elevated and
significant, by separating the total observable
range of liver neoplasm prevalence corresponding
to MSFD sub-Region.
For further details see end notevi
Fish disease OSPAR and ICES Environmental Assessment
Criteria (EACs) are used.
For further details see end notevi
Occurrence and extent of
significant acute pollution
events are minimised.
Oil spills For the purposes of this assessment, a spill volume
of >1t is used for trend analysis.
D9 Contaminants in Seafood
For contaminants where
regulatory levels have been
set, and a risk assessment
has indicated that
concentrations in some
commonly eaten seafood
may be of concern to the
public if they exceed current
precautionary advice to
restrict consumption of
certain higher risk species,
there should be a high rate
of compliance based on
Contaminant
concentrations in
seafood
Maximum Levels set out in EC Regulation
1881/2006 are used, where available.

99
Target Associated
Indicator
Threshold value / reference level
relevant surveys and
including samples
originating from commercial
fishing grounds in the
greater North Sea and the
Celtic Seas
D10 litter
A decrease in the total
amount of the most
common categories of litter
found on surveyed beaches
Litter types on
beaches
Trends used. No threshold value currently
available.
A decrease in the number
of items of litter on the
seabed.
Litter on the
seabed
Trends used. No threshold value currently
available.
A downward trend in the
number of northern fulmars
with more than 0.1 g of
plastic particles in their
stomach
Floating litter OSPAR goal is that fewer than 10% of fulmars
should have more than 0.1g of plastic in their
stomachs.
Develop an appropriate
indicator to measure micro-
litter in the marine
environment.
Micro-litter in the
sea
Micro-litter threshold values not currently available.
D11 underwater noise
Levels of anthropogenic
impulsive sound sources do
not exceed levels that
adversely affect populations
of marine animals.
Impulsive sound in
the sea
Impulsive sound threshold values not currently
available.
Levels of anthropogenic
continuous low-frequency
sound do not exceed levels
Continuous low
frequency sound
Continuous sound threshold values not currently
available.

100
Target Associated
Indicator
Threshold value / reference level
that adversely affect
populations of marine
animals.
(ambient noise) in
UK seas
i US EPA, 2013. http://www.epa.gov/emap2/maia/html/docs/Est5.pdf
ii OSPAR, 2009. Background document on CEMP assessment criteria for QSR 2010.
Publication Number: 461/2009. pp. 23 and OSPAR (2016). OSPAR Coordinated Environmental Monitoring Programme
(CEMP). Agreement 2016-01
iii OSPAR Publication 2009-461 Background Document on CEMP Assessment Criteria for the QSR 2010
iv See OSPAR Publication 2009-461 Background Document on CEMP Assessment Criteria for the QSR 2010 for
details. v ICRP, 2007. The 2007 Recommendations of the International Commission on Radiological Protection. ICRP
Publication 103. Ann. ICRP 37 (2-4). vi OSPAR Commission. 2009. Background Document on Assessment Criteria used for assessing CEMP
Monitoring Data for the Concentrations of Hazardous Substances in Marine Sediments and Biota in the Context of QSR 2010. OSPAR Publication 461/2009. ISBN 978-1-907390-08-1. Available via ‘Publications’ on www.ospar.org
vii OSPAR, 2013. Background document and technical annexes for biological effects monitoring, Update 2013. ISBN 978-1-
909159-22-8 Publication Number: 589/2013